1. Introduction
Additive-manufacturing (AM) processes are steadily gaining increased significance in the production of individualized near-net-shape geometries. Due to the advancements of computer-aided design (CAE) methods and the inherently high design freedom of AM technologies, additively manufactured parts offer a great potential in terms of lightweight construction [
1]. Among the established AM processes, laser-based powder bed fusion (PBF-LB) currently exhibits the highest level of technological maturity and, thus, a high market potential [
2]. The advantages of PBF-LB include its ability to fabricate high-resolution features with reduced material waste [
3]. Furthermore, this process is compatible with a wide range of metals, covering different steel, titanium, and aluminum grades. An alloy with great lightweight construction potential, which is widely used in both die casting and additive manufacturing, is AlSi10Mg [
4,
5]. While this alloy possesses good mechanical properties in an as-cast state, the thermal cycles of a PBF-LB process generally result in superior tensile strength (up to 450–500 MPa) due to precipitation hardening [
6]. Its tensile properties, comparable to low-alloy steels, combined with a much lower density, make AlSi10Mg an attractive material for many applications, e.g., small batch series in vehicle manufacturing [
7] or for spare parts [
8]. Besides the benefits, the PBF-LB process has some limitations, too. One significant drawback is that most PBF-LB machines have a relatively small build space, which restricts the maximal achievable component dimensions.
Manufacturing large-scale parts, thus, requires special machines with larger chamber sizes associated with higher purchasing and operating costs. Another approach is to divide a larger component into smaller sub-parts, which are manufactured separately and joined together, often using fusion welding processes [
5,
9]. Recent studies, however, showed that the weldability of additively manufactured aluminum parts significantly differs from cast or wrought parts [
10,
11,
12]. This challenge manifests itself in a pronounced porosity formation in the weld metal, leading to a significant decrease in its tensile properties. The main reason for the porosity is the presence of entrapped hydrogen in the base material. In contrast with conventionally manufactured products, powder exhibits an extremely high surface-to-volume ratio, which results in a pronounced reaction with the ambient air containing moisture during the powder’s handling [
4,
13,
14]. The high hydrogen content, combined with the strong temperature dependence of the hydrogen solubility in aluminum, leads to the formation of gas pores during the cooling and solidification of the melt pool. While a PBF-LB process also includes multiple cycles of re-melting and solidification, the available time is not sufficient for significant degassing. Thus, a large fraction of the hydrogen remains in the additively manufactured part and becomes the primary reason for weld seam porosity [
15]. The majority of studies have reported a significant amount of pores, which is inherently detrimental to the tensile properties of a weld seam. Hence, the load-bearing capacity of the parts is strongly restricted by the weld joints. To address this challenge, several studies have dealt with the weldability of AlSi10Mg, investigating the relations between the PBF-LB parameters, weld parameters, porosity, and tensile properties.
Table 1 provides an overview of recent studies on the weldability of AlSi10Mg samples produced by PBF-LB, using fusion-welding processes. For each study listed in the table, it is indicated whether and to what extent parameters of a specific category were investigated. The majority of the studies focused mainly on laser beam welding. Zhang et al. [
13], Mäkikangas et al. [
16], and Biffi et al. [
17] investigated the weldability of PBF-LB-manufactured aluminum, without variation in the welding parameters, and unanimously reported a significant weld seam porosity. Other authors put an emphasis on the interaction between the base material, welding parameters, and welding result, too. Li et al. [
18] investigated the effect of using aluminum powder as filler material in laser beam welding, as well as the impact of multiple (five and eight times) remelting. Through the successive remelting, the porosity was reduced, resulting in a higher strength of the weld seam [
18]. Peng et al. [
19] determined the influence of erbium- and zirconium-containing filler wires on the laser beam welding of AlSi10Mg. Feeding the wire into the weld pool led to a decrease in porosity and an increase in the strength of the weld seams. A beneficial effect of filler metals was also confirmed by Cui et al. [
20]. In their work, the authors compared a single-pass laser beam welding process without a filler metal with a welding process with laser metal deposition (LMD). Due to the layer-wise build-up and the consequently higher fraction of the filler metal in the weld metal, the porosity was greatly reduced.
Additional works were carried out under variation in the ambient pressure to determine its influence on the porosity formation. Schwarz et al. [
9] performed welding trials under reduced ambient pressure while simultaneously examining the effect of multiple remelting, too. According to their findings, multiple passes on the weld seam did not improve the weld quality. On the contrary, welding in a rough vacuum (15.5 mbar) led to a significantly lower amount of pores. In addition to reduced ambient pressures, hyperbaric process conditions were also investigated. Chen et al. [
21] varied the line energy and ambient pressure in their study on laser beam welding. They found that a higher line energy led to increased porosity due to the elevated temperature. Moreover, welding under higher ambient pressure results in a reduction in porosity due to the limitation in pore growth. Besides the welding process, the influence of the PBF-LB process or a subsequent heat treatment was also evaluated in some works. Beckmann et al. [
22] showed that the use of virgin powder can reduce the hydrogen in PBF-LB parts and even halve the porosity in the weld metal. Pre-heating of the build platform also had a minor, but positive influence on the weld quality. Biffi et al. [
17] applied a stress-relieving heat treatment at 320 °C on laser beam-welded samples and reported a more uniform hardness distribution in the base material and the weld metal. The heat treatment process, however, led to a further reduction in the ductility of the weld metal.
It can be stated based on the literature results that the majority of the works focused on laser beam welding. Studies on further welding processes, such as electron beam welding [
23] or friction stir welding [
24,
25,
26], were carried out, too. What all these processes have in common is that they are normally associated with a high degree of automation, making them suitable for serial production. However, for smaller batches or prototypes, manual welding processes, such as tungsten inert gas (TIG) welding, are of greater interest. Only a few research groups have dealt with TIG welding of additively manufactured aluminum. Zhang et al. [
13] compared TIG welding with filler wire with autogenous laser beam welding and observed that TIG welding resulted in a higher weld porosity. Gill et al. [
8] also reported on severe porosity, especially near the fusion boundary and also the surface.
Despite these findings, the current state of the research still lacks a deeper understanding of how the welding parameters influence the final weld quality. Additionally, the interaction between the PBF-LB parameters, weld strategy, and post-processing techniques, such as post-weld heat treatment, with regard to the weld quality, is still unclear. The goal of this study was to identify the factors in TIG welding that influence the weld seam quality, with a particular focus on the porosity and the resulting tensile properties. Additionally, the influence of the powder layer height in the PBF-LB process and the effect of post-weld heat treatment were also investigated.
2. Materials and Methods
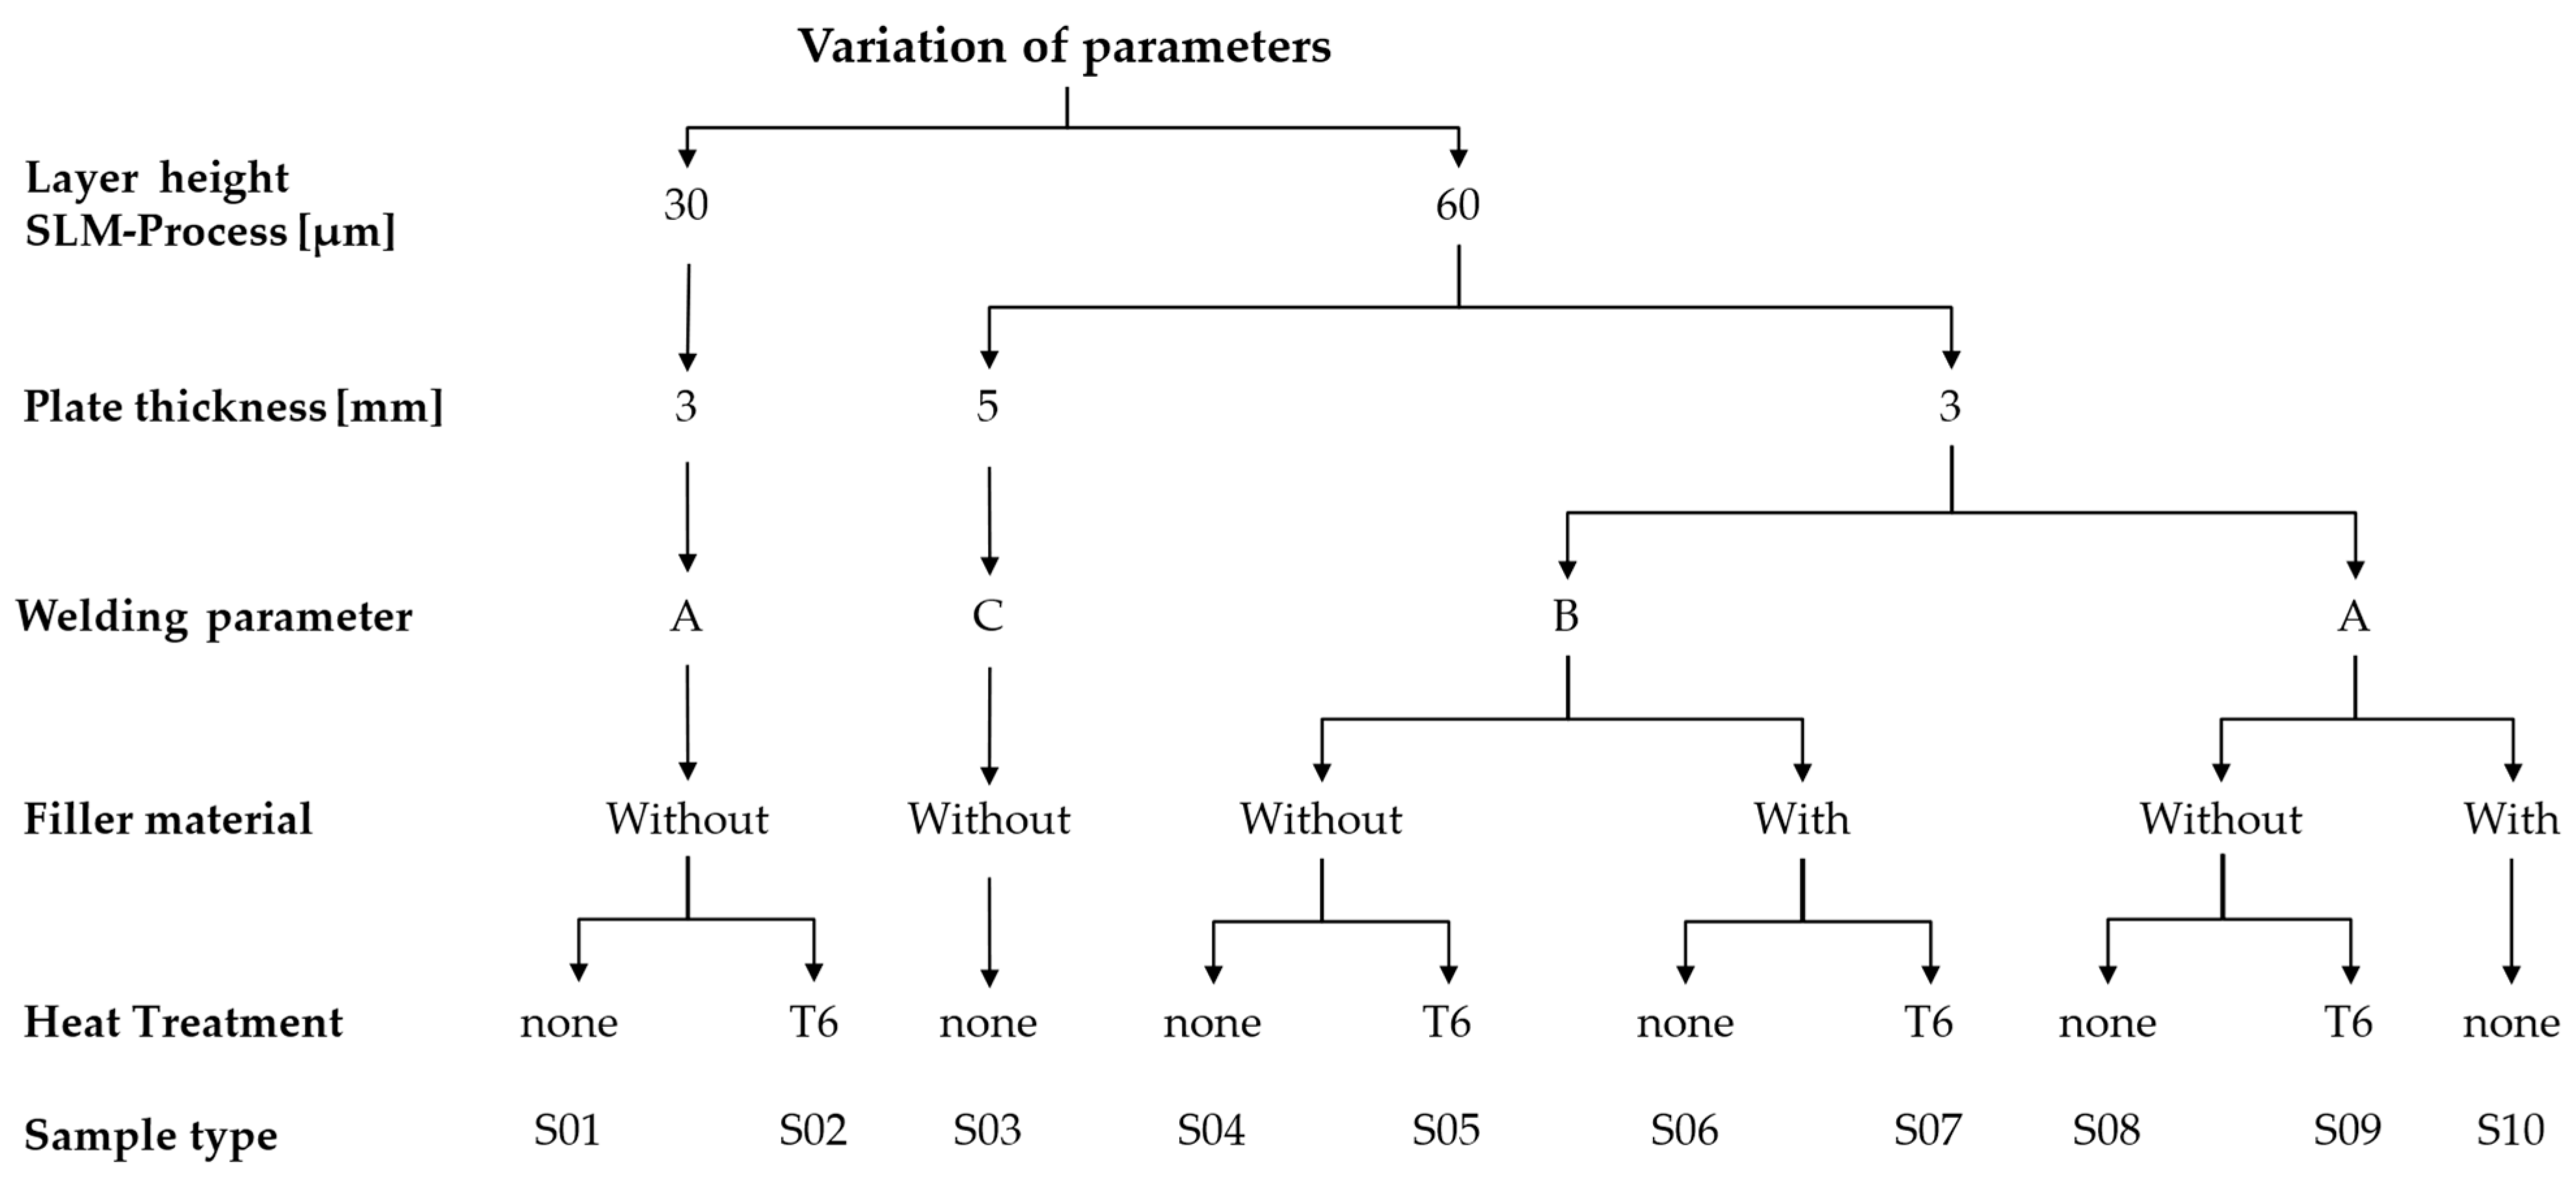
To achieve the described objective, the experimental design shown in
Figure 1 was developed. Two conditions were considered for each selected parameter to enable pairwise comparison and to identify potentially influential factors. This limited design was chosen intentionally due to the considerable time and material requirements of the experiments. The layer height was varied between two commonly used settings: 30 µm for detailed prints and 60 µm for faster prints. The plate thickness was also investigated, as it can influence the strength of the weld seam; thicknesses of three and five millimeters were considered. The influence of the welding parameters was examined in the next phase of the parameter variation. Lastly, the effects of the filler material and post-weld heat treatment were also explored.
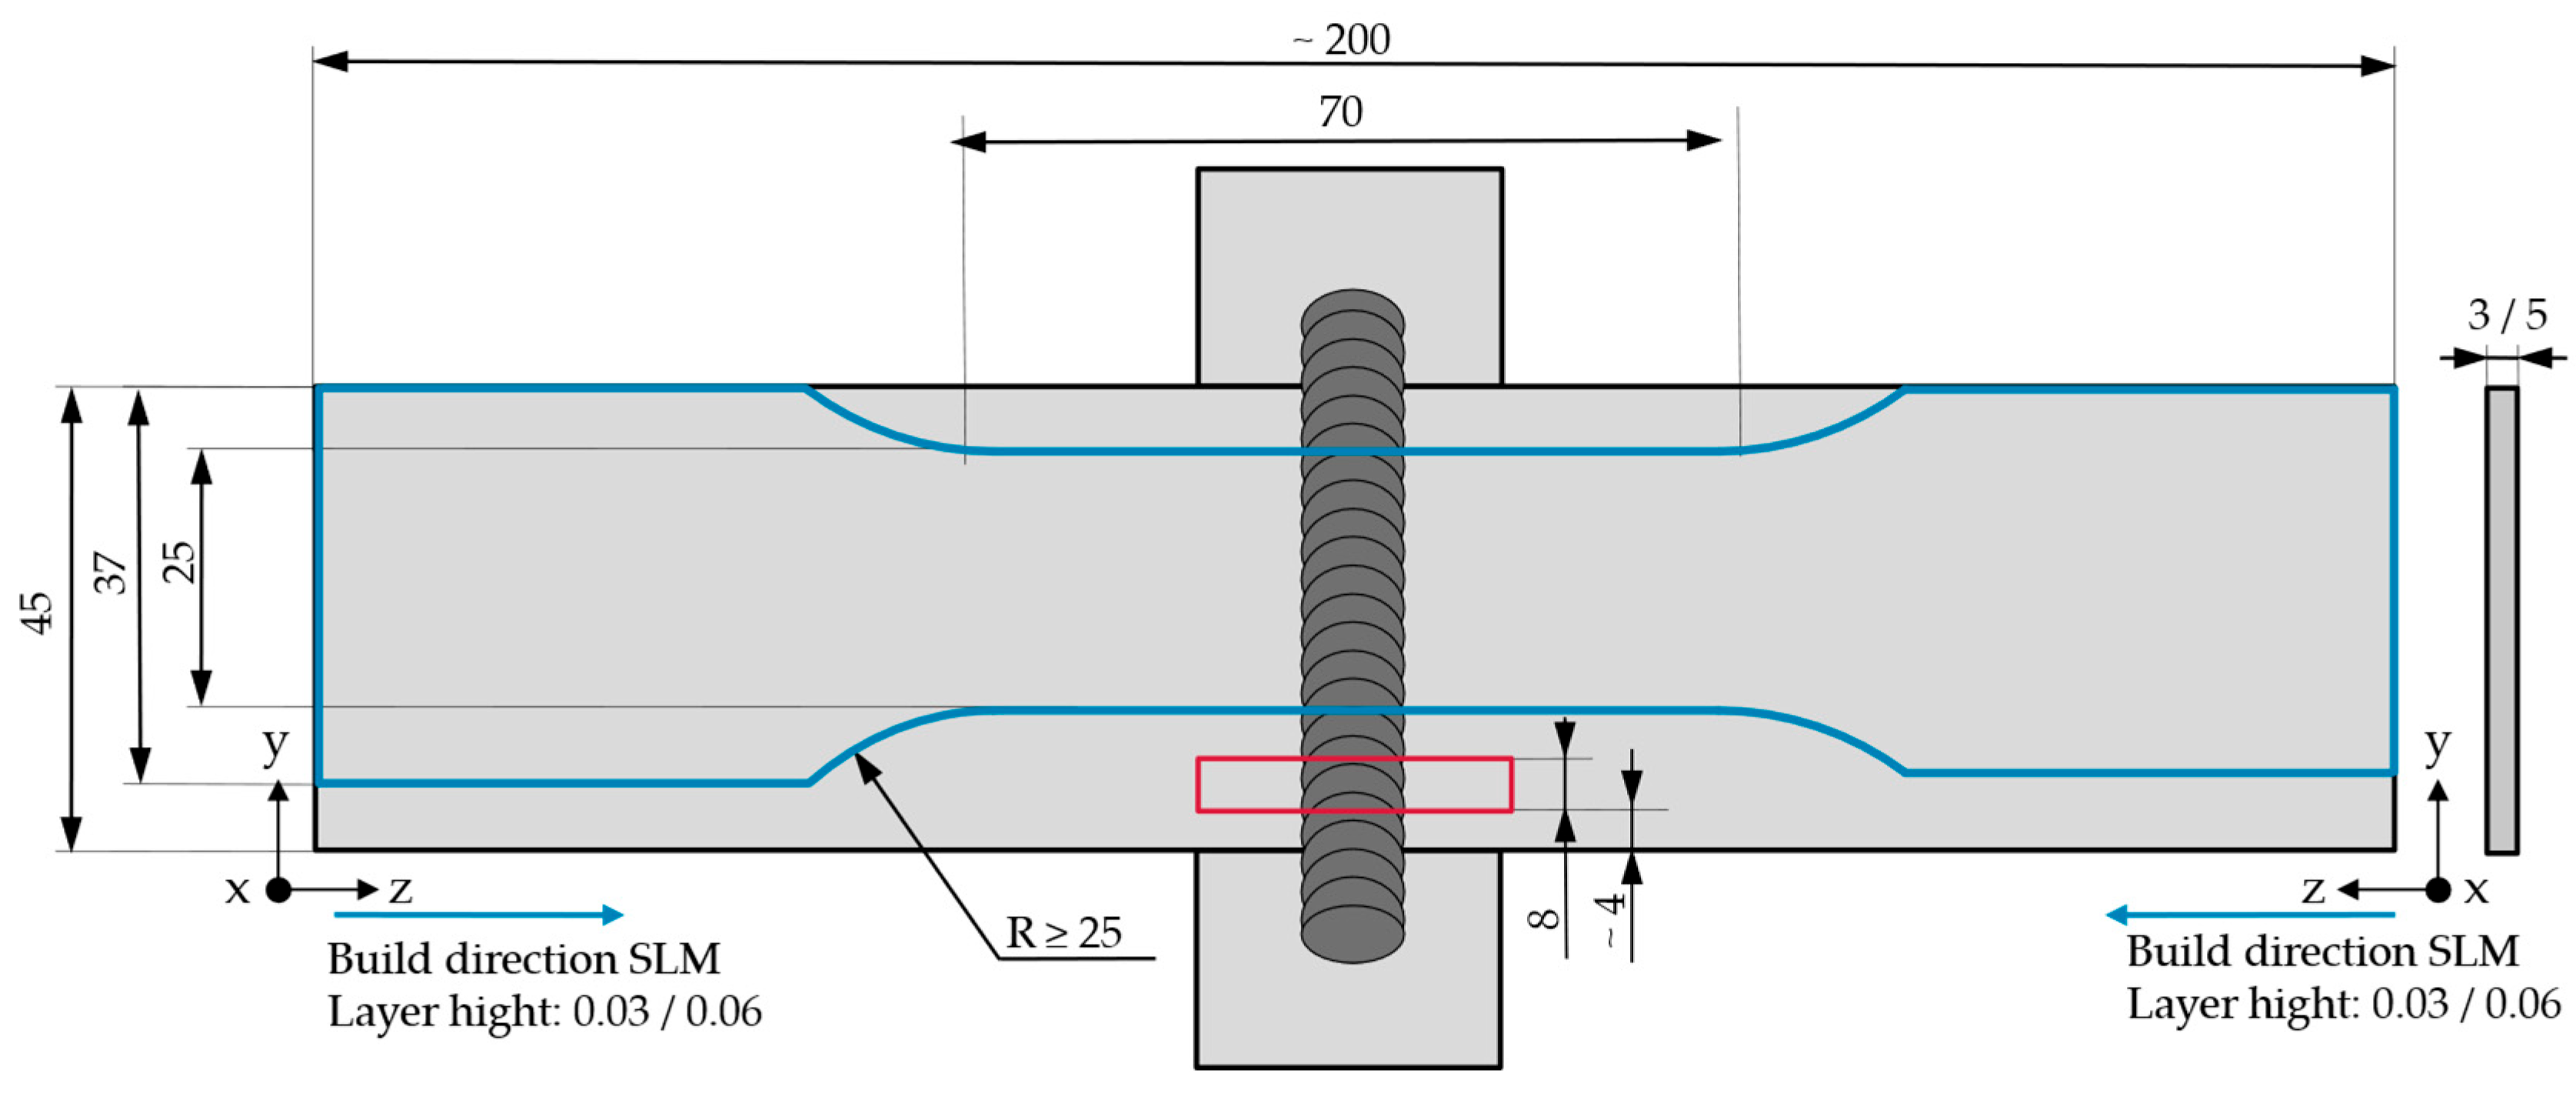
The samples, consisting of two PBF-LB-manufactured plates, measuring 45 mm × 100 mm, were TIG-welded as an I-joint without weld pool backing. Additionally, run-on and run-off tabs (30 mm × 30 mm) were attached to the sides of the workpieces to extend the weld line beyond the main joint, as can be seen in
Figure 2. Five samples were produced for each parameter combination (sample type). For each sample type, three metallographic cross-sections were extracted from three different samples, on which porosity analysis and microhardness measurements were carried out. A tensile specimen was extracted from each welded sample. Additionally, three randomly selected tensile specimens from each type underwent computer tomography (CT) before the tensile testing. The geometry of the welded samples, of the tensile specimens taken, and of the cross-sections is shown in
Figure 2. Further process details are explained below.
2.1. Additive Manufacturing of Plates
As the base material, aluminum powder EN AC-43000 [
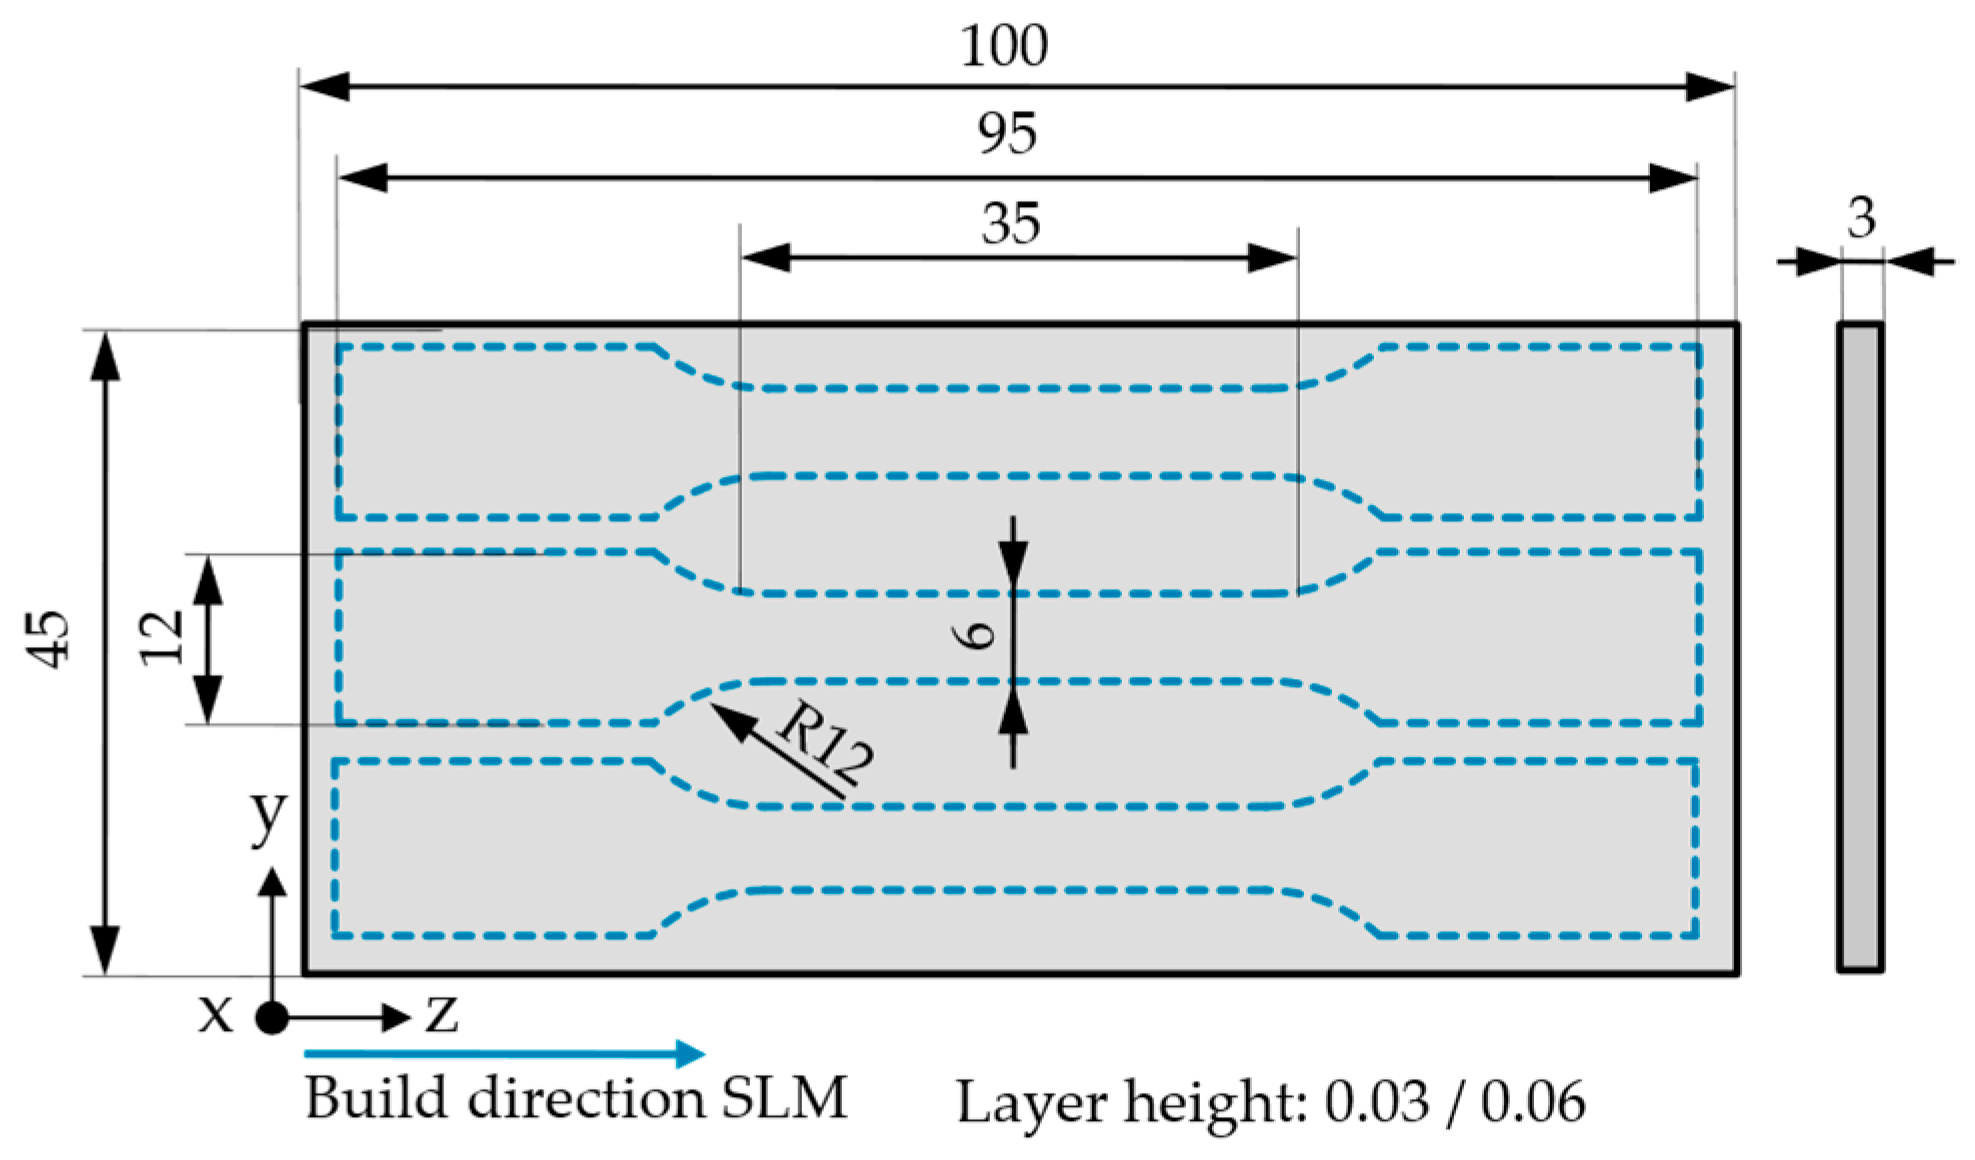
28] (AlSi10Mg; SLM Solutions AG, Lübeck, Germany) with a particle size of 20–63 μm was used. The plates were produced by formatting
Figure 3 with a uniform building direction (z). These were manufactured using the PBF-LB machine SLM125HL (SLM Solutions AG, Lübeck, Germany). Argon 5.0 with a purity of ≥99.999% was used as the shielding gas. The process parameters used are listed in
Table 2.
The layer height was set to 30 or 60 µm according to the experimental design (
Figure 1). The laser power was adjusted to 350 and 380 W for 30 µm and 60 µm layer heights, respectively. The laser scan speed of 1650 mm/s was chosen to be very high, as it has been shown that a reduction in the pore density in a PBF-LB-manufactured component is to be expected at higher scan speeds [
29]. After each build job, the remaining powder was sieved and reused for the next build job. In order to dry the recycled powder in the process, the build plate was heated to 150 °C. This was sufficient to minimize the hydrogen content but low enough to avoid softening in the material, which Buchbinder et al. found at higher temperatures [
30]. Further pre-drying of the powder was, therefore, not necessary [
12]. Since hydrogen is the main cause of porosity in welded aluminum, the additively manufactured plates were examined with regard to their oxygen and hydrogen content. The measurements were carried out on a LECO TCH600 (LECO Corporation, St. Joseph, MO, USA) elemental analyzer. Altogether, three plates were selected from three different build jobs, from which five specimens with a uniform mass of 0.64 ± 0.02 g were extracted. The sample surfaces were ground to avoid the influence of the oxide layer and any existing markings.
2.2. Tungsten Inert Gas Welding
In TIG welding, the influence of the line energy and filler material on the mechanical properties was investigated. Suitable welding parameters were determined in preliminary tests on the basis of iterative process optimization. The welding parameters applied in this study are shown in
Table 3, in relation to the different line energies. The line energies A and B were used for the samples with a plate thickness of 3 mm. The two welding strategies essentially differed in terms of welding speed, welding current, and line energy, too. The goal was to develop and investigate a welding process for the plates with a thickness of 3 mm in two different parameter regimes while maintaining a good weld quality with low fluctuations in the weld seam width. The line energy C was adjusted for the plates with a thickness of 5 mm due to different welding behaviors and cooling rates associated with thicker plates. All joints were welded as single-pass welds without weld pool backing. The values for the welding current and voltage shown in
Table 3 are the average values determined from the data of the HKS WeldScanner (HKS Prozesstechnik GmbH, Halle, Germany), which was used to record the welds. The line energy was then calculated from the average values determined and the specified welding speed. Welding was carried out with the TIG power source DALEX VARIO TIG 400 W—AC/DC (DALEX Automation & Welding GmbH, Wissen, Germany), with an alternating current (80 Hz; balance: 50–50%) and a 6-axis robot (KUKA Aktiengesellschaft, Augsburg, Germany). The experimental setup is shown in
Figure 4.
Pure argon (99.999%) was used as the shielding gas, with a gas flow of 12 L/min (3 mm plates) and 14 L/min (5 mm plates). For the sample series with the filler material, the distance between the electrode and the component was increased from 2 mm (without the filler material) to 3 mm. The filler material used was S Al 4046 (AlSi10Mg) [
31] filler wire (Drahtwerk Elisental W. Erdmann GmbH, Neuenrade, Germany), with a wire diameter of 1.0 mm. The wire feed speed was adapted to the welding strategy and was 0.8 m/min at line energy A and 1.1 m/min at line energy B.
2.3. Heat Treatment
T6 heat treatment is used in industry to increase the strength of heat-treatable aluminum alloys such as AlSi10Mg by precipitation hardening. In the current study, it was, therefore, investigated whether it could counteract the expected reduction in strength caused by welding. The welded samples were positioned upright in a muffle furnace using a fixture to avoid contact between the samples. Solution heat treatment was carried out in the first phase. The furnace, together with the samples, was first heated from room temperature (approx. 20 °C) at a heating rate of 160 °C/h to the solution heat treatment temperature of 525 °C. Afterward, this temperature was maintained for two hours. The samples were then quenched in water at room temperature. The next day (about 15 h later), artificial aging was carried out. For this, the samples were heated in the furnace at the same heating rate of 160 °C/h up to 160 °C and held at this temperature for eight hours. The samples were then cooled at room temperature.
2.4. Sample Characterization
To characterize the welded joints, cross-sections were taken from three of the welded samples per parameter combination across the weld seam. These were mounted, ground, and polished with SiO2, etched with a 5% solution of NaOH and water, and investigated by means of a DM-4000 light microscope (Leica, Wetzlar, Germany). Furthermore, porosity analysis by using a histogram based on image segmentation (IMS Client, Imagic Bildverarbeitung AG, Glattbrugg, Suisse) and microhardness measurements were additionally performed on the cross-sections.
The microhardness measurements were carried out using the Vickers method in accordance with DIN EN ISO 9015-2 [
32], with a test force of 500 g (HV0.5). The DuraScan microhardness testing machine (Zwick-Roell, Ulm, Germany) was used for this purpose. Three hardness indentations were taken in each of the two PBF base plates, the two heat-affected zones, and the weld metal. The hardness indentations were positioned manually using microscopic magnification in order to avoid the pores.
As the porosity analysis in the cross-sections only represented a random section of the weld seam, X-ray microcomputed tomography (µ-CT) was performed on three tensile specimens for each parameter combination, using a µ-CT (Vtomex by General Electric, Boston, MA, USA) scanner.
Table 4 provides a detailed overview of the applied machine parameters. The resulting data were processed with the software to obtain the porosity values.
2.5. Tensile Tests
The tensile strength was determined by a quasi-static tensile test in accordance with DIN EN ISO 6892-1 [
28]. As a reference, tensile tests were carried out on the base material, too. For this purpose, three flat tensile specimens were taken from three additively manufactured plates each. Two plates with a layer height of 0.06 mm and one plate with a layer height of 0.03 mm were tested, respectively. The tensile specimen geometry for the base material was designed based on the tensile test specimen of form E according to DIN 50125 [
33] and is shown in
Figure 5. The geometry had to be reduced due to the maximum plate size. The tensile tests were performed on the electromechanical testing machine Instron 5567 (Instron GmbH, Darmstadt, Germany) at a test speed of 0.57 mm/min. After testing, all fracture surfaces were evaluated using the digital microscope VHX 7000 (Keyence, Frankfurt, Germany).
In addition to the reference samples, tensile specimens were also extracted from the welded samples to characterize the influence of welding. The geometry of the flat tensile specimens was defined in accordance with DIN EN ISO 4136, whereby a weld seam width of 10 mm was given [
28]. The specimen geometry is shown in
Figure 2. To achieve constant specimen thicknesses of 3 mm and 5 mm, respectively, the weld and root reinforcements were plain milled. Contour milling was carried out using a CNC machine. The welded tensile specimens were tested in the electromechanical testing machine Instron 5584 (Instron GmbH, Darmstadt, Germany) at the same test speed of 0.57 mm/min as the base material specimens.
3. Results
3.1. Tensile Strength of Base Material
The determined tensile strength of the reference samples averaged 397 ± 2.7 MPa for a layer thickness of 60 µm and 449.6 ± 1.6 MPa for a layer thickness of 30 µm. As demonstrated in
Figure 6a,b, all samples exhibited a ductile shear fracture [
34]. A reduced number of defects, and of a smaller size, were visible on the fracture surface of the 30 µm sample (
Figure 6a) when compared with the fracture surface of the 60 µm sample (
Figure 6b). The mechanical tensile strength of all samples fell within the range specified in VDI 3405 (tensile strength: 353–482 MPa) for aluminum components manufactured using the PBF-LB/M process, making them suitable for further use [
6]. The slightly higher tensile strength of the samples with a layer height of 30 µm can be explained by the small pore size and porosity and the grain size differences associated with a lower layer height, as has previously been observed by Rautio et al. and Wu et al. [
35,
36].
3.2. Hydrogen and Oxygen Contents
The measured atomic hydrogen content in the additively manufactured samples amounted to 230 parts per million (ppm), while the average oxygen content was approximately 305 ppm. In their study, Riener et al. [
28] reported oxygen concentrations between 683 and 759 ppm, and hydrogen contents ranging from 143 to 908 ppm, depending on the condition of the powder (i.e., new, briefly aged, aged, or aged plus dried) [
37].
The difference in the hydrogen content between the new powder (used in build job 2) and the reused powder was relatively minor, at approximately 40 ppm, and was, therefore, considered negligible when combining materials from different build jobs for sample fabrication. Throughout the powder-handling process, particular attention was paid to maintaining a low-humidity environment, minimizing exposure times, and storing the powder exclusively in sealed containers. These measures resulted in impurity levels below those reported by Riener et al. [
37]. Nevertheless, the observed hydrogen concentration exceeded the maximum solubility limit of hydrogen in aluminum, which is 102 ppm [
15,
38]. It is, therefore, likely that additional hydrogen was present in the form of microscopic pores or was bound as water or hydroxides within the surface oxide layer of the aluminum [
15,
29].
3.3. Metallography
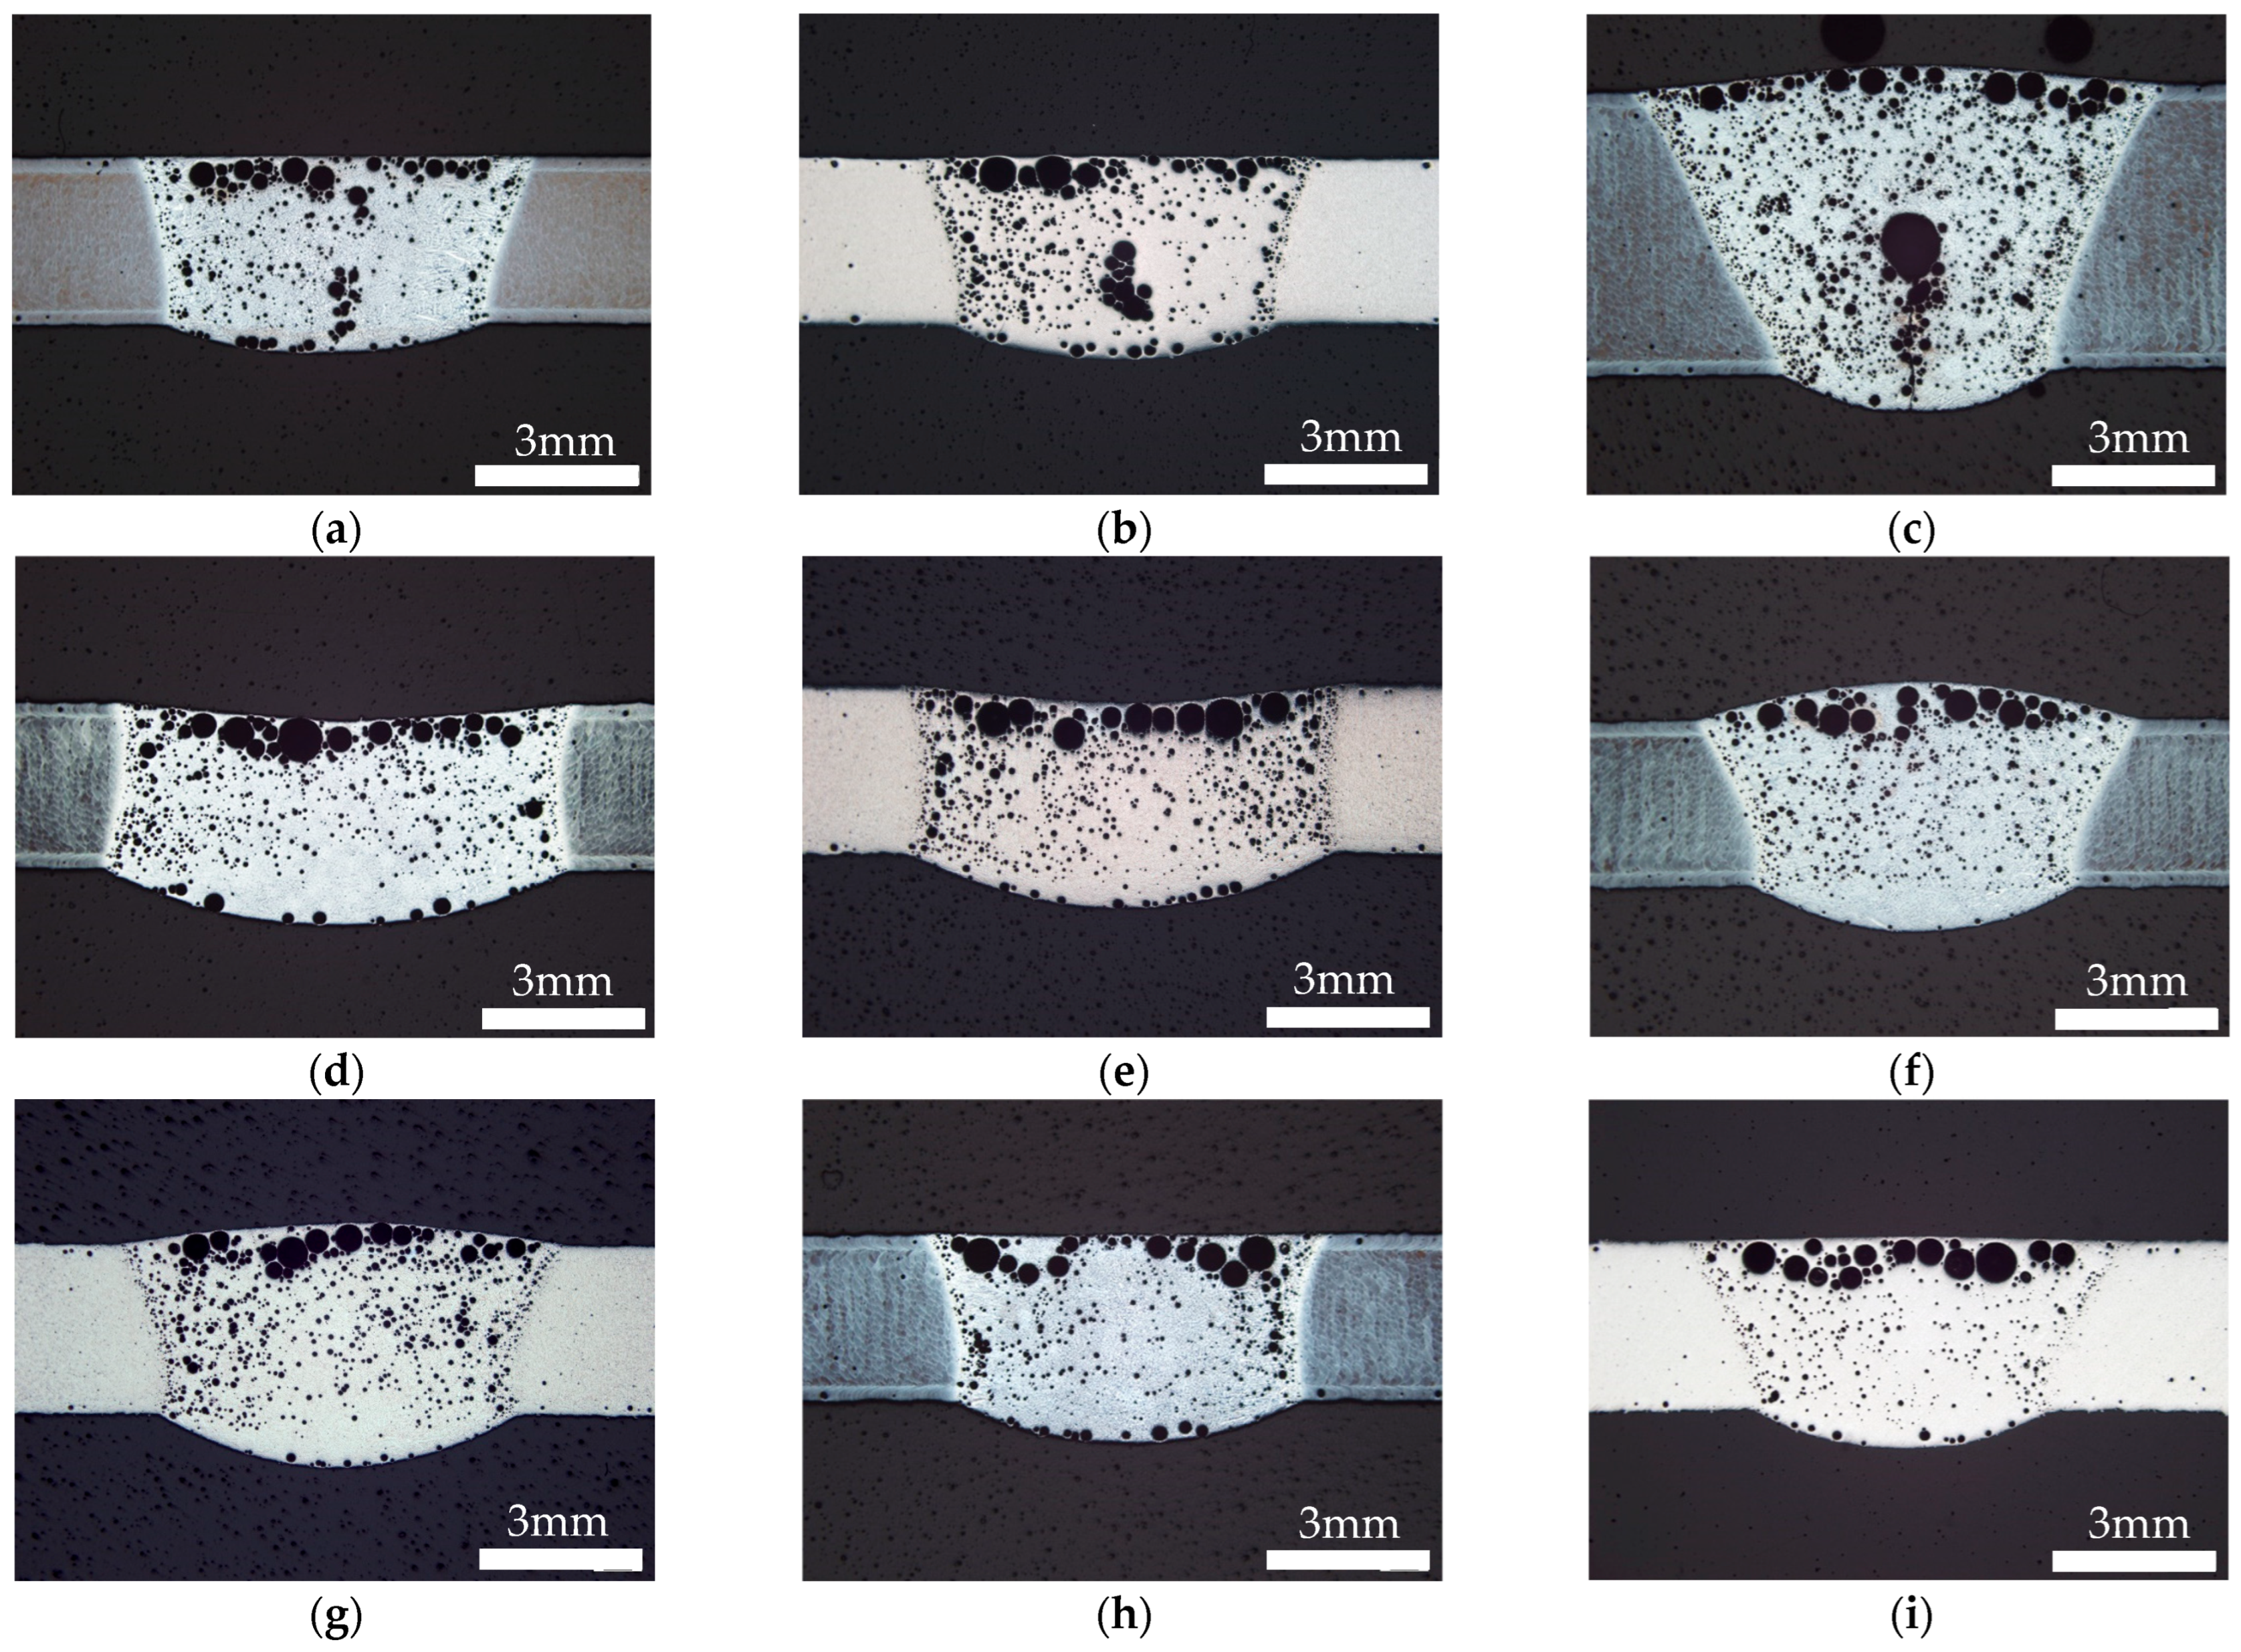
Figure 7 shows one exemplary micrograph of the ones taken for each parameter set. Microscopic examination of the polished sections revealed a high overall porosity in the weld seams, with larger pores occurring predominantly in the upper part of the seam. A fine pore band with smaller pores was visible along the melt pool boundary in all samples. A further noteworthy observation was the aggregation of pores in the center of the weld pool, particularly evident in series S01 to S03. The selection of welding parameters had a substantial influence on the resultant seam profile. When welding parameter A (with a lower welding speed and a lower welding current) was applied (see samples S01, S08, and S09 in
Figure 7a,h,i, respectively), there was a reduced incidence of seam shrinkage and a decreased mean seam width (see samples S04 and S05 in
Figure 7d,e, respectively) compared with welding parameter B (with a higher welding speed and higher welding current and an overall lower line energy compared with parameter A).
The utilization of the filler material, as evidenced in samples S06 and S07, resulted in a substantial increase in the weld reinforcement. It is noteworthy that weld reinforcement was also observed in sample S03, despite the absence of the filler material.
Finally, in samples S02, S05, S07, and S09, a microstructural transformation from numerous clear grain boundaries to a more homogeneous microstructure in the base material was evident as a consequence of the subsequent T6 heat treatment.
Additional focus was put on the evolution of the microstructure for different parameter combinations, especially with regard to the T6 heat treatment.
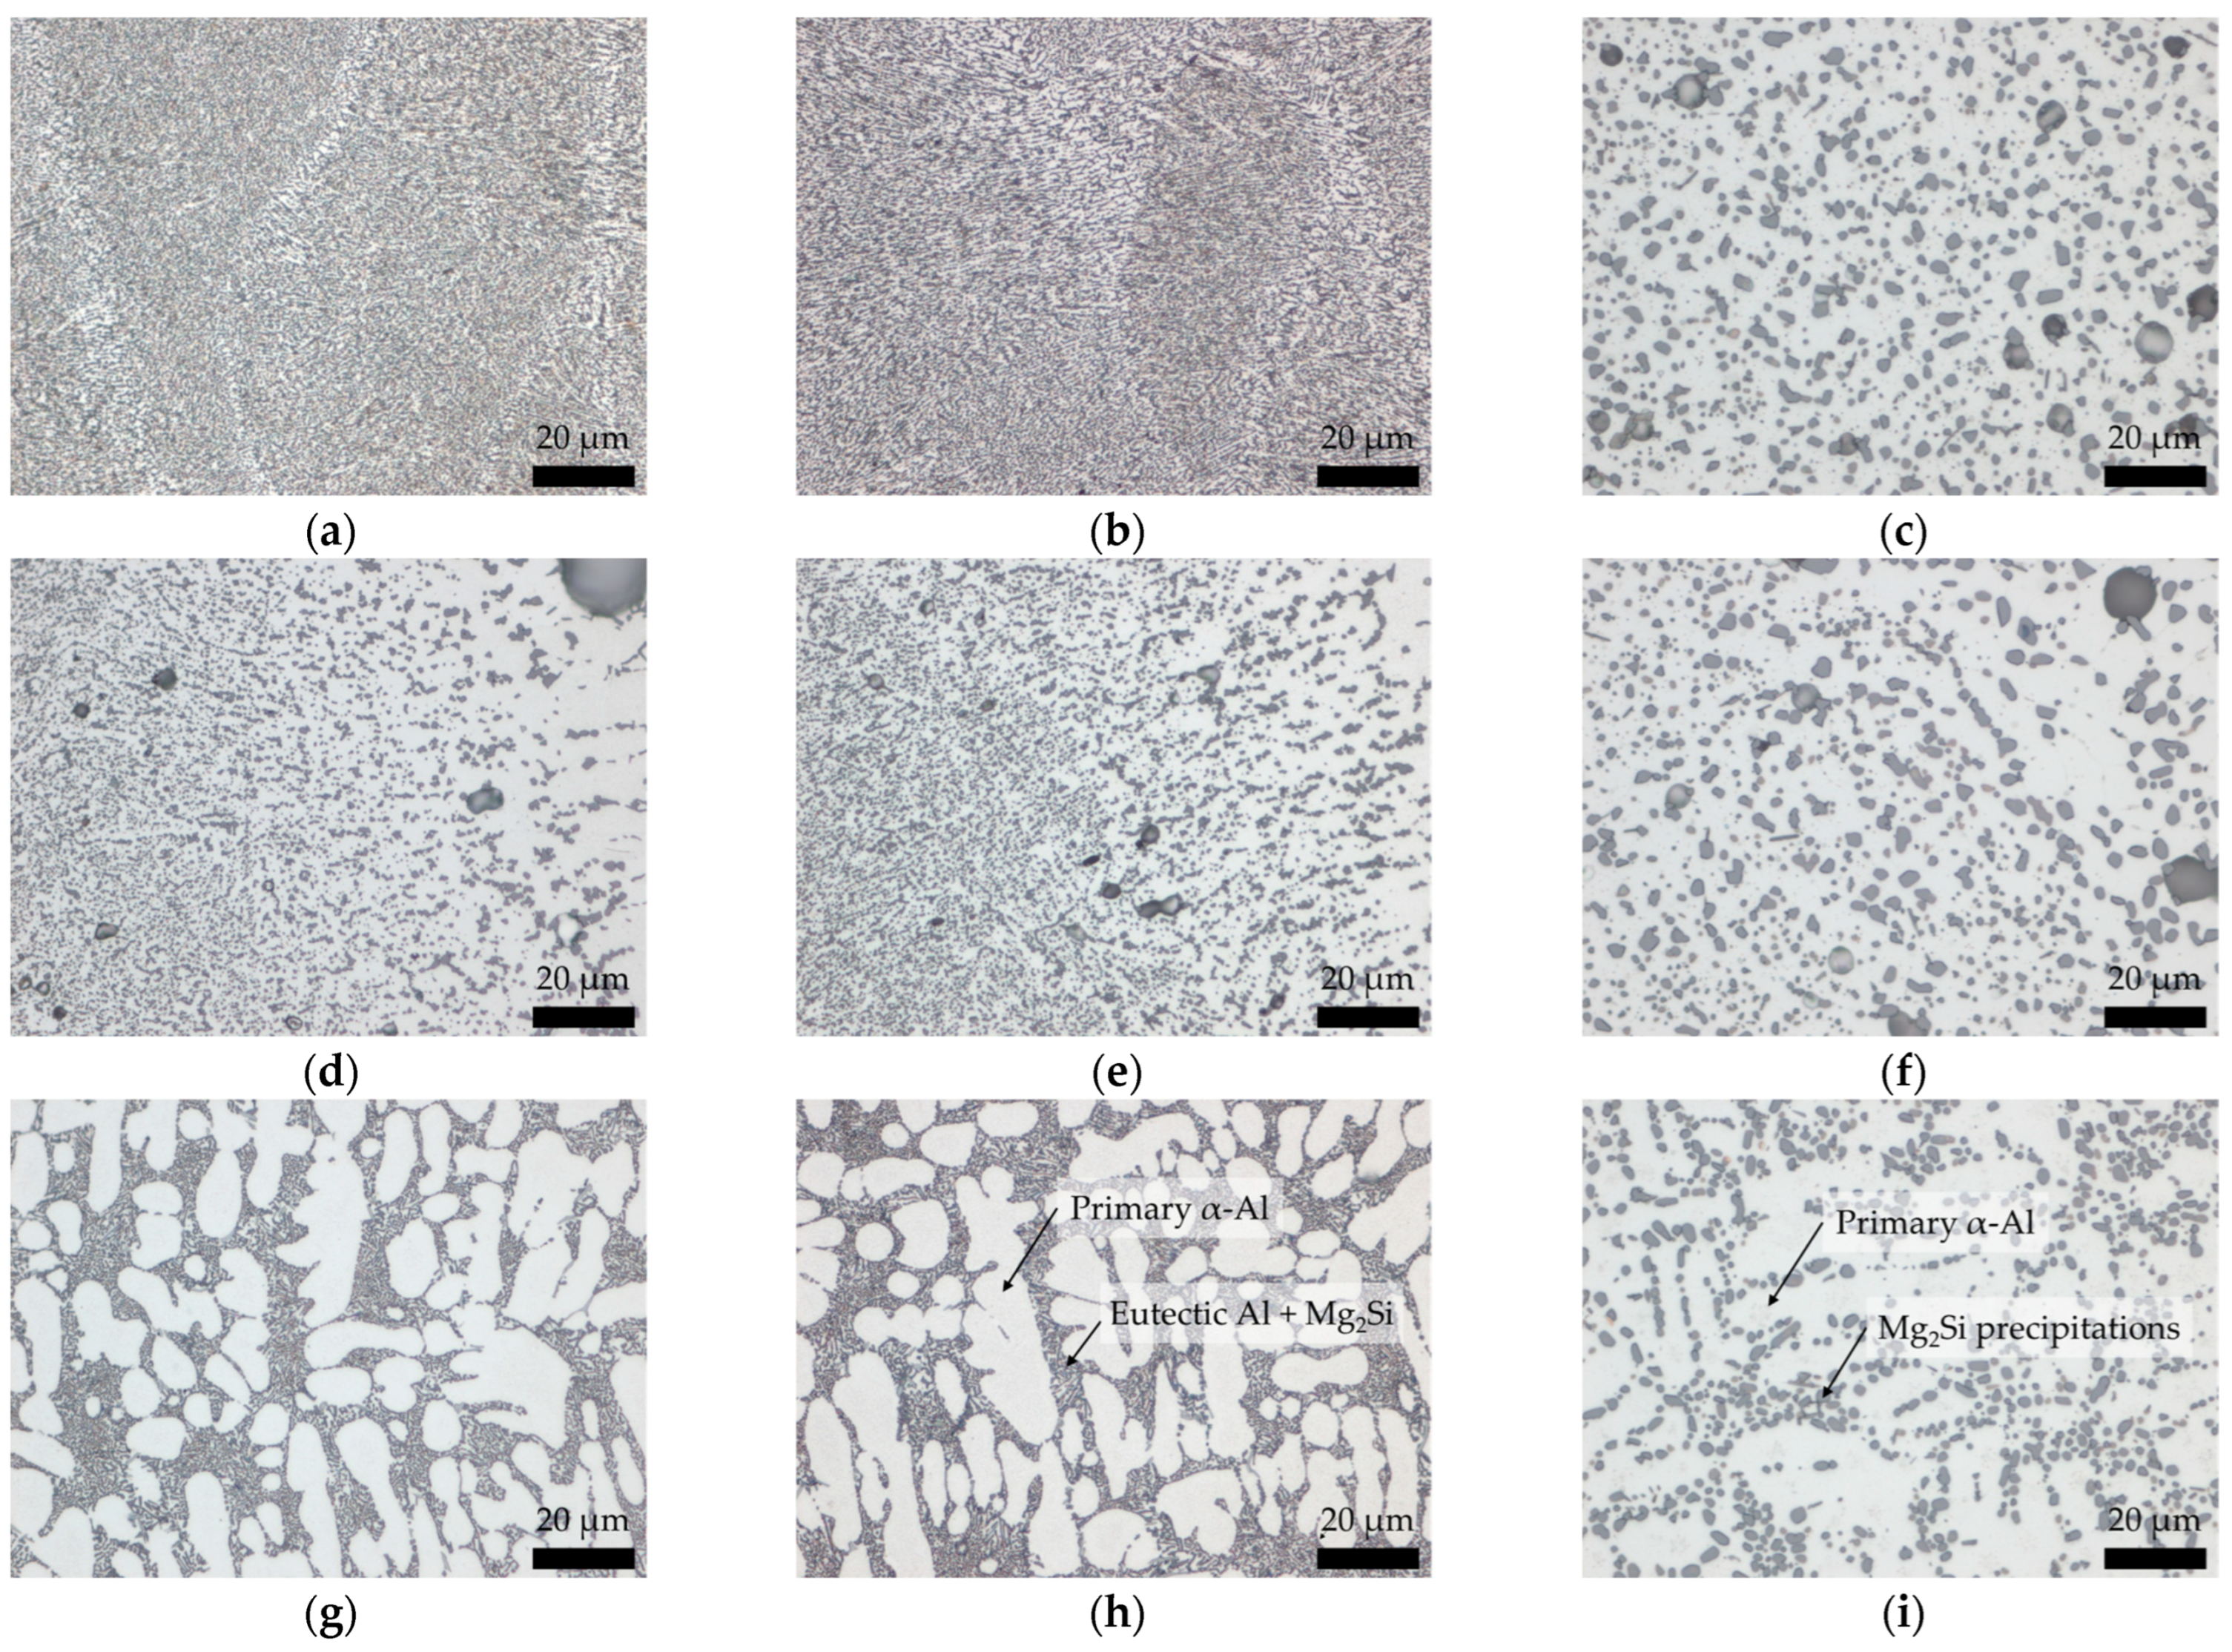
Figure 8 shows the microstructure of the base material (BM), heat-affected zone (HAZ), and weld metal (WM) for samples S01 (with a layer height of 30 µm, welding parameter A, no filler wire, and no heat treatment), S08 (with a layer height of 60 µm, welding parameter A, no filler wire, and no heat treatment), and S09 (with a layer height of 60 µm, welding parameter A, and no filler wire but with T6 heat treatment). For S01 and S08, small, elongated precipitations could be observed in the α-Al matrix, but no difference could be seen between the series. On the contrary, the S09 sample underwent T6 heat treatment, showing a different microstructure, where larger, round Mg
2Si precipitations were embedded in the α-Al matrix. In terms of the HAZ, a transition could be observed, where the precipitations became less dense and larger in size when moving in the direction of the WM. However, no such transient structure appeared in S09. Significant differences were seen in the WM, too. Without T6 heat treatment (S01 and S08), the microstructure consisted of α-Al and a eutectic Al + Mg
2Si phase with a needle-like morphology. In contrast, the microstructure of the WM that underwent T6 heat treatment was composed of primary α-Al and round Mg
2Si precipitations close to the original phase boundaries.
3.4. Hardness
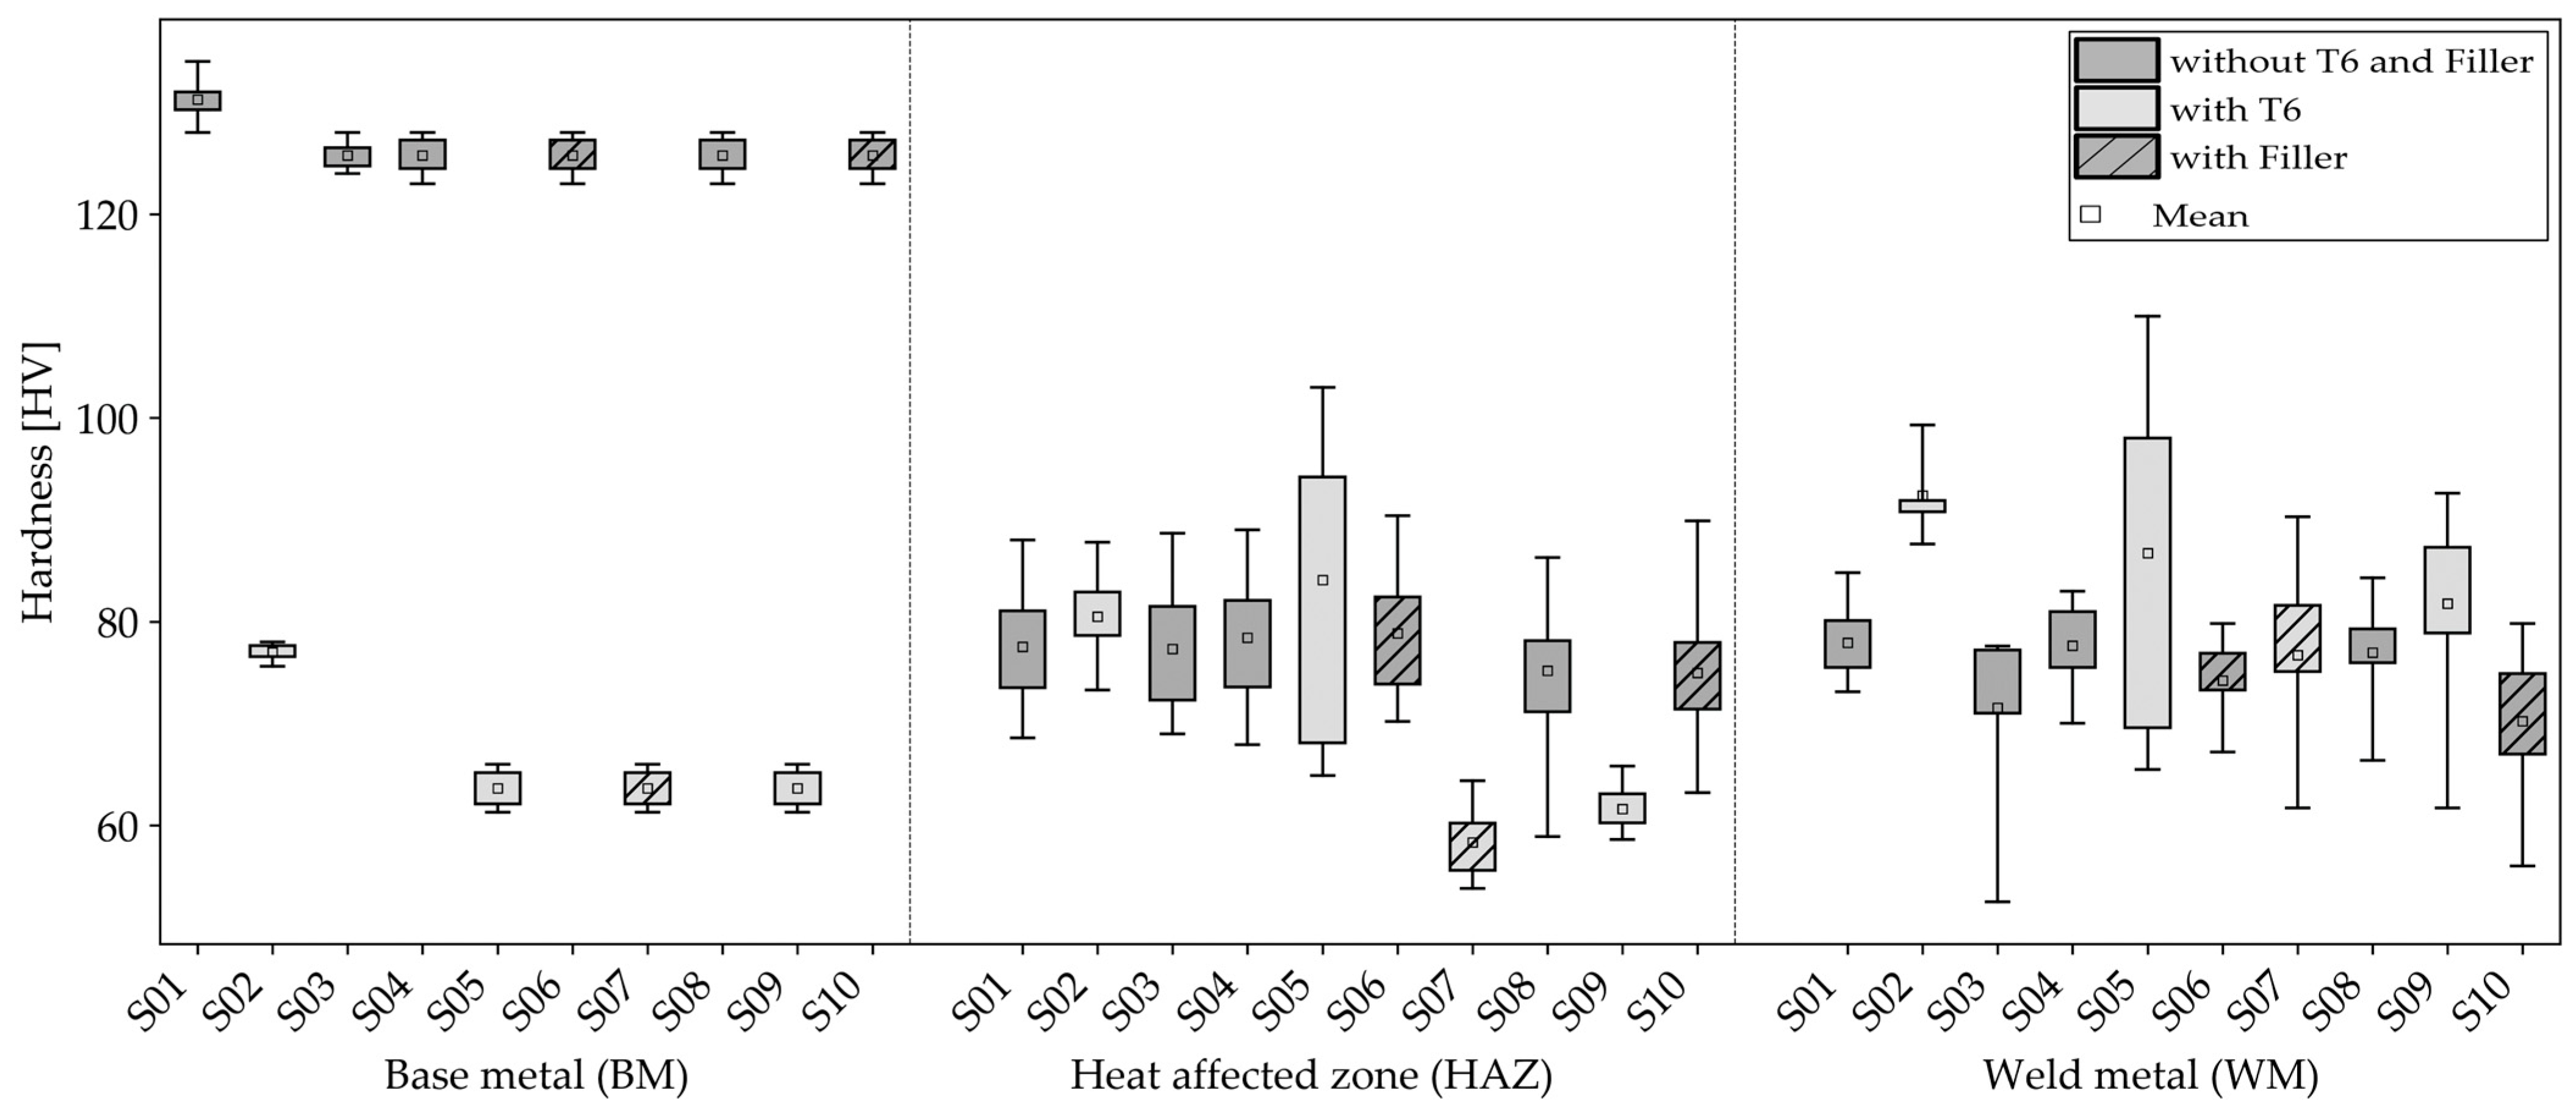
Figure 9 shows the measured microhardness distribution of the 10 sample types. In the absence of a subsequent T6 heat treatment, the weld seam showed a lower hardness (70–80 HV) in comparison with the adjacent base material (BM) (125–130 HV). The application of T6 heat treatment resulted in a decrease in hardness in the base material to 60–75 HV. In contrast, the hardness in the weld metal (WM) slightly rose to 70–80 HV.
For a layer height of 30 µm (S01 and S02), the microhardness in the BM was higher than for specimens with a layer height of 60 µm (from S03 to S10), considering the respective heat treatment. This might be due to the prolonged manufacturing time and the doubled number of thermal cycles, which favored precipitation hardening. The hardness of the base material matched the expectations based on the existing literature of 117–132 HV [
17,
28].
The hardness values determined in the weld joint were much lower than those of the base material. In terms of the heat-affected zone (HAZ), the majority of the readings were between 70 HV and 90 HV. It can be additionally noted that S07 (welding parameter B with T6 heat treatment and filler wire) and S09 (welding parameter A with T6 heat treatment and without filler wire) had a lower hardness (55–65 HV) in their HAZs.
The significance of the hardness measurements in the weld metal (WM) is limited due to the high pore content of the material. The limited number of usable indentations, in conjunction with the potential for individual measurements to encounter pores beneath the surface, can result in enlarged impressions and, consequently, locally diminished hardness values and elevated scatter (e.g., for S05). Nevertheless, it can be seen as an overall trend that subsequent T06 heat treatment increased the hardness in the WM (S02 vs. S01; S04 vs. S05; S06 vs. S07; and S08 vs. S09, respectively).
3.5. Porosity Analysis
The metallographic evaluation of the micrographs is shown in
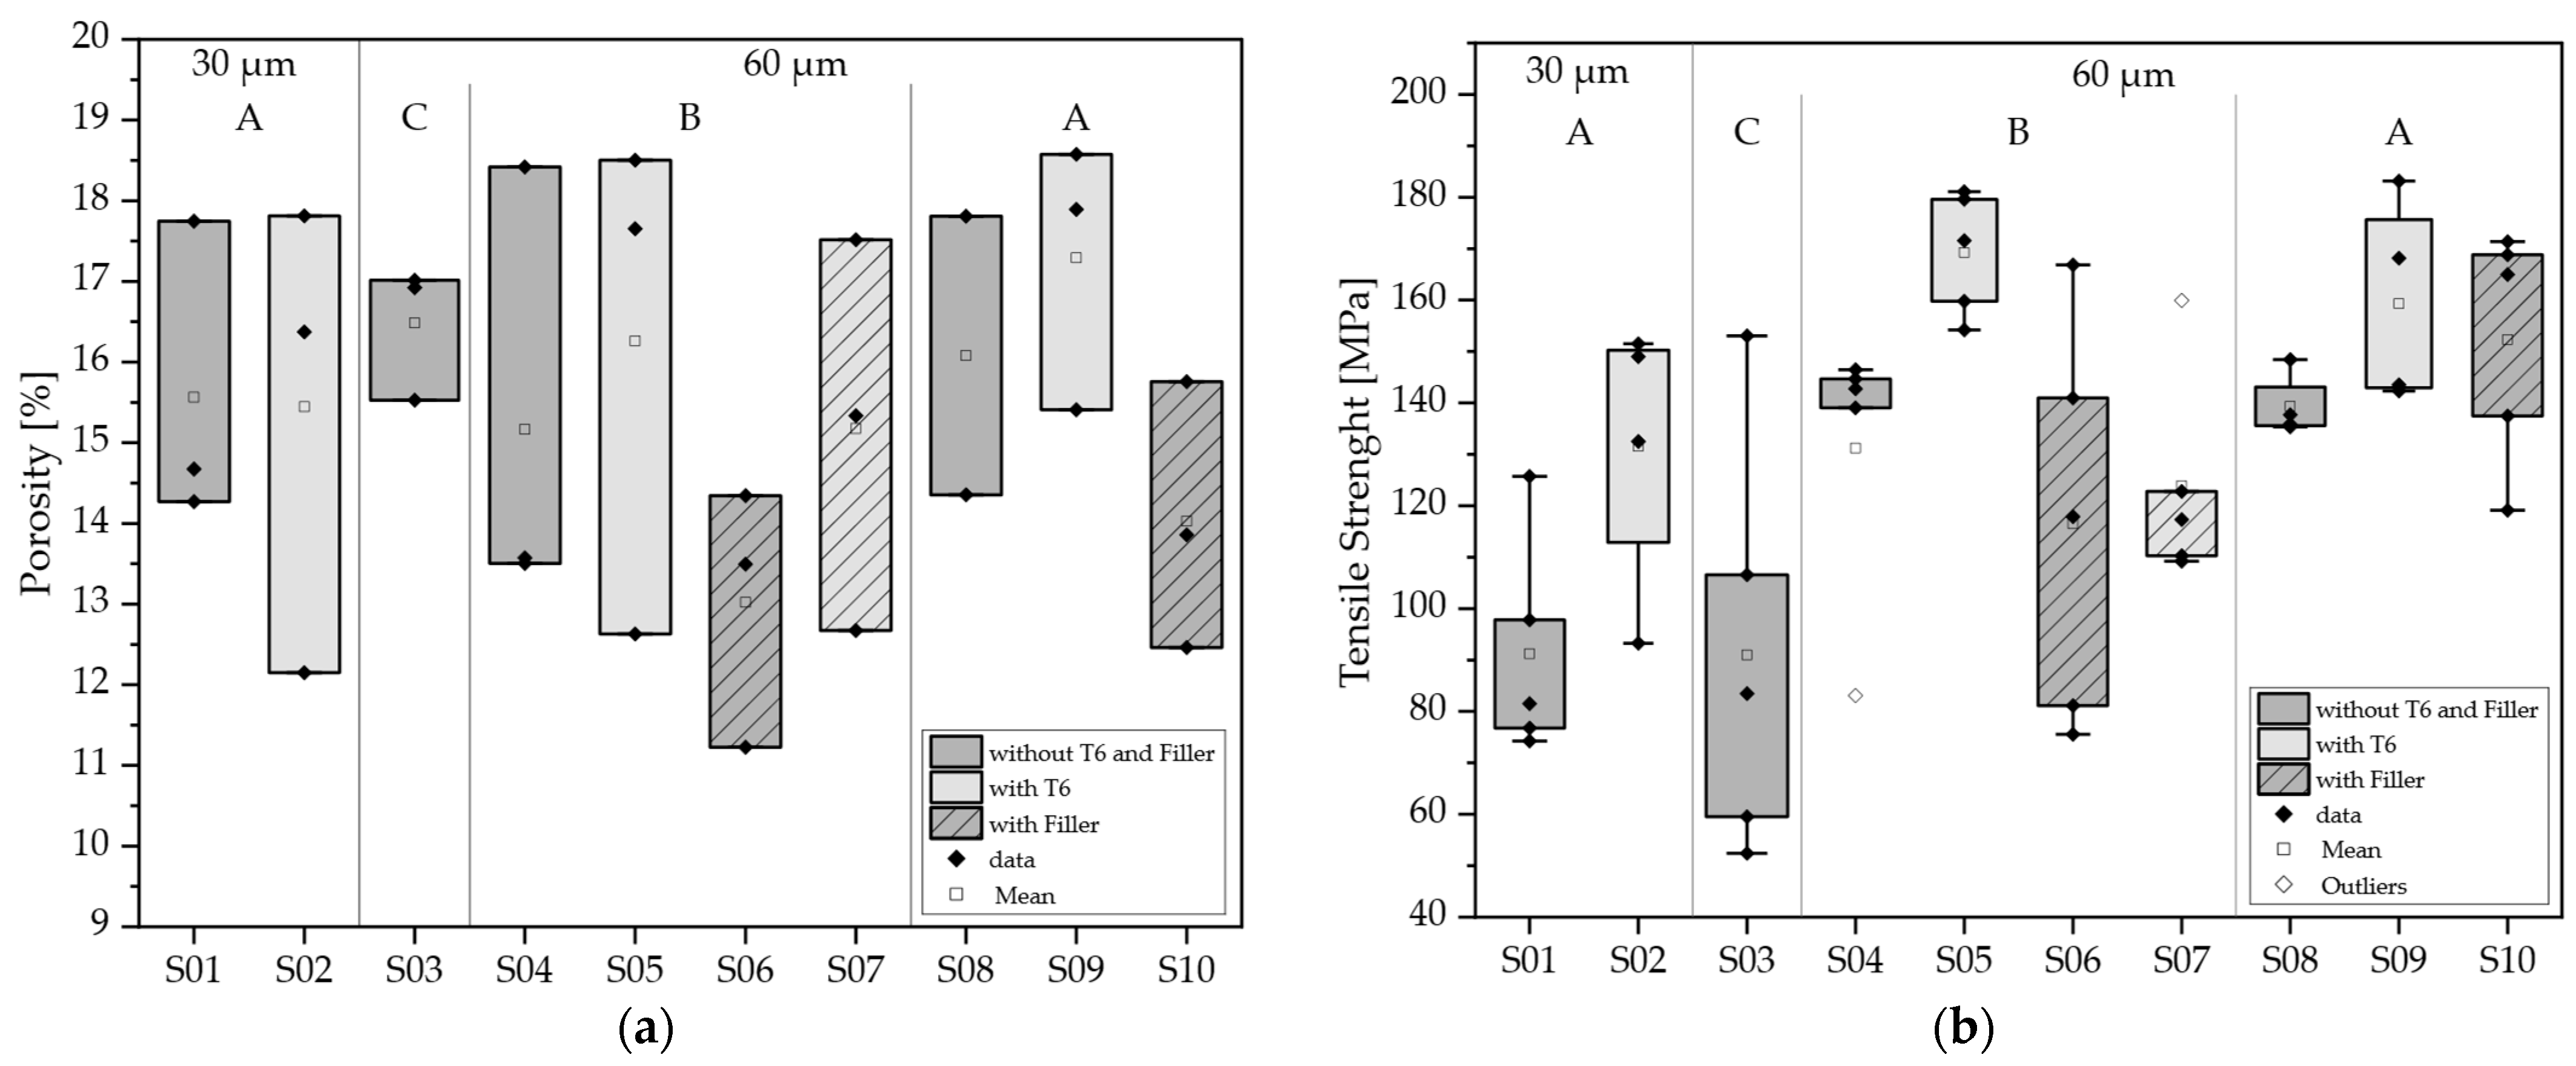
Figure 10a and revealed a generally comparable porosity in all samples examined, with values ranging from 11% to 19%. Statistically, no significant difference was found between the individual series (
p = 0.55 > 0.05 = α), indicating that the pore quantity in the respective samples was fundamentally similar. It is evident that the samples containing the filler material exhibited a modest propensity toward diminished porosity. However, due to the limited sample size, this effect was not statistically significant. Consequently, a CT analysis was also performed. However, the resolution of the images was found to be inadequate, thereby precluding the possibility of discerning the small pores. Consequently, the results yielded no added value.
3.6. Tensile Strength
The tensile strengths of the examined weld joints ranged from 50 to 180 MPa, which were up to a third lower than those of the base materials. Fracture predominantly occurred in the middle or at the fusion line of the weld seam. All samples failed as brittle fractures with nearly no elongation. The lowest strength values were found for a plate thickness of 5 mm (91 ± 41 MPa), while the highest tensile strengths (169 ± 12 MPa) were achieved for sample S05 (with a layer height of 60 µm, SP welding parameters, T6 heat treatment, and no filler material). The samples with a lower layer height of 30 µm (S01 and S02) had a tensile strength of 91 ± 21 MPa without and 132 ± 27 MPa with heat treatment. With welding parameter A (S04–S07), the tensile strength measured 143 ± 4 MPa without heat treatment, 169 ± 12 MPa with heat treatment, 124 ± 21 MPa with the filler, and 116 ± 39 MPa with the filler wire and heat treatment. The welding parameter B led to a tensile strength of 139 ± 6 MPa without heat treatment (S08) and 159 ± 20 MPa with heat treatment (S09). Welding with the filler wire (S10) resulted in a tensile strength of 152 ± 23 MPa. Statistical analysis of the test data using ANOVA showed that the individual series differed significantly from one another at a significance level (α) of 0.05. The ANOVA results are shown in
Appendix A. The main influencing factors are shown in
Figure 11. The diagrams show the direct comparisons of the parameter variations.
An analysis of the welding parameters indicated that parameter set A led to a greater dispersion of tensile strength values compared with parameter set B, but resulted in a comparable mean tensile strength. However, when comparing the parameter set A with C, it became visible that the excessively high line energy associated with the parameter set C, applied for the joining of the 5 mm thick plates, reduced the tensile strength (p = 0.053).
Additionally, the layer height was demonstrated to exert a substantial influence on the weld strength (p = 0.016). It was demonstrated that as the layer height increased, the strength of the weld seam decreased. The application of T6 heat treatment after welding also had a significant effect (p = 0.0042) and led to an increase in the maximum weld seam strength.
Moreover, the utilization of the filler material was demonstrated to exert a substantial influence on the strength of the weld seams (p = 0.022). The use of the filler material was observed to result in a decline in the strength of the weld seams.
The interactions between the layer height, welding parameters, filler material, and heat treatment cannot be statistically proven. In a similar manner, the direct influence of the various welding parameters on weld strength remains insignificant.
4. Discussion
4.1. Weld Seam Quality
The pores visible in the micrographs typically form at the solidification front during the welding process as a result of a solubility jump of hydrogen in aluminum during the transition from the liquid to the solid state [
14]. In the course of the solidification process, hydrogen diffuses from the material undergoing solidification into the remaining melt. This process gives rise to the formation of pores. The growth of these pores is facilitated by the diffusion of hydrogen and the subsequent merging of neighboring pores. In accordance with the principles of thermal lift, the hydrogen rises to the surface of the melt, resulting in the observable pore distribution. Large pores are found to be preferentially located in the upper region of the weld seam, while smaller pores are distributed throughout the melt.
The formation of a finer pore band in all series at the edge of the weld seam is indicative of increased nucleation in this area. An uneven boundary of the melt pool, in conjunction with local defects at this boundary, could serve as nuclei for pore formation. These irregularities result in local increases in concentration, thereby promoting the nucleation of pores [
39,
40]. It can be hypothesized that the majority of the hydrogen dissolved in the melt enters the melt by diffusion from the base material, resulting in an increased hydrogen concentration in the molten pool. However, the precise quantitative value of this proportion remains to be determined. Alternative potential sources of hydrogen within the molten pool during the welding process may include the absorption of hydrogen from the surrounding ambient air, surface contamination, and hydrogen content inherent within the filler material [
41].
In specific metallographic sections, an accumulation of pores was observed in the center of the weld seam. This phenomenon cannot be unequivocally explained on the basis of the micrographs, but could be attributed to various physical effects. One potential cause of this phenomenon lies in the dynamics of the solidification front. It has been established that, at the elevated cooling rates that are characteristic of aluminum, gas pores and non-metallic inclusions have the capacity to be displaced from the solidification front to the center of the seam [
41].
In sample set S03, hot cracks occurred in addition to the accumulation of pores in the center of the weld pool. These cracks can arise due to the greater plate thickness and the associated thermal stresses during cooling. These hot cracks are exacerbated by the presence of particularly large pores in the center of the weld pool. These pores were likely to be larger in the 5 mm samples than in the 3 mm samples because they had more time to grow due to the longer cooling times, yet they still could not escape the weld pool due to the greater distance to the surface.
Furthermore, a temperature gradient within the molten pool may result in surface tension differences, thereby inducing the phenomenon known as the Marangoni effect. This phenomenon involves the movement of material along the surface of a molten pool, originating from regions where surface tension is lower and migrating toward areas where surface tension is higher. This flow, consequently, results in a retrograde movement within the molten pool volume. The temperature distribution and cooling process are pivotal factors in this effect, as they can promote the accumulation of pores in the center of the weld seam. These pores are trapped before degassing by the approaching solidification front [
42,
43].
A comparison of the microstructure of the base material at varying layer heights in the PBF process revealed that a finer grain structure was produced at a layer height of 30 µm (sample S01) compared with 60 µm (sample S04). This phenomenon could be attributed to the increased number of individual layers applied at lower layer heights, leading to an increased number of melt pool boundaries and, consequently, a finer grain structure. More melt pool boundaries may reduce the thermal conductivity of a material [
44]. In addition, the probability of defects at these interfaces is increased, which can act as nuclei for crystallization [
45].
As demonstrated in this research, the utilization of welding parameter A resulted in a weld pool of reduced dimensions when compared with the use of welding parameter B. Additionally, the reduction in the heat input was shown to diminish the occurrence of seam sagging due to gravitational forces. The utilization of a filler material invariably resulted in the occurrence of seam elevation due to the introduction of additional molten material, which must have been accommodated within the weld volume. In the absence of filler material in sample 03, its increased melt volume could be attributed to the high pore volume enclosed in the weld metal, which displaced the melt.
The subsequent heat treatment of the material, in this case, following the welding process, was demonstrated to contribute to the homogenization of the microstructure. In particular, the microstructure of the weld metal, which consisted of a primary α-Al phase and an α-Al + Mg
2Si eutectic structure in the as-welded condition, underwent a transition, resulting in a microstructure with spherical Mg
2Si precipitations in an α-Al matrix. The heat treatment resulted in an overall more uniform and refined microstructure, both within the weld seam and in the adjacent base material, as previously observed by Alghamdi et al. [
46]. This was characterized by a reduction in hardness when compared with the as-built base material, as indicated by the hardness measurement.
4.2. Tensile Test
The tensile strength values thus determined were within the range commonly reported in the literature: approximately 150 MPa without and up to 220 MPa with T6 heat treatment [
6]. However, these values were significantly lower than those of the base material, measured at 397–449 MPa in the reference samples. This was mainly due to the differences in the porosity levels and the microstructures. The welding process led to much higher porosity and local softening compared with the base metal, which, in turn, reduced the strength. As indicated by the extant literature, disparities in hardness distribution between the base material and the weld seam could result in premature failure [
47].
The tensile test revealed significant differences between the tested series, with the main influencing factors being the layer height, heat treatment, filler material, and plate thickness.
The layer height was demonstrated to have a substantial influence on the pore distribution. In 30 µm samples, larger pores accumulated in the center of the weld pool, while in 60 µm samples, the pores tended to be closer to the surface. This phenomenon may be attributed to variations in the cooling rates and the occurrence of flow phenomena, such as Marangoni flow, as mentioned in the analysis of the micrography. This is of particular significance when pores are concentrated in a single plane, as this results in local weakening of the tensile strength [
48].
T6 heat treatment was shown to enhance strength through the equalization of hardness across the base material and the weld seam. However, the porosity remained constant due to the absence of remelting, thereby constraining the enhancement of strength.
The utilization of the filler material was observed to result in increased dispersion and a reduction in tensile strength. This may be the result of the grinding process of the weld seam after welding, before testing. It is important to note that this process has the potential to generate stress concentration by creating surface pores. Moreover, the flow within the molten pool is subject to influence by the filler material, yet the overall porosity remains largely unaltered. Consequently, it can be deduced that the porosity is increased in the area of the weld seam boundary, where the tensile strength is reduced. Therefore, it could be assumed that the pore distribution is more crucial for the tensile strength than the relative number of pores. If many pores are aligned in one plane, the structure is more weakened than if the pores are evenly distributed. In future work, a detailed, deeper analysis of the welding process will be carried out to better understand how the addition of filler material affects melt pool behavior, solidification, and the resulting pore distribution.
The plate thickness was also demonstrated to have an effect. It was demonstrated that, despite the relative pore content remaining constant, there was a significant increase in dispersion when thicker plates were employed. This phenomenon can be attributed to a number of factors, including the complexity of the degassing process and the higher heat input necessary to weld thicker plates in one pass. A larger heat input resulted in a greater melt pool volume, leading to a prolonged solidification and cooling time. This led to pore merging and, consequently, to larger pores in the middle of the weld seam, which also induced hot cracks, reducing the overall strength of the material. Conversely, a uniform pore distribution could allow for tensile strengths similar to those of lower plate thicknesses.
In consideration of the welding parameters, it was shown that a high line energy, required to weld thicker plates in one pass, led to a decrease in the tensile strength. This is attributed to the slower solidification rate and the larger weld pool, which favored pore merging. However, there was no clear correlation between the welding parameters and the tensile strength when thinner plates were joined with an overall lower line energy.
Further investigations are necessary to gain a better understanding of the welding behavior of additively manufactured components. A key aspect of this research was the hydrogen content in the weld seam, the origin of which—for example, from shielding gas, PBF powder, or ambient humidity—and its influence on pore formation and strength have not yet been sufficiently clarified. A thorough investigation into the melt pool flows and pore movements could potentially lead to a reduction in porosity, consequently enhancing tensile strength.
It is imperative to consider additional PBF process parameters, including layer height gradations, shielding gases, plate thicknesses, and orientation in the build space. The latter has been demonstrated to exert a substantial influence on thermal behavior and pore formation, as evidenced by Moeini et al. in their research on friction welding [
23]. Furthermore, the geometric configuration of the weld seam offers potential for enhancement through optimization techniques. Such techniques include, but are not limited to, chamfering, edge preparation, local thickening, and weld pool support, which have the capacity to reduce seam shrinkage and improve quality. Multipass welding could lead to the reduction in porosity; however, it necessitates precise process control and is associated with longer manufacturing times.
