Article

Interfacial Strength Testing of Laser Powder Bed Fusion Metal Samples Produced Using the Multi-Material Binning Method

by
Suyash Niraula
1,*,
Brendon S. Dodge
1,
Justin D. Gillham
2 and
Thomas A. Berfield
1,2
1
Mechanical Engineering Department, J.B. Speed School of Engineering, University of Louisville, Louisville, KY 40292, USA
2
Additive Manufacturing Institute of Science and Technology (AMIST), J.B. Speed School of Engineering, University of Louisville, Louisville, KY 40292, USA
*
Author to whom correspondence should be addressed.
J. Manuf. Mater. Process. 2025, 9(10), 327; https://doi.org/10.3390/jmmp9100327
Submission received: 22 July 2025 / Revised: 25 September 2025 / Accepted: 28 September 2025 / Published: 3 October 2025

Abstract

Creating complex structures using multiple materials in additive manufacturing comes with a unique set of challenges, particularly when it comes to how the materials transition and bond together. This research looks at a new powder binning method for combining metal powders to create multi-material components in a single build, all produced on a standard Laser Powder Bed Fusion EOS M 290 machine. The study focuses on the size and quality of the resulting multi-material interfaces and how different scan strategies used affect the interface strength. The strength of the interface between different material pairings is evaluated for combinations of 316 stainless steel bonded to Inconel 718, Inconel 718 bonded to Inconel 625, and Inconel 625 bonded to 316 stainless steel. The Ultimate Tensile Strength (UTS) and interface region lengths were calculated to be 675 MPa and 1250 µm for 316L–IN718, 1004 MPa and 2500 µm for IN718–IN625, and 687 MPa and 2000 µm for IN625–316L, respectively. The findings show that the laser powder bed fusion material binning method is comparable to traditional methods, such as welding or directed energy deposition. This suggests that the new material binning method offers clear advantages when it comes to enabling complex geometry multi-material components while maintaining the strength and durability of the bonds between different metal materials found in traditional means. Further, optimization of scan strategies in the interface zones could play a significant role in improving the overall performance of these multi-material components, which is particularly important for industries such as aerospace, automotive, and energy production.

1. Introduction

Additive manufacturing (AM) has revolutionized the fabrication of complex metal components, providing enhanced design flexibility and reduced material waste. Among various AM techniques, Laser Powder Bed Fusion (L-PBF) has emerged as a prominent method due to its ability to produce high-precision parts with intricate geometries [1]. L-PBF employs a laser to selectively melt metal powder, layer by layer, to create fully dense components with desirable mechanical properties [2,3]. Among the various advancements in this field, the development of multi-material metal additive manufacturing (MMAM) stands out for its potential to produce components with spatially varying properties, tailored to specific functional requirements [4,5]. This capability is particularly advantageous in industries such as aerospace, automotive, and biomedical engineering, where components often demand a combination of properties that cannot be achieved with a single material [6,7]. MMAM methods have recently been applied to fabricate complex structures efficiently, reducing production time and material costs [8,9].
Multi-material metal additive manufacturing facilitates the creation of functionally graded materials and components with discrete material interfaces, offering unprecedented flexibility in engineering material properties [10,11]. Techniques such as L-PBF and Directed Energy Deposition (DED) have been employed to fabricate these multi-material structures. However, the introduction of multiple materials within a single build introduces complexities, particularly at the material interfaces, where differences in thermal expansion coefficients, melting points, and other material properties can lead to defects such as interfacial cracking, residual stresses, and the formation of brittle intermetallic phases [12,13].
A variety of joining processes and material combinations have been studied and used to create a multi-material part, encompassing both metallic and non-metallic materials. Arc welding is a cost-effective, versatile, and widely accessible joining technique that has been extensively utilized in both commercial manufacturing and academic research for the joining of various dissimilar metals, such as stainless steel 304 to stainless steel 4140 [14] and aluminum alloys to stainless steel [15]. Similarly, friction stir welding has proven to be an effective method for joining dissimilar aluminum and steel alloys; however, the formation of brittle intermetallic compounds and cracking at the aluminum/steel interface significantly compromises mechanical properties and degrades overall joint performance [16,17]. Laser welding, another heat-source direct-action joining process, has been explored for joining a range of dissimilar metals, including aluminum alloy 6111 T4 to stainless steel DC04 [18] and shape memory alloys such as dissimilar NiTi wires [19,20]. Additionally, modifications of laser welding through brazing techniques, which introduce a third material to facilitate bonding, have been studied for joining aluminum alloys to stainless steel using Ni coatings [21] and AISI 316L stainless steel to Ti-6Al-4V alloy using a pure vanadium interlayer [22].
The creation of multi-material parts and their functionality is closely linked to the selection of material combinations. Multi-material samples like copper alloy CuCr1Zr and tool steel 1.2344 were investigated, produced by the L-PBF process using a graded energy input, which emphasized the current difficulty in manufacturing defect-free microstructure within the interface [23]. Researchers have extensively utilized the versatility of this L-PBF process to predict parameters through Machine Learning (ML), while also combining materials and manufacturing multi-material parts. For example, ML techniques were used to optimize the L-PBF process parameters for creating a compositionally graded 316L-Cu multi-material part [24]. Different volumetric ratios of pure Fe and Al-12Si powders were mixed to demonstrate the feasibility of using L-PBF for controlled material distribution within components [13]. The same L-PBF method has been applied to various material combinations, such as stainless steel 316L and CuSn10 [25,26], CuSn and 18Ni300 [27], Ti6Al4V and IN718 [28], Ti6Al4V and NiTi [29], and AlSi10Mg and Cr18Ni10Ti [30], to form multi-material parts, study their characterization, and analyze their mechanical properties.
There is limited literature on using L-PBF and DED processes to specifically produce Inconel and stainless steel multi-material samples. Studies on multi-material metal samples have shown that L-PBF of 316L/Inconel 718 results in varying microhardness across different sample zones and a significant presence of high-angle grain boundaries within the material [31,32]. The DED process appears to be more widely used for these materials compared to L-PBF. For example, wire-based DED was employed to develop design strategies and microstructural characterization of stainless steel 316-Inconel 718 multi-material samples [33]. Additionally, premixed powders of Inconel 718 and stainless steel 316L in ratios of 25%, 50%, and 75% were used in DED to fabricate parts and analyze their mechanical properties [34]. Another detailed study used DED to create a functionally graded component from 304L stainless steel to Inconel 625, with characterization and experimental and thermodynamic modeling [35]. A separate study reported the fabrication of a graded Inconel-stainless steel multi-material structure using Liquid Dispersed Metal Powder Bed Fusion (LDM-PBF), showing alloy variations between and within layers [36]. Other techniques, like the PDS method (also known as 3D printing, debinding, and sintering), were also explored to create IN718–AISI 316L bimetallic parts [37].
Multi-material parts combining stainless steel 316L, Inconel 718 (IN718), and Inconel 625 (IN625) offer significant advantages in applications requiring a balance of mechanical strength, high-temperature resistance, and corrosion protection. For example, pairing 316L with IN718 is ideal in aerospace and chemical processing, where corrosion-resistant 316L can serve as a structural base and IN718 can handle localized high-stress or high-heat areas [37,38,39]. Another example is the pairing of SS316L and IN718 in aero-engines and gas turbines, such as the GT10B compressor rotor, where IN718 provides the strength needed at elevated temperatures while SS316L offers dependable structural support under less severe conditions [40]. Advances in additive manufacturing have further expanded this combination, with techniques like electron-beam and powder-bed fusion enabling the production of hybrid aerospace and energy components that seamlessly integrate the unique strengths of each alloy [41]. IN718–IN625 combinations are well-suited for gas turbines, petrochemical systems, and nuclear reactors, where IN718 provides load-bearing capability and creep resistance and IN625 offers superior corrosion and oxidation resistance at elevated temperatures, often serving as a transitional alloy to secure reliable joints in demanding power and oil–gas shafts [40,42,43,44]. IN625–316L pairings are commonly used in marine, oil and gas, and desalination or heat exchanger applications, where IN625 forms a corrosion-resistant barrier to acids and chlorides while 316L provides strength, reducing material costs [45,46,47,48]. By strategically combining these materials within a single component, performance can be optimized while minimizing weight and expense. The result is a cost-effective, high-performance, corrosion-resistant component tailored for demanding environments [49,50,51]. Industries such as aerospace, energy, marine, and chemical processing benefit greatly from these multi-material solutions, as they provide an effective balance of durability and economic feasibility.
Various studies have investigated mechanical performance, particularly ultimate tensile strength, yield strength, and elongation of dissimilar material joints between stainless steels and nickel-based superalloys using conventional welding techniques and advanced processes such as laser wire direct energy deposition. Dissimilar friction welds of AISI 316L with IN 718 in solution-treated and solution-treated aged conditions demonstrated yield strengths of 634.9 MPa and 602.3 MPa, UTS of 728.7 MPa and 697.2 MPa, and elongations of 14.1% and 17.0%, respectively, while post-weld heat-treated samples exhibited higher strength with a yield strength of 730.2 MPa, UTS of 828.5 MPa, and elongation of 9.1%, attributed to the formation of strengthening precipitates [52]. Under optimized blending conditions, the 75% SS316L–25% IN718 composition showed a UTS of 274.15 MPa and elongation of 4.92%, the 50% SS316L–50% IN718 blend presented a UTS of 464.15 MPa and elongation of 13.53%, and the 25% SS316L–75% IN718 blend recorded the highest UTS of 499.37 MPa with 10.34% elongation [34]. In laser-welded dissimilar joints of PBF-LB/IN718 to AISI 316L, as-built samples exhibited slightly higher tensile strength than heat-treated ones, with yield strengths ranging from 353 to 359 MPa (as-built) and 352 to 356 MPa (heat-treated), and UTS from 655 to 659 MPa compared to 639 to 654 MPa for heat-treated samples [53]. Studies on dissimilar metal joining of Inconel 625 and AISI 316L using Tungsten Arc Welding, TIG 316L, and twisted fillers under continuous current showed yield strengths of 442 MPa, 389 MPa, and 437 MPa and UTS of 674 MPa, 529 MPa, and 567 MPa, respectively; under pulse current, yield strengths were 401 MPa, 446 MPa, and 451 MPa with UTS of 532 MPa, 661 MPa, and 687 MPa [54]. Laser wire direct energy deposition of bimetallic SS316L and IN625 alloys yielded an average yield strength of 302.33 MPa, UTS of 550.2 MPa, and elongation of 41.6% [55].
Literatures have introduced and increasingly used a rescanning strategy in L-PBF, where each layer or selected layers are remelted to improve part quality [56,57,58]. It has been hypothesized that a secondary shallow melt pool on top of the initial (main) melt pool may affect grain formation [59]. The changes in microstructure, such as refined grain size and porosity, might be subtle, but the most critical impact of this is observed on the mechanical behavior of the final part, particularly in addressing anisotropy [57,60,61]. L-PBF components often suffer from direction-dependent properties due to the layer-wise thermal gradients and solidification patterns [56,62]. Rescanning helps to partially homogenize these thermal effects by introducing a second thermal cycle, which can redistribute residual stresses and promote more uniform microstructural evolution across different orientations [58,61]. This, in turn, contributes to reducing the gap between the build direction and transverse mechanical performance, especially in terms of hardness and tensile strength [60,62]. Additionally, rescanning is used to optimize and compensate for the effects that post-heat treatment typically achieves [61,63]. Rescanning during the build can reduce or eliminate the need for additional post-processing steps, particularly those aimed at improving properties [56,57,58,59,60,61,62,63,64,65]. Ultimately, rescanning is typically applied, resulting in layer-wise variation in microstructure and anisotropic mechanical properties.
The integrity of interfaces is critical, as they often dictate the overall mechanical performance of the component. Consequently, interfacial strength testing has become a focal point in assessing the quality and reliability of multi-material AM parts. Thus, in this research paper, 316L, IN718, and IN625 multi-material samples were chosen and prepared by using the laser powder bed fusion process. Then, various experimental techniques were employed on printed samples to evaluate interfacial properties, including mechanical testing methods such as tensile tests, micro-hardness measurements, and advanced characterization techniques like scanning electron microscopy (SEM) and Energy Dispersive X-Ray Spectroscopy (EDX). These methods provided insights into the microstructural features at the interfaces, the strength of these composite materials, and the presence of defects, which influenced the overall mechanical behavior and performance of the printed part. Finally, results from tensile testing, data from micro-hardness, and observations from SEM and EDX were discussed and documented in detail in the sections below.

2. Materials and Methods

2.1. Sample Manufacturing and Preparation

In this study, commercially available stainless steel 316L, IN718, and IN625 metal powders were used. Low-carbon, non-magnetic, austenitic stainless steel 316L powders were from Carpenter Additive LPW Technology AM Metal Powder Manufacturing (Philadelphia, PA, USA) produced by the nitrogen gas atomization process with a maximum of 1 wt% above 53 µm2 and a maximum of 10 vol% below 15 µm3 [66]. Nickel-chromium alloy IN718 powders used were from Linde AMT: Praxair Surface Technologies (Danbury, CT, USA) and produced by vacuum induction melt argon gas atomization technology with a particle size distribution between 16 µm and 44 µm [67]. Nickel alloy IN625 powders were from EOS GmbH (Krailling, Germany), produced by gas (nitrogen/argon) atomization with a particle size distribution of 15–65 µm [68]. The compositions of the powders are shown in Table 1. Hall Flow tests using ASTM B213-20 [69] Method 1 yielded FRH values of 16, 16, and 17 for 316L, IN718, and IN625, respectively.
Multi-material tensile bars were manufactured using EOS M 290 Laser Powder Bed Fusion machine (EOS GmbH, Munich, Germany) in a nitrogen atmosphere on a steel build plate pre-heated to 80 °C. The layer thickness throughout the build was 40 µm and the hatch overlap between every scan was kept constant at the default EOS M 290 parameter setting. For micro-hardness testing and microstructure characteristics, rectangular samples of 8 mm × 15 mm and a height of 4 mm were built.
The L-PBF process parameters used for both SS and IN powders were the default settings provided by EOS for the M 290 machine (EOS GmbH, Munich, Germany), and both materials shared the same deposition parameters. The following process parameters were used:
Volumetric Energy Density (VED) is the total amount of energy input per unit volume of the powder in the build layer in the material bed, calculated as
V E D = P ν   .   t   .   h   J mm 3
where P is the laser power (W), ν is the scan speed (mm/s), t is the layer height (mm), and h is the hatch spacing (mm).
Referencing Equation (1) and the dataset from Table 2, the VED of the scan strategies was calculated to be
Table 3 presents the volumetric energy density for the two sets of deposition parameters listed in Table 2.

2.2. Sample Layout

Two types of specimens, tensile bars of 60 mm length based on ASTM D1708 [70] geometry and rectangular blocks, were made in a single build using the EOS M 290 laser powder bed fusion machine, as shown in Figure 1. Samples were labeled from A to L, each with three variations: for example, A1, A2, and A3. In this naming convention, the suffix ‘L’ (e.g., A1L) denotes the section of the sample made from the left-side material (e.g., 316L stainless steel in A1L), while the suffix ‘R’ (e.g., A1R) denotes the sample made from the right-side material (e.g., IN718 in A1R). All samples with the number 1 (i.e., A1, B1, etc.) were produced using Scan Strategy 1; samples with the number 2 (i.e., A2, B2, etc.) used Scan Strategy 2, and those with the number 3 (i.e., A3, B3, etc.) followed Scan Strategy 3. Thus, for each scan strategy condition, 3 multi-material samples were fabricated and tested.
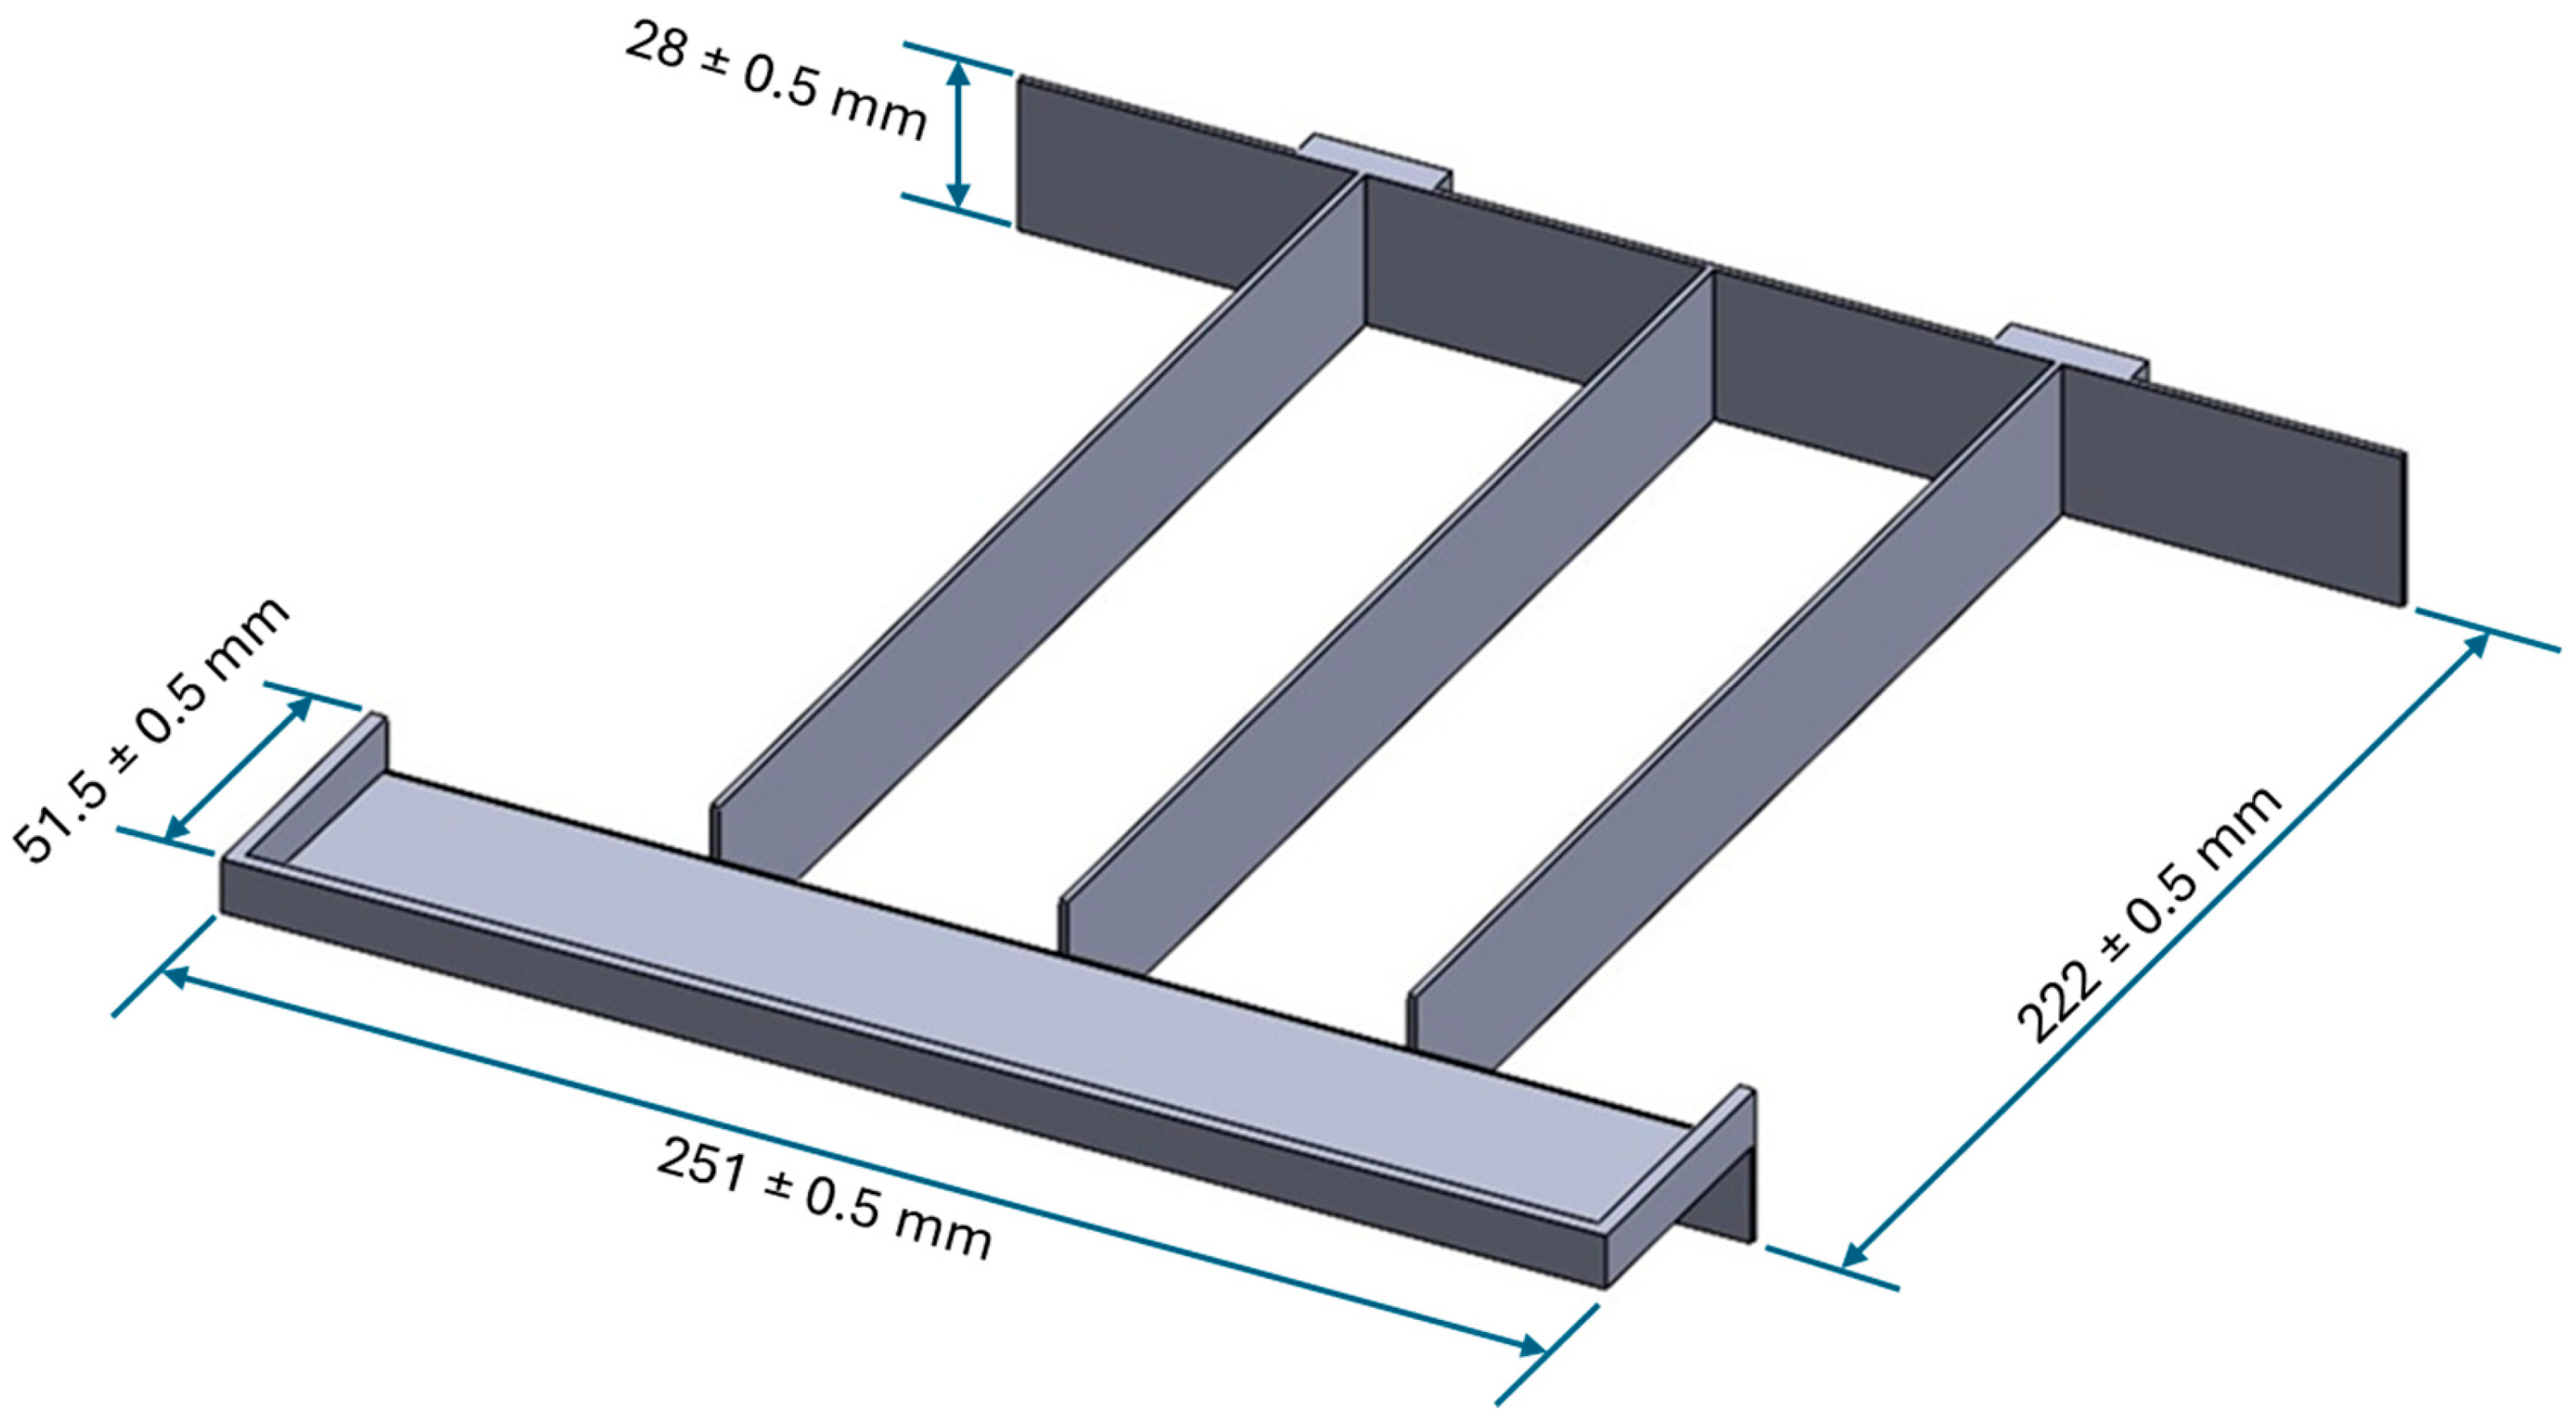
The powder feedstock was divided into four sections, as shown in Figure 2, by a custom bin, which layered powders of four different materials in a rectangular track across the feedstock. The bin is 251 ± 0.5 mm by 250 ± 0.5 mm with a height of 28 ± 0.5 mm. Supporting the information in Figure 2 by referring back to Figure 1, the leftmost and rightmost sections, marked in light red, contained 316L powder, while the light green section was filled with IN718 powder, and the light blue section contained IN625 powder.
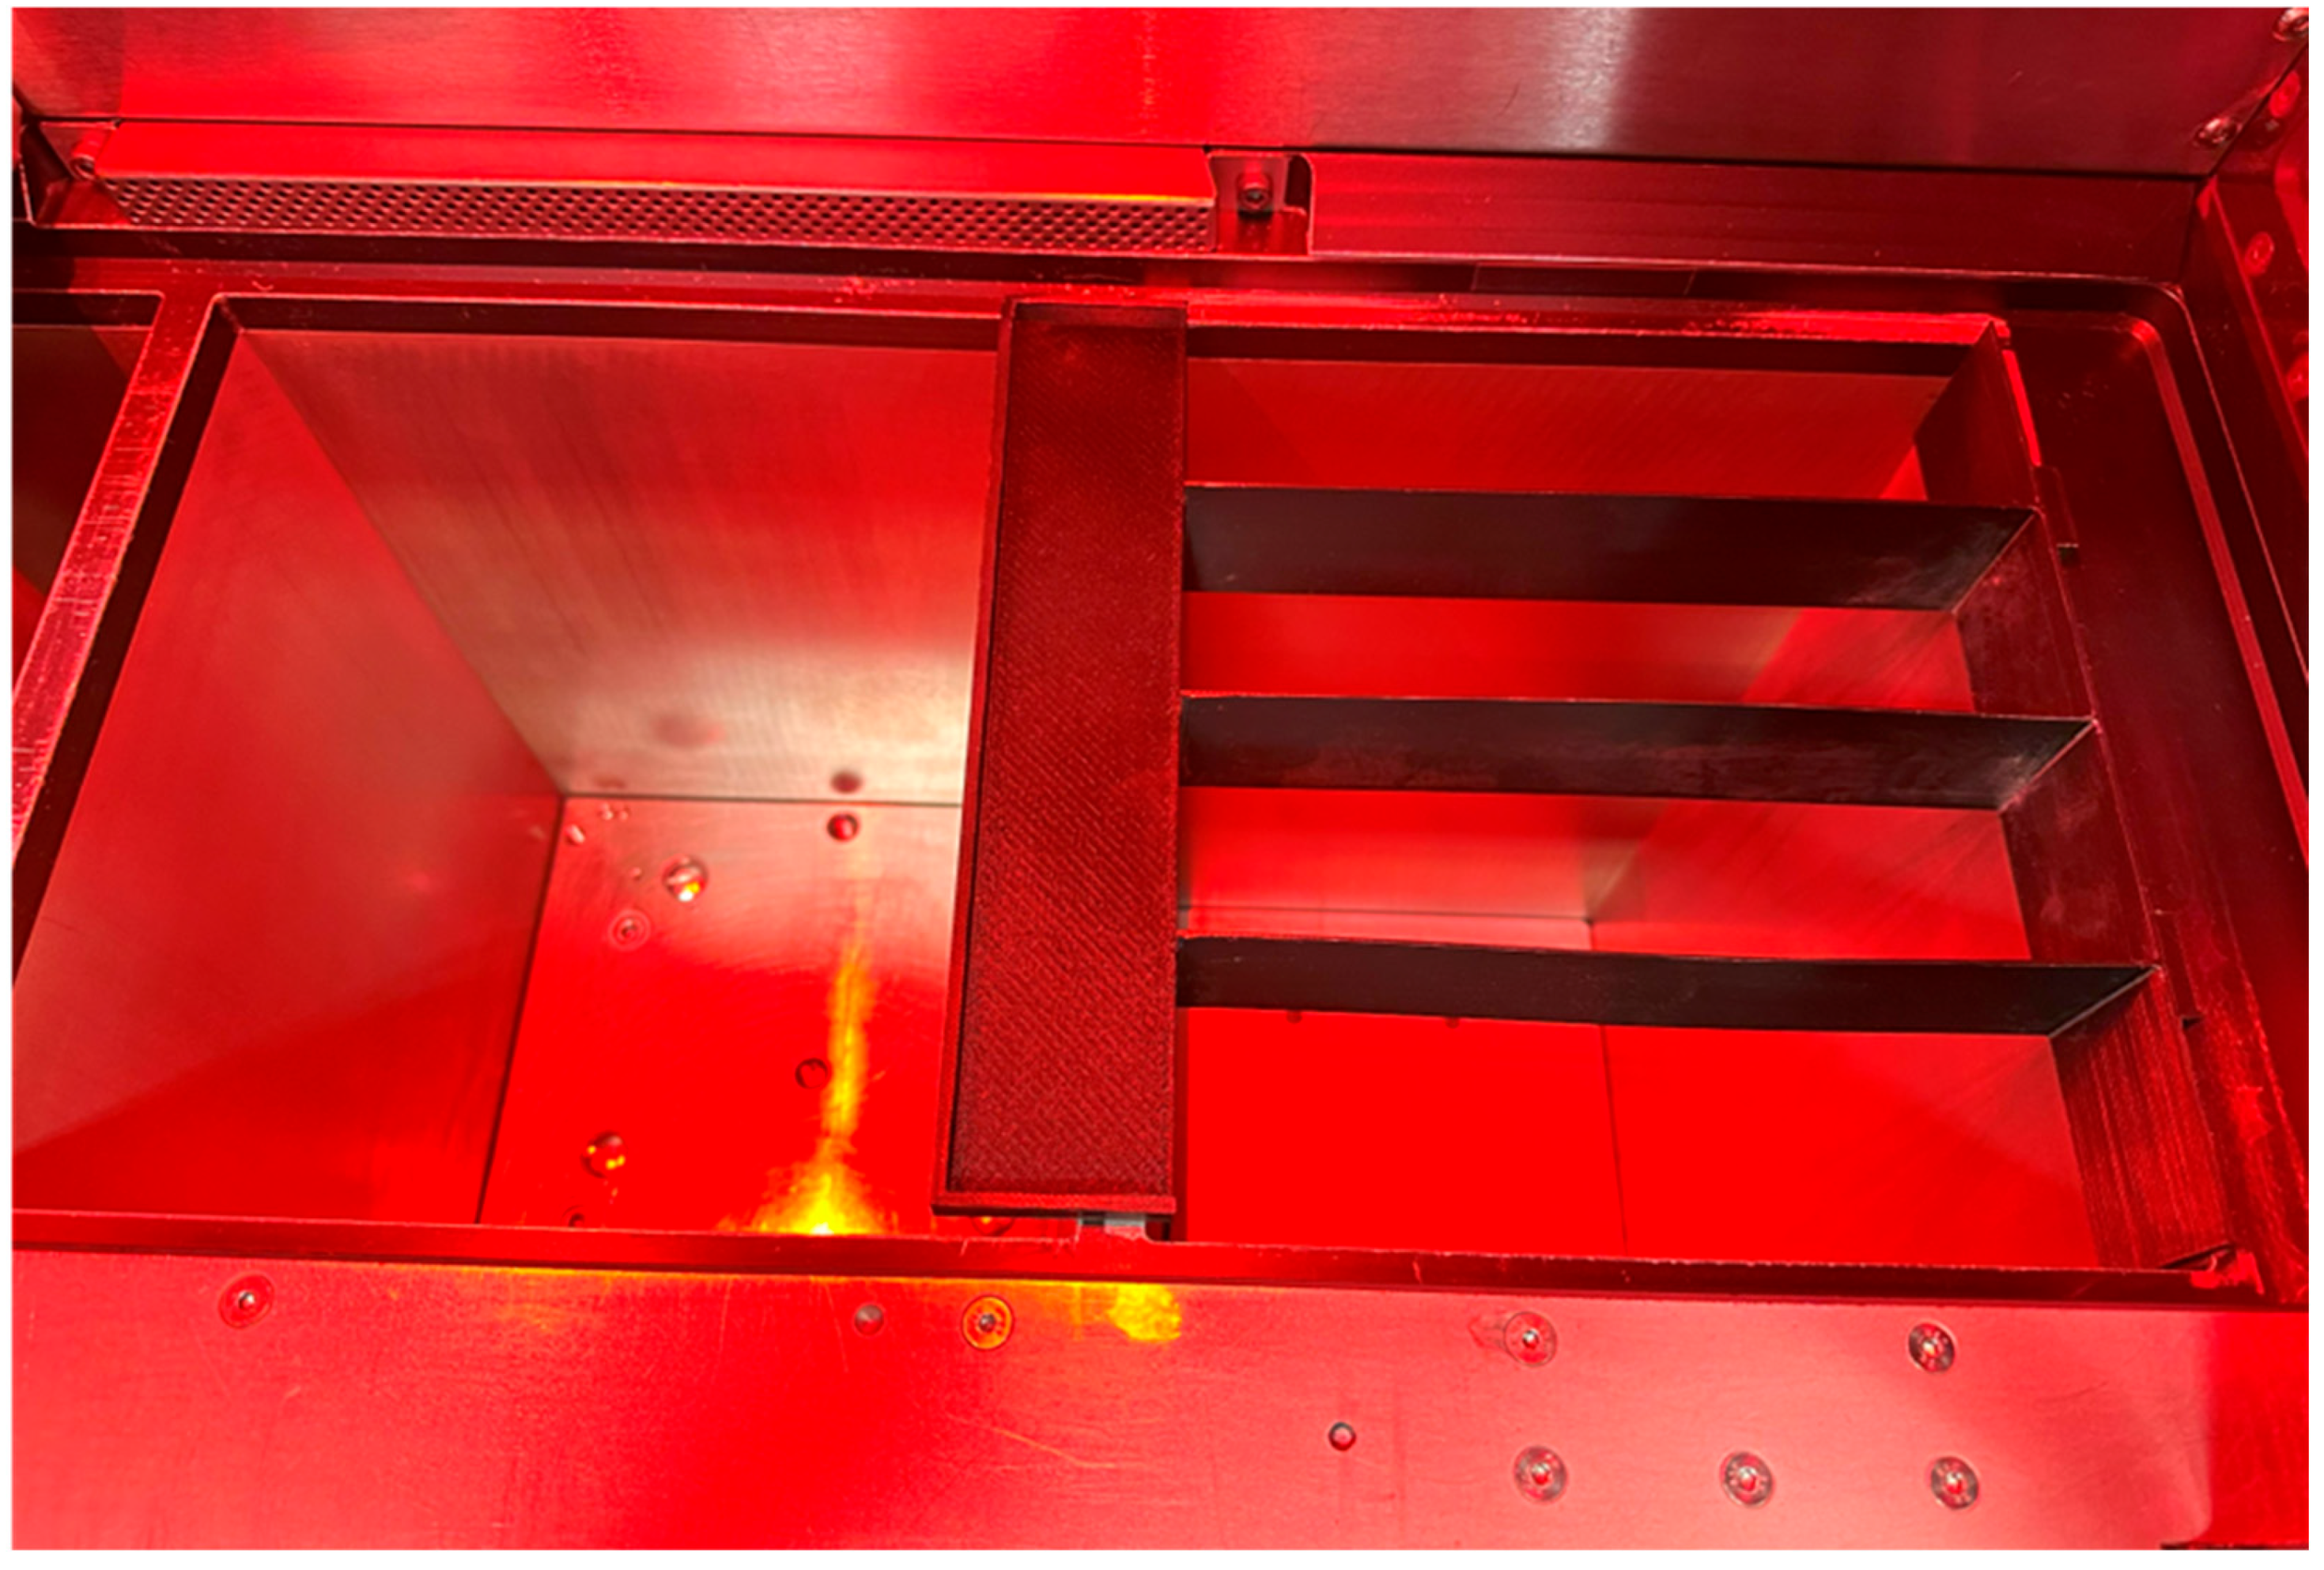
Figure 3 shows a real-time build setup, where a black polymer bin is positioned on top of the powder feedstock chamber located on the right side. The chamber to the left of the bin corresponds to the build plate section, with the build plate shown in its lowered position in the image. The photograph was taken after the bin had been placed on the powder feedstock chamber but before loading powder onto the individual tracks within the bin. Once the tracks were filled with powder, the bin was carefully removed to avoid disturbing the powder interface. The remaining steps followed the standard L-PBF procedure for fabricating the samples.
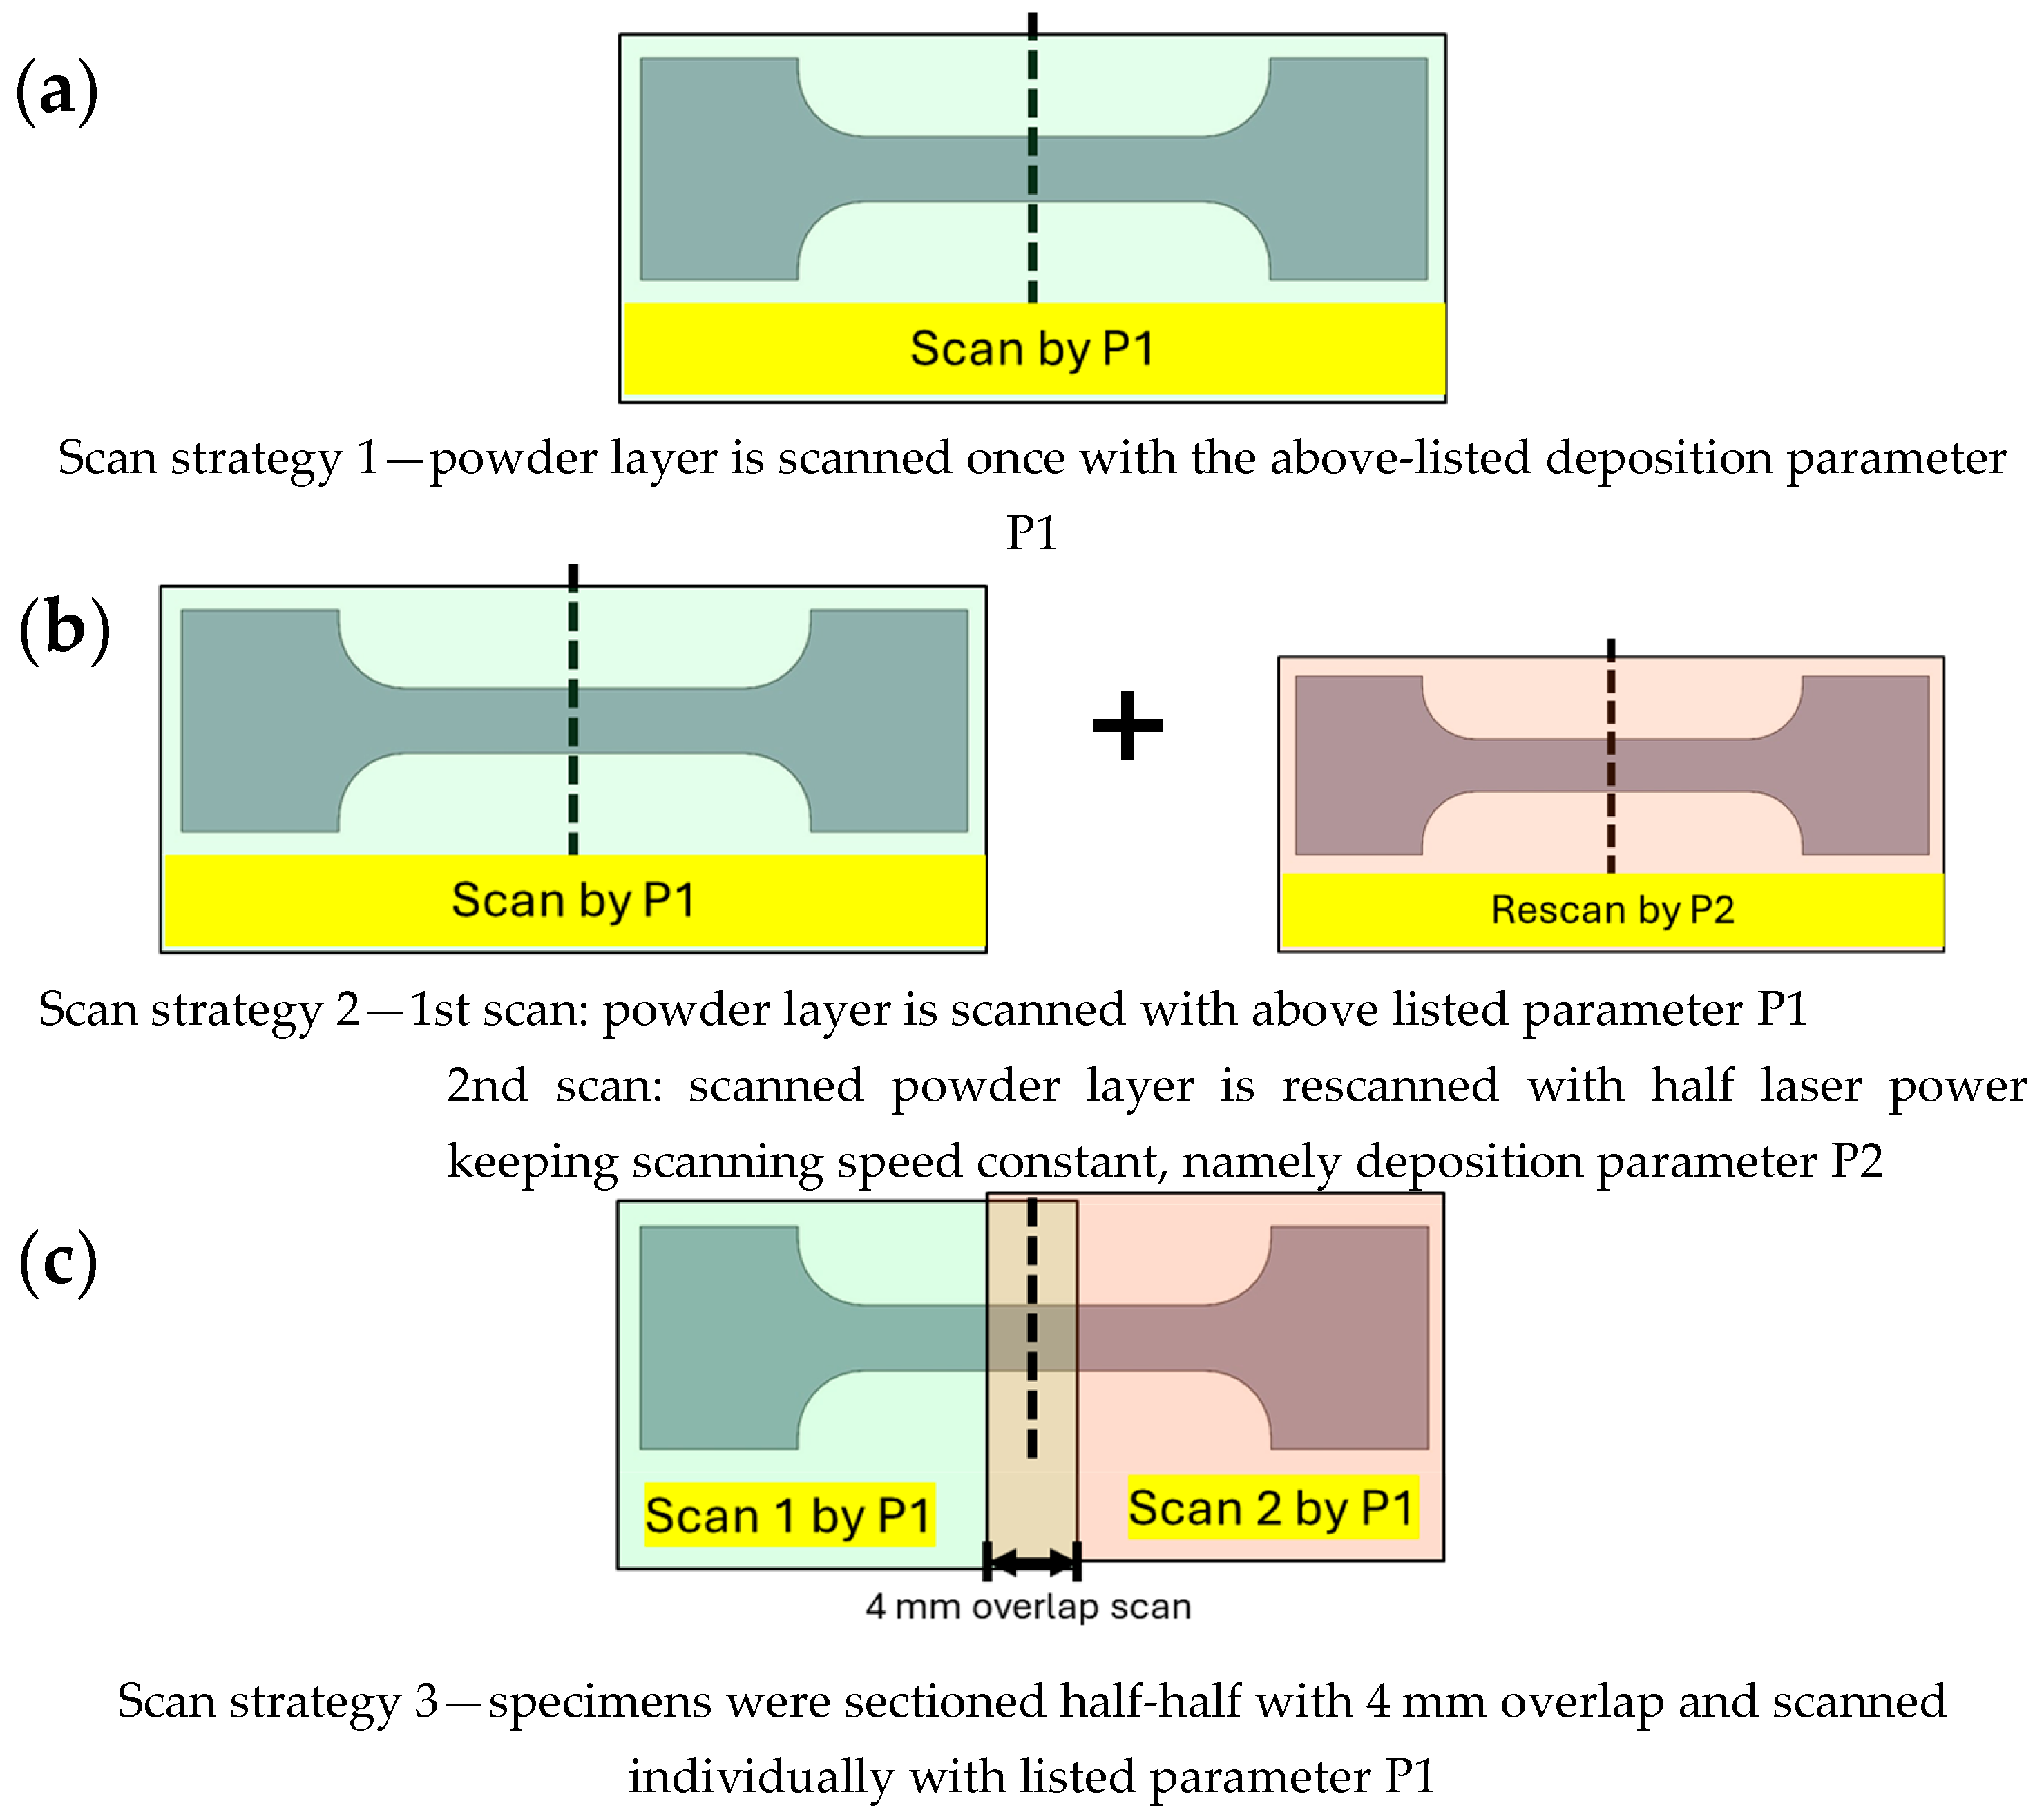
Three different scanning strategies were used to print the samples: one set of samples was scanned entirely by the parameter P1, labelled as 100% energy density scan. Within the same build, a second set of samples was solidified using the P1 parameter, followed by a rescan at half that laser power (i.e., P2), labelled as a 150% energy density scan. The third set of tensile samples were sectioned into two halves across the build plate, with a 4 mm overlap at the interface on each material section. Each half was then scanned using the previously mentioned parameter, P1. This resulted in the overlapped interface section receiving a double scan, labelled as a 200% energy density scan, as shown in Figure 4.
Table 4 presents the corresponding volumetric energy densities for each scan strategy used in the experiment, as illustrated in Figure 4.

2.3. Post-Processing

The build plate was placed in a FANUC wire electrical discharge machine, and the printed multi-material samples were cut from the support structure for removal. No additional heat treatment was applied to these samples, as the powders used in 316L for this experiment cannot be further strengthened through post-processing heat treatment [66]. Also, the primary focus of this project was to characterize and evaluate the properties of ‘as-is’ built samples, without any modifications or thermal treatments, to allow for analysis of the inherent properties as they were directly produced using the various scan approaches.
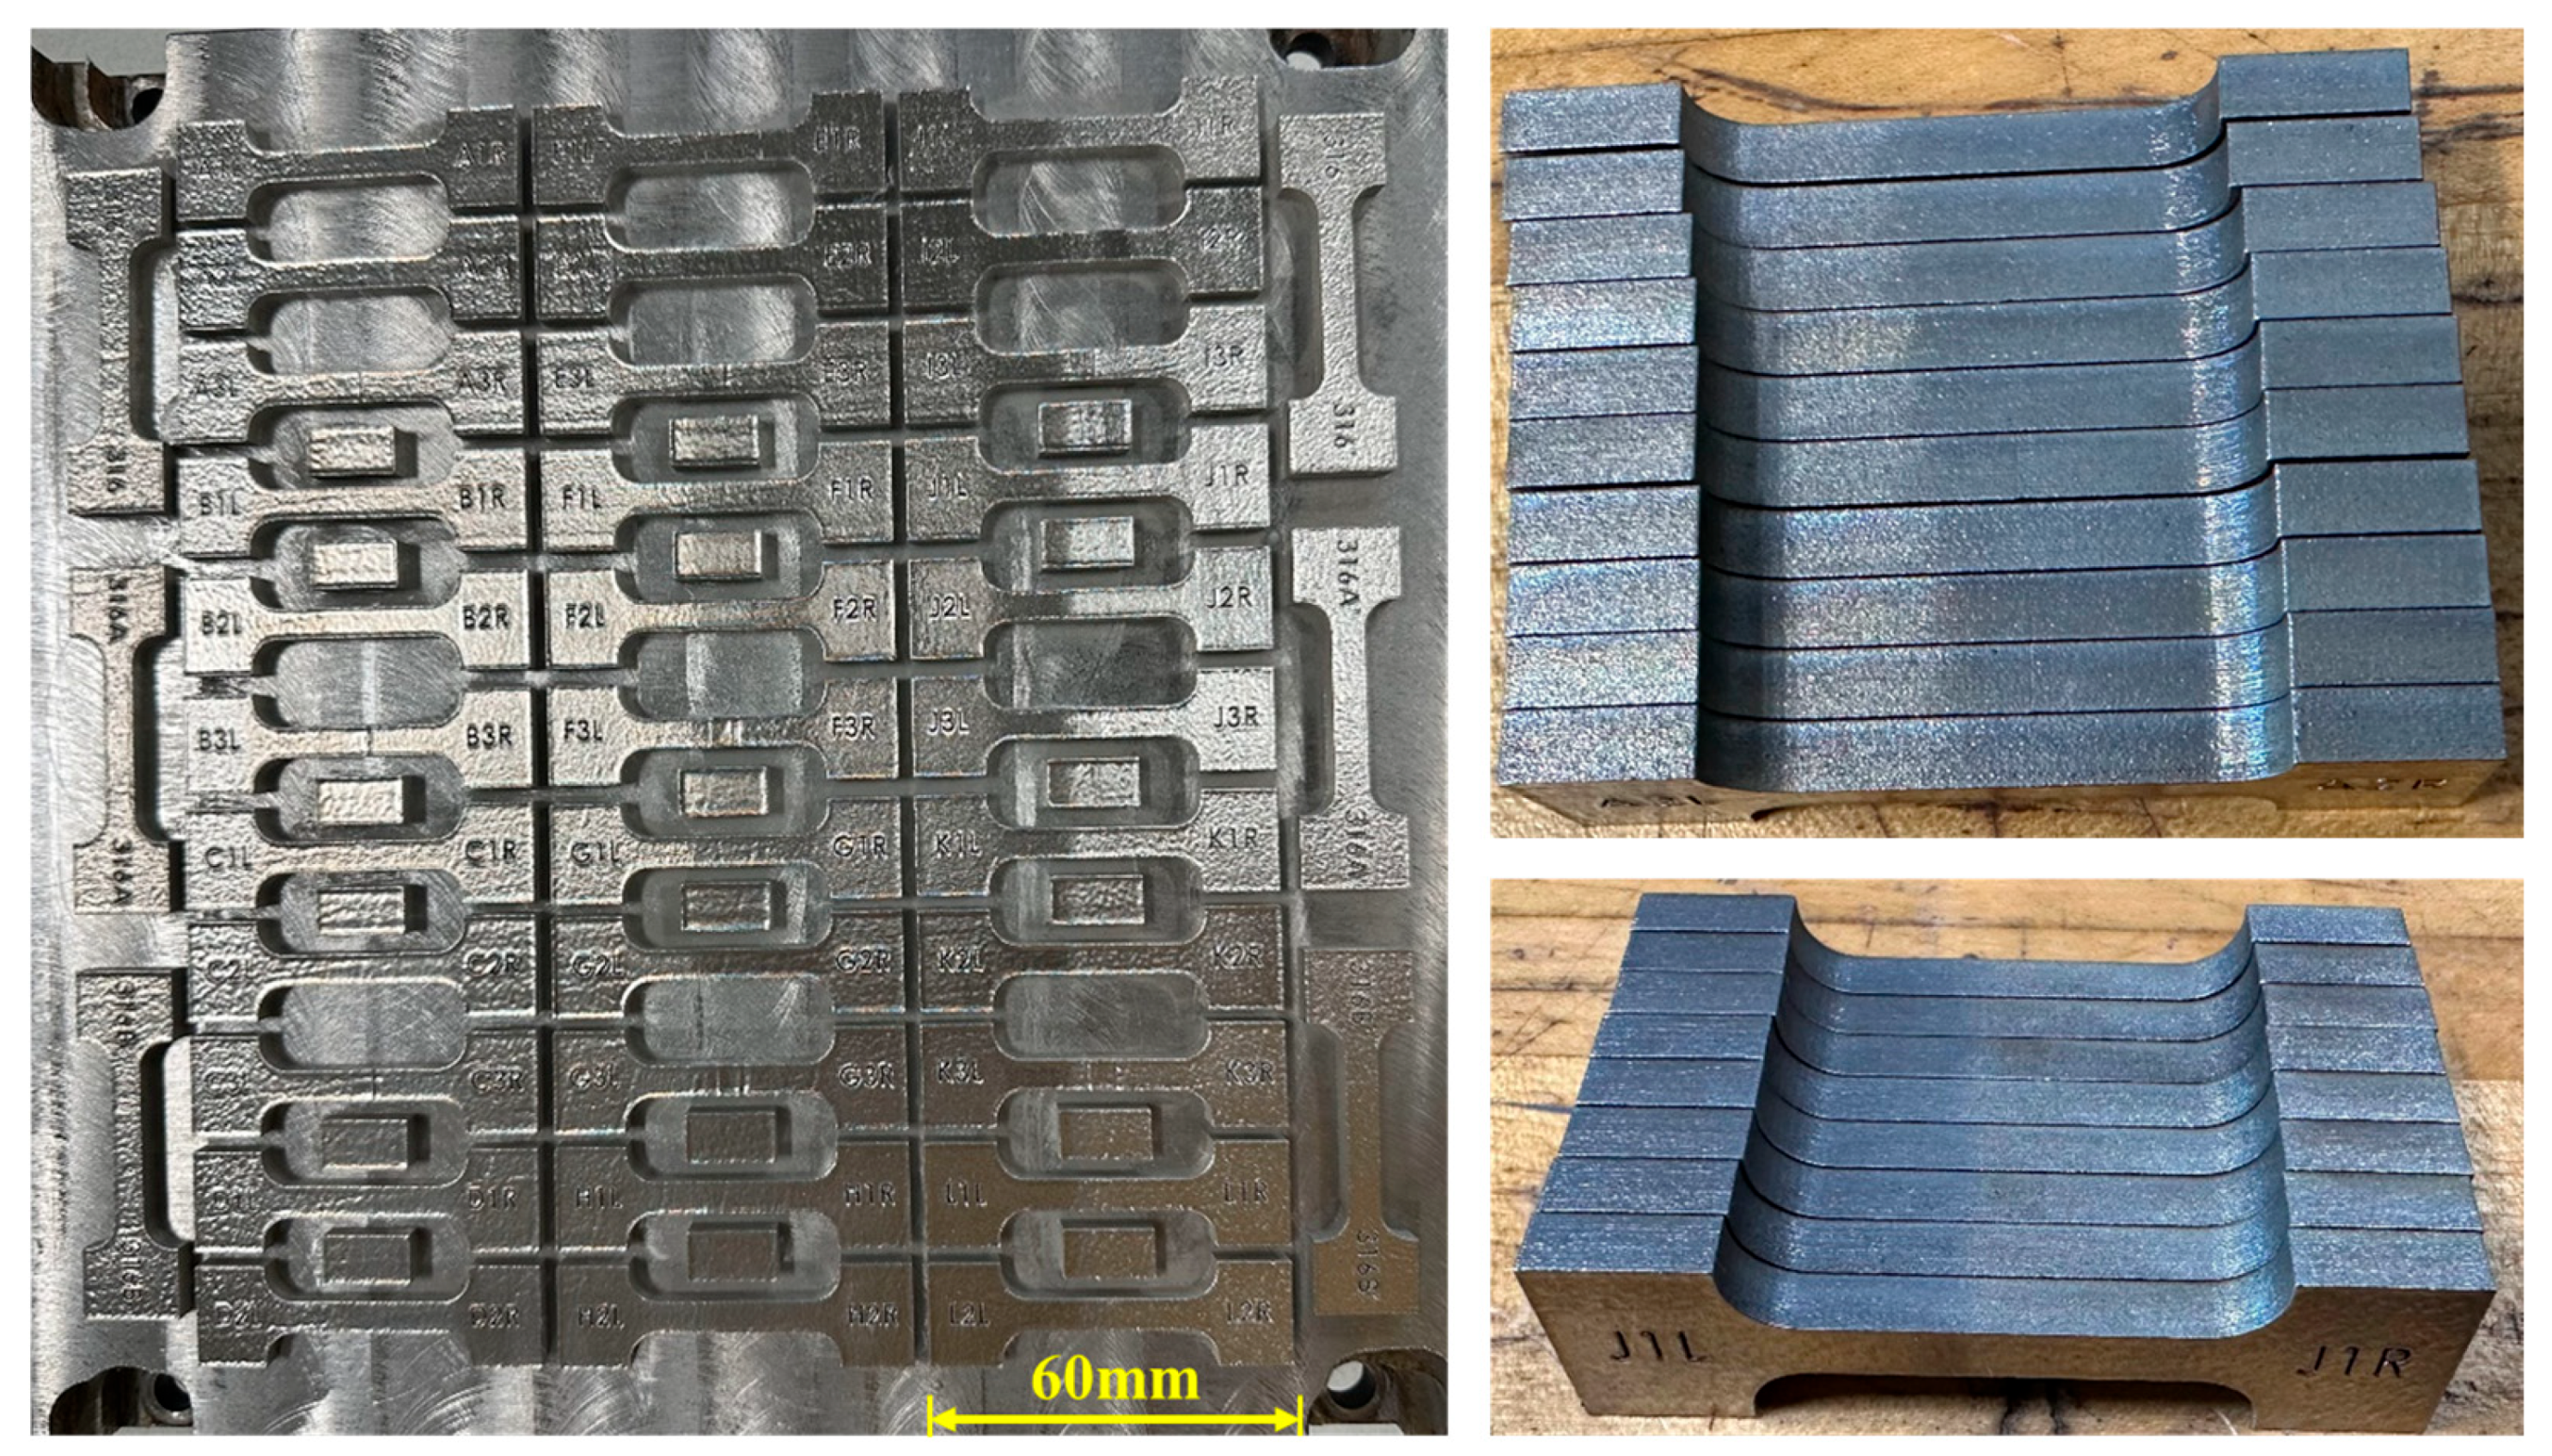
Figure 5 on the left shows the multi-material samples immediately after printing on the build plate. The two images on the right display the tensile specimens after being wire electrical discharge machined (wire EDM machine, FANUC America, MI, USA) from the build plate. These specimens show the transition between two materials, with a distinct visual indication of the interface zone where these materials meet. It also provides a clear representation of how the materials are layered and joined together, allowing for easy identification of the boundaries between them, which is important for understanding the material behavior and the integrity of the interface.

2.4. Mechanical Testing and Microstructure Characterization

After removing the sample from the build plate, various testing and characterization studies were conducted to determine the properties of the multi-material parts. Tensile tests were performed on an MTS 810 Material Test System machine (MTS Systems Corporation, Eden Prairie, MN, USA). The Digital Image Correlation (DIC) technique was used to measure full-field displacement and strain on the surface of the materials during deformation. A series of high-resolution images were captured throughout the loading process, before and after deformation, and DIC software (VIC-3D Version 6.12) was used to compare images to calculate displacement maps and strain fields across the gauge length of the sample.
The rectangular samples were embedded in an epoxy setup and prepared using standard metallographic techniques. These prepared samples were then used for micro-hardness testing on the Shimadzu HMV-G Micro Vickers Hardness Tester (Shimadzu Corporation, Kyoto, Japan) using a Vickers indenter with a force of 1.961 N and a hold time of 10 s. A minimum of two parallel, equally spaced 50 indents were made in a straight line within the rectangular sample length to measure the hardness across the sample and to assess the interface zone where the two constituent metal powders mixed.
Following the micro-hardness test, the indented samples were subjected to etching to reveal their microstructure. Two primary etchants were used in the process: Adler’s reagent (Pace Technologies, Inc., Tucson, AZ, USA) was used for etching samples that included stainless steel alloys (316L–IN718 and IN625–316L), while the IN/Super Alloy reagent (Pace Technologies, Inc., Tucson, AZ, USA) was applied specifically to etch the IN718–IN625 samples. Further surface morphology, microstructure analysis, and interface characteristics of these multi-material samples were observed using a Keyence VHX visible-light microscope (Keyence Corporation, Osaka, Japan) and a Apreo Scanning Electron Microscope (SEM) (Thermo Fisher Scientific Inc., Waltham, MA, USA) with Bruker Energy Dispersive X-Ray Spectroscopy (EDX) (Bruker Corporation, Billerica, MA, USA).

3. Results and Discussion

3.1. Mechanical Properties

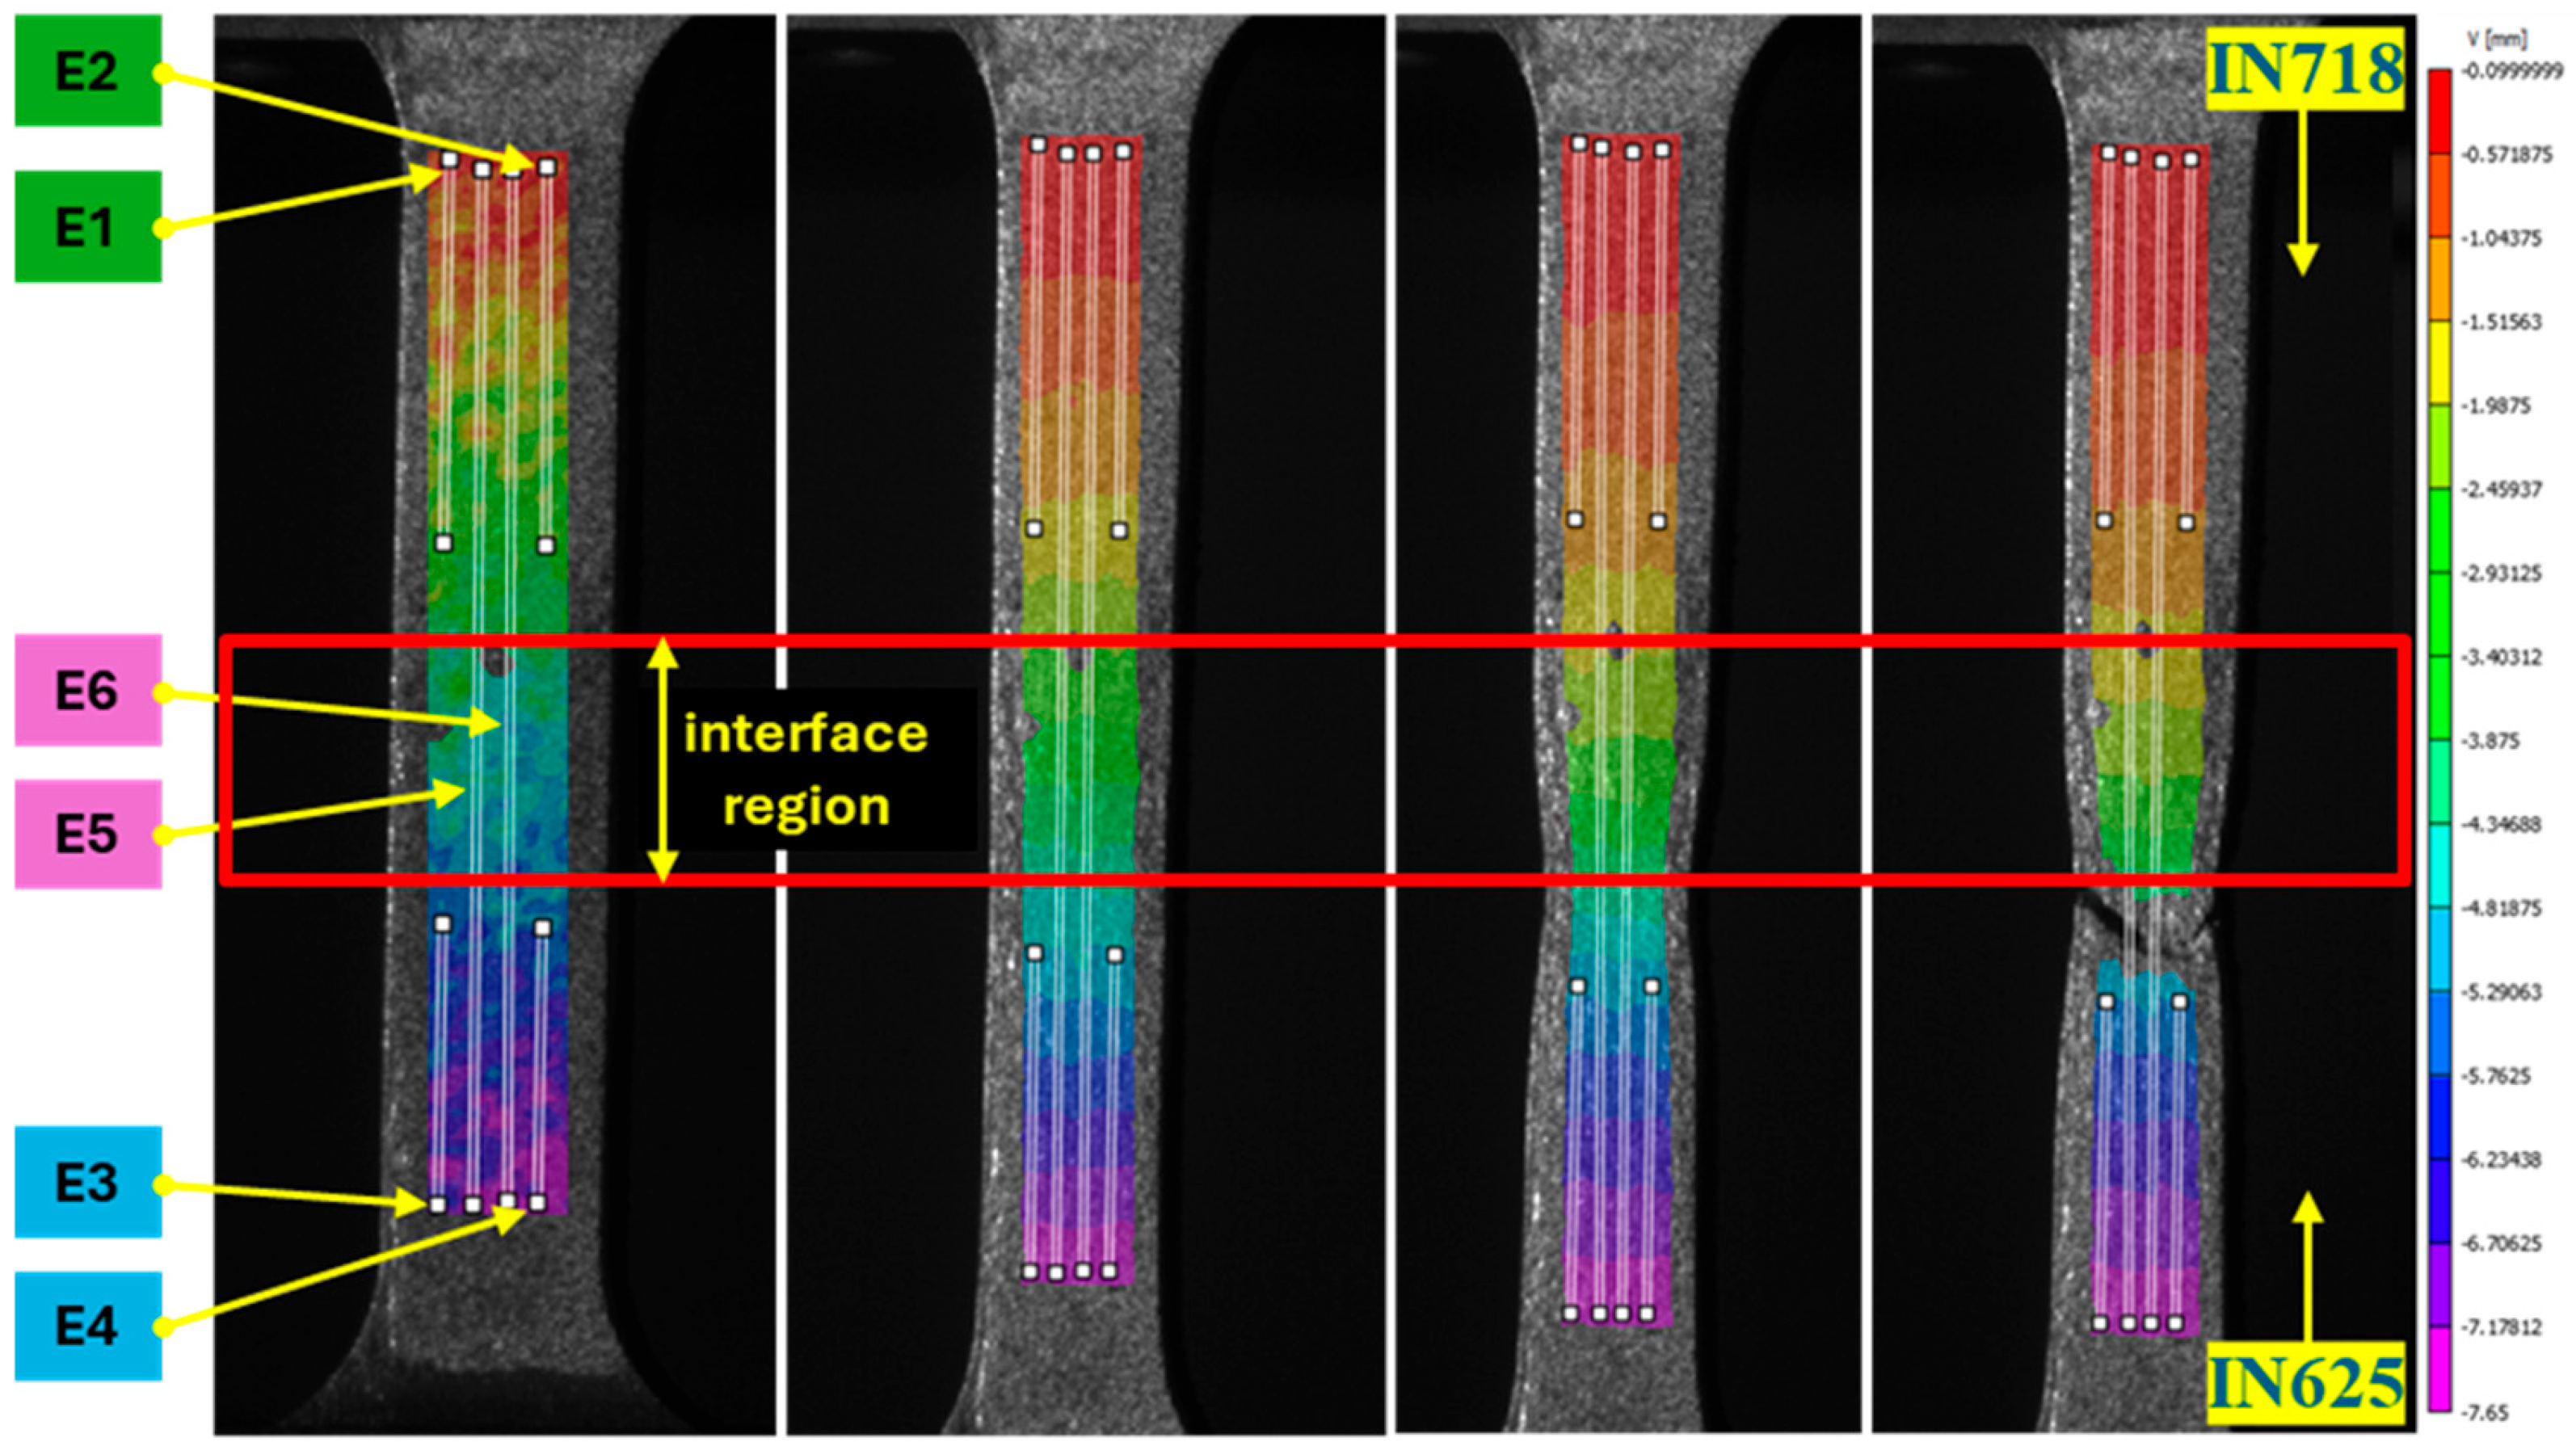
In the post-processing of the Digital Image Correlation (DIC) test data, extensometers were used to measure strain at different locations on the sample. Two parallel extensometers were placed vertically on each side of the material, as shown in Figure 6, and two more were positioned across the sample, spanning the transition region between the two materials. The average strain values from each pair of extensometers (e.g., E1 and E2 for IN718, E3 and E4 for IN625, and E5 and E6 for the full gauge section in Figure 6) were used to calculate and analyze the data, generating plots of the stress-strain behavior of the multi-material stainless steel and Inconel samples. Three samples were tested for each material combination and scan strategy. The average Ultimate Tensile Strength (UTS) values for each material combination printed using Scan Strategy 1 are shown in the figures below.
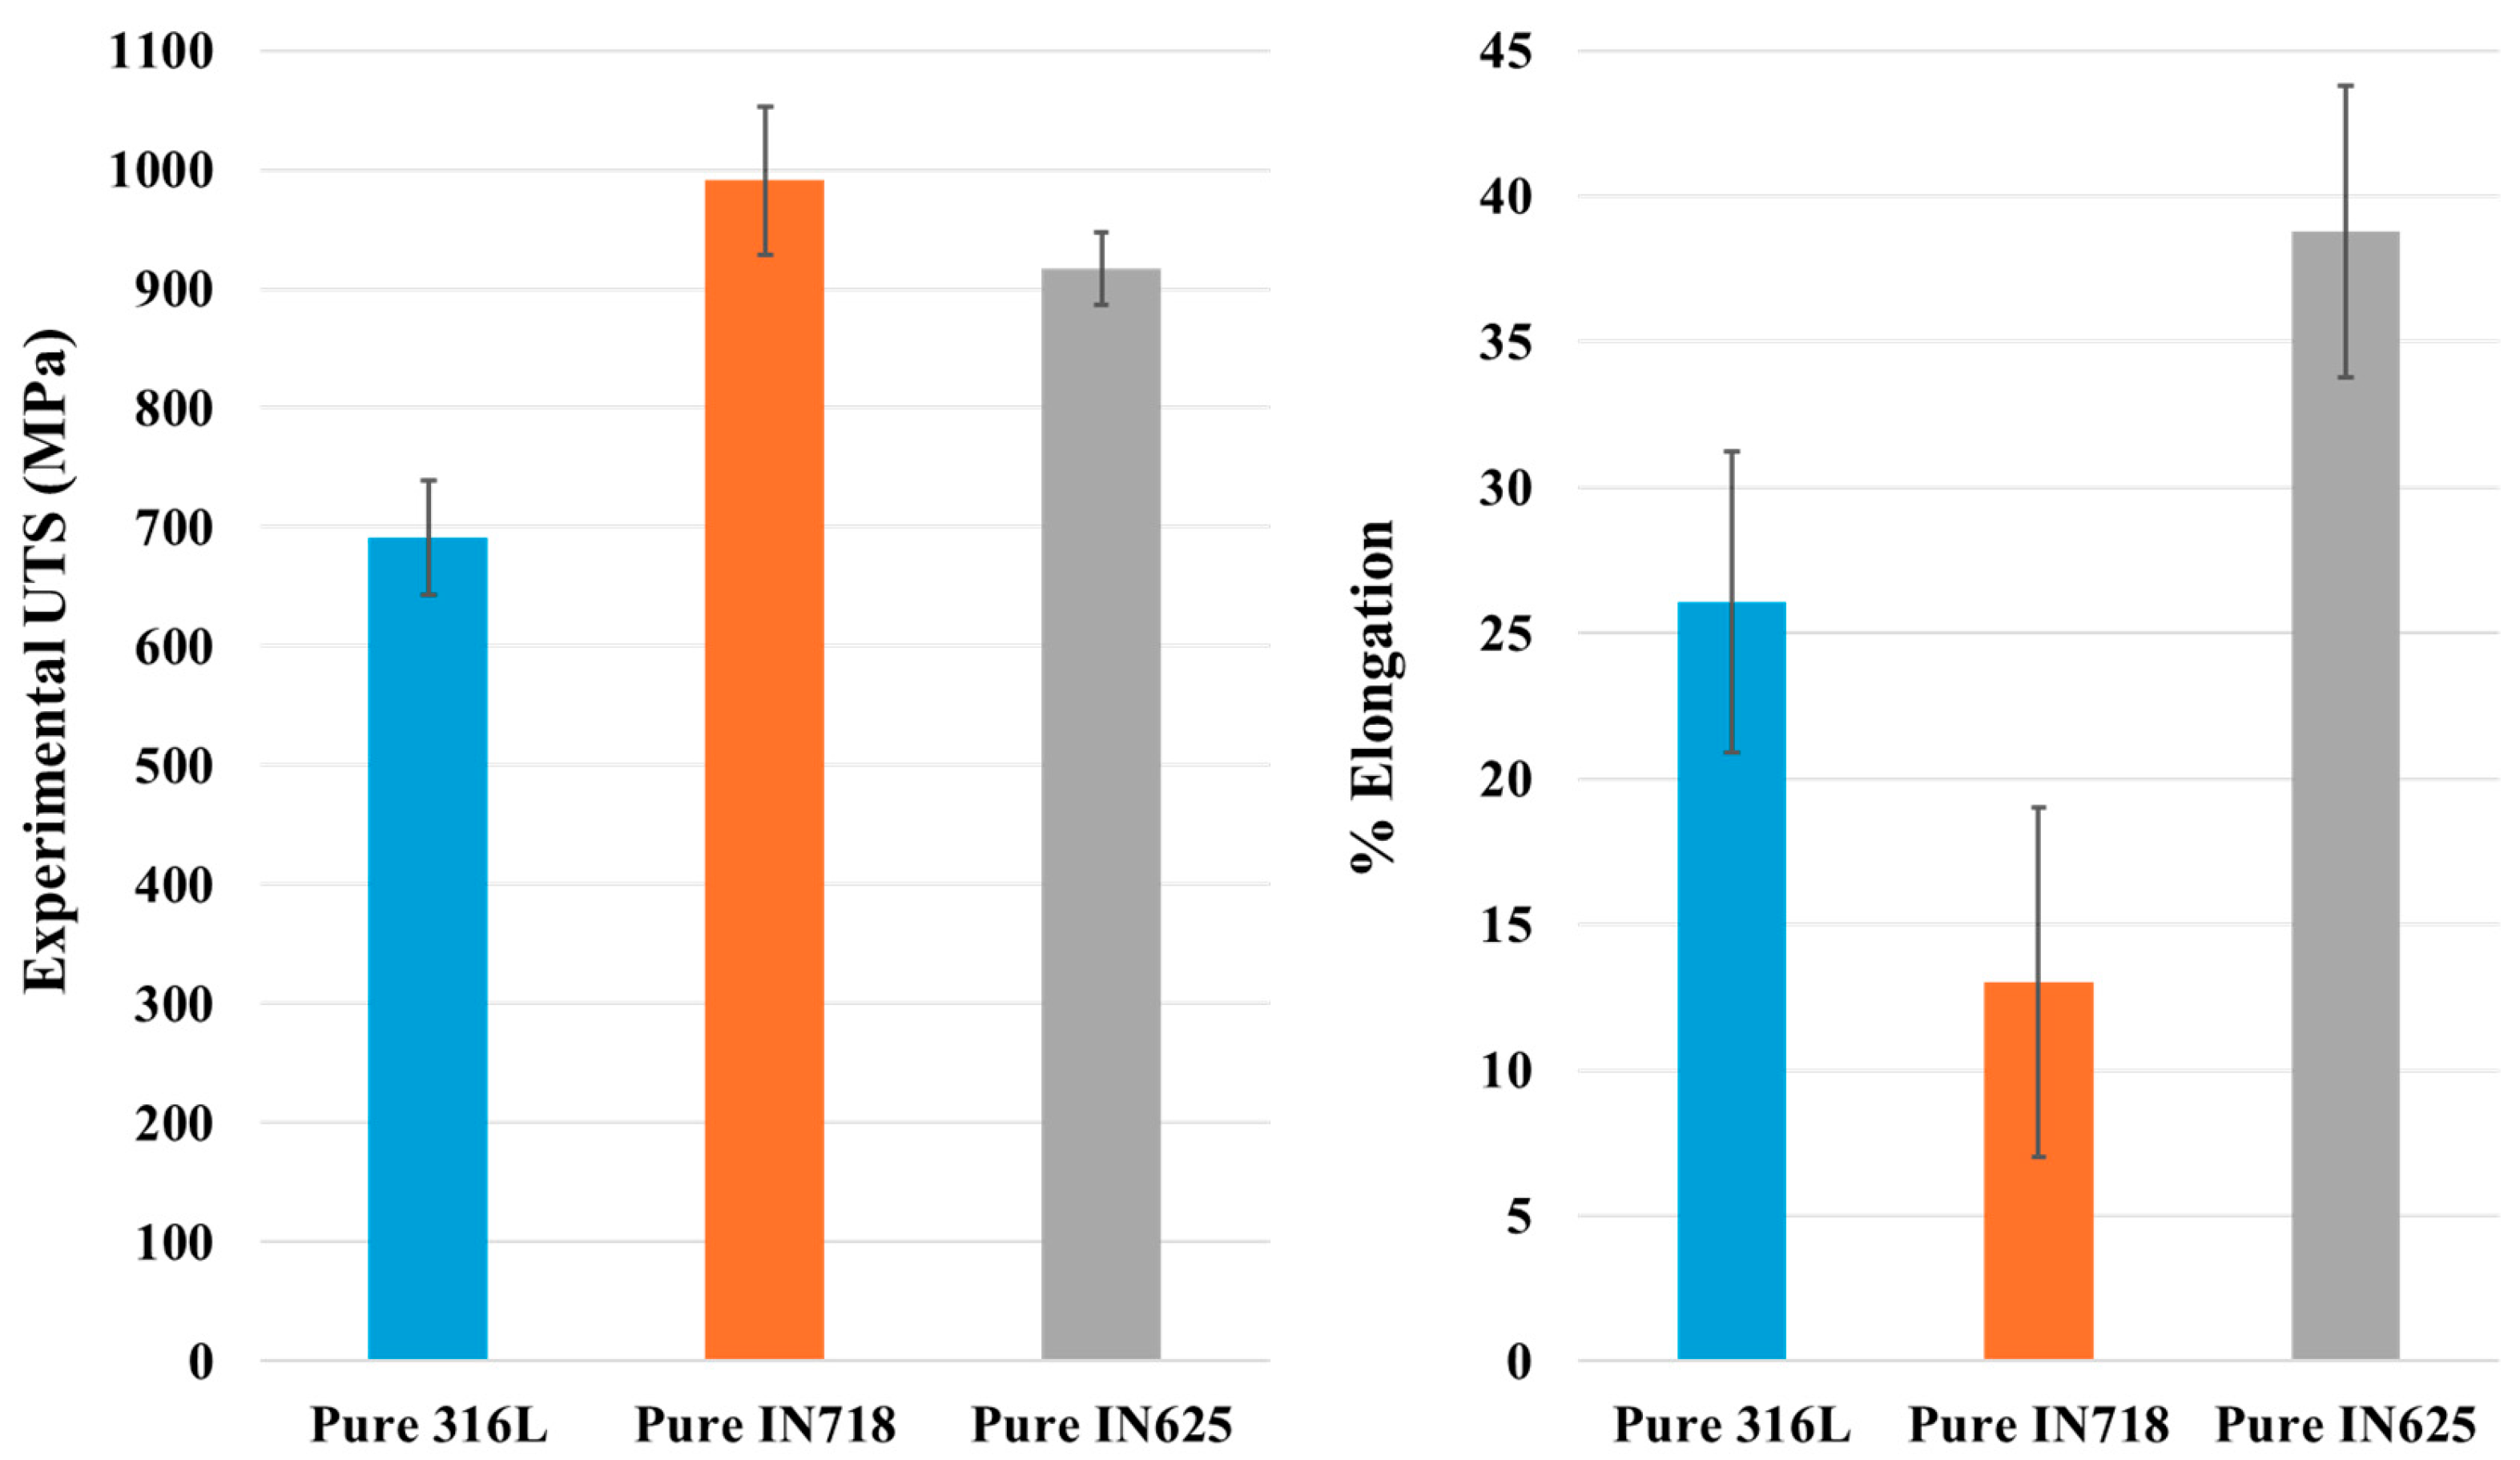
Figure 7 presents the Ultimate Tensile Strength (UTS) and percentage elongation values for L-PBF components fabricated solely from 316L, IN718, and IN625 powders. Tensile specimens of 316L and IN625 were produced and tested in the as-built condition, while the IN718 values were taken from the literature for reference. The average UTS values were 691 ± 45 MPa for 316L and 917 ± 30 MPa for IN625, with elongations of 26% and 38%, respectively, each with an error margin of ±5%. For IN718, the reported UTS was 991 ± 62 MPa with an elongation of 13% and an error margin of ±6%, which aligns with values typically observed for L-PBF-processed IN718 in the as-built state [71]. These results highlight the expected differences in mechanical behavior, with IN718 offering high strength but limited ductility, whereas 316L and IN625 exhibit lower strength but greater ductility. In the multi-material specimens, failures consistently occurred in the weaker regions, specifically within the 316L and IN625 areas, indicating that these alloys largely controlled the overall mechanical response. Consequently, the analysis focused more on the UTS and elongation values of 316L and IN625 for comparison and reference in evaluating failure behavior, as their properties directly determined the observed fracture locations and trends.
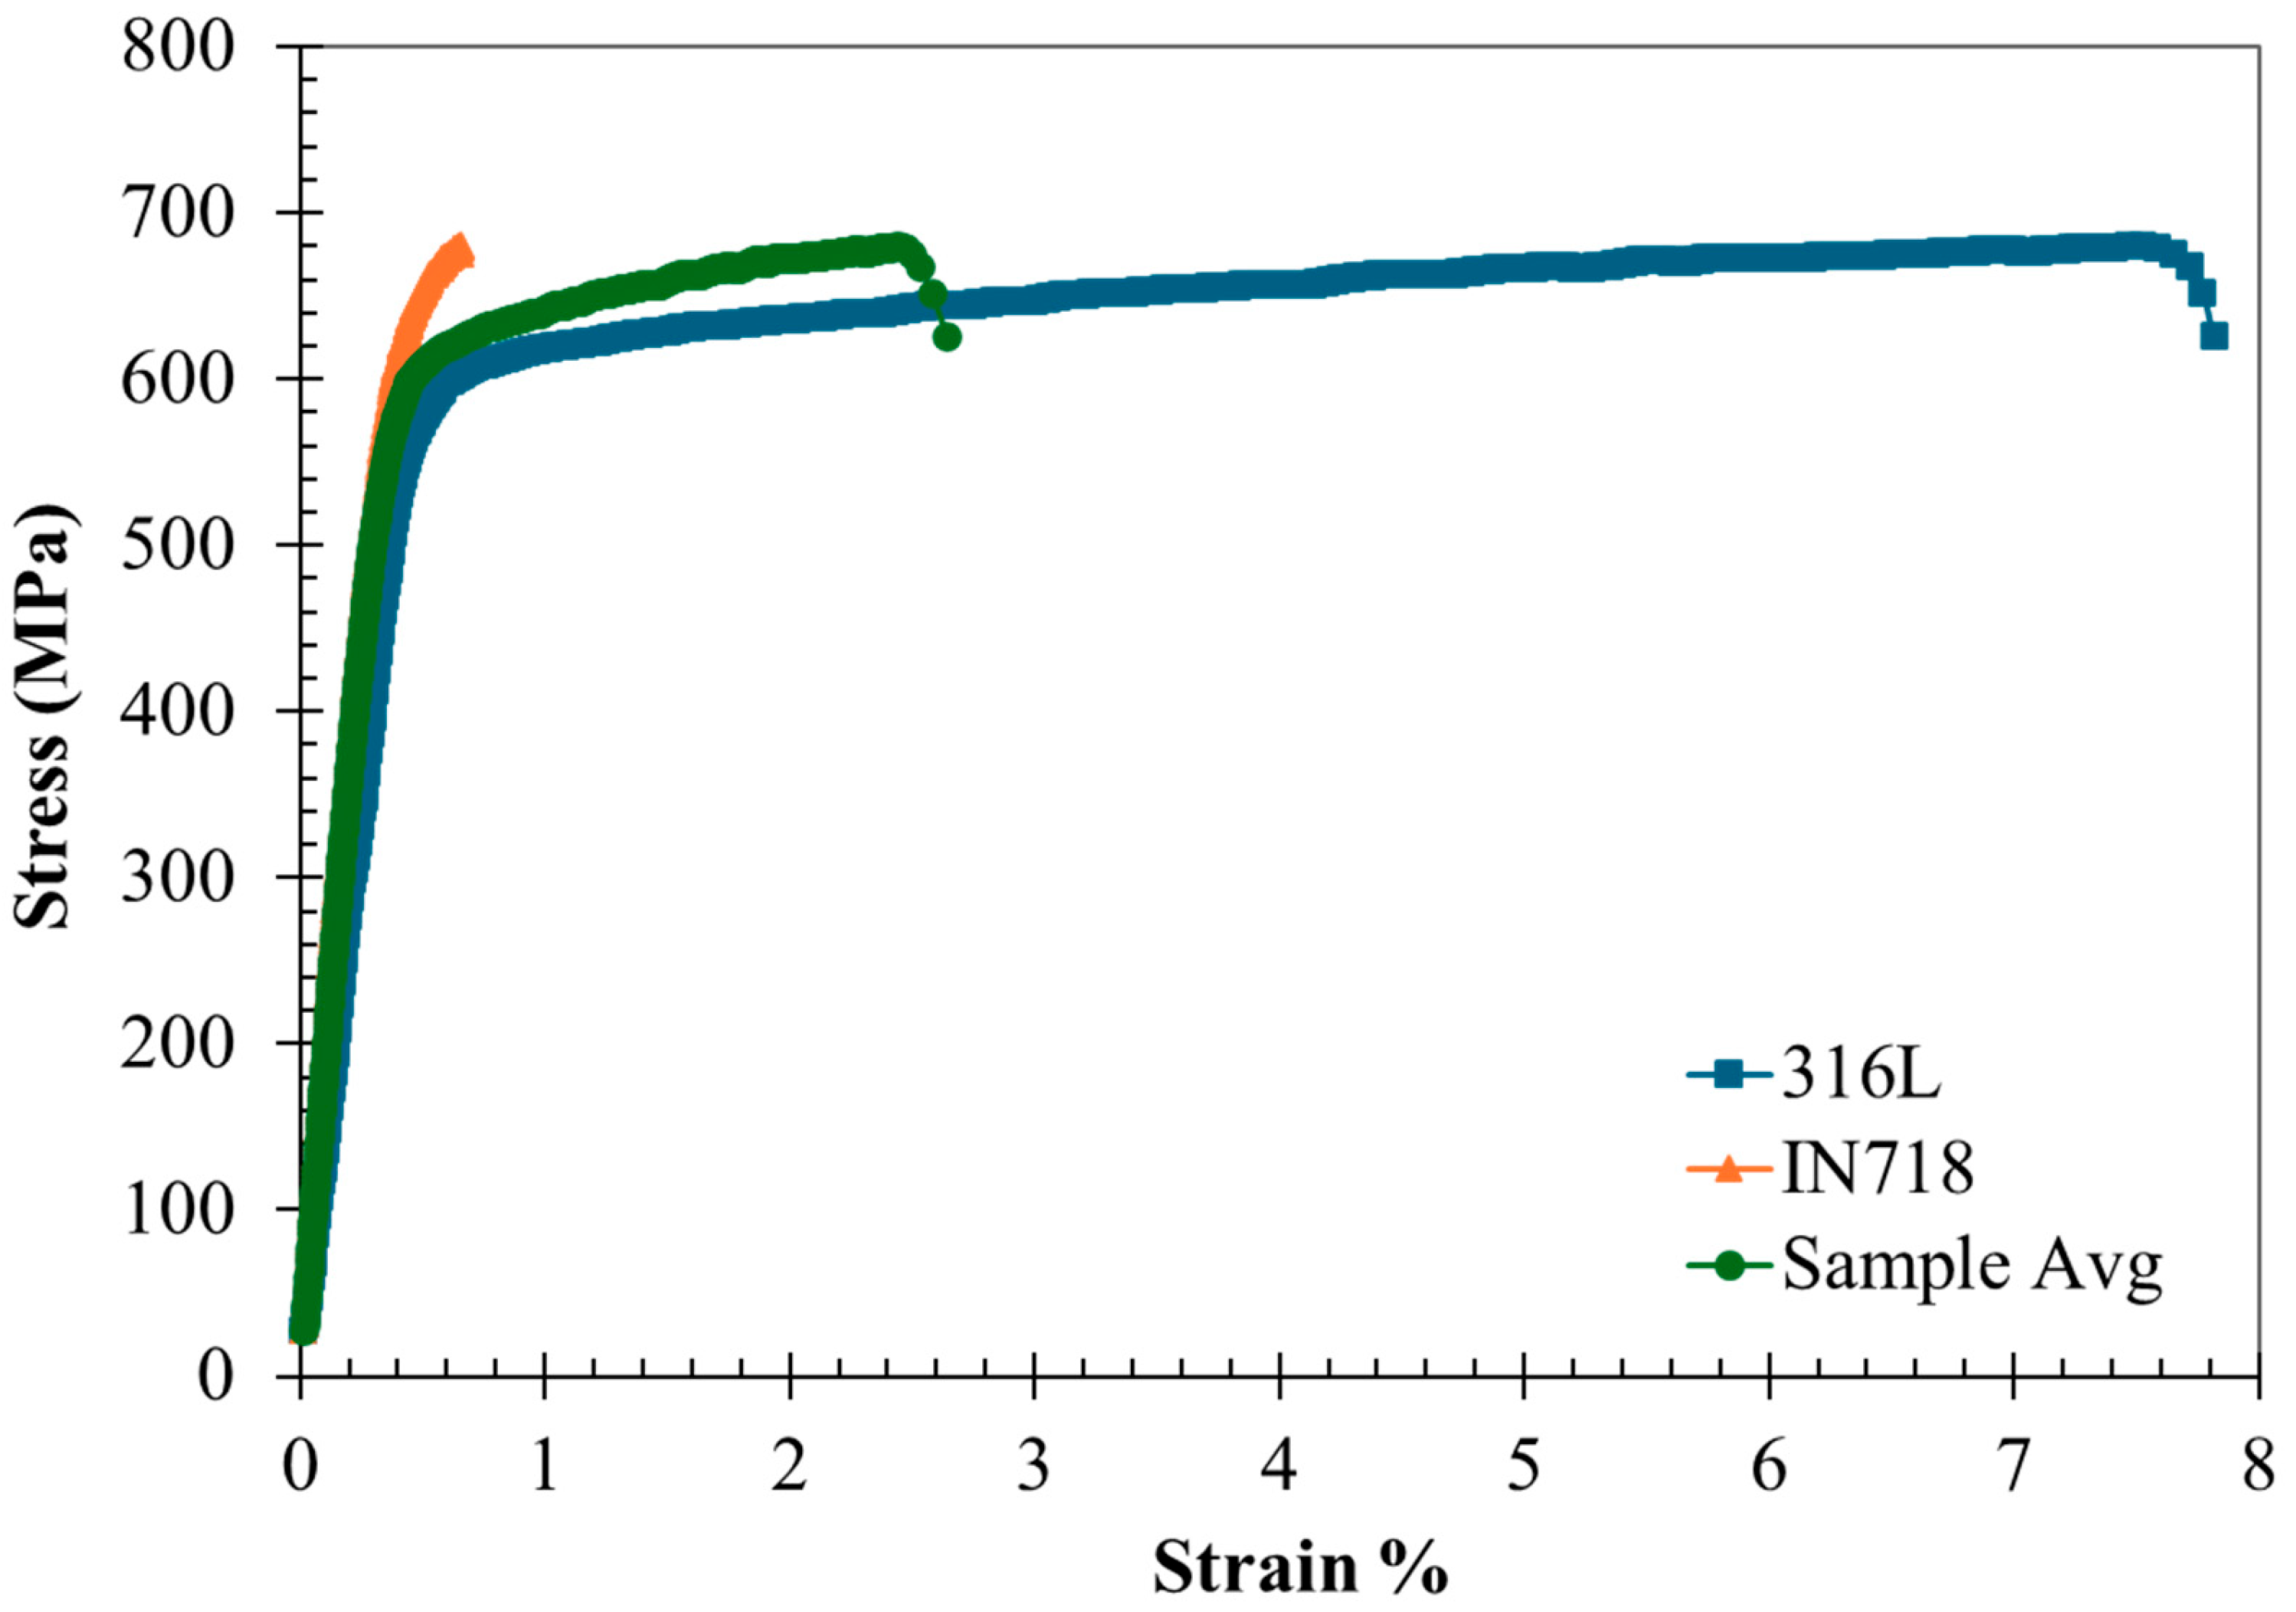
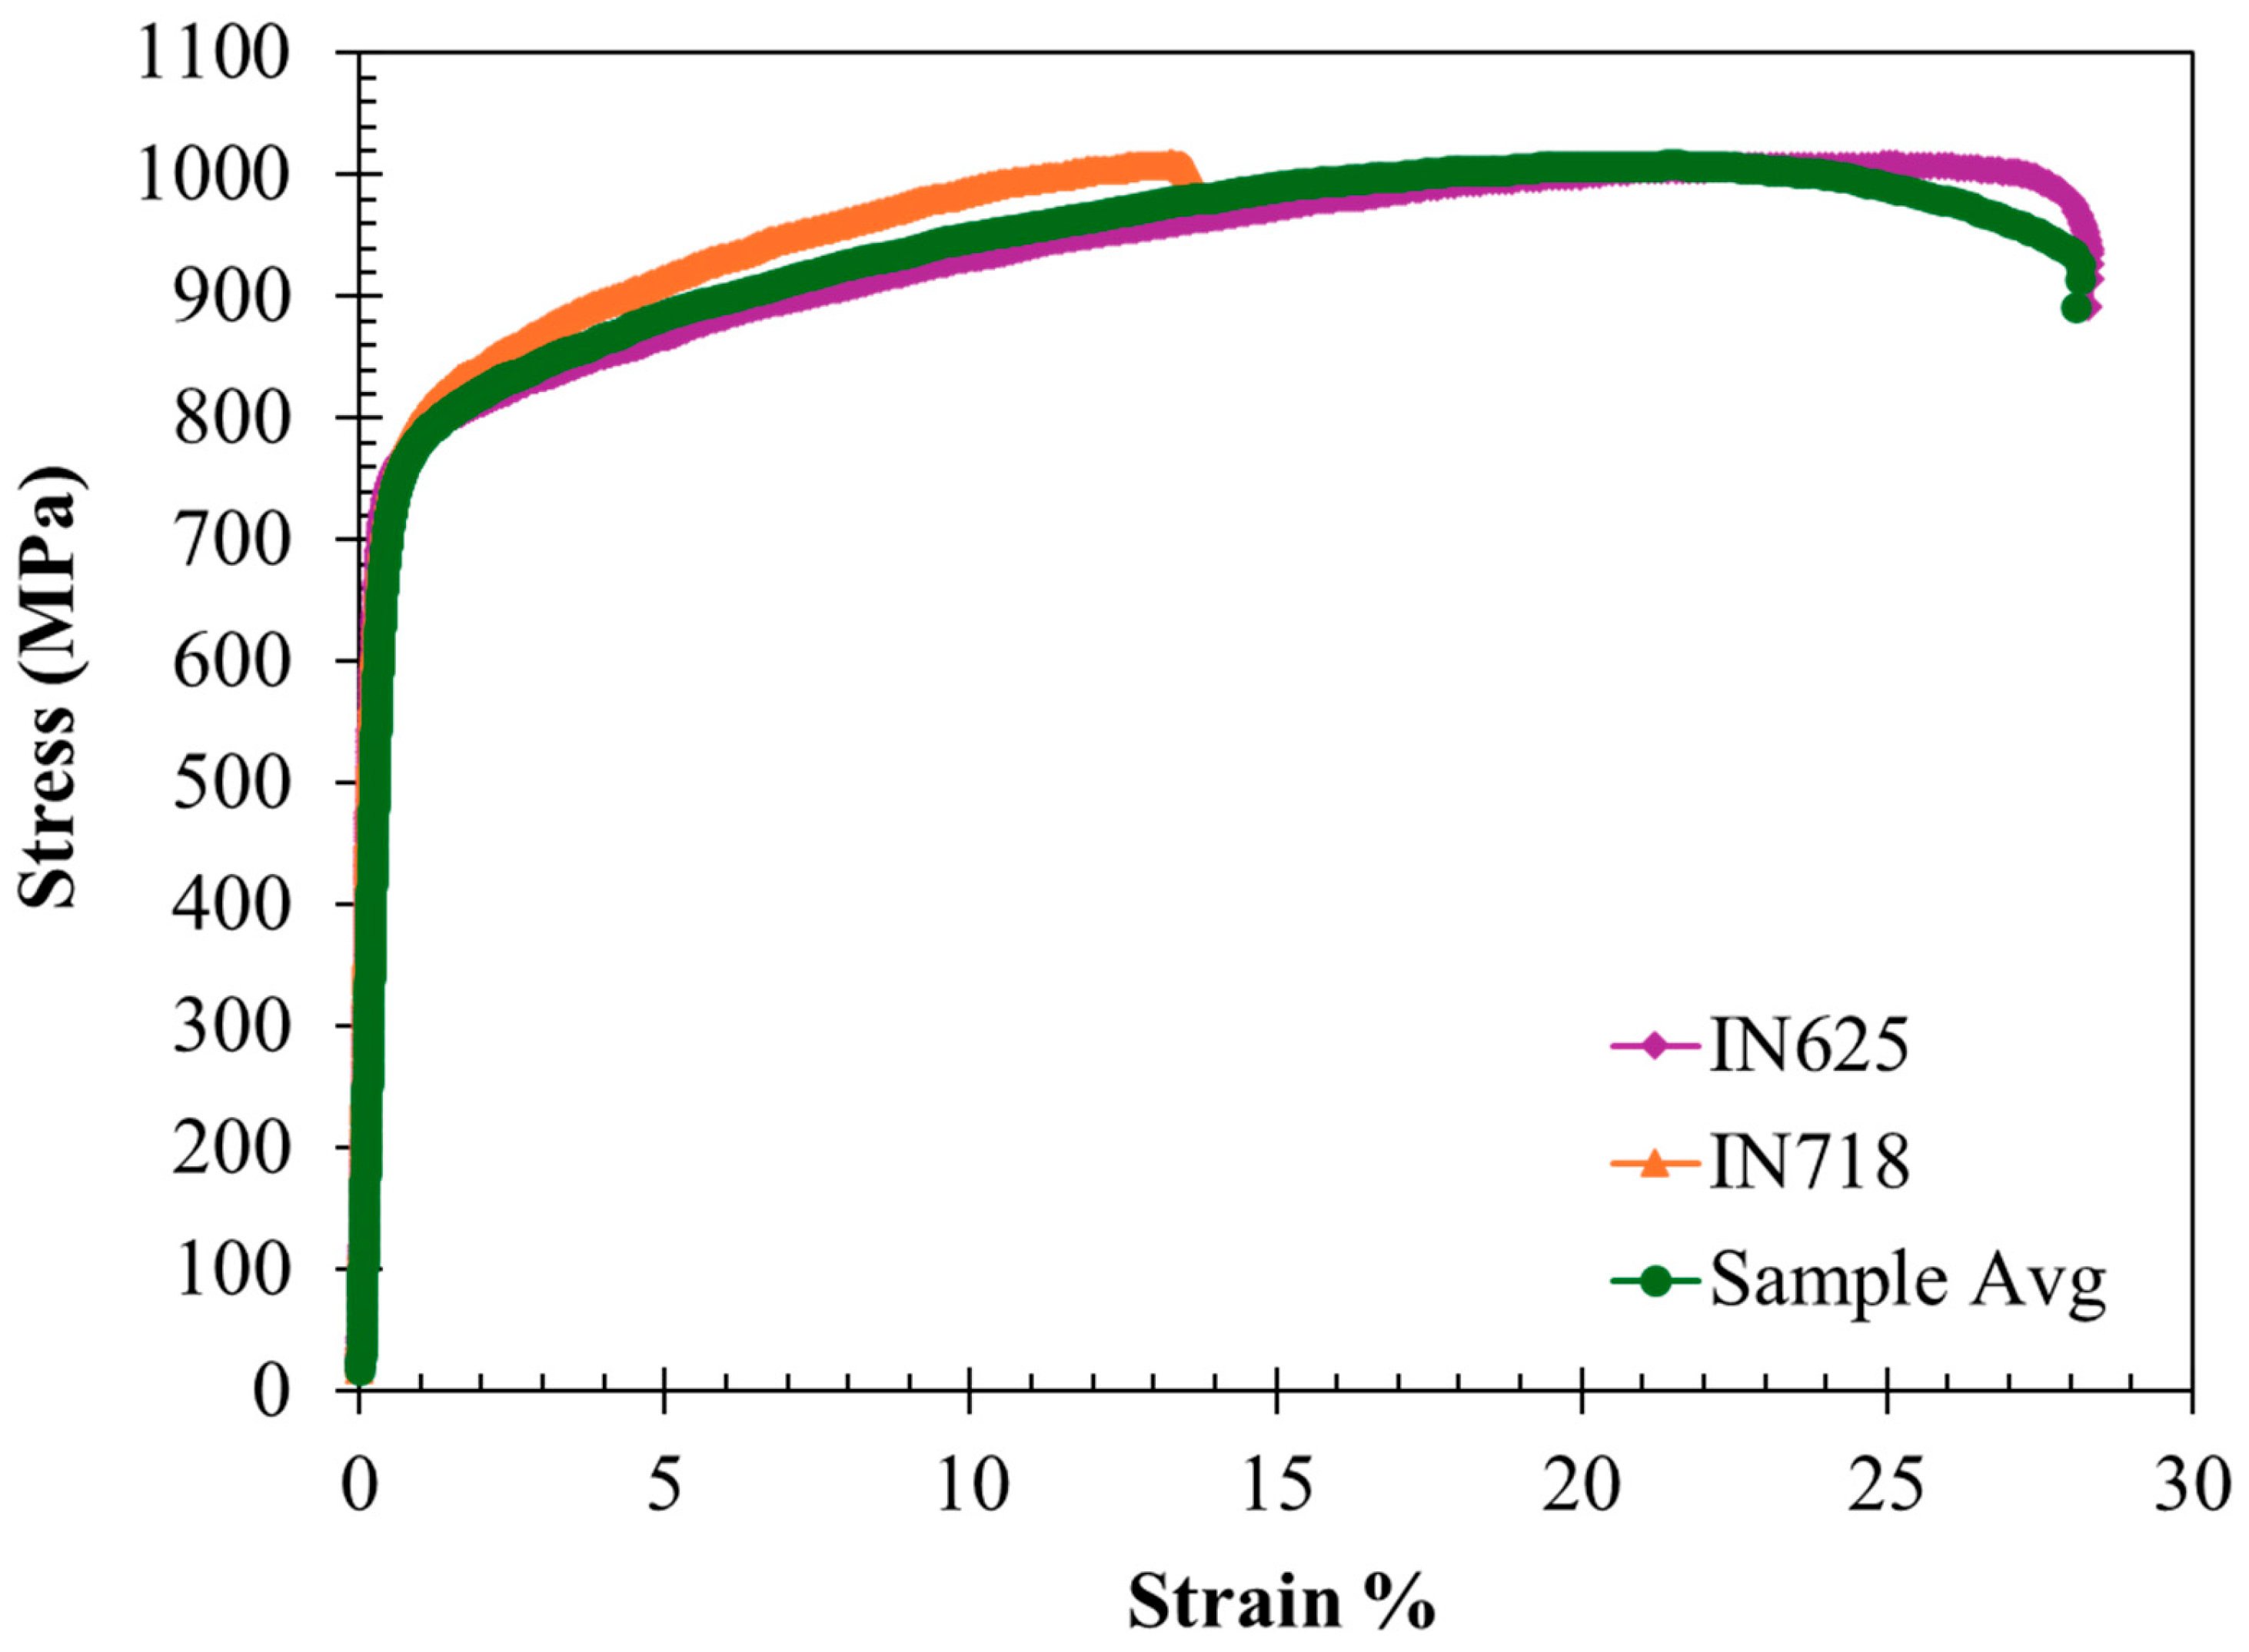
Figure 8, Figure 9 and Figure 10 show the stress-strain behavior of the multi-material samples. Each figure contains three plots corresponding to the data from three average extensometer data. Extensometers E1 and E2, from Figure 6, which are positioned on one metal material, have their average data plotted. Similarly, extensometers E3 and E4, located on another material, have their average data represented. Extensometers E5 and E6 measure the average strain across the full gauge section, and their average data are also depicted in the figures.
Figure 8 presents the stress-strain curve for the 316L–IN718 sample. It is evident from the plot that 316L had already entered the strain hardening and necking region, while IN718 remained in the elastic region throughout the test. IN718 maintained its true elastic limit until failure, which occurred near the interface on the 316L side. This observation was a key finding from the tensile testing, facilitated by the use of individual material extensometers in the DIC test. The UTS of this sample was calculated to be 675 MPa, closely aligning with the lower-strength material in the 316L–IN718 combination, namely 316L, which has a measured UTS of 691 ± 45 MPa.
Figure 9 displays the stress-strain curve for the IN718–IN625 sample. A key observation is that both Inconel materials, IN718 and IN625, begin to yield, but IN625 fails before IN718. The average plot of the sample is almost the same as the IN625 plot, but with a slightly higher stress endurance close to failure. Additionally, this sample had the highest elongation at break of the three variations, with about 15% elongation. The UTS of this sample was 1004 MPa, which is between the UTS of IN718 and IN625 and slightly higher than the average value calculated for IN625 alone (917 ± 30 MPa).
Figure 10 shows the stress-strain curve for the IN625–316L sample. Similar to the observation in Figure 8, 316L had already entered the necking region, while IN625 was still in the elastic region. The sample broke near the interface on the 316L side, with IN625 just beginning to enter the yielding zone. The UTS of this sample was calculated at 687 MPa, again aligning closely with the lower-strength material in the 316L–IN625 combination, i.e., 316L, whose experimental UTS is measured at 691 ± 45 MPa.
The % elongation data at break in Table 5 shows that Inconel samples experience the most stretching during loading compared to stainless steel samples. IN718–IN625 had the highest elongation, almost 29%, regardless of rescans. The second-longest elongation was observed in the IN625–316L sample, with an elongation of about 14% before breaking. The lowest elongation was seen in 316L–IN718 sample, which only reached close to 3% before breaking near the interface with the 316L.
The experimental observation showed that the AM-produced IN718–IN625 multi-material samples exhibited a markedly higher UTS of 1004 MPa and elongation of 15%, outperforming the post-weld heat-treated friction joint of AISI 316L–IN718, which showed a UTS of 828.5 MPa and elongation of 9.1% [52]. Similarly, the AM-fabricated IN625–316L samples achieved a UTS of 687 MPa and elongation of 28%, both higher in strength but lower in ductility when compared to laser wire DED-processed SS316L–IN625 samples, which recorded a UTS of 550.2 MPa and elongation of 41.6% [55]. In contrast, the AM-manufactured 316L–IN718 samples demonstrated a UTS of 675 MPa and elongation of 3%, which were lower than the values reported for traditionally friction-welded AISI 316L–IN718 joints, with a UTS of 728.7 MPa and elongation of 14.1% [52]. The lower strength of the AM SS316L–IN718 combination compared to the traditional friction weld may be attributed to the fact that the AM samples were as-built, without any post-processing heat treatment, which likely contributed to the reduced performance in both strength and ductility.

3.2. Interface Characterization

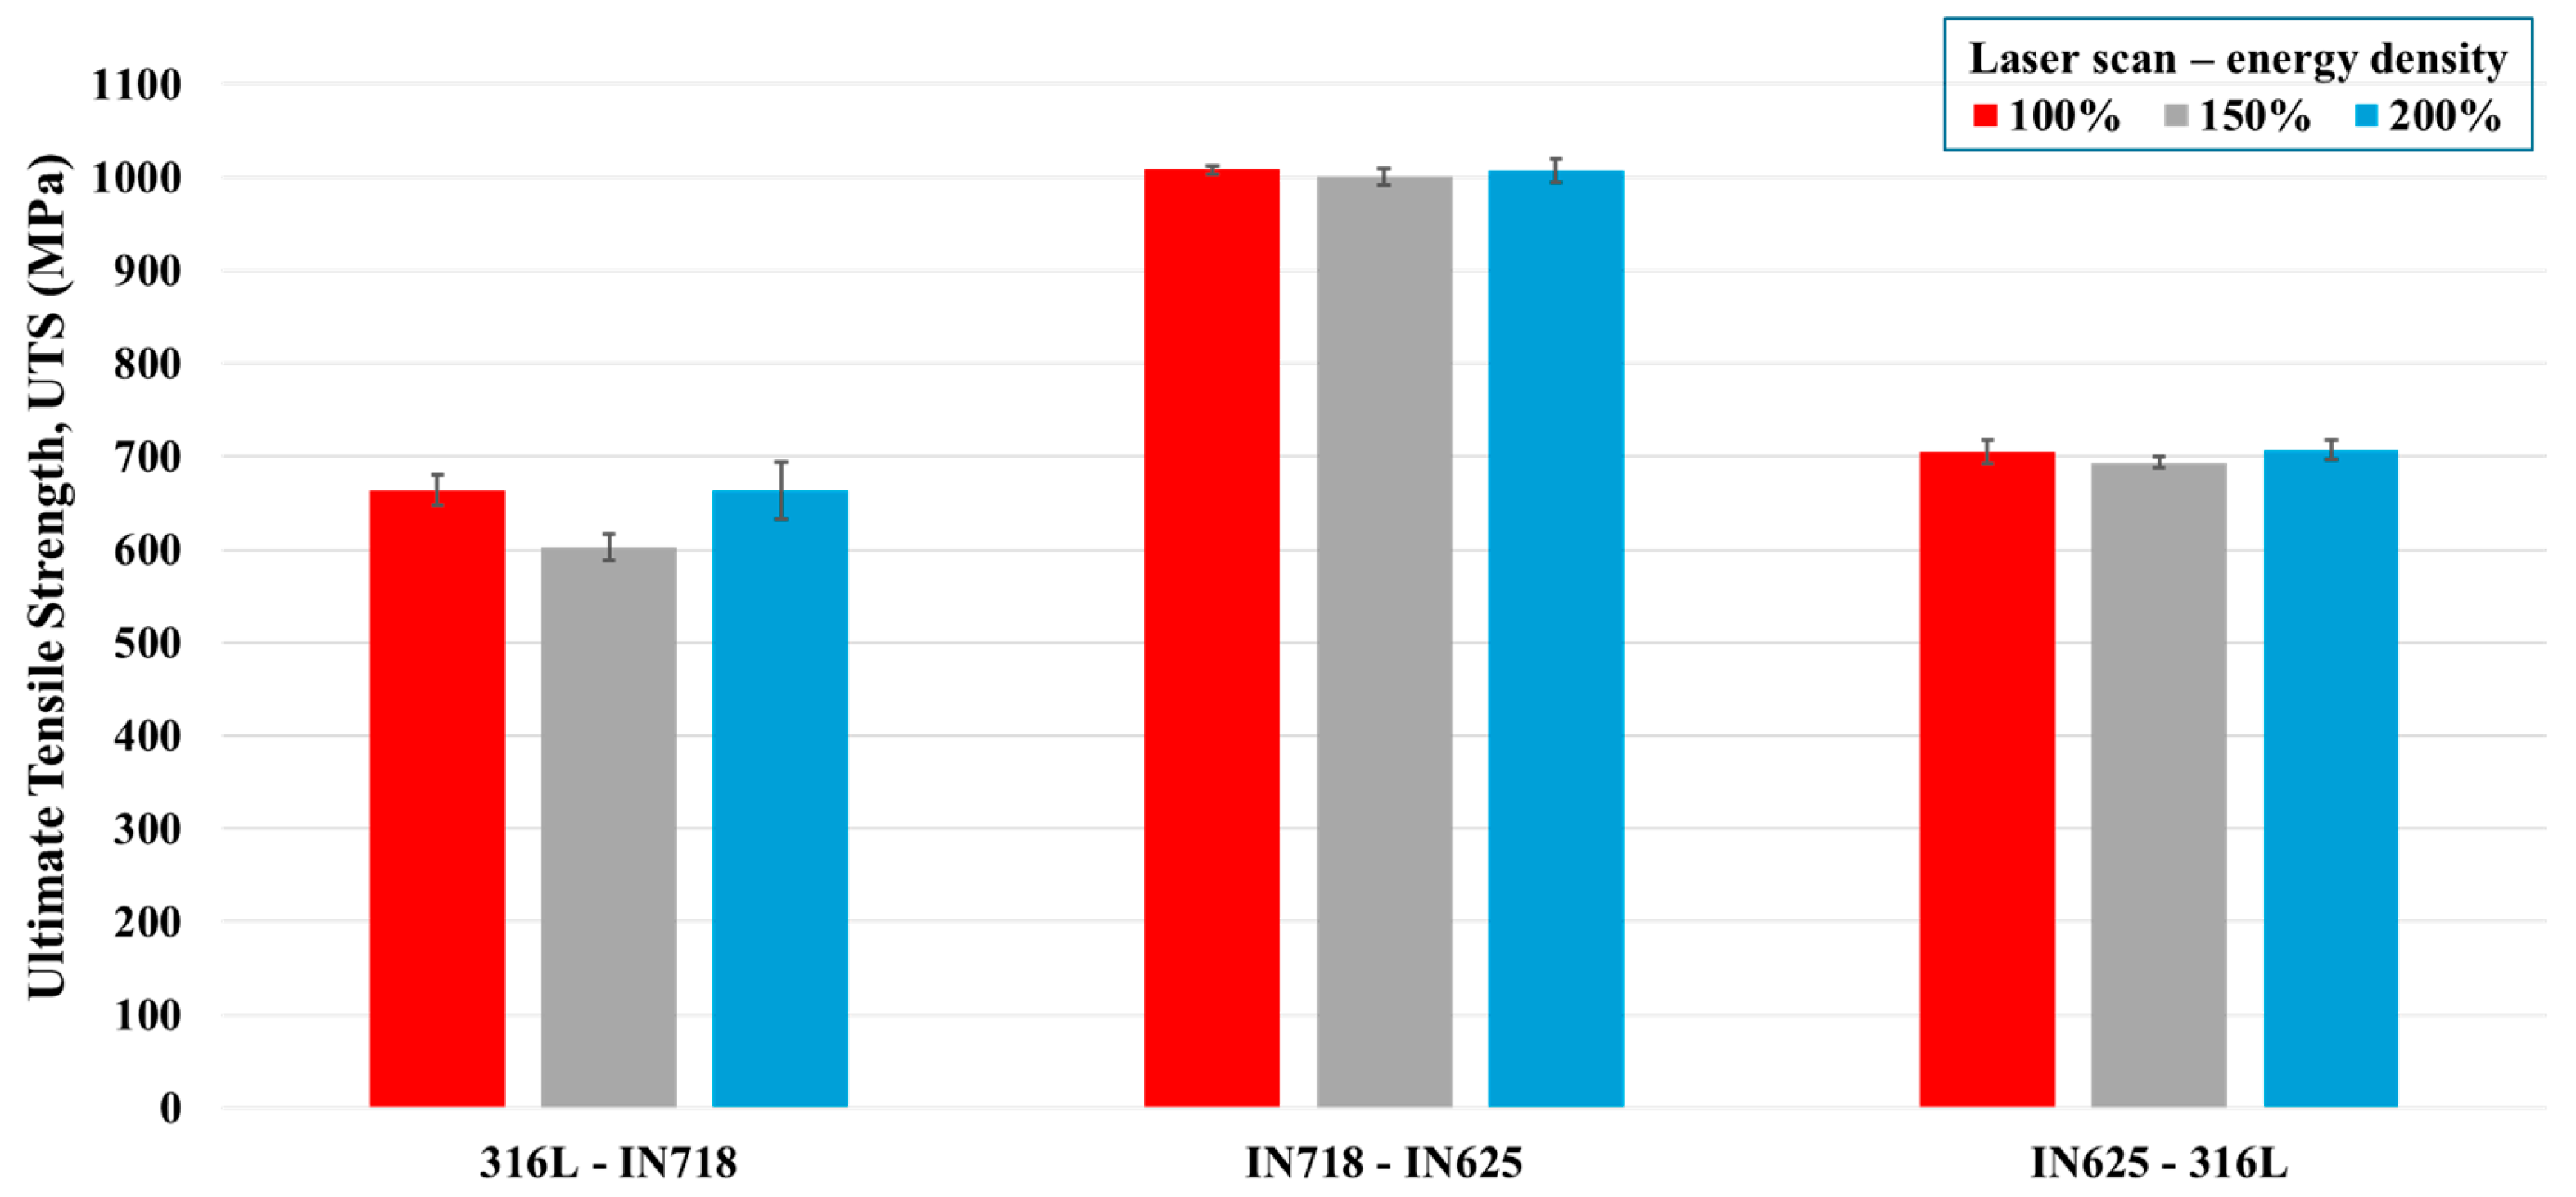
Figure 11 displays the comparison of UTS values calculated from samples after rescanning with added energy densities. Rescanning the samples with 50% and 100% energy density did not significantly improve the UTS values for IN718–IN625 and IN625–IN718 samples. In fact, the UTS value for the 50% rescan of 316L–IN718 samples decreased by 9.20%, as noticed from the figure. This decrease can be attributed to the fact that the anisotropic mechanical response of the dissimilar materials interface under varying energy inputs may lead to localized stress concentrations during tensile loading. Such regions, especially near the fusion boundaries, can exhibit reduced load-bearing efficiency when the VED during rescanning is not optimally balanced. The 50% rescan, in particular, might have introduced residual stress patterns that unfavorably aligned with the principal loading direction, thereby lowering the UTS value in 316L–IN718 samples [63].
The microstructural analysis of the build specimen using visible light shows that samples have a diffused gradient zone on a µm scale instead of sharp transition distinctions. The microstructure of the etched 316L–IN718 sample is shown in Figure 12.
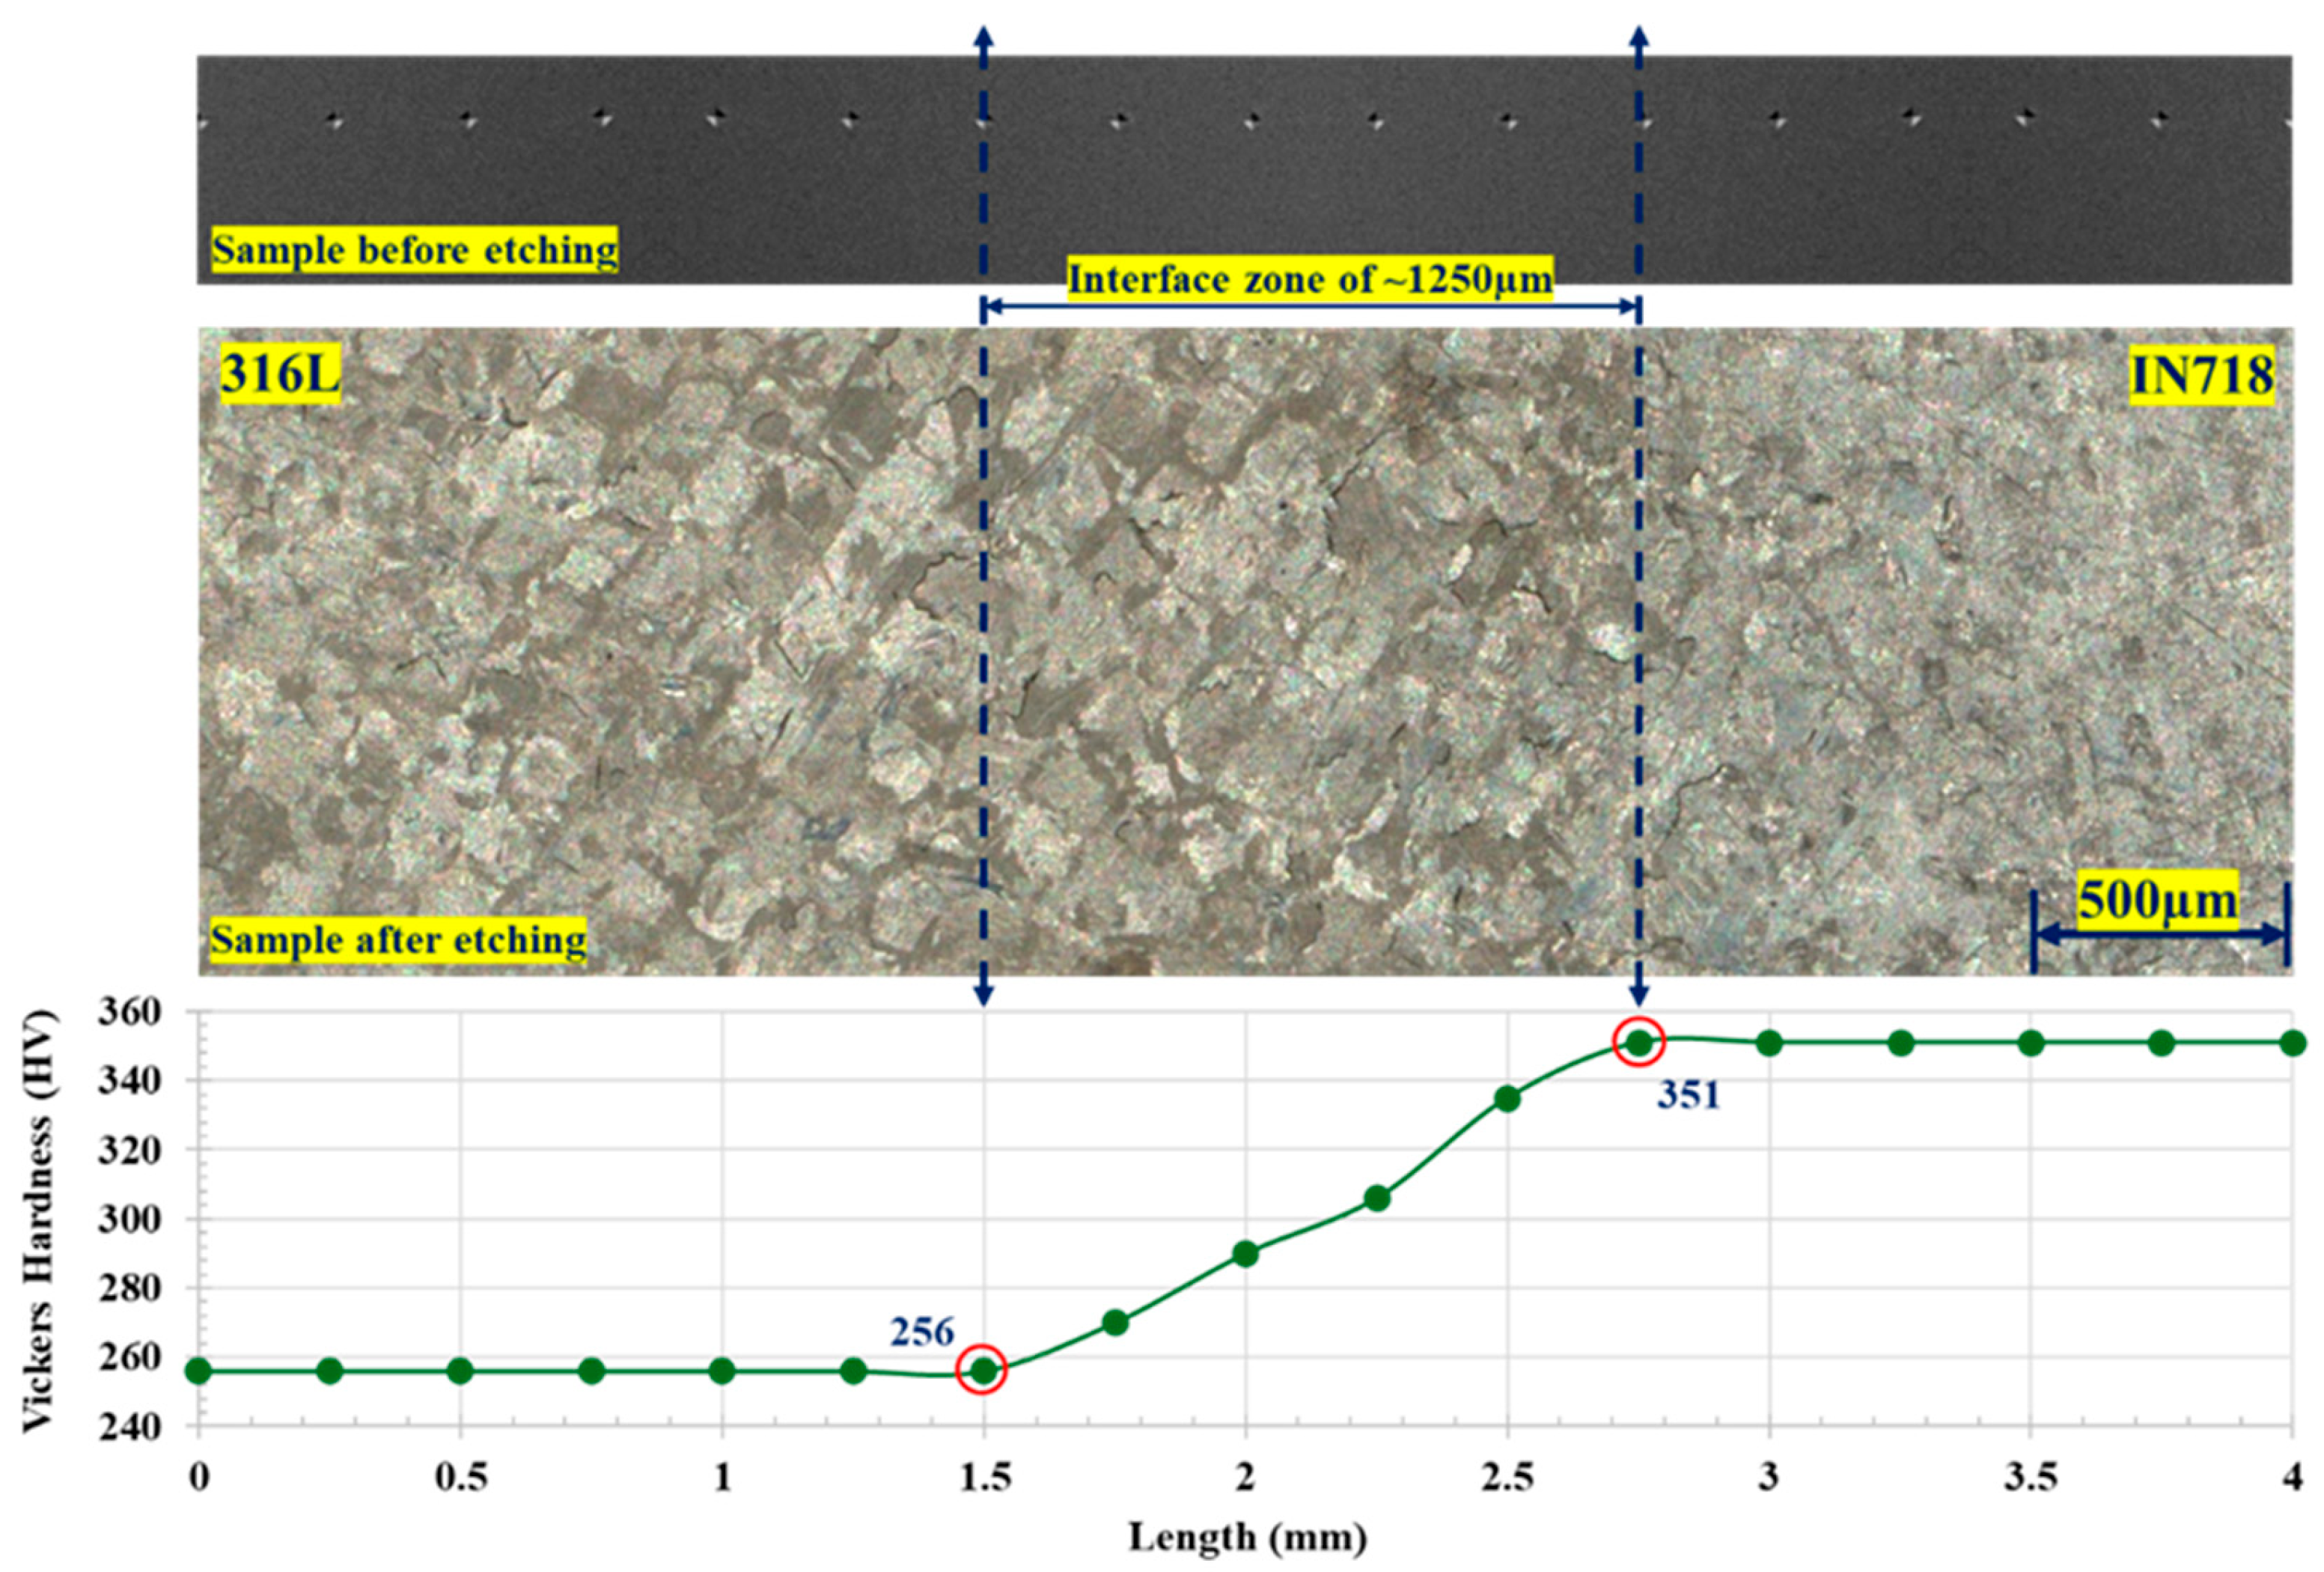
Figure 13 presents the interface region of a 316L–IN718 sample: SEM image before etching (top), after etching with Adler’s reagent (middle), and the corresponding Vickers microhardness (HV) data (bottom). The interface region length in this typical sample was approximately 1250 µm. The etched image clearly shows the transition from 316L steel to IN718 nickel alloy at the microstructure level. This interface, produced using a customized novel binning process in a laser powder bed fusion machine, provides good metallurgical bonding and exhibits no noticeable porosity across the material interface. Additionally, cross-contamination of materials spatially beyond the transition is consistently not found, as supported by Figure 14.
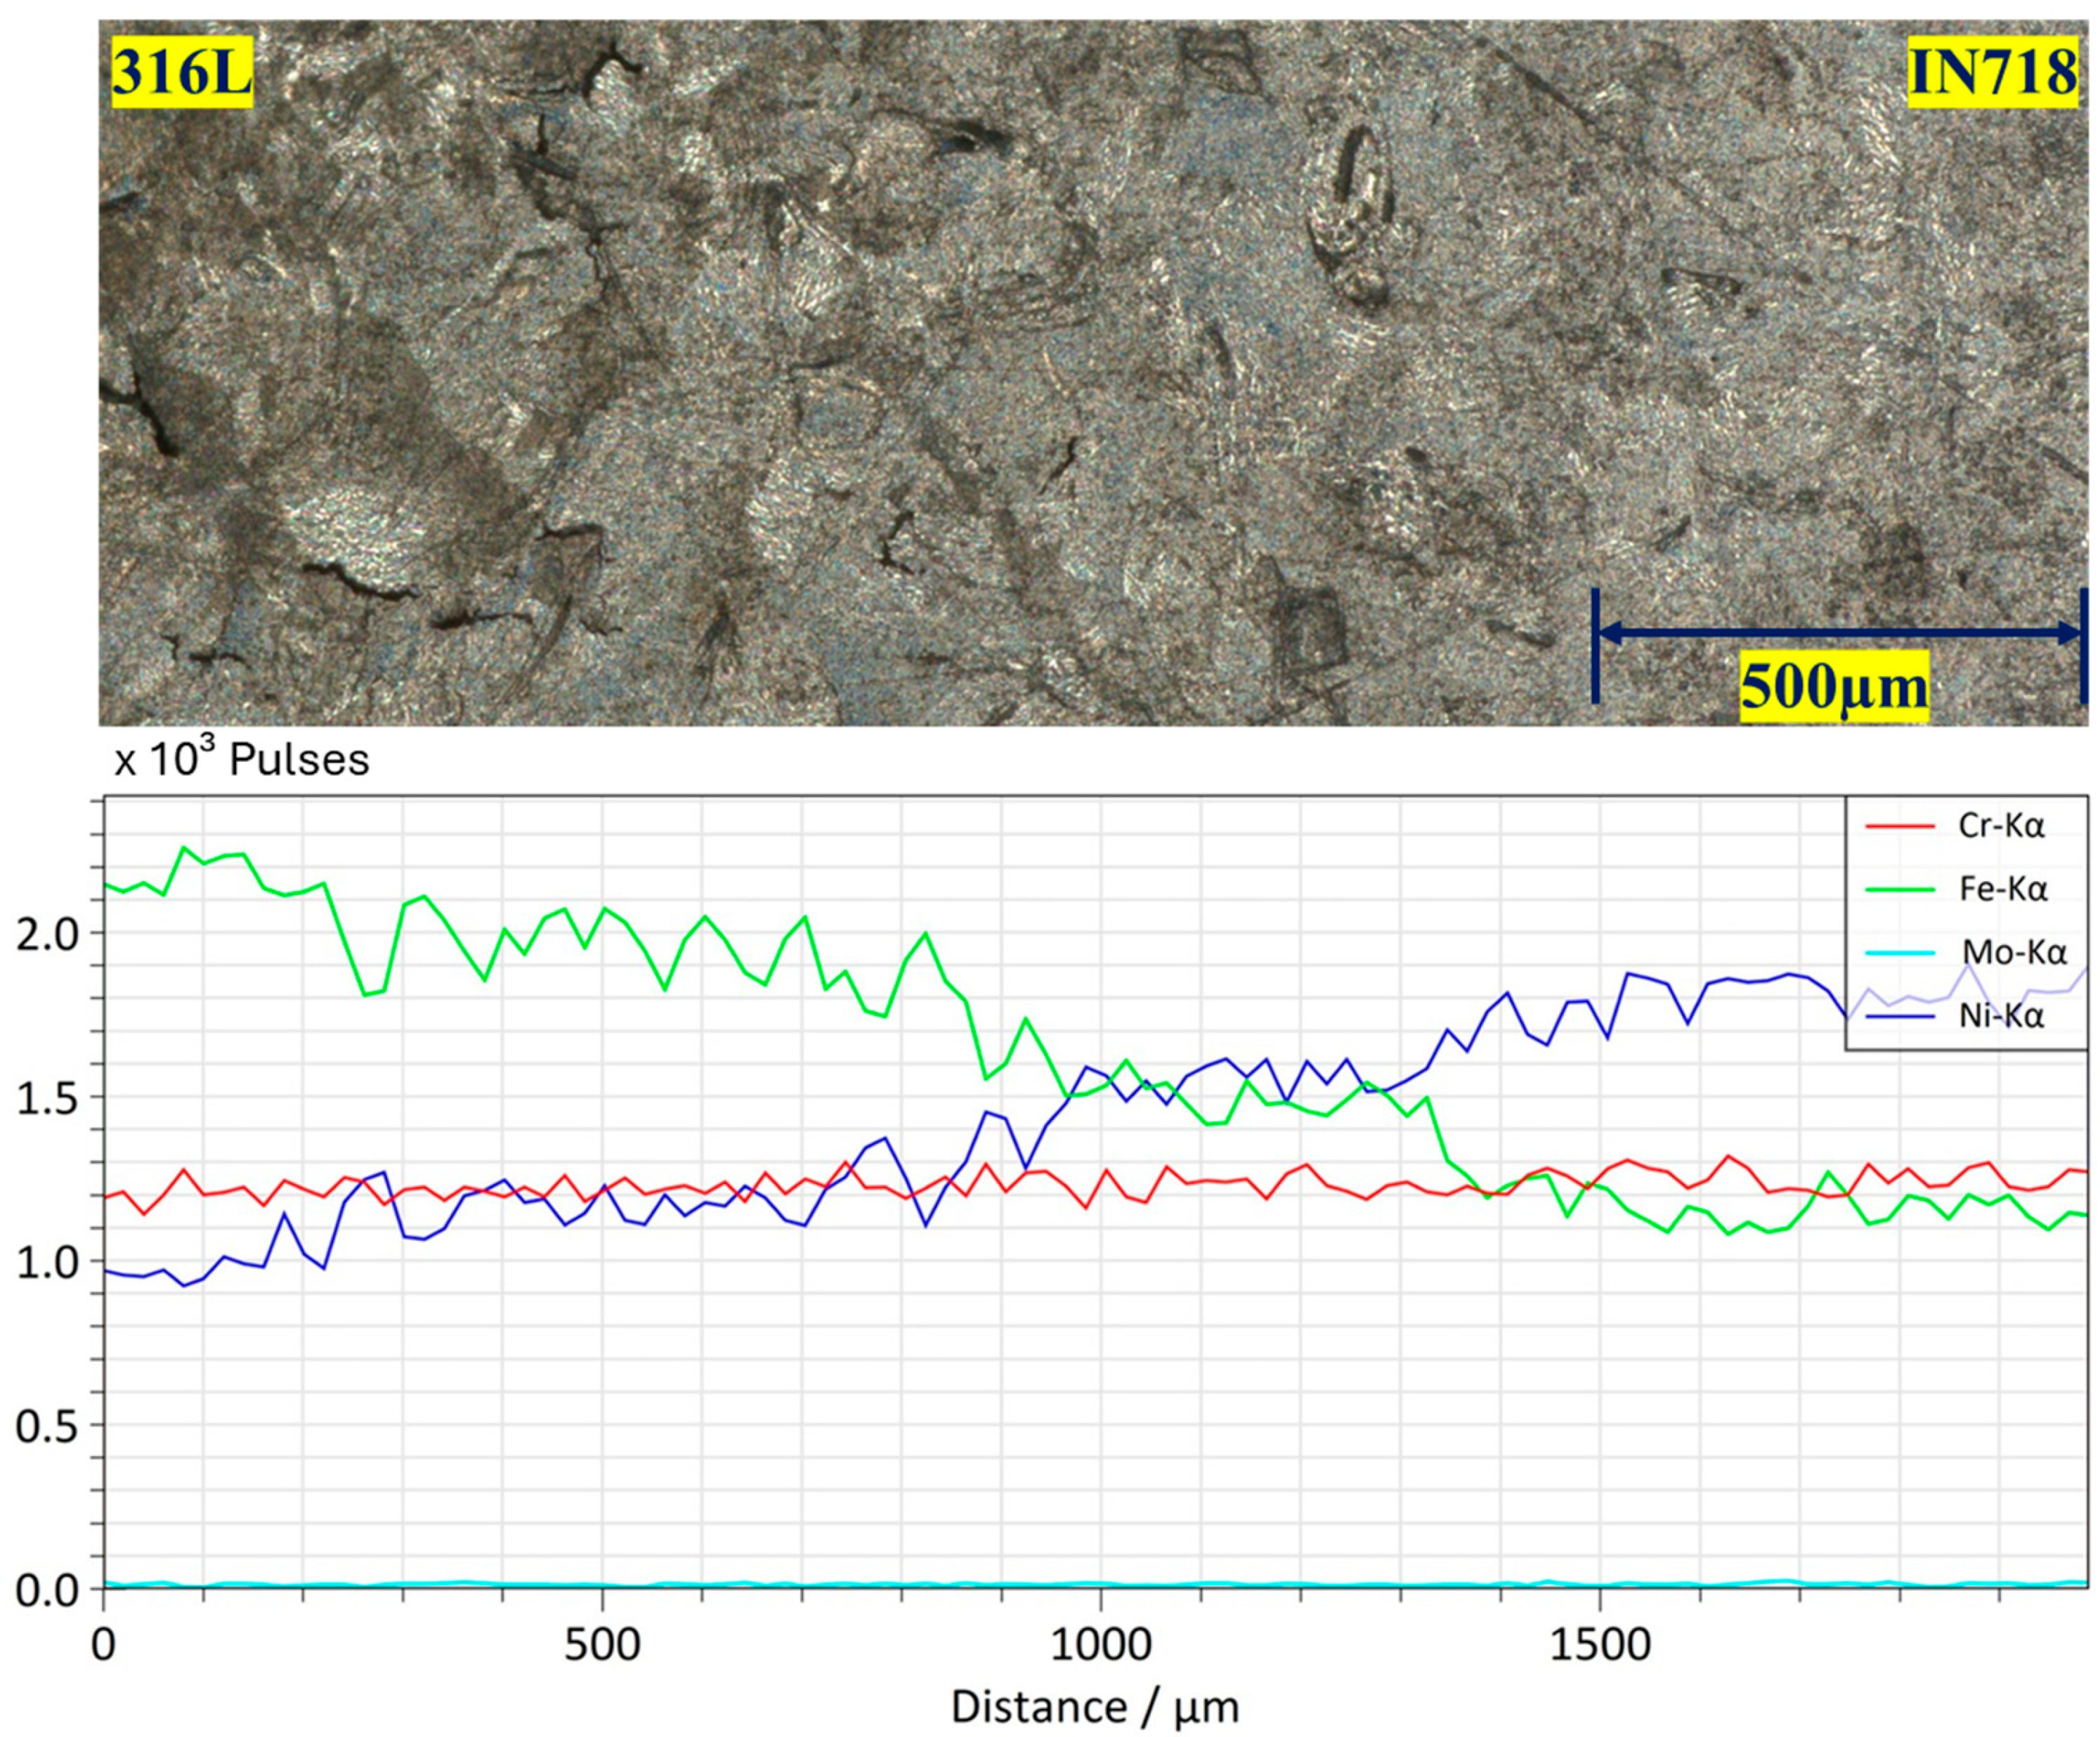
Energy Dispersive X-Ray Spectroscopy (EDX) technique was further used to analyze the microstructure as well as the surface structure pattern of the printed sample and the variation in the concentrations of the major matrix elements, Fe and Ni, in the stainless steel and Inconel alloys, as shown in Figure 14. From left to right, the Fe content gradually decreases, reaches a minimum, and plateaus, while the Ni percentage increases, reaches a maximum, and then plateaus. This helps quantify the spatial distribution of the two materials over the diffused interface produced by the powder binning approach and is consistent with microhardness measurement results.
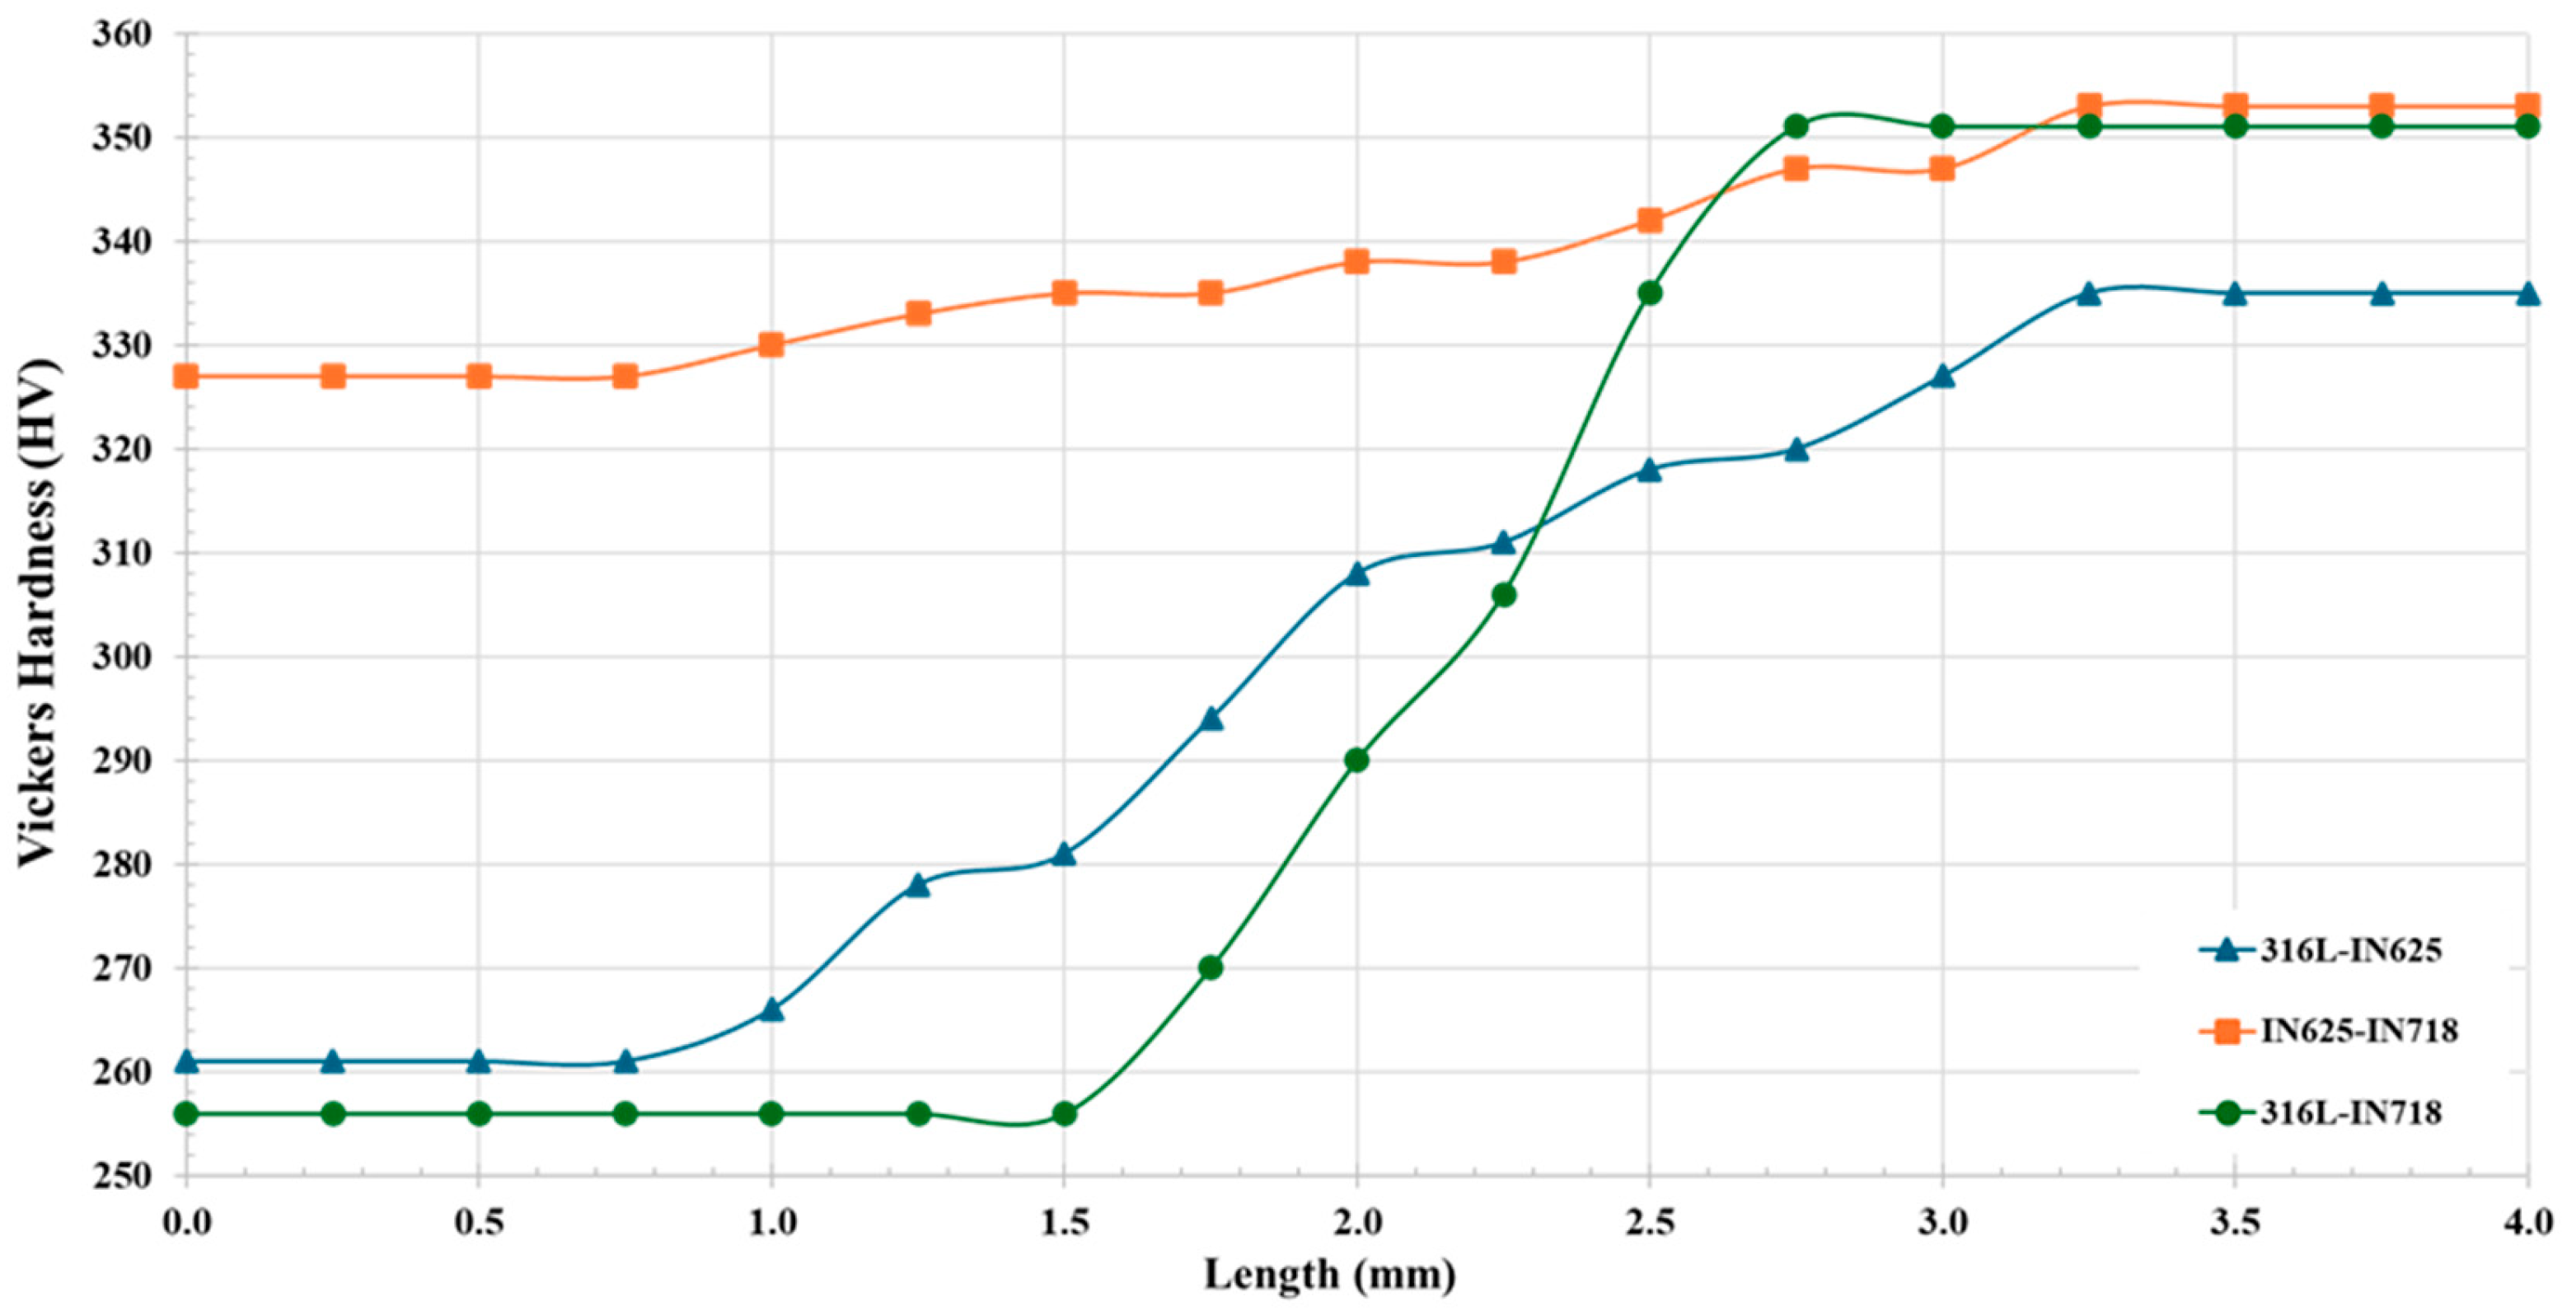
The distribution of Vickers micro-hardness (HV) across both the interfacial and distinct material regions of the samples produced using Scan Strategy 1 is shown in Figure 15. Consistent HV values were observed within each individual material region. Specifically, 316L exhibited a hardness value of 260 ± 5 HV, IN718 had a value of 350 ± 5 HV, and IN625 measured a hardness of 330 ± 5 HV. Across the interface region, the HV values transitioned from the plateaued hardness value of one material to the plateaued hardness value of the adjacent material, as shown in the plot. This gradual change in hardness was a key observation in this study, as it allowed for a precise identification of the length of transition zones between different material combinations. It is important to note that no single, unique HV value was observed throughout the interface region, which is to be expected due to the significant difference in hardness values between the materials, ranging from 260 HV for stainless steel to 350 HV for Inconel.
The length of the interface region was determined by the mixing zones of powders during the recoating process within the EOS M 290 machine. For the 316L–IN718 samples, the interface region was measured to be 1250 ± 500 µm, while the interface region for the 316L-IN625 samples was found to be 2000 ± 500 µm. For the IN718-IN625 samples, the interface region measured 2500 ± 500 µm. It was observed that the interface region of the sample composed of both Inconel materials (IN718 and IN625) was the longest of the three. This was attributed to the fact that both Inconel possess very similar properties, which resulted in a more challenging task of identifying the precise boundary of the interface region due to the near-matching characteristics. In the future, accurately quantifying and controlling the interface region could be an important topic of study. This could be achieved by regulating variables in the recoating system, and by doing so, the mixing zone could be reduced, resulting in clearer and more defined interface boundaries. Alternatively, a more diffuse interface could be created, depending on the desired material properties. This control over the interface could greatly improve material processing and performance, making it a key area for research.
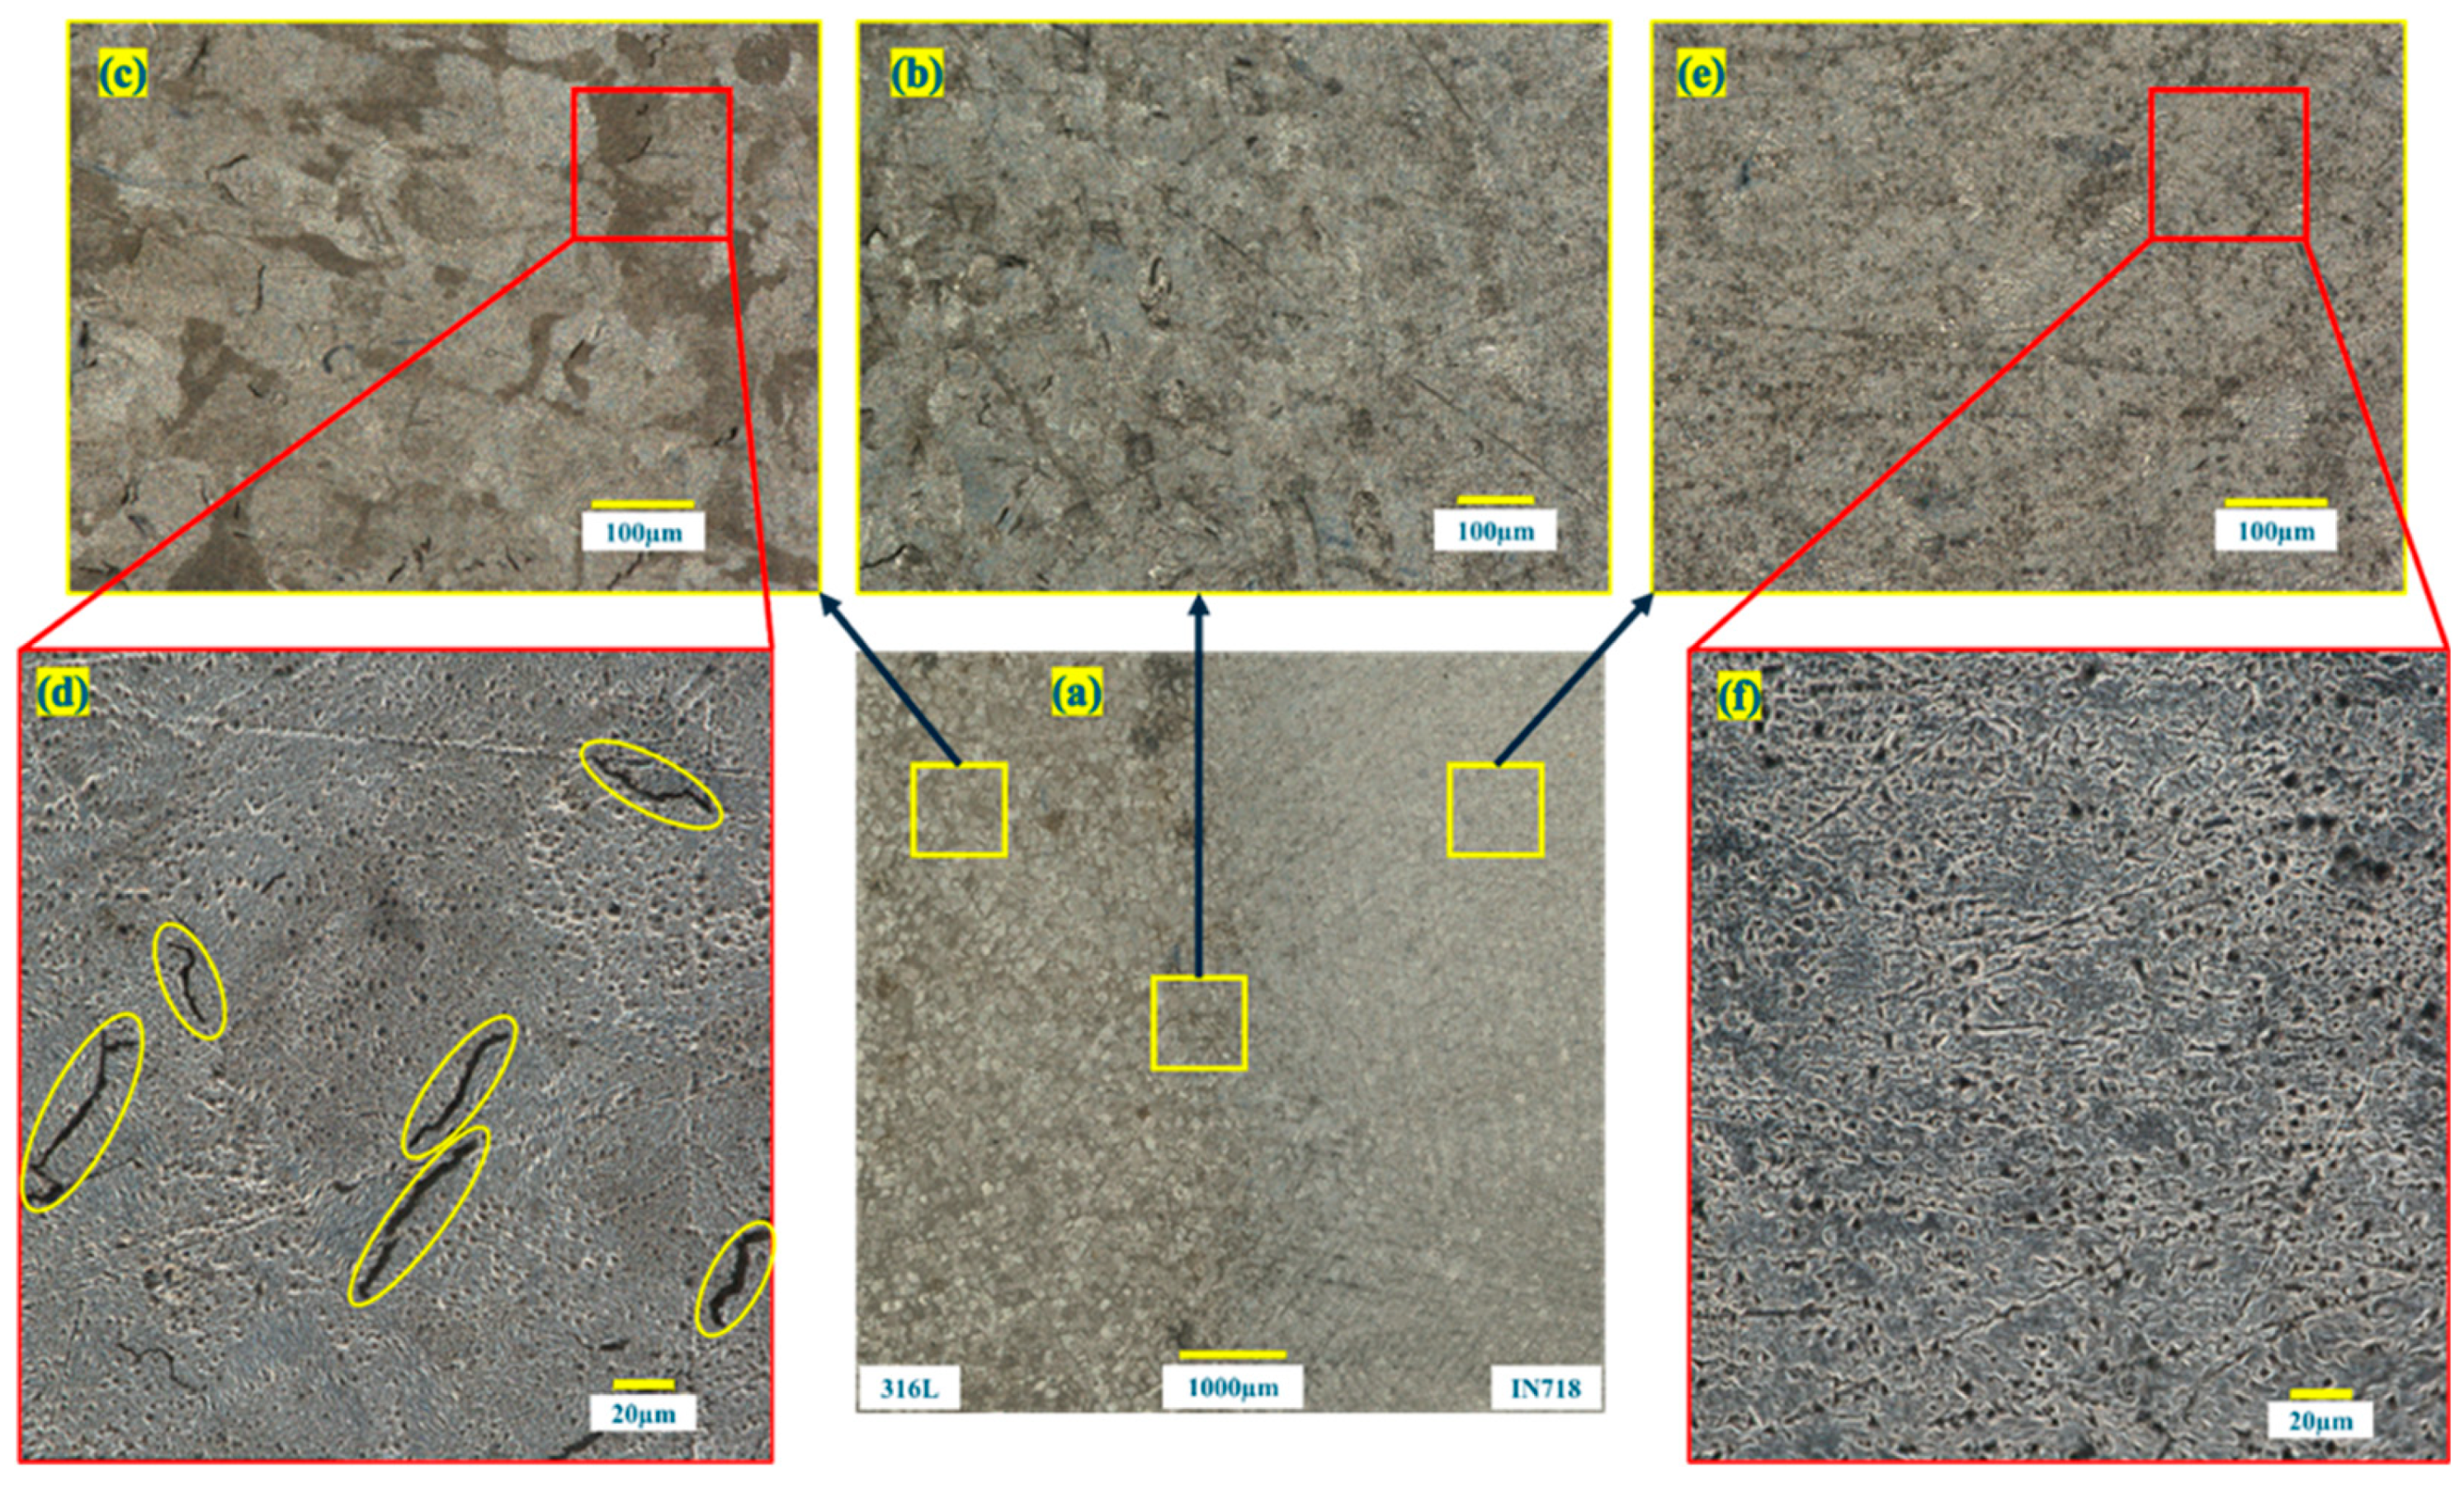
Figure 16 illustrates the microstructure at various levels of the multi-material 316L–IN718 sample. The left images, (c) and (d), correspond to the microstructure and grain structure of the 316L section, while the right images, (e) and (f), depict the microstructure and grains of the IN718 section. It is evident from the images that the 316L section exhibits large, equiaxed grains, as seen in images (a) and (c), whereas the IN718 section displays a dendritic columnar grain structure, as observed in image (f). The equiaxed grain structure in 316L suggests relatively uniform solidification, leading to isotropic mechanical properties. In contrast, the dendritic columnar grain structure in IN718 is indicative of a directional solidification process.
Under higher magnification, cracks measuring ~50 µm in length and dark lines inside rounded yellow highlights in Figure 16d were observed in the 316L section of the sample with no macroscopic evidence of segregation. Formation of these cracks is likely influenced by the following factors. Micron-sized secondary-phase particles, such as metal monocarbides, may contribute to crack development during fabrication and affect microhardness in the 316L. These stable monocarbides form due to reactions between carbon and carbide-forming elements like chromium and molybdenum in the powder alloy, especially during high-temperature fabrication. Factors such as cooling rates, thermal gradients, and local compositional variations can influence the precipitation and distribution of these monocarbides within the microstructure [35]. Uneven internal stress distribution and increased porosity under specific processing conditions could further promote cracking. The grain structure and discrete boundaries may weaken mechanical properties and deformation behavior, acting as crack initiation sites. Cracks are also likely caused by differences in solidification rates during cooling, leading to thermal stress-induced cracking [31,34].
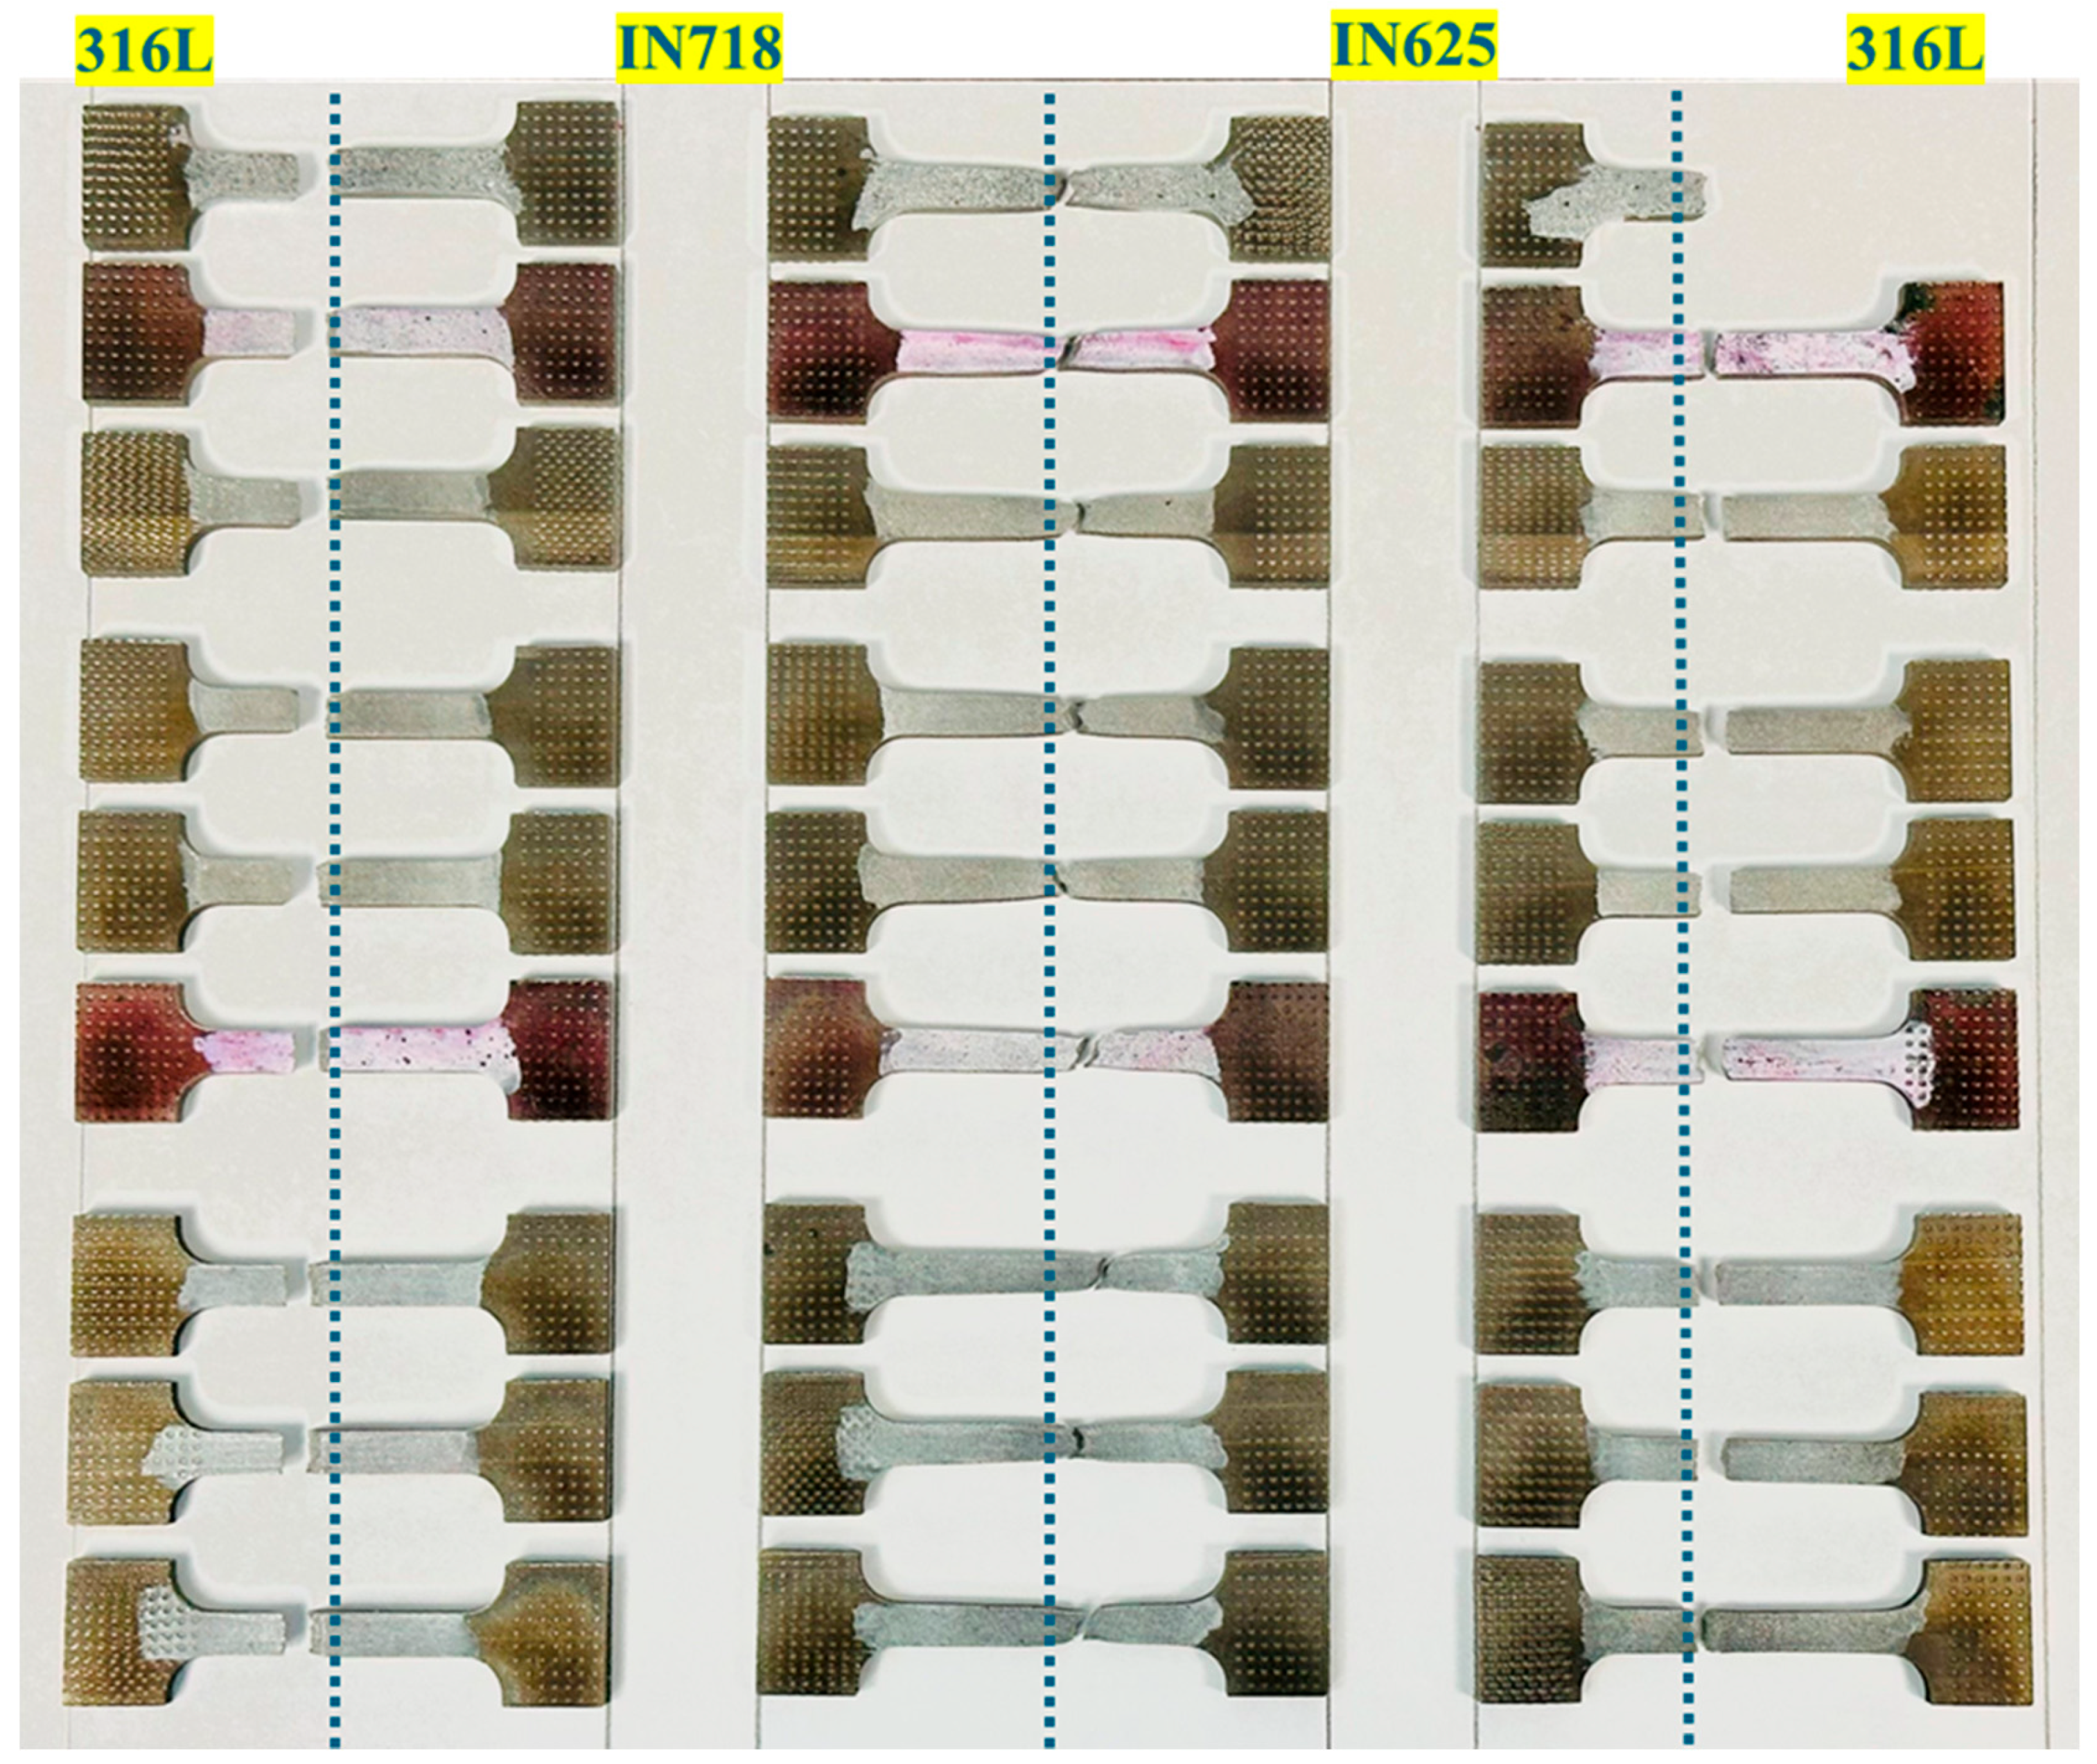
Figure 17 shows the sample fracture surfaces and location after tensile testing. The sample gauge length sections are speckled from the DIC measurements, and the blue dotted vertical lines across the broken samples indicate the approximate interface region. The metal material on the left side of the dotted line is labeled at the top-left of the column, while the metal on the right is marked at the top-right. The figure clearly shows the failure patterns of multi-material samples. Regardless of scan strategy, the specimens consistently failed within the weaker of the two materials (316L or IN625). The failure location was typically found to reside just outside the beginning of the transition zone, as determined by microhardness and optical imaging of etched specimens.
For example, 316L–IN718 samples failed just to the left of the dotted line, near the interface on the 316L side. Similarly, IN718–IN625 samples failed to the right of the dotted line, close to the interface on the IN625 side. In the case of IN625–316L samples, failure occurred to the right of the dotted line, close to the interface on the 316L side. Although the interface region was originally designed to be centered in the gauge to ensure symmetry, post-build it was noted that for the IN625–316L samples, the interface shifted left toward the IN625 zone. This minor shift can be explained by small deviations in the physical bin geometry (effect of the bin partition wall thickness) and placement of the bin with respect to the modeled build part layout.

4. Conclusions

This study successfully fabricated multi-material combinations of 316L–IN718, IN718–IN625, and IN625–316L, all in a single L-PBF build. Subsequent interfacial transition characteristics and mechanical testing of these were performed. Conclusions of results can be summarized as follows:
  • The ultimate tensile strength (UTS) and overall mechanical performance of multi-material L-PBF samples were comparable across different scanned energy density conditions. This suggests that a strong, reliable multi-material joint can be achieved in L-PBF in a single build by adjusting laser parameters and scanning strategies, supporting the effectiveness of the binning method for producing multi-material samples.
  • UTS values of the multi-material samples were found to closely match those of the lower-strength constituent material—specifically 316L in the 316L–IN718 and IN625–316L combinations. In contrast, the UTS of the IN718–IN625 sample was measured to fall between the UTS values of its individual components, exceeding the UTS of the weaker material, IN625.
  • Throughout the interface region, hardness testing results show a diffuse transition zone between materials averaging 1.5–2.0 mm in length.
  • Rescanning the sample with 50% and 100% energy density did not significantly change the interface failure strength, although some small changes were noticed. Due to the overlapping processing parameter window for these specific 316L and Inconel metallic powders, a single scan using the simplified parameter set was able to reach properties closely matching those reported in the literature, eliminating the time and preparation efforts needed associated with more elaborate rescan strategies.
  • The failure initiation location for all specimens was consistently located within the weaker material, at the beginning or before the start of the transition zone.
Thus, mechanical testing and properties of additively manufactured metal samples via L-PBF are influenced by a myriad of factors, including processing parameters, microstructural characteristics, build orientation, and material composition. As research in this field progresses, a deeper understanding of these variables will enhance the ability to optimize the mechanical performance of L-PBF components, paving the way for their broader adoption in high-performance applications. Despite these advancements, several challenges remain in the interfacial testing of multi-material AM metal samples. Standardized testing methodologies are lacking, making it difficult to compare results across different studies. Additionally, complex geometries and small-scale features inherent to AM parts pose difficulties in sample preparation and testing. There is also a need for in situ monitoring techniques that can provide real-time feedback from the build plate during the manufacturing process to detect and address interfacial defects as they arise.
Therefore, while multi-material metal additive manufacturing offers significant potential to produce components with tailored properties, ensuring the integrity of material interfaces is paramount. Continued research into interfacial testing methods and the underlying factors affecting interfacial quality is essential to unlock the full benefits of this transformative technology.

Author Contributions

Conceptualization, S.N. and T.A.B.; methodology, S.N. and T.A.B.; validation, T.A.B.; formal analysis, S.N. and B.S.D.; investigation, S.N., B.S.D., and J.D.G.; resources, S.N. and T.A.B.; data curation, S.N.; writing—original draft preparation, S.N.; writing—review and editing, S.N. and T.A.B.; supervision, J.D.G. and T.A.B.; funding acquisition, T.A.B. All authors have read and agreed to the published version of the manuscript.

Funding

This research was funded by the National Science Foundation (NSF), grant number 2216352, and the Department of Energy (DOE), grant number 00011197.

Data Availability Statement

The data presented in the study and supporting discussion and conclusions of this article will be made available by the authors on request.

Acknowledgments

The authors gratefully acknowledge financial support from the National Science Foundation and Department of Energy. Any opinions, findings, and conclusions or recommendations expressed in this material are those of the authors and do not necessarily reflect views of NSF and DOE. We also acknowledge technical assistance from the dedicated staff at the Additive Manufacturing Institute of Science and Technology (AMIST) at the University of Louisville for their unwavering support, expert guidance, and access to AM equipment and resources.

Conflicts of Interest

The authors declare no conflicts of interest.

Abbreviations

The following abbreviations are used in this manuscript:
AMAdditive Manufacturing
L-PBFLaser Powder Bed Fusion
MMAMMulti-material Additive Manufacturing
DEDDirect Energy Deposition
VEDVolumetric Energy Density
316LStainless steel 316 alloy
IN718Inconel 718 alloy
IN625Inconel 625 alloy
FRHHall Flow Rate
SEMScanning Electron Microscopy
EDXEnergy Dispersive X-Ray Spectroscopy

References

  1. Bandyopadhyay, A.; Heer, B. Additive manufacturing of multi-material structures. Mater. Sci. Eng. R Rep. 2018, 129, 1–16. [Google Scholar] [CrossRef]
  2. Wei, C.; Li, L.; Zhang, X.; Chueh, Y.-H. 3D printing of multiple metallic materials via modified selective laser melting. CIRP Ann. 2018, 67, 245–248. [Google Scholar] [CrossRef]
  3. Wei, C.; Zhang, Z.; Cheng, D.; Sun, Z.; Zhu, M.; Li, L. An overview of laser-based multiple metallic material additive manufacturing: From macro- to micro-scales. Int. J. Extrem. Manuf. 2021, 3, 012003. [Google Scholar] [CrossRef]
  4. Borisov, E.; Polozov, I.; Starikov, K.; Popovich, A.; Sufiiarov, V. Structure and Properties of Ti/Ti64 Graded Material Manufactured by Laser Powder Bed Fusion. Materials 2021, 14, 6140. [Google Scholar] [CrossRef]
  5. Wei, C.; Li, L. Recent progress and scientific challenges in multi-material additive manufacturing via laser-based powder bed fusion. Virtual Phys. Prototyp. 2021, 16, 347–371. [Google Scholar] [CrossRef]
  6. Han, D.; Lee, H. Recent advances in multi-material additive manufacturing: Methods and applications. Curr. Opin. Chem. Eng. 2020, 28, 158–166. [Google Scholar] [CrossRef]
  7. Walker, J.; Middendorf, J.R.; Lesko, C.C.C.; Gockel, J. Multi-material laser powder bed fusion additive manufacturing in 3-dimensions. Manuf. Lett. 2022, 31, 74–77. [Google Scholar] [CrossRef]
  8. Hasanov, S.; Alkunte, S.; Rajeshirke, M.; Gupta, A.; Huseynov, O.; Fidan, I.; Alifui-Segbaya, F.; Rennie, A. Review on Additive Manufacturing of Multi-Material Parts: Progress and Challenges. J. Manuf. Mater. Process. 2022, 6, 4. [Google Scholar] [CrossRef]
  9. Wu, Z.; Wilson-Heid, A.E.; Griffiths, R.J.; Elton, E.S. A review on experimentally observed mechanical and microstructural characteristics of interfaces in multi-material laser powder bed fusion. Front. Mech. Eng. 2023, 9, 1087021. [Google Scholar] [CrossRef]
  10. Nazir, A.; Gokcekaya, O.; Md Masum Billah, K.; Ertugrul, O.; Jiang, J.; Sun, J.; Hussain, S. Multi-material additive manufacturing: A systematic review of design, properties, applications, challenges, and 3D printing of materials and cellular metamaterials. Mater. Des. 2023, 226, 111661. [Google Scholar] [CrossRef]
  11. Razzaq, S.; Pan, Z.X.; Li, H.J.; Ringer, S.P.; Liao, X.Z. Joining dissimilar metals by additive manufacturing: A review. J. Mater. Res. Technol. 2024, 31, 2820–2845. [Google Scholar] [CrossRef]
  12. Verma, A.; Kapil, A.; Klobčar, D.; Sharma, A. A Review on Multiplicity in Multi-Material Additive Manufacturing: Process, Capability, Scale, and Structure. Materials 2023, 16, 5246. [Google Scholar] [CrossRef]
  13. Demir, A.G.; Previtali, B. Multi-material selective laser melting of Fe/Al-12Si components. Manuf. Lett. 2017, 11, 8–11. [Google Scholar] [CrossRef]
  14. Arivazhagan, N.; Singh, S.; Prakash, S.; Reddy, G.M. Investigation on AISI 304 austenitic stainless steel to AISI 4140 low alloy steel dissimilar joints by gas tungsten arc, electron beam and friction welding. Mater. Des. 2011, 32, 3036–3050. [Google Scholar] [CrossRef]
  15. Li, J.; Li, H.; Huang, C.; Xiang, T.; Ni, Y.; Wei, H. Welding process characteristics of pulse on pulse MIG arc brazing of aluminum alloy to stainless steel. Int. J. Adv. Manuf. Technol. 2017, 91, 1057–1067. [Google Scholar] [CrossRef]
  16. Taban, E.; Gould, J.E.; Lippold, J.C. Dissimilar friction welding of 6061-T6 aluminum and AISI 1018 steel: Properties and microstructural characterization. Mater. Des. 2010, 31, 2305–2311. [Google Scholar] [CrossRef]
  17. Liyanage, T.; Kilbourne, J.; Gerlich, A.P.; North, T.H. Joint formation in dissimilar Al alloy/steel and Mg alloy/steel friction stir spot welds. Sci. Technol. Weld. Join. 2009, 14, 500–508. [Google Scholar] [CrossRef]
  18. Pardal, G.; Meco, S.; Ganguly, S.; Williams, S.; Prangnell, P. Dissimilar metal laser spot joining of steel to aluminium in conduction mode. Int. J. Adv. Manuf. Technol. 2014, 73, 365–373. [Google Scholar] [CrossRef]
  19. Mehrpouya, M.; Gisario, A.; Broggiato, G.B.; Puopolo, M.; Vesco, S.; Barletta, M. Effect of welding parameters on functionality of dissimilar laser-welded NiTi superelastic (SE) to shape memory effect (SME) wires. Int. J. Adv. Manuf. Technol. 2019, 103, 1593–1601. [Google Scholar] [CrossRef]
  20. Mehrpouya, M.; Gisario, A.; Barletta, M.; Natali, S.; Veniali, F. Dissimilar Laser Welding of NiTi Wires. Lasers Manuf. Mater. Process. 2019, 6, 99–112. [Google Scholar] [CrossRef]
  21. Yang, J.; Chen, J.; Zhao, W.; Zhang, P.; Yu, Z.; Li, Y.; Zeng, Z.; Zhou, N. Diode Laser Welding/Brazing of Aluminum Alloy to Steel Using a Nickel Coating. Appl. Sci. 2018, 8, 922. [Google Scholar] [CrossRef]
  22. Tomashchuk, I.; Grevey, D.; Sallamand, P. Dissimilar laser welding of AISI 316L stainless steel to Ti6–Al4–6V alloy via pure vanadium interlayer. Mater. Sci. Eng. A 2015, 622, 37–45. [Google Scholar] [CrossRef]
  23. Uhlmann, E.; Saber, Y. Mechanical properties of steel–copper multi-material samples built by laser powder bed fusion using a graded energy input. Prog. Addit. Manuf. 2025, 10, 475–489. [Google Scholar] [CrossRef]
  24. Rankouhi, B.; Jahani, S.; Pfefferkorn, F.E.; Thoma, D.J. Compositional grading of a 316L-Cu multi-material part using machine learning for the determination of selective laser melting process parameters. Addit. Manuf. 2021, 38, 101836. [Google Scholar] [CrossRef]
  25. Chen, K.; Wang, C.; Hong, Q.; Wen, S.; Zhou, Y.; Yan, C.; Shi, Y. Selective laser melting 316L/CuSn10 multi-materials: Processing optimization, interfacial characterization and mechanical property. J. Mater. Process. Technol. 2020, 283, 116701. [Google Scholar] [CrossRef]
  26. Chen, J.; Yang, Y.; Song, C.; Zhang, M.; Wu, S.; Wang, D. Interfacial microstructure and mechanical properties of 316L/CuSn10 multi-material bimetallic structure fabricated by selective laser melting. Mater. Sci. Eng. A 2019, 752, 75–85. [Google Scholar] [CrossRef]
  27. Zhang, M.; Yang, Y.; Wang, D.; Song, C.; Chen, J. Microstructure and mechanical properties of CuSn/18Ni300 bimetallic porous structures manufactured by selective laser melting. Mater. Des. 2019, 165, 107583. [Google Scholar] [CrossRef]
  28. Scaramuccia, M.G.; Demir, A.G.; Caprio, L.; Tassa, O.; Previtali, B. Development of processing strategies for multigraded selective laser melting of Ti6Al4V and IN718. Powder Technol. 2020, 367, 376–389. [Google Scholar] [CrossRef]
  29. Bartolomeu, F.; Costa, M.M.; Alves, N.; Miranda, G.; Silva, F.S. Additive manufacturing of NiTi-Ti6Al4V multi-material cellular structures targeting orthopedic implants. Opt. Lasers Eng. 2020, 134, 106208. [Google Scholar] [CrossRef]
  30. Khaimovich, A.; Erisov, Y.; Smelov, V.; Agapovichev, A.; Petrov, I.; Razhivin, V.; Bobrovskij, I.; Kokareva, V.; Kuzin, A. Interface Quality Indices of Al–10Si–Mg Aluminum Alloy and Cr18–Ni10–Ti Stainless-Steel Bimetal Fabricated via Selective Laser Melting. Metals 2021, 11, 172. [Google Scholar] [CrossRef]
  31. Mohd Yusuf, S.; Mazlan, N.; Musa, N.H.; Zhao, X.; Chen, Y.; Yang, S.; Nordin, N.A.; Mazlan, S.A.; Gao, N. Microstructures and Hardening Mechanisms of a 316L Stainless Steel/Inconel 718 Interface Additively Manufactured by Multi-Material Selective Laser Melting. Metals 2023, 13, 400. [Google Scholar] [CrossRef]
  32. Mohd Yusuf, S.; Zhao, X.; Yang, S.; Gao, N. Interfacial characterisation of multi-material 316L stainless steel/Inconel 718 fabricated by laser powder bed fusion. Mater. Lett. 2021, 284, 128928. [Google Scholar] [CrossRef]
  33. Ureña, J.; Alvarez-Leal, M. Microstructural and hardness characterization of stainless steel 316-Inconel 718 multimaterial developed by wire-based Directed Energy Deposition. Int. J. Adv. Manuf. Technol. 2024, 135, 2975–2986. [Google Scholar] [CrossRef]
  34. Chen, Y.-X.; Qiu, J.-R.; Chang, W.-L.; Hwang, Y.-K.; Hwang, S.-J. Process optimization and mechanical properties analysis of Inconel 718/stainless steel 316 L multi-material via direct energy deposition. Sci. Rep. 2024, 14, 28927. [Google Scholar] [CrossRef] [PubMed]
  35. Carroll, B.E.; Otis, R.A.; Borgonia, J.P.; Suh, J.-O.; Dillon, R.P.; Shapiro, A.A.; Hofmann, D.C.; Liu, Z.-K.; Beese, A.M. Functionally graded material of 304L stainless steel and inconel 625 fabricated by directed energy deposition: Characterization and thermodynamic modeling. Acta Mater. 2016, 108, 46–54. [Google Scholar] [CrossRef]
  36. Bodner, S.C.; Hlushko, K.; van de Vorst, L.T.G.; Meindlhumer, M.; Todt, J.; Nielsen, M.A.; Hooijmans, J.W.; Saurwalt, J.J.; Mirzaei, S.; Keckes, J. Graded Inconel-stainless steel multi-material structure by inter- and intralayer variation of metal alloys. J. Mater. Res. Technol. 2022, 21, 4846–4859. [Google Scholar] [CrossRef]
  37. Ferro, P.; Fabrizi, A.; Elsayed, H.; Savio, G. Multi-Material Additive Manufacturing: Creating IN718-AISI 316L Bimetallic Parts by 3D Printing, Debinding, and Sintering. Sustainability 2023, 15, 11911. [Google Scholar] [CrossRef]
  38. Duval-Chaneac, M.S.; Gao, N.; Khan, R.H.U.; Giles, M.; Georgilas, K.; Zhao, X.; Reed, P.A.S. Fatigue crack growth in IN718/316L multi-materials layered structures fabricated by laser powder bed fusion. Int. J. Fatigue 2021, 152, 106454. [Google Scholar] [CrossRef]
  39. Mahmud, A.; Ayers, N.; Huynh, T.; Sohn, Y. Additive Manufacturing of SS316L/IN718 Bimetallic Structure via Laser Powder Bed Fusion. Materials 2023, 16, 6527. [Google Scholar] [CrossRef]
  40. Ramkumar, T.; Selvakumar, M.; Narayanasamy, P.; Begam, A.A.; Mathavan, P.; Raj, A.A. Studies on the structural property, mechanical relationships and corrosion behaviour of Inconel 718 and SS 316L dissimilar joints by TIG welding without using activated flux. J. Manuf. Process. 2017, 30, 290–298. [Google Scholar] [CrossRef]
  41. Hinojos, A.; Mireles, J.; Reichardt, A.; Frigola, P.; Hosemann, P.; Murr, L.E.; Wicker, R.B. Joining of Inconel 718 and 316 Stainless Steel using electron beam melting additive manufacturing technology. Mater. Des. 2016, 94, 17–27. [Google Scholar] [CrossRef]
  42. Pratheesh Kumar, S.; Elangovan, S.; Mohanraj, R.; Ramakrishna, J.R. A review on properties of Inconel 625 and Inconel 718 fabricated using direct energy deposition. Mater. Today Proc. 2021, 46, 7892–7906. [Google Scholar] [CrossRef]
  43. Shahwaz, M.; Nath, P.; Sen, I. A critical review on the microstructure and mechanical properties correlation of additively manufactured nickel-based superalloys. J. Alloys Compd. 2022, 907, 164530. [Google Scholar] [CrossRef]
  44. Rehman, A.U.; Kishore Babu, N.; Talari, M.K.; Anwar, S.; Usmani, Y.; Al-Samhan, A.M. Dissimilar Rotary Friction Welding of Inconel 718 to F22 Using Inconel 625 Interlayer. Appl. Sci. 2021, 11, 10684. [Google Scholar] [CrossRef]
  45. Rodrigues, T.A.; Cipriano Farias, F.W.; Avila, J.A.; Maawad, E.; Schell, N.; Santos, T.G.; Oliveira, J.P. Effect of heat treatments on Inconel 625 fabricated by wire and arc additive manufacturing: An in situ synchrotron X-ray diffraction analysis. Sci. Technol. Weld. Join. 2023, 28, 534–539. [Google Scholar] [CrossRef]
  46. Evangeline, A.; Sathiya, P. Dissimilar Cladding of Ni–Cr–Mo Superalloy over 316L Austenitic Stainless Steel: Morphologies and Mechanical Properties. Met. Mater. Int. 2021, 27, 1155–1172. [Google Scholar] [CrossRef]
  47. Chen, N.; Khan, H.A.; Wan, Z.; Lippert, J.; Sun, H.; Shang, S.-L.; Liu, Z.-K.; Li, J. Microstructural characteristics and crack formation in additively manufactured bimetal material of 316L stainless steel and Inconel 625. Addit. Manuf. 2020, 32, 101037. [Google Scholar] [CrossRef]
  48. Kourdani, A.; Derakhshandeh-Haghighi, R. Evaluating the Properties of Dissimilar Metal Welding Between Inconel 625 and 316L Stainless Steel by Applying Different Welding Methods and Consumables. Metall. Mater. Trans. A 2018, 49, 1231–1243. [Google Scholar] [CrossRef]
  49. Zheng, Y.; Xiong, R.; Zhao, Z.; Zhao, C.; Wang, Z.; Niu, W.; Xue, H.; Cheng, F.; Liu, W.; Wei, S. Laser melting deposition of in-situ (TiB+TiC) hybrid reinforced TC4 composites: Preparation, microstructure and room/high-temperature corrosion behaviour. J. Mater. Sci. Technol. 2025, 228, 137–154. [Google Scholar] [CrossRef]
  50. Dutkiewicz, J.; Rogal, Ł.; Kalita, D.; Berent, K.; Antoszewski, B.; Danielewski, H.; Węglowski, M.S.; Łazińska, M.; Durejko, T.; Czujko, T. Microstructure and Properties of Inconel 625 Fabricated Using Two Types of Laser Metal Deposition Methods. Materials 2020, 13, 5050. [Google Scholar] [CrossRef]
  51. Kaščák, Ľ.; Varga, J.; Bidulská, J.; Bidulský, R.; Kvačkaj, T. A Review of Simulation Tools Utilization for the Process of Laser Powder Bed Fusion. Materials 2025, 18, 895. [Google Scholar] [CrossRef]
  52. Beeravolu, A.R.; Babu, N.K.; Talari, M.K.; Rehman, A.U.; Srirangam, P. Influence of Microstructure and Mechanical Properties of Dissimilar Rotary Friction Welded Inconel to Stainless Steel Joints. Materials 2023, 16, 3049. [Google Scholar] [CrossRef] [PubMed]
  53. Chozaki, S.P.; Piili, H.; Afkhami, S.; Amraei, M.; Salminen, A. Investigation of the microstructure and mechanical properties of dissimilar joints of PBF-LB/IN718 to AISI 316L by laser welding. Weld. World 2025, 69, 1829–1845. [Google Scholar] [CrossRef]
  54. Dokme, F.; Kulekci, M.K.; Esme, U. Microstructural and Mechanical Characterization of Dissimilar Metal Welding of Inconel 625 and AISI 316L. Metals 2018, 8, 797. [Google Scholar] [CrossRef]
  55. Tyagi, S.; Balla, S.K.; Manjaiah, M.; Aranas, C. Microstructure and mechanical properties of stainless steel 316L-Inconel 625 bimetallic structure fabricated by laser wire direct energy deposition. J. Mater. Res. Technol. 2024, 33, 8361–8371. [Google Scholar] [CrossRef]
  56. Paraschiv, A.; Matache, G.; Constantin, N.; Vladut, M. Investigation of Scanning Strategies and Laser Remelting Effects on Top Surface Deformation of Additively Manufactured IN 625. Materials 2022, 15, 3198. [Google Scholar] [CrossRef]
  57. Ravichander, B.B.; Jagdale, S.H.; Kumar, G. Interpenetrating microstructure in laser powder-bed fusion parts using selective rescanning. Addit. Manuf. Lett. 2024, 10, 100221. [Google Scholar] [CrossRef]
  58. Jiang, R.; Yang, Y.; Wang, H.; Liu, Z.; Liu, L.; Du, J.; Tang, T.; Ye, Z.; Li, Q.; Yan, X.; et al. Effects of remelting scan strategy on the overlapping quality of 316L stainless steel fabricated by multi-laser powder bed fusion. Mater. Sci. Eng. A 2025, 923, 147725. [Google Scholar] [CrossRef]
  59. Thijs, L.; Montero Sistiaga, M.L.; Wauthle, R.; Xie, Q.; Kruth, J.-P.; Van Humbeeck, J. Strong morphological and crystallographic texture and resulting yield strength anisotropy in selective laser melted tantalum. Acta Mater. 2013, 61, 4657–4668. [Google Scholar] [CrossRef]
  60. Brooks, N.; Porter, L.; Vaseghi, M.; Palazotto, A.; Davami, K. Mechanical, Morphological, and Microstructural Characterization of Additively Manufactured Inconel 718 After Laser Surface Remelting at Different Scan Speeds. Metall. Mater. Trans. A 2022, 53, 4471–4480. [Google Scholar] [CrossRef]
  61. Liang, A.; Pey, K.S.; Polcar, T.; Hamilton, A.R. Effects of rescanning parameters on densification and microstructural refinement of 316L stainless steel fabricated by laser powder bed fusion. J. Mater. Process. Technol. 2022, 302, 117493. [Google Scholar] [CrossRef]
  62. Hasanabadi, M.; Keshavarzkermai, A.; Asgari, H.; Azizi, N.; Gerlich, A.; Toyserkani, E. In-situ microstructure control by laser post-exposure treatment during laser powder-bed fusion. Addit. Manuf. Lett. 2023, 4, 100110. [Google Scholar] [CrossRef]
  63. Tan, Z.; Gao, S.; Lan, L.; He, B. Effect of Rescanning Strategy on Residual Stress and Distortion of Two Alloys Manufactured by Selective Laser Melting. J. Mater. Eng. Perform. 2021, 30, 6493–6501. [Google Scholar] [CrossRef]
  64. Chen, L.; Richter, B.; Zhang, X.; Bertsch, K.B.; Thoma, D.J.; Pfefferkorn, F.E. Effect of laser polishing on the microstructure and mechanical properties of stainless steel 316L fabricated by laser powder bed fusion. Mater. Sci. Eng. A 2021, 802, 140579. [Google Scholar] [CrossRef]
  65. Park, J.H.; Bang, G.B.; Lee, K.-A.; Son, Y.; Kim, W.R.; Kim, H.G. Effect on microstructural and mechanical properties of Inconel 718 superalloy fabricated by selective laser melting with rescanning by low energy density. J. Mater. Res. Technol. 2021, 10, 785–796. [Google Scholar] [CrossRef]
  66. Carpenter Additive. PowderRange® 316L DataSheet. Available online: https://www.carpenteradditive.com/hubfs/Resources/datasheets%202023/PowderRange_316L_Datasheet.pdf (accessed on 11 August 2024).
  67. Linde. TruForm™ 718 Metal Powder. Available online: https://assets.linde.com/-/media/global/advanced-material-technologies/advanced-material-technologies/literature/40-4219_truform_718_amt_web.pdf (accessed on 2 October 2024).
  68. EOS GmbH. EOS NickelAlloy IN625. Available online: https://www.eos.info/var/assets/03_system-related-assets/material-related-contents/metal-materials-and-examples/metal-material-datasheet/nickelalloy-inconel/niall-in625-m290_material_data_sheet_06-22_en.pdf (accessed on 28 February 2025).
  69. ASTM B213-20; Standard Test Methods for Flow Rate of Metal Powders Using the Hall Flowmeter Funnel. ASTM International: West Conshohocken, PA, USA, 2020.
  70. ASTM D1708-18; Standard Test Method for Tensile Properties of Plastics by Use of Microtensile Specimens. ASTM International: West Conshohocken, PA, USA, 2018.
  71. Chlebus, E.; Gruber, K.; Kuźnicka, B.; Kurzac, J.; Kurzynowski, T. Effect of heat treatment on the microstructure and mechanical properties of Inconel 718 processed by selective laser melting. Mater. Sci. Eng. A 2015, 639, 647–655. [Google Scholar] [CrossRef]
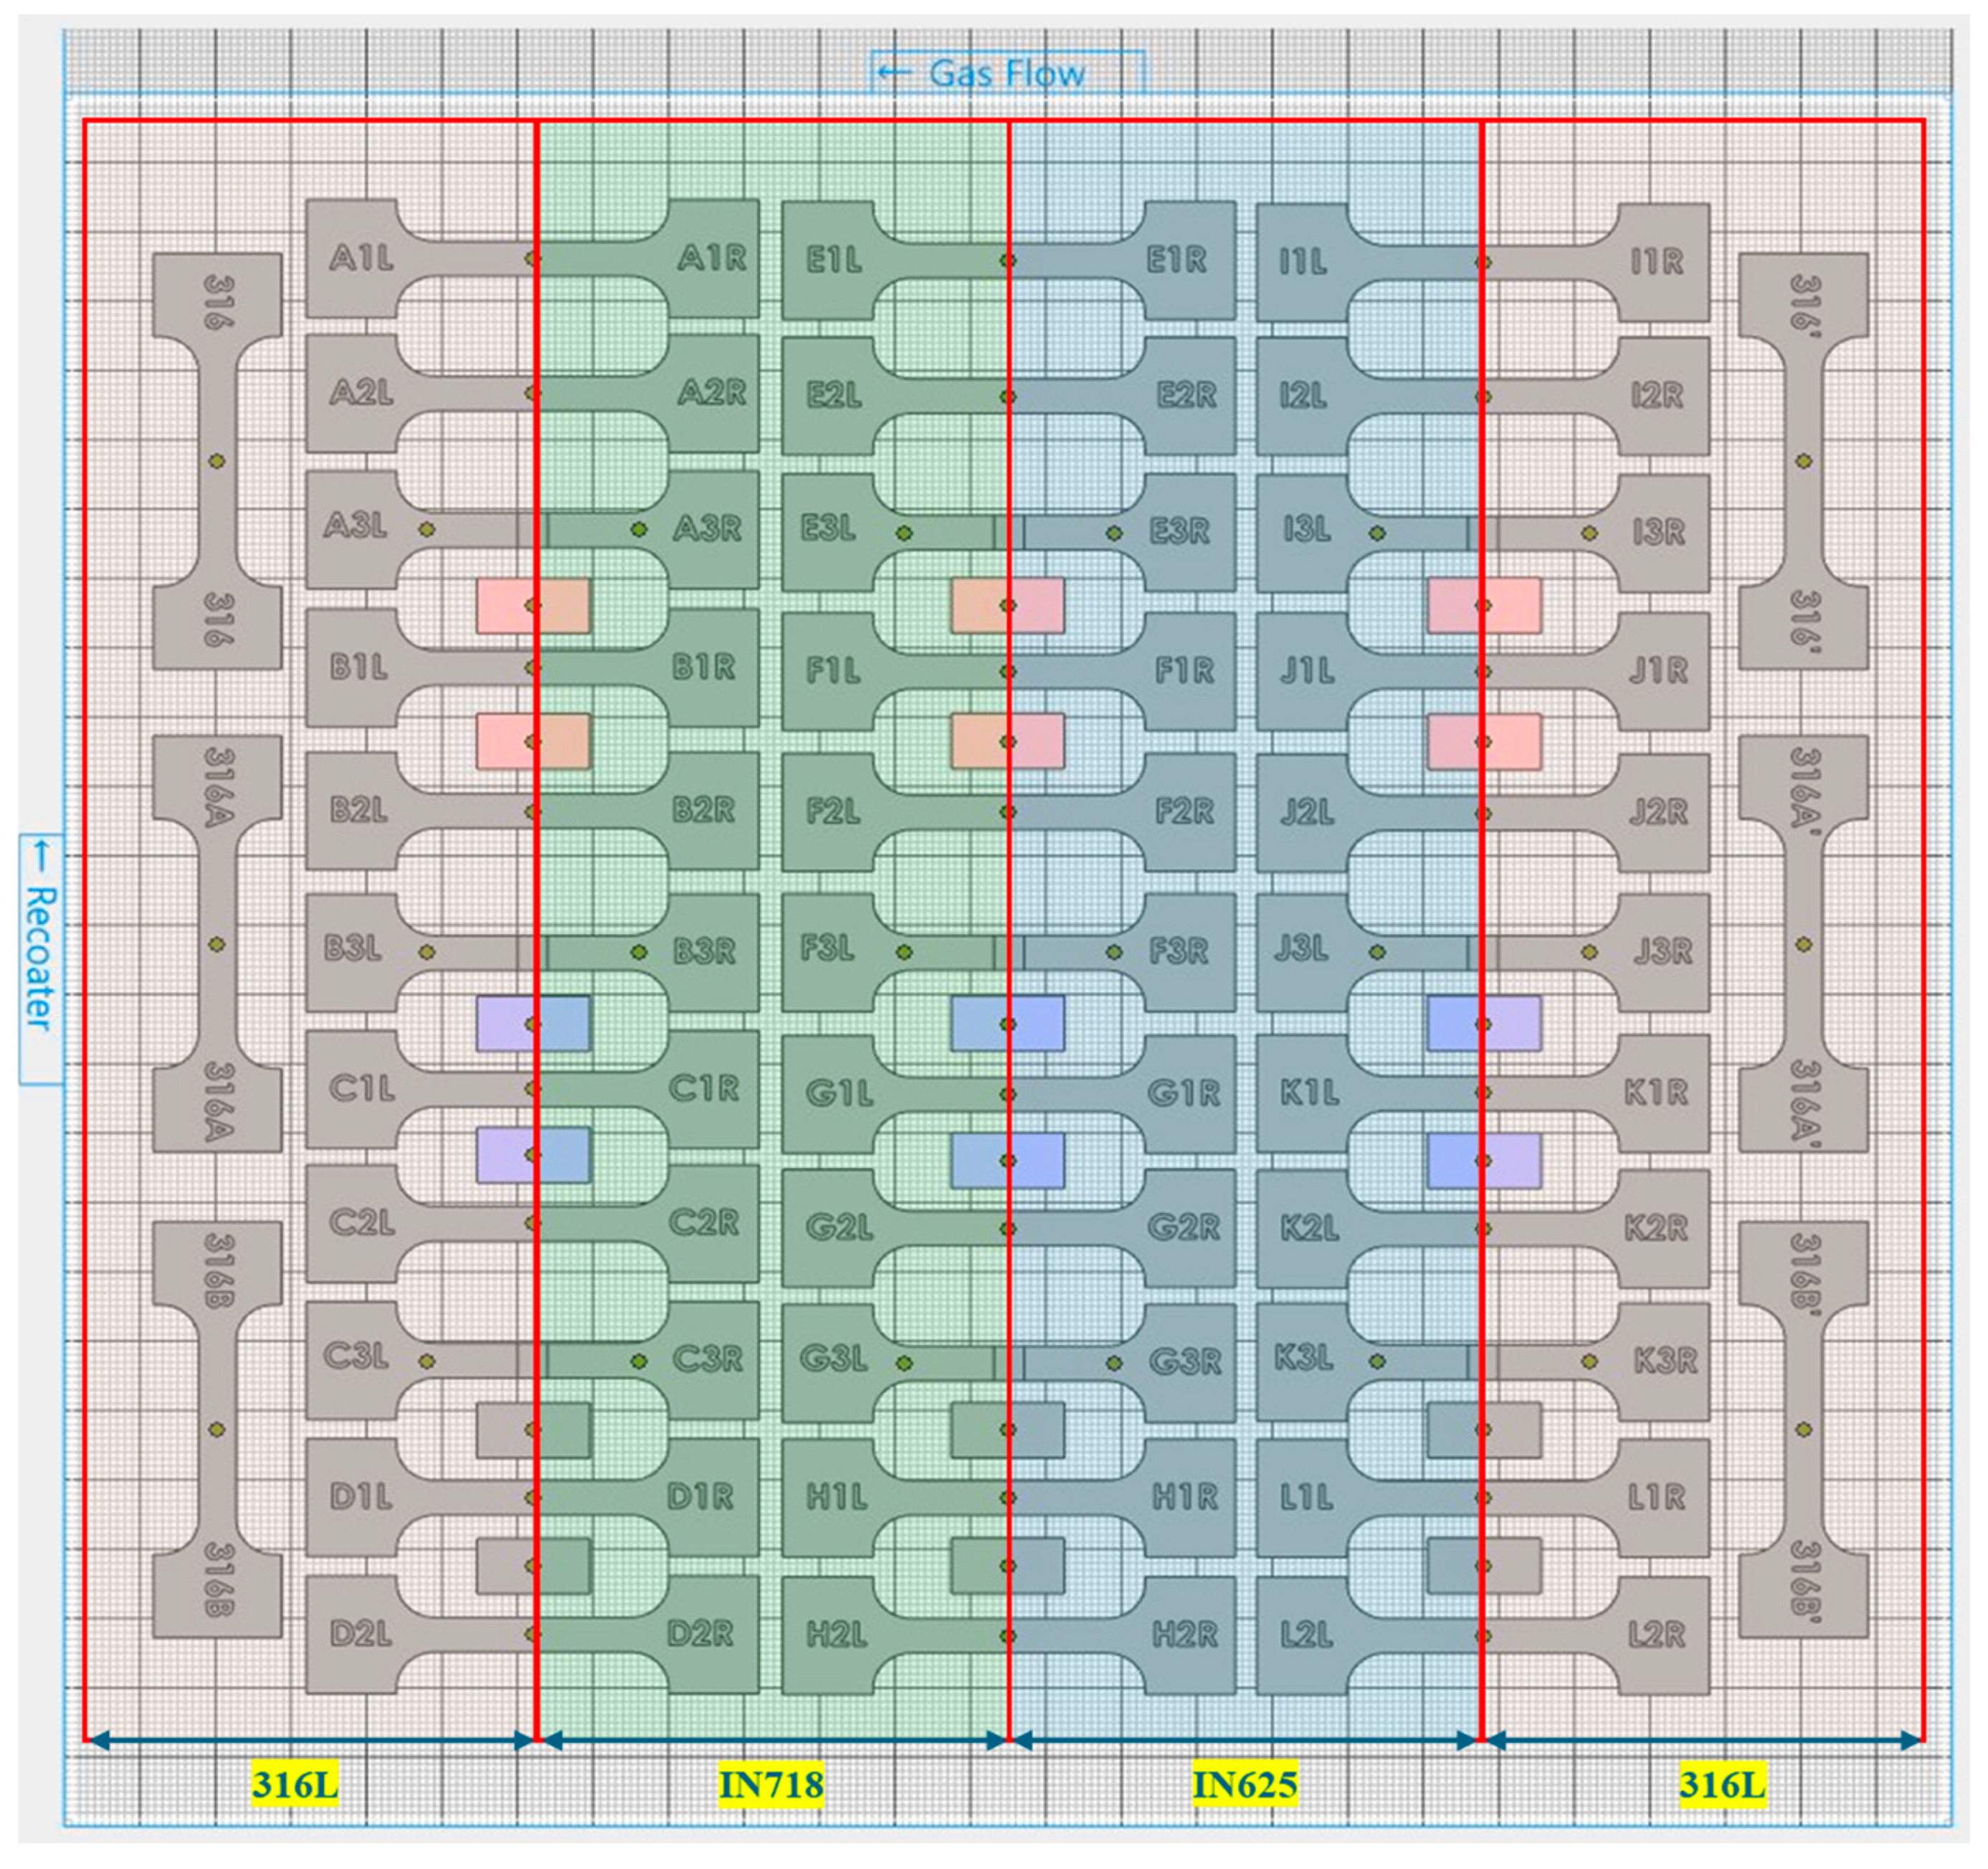
Figure 1. Specimen configuration schematic representation where the different colors denote the individual material tracks spread across the build plate.
Jmmp 09 00327 g001
Figure 2. Custom-designed 4-section polymer bin produced via fused filament fabrication.
Jmmp 09 00327 g002
Figure 3. Three-dimensional printed ABS material custom designed 4-section bin over the powder feedstock zone inside EOS M 290 machine.
Jmmp 09 00327 g003
Figure 4. Different scanning strategies used in the process of sample fabrication. (a) Scan strategy 1; (b) Scan strategy 2; (c) Scan strategy 3.
Jmmp 09 00327 g004
Figure 5. Samples on the build plate post printing (left) and tensile specimens after wire EDM removal from the build plate (right top and bottom).
Jmmp 09 00327 g005
Figure 6. DIC Test setup on sample IN718 − IN625 showing extensometers; images on the left are of a sample during load application and image on the right is a sample just after failure.
Jmmp 09 00327 g006
Figure 7. Comparison chart of ultimate tensile strength, UTS, and % Elongation for pure materials.
Jmmp 09 00327 g007
Figure 8. Stress-strain plot for sample 316L–IN718.
Jmmp 09 00327 g008
Figure 9. Stress-strain plot for sample IN718–IN625.
Jmmp 09 00327 g009
Figure 10. Stress-strain plot for sample IN625–316L.
Jmmp 09 00327 g010
Figure 11. Comparison chart of UTS values for various multi-material samples at different scan energy levels. 100% is a single scan by P1, 150% is a rescan by P2, and 200% is a P1 scan on half-half sample with 4 mm overlap.
Jmmp 09 00327 g011
Figure 12. Sample etched with Adler’s reagent showing the interface region.
Jmmp 09 00327 g012
Figure 13. Approximately 316L–IN718 sample before and after etching and the hardness plot across the sample surface.
Jmmp 09 00327 g013
Figure 14. Concentrations of major matrix elements (Ni and Fe) across the interface zone, as measured by SEM EDX.
Jmmp 09 00327 g014
Figure 15. Spatial distribution of Vickers Hardness across individual and interfacial material regions.
Jmmp 09 00327 g015
Figure 16. Microstructure images of 316L–IN718 sample. (a) sample under 40× magnification showing interface region. (b) Interface region zoomed to 400× showing transition between 316L and IN718. (c) 316L section under 400× magnification. (d) 316L section under 2000× magnification showing micro-cracks and grain structures. (e) IN718 section under 400× magnification. (f) IN718 section under 2000× magnification exposing grain structures.
Jmmp 09 00327 g016
Figure 17. Image showing most of the samples failed on the weaker metal side of the interface region.
Jmmp 09 00327 g017
Table 1. Powder compositions used in this study in wt. %.
ElementSS 316L (wt. %) [66]IN 718 (wt. %) [67]IN 625 (wt. %) [68]
FeBalance15.00–21.005.00
Cr16.00–18.0017.00–21.0023.00
Ni10.00–14.0050.00–55.00Balance
Mo2.00–3.002.80–3.3010.00
Nb-4.75–5.554.15
Ti-0.65–1.150.40
Co-1.001.00
Al-0.20–0.800.40
Mn2.000.350.50
Si1.000.350.50
S0.030.020.02
P0.050.020.02
C0.030.080.10
Ta-0.050.05
Cu-0.30-
B-0.01-
N0.10--
O0.10--
Table 2. Deposition parameters used for printing.
Laser Power (W)Scan Speed (mm/s)Layer Height (µm)
Parameter P128596040
Parameter P214596040
Table 3. VED of Parameters.
VED (J/mm3)
Parameter P1114.18
Parameter P258.09
Table 4. VED of corresponding scan strategies.
VED (J/mm3)
Scan Strategy 1Scanned by VED of 114.18 J/mm3
Scan Strategy 2Scanned by VED of 114.18 J/mm3
Rescanned by VED of 58.09 J/mm3
Scan Strategy 3Half-half section scanned by VED of 114.18 J/mm3
4 mm overlap section gets double scan of 114.18 J/mm3
Table 5. Total sample elongation % at break for various samples at different scan energy levels.
SampleTotal % Elongation at Break
100%
(All P1)
150%
(P1 + P2 Rescan)
200%
(P1 Half-Half Overlap)
316L–IN7183.042.153.11
IN718–IN62528.3127.6828.74
IN625–316L12.2811.9414.76
Disclaimer/Publisher’s Note: The statements, opinions and data contained in all publications are solely those of the individual author(s) and contributor(s) and not of MDPI and/or the editor(s). MDPI and/or the editor(s) disclaim responsibility for any injury to people or property resulting from any ideas, methods, instructions or products referred to in the content.