Article

Multi-Scale Model of Mid-Frequency Errors in Semi-Rigid Tool Polishing of Diamond-Turned Electroless Nickel Mirror

1
Institute of Precision Optic Engineering, School of Physics, Science, and Engineering, Tongji University, No. 1239 Siping Road, Shanghai 200092, China
2
School of Mechanical Engineering, Tongji University, No. 1239 Siping Road, Shanghai 200092, China
*
Author to whom correspondence should be addressed.
J. Manuf. Mater. Process. 2025, 9(10), 325; https://doi.org/10.3390/jmmp9100325
Submission received: 27 August 2025 / Revised: 25 September 2025 / Accepted: 27 September 2025 / Published: 30 September 2025

Abstract

Semi-rigid tool polishing is widely used in the high-precision manufacturing of electroless nickel surface due to its stable material removal and high efficiency in correcting mid- and high-frequency profile errors. However, predicting mid-frequency errors remains challenging due to the complexity of their underlying sources. In this study, a theoretical model for semi-rigid tool polishing was developed based on multi-scale contact theory, incorporating a bridging model, rough surface contact, and Hertzian contact mechanics. The model accounts for the effects of tool surface roughness, polishing force, and path spacing. A series of experiments on diamond-turned electroless nickel mirrors was conducted to quantitatively evaluate the model’s feasibility and accuracy. The results demonstrate that the model can effectively predict mid-frequency errors, reveal the material removal mechanisms in semi-rigid polishing, and guide the optimization of process parameters. Ultimately, a surface with mid-frequency errors of 0.59 nm Rms (measured over a 1.26 mm × 0.94 mm window) was achieved, closely matching the predicted value of 0.64 nm.

1. Introduction

Metal-, ceramic-, and composite-based reflectors—typically made of aluminum, copper, or silicon carbide—are desirable for demanding X-ray optical applications due to their long-term stability and high strength-to-weight ratio [1,2,3]. However, these applications require extremely high surface accuracy [4]. In most cases, it is not feasible to directly polish these materials to meet the required specifications [5]. To address this challenge, a layer of electroless nickel (EN) is typically applied to the surface, providing a polishable layer that enables the elimination of surface profile errors through precision finishing [6].
Surface profile errors that degrade optical performance are typically classified into three categories: (1) low-frequency errors (LFEs), which can be described by geometric optics [7]; (2) high-frequency errors (HFEs), which are governed by scattering theory [8]; and (3) mid-frequency errors (MFEs), which lie in the transitional regime between LFEs and HFEs [9]. In X-ray applications, the boundaries of LFEs and HFEs are typically defined as 1 mm−1 and 1 μm−1, respectively [10]. To meet the requirements of X-ray applications [11], the mirrors covered by EN first need to be machined with single-point diamond turning [12] to achieve low-frequency errors at the hundred-nanometer level [13], and mid-/high-frequency errors at the nanometer level [14]. Subsequently, an advanced polishing technology was used to obtain nanometer-level low-frequency errors and sub-nanometer-level mid-/high-frequency errors. Typical polishing technologies include ion-beam figuring [15], magnetorheological finishing [16], and small-tool polishing (STP). However, ion-beam figuring is ineffective at correcting mid-frequency errors (MFEs) with spatial wavelengths in the order of hundreds of micrometers [17], while magnetorheological finishing often introduces high-frequency errors (HFEs) with root-mean-square (Rms) values of several nanometers [18]. Therefore, neither method can independently complete the mirror finishing process and must be combined with STP, which is based on the principle of chemical–mechanical polishing, to effectively control both MFEs and HFEs. In the STP process, a computer-controlled polishing tool—typically spherical, wheel-shaped, or disc-shaped and smaller than the workpiece—is used to polish the entire surface [19]. These tools usually consist of a pitch layer bonded to a metal base and are capable of achieving an Rms surface roughness below 0.3 nm on electroless nickel mirrors [20]. However, the use of these rigid tools can result in surface accuracy degradation and scratches due to localized hard contact between the tool and the workpiece [21].
To address these challenges, researchers have explored the use of elastic polishing tools, which offer greater adaptability to complex surface geometries and improved surface quality compared to rigid tools [22]. Using elastic tools—such as bonnet polishing heads [23] and polishing cloth pads [24]—electroless nickel mirrors with low-frequency errors (LFEs) below 10 nm Rms and high-frequency errors (HFEs) below 0.3 nm Rms can be achieved. However, elastic tools are generally ineffective at eliminating mid-frequency errors (MFEs) with wavelengths greater than 0.1 mm. As a result, this method is typically applied after MFEs have been reduced using fluid jet polishing [25] or rigid tool polishing [26], which inevitably increases process complexity. A polishing tool that combines the MFE-correction capability of rigid tools with the shape-conforming flexibility of elastic tools is therefore essential for improving overall manufacturing efficiency.
A semi-rigid tool—comprising a rigid inner base, an elastic intermediate layer, and an elastic or rigid outer polishing layer—is a key solution for achieving the above objectives [27]. Various studies have been conducted to reduce mid- and high-frequency errors using semi-rigid tools [28]. However, most existing work is experimental in nature and primarily focuses on final polishing outcomes, with the relationship between surface roughness and polishing parameters analyzed only qualitatively. To quantitatively evaluate the influence of polishing parameters on surface quality in semi-rigid tool polishing, it is essential to first model and analyze the material removal process. During semi-rigid tool polishing, the material removal mechanism is similar to that of chemical–mechanical polishing (CMP). LFEs primarily arise from material removal at the macroscopic scale, which can be mathematically described as the convolution of the tool removal function (TRF) and the dwell time [29]. HFEs, on the other hand, result mainly from microscale interactions—specifically, the cutting action of abrasive particles and the chemical etching effect of the polishing fluid [30]. Numerous models have been developed to describe LFEs and HFEs; their predictions generally align well with experimental results. However, MFEs are influenced by both macro- and micro-scale removal processes, leading to varying interpretations of their underlying mechanisms. As a result, the modeling and controlling of MFEs remains a significant challenge [31].
Many researchers have suggested that MFEs are primarily influenced by the TRF and the polishing path. For example, Z. He et al. [32] investigated the MFEs generated by different TRF profiles and found that a Gaussian-type TRF, combined with a small path spacing, resulted in lower MFE amplitudes. Some researchers have attempted to reduce MFEs by employing randomized polishing paths [33]. H. Tam conducted both analytical and experimental studies on the influence of various tool path types on MFEs [34]. Their findings indicated that the peak-to-valley (PV) amplitude in the removal map remains essentially unchanged for a given path spacing, regardless of the specific type of tool path used. Other researchers have suggested that, in addition to the polishing path, the surface roughness of the polishing tool also contributes to mid-frequency errors. Accordingly, MFEs can be classified into two categories: PSD-1, which is associated with polishing path spacing, and PSD-2, which is related to the rough contact pressure distribution between the tool and the workpiece [35]. Several models describing tool roughness adopted the Greenwood–Williamson (GW) approach [36] to simulate rough surface contact between the tool and workpiece. In these models, asperity contact is represented based on different height distributions such as exponential [37], Gaussian [38], and periodic distributions [39]. The material removal resulting from rough contact can then be modeled using the Preston equation [40] in combination with Hertzian contact theory [41]. In addition, some researchers have investigated the relationship between pressure distribution and tool surface morphology through experimental methods. For example, Z. Wang et al. [42] modeled both the tool surface and the polished surface profile by statistically analyzing real scanning images. L. Zhang [43] developed an MFE model based on actual contact pressure distributions measured using pressure-sensitive paper. However, these approaches alone are insufficient for accurately predicting mid-frequency errors. To achieve reliable MFE prediction, it is necessary to integrate both types of models.
To achieve this goal, researchers have developed comprehensive polishing models that integrate both Hertzian contact and rough surface contact between the tool and the workpiece [44,45,46,47,48,49,50,51]. In these multi-scale contact models, the pressure exerted by each micro-protrusion on the polishing tool is governed by the overall Hertzian pressure distribution. As early as 2003, J. Seok et al. [44] investigated multi-scale contact in chemical mechanical polishing (CMP) using finite element analysis. In 2016, Z. Cao et al. developed a multi-scale material removal model for computer-controlled bonnet polishing by incorporating both contact pressure distribution and single-particle wear mechanisms [45]. Later, in 2019, A. Lu modeled surface topography and roughness in the dual-axis wheel polishing of optical glass using a combination of single-particle wear theory and rough surface contact analysis [46]. Building on this, W. Yao et al. [47] proposed a multi-scale contact-based material removal model for cylindrical polishing, which extended previous models by including single-particle cutting effects. More recently, F. Meng et al. [48] introduced a multi-scale roughness prediction model for ultrasonic-assisted polishing based on W. Yao’s framework, achieving an error rate of less than 9.43%. In addition to these models, statistical approaches [49], the wear hypothesis [50], and fractal theory [51] have also been applied to study multi-contact behaviors in polishing. These studies collectively highlight the critical importance of multi-scale contact mechanics in accurately modeling mid-frequency errors.
In the above-mentioned multi-scale contact models, it is typically assumed that the polishing process can completely eliminate the mid-frequency errors of the initial surface [52]. As a result, only the MFEs introduced by the polishing tool are considered. However, in practical polishing with semi-rigid and elastic tools, the ability to suppress existing MFEs is often limited [53]. Therefore, the smoothing capability of the polishing tool also significantly affects the final surface MFEs. This smoothing effect arises from variations in contact pressure between surface asperities and valleys during the polishing process. Various studies have been conducted to investigate the smoothing capability of polishing tools through both experimental and theoretical approaches. For example, T. Suratwala et al. [54] experimentally examined the smoothing performance of semi-rigid tools with different polishing and elastic layers. Their results showed that a polishing layer with higher elastic modulus and a thicker elastic layer led to improved MFE suppression. Similarly, P. Lei et al. [55] explored the effect of tool size and found that larger tool sizes enhance the smoothing capability. Compared to experimental studies, theoretical models offer a more quantitative understanding of these effects. Early theoretical work by P.K. Mehta and P.B. Reid [56] introduced a bridging model based on Kirchhoff’s flat plate theory to describe pressure distribution during polishing of sinusoidal surface errors. J. Burge et al. [57] applied finite element modeling to analyze pressure distributions under various tool geometries. S. Liu et al. [58] proposed an MFE prediction model for pitch-based semi-rigid tools and assumed that MFE decreases exponentially with increasing removal depth. Y. Shu et al. [59] investigated the smoothing limitations of different polishing pads using the bridging model and concluded that increased stiffness would lead to a smaller MFE. More recently, X. Li et al. [60] developed a mathematical model for pressure distribution in multi-layer polishing tools, while X. Nie et al. [61] advanced this field by proposing a generalized finite element method model for calculating pressure distribution. These analyses collectively show that pressure differences between surface peaks and valleys reduce significantly as the surface approaches the smoothing limit. Clearly, the smoothing capability of a polishing tool is a key factor that directly influences the final mid-frequency errors. However, existing MFE prediction models based on multiscale contact mechanics have yet to incorporate this factor. Current research on MFE modeling for semi-rigid tool polishing remains insufficient.
To develop an accurate MFE prediction model for guiding and optimizing high-efficiency, low-roughness polishing of EN coated X-ray components, this paper presents a semi-empirical model for semi-rigid tool polishing. The model integrates frequency domain analysis and multi-scale contact mechanics, including smoothing capability, rough surface contact, and Hertzian contact mechanics. The influences of path spacing, polishing force, and tool surface roughness on the final MFEs were considered. Model parameters were first calibrated through a series of controlled experiments. Subsequently, polishing tests using a wheel-type semi-rigid tool were performed to validate the model. Both the modeling and experimental results demonstrate that higher tool flexural rigidity, smoother tool profiles, smaller path spacing, and appropriate polishing forces are beneficial for MFE suppression. Based on this model, we successfully reduced the root-mean-square MFE to 0.59 nm on a diamond-turned electroless nickel–phosphorus surface (measured over a 1.26 × 0.95 mm2 area), with a predicted value of 0.64 nm. The main objectives of this study are: (1) to reveal the quantitative relationship between MFEs, tool properties, and polishing parameters; and (2) to provide practical guidance for the selection of polishing tools and process parameters.

2. Theory and Modeling of MFEs

This section first analyzed the material removal mechanisms associated with MFEs under three distinct contact behaviors: smoothing effect, rough surface contact, and Hertzian contact. Simplified expressions corresponding to the MFEs induced by each of these contact modes were then derived. The parameters influencing MFEs were categorized into three groups: (1) tool parameters, including tool surface roughness and geometric features; (2) polishing parameters, including path spacing and applied polishing force; and (3) empirical parameters, which are difficult to measure directly and must be obtained through experimental calibration. For modeling purposes, the polishing process was simplified as an input–output system. The input consisted of theoretical parameters and the initial surface topography of the workpiece, while the output includes the predicted final MFE topography and the respective contributions from the three contact mechanisms.
According to the Preston equation [44], the material removal during the polishing process can be expressed as:
d f ( x , y , t ) = k p ( x , y , t ) v ( x , y , t ) d t
where f(x,y,t) is the surface profile at time t, p(x,y,t) is the real-time pressure distribution, v(x,y,t) is the real-time relative velocity distribution, and k is the Preston coefficient affected by polishing slurry. Given that the polishing velocity remains stable during the process, the velocity distribution was assumed to be constant in this study. As a result, the material removal distribution was determined solely by the pressure distribution.
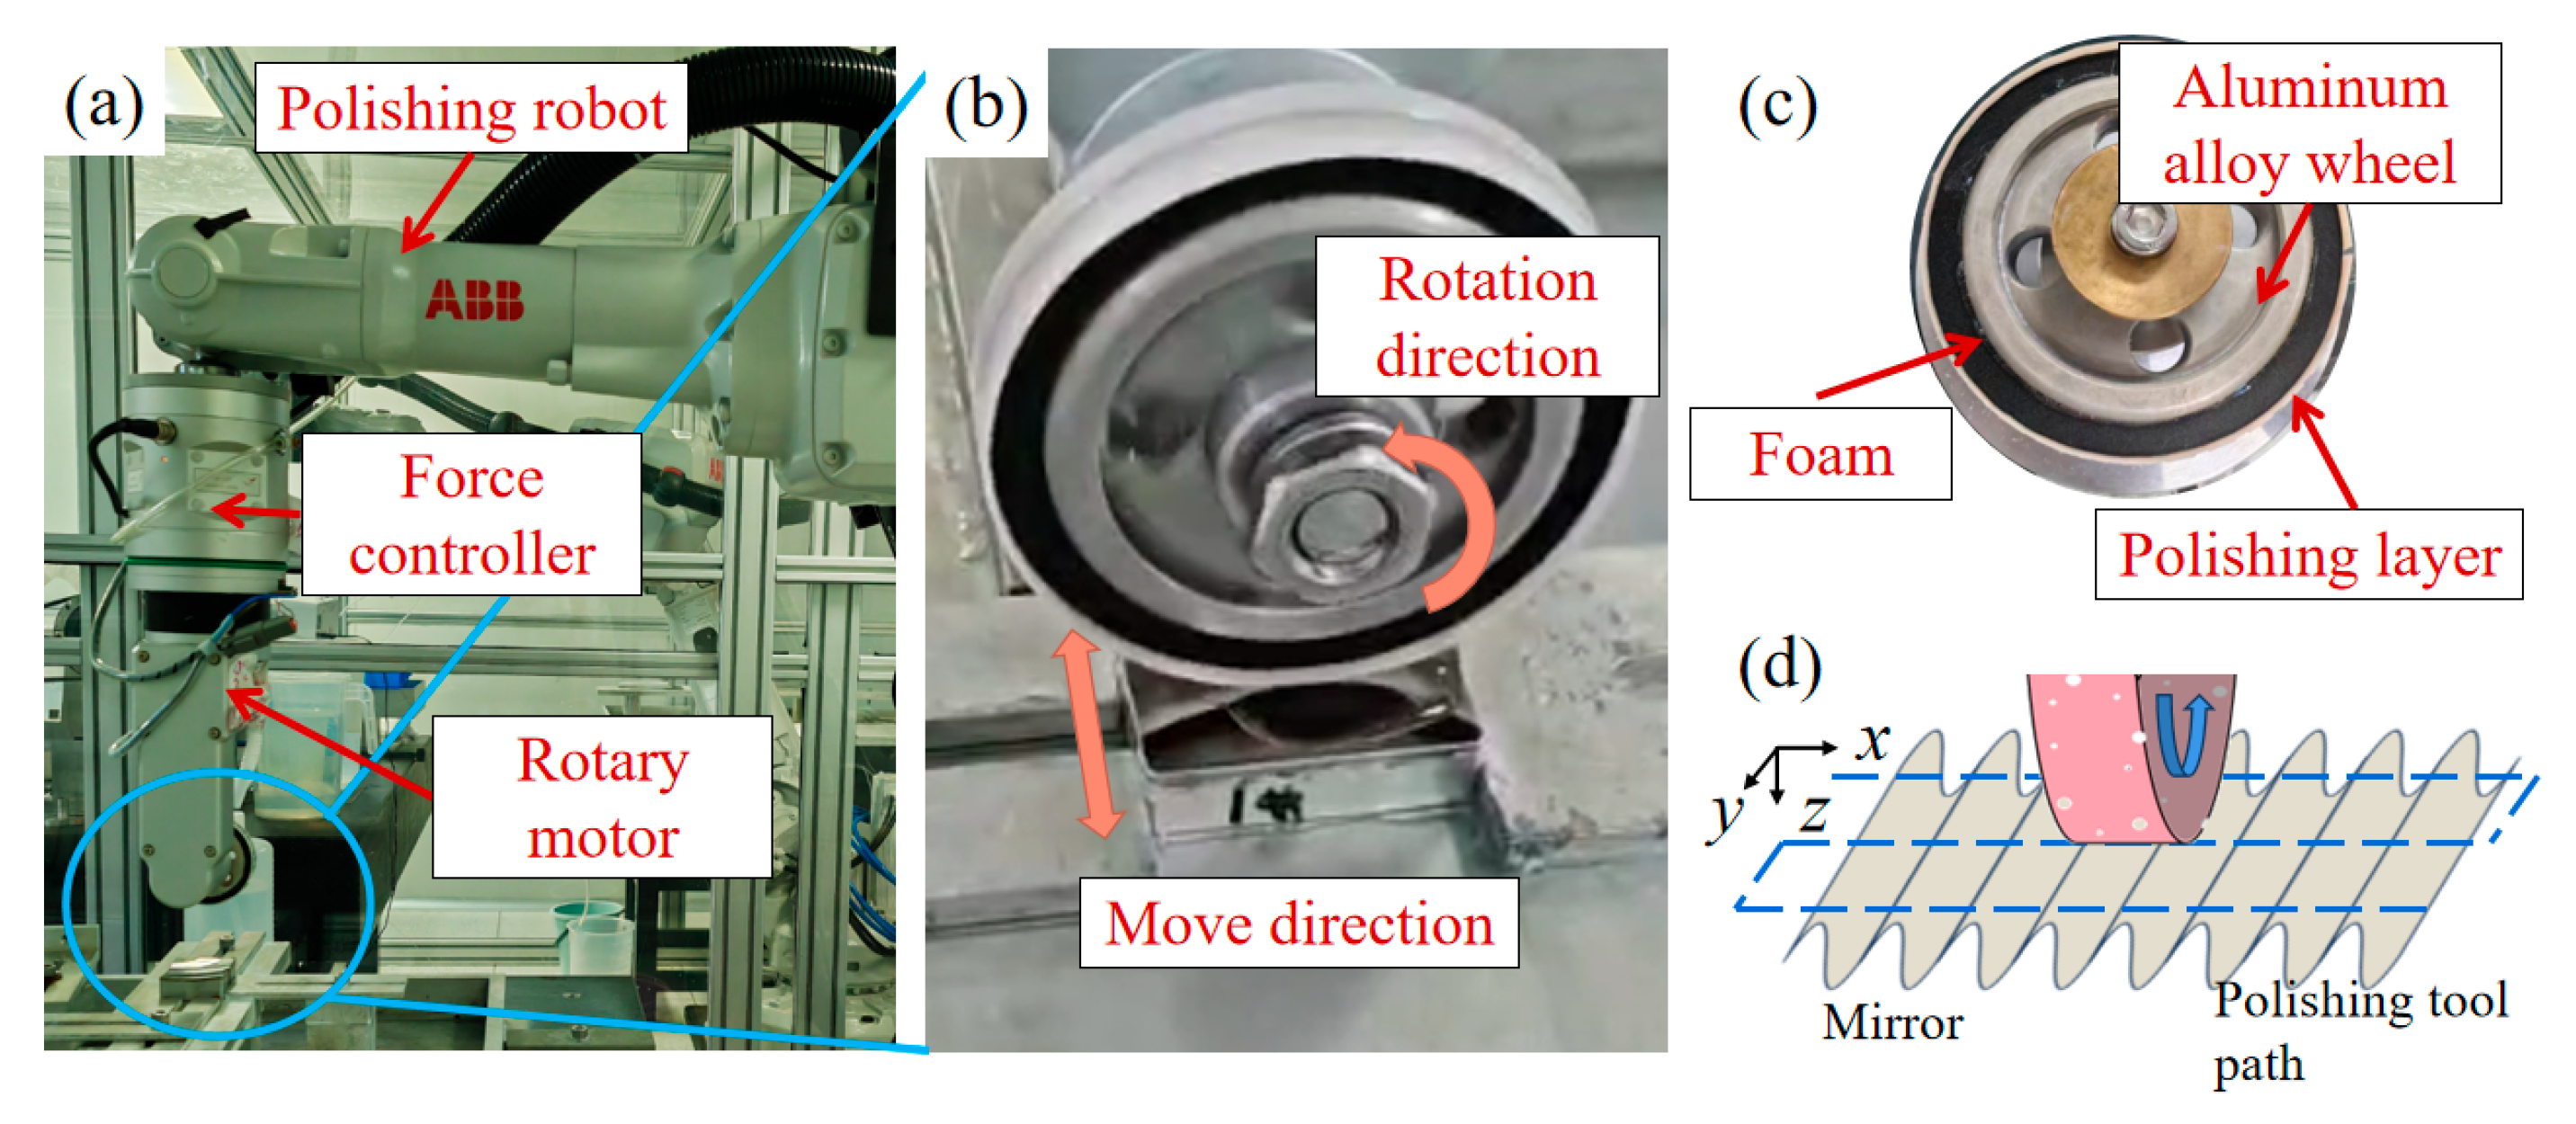
Figure 1a illustrates the STP process using a semi-rigid, wheel-type polishing tool. The tool consists of a polishing layer, an elastic layer, and a metal base. The elastic layer allows the tool to conform to low-frequency surface errors, while the polishing layer is responsible for smoothing mid- and high-frequency errors, as shown in Figure 1b.
The contact pressure between the tool and the workpiece includes three components:
(1) Hertzian contact pressure—caused by the elastic deformation of the elastic layer;
(2) Bridging contact pressure—caused by the misfit between the polishing layer and the mirror surface;
(3) Rough contact pressure—caused by the surface roughness of the polishing layer.

2.1. Hertzian Contact and Polishing Path-Introduced Marks

Figure 2 illustrates the Hertzian contact and the MFEs introduced by the polishing path. Since the plasticity index of the polishing tool is only about one-tenth of that of the polished mirror, the contact between the tool and the mirror can be considered almost entirely elastic. In the case of a wheel-type tool operating on a planar workpiece, the analytical form of the Hertzian contact [41] pressure distribution is as follows:
P ( x , y ) = P 0 1 ( x 2 a 2 + y 2 b 2 ) 1 / 2
where the maximum pressure P0 is:
P 0 = 3 F 2 π a b
where F is the applied force, a is the semi-major axis of the elliptical contact patch, and b is the semi-minor axis of the elliptical contact patch, as shown in Figure 2a.
Consider a simplified case where the curvature of the tool along the minor axis is identical to that of the mirror. In this scenario, b corresponds to the length of the contact area, and a is as follows:
a = 4 R F π b E 0
E0 is the effective elastic modulus of the tool and workpiece, R is the tool radius:
1 E 0 = 1 E 1 + 1 E 2
where E1 and E2 are the elastic modulus of the tool and workpiece, respectively.
By incorporating the tool path spacing, the MFEs introduced by the tool path can be derived. As shown in Figure 2b, during polishing, the TRF results in noticeable tool marks on the surface. Based on Equations (1)–(5), the side-view profile of the TRF generated by Hertzian contact is as follows:
T R F ( x ) = k v 2 F π a ( 1 x 2 a 2 ) 1 / 2
where v is the relative velocity, and k is the Preston coefficient. The tool marks exhibit the same period L as the polishing path, and the height is as follows:
H = k v 2 F π a [ 1 ( 1 L 2 4 a 2 ) 1 / 2 ]
Therefore, the polishing path introduced MFE can be expressed as:
Z p a t h ( t r 1 ) = k p b F R π [ 1 - ( 1 - ( t n L ) 2 a 2 ) 1 / 2 ] n - 1 2 t L < ( n + 1 2 ) , n Z
where n is an arbitrary integer, t r 1 is the coordinate, t is the distance along the profile as shown in Figure 2b, r 1 is the direction vector of polishing path as shown in Figure 2, and kp is the semi-empirical coefficient related to E0 and kv.

2.2. Bridging Contact and Smooth Limitation

Figure 3 illustrates the smoothing limitation during STP. According to bridging theory, the polishing pad can be modeled as a thin plate that follows Kirchhoff’s thin plate equation. When pressure q is applied to the polishing layer, its deformation satisfies the following equation [56]:
4 w = q D 2 q D s D s = E h 2 ( 1 + ν ) D = E h 3 12 ( 1 ν 2 )
where E is the Young’s modulus of the polishing layer, ν is the Poisson’s ratio of the polishing layer, q is the pressure distribution acting on the polishing layer, is the Laplacian operator, w is the profile of the deformed polishing layer, D is the flexural rigidity, and Ds is the transverse shear stiffness. For diamond-turned surfaces, the mirror surface exhibits a one-dimensional periodic profile, with the relative velocity oriented perpendicular to the direction of periodicity, as shown in Figure 3a. Under this assumption, the deformation of the polished surface will retain the same period length l as the original surface profile.
During polishing, the high points of the surface profile, as shown in Figure 3b, bear most of the pressure due to direct contact with the polishing layer, while the low points experience zero pressure because no contact occurs. This pressure difference leads to preferential material removal at the high points, resulting in smoothing of the surface profile. As polishing continues, the low points of the mirror eventually come into contact with the corresponding low points of the deformed polishing layer. At this stage, the normal pressures at both the high and low points equalize. With further polishing, the surface profile tends to stabilize, as illustrated in Figure 3c. Therefore, the final surface profile zs after polishing corresponds to the maximum deformation wx of the polishing layer:
z s = w x
Considering the deformation within a single cycle, the high points of the surface profile can be treated as supporting beams for the thin plate. Due to the obvious one-dimensional periodic structure of the surface profile after turning, the bending of the polishing layer can be approximated as the bending of a beam in one-dimensional conditions. Accordingly, the deformation wx can be obtained as [56]:
w x = q x 2 l 2 1 2 l 4 24 D
From Equation (11), it can be observed that the maximum deformation, wx, is inversely proportional to the flexural rigidity D and the fourth power of the spatial frequency 1/l, and directly proportional to the applied pressure q. Therefore, the following conclusions can be drawn:
  • When the spatial frequency of the error is sufficiently high, the smoothing effect can reduce the profile error to nearly zero;
  • The smoothing limit is directly proportional to the applied pressure q, and inversely proportional to the flexural rigidity D;
  • This implies that the smoothing effect described by the bridging model can be considered analogous to a low-pass filter.
In our model, the pressure q is the pressure of Hertzian contact. Considering that the polishing tool would pass through the whole surface, the q can be regarded as the maximum pressure P0 in Section 2.1. Accordingly, the smoothing limit is:
Z s m o o t h e f f e c t = F b R π f k f a f Z f
where afZf is the Fourier expansion of initial surface profile Z1:
Z 1 = f a f Z f
where kf is the smooth coefficient:
k f = 0 f f h p D R m s ( Z 1 ) f < f h
where fh is the cutoff frequency of smooth effect, p is the scale factor, and Rms(Z1) is the root-mean-square (Rms) value of initial surface profile. The fh and p can be obtained by experiments, the details of which will be discussed in Section 3 and Section 4.

2.3. Rough Contact Introduced Mid-Frequency Errors

The pressure distribution arising from rough surface contact is the primary cause of profile errors with spatial frequencies higher than fh. According to the GW model, the rough surface of the polishing tool can be considered as a surface composed of multi-scale asperities, as illustrated in Figure 4a. During the polishing process, the material removal can be modeled as the action of an equivalent polishing tool with a one-dimensional fractal profile, as shown in Figure 4b. The profile of the mirror is set as Z(x,y), and the profile of the equivalent polishing tool is set as Zp(x,y). Under normal conditions, Z(x,y) << Zp(x,y). According to Hertzian contact theory, the contact pressure between the mirror and the polishing tool is as follows [44]:
P = 4 3 P H E 0 R p c ( Z ( x , y ) Z p ( x , y ) ) 3 2 4 3 P H E 0 R p c ( Z p ( x , y ) ) 3 2
where Rpc is the radius of protrusions and PH is the pressure of Hertzian contact. Considering that the polishing tool would pass through the whole surface, the PH can be regarded as the maximum pressure P0, as shown in Section 2.1. During the polishing process, the polishing tool cyclically removes material from the mirror surface along a predefined path. When the tool passes over the surface for the i-th time, the surface profile modification introduced by rough contact can be expressed as:
Z i ( x , y ) = k s ( Z i 1 ( x , y ) 4 3 k P 0 E 0 R p c ( Z p ( x , y ) ) 3 2 v )
where ks is the smooth coefficient caused by smooth effect and chemical etching. It is evident that:
Z r o u g h c o n t a c t = Z i 1 ( x , y ) = k s 1 k s k 4 3 P 0 E 0 R p c ( Z p ( x , y ) ) 3 2 v = k E F b R π Z p ( x , y ) 3 2 v
where kE is the constant related to the elastic coefficient and ks, the Zi(x,y) is equal to Zi-1(x,y), indicating that the surface roughness has stabilized.

2.4. MFEs Predication Model

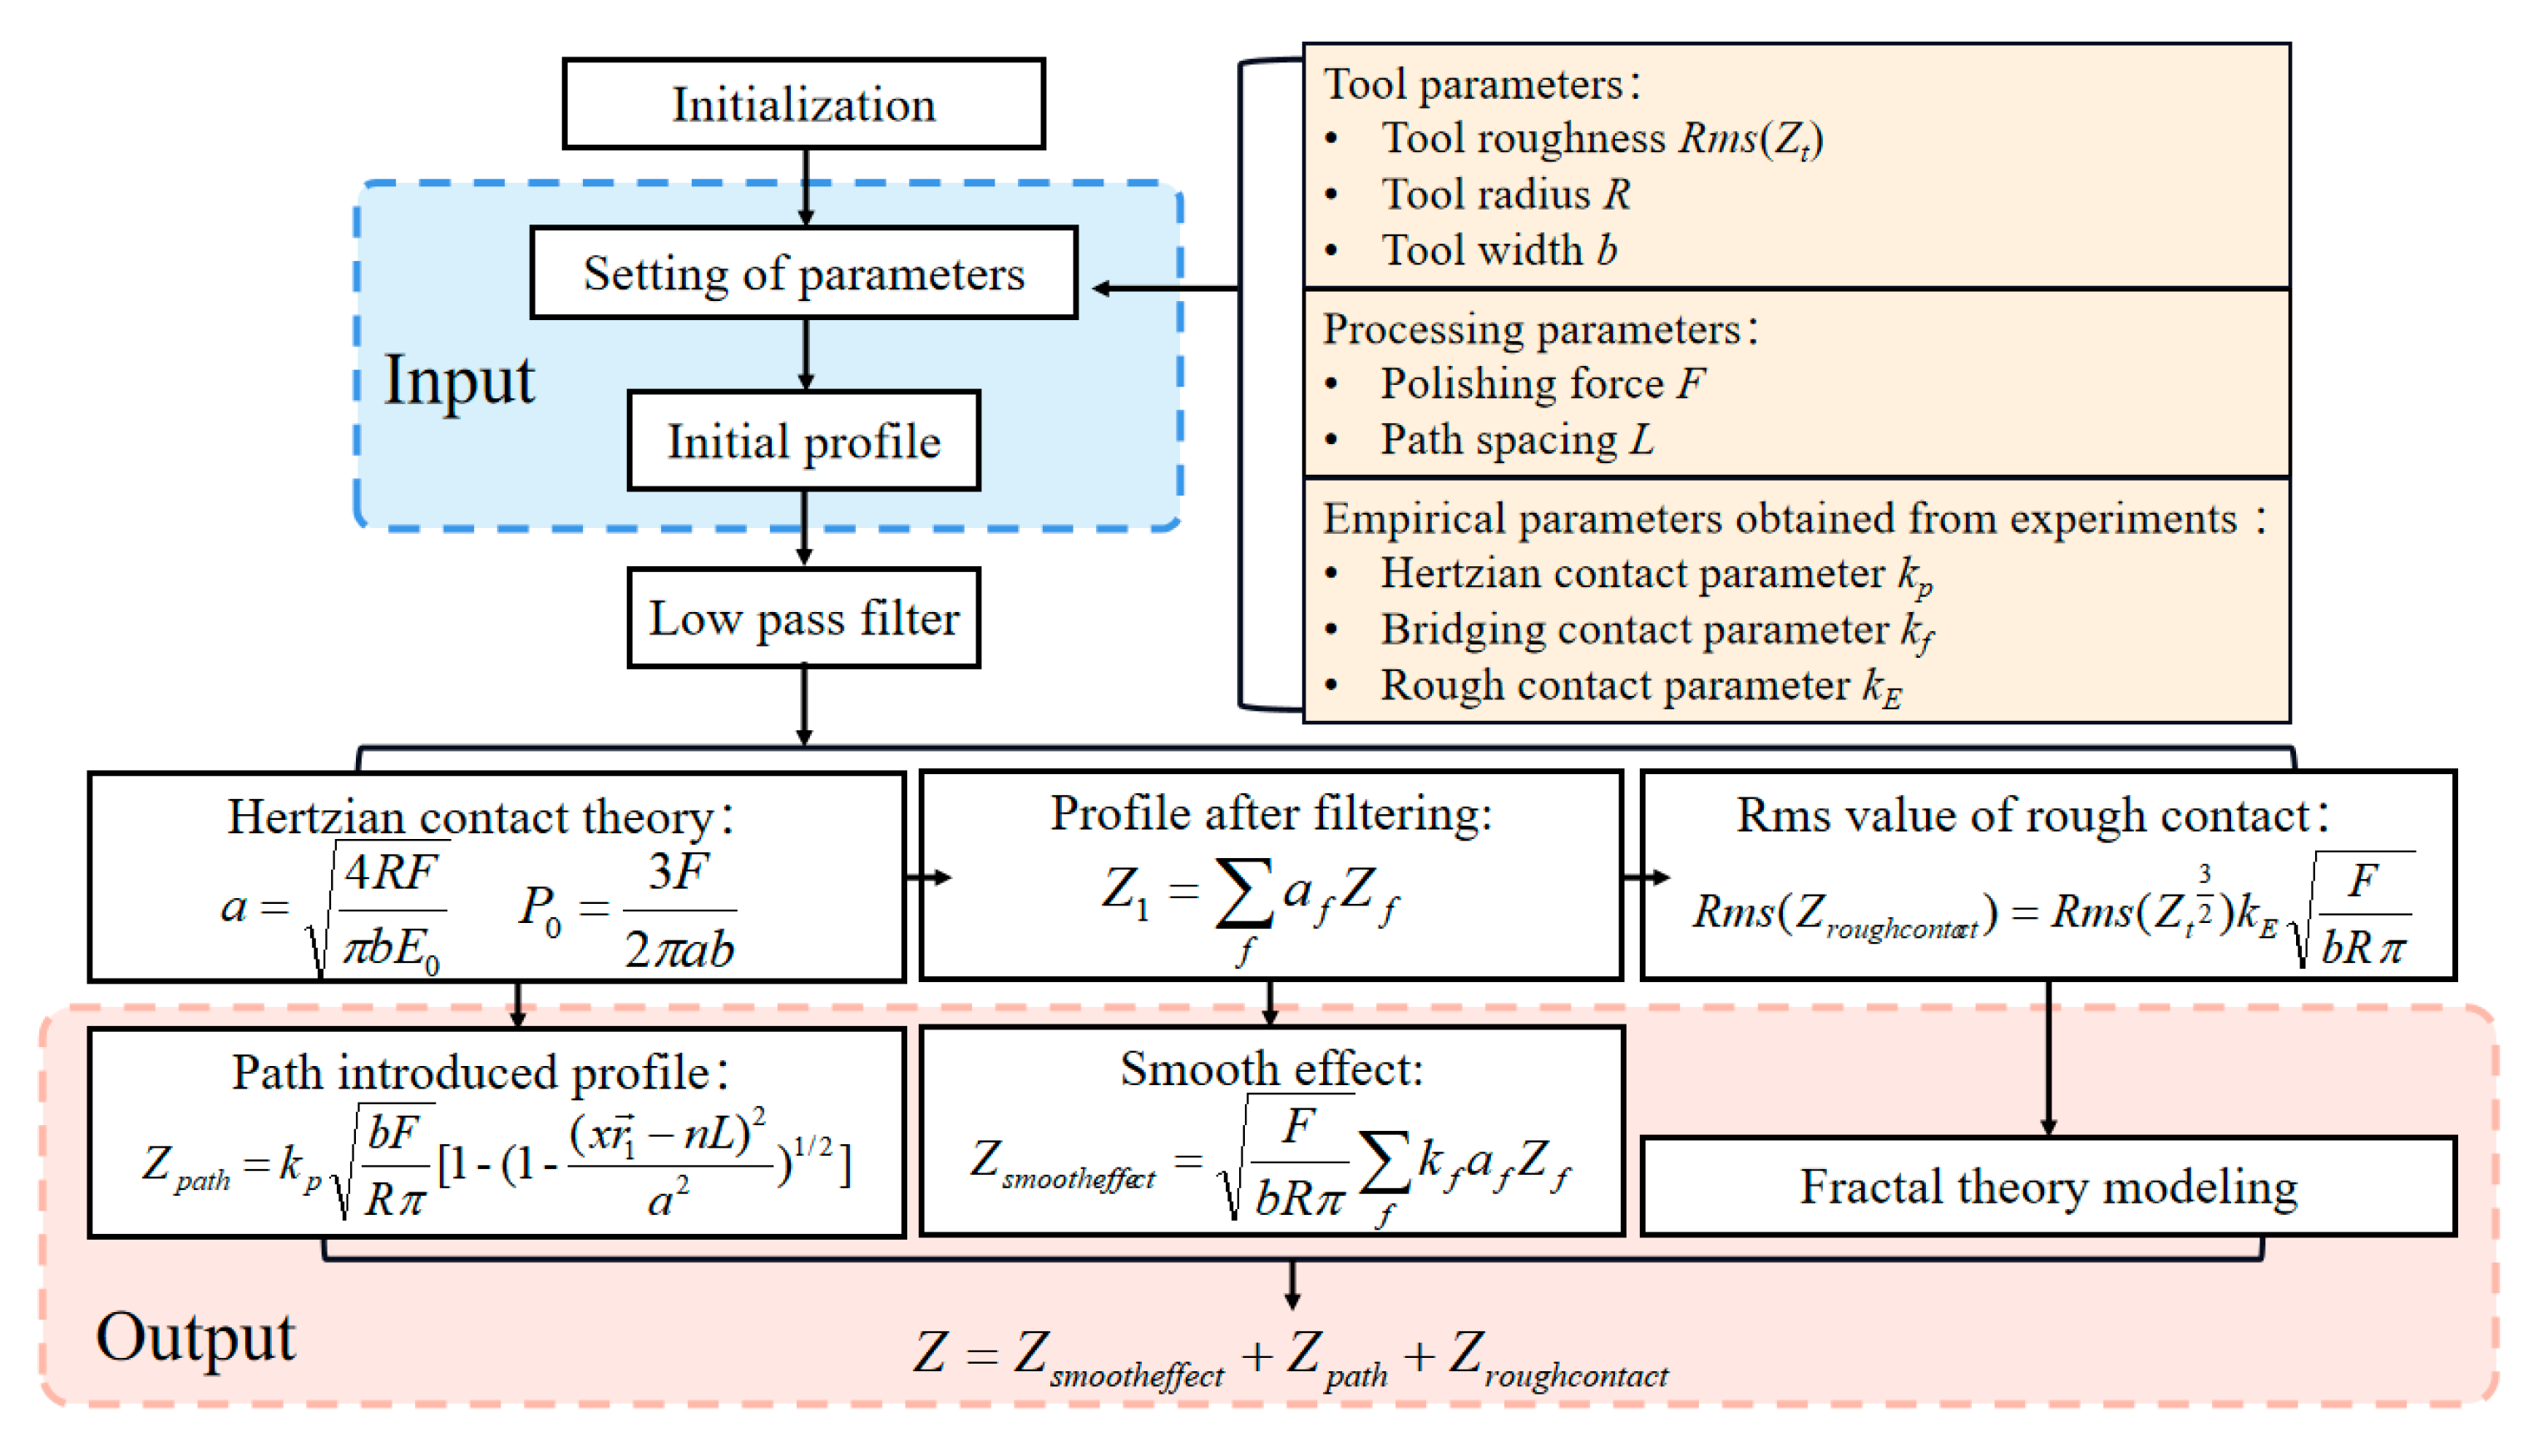
Figure 5 illustrates the flowchart of the MFE prediction model. Based on the previous analysis, the parameters influencing the MFEs can be categorized into three types:
  • Tool parameters, including tool roughness, tool radius, and tool width;
  • Polishing parameters, including path spacing and polishing force;
  • Empirical parameters obtained by experiments, including fh, kp, kf and kE.
First, it is necessary to obtain empirical parameters fh, kp, kf and kE through experiments. This will be discussed in Section 3. Then, the parameters and the initial surface profile are inputted into the model to predicate the final surface profile. After inputting the initial surface profile of the workpiece along with the above parameters, the first step is to compute the contact area and maximum contact pressure using Hertzian contact theory. Then, the mid-frequency error introduced by the tool path, Zpath, is calculated using Equation (8). Next, a low-pass filter is applied to the initial surface profile to simulate the smoothing effect. The filtered profile is then used to calculate the smoothing-induced error, Zsmootheffect, according to Equation (13).
The equivalent profile of the polishing tool cannot be obtained directly. Therefore, it is assumed that a linear proportional relationship exists between the Rms value of the equivalent tool profile Zp and that of the actual tool surface profile Zt. This proportionality factor is influenced by both the rotational speed and the translational speed of the polishing tool. Based on this assumption, the surface profile introduced by rough contact, Zroughcontact, can be reconstructed using fractal theory and the corresponding Rms value. The Rms value of Zroughcontact can be calculated as:
R m s ( Z r o u g h c o n t a c t ) = R m s ( k E P 0 Z t ( x , y ) 3 2 v )
Typically, the Zroughcontact can be expressed using the Weierstrass–Mandelbrot (WM) function, which is widely used to describe fractal profiles:
Z r o u g h c o n t a c t ( x , y ) = G D 1 n = n 1 cos 2 π γ n ( x ) γ ( 2 D ) n
where D is the fractal dimension, G is the scale coefficient, γ is a constant that is always taken as 1.5, n1 is a coefficient related to the lowest truncation frequency of the profile, and x is the coordinates.
Finally, the overall MFEs can be obtained by summing the contributions from all individual sources. The Rms value of the final MFEs is then calculated based on this cumulative result. By inputting different sets of processing parameters into the model, the relationship between these parameters and the resulting MFEs can be systematically analyzed. This enables guidance for the selection and optimization of polishing parameters.

2.5. Error Analysis

The mode’s errors mainly arise from two factors: model simplification and empirical parameters. In this model, only the multi-contact behavior is discussed. For a real polishing process, the chemical etching and fluid effect would also influence the final topography. Chemical etching and fluid effects mainly affect the HFEs. However, there is still a non-ignorable influence on the surface morphology with a period close to micrometers. In the frequency domain analyzed in this article, although the effects of these two are less significant compared to the roughness generated by contact, they are still difficult to ignore and introduce predication errors when the roughness is small enough, especially for Zroughcontact.
Empirical parameters are obtained from experiments. Measurement errors could lead to errors in these parameters and cause predication error. The measurement error will have a greater impact when the roughness is improved. Therefore, this model will exhibit significant errors when the roughness is small enough.

3. Experiment Design

Two types of experiments were conducted in this study: (1) empirical parameter acquisition experiments; and (2) model validation experiments. Diamond-turned electroless nickel plates with dimensions of 40 × 40 mm2 were used as the workpieces for polishing. The polishing experiments were carried out using a 6-axis industrial robot (IRB 1600, ABB, Zurich, Switzerland), as shown in Figure 6a. A wheel-type polishing tool was employed, as illustrated in Figure 6b. The polishing tool consists of a 50 mm diameter aluminum alloy wheel, a 5 mm thick foam elastic layer, and a 1.2 mm thick polyurethane polishing layer, as detailed in Figure 6c. The foam layer has a hardness of 40 HA, and the width of the polishing layer is 10 mm. The surface profile of diamond-turned EN plates exhibits distinct directionality [62]. Figure 6d illustrates the polishing scenario, where the orientation of the mirror’s periodic surface profile is parallel to the rotation direction of the polishing tool. The blue dashed line is the polishing path, which is also expressed by the yellow solid line in Figure 2a.
In all experiments, the rotational and translational speeds of the polishing tool were maintained constant to ensure process consistency. The polishing wheel rotated at 100 revolutions per minute (rev/min), while its translational speed was set to 5 mm/s. The polishing slurry consisted of SiO2 abrasives with an average particle size of 100 nm, suspended in deionized water. The material removal depth was controlled at 1 μm in each experiment to ensure that the surface roughness reached a stable, convergent value.
During the polishing process, the directions of tool translation and rotation are arranged to be perpendicular, as shown in Figure 6b,d, in order to minimize the influence of translation speed on the TRF. Consequently, the orientations of Zpath and Zroughcontact are also perpendicular to each other, and the smoothing effect Zroughcontact becomes oriented perpendicular to Zpath.

3.1. Parameters Acquisition Experiments

The purpose of this experimental section is to determine the empirical parameters kp, kf and kE. Ideally, these three effects would be studied independently through separate experiments. However, in practical polishing processes, the smoothing effect, tool path effect, and rough contact effect are inevitably coupled. Therefore, decoupling these three contributors to MFEs after polishing became a critical challenge in this study. According to the work of Xia et al. [63], the anisotropic component can be extracted based on two-dimensional power spectral density analysis for polished surfaces. As discussed in Section 2, Zsmootheffect, Zpath and Zroughcontact each exhibit distinct anisotropic characteristics, making them separable using this method. By applying this approach to the polished surface profiles, the individual contributions of each effect can be isolated and the corresponding empirical parameters kp, kf and kE can be accurately extracted. The empirical parameter fh can be obtained by analyzing the power spectral density after polishing. The highest frequency corresponding to the periodic structure that remains on the surface after polishing can be considered as fh.
Two polishing tools of identical dimensions but with different polishing layers were used in this study. The detailed tool parameters are listed in Table 1. Tool A was equipped with an LP87 polishing material (hardness: 96 HA; density: 49 lb/ft2, Universal Photonics, New York, NY, USA), while Tool B used SL4387 (hardness: 69 HD; density: 68 lb/ft2, Universal Photonics, New York, NY, USA). A polishing force of 8 N was applied in both cases. Prior to polishing, both tools were dressed using identical single-point diamond-turning parameters to ensure consistent initial surface profiles. The surface topographies of the tools were then measured using a white-light interferometer (ContourGT, Bruker, Karlsruhe, Germany). The measured profiles are presented in Figure 7.
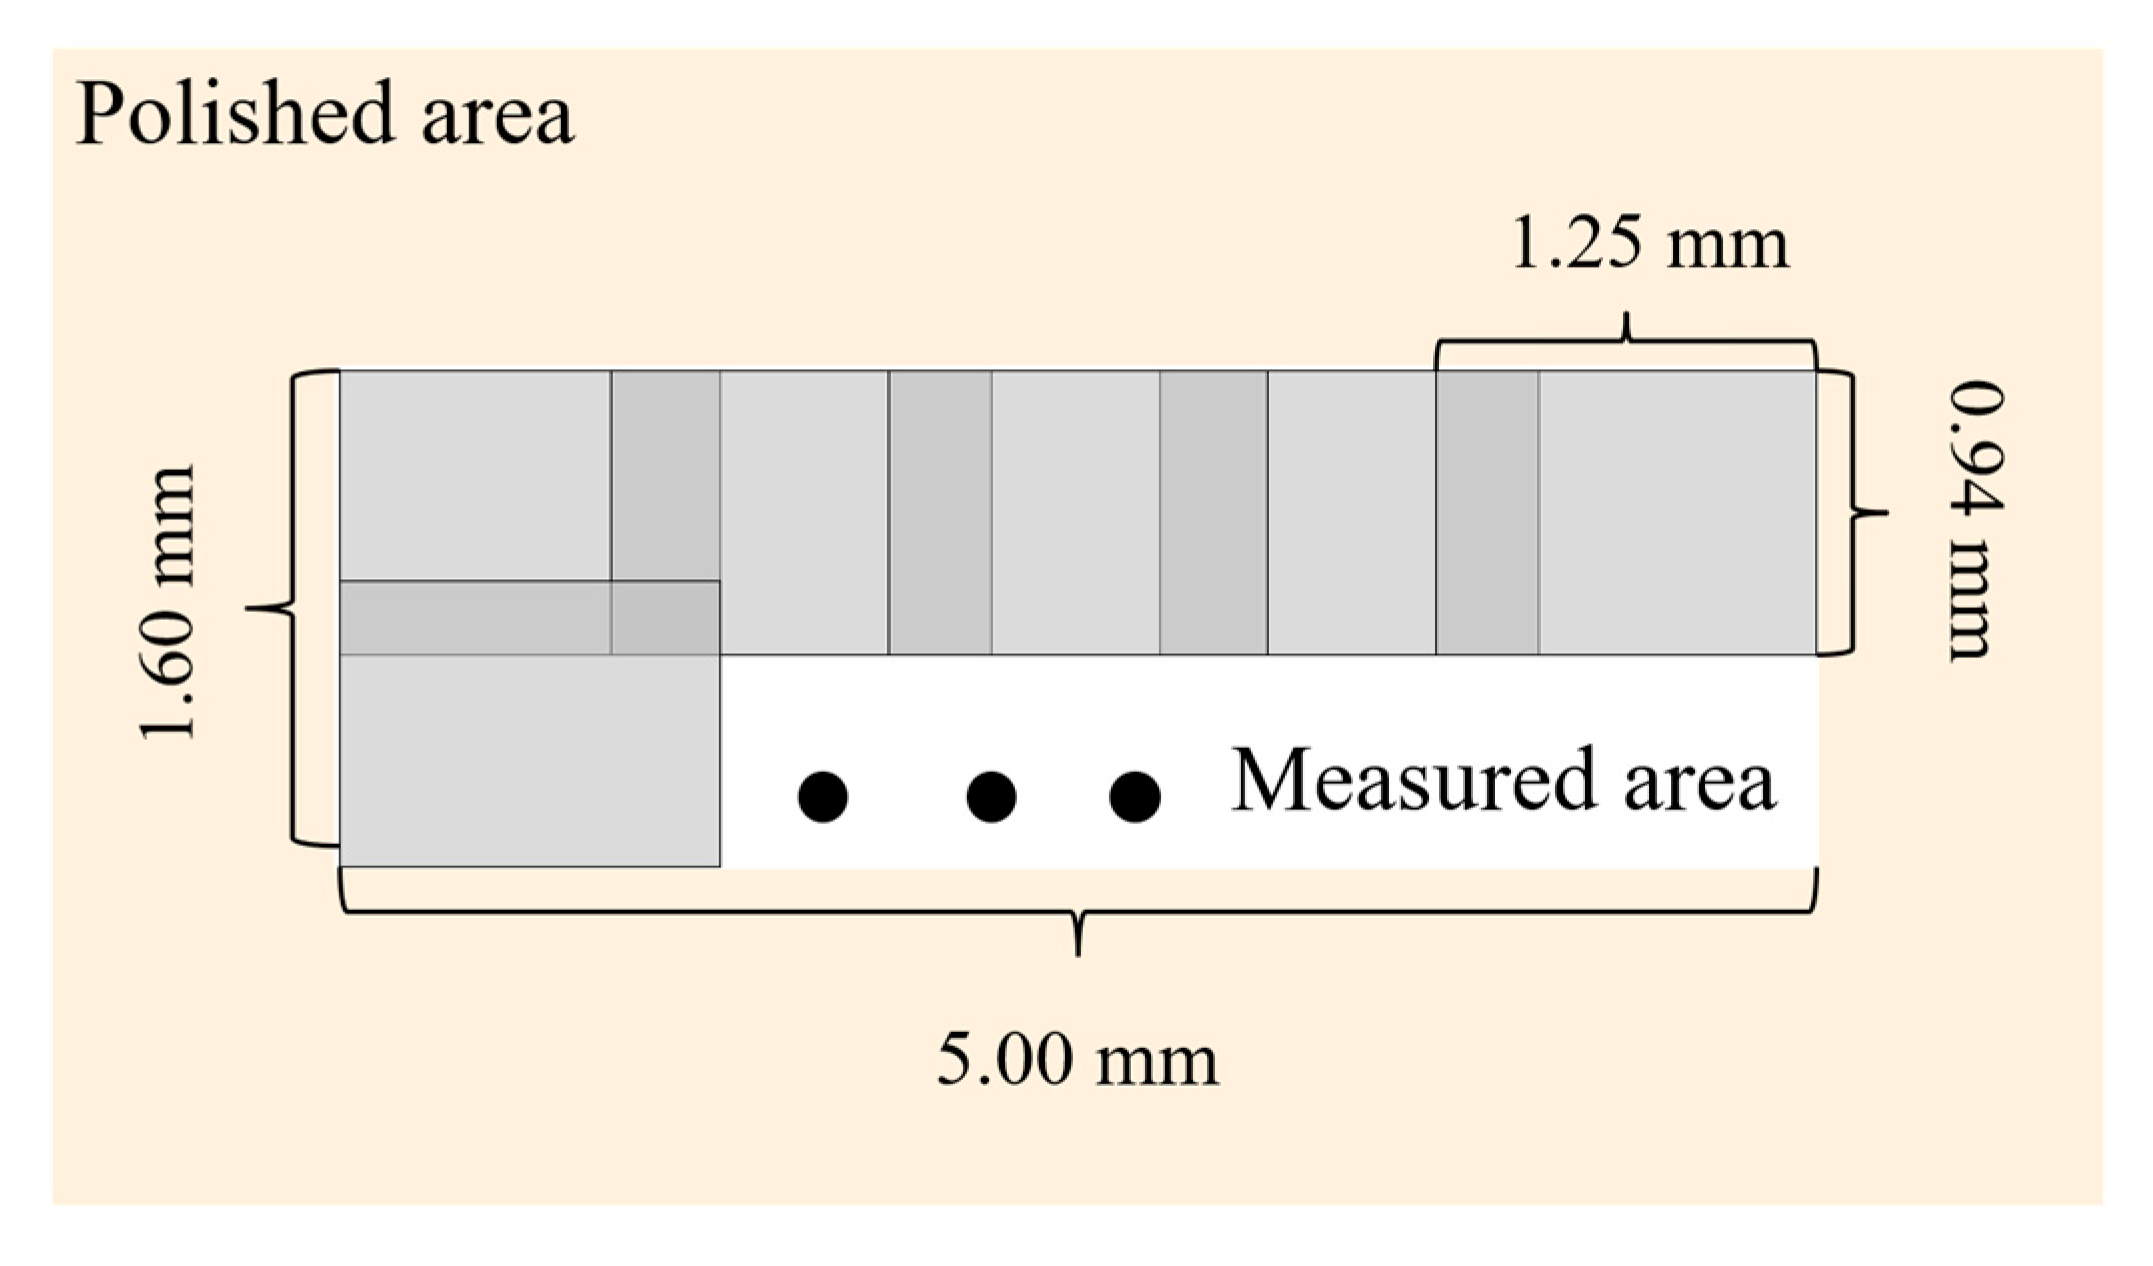
After polishing, the surface profiles were measured using a white-light interferometer with a measurement window of 1.26 mm × 0.94 mm. To minimize the influence of positioning errors on the measurement results, points were uniformly selected within the polished area. The overlap between adjacent measurements was 25% of the measurement window, resulting in a total scanned area of 5.00 mm × 1.60 mm. Measurements were performed at 10 locations, as shown in Figure 8. The model accuracy was then evaluated by averaging the results from these 10 measurements.
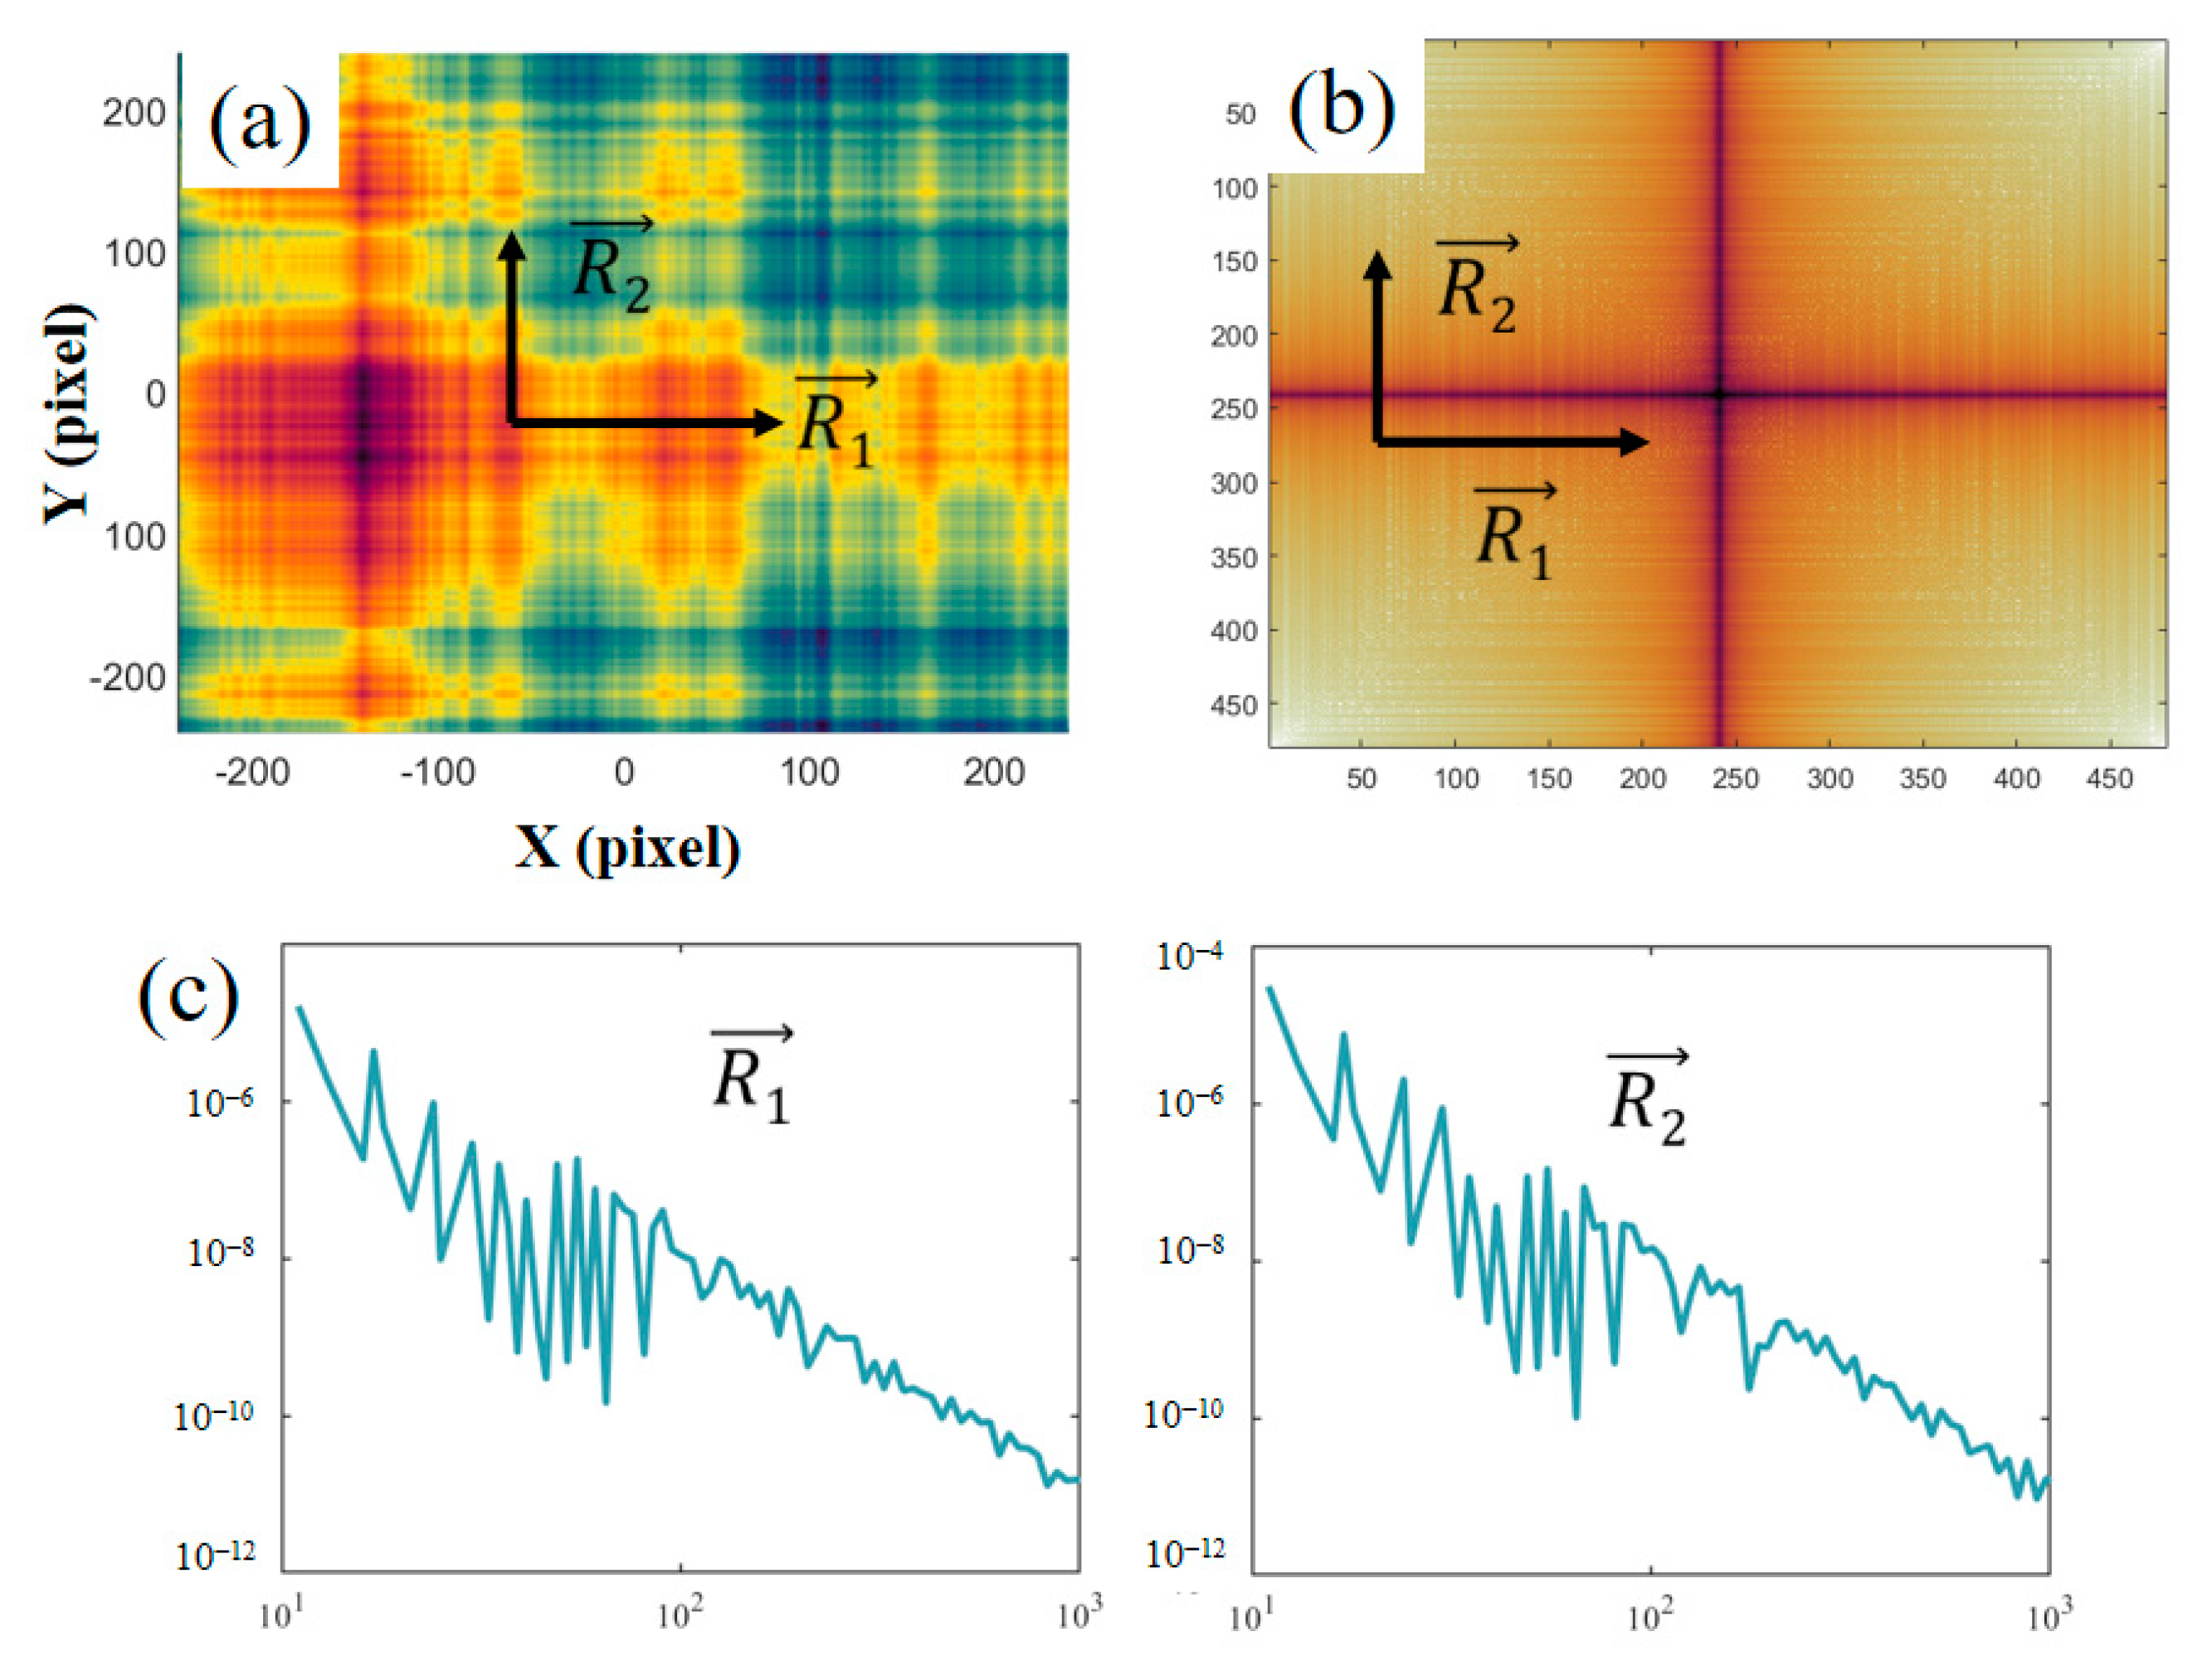
A high-pass filter with a cutoff frequency of 5 mm−1 was first applied to isolate the component Zroughcontact from the measured results. Subsequently, two-dimensional power spectral density (2D PSD) analysis was employed to separate Zsmootheffect and Zpath, as shown in Figure 9. For a surface composed of anisotropic features in different orientations (e.g., directions R1, and R2 in Figure 9a), the 2D PSD was first computed, as shown in Figure 9b. Then, orientation-specific, one-dimensional PSDs were extracted by averaging along directions R1 and R2 from the 2D PSD (Figure 9c). Finally, the root-mean-square values of each component were calculated based on their respective 1D PSDs.

3.2. Model Validation Experiments

The objective of this set of experiments was to validate the proposed MFE prediction model. In this phase, simulations and experimental results were compared under varying input parameters, including polishing force, path spacing, and tool surface roughness.
Tool A was employed to investigate the influence of polishing force F. According to the theoretical analysis, Zsmootheffect and Zroughcontact are proportional to F0.5, while Zpath is inversely proportional to F0.5. During the experiments, the path spacing was fixed at 0.5 mm; the used polishing forces were 5 N, 8 N, 10 N, and 12 N.
To examine the influence of tool roughness, polishing experiments were conducted using tool B and two additional tools (tools C and D), which shared the same size and polishing layer material as tool B. The path spacing was fixed at 0.5 mm, and the polishing force was maintained at 10 N. The surface profiles of tools C and D are shown in Figure 10a and 10b, respectively. The roughness values of tools B, C, and D are summarized in Table 2.
To verify the influence of path spacing, polishing experiments were conducted with path spacings of 0.25 mm, 0.40 mm, 0.50 mm, and 0.60 mm, while maintaining a polishing force of 10 N. According to the analysis, a smoother polishing tool yields better polishing results; therefore, tool C was selected for these experiments.

4. Results and Discussion

4.1. Parameters Acquisition

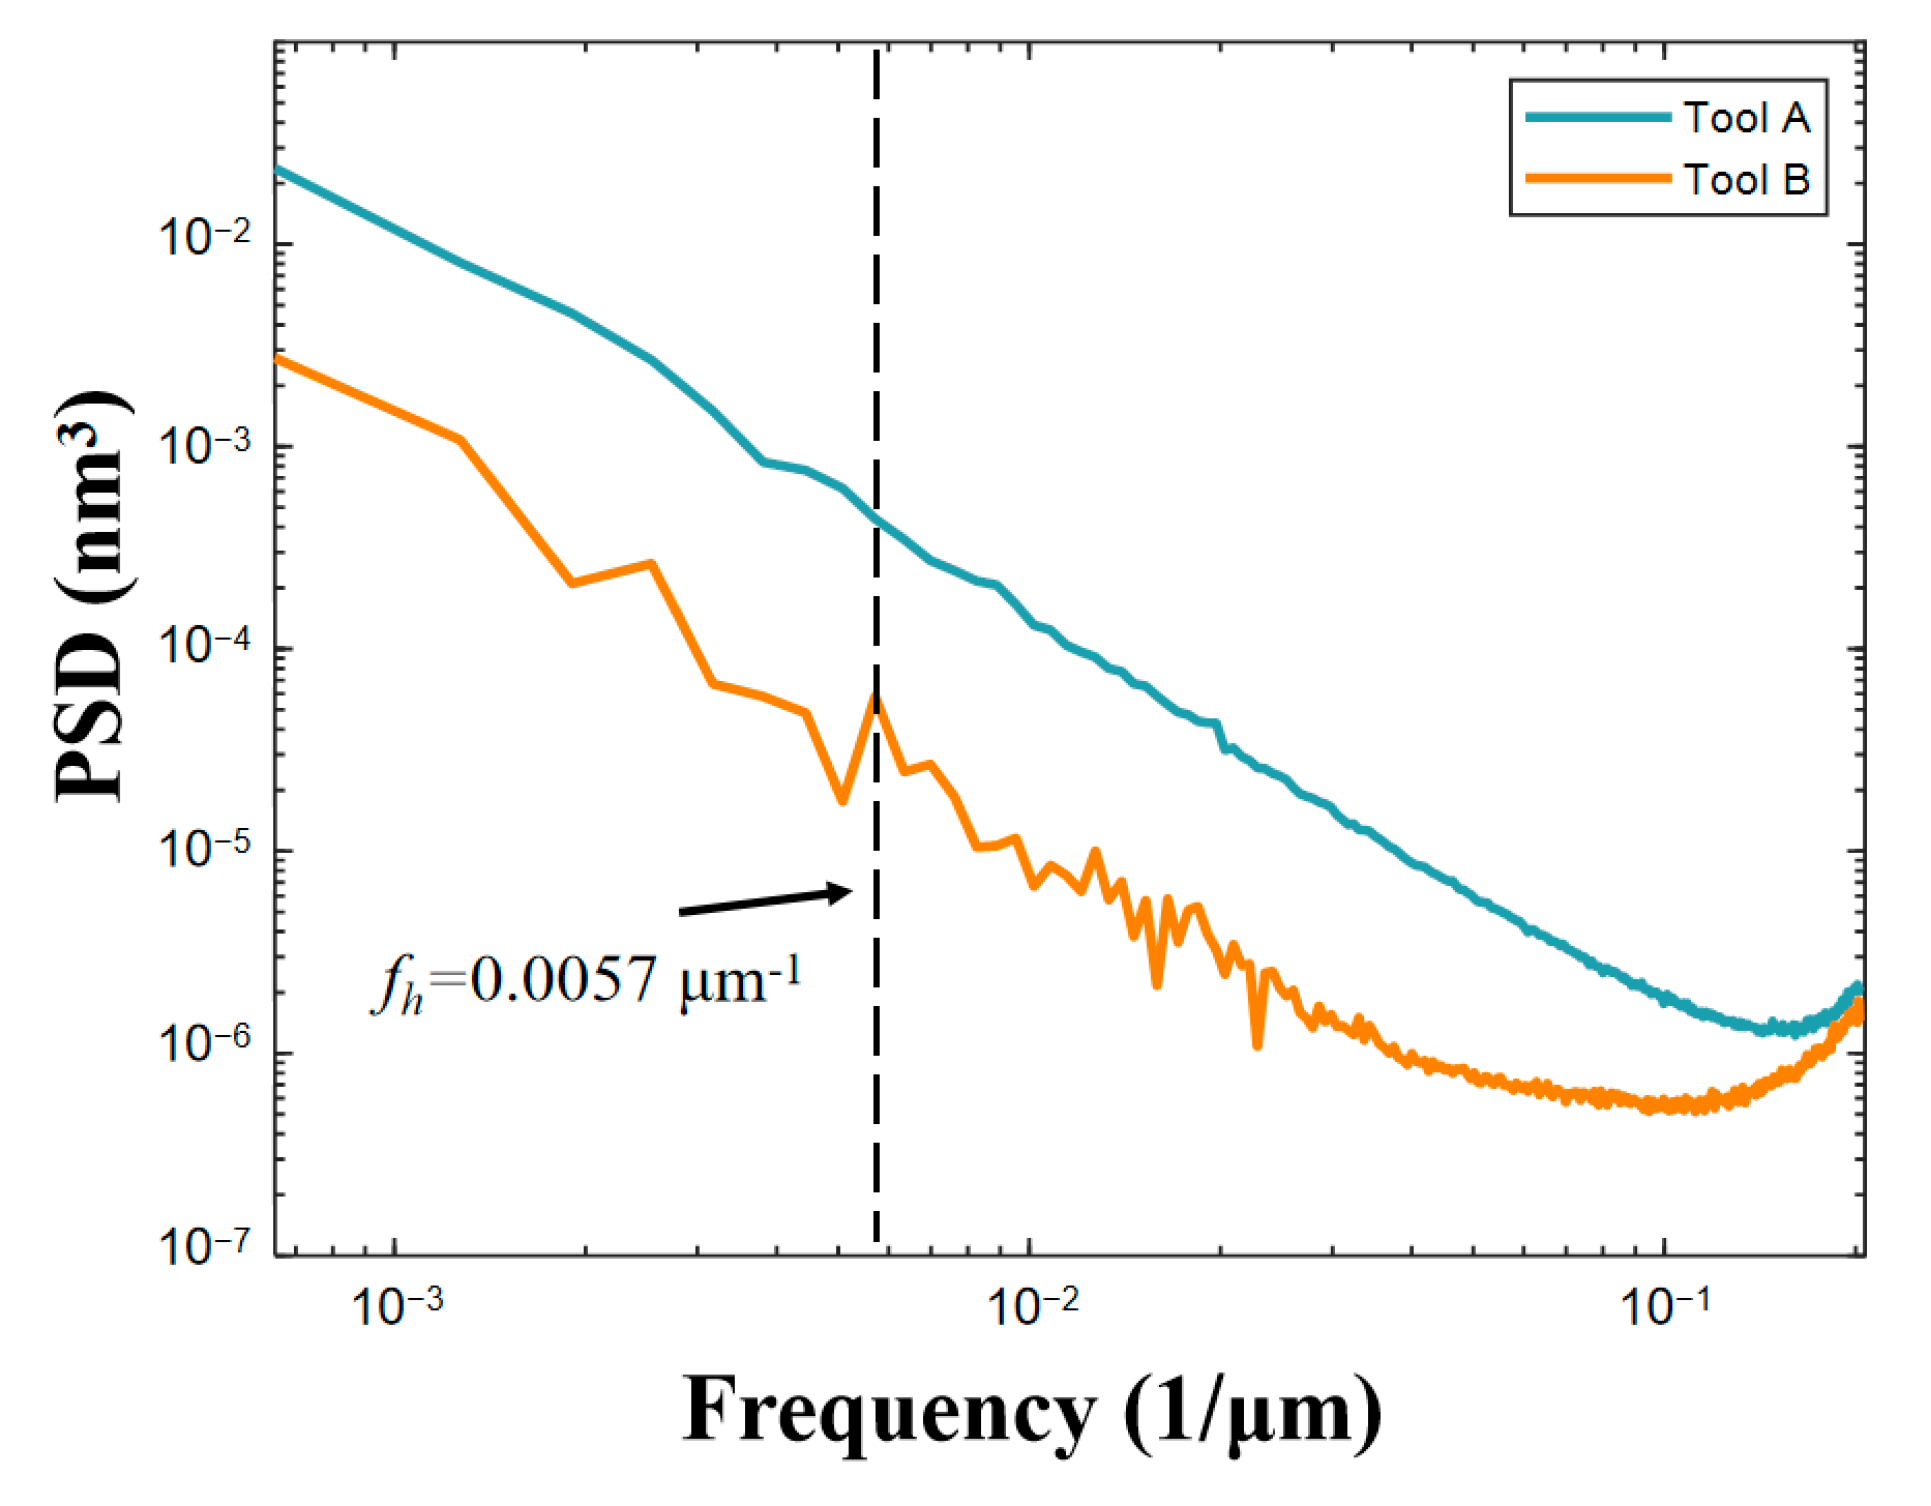
In this part, the value of fh, kp, kf and kE were determined from experimental results for the MFE model. Two EN mirrors were polished using Tool A and Tool B, respectively. The first step was to obtain the fh through one-dimensional PSD analysis in Zsmootheffect direction. Figure 11 shows the one-dimensional PSDs of the surfaces polished with tool A and tool B. From the PSD curve, it can be seen that there are structures with periods greater than 200 μm on both surfaces. The fh can be obtained as 5.7 mm−1.
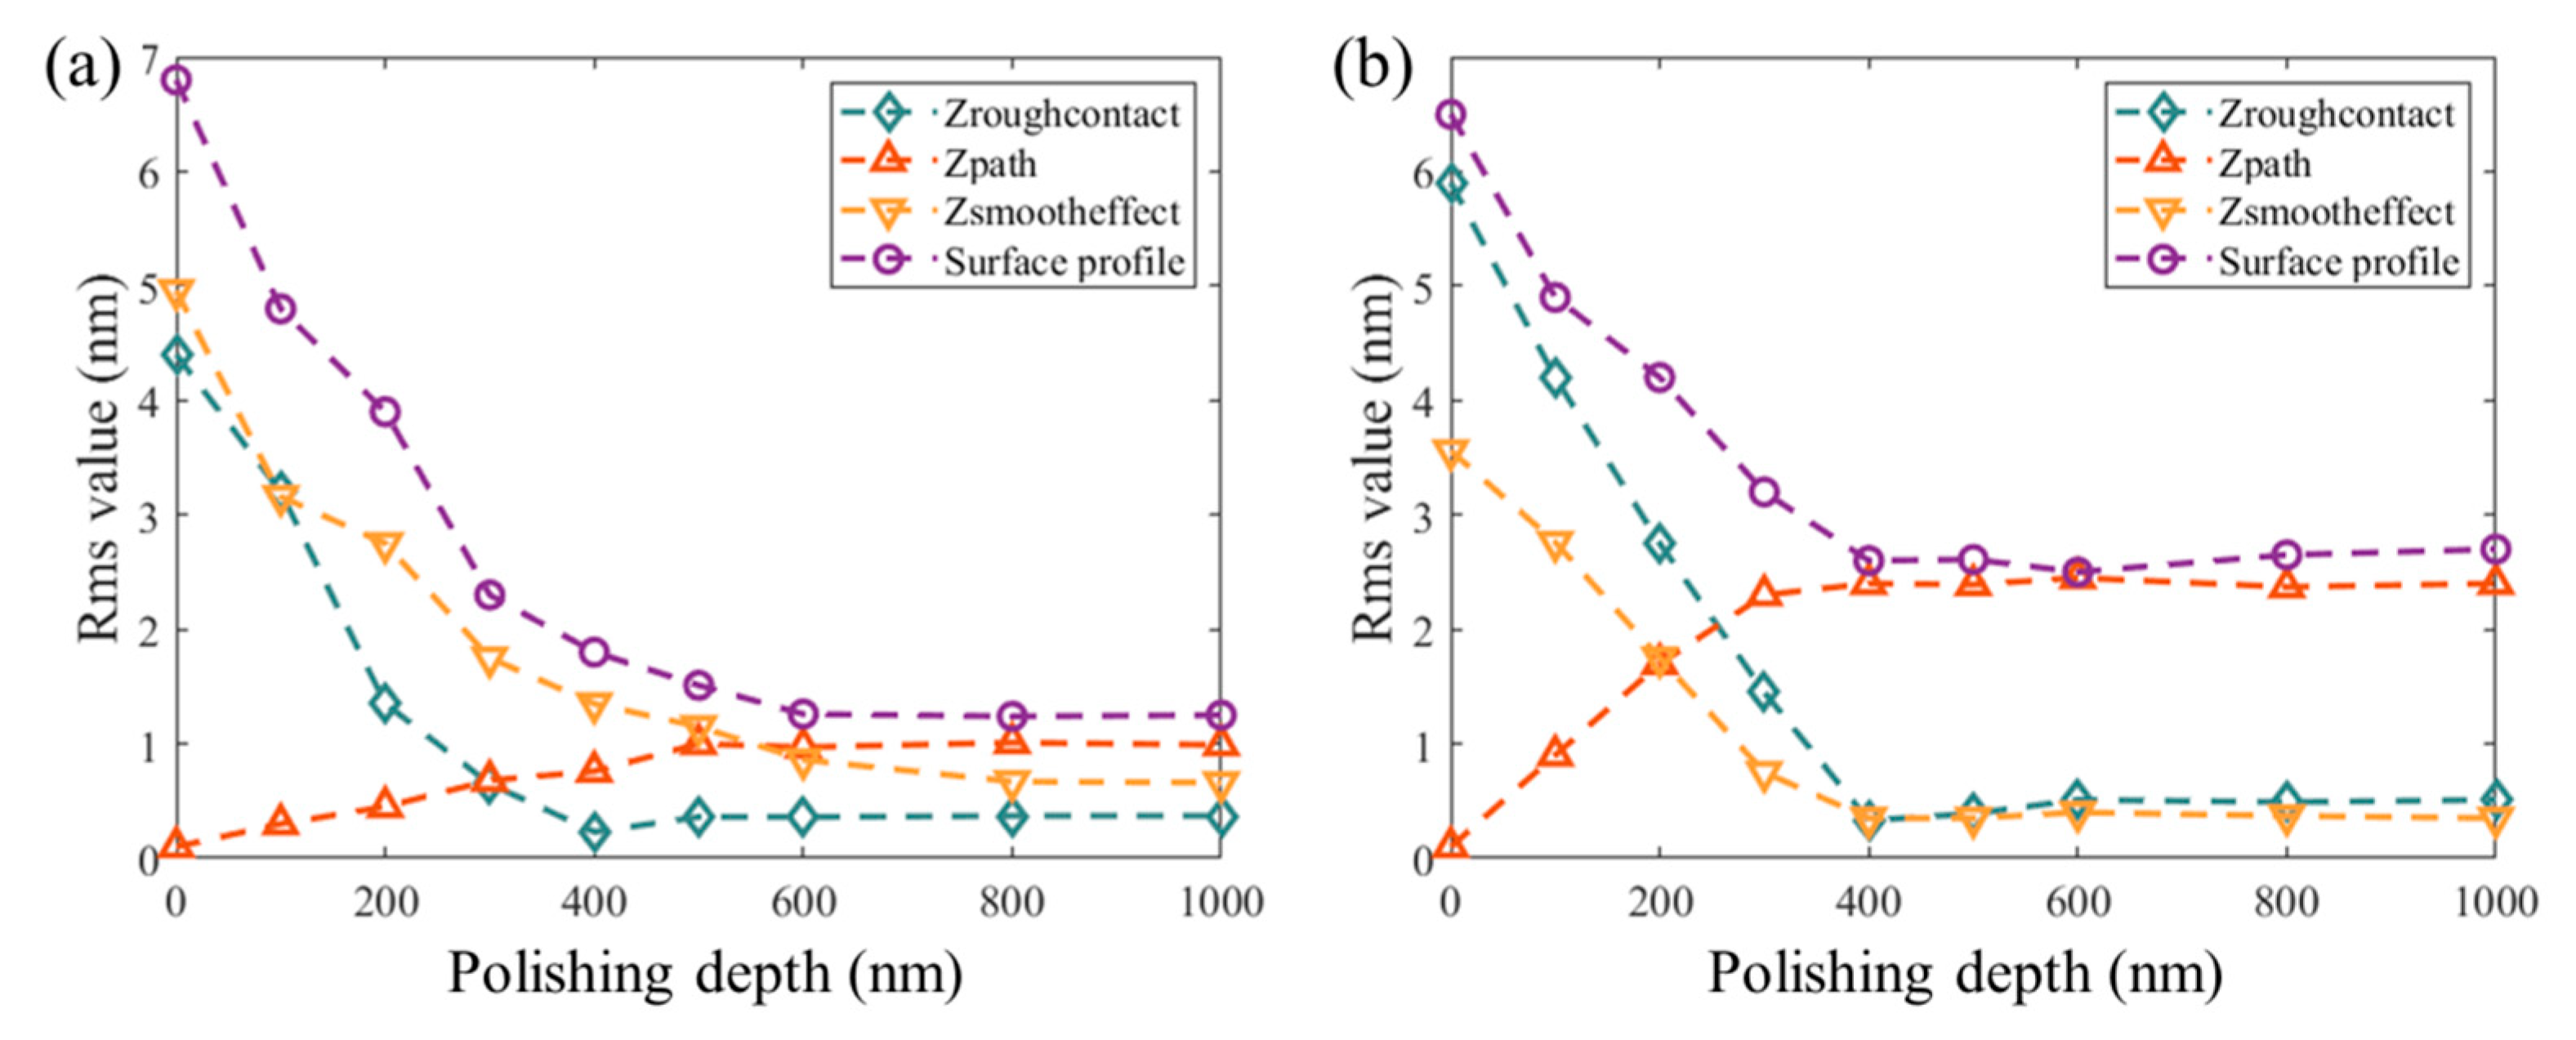
Then, the evolution of surface roughness, Zpath, Zroughcontact and Zsmootheffect was recorded, as shown in Figure 12. When the removal depth reached 1 μm, the surface MFEs converged to a stable value. For the surface polished with Tool A (Figure 12a), the Zsmootheffect and Zpath results were comparable, whereas for the surface polished with Tool B, Zpath dominated the surface profile. This difference arose from the significantly higher hardness of the polishing layer of Tool B compared with that of Tool A.
By substituting the measured results listed in Table 3 into Equations (8) and (18), the kp and kE of tool A can be calculated as 55.9 and 1.49, respectively. The kp and kE of tool B can be calculated as 151.3 and 2.28, respectively.
By substituting the measured results listed in Table 3 into Equation (14), the kf of tool A can be calculated as follows:
k f = 0 f f h 6 . 53 R m s ( Z 1 ) f < f h
The kf of tool B can be calculated as follows:
k f = 0 f f h 3 . 47 R m s ( Z 1 ) f < f h
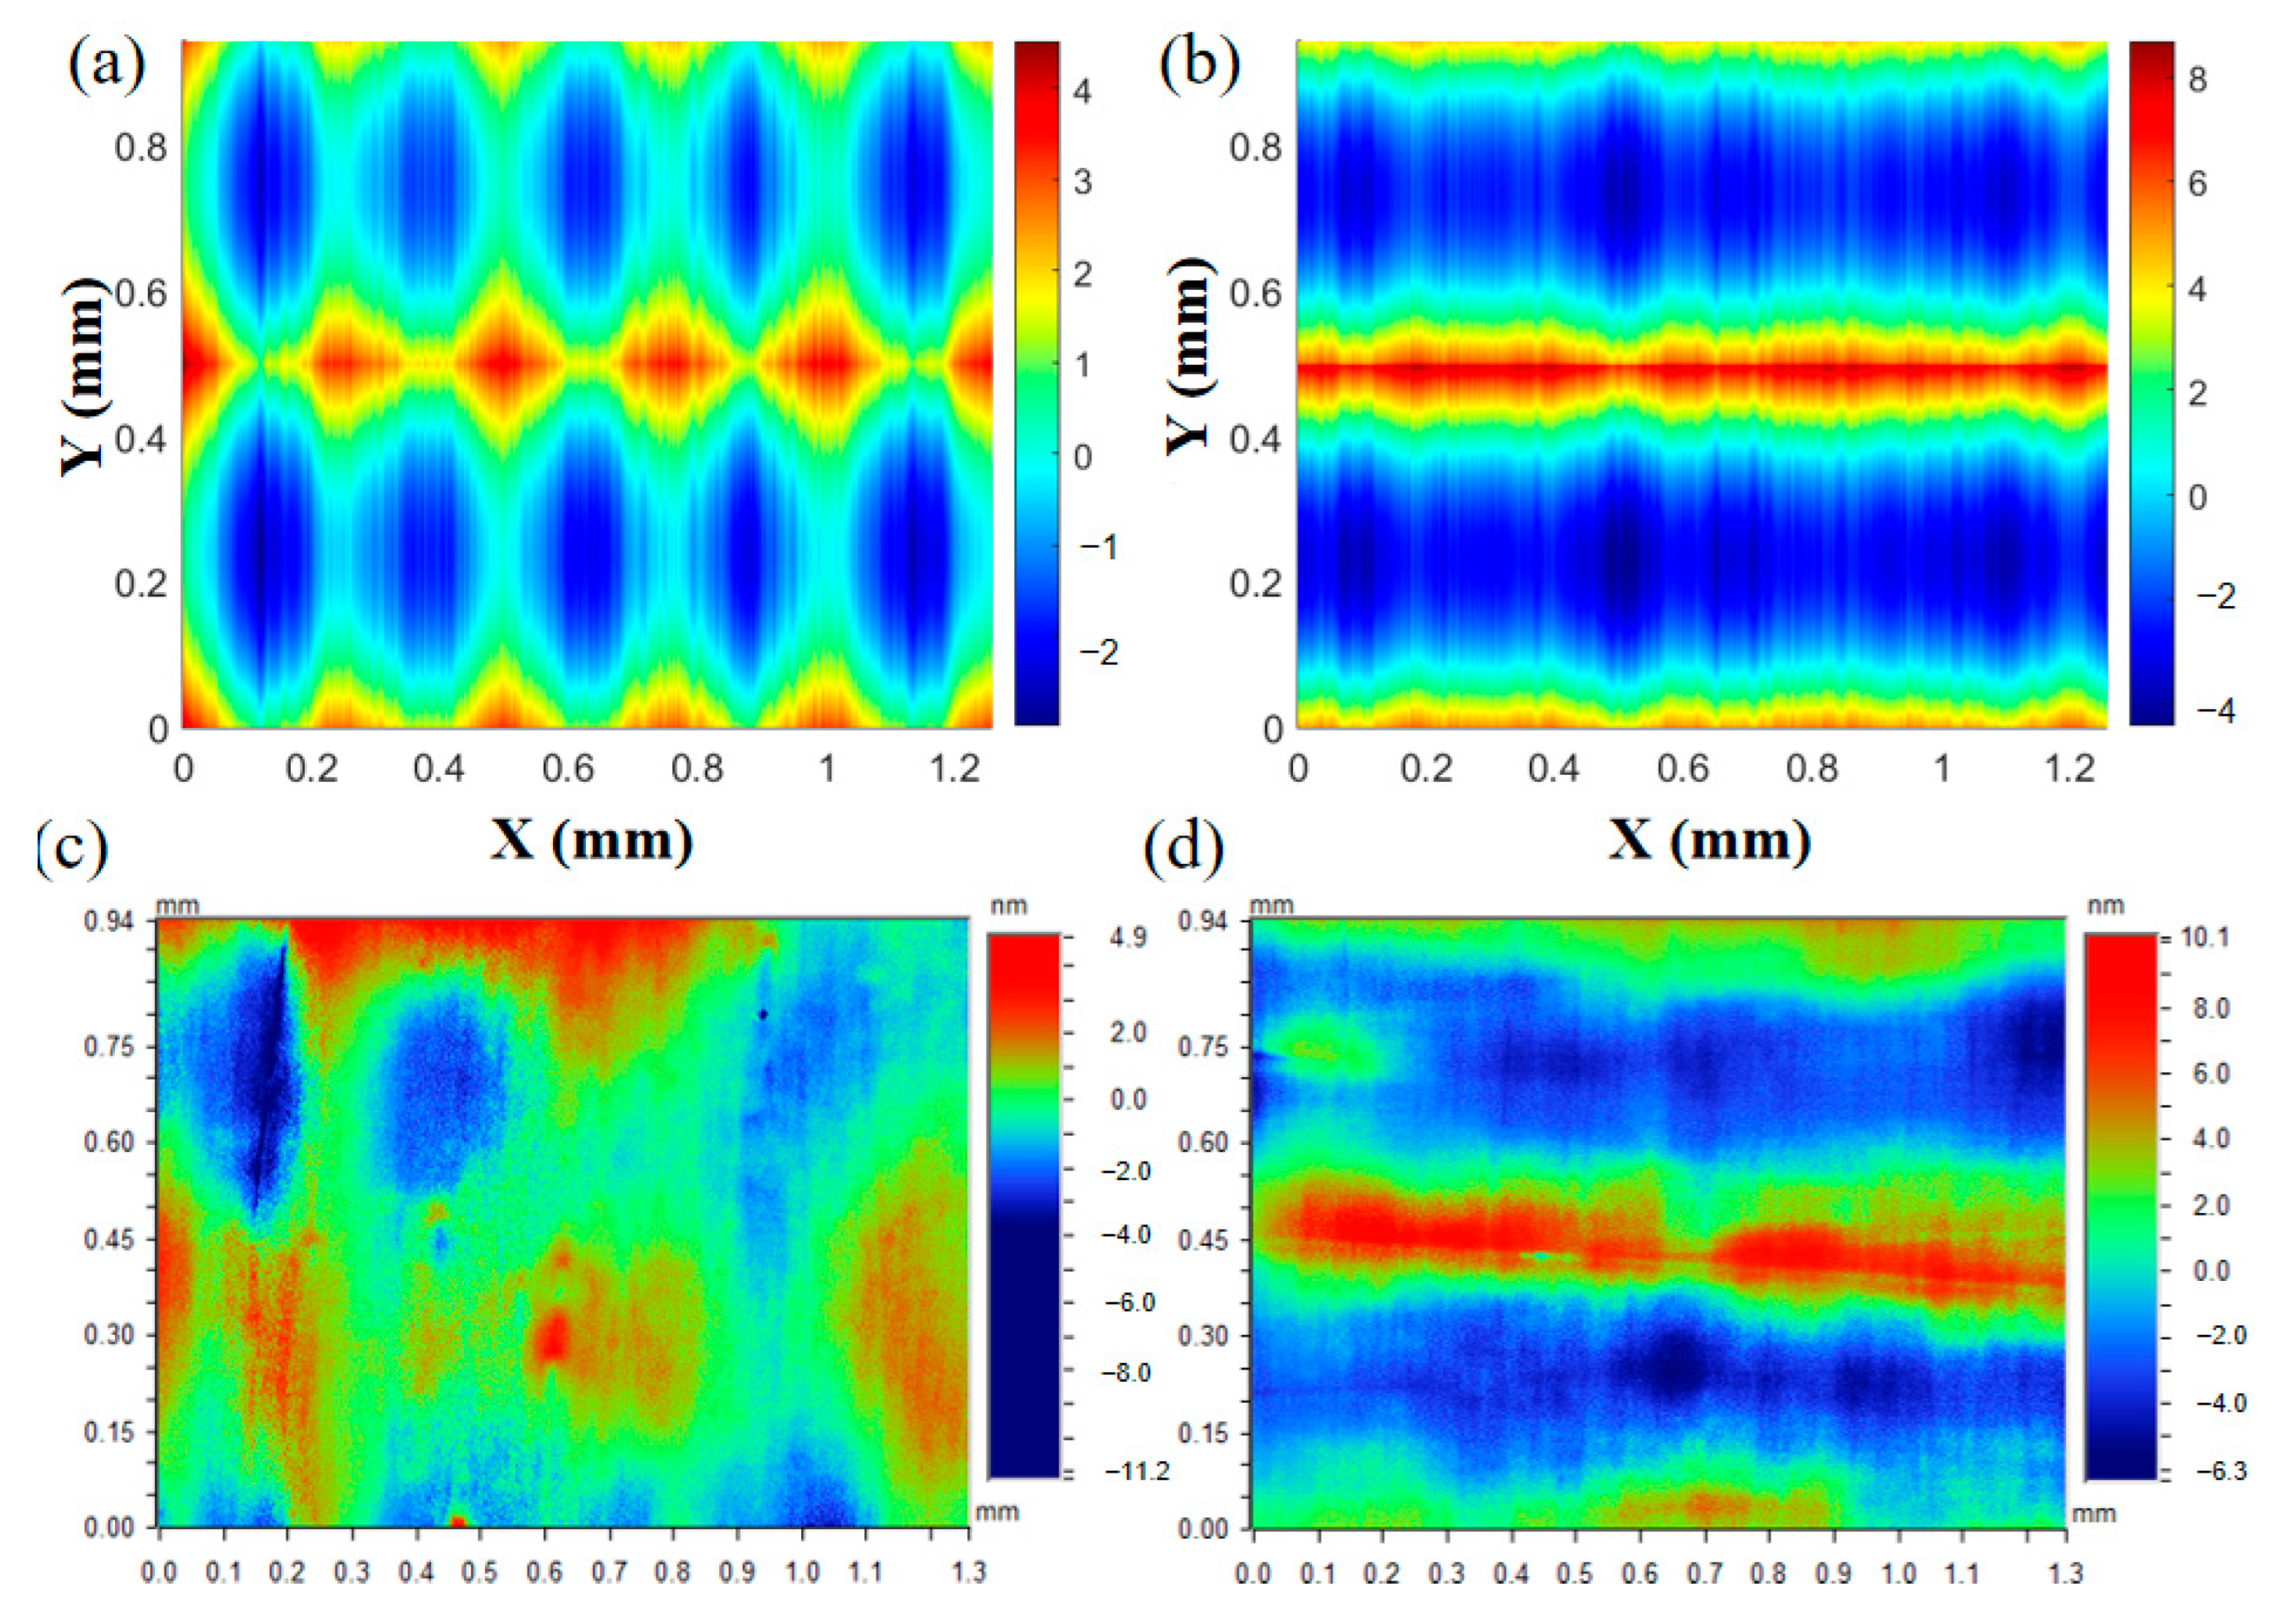
Using the calculated parameters, the modeled profiles for Tool A and Tool B are presented in Figure 13a and 13b, respectively. Figure 13c,d shows the measured surface profiles of the polished samples. The predicted profiles have a similar structure to the measured data.
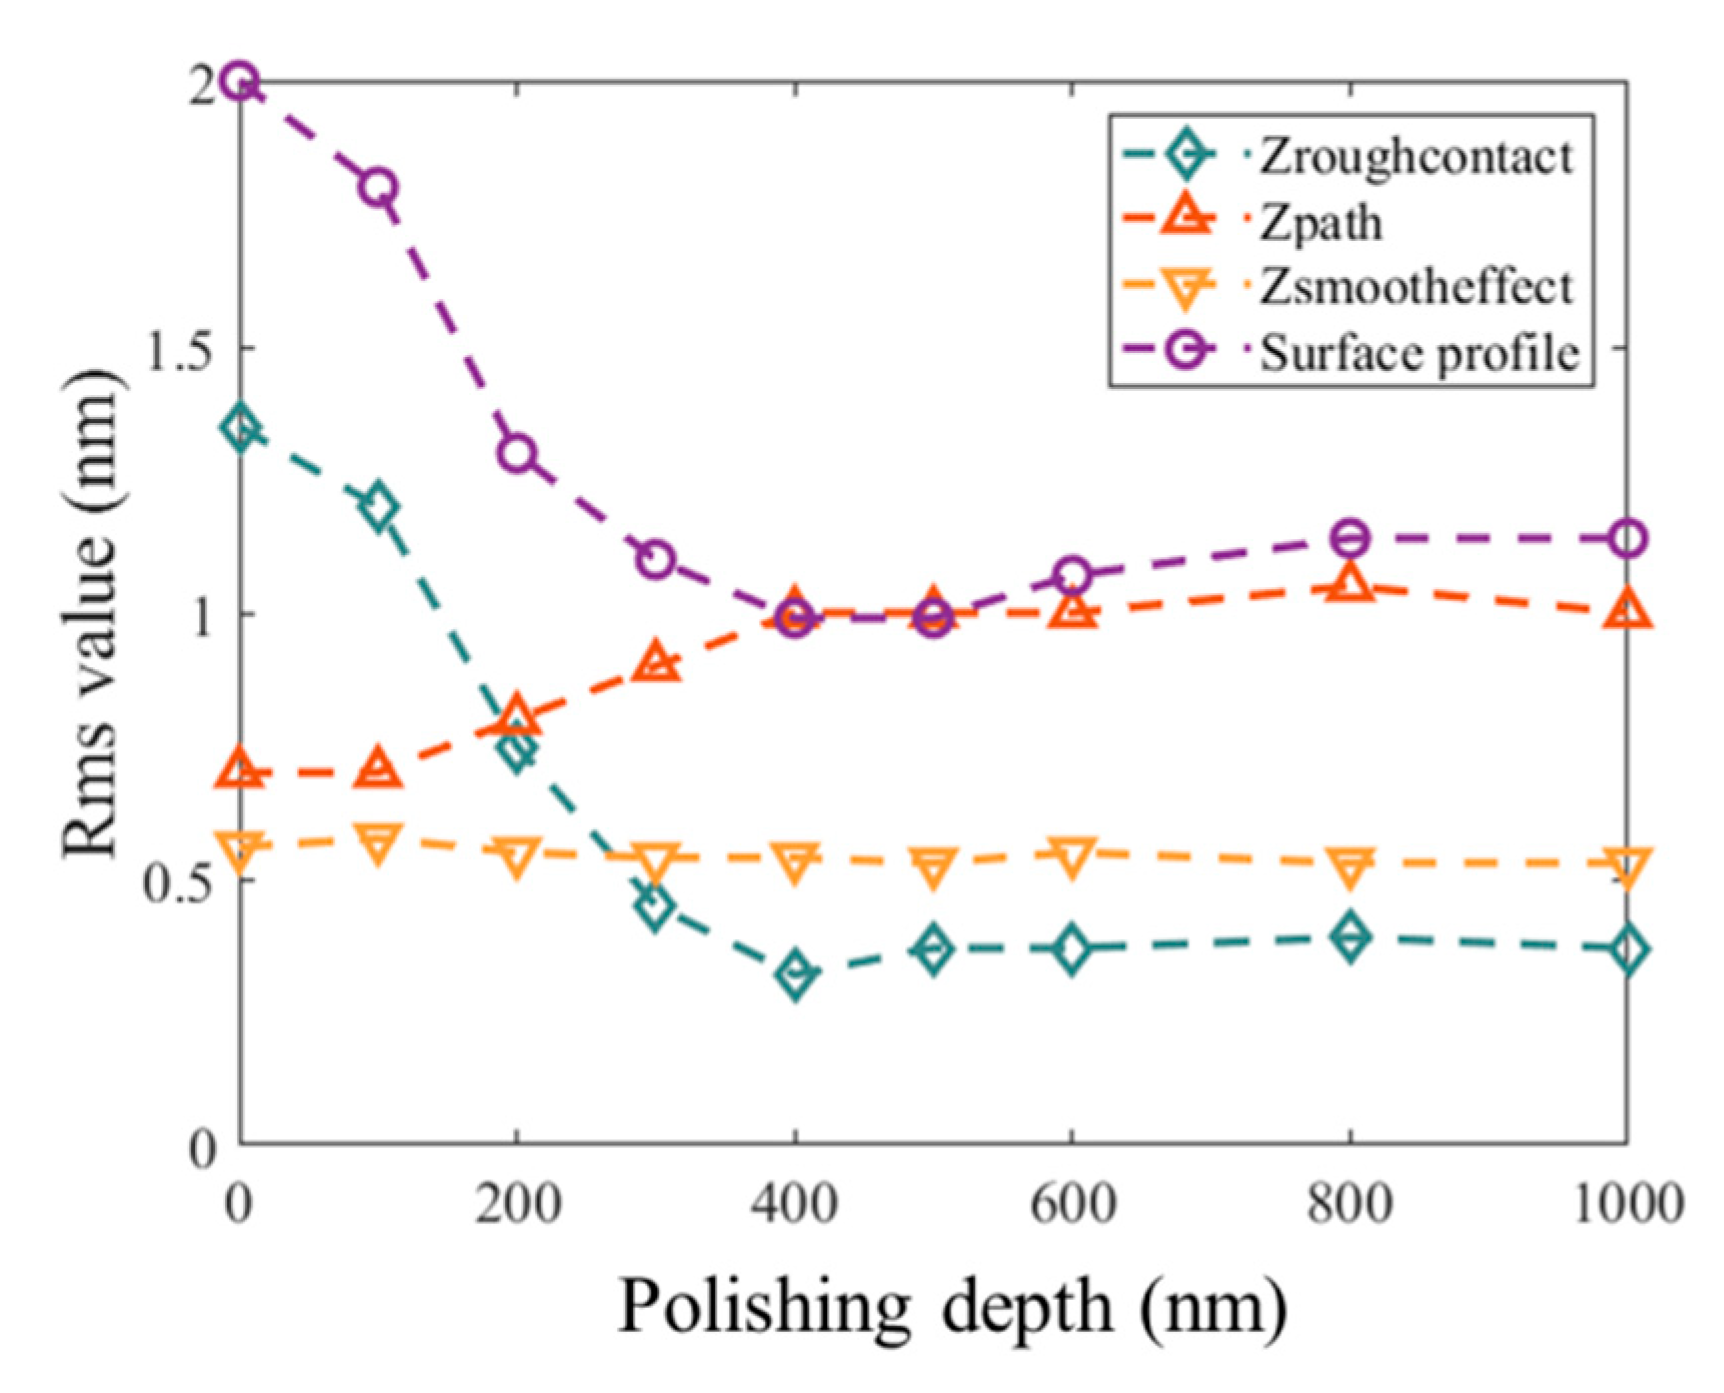
According to the analysis in Section 2, when the initial Zsmootheffect is sufficiently small, its change during polishing can be neglected. To verify this conclusion, another EN mirror with a smaller initial roughness was polished using Tool A; the evolution of the MFEs is shown in Figure 14. The initial Zsmootheffect was 0.57 nm Rms and remained stable throughout polishing. This result is consistent with the analysis.

4.2. Model Validation

In this section, simulations were conducted using the empirical parameters kp, kf and kE obtained in Section 4.1 to verify the accuracy of the proposed model. The Rms value of the MFEs is used as the evaluation metric. The validation study focused on three aspects: the influence of polishing force, tool roughness, and path spacing.

4.2.1. The Influence of Polishing Force

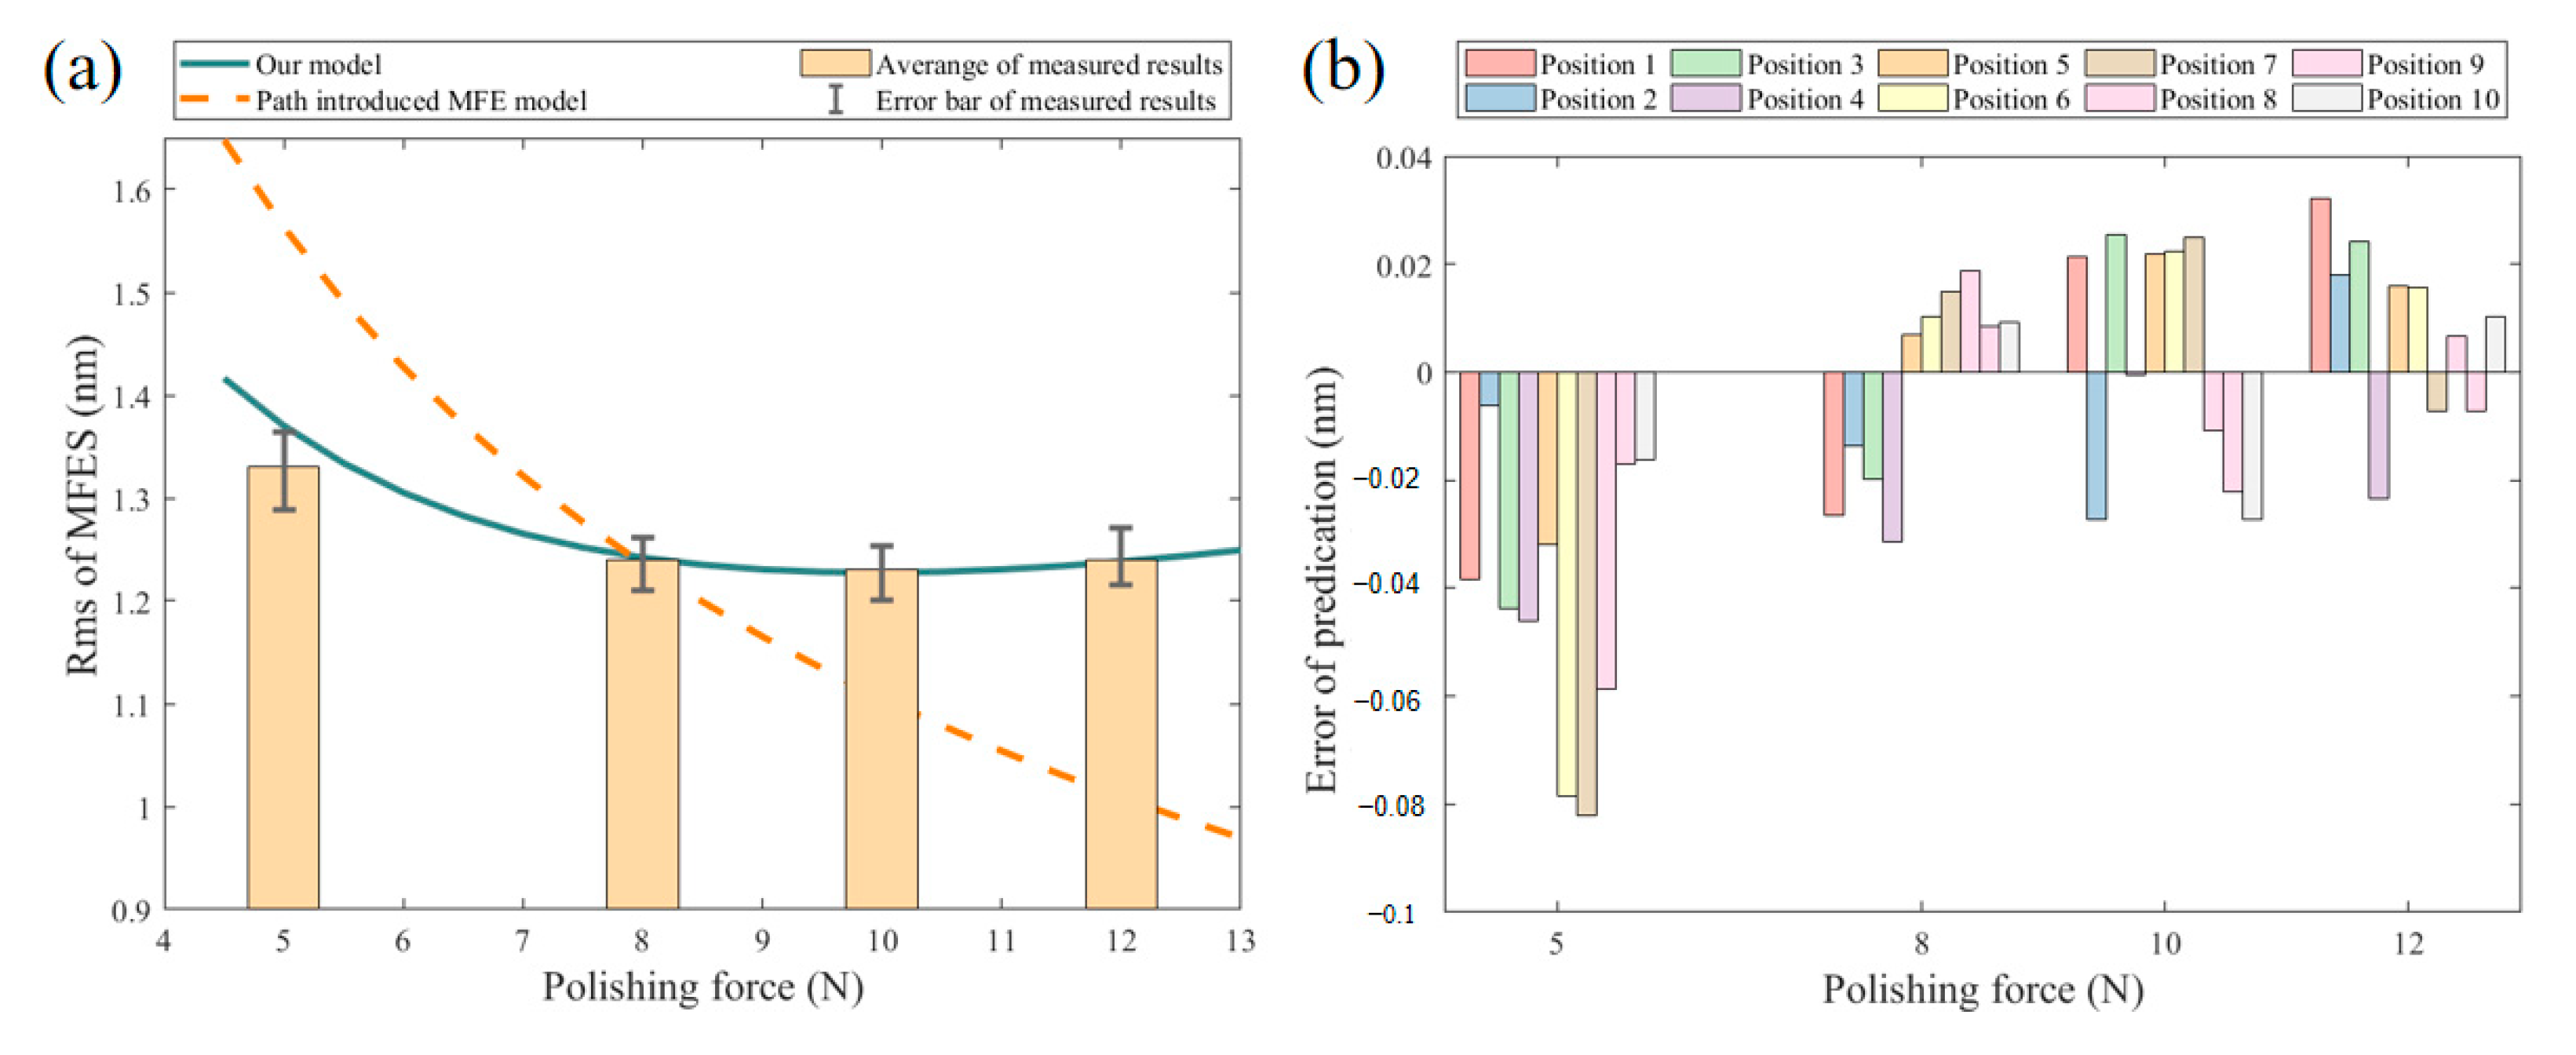
To verify the accuracy of our model, the predicted results were compared with experimental data and with the predictions of an MFEs model that considers only the path influence. The results are shown in Figure 15. The prediction errors of both models are close to zero when the polishing force is 8 N. For other polishing forces, the errors of our model are much smaller. This is because, in the parameter acquisition experiment in Section 4.1, a polishing force of 8 N was used. The prediction errors of our model are less than 0.1 nm, as listed in Table 4. Both the measured data and our model predictions consistently show that increasing the polishing force initially reduces the MFE; however, further increases lead to a rise in MFE. The MFEs model that considers only the path influence predicts that the MFE monotonically decreases with the increase in B. This indicates that our model is closer to the real situation.
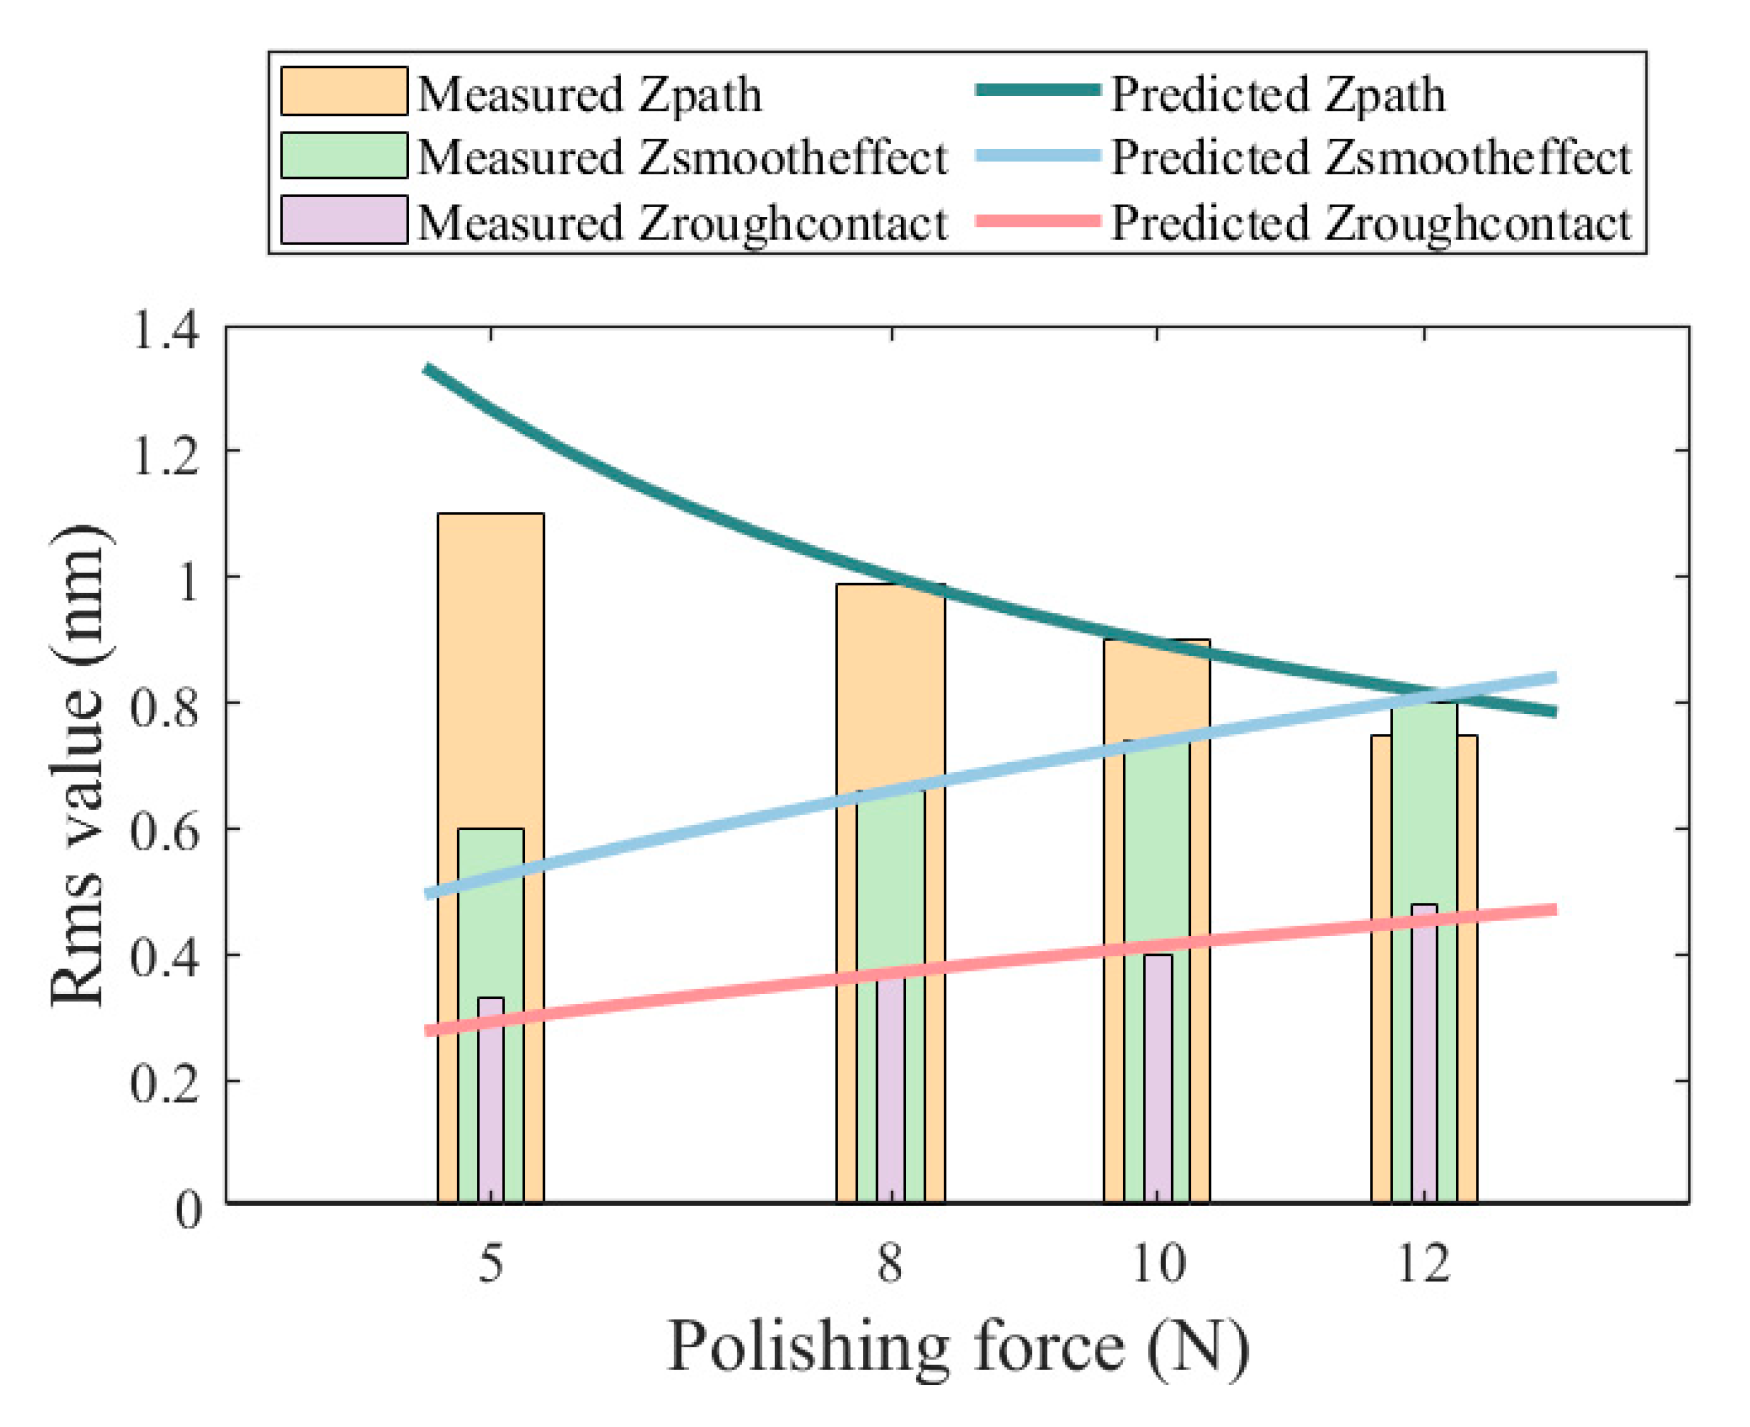
According to the analysis in Section 2, the polishing force influences Zpath, Zroughcontact and Zsmootheffect. Therefore, the values predicted by the model were compared with experimental results, as shown in Figure 16. Both the Zroughcontact and Zsmootheffect increase with the increase in polishing force, while the Zpath decreases. The figure demonstrates good agreement between predicted and measured data, confirming the accuracy of our model.

4.2.2. The Influence of Path Spacing

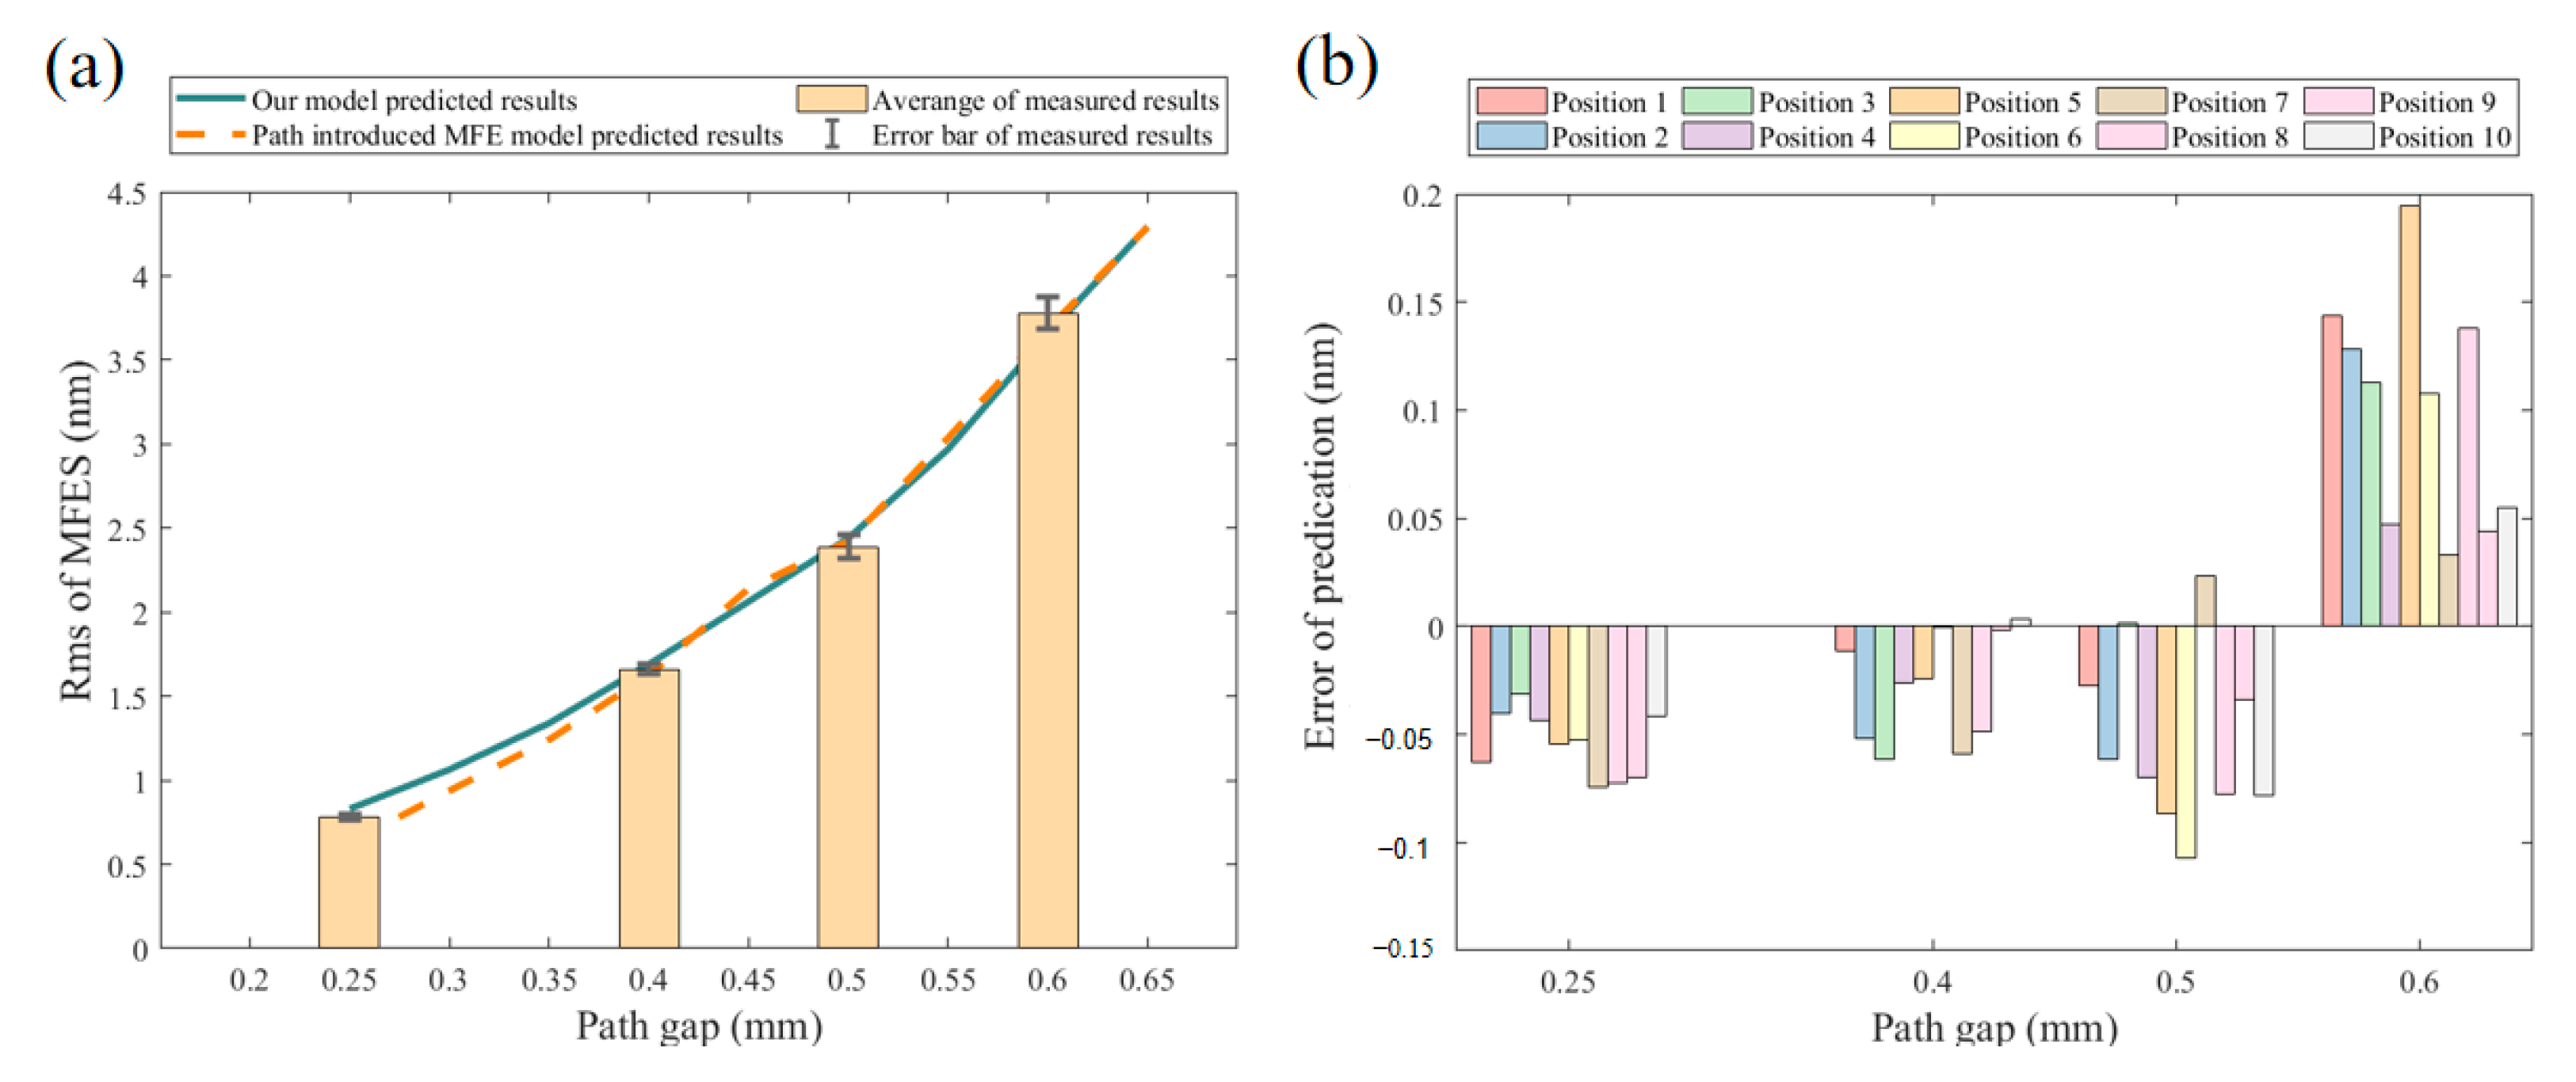
The experiments in this section were performed using Tool B. Figure 17 presents the measured results alongside the model predictions. The model indicates that the final MFEs decrease as the path spacing is reduced. When the polishing spacing is sufficiently large, the MFE caused by the path dominates the overall MFEs (as shown in Figure 13b,d). In this case, our model’s predictions closely match those of the path-only model, with errors less than 0.2 nm compared to the measurements (Figure 17b).
When the polishing spacing is below 0.3 mm, Zroughcontact and Zsmootheffect become significant relative to Zpath. Under these conditions, the path-only model underestimates the MFEs compared to experimental results, whereas the error between our model and the measurements still remains below 0.1 nm.
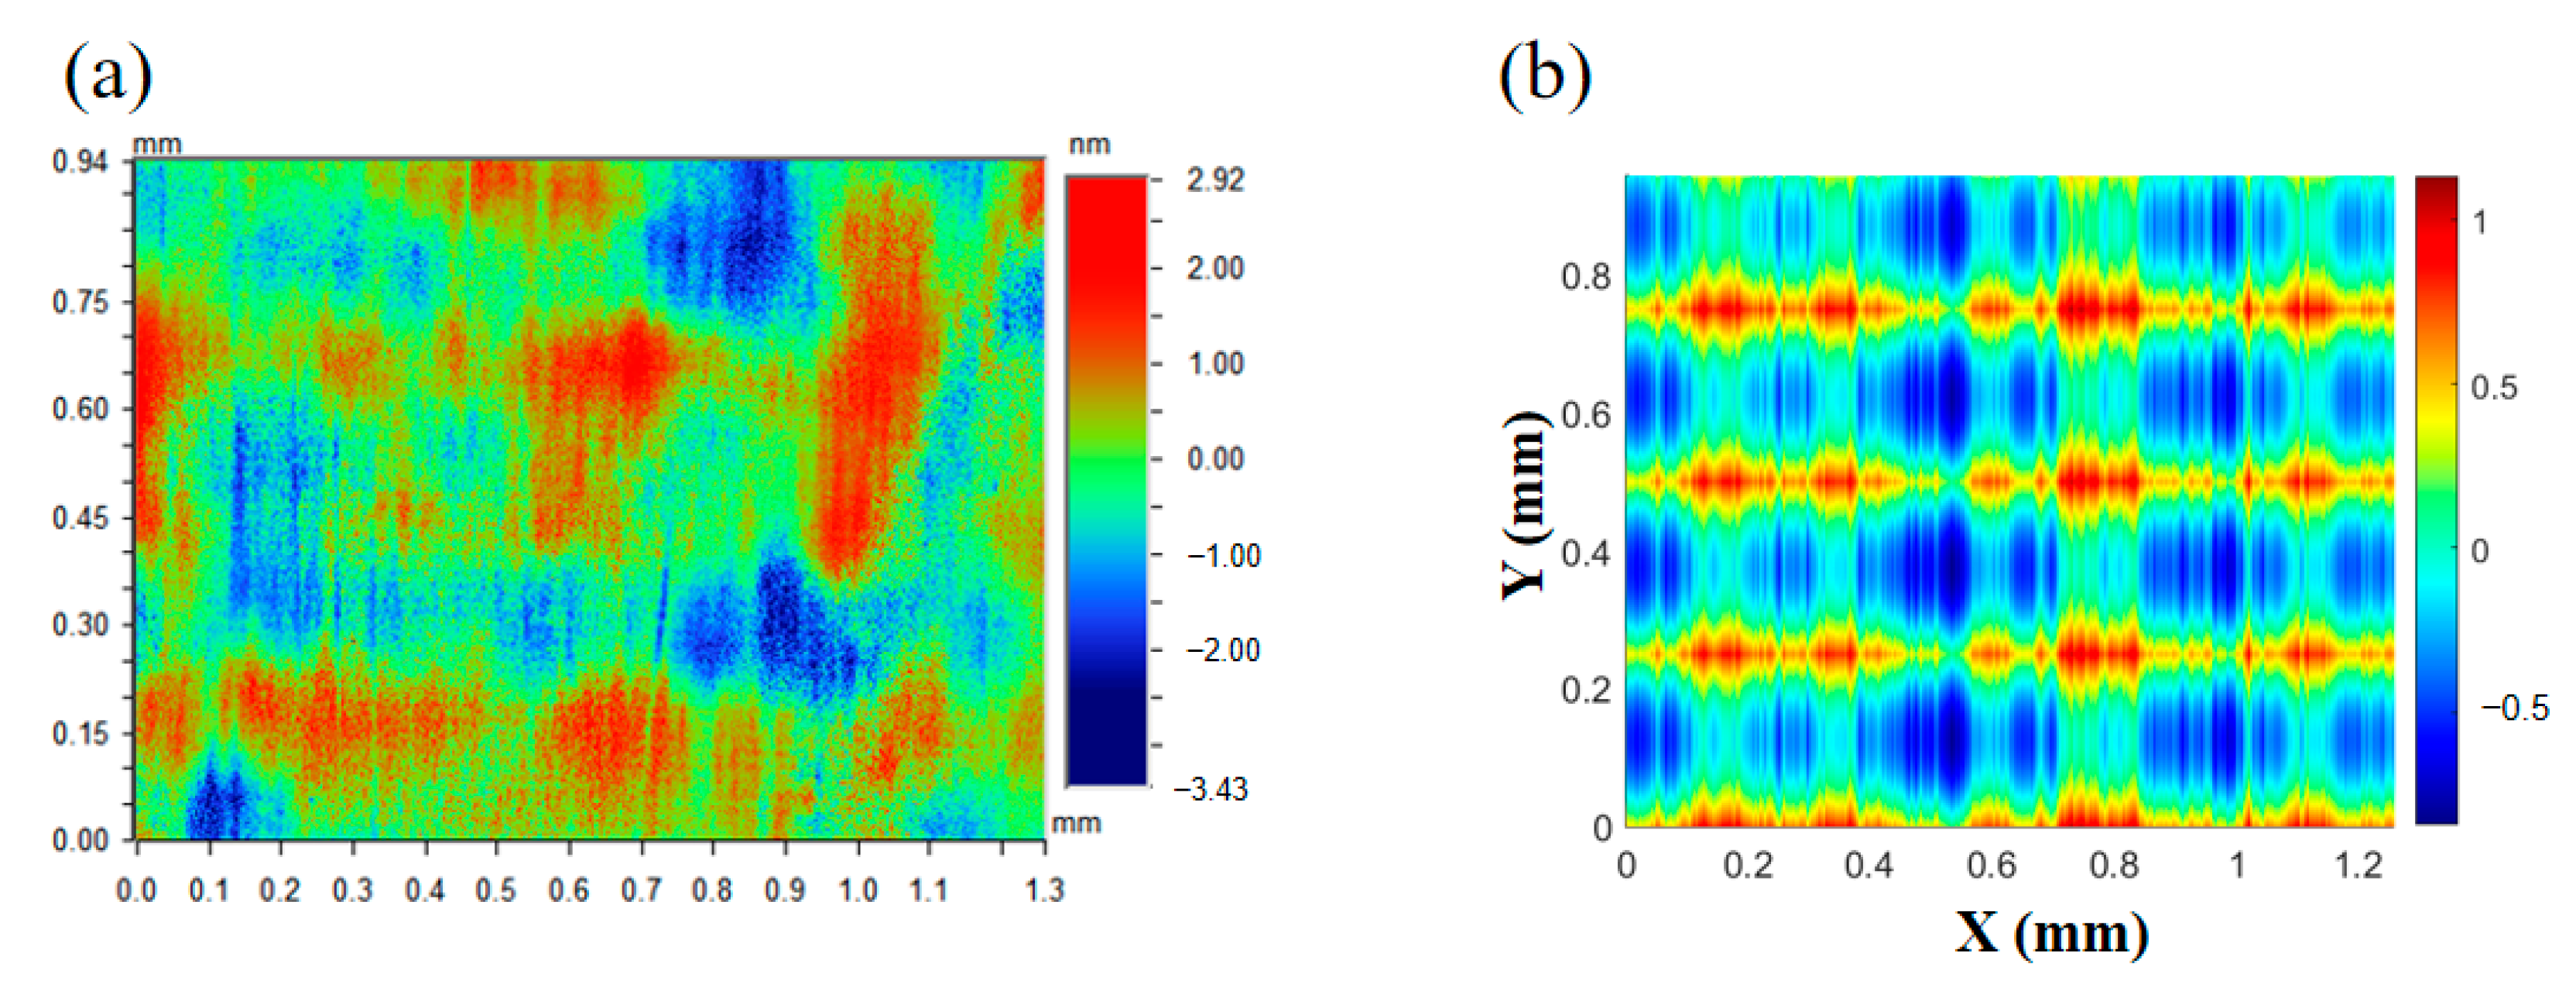
Figure 18a shows a representative measured surface profile at a path spacing of 0.25 mm, with the corresponding model prediction shown in Figure 18b. The periodic features caused by the path in the measured profile are less continuous and pronounced than in the prediction. We speculate that this discrepancy arises from random polishing errors, resulting in measured values that are smaller than predicted.

4.2.3. The Influence of Tool Roughness

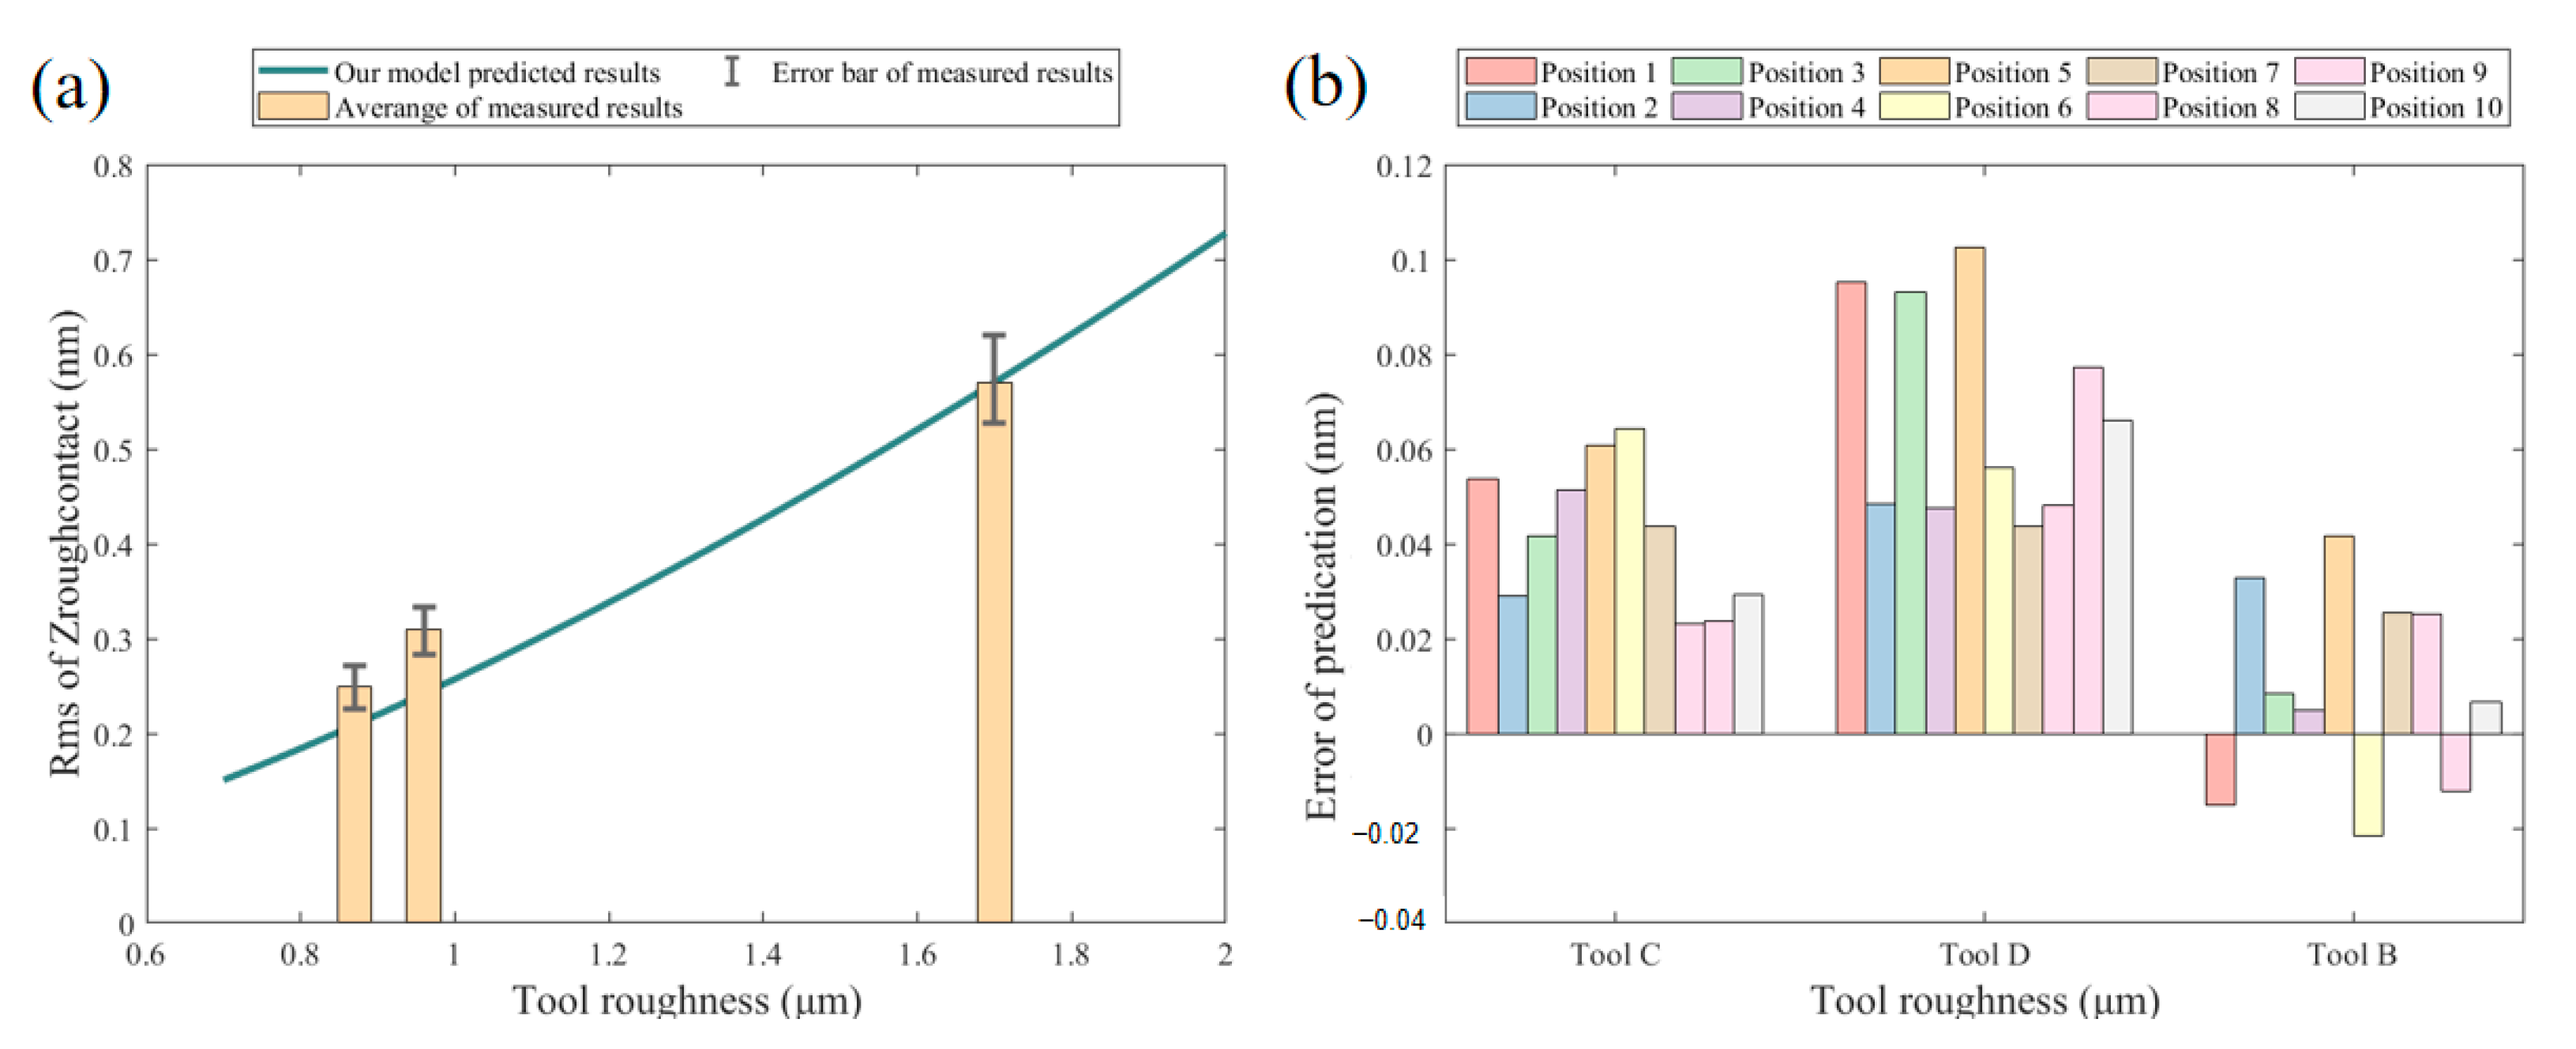
Experiments were conducted using three different polishing tools: Tool B, Tool C, and Tool D. Considering that tool roughness affects only Zroughcontact, only the Zroughcontact predicted by our model was compared with experimental results, as shown in Figure 18. Both the simulation and experimental results indicate that Zroughcontact will monotonically increase with the increase in tool roughness, as shown in Figure 19a.
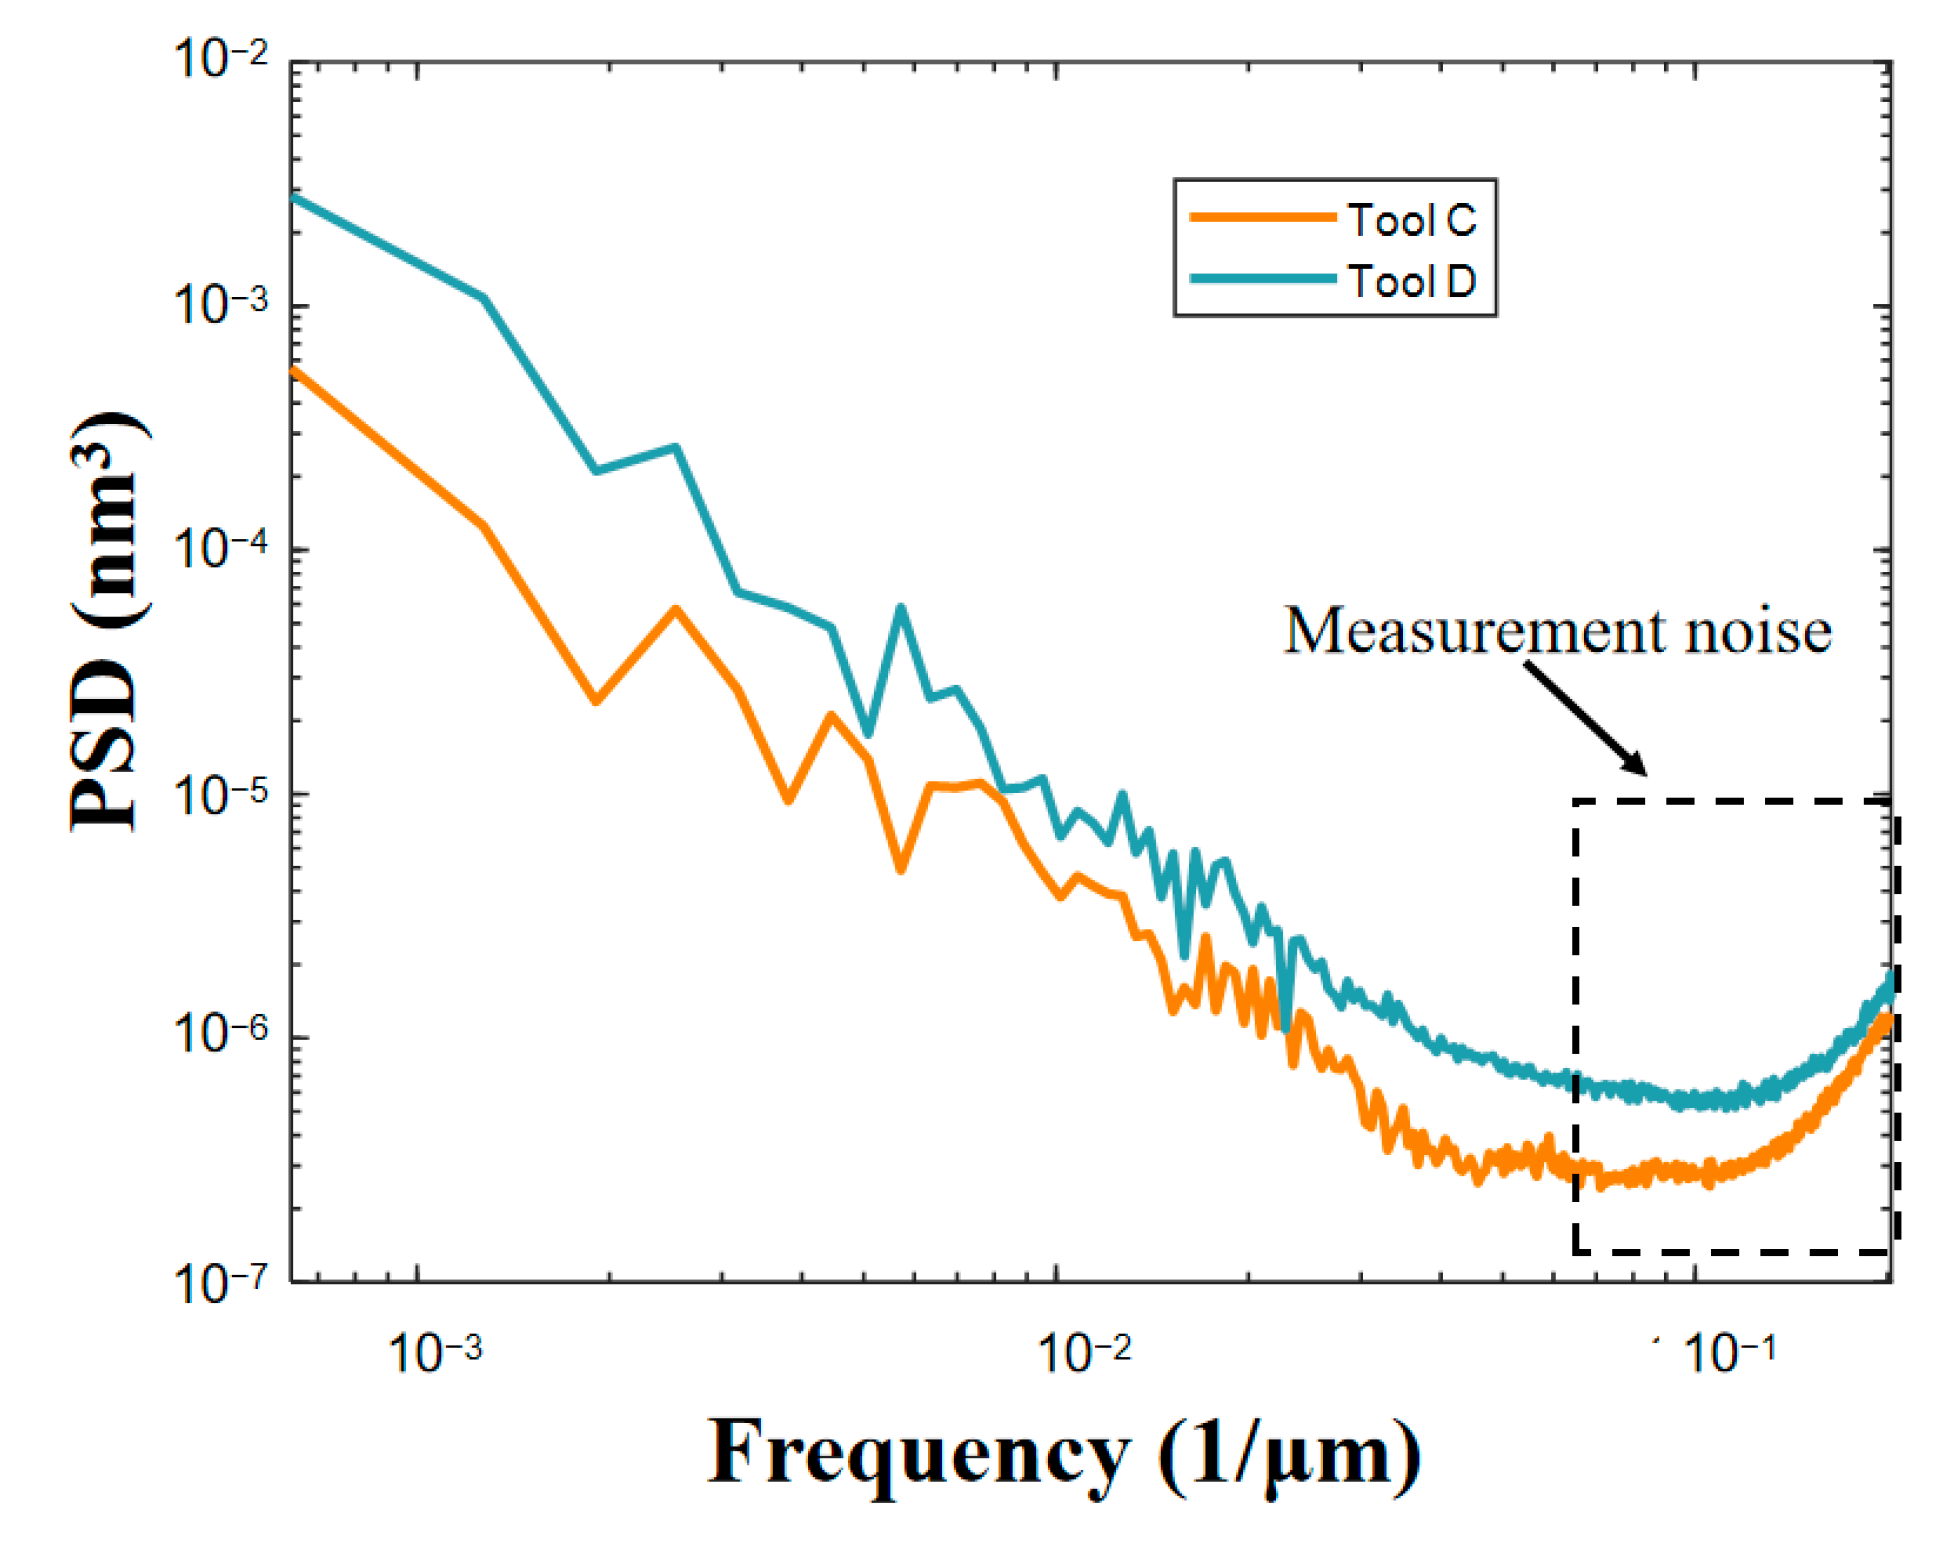
Although the error of the model is still less than 0.1 nm, as shown in Figure 19b, the relative error has reached nearly 30%. Figure 20 shows the one-dimension PSDs in the Zroughcontact direction of the surface polished with tool C and tool D. Evidently, the high-frequency part shows an upward tilt, which means that the measurement noise cannot be ignored. Therefore, the relative error of the model prediction may be caused by various factors, including measurement noise, model simplification, human errors, etc. Considering that the final error value is not very large, we still believe that the model’s prediction results are reliable.

4.3. Further Discussion: Engineering Application of Model

In the ultra-precision manufacturing of EN mirrors for X-ray applications, LFEs, MFEs, and HFEs must all be controlled to the nanometer or sub-nanometer level. Traditional computer-controlled optical surfacing methods can achieve nanometer-level LFEs and sub-nanometer-level HFEs, but face challenges in effectively suppressing MFEs. Semi-rigid tool polishing has been widely adopted for mitigating MFEs. When combined with CCOS, semi-rigid tool polishing enables full-spectrum surface error correction, eliminating the need for additional polishing processes.
The MFE prediction model established in this study incorporates both macro- and micro-scale contact behaviors. It not only enables accurate prediction of final MFEs based on selected process parameters but also provides theoretical guidance and supports process optimization for semi-rigid tool polishing, facilitating a balance between machining accuracy and efficiency. For instance, Figure 21 illustrates the predicted MFEs under various processing conditions of Tool A. If the target MFE is set to be less than 1.30 nm Rms, a corresponding threshold plane can be drawn in Figure 20. The parameter sets yielding predicted MFEs below this threshold can then be selected for the polishing process. By integrating the TRF model, the optimal polishing parameters that meet the MFE requirement with the highest remove rate can be determined.
Figure 21 marks the parameters for the optimal material removal rate (polishing force of 12 N, path gap of 0.5 mm) and optimal roughness (polishing force of 5 N, path gap of 0.25 mm) within the limitations of our processing instrument. Model simulations predicted that the “highest remove rate” parameters yield an MFE of 1.22 nm (Rms), while the “best roughness” parameters yield an MFE of 0.64 nm (Rms). Experiments were conducted using these parameters; the results are shown in Figure 22. The measured results show that the “highest remove rate” parameters yield an MFE of 1.24 nm (Rms), while the “best roughness” parameters yield an MFE of 0.59 nm (Rms). The experimental results are in close agreement with the predictions.

5. Conclusions

Semi-rigid tool polishing is widely used to remove the mid-frequency profile errors on the electroless nickel surface that are introduced by the diamond-turning process. In this paper, an MFE prediction model for the semi-rigid tool polishing of a diamond-turned electroless nickel surface is developed based on the multi-scale contact theory to guide the polishing parameters and tool selection. The main conclusions are as follows:
  • The MFE prediction model was developed by incorporating a Hertzian contact, rough surface contact, and bridging model. The key parameters were categorized into three groups: tool parameters, polishing parameters, and empirical parameters. The empirical parameters are associated with the structural properties of the polishing tool and the characteristics of the polishing slurry. Once these empirical parameters are determined through polishing experiments, the model can be used to guide the optimized selection of polishing and tool parameters for improved process performance;
  • The effects of tool roughness, polishing force, and path spacing were systematically investigated in this study. The model indicates that reduced tool roughness and smaller path spacing contribute to MFEs. In contrast, the relationship between the polishing force and MFEs is non-linear: The MFEs initially decrease with increasing force but begin to rise once the force is larger than a certain value;
  • Polishing experiments were carried out on diamond-turned electroless nickel plates to validate the proposed model. The predicted results show good agreement with the experimental data. Guided by this model, the “best roughness” polishing parameter within the limitations of our processing instrument was selected for the polishing experiments. The surface roughness achieved was 0.59 nm (Rms), measured over a 1.26 mm × 0.94 mm area, which closely matched the predicted value of 0.64 nm (Rms).
This study provides preliminary verification that the smoothing effect of the polishing tool, the rough surface contact between the tool and the mirror, and the Hertzian contact between the tool and the mirror all contribute to the mid-frequency errors of the final polished surface. Compared with models that consider only Hertzian contact between the mold and the mirror, our model demonstrates a significant improvement in predictive accuracy, particularly for tools with lower hardness. Although all experiments in this work were conducted using wheel-shaped tools, the model can be readily extended to polishing tools of other geometries. Furthermore, while this study explained the influence of smoothing effects and tool–mirror rough surface contact on MFEs, thereby deepening the understanding of their origins, the evaluation of the spatial-frequency ranges associated with each effect remains largely empirical. In addition, the velocity was regarded as stable in this study and the influence of velocity was not discussed. Future work will focus on quantitatively determining the spatial-frequency ranges and the influence of velocity.

Author Contributions

Conceptualization, P.S. and J.Y.; methodology, P.S.; software, J.X.; validation, P.S., K.W. and Z.W.; formal analysis, J.Y.; investigation, P.S. and J.X.; resources, K.W.; data curation, P.S. and J.X.; writing—original draft preparation, P.S. and J.Y.; writing—review and editing, K.W. and Z.W.; visualization, K.W. and Z.W.; supervision, Z.W.; project administration, Z.W.; funding acquisition, P.S. All authors have read and agreed to the published version of the manuscript.

Funding

This research was funded by National Natural Science Foundation of China (NSFC), grant number 12305365.

Data Availability Statement

The raw data supporting the conclusions of this article will be made available by the authors on request.

Conflicts of Interest

The authors declare no conflicts of interest.

Abbreviations

The following abbreviations are used in this manuscript:
ENElectroless nickel
LFEsLow-frequency errors
MFEsMid-frequency errors
HFEsHigh-frequency errors
RmsRoot-mean-square
PVPeak-to-valley
CMPChemical-mechanical polishing
TRFTool removal function
GWGreenwood–Williamson
STPSmall-tool polishing
PSDPower spectral density
2DTwo-dimensional
1DOne-dimensional

References

  1. Civitani, M.M.; Basso, S.; Incorvaia, S.; Lessio, L.; Pareschi, G.; Toso, G.; Vecchi, G. A novel approach for fast and effective realization of high-resolution x-ray optics in metal. In Proceedings of the SPIE Optical Engineering + Applications, San Diego, CA, USA, 1–5 August 2021; Volume 11822, pp. 258–270. [Google Scholar]
  2. Bachrach, R.Z.; Flodstrom, S.A.; Bauer, R.S.; Rehn, V.; Jones, V.O. Evaluation of the soft X-ray spectral throughput of platinum-coated, copper, synchrotron-radiation collection mirrors. Nucl. Instrum. Methods 1978, 152, 135–139. [Google Scholar] [CrossRef]
  3. Yamaguchi, G.; Motoyama, H.; Owada, S.; Kubota, Y.; Egawa, S.; Kume, T.; Takeo, Y.; Yabashi, M.; Mimura, H. Copper electroforming replication process for soft x-ray mirrors. Rev. Sci. Instrum. 2021, 92, 123106. [Google Scholar] [CrossRef] [PubMed]
  4. Xue, L.; Si, S.; Zhang, H.; He, Y.; Tian, N.; Zhao, C.; Zhang, Y.; Mo, Q.; Sun, H.; Li, Z.; et al. X-ray optics development and metrology at Shanghai synchrotron radiation facility. In Proceedings of the International Conference on Optical and Photonic Engineering (icOPEN 2023), Singapore, 27 November–1 December 2023; Volume 13069, pp. 313–321. [Google Scholar]
  5. Pimenov, D.Y.; Kiran, M.; Khanna, N.; Pintaude, G.; Vasco, M.C.; da Silva, L.R.R.; Giasin, K. Review of improvement of machinability and surface integrity in machining on aluminum alloys. Int. J. Adv. Manuf. Technol. 2023, 129, 4743–4779. [Google Scholar] [CrossRef]
  6. Hibbard, D.L. Electroless nickel for optical applications. In Proceedings of the Optical Science, Engineering and Instrumentation ′97, San Diego, CA, USA, 27 July–1 August 1997; Volume 10289, pp. 173–199. [Google Scholar]
  7. Signorato, R.; del Rio, M.S. Structured slope errors on real x-ray mirrors: Ray tracing versus Experiment. In Proceedings of the Optical Science, Engineering and Instrumentation ′97, San Diego, CA, USA, 27 July–1 August 1997; Volume 3152, pp. 136–147. [Google Scholar]
  8. Raimondi, L.; Spiga, D. Mirrors for X-ray telescopes: Fresnel diffraction-based computation of point spread functions from metrology. Astron. Astrophys 2015, 573, A22. [Google Scholar] [CrossRef]
  9. Werzer, O.; Kowarik, S.; Gasser, F.; Jiang, Z.; Strzalka, J.; Nicklin, C.; Resel, R. X-ray diffraction under grazing incidence conditions. Nat. Rev. Methods Primers 2024, 4, 15. [Google Scholar] [CrossRef]
  10. Soufli, R.; Fernandez-Perea, M.; Baker, S.L.; Robinson, J.C.; Gullikson, E.M.; Heimann, P.; Yashchuk, V.V.; McKinney, W.R.; Schlotter, W.F.; Rowen, M. Development and calibration of mirrors and gratings for the soft x-ray materials science beamline at the Linac Coherent Light Source free-electron laser. Appl. Opt. 2012, 51, 2118–2128. [Google Scholar] [CrossRef]
  11. Windt, D.L.; Waskiewicz, W.K.; Griffith, J.E. Surface finish requirements for soft x-ray mirrors. Appl. Opt. 1994, 33, 2025–2031. [Google Scholar] [CrossRef]
  12. Pramanik, A.; Neo, K.S.; Rahman, M.; Li, X.P.; Sawa, M.; Maeda, Y. Cutting performance of diamond tools during ultra-precision turning of electroless-nickel plated die materials. J. Mater. Process. Technol. 2003, 140, 308–313. [Google Scholar] [CrossRef]
  13. Chon, K.S.; Namba, Y. Single-point diamond turning of electroless nickel for flat X-ray mirror. J. Mech. Sci. Technol. 2010, 24, 1603–1609. [Google Scholar] [CrossRef]
  14. Pramanik, A.; Neo, K.S.; Rahman, M.; Li, X.P.; Sawa, M.; Maeda, Y. Ultraprecision turning of electroless nickel: Effects of crystal orientation and origin of diamond tools. Int. J. Adv. Manuf. Technol. 2009, 43, 681–689. [Google Scholar] [CrossRef]
  15. Pradhan, P.; Shurvinton, R.; Bourgenot, C.; Wang, H.; Sawhney, K. Ultra-high precision NiP mirror fabrication using ion beam figuring for space applications. Opt. Express 2025, 33, 17721–17734. [Google Scholar] [CrossRef] [PubMed]
  16. Kang, J.G.; Jeong, S.K.; Jeon, M.; Jeong, B.; Yeo, W.J.; Choi, H.J.; Kwon, Y.E.; Ham, J.; Kim, J.H.; Lee, W. Magnetorheological finishing of electroless nickel-phosphorus-plated mold for ultraprecision injection molding. Int. J. Adv. Manuf. Technol. 2024, 131, 1705–1716. [Google Scholar] [CrossRef]
  17. Shurvinton, R.; Wang, H.; Pradhan, P.; Nistea, I.T.; Alcock, S.; Bazan Da Silva, M.; Majhi, A.; Sawhney, K. Ion beam figuring for X-ray mirrors: History, state-of-the-art and future prospects. J. Synchrotron Radiat. 2024, 31, 655–669. [Google Scholar] [CrossRef]
  18. Wang, W.; Ji, S.; Zhao, J. Review of magnetorheological finishing on components with complex surfaces. Int. J. Adv. Manuf. Technol. 2024, 131, 3165–3191. [Google Scholar] [CrossRef]
  19. Jones, R.A.; Rupp, W.J. Rapid optical fabrication with computer-controlled optical surfacing. Opt. Eng. 1991, 30, 1962–1968. [Google Scholar] [CrossRef]
  20. Xue, J.; Wang, B.; Liao, Q.; Wu, K.; Liu, Y.; Wu, Y.; Chen, W.; Qiao, Z.; Jin, Y.; Ding, F.; et al. Precision Manufacturing in China of Replication Mandrels for Ni-Based Monolithic Wolter-I X-ray Mirror Mandrels. Aerospace 2024, 11, 849. [Google Scholar] [CrossRef]
  21. Li, F.; Bai, Y.; Hu, H.; Li, L.; Li, L.; Zhang, F.; Luo, X.; Zhang, X. Elastoplastic contact model of pitch-based rough surface and its polishing characteristics. Opt. Express 2024, 31, 42150–42164. [Google Scholar] [CrossRef] [PubMed]
  22. Xu, C.; Song, J.; Liu, X.; Lee, C.H.; Marinescu, I.D.; Hui, J.; Guo, L. Precision and ultra-precision machining with elastic polishing tools: A review. Surf. Sci. Technol. 2025, 3, 9. [Google Scholar] [CrossRef]
  23. Beaucamp, A.T.; Freeman, R.R.; Matsumoto, A.; Namba, Y. Fluid jet and bonnet polishing of optical moulds for application from visible to x-ray. In Proceedings of the SPIE Optical Engineering + Applications, San Diego, CA, USA, 21–25 August 2011; Volume 8126, pp. 240–247. [Google Scholar]
  24. Namba, Y.; Shimomura, T.; Fushiki, A.; Beaucamp, A.; Inasaki, I.; Kunieda, H.; Ogasaka, Y.; Yamashita, K. Ultra-precision polishing of electroless nickel molding dies for shorter wavelength applications. CIRP Ann. 2008, 57, 337–340. [Google Scholar] [CrossRef]
  25. Beaucamp, A.; Namba, Y. Super-smooth finishing of diamond turned hard X-ray molding dies by combined fluid jet and bonnet polishing. CIRP Ann. 2013, 62, 315–318. [Google Scholar] [CrossRef]
  26. Xue, J.; Chu, Y.; Liu, Y.; Liao, Q.; Chen, W.; Wu, Y.; Ding, F.; Wang, B.; Li, G.; Wang, D.; et al. Influence analysis of surface particulate and molecular contamination in CMP process of mandrel for EP focusing mirror. Radiat. Detect. Technol. Methods 2025, 9, 344–354. [Google Scholar] [CrossRef]
  27. Ghosh, G.; Sidpara, A.; Bandyopadhyay, P.P. Brittle-ductile transition in compliant finishing of HVOF sprayed hard WC-Co coating. Int. J. Refract. Met. H. 2021, 99, 105610. [Google Scholar] [CrossRef]
  28. Feng, H.; Huang, L.; Huang, P.; Liu, J.; He, X.; Peng, Y. Review on high efficiency and high precision compliant polishing method. Int. J. Adv. Manuf. Technol. 2024, 132, 2091–2128. [Google Scholar] [CrossRef]
  29. Wang, X.; Gao, H.; Yuan, J. Experimental investigation and analytical modelling of the tool influence function of the ultra-precision numerical control polishing method based on the water dissolution principle for KDP crystals. Precis. Eng. 2020, 65, 185–196. [Google Scholar] [CrossRef]
  30. Yang, K.; Di, H.; Huang, N.; Hou, C.; Zhou, P. Surface microtopography evolution of monocrystalline silicon in chemical mechanical polishing. J. Mater. Process. Technol. 2024, 328, 118387. [Google Scholar] [CrossRef]
  31. Deng, Y.; Hou, X.; Li, B.; Wang, J.; Zhang, Y. Review on mid-spatial frequency error suppression in optical components manufacturing. Int. J. Adv. Manuf. Technol. 2023, 126, 4827–4847. [Google Scholar] [CrossRef]
  32. He, Z.; Hai, K.; Li, K.; Yu, J.; Wu, L.; Zhang, L.; Su, X.; Cai, L.; Huang, W.; Hang, W. Research on the influence of the material removal profile of a spherical polishing tool on the mid-spatial frequency errors of optical surfaces. Micromachines 2024, 15, 654. [Google Scholar] [CrossRef]
  33. Li, S.; Wang, K.; Ai, H.; Ren, P.; Wang, Z. Middle–high spatial frequency error suppression of a self-organizing map pseudorandom path planning method in complex surface polishing. Appl. Opt. 2025, 64, 3936–3946. [Google Scholar] [CrossRef] [PubMed]
  34. Tam, H.Y.; Cheng, H. An investigation of the effects of the tool path on the removal of material in polishing. J. Mater. Process. Technol. 2010, 210, 807–818. [Google Scholar] [CrossRef]
  35. Liao, D.; Yuan, Z.; Tang, C.; Xie, R.; Chen, X. Mid-Spatial Frequency Error (PSD-2) of optics induced during CCOS and full-aperture polishing. J. Eur. Opt. Soc.-Rapid 2013, 8, 13031. [Google Scholar] [CrossRef]
  36. Greenwood, J.A.; Williamson, J.P. Contact of nominally flat surfaces. Proc. R. Soc. Lond. Ser. A Math. Phys. Sci. 1966, 295, 300–319. [Google Scholar]
  37. Vlassak, J.J. A model for chemical–mechanical polishing of a material surface based on contact mechanics. J. Mech. Phys. Solids 2004, 52, 847–873. [Google Scholar] [CrossRef]
  38. Nguyen, V.H.; Daamen, R.; van Kranenburg, H.; van der Velden, P.; Woerlee, P.H. A physical model for dishing during metal CMP. J. Electrochem. Soc. 2003, 150, G689. [Google Scholar] [CrossRef]
  39. Luo, J.; Dornfeld, D.A. Material removal mechanism in chemical mechanical polishing: Theory and modeling. IEEE Trans. Semicond. Manuf. 2001, 14, 112–133. [Google Scholar] [CrossRef]
  40. Jones, R.A. Optimization of computer controlled polishing. Appl. Opt. 1997, 16, 218–224. [Google Scholar] [CrossRef]
  41. Johnson, K.L. One hundred years of Hertz contact. Proc. Inst. Mech. Eng. 1982, 196, 363–378. [Google Scholar] [CrossRef]
  42. Wang, Z.; Wang, Z.; Liang, Y.; Meng, F.; Cui, Z.; Chen, T.; Yang, Y.; Fan, C.; Yu, T.; Zhao, J. Modelling of polyurethane polishing pad surface topography and fixed-point polished surface profile. Tribol. Int. 2024, 195, 109646. [Google Scholar] [CrossRef]
  43. Zhang, L.; Wan, S.; Li, H.; Guo, H.; Wei, C.; Zhang, D.; Shao, J. Modeling and in-depth analysis of the mid-spatial-frequency error influenced by actual contact pressure distribution in sub-aperture polishing. Opt. Express 2023, 31, 14414–14431. [Google Scholar] [CrossRef] [PubMed]
  44. Seok, J.; Sukam, C.P.; Kim, A.T.; Tichy, J.A.; Cale, T.S. Multiscale material removal modeling of chemical mechanical polishing. Wear 2003, 254, 307–320. [Google Scholar] [CrossRef]
  45. Cao, Z.C.; Cheung, C.F. Multi-scale modeling and simulation of material removal characteristics in computer-controlled bonnet polishing. Int. J. Mech. Sci. 2016, 106, 147–156. [Google Scholar] [CrossRef]
  46. Lu, A.; Jin, T.; Liu, Q.; Guo, Z.; Qu, M.; Luo, H.; Han, M. Modeling and prediction of surface topography and surface roughness in dual-axis wheel polishing of optical glass. Int. J. Mach. Tools Manuf. 2019, 137, 13–29. [Google Scholar] [CrossRef]
  47. Yao, W.; Chu, Q.; Lyu, B.; Wang, C.; Shao, Q.; Feng, M.; Wu, Z. Modeling of material removal based on multi-scale contact in cylindrical polishing. Int. J. Mech. Sci. 2022, 223, 107287. [Google Scholar] [CrossRef]
  48. Meng, F.; Cui, Z.; Liang, Y.; Wang, Z.; Yu, T.; Ma, Z.; Zhao, J. Multiscale model of material removal for ultrasonic assisted polishing of cylindrical surfaces. Tribol. Int. 2025, 202, 110383. [Google Scholar] [CrossRef]
  49. Kang, H.; Li, Z.M.; Liu, T.; Zhao, G.; Jing, J.; Yuan, W. A novel multiscale model for contact behavior analysis of rough surfaces with the statistical approach. Int. J. Mech. Sci. 2021, 212, 106808. [Google Scholar] [CrossRef]
  50. Savio, G.; Meneghello, R.; Concheri, G. A surface roughness predictive model in deterministic polishing of ground glass moulds. Int. J. Mach. Tools Manuf. 2009, 49, 1–7. [Google Scholar] [CrossRef]
  51. Zhang, C.; Qu, S.; Liang, Y.; Chen, X.; Zhao, J.; Yu, T. Predictive modeling and experimental study of polishing force for ultrasonic vibration-assisted polishing of K9 optical glass. Int. J. Adv. Manuf. Technol. 2022, 119, 3119–3139. [Google Scholar] [CrossRef]
  52. Peng, W.; Jiang, L.; Huang, C.; Chen, Y.; Tian, Y.; Han, Y.; Zhang, S.; Qian, L. Surface roughness evolution law in full-aperture chemical mechanical polishing. Int. J. Mech. Sci. 2024, 277, 109387. [Google Scholar] [CrossRef]
  53. Deng, Y.; Hou, X.; Li, B.; Wang, J.; Zhang, Y. Experimental studies on smoothing process for aspheric optical components. In Proceedings of the 8th Asia Pacific Conference on Optics Manufacture & 3rd International Forum of Young Scientists on Advanced Optical Manufacturing, Shenzhen, China, 4–6 August 2023; Volume 12976, pp. 175–180. [Google Scholar]
  54. Suratwala, T.; Tham, G.; Steele, R.; Wong, L.; Menapace, J.; Ray, N.; Bauman, B. Smoothing tool design and performance during subaperture glass polishing. Appl. Opt. 2023, 62, 2061–2072. [Google Scholar] [CrossRef] [PubMed]
  55. Lei, P.; Hou, J.; Wang, J.; Deng, W.; Zhong, B. Smoothing of mid-spatial frequency errors by computer controlled surface processing. High Power Laser Part. Beams 2019, 31, 111002. [Google Scholar]
  56. Mehta, P.K.; Reid, P.B. Mathematical model for optical smoothing prediction of high-spatial-frequency surface errors. In Proceedings of the SPIE’s International Symposium on Optical Science, Engineering, and Instrumentation, Denver, CO, USA, 18–23 July 1999; Volume 3786, pp. 447–459. [Google Scholar]
  57. Burge, J.H.; Anderson, B.; Benjamin, S.; Cho, M.K.; Smith, K.Z.; Valente, M.J. Development of optimal grinding and polishing tools for aspheric surfaces. In Proceedings of the International Symposium on Optical Science and Technology, San Diego, CA, USA, 29 July–3 August 2001; Volume 4451, pp. 153–164. [Google Scholar]
  58. Liu, S.W.; Wang, H.X.; Zhang, Q.H.; Hou, J.; Chen, X.H.; Xu, Q.; Wang, C. Smoothing process of conformal vibration polishing for mid-spatial frequency errors: Characteristics research and guiding prediction. Appl. Opt. 2021, 60, 3925–3935. [Google Scholar] [CrossRef]
  59. Shu, Y.; Nie, X.; Shi, F.; Li, S. Smoothing evolution model for computer controlled optical surfacing. J. Opt. Technol. 2014, 81, 164–167. [Google Scholar] [CrossRef]
  60. Li, X.; Wei, C.; Zhang, S.; Xu, W.; Shao, J. Theoretical and experimental comparisons of the smoothing effects for different multi-layer polishing tools during computer-controlled optical surfacing. Appl. Opt. 2019, 58, 4406–4413. [Google Scholar] [CrossRef] [PubMed]
  61. Nie, X.; Li, S.; Shi, F.; Hu, H. Generalized numerical pressure distribution model for smoothing polishing of irregular midspatial frequency errors. Appl. Opt. 2014, 53, 1020–1027. [Google Scholar] [CrossRef] [PubMed]
  62. Khatri, N.; Manjunath, K.; Tewary, S.; Kang, W.; Liang, R. Measurement of mid-spatial frequencies of diamond turned optics by using dual-mode snapshot interferometry. In Proceedings of the Optical Engineering + Applications, San Diego, CA, USA, 18–22 August 2024; Volume 13134, pp. 182–190. [Google Scholar]
  63. Xia, J.; Yu, J.; Lu, S.; Xue, C.; Zhu, Y.; Feng, Y.; Sheng, P.; Wang, Z. Extraction of isotropic and anisotropic components for optical surface micro-metrology based on the two-dimensional power spectral density analysis. Precis. Eng. 2024, 91, 344–357. [Google Scholar] [CrossRef]
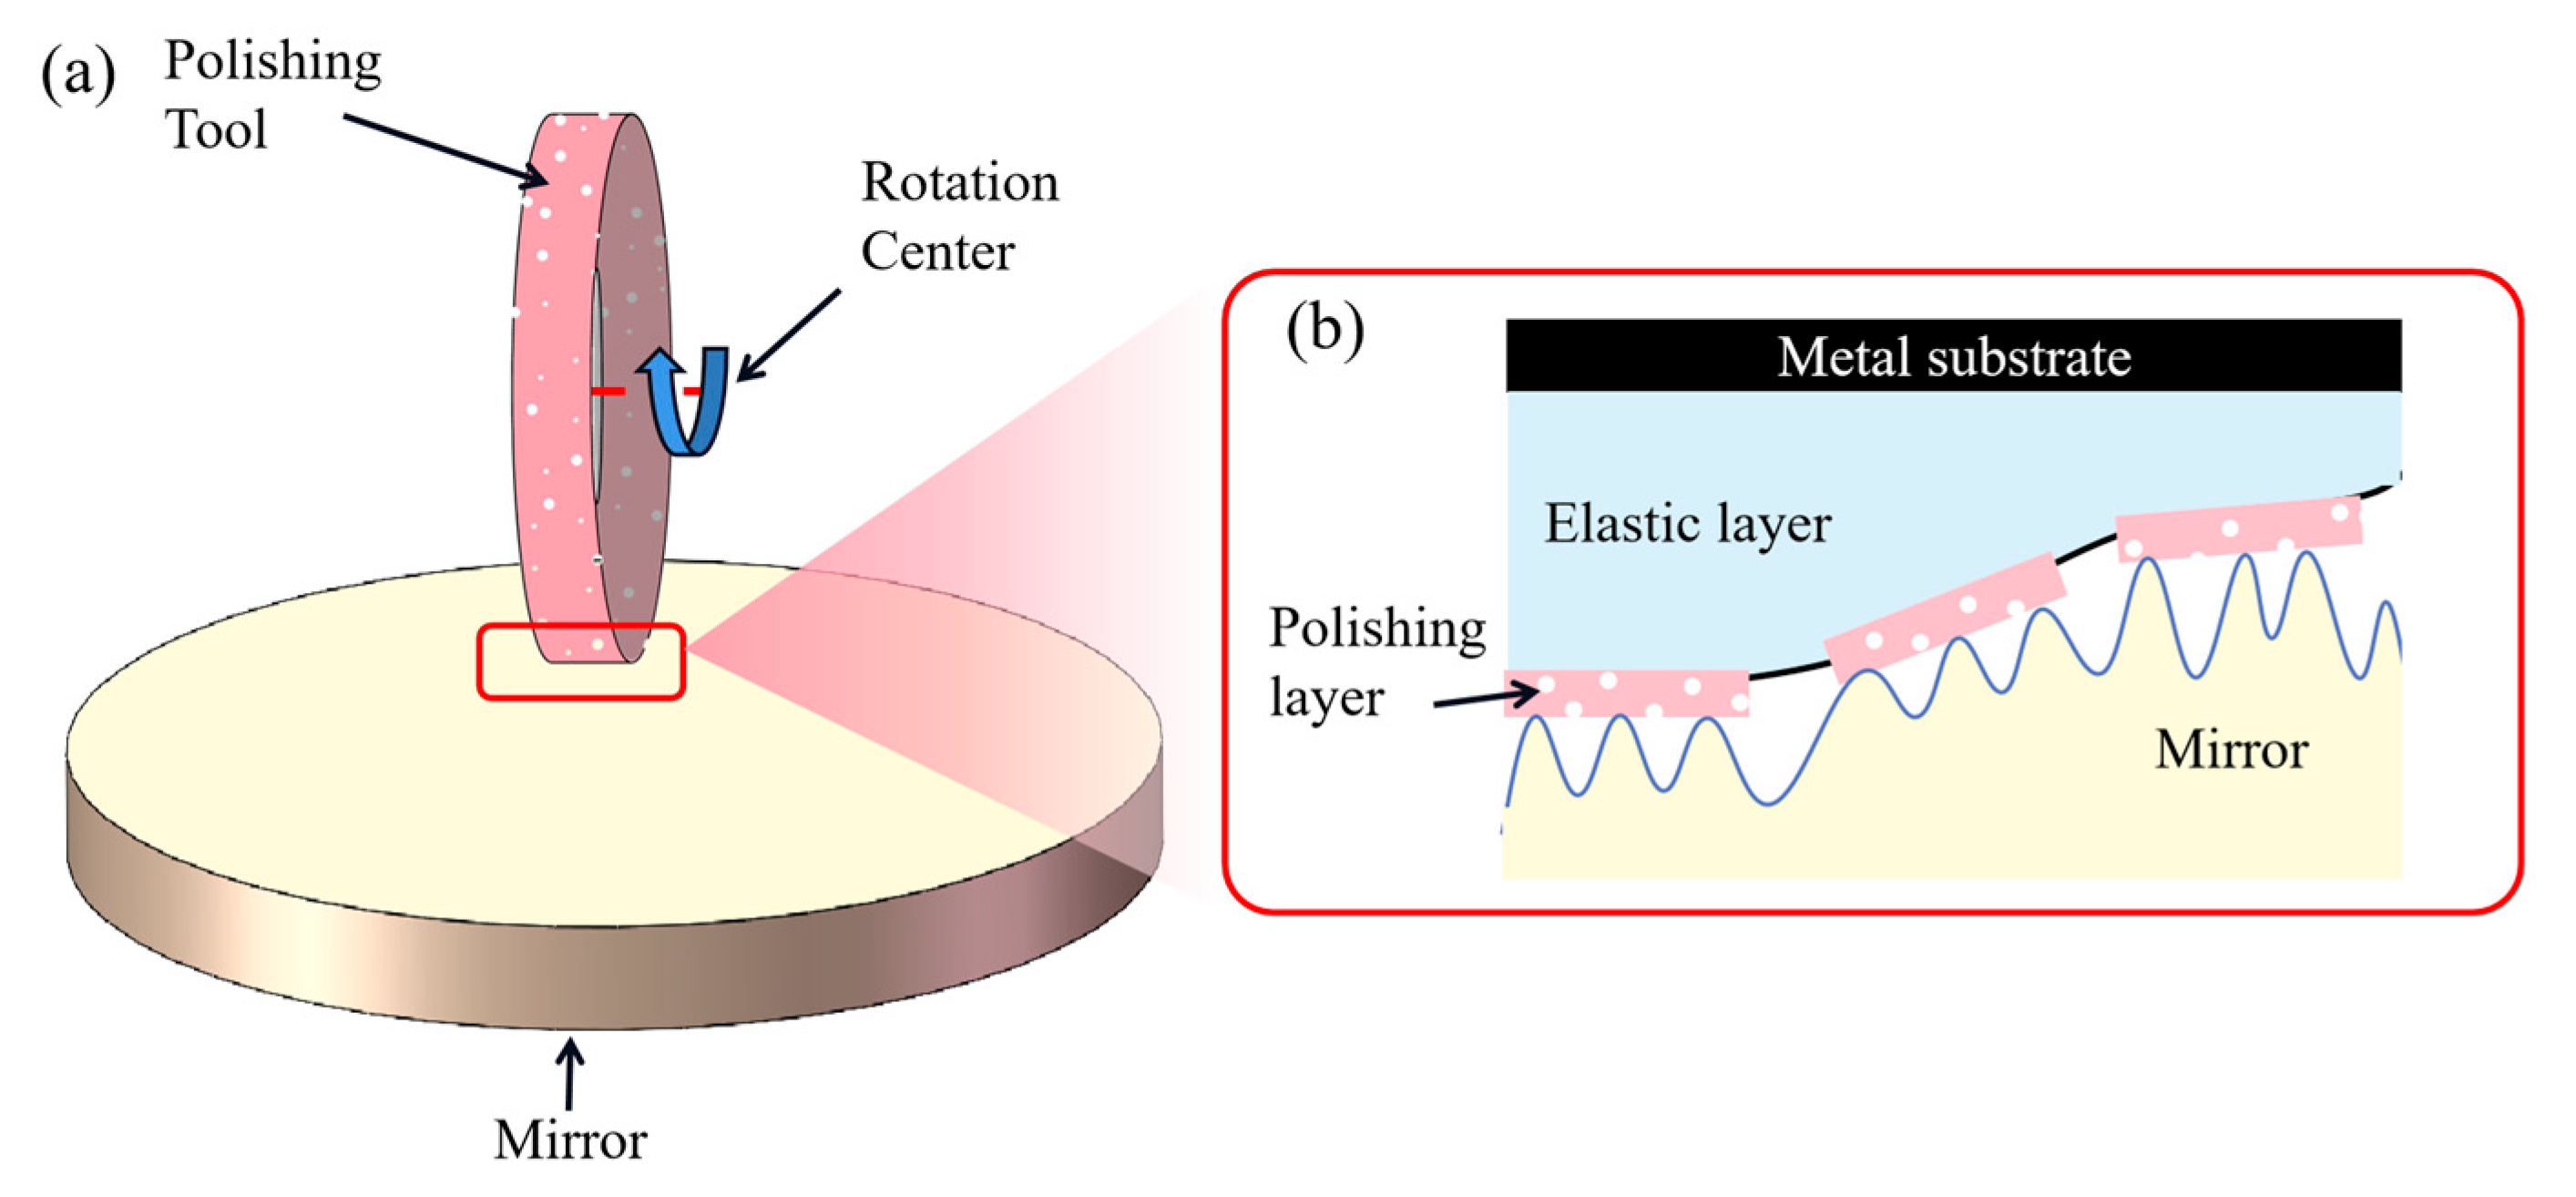
Figure 1. Schematic illustration of the semi-rigid wheel-type tool polishing process: (a) overall polishing setup; and (b) enlarged view of the solid-box region in (a). The tool consists of a polishing layer, an elastic layer, and a metal base. The elastic layer enables the tool to conform to low-frequency surface errors, while the polishing layer is responsible for smoothing mid- and high-frequency errors.
Jmmp 09 00325 g001
Figure 2. Schematic diagrams of: (a) Hertzian contact; and (b) mid-frequency errors (MFEs) introduced by tool path spacing. The MFEs exhibit the same profile as the tool removal function (TRF) and share the same spatial period as the polishing path.
Jmmp 09 00325 g002
Figure 3. Polishing of a mirror with a one-dimensional periodic profile: (a) 3D schematic diagram; (b) initial polishing state; and (c) final polishing state. At the initial stage, the lowest part of the polishing tool does not contact the mirror surface, resulting in a large pressure difference between the peaks and valleys of the mirror profile. When the lowest part of the tool comes into contact with the mirror surface, the pressure difference between the peaks and valleys becomes negligible, and the mirror profile stabilizes.
Jmmp 09 00325 g003
Figure 4. Rough contact between the polishing tool and the mirror during polishing: (a) according to the GW model, the surface of the polishing tool can be regarded as consisting of multi-scale protrusions; and (b) during polishing, the tool velocity stabilizes, and the material removal becomes equivalent to the removal of a one-dimensional fractal surface.
Jmmp 09 00325 g004
Figure 5. Flowchart of MFEs predication model. The model is simplified as an input–output system. The input consists of theoretical parameters and the initial surface topography of the workpiece, while the output includes the predicted final MFE topography and the respective contributions from the three contact mechanisms.
Jmmp 09 00325 g005
Figure 6. Wheel-type small tool polishing setup: (a) polishing robot; (b,c) polishing tool components; and (d) schematic illustration of the polishing process.
Jmmp 09 00325 g006
Figure 7. Measured surface profiles of different polishing tools: (a) Tool A; and (b) Tool B. Tool A exhibits a distinct porous structure, whereas Tool B shows noticeable turning marks due to its lower foaming rate.
Jmmp 09 00325 g007
Figure 8. Schematic diagram of the measurement area for surface roughness after polishing.
Jmmp 09 00325 g008
Figure 9. Schematic illustration of the separation procedure for anisotropic surface components with distinct orientations: (a) surface profile composed of multiple directional features; (b) corresponding 2D PSD; and (c) one-dimensional PSDs extracted along each anisotropic orientation.
Jmmp 09 00325 g009
Figure 10. Measured surface profiles of different polishing tools: (a) Tool C; and (b) Tool D. The two tools were processed using different turning parameters, resulting in significantly different surface textures and roughness.
Jmmp 09 00325 g010
Figure 11. One-dimensional PSDs of surface polished with tool A and tool B. From the PSD curve, it can be seen that there are structures with periods greater than 200 μm on both surfaces.
Jmmp 09 00325 g011
Figure 12. Evolution of surface roughness (Zpath, Zroughcontact and Zsmootheffect): (a) surface polished with Tool A; and (b) surface polished with Tool B. When the polishing depth approaches 1 μm, the MFEs of both mirrors converge to a stable value.
Jmmp 09 00325 g012
Figure 13. Comparison between simulated and measured results: (a) simulated profile for Tool A; (b) simulated profile for Tool B; (c) measured profile for Tool A; and (d) measured profile for Tool B.
Jmmp 09 00325 g013
Figure 14. Evolution of MFEs during polishing of a mirror with a small initial Zsmootheffect using Tool A. The Zsmootheffect remains stable during polishing, as predicted.
Jmmp 09 00325 g014
Figure 15. Predicted and experimentally measured RMS values of final MFEs for different polishing forces: (a) comparison between our model, measured data, and a model considering only path-induced MFEs. Our model demonstrates significantly higher prediction accuracy; and (b) prediction error of our model at different measurement positions, with errors less than 0.1 nm.
Jmmp 09 00325 g015
Figure 16. Comparison of Zpath, Zroughcontact and Zsmootheffect predicted by our model with experimental results.
Jmmp 09 00325 g016
Figure 17. Predicted and experimentally measured Rms values of final MFEs for different path spacings: (a) comparison between our model, measured data, and a model considering only path-induced MFEs. Our model demonstrates significantly higher prediction accuracy; and (b) prediction error of our model at different measurement positions, with values less than 0.2 nm.
Jmmp 09 00325 g017
Figure 18. Comparison between: (a) experimental measurements; and (b) model-predicted results. The periodic features caused by the path in the measured data are less continuous and pronounced, which likely results in the measured values being smaller than predicted.
Jmmp 09 00325 g018
Figure 19. Predicted and experimentally measured Zroughcontact for different tool roughness values: (a) comparison between simulation and experimental results; and (b) prediction error of the model. Experimental results are consistent with predictions.
Jmmp 09 00325 g019
Figure 20. One-dimension PSDs in Zroughcontact direction of the surface polished with tool C and tool D. The high-frequency part shows an upward tilt, which means that the measurement results contain significant measurement noise.
Jmmp 09 00325 g020
Figure 21. Example of engineering applications of the model. Simulated Rms values of MFEs for Tool A are plotted against different process parameters. A threshold plane is applied to select process parameters based on requirements; parameter sets yielding predicted MFEs below this threshold are suitable for polishing. Asterisks mark the “highest remove rate” parameters, which yield an MFE of 1.22 nm (Rms), and the “best roughness” parameters, which yield an MFE of 0.64 nm (Rms).
Jmmp 09 00325 g021
Figure 22. Surface roughness of samples polished using: (a) “highest remove rate” parameters; and (b) “best roughness” parameters. The “highest remove rate” parameters yield an MFE of 1.24 nm (Rms), while the “best roughness” parameters yield an MFE of 0.59 nm (Rms).
Jmmp 09 00325 g022
Table 1. Tool parameters used for the parameter acquisition experiments.
Tool ATool B
Aluminum wheel radius25 mm25 mm
Foam layer thickness5 mm5 mm
Polishing layer thickness1.20 mm1.20 mm
Polishing layer materialLP87SL4387
Rms tool roughness1.81 μm1.70 μm
Table 2. Tool parameters of tool B, C and D.
Tool BTool CTool D
Aluminum wheel radius25 mm25 mm25 mm
Foam layer thickness5 mm5 mm5 mm
Polishing layer thickness1.20 mm1.20 mm1.20 mm
Polishing layer materialSL4387SL4387SL4387
Rms tool roughness1.70 μm0.87 μm0.96 μm
Table 3. The Zpath, Zroughcontact and Zsmootheffect with Tool A and Tool B.
Tool ATool B
Rms(Zpath)0.95 nm2.41 nm
Rms(Zroughcontact)0.33 nm0.51 nm
Rms(Zsmootheffect)0.69 nm0.35 nm
Table 4. Comparison between measured results and the model-predicted results.
Force (N)581012
Measure MFEs (nm)1.33 ± 0.041.25 ± 0.031.23 ± 0.021.24 ± 0.03
Predicted MFEs (nm)1.37 1.261.241.25
Error of predication (nm)−0.04 ± 0.040.00 ± 0.03−0.01 ± 0.02−0.01 ± 0.02
Disclaimer/Publisher’s Note: The statements, opinions and data contained in all publications are solely those of the individual author(s) and contributor(s) and not of MDPI and/or the editor(s). MDPI and/or the editor(s) disclaim responsibility for any injury to people or property resulting from any ideas, methods, instructions or products referred to in the content.