Abstract
The purpose of this research was to create a predictive model for a medium-speed wire electrical discharge machine (WEDM) utilizing an artificial neural network (ANN). Medium-speed WEDM experiments were developed based on the I-optimal mixture design for machining, the Inconel 718 superalloy. During the experiment, the input parameters were the spark ontime, spark offtime, wire feed, and current, with the material removal rate (MRR) and surface roughness (Ra) selected as performance indicators. The ANN model was trained on experimental data and built using a feed-forward backpropagation neural network with a (4-8-2) structure and the Bayesian regularization (BR) learning approach. The model correctly predicted the relationship between the medium-speed WEDM’s primary process parameters and machining performance. An integrated ANN model and the Non-Dominated Sorting Genetic Algorithm-II (NSGA-II) were used to determine the ideal parameters for the MRR and Ra, resulting in a set of Pareto-optimal solutions. The confirmation experiment revealed that the mean prediction error between the experimental and ideal solutions had a maximum error percentage of 1% for the MRR and 2% for the Ra, which are within acceptable ranges. This showed that the best process–parameter combinations were better for the MRR and Ra.
Keywords:
I-optimal design; artificial neural network; Inconel 718; NSGA-II; current; voltage; wire feed rate 1. Introduction
A wire electrical discharge machine (WEDM) is a precise and advanced tool primarily used in the molding, instrumentation, and manufacturing industries. It utilizes a high-temperature procedure in which many electrical discharges swiftly dissolve an accurate amount of metal. This process leads to the formation of discharge craters and recast layers on the surface of the workpiece, which are found between the wire electrode and the workpiece.
A WEDM can be classified into two categories, a high-speed WEDM and a low-speed WEDM, depending on the speed at which the wire moves. A high-speed WEDM typically runs at a wire speed ranging from 480 to 600 m per minute, utilizing recycled molybdenum wire. In contrast, a low-speed WEDM operates at a maximum wire speed of 12 m per minute [1].
High-speed WEDMs, an advanced Chinese product, have dominated more than 85% of the local market owing to their cost efficiency and capability to handle thicker workpieces. Nevertheless, a low-speed WEDM has additional advantages, such as enhanced operational velocity, precision, surface quality, and level of automation.
Attempts have been undertaken to close the disparity between high-speed WEDMs and low-speed WEDMs, resulting in the emergence of a novel concept referred to as a medium-speed WEDM. The medium-speed WEDM machine operates at a wire speed of 10 to 480 m per minute. For finish cutting, the wire speed is between 10 and 120 m per minute, while for roughness cutting, it ranges from 200 to 480 m per minute. Medium-speed WEDMs were developed to improve control systems, high-frequency power supplies, and operating software based on the high-speed WEDM. This innovative concept enables the execution of many cuts with a greater capacity, enhancing machining productivity.
A rising trend in China is the replacement of high-speed WEDMs with medium-speed WEDMs, which is considered an upgraded product to a high-speed WEDM, often referred to as a fast wire that can be cut multiple times. Therefore, its processing speed is close to that of fast-moving wire, and the processing quality tends to align with that of a slow-moving wire. However, achieving the best possible performance for any new machine requires additional research to determine the ideal machining setups which are essential for enabling the machine’s optimal functionality. Furthermore, the effectiveness of this machine is affected by several main and secondary variables, including the current, spark ontime, spark offtime, gap voltage, flushing pressure, wire feed, wire tension, and thermomechanical properties of the workpiece and electrode wire. Unfortunately, engineers must face all these tasks and complexities and determine the most favorable process parameter levels for achieving a machine’s optimal performance.
To solve these issues, it is crucial to create an accurate model that can establish a relationship between the input processing parameters and its performance characteristics, such as its accuracy, productivity, surface quality, and other variables. Furthermore, this model can be optimized to find the best possible machining configurations, which can, after that, be recorded in manuals to assist engineers in industrial environments and workshops in attaining successful machining processes, so that they can become more efficient in their work [2].
Vijaya Bhaskara Reddy, et al. [3] developed an ANN model that was used to predict the Ra of Cr–Mo–V alloyed special steel with a low-speed WEDM. This steel is used a lot in the car industry. Experiment data from an L16 orthogonal array were used to build the ANN model. The study looked at four input factors at four different levels: the spark ontime, open voltage, wire speed, and flushing pressure.
Multiple regression analysis was used to find a mathematical relationship between the Ra and the cutting variables in the low-speed WEDM. The expected Ra values from the backpropagation neural network, the general regression neural networks using the MATLAB NN tool, and regression analysis were compared to the testing results to see if they were the same. The backpropagation neural network, which had two hidden layers, agreed more with the experimental results than with the general regression neural network and the multiple regression analysis.
Guojun Zhang et al. [2] established a mathematical model that utilized response surface methodology (RSM) with a central composite design (CCD) for processing tool steel (SKD11). Their study successfully correlated the essential process parameters of a medium-speed WEDM with machining performance. It utilized an integrated approach combining the RSM and NSGA-II to determine the optimal parameters for the MRR and 3D surface quality. The results demonstrated that the integrated RSM and NSGA-II method is a successful technique for achieving multi-objective optimization. Ultimately, a collection of Pareto-optimal solutions was acquired. Furthermore, their confirmational experiment demonstrated that the ideal combinations of process parameters were appropriate for achieving the best MRR and 3D surface quality.
T. Singh et al. [4] created a complete way to describe the low-speed WEDM process of AA6063 using an ANN. The experimental study had four input variables: the spark ontime, spark offtime, servo voltage, and peak current. The MRR was used as the performance parameter. A 3k full factorial design was used to choose the trial runs. The results showed that the model correctly predicted the values and could be used for intelligent output and prediction.
Lalwani et al. [5] created two models to predict the Ra, kerf width (KW), and volumetric material removal rate (VMRR) during the machining of the Inconel 718 superalloy with a low-speed WEDM process. These models analyzed operational factors such as the spark on/offtime, servo voltage, and wire tension. The first model utilized RSM, a mathematical model, whereas the second used an ANN. The researchers observed that the ANN model was more accurate than the RSM model. The lower mean square error value for the ANN model (1.49%) compared to the RSM model (5.71%) confirmed this finding, showing that the ANN model performed better. The study revealed that the spark ontime had the greatest impact on the low-speed WEDM process of the Inconel 718 superalloy. The researchers employed the NSGA-II algorithm to determine the optimum parameters for the low-speed WEDM process.
M. M. Hasan et al. [6] explored the mean percentage prediction error for five different modeling techniques for the low-speed WEDM process. They found that models based on an ANN with an error of 2.74% were superior in their prediction accuracy compared to other methods. This was followed by fuzzy logic models with a 6% error, Adaptive Neuro-Fuzzy Inference System (ANFIS) models with a 6.44% error, RSM models with a 7% error, and regression models with an 8.01% error.
Pritam Choudhary et al. [7] used the Taguchi Grey Analysis method to find the best process settings for a low-speed WEDM of tungsten. The main goal was to lower operating costs, waste as little material as possible, cut down on the number of tests, and shorten the time it took to complete the process. Seven input factors were picked for parametric optimization: the spark ontime, spark offtime, arc offtime, flushing pressure, wire feed, wire tension, and gap voltage. Three output factors were also considered as the following: VMRR, KW, and Ra. The results of the parametric optimization study of the low-speed WEDM process for single-crystal pure tungsten were a VMRR of 0.298 mm3/min, a KW of 0.346 mm, and a Ra of 1.834 µm.
The current study was motivated by the following factors, as concluded from the content of a literature survey: Previous studies have dedicated significant attention to the optimization of input parameters for low-speed WEDM. Furthermore, they frequently used experimental designs such as Taguchi, CCD, or a complete factorial, which require updating; however, newer experimental designs exist that require further studies, such as the I-optimal design of a mixture. This design is being developed using a computer algorithm that improves the accuracy of predictions across the design space, and it can perfectly be employed to construct the experimental design for an accurate model of the medium-speed WEDM process.
It was found that previous studies utilized mathematical models to simulate the primary process parameters of a medium-speed WEDM and applied the NSGA-II algorithm to these models to determine the optimal processing parameters. However, the survey showed that ANN models performed better than other models in terms of their prediction accuracy, which led to the idea that employing an ANN model with the NSGA-II algorithm and this hybrid could produce excellent results.
Hence, this study’s objective is to systematically investigate the machining process of Inconel 718 using a medium-speed WEDM and develop a precise prediction model based on an ANN. The performance characteristics of the variable input parameters spark ontime, spark offtime, wire feed, and current will be the MRR and Ra.
At first, the I-optimal design of the mixture will be used to create the experimental design. Subsequently, the ANN model will be trained and constructed from the data experiments, and its efficacy will be assessed by calculating the percentage prediction error. The NSGA-II will be used to maximize the performance of the medium-speed WEDM process and determine the ideal processing parameters.
2. Materials and Methods
2.1. Materials
The workpiece is a cylindrical block made of Inconel 718 superalloy with a diameter of 16 mm, a specimen that was provided by the Central Metallurgical Research and Development Institute. Inconel 718 is a high-nickel, high-chromium alloy often employed in manufacturing steam turbine and jet aircraft interiors, rotary spindles, and other applications [8]. Inconel 718’s composition is 54% Ni, 17.7% Fe, 16.9% Cr, 4.6 wt% Nb, 2.17 wt% Mo, and 1.49 wt% Ti. The workpiece’s physical characteristics are shown in Table 1.

Table 1.
Workpiece’s physical characteristics.
2.2. Experimental Setup and Procedure
This study aims to find the best machine parameter settings for a medium-speed WEDM, and the process’s schematic design is in Figure 1, to achieve the conflicting objective of maximizing the MRR while minimizing the Ra. The research was conducted in multiple phases.
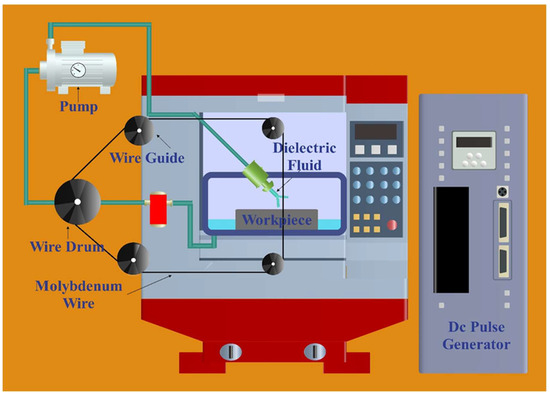
Figure 1.
Medium-speed WEDM process’s schematic design.
During the initial stage of the study, the optimal machining parameters that ensured a stable cutting process without any wire breaks were successfully identified. In the second stage, models for predicting a medium-speed WEDM were developed using the I-optimal design of the mixture and ANN.
In the third stage, the prediction models were evaluated. The following step utilized the NSGA-II algorithm to perform multi-objective optimization and determine the optimal conditions for achieving a max MRR and min Ra. In the final stage, the solutions obtained by the NSGA-II algorithm were validated through real experiments, and the prediction error calculation was carried out. All stages of the research are shown in Figure 2.
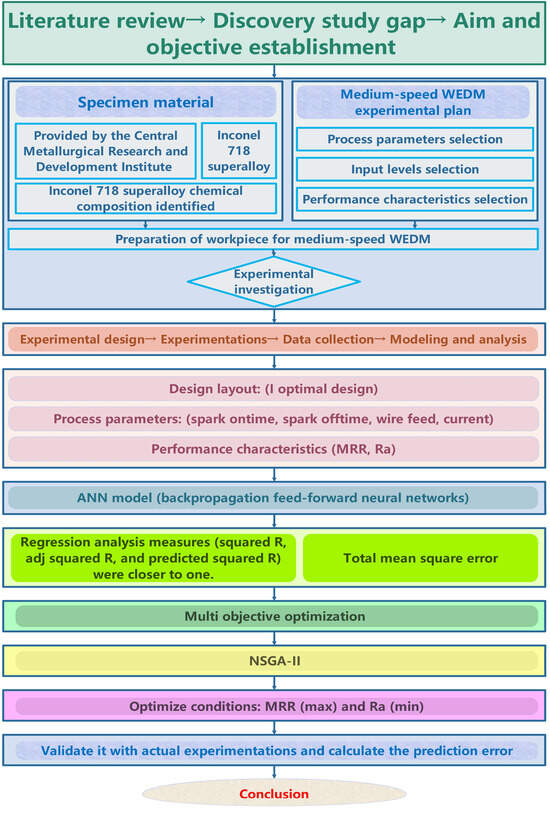
Figure 2.
Schematic description of the general research work.
To achieve the previous tasks, the experimental studies were carried out on the ESUNTEK (EFH-CC2.0) medium-speed WEDM machine, as seen in Figure 3, and all its settings are provided in Table 2; 20 samples were obtained from a cylindrical block made of Inconel 718 superalloy with a diameter of 16 mm, as shown in Figure 4. The electrode was a molybdenum wire measuring 0.18 mm in diameter, while the dielectric employed was a combination of (JR3A emulsified + water).
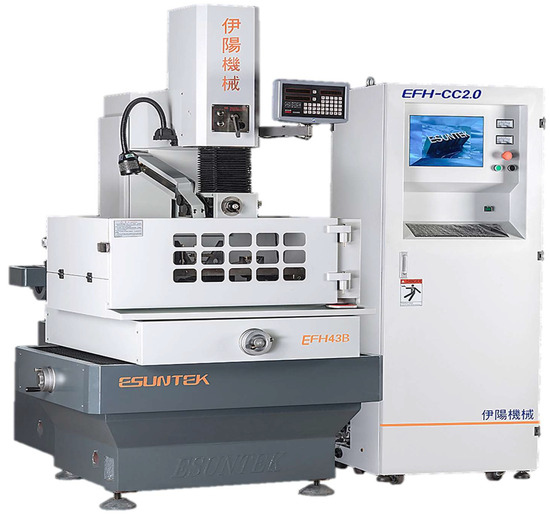
Figure 3.
ESUNTEK (EFH-CC2.0) medium-speed WEDM machine.

Table 2.
Medium-speed WEDM operating conditions.
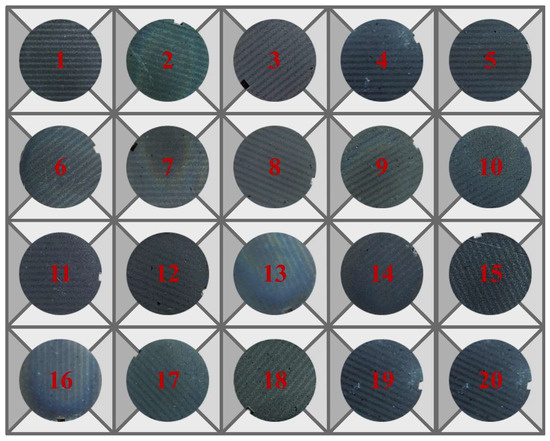
Figure 4.
20 Samples cutting on the medium-speed WEDM machine.
The MRR in the medium-speed WEDM is very complicated. The system is operated by various key factors, including those that affect the energy discharge (such as voltage, current, spark duration, and spark interval), factors related to the working electrode (like wire speed, wire tension, and wire feed), and processing conditions characterizing the method and pressure of the dielectric supply [9].
Based on experience, some preliminary investigations, and the literature review mentioned above, concluded that the parameters that have the highest impact on the MRR and Ra in cutting with a medium-speed WEDM are the spark ontime, spark offtime, wire feed, and current. The parameter MRR was determined by dividing the lateral surface area of the cut sample by the cutting time [9]. The following formula calculates the MRR:
where D represents the sample diameter in mm and t represents the cutting time in min.
The parameter surface roughness was measured using a surface roughness meter (TR210, Beijing TIME High Technology Ltd., Beijing, China) as shown in Figure 5. The Ra value was measured at five different points on the same face using a surface roughness meter on every cutting surface. The average of these five readings was then considered the actual Ra value. The indicator’s settings were configured with a digital filter (RC) and the cut-off length (λc) was set to 0.8 mm.

Figure 5.
Surface roughness meter (TR210, Beijing).
2.3. Modeling Method
2.3.1. I-Optimal Design of the Mixture
The RSM is a statistical tool that enables the modeling, analysis, and optimization of issues where the relationship of input parameters impacts the output response under study. This strategy is well regarded for its effectiveness and flexibility [10]. The I-optimal design of a mixture enables a precise characterization and optimization of a given process. Using an I-optimal design of a mixture offers several benefits compared to a conventional RSM design, such as requiring fewer trials than conventional RSM methods and being very valuable for resolving problems with numerous constraints.
For example, it can manage situations where parameter levels are limited to specific values or when parameters have different amounts of levels. This is performed by taking out a specific area of study where responses could not be evaluated well (e.g., in medium-speed WEDM parameter optimization) [11].
The I-optimal design of a mixture was employed to determine the ideal combination of parameters for machining Inconel 718 superalloy using a medium-speed WEDM. The independent control variables selected for this investigation were the spark ontime, spark offtime, wire feed, and current. The I-optimal design of the mixture consisted of a total of 20 experimental trials. Out of these, 15 trials were dedicated to the basic model, 1 trial was allocated for central points, 2 trials were used for measuring a lack of fit, and the other 2 trials were replication points.
The Design-Expert program was employed for the design, which utilized a computer algorithm to enhance the precision of forecasts throughout the design domain. Table 3 displays the complete DOE matrix and the responses for the MRR and Ra.

Table 3.
DOE matrix and the responses for the MRR and Ra.
2.3.2. Artificial Neural Networks (ANN)
An ANN is a machine learning method commonly employed in manufacturing to forecast responses correctly. The tool functions as a brain and generates a continuous output variable based on discrete input variables. It is a vital technique for representing complicated non-linear connections. In a standard ANN design, there are three types of layers, the input, output, and hidden layers, all of which are interconnected.
Each neural network layer consists of one or more neurons and serves as a fundamental component. Each neuron is assigned a weight for every input, which alters the magnitude of each input. The neuron collects all the inputs processed through an activation function and computes an output to be transmitted further. The third layer is the hidden layer, where neurons are not in the input or output layers. To enhance the system’s accuracy, one can improve its computational and processing capabilities by adding more hidden layers containing neurons [12]. However, Dr. Ping-Hsien Chou et al. [13] conducted a comparative analysis of ANN models for predicting wire rupture in WEDM showing a range of architectures, including 1 to 4 hidden layers and neuronal counts varying from 100 to 300. Variability in the results indicated that simply increasing the number of hidden layers or neurons did not ensure an improvement in the accuracy. The process of developing an ANN model for the prediction and optimization of the MRR and Ra was followed using the flow chart shown in Figure 6.
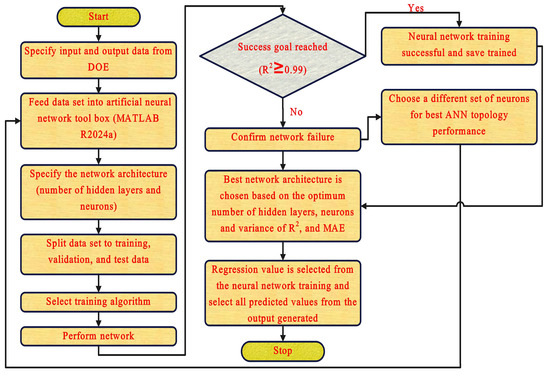
Figure 6.
Flow chart of the ANN model for the prediction and optimization of the MRR and Ra.
The current study employed a single input, hidden, and output layer for the ANN model; the model is expected to have a structure of (X–N1–Y), where X denotes the number of neurons in the input layer, N1 denotes the number of neurons in the first hidden layer, and Y denotes the number of neurons in the output layer. Figure 7 displays the structure of the constructed ANN model. In this case, the input layer consisted of four neurons: the spark ontime, spark offtime, wire feed, and current. The output layer, on the other hand, had two neurons representing the MRR and Ra. The ANN models were constructed using MATLAB R2024a. Various models were devised and evaluated to explore the most effective architectures. The primary factors for evaluation were the root mean square error (RMSE) and the coefficient of determination (R2) value for all the networks.

Figure 7.
Structure of the constructed (ANN) model.
3. Results and Discussion
3.1. Artificial Neural Network (ANN) Prediction Model for MRR and Ra
An ANN was employed to model the experimental data and analyze the influence of input parameters, including the spark ontime, spark offtime, wire feed, and current, on the MRR and Ra. The challenges in choosing the best ANN model, as highlighted by Yusliza Yusoff et al. [14], result from the lack of specific instructions in the current literature. Consequently, many researchers rely on random and extensive trials to discover effective configurations. This study conducted a series of random trials that led to a model with an R² value exceeding 99%. It took around one month to develop the final structure of this ANN model, which is a feed-forward backpropagation neural network with a (4–8–2) structure using the Bayesian regularization (BR) learning technique.
The dataset used a random splitting method and was divided into 20% with four experiments (6, 8, 9, and 10) for testing and 80% with 16 other experiments for training. Then, it was used to predict medium-speed WEDM attributes. The model’s evaluation is based on the R2 (representing the amount of variability in the data that the model accounted for), the adjusted R2 (taking into consideration the number of predictors in the model), and the predicted R2 (measuring how well the model predicts new data) to determine the model’s accuracy. The values span from zero to one. A zero value indicates a bad model prediction, whereas a value of one suggests an ideal forecast. Ultimately, the mean percentage error is computed, which is the percentage disparity between the predicted results and the actual experimental values.
An actual (experimental) and predicted value plot is a graphical method for comparing the data obtained from experiments with the values predicted by an ANN model. This enables measuring the model’s performance and observing the proximity between the predicted values and actual values.
Before plotting the actual and predicted value plot, the model needs to collect the experimental and predicted values for each data point. By plotting the actual value on the x-axis and the predicted value on the y-axis, one can compare the two plots to determine the proximity of the points. The model is considered perfect not if the actual and predicted values are permanently aligned but if the actual plot and predicted values align around the diagonal line. In that case, it indicates that the model performs well in predicting values, and the prediction error is the vertical distance between the point and the line of perfect predictions. Furthermore, it was observed in Figure 8 that as the actual values (X) obtained from experiments increased, so did the predicted values (Y) by an ANN model, indicating a positive correlation between the two. This positive correlation suggests that the model accurately represents the underlying relationship between the input and output variables. On the other hand, if the plots show an extensive and unequal distribution, it indicates that the model cannot predict values accurately. This difference can be attributed to various factors, including model overfitting, underfitting, or the presence of outliers in the data [15].
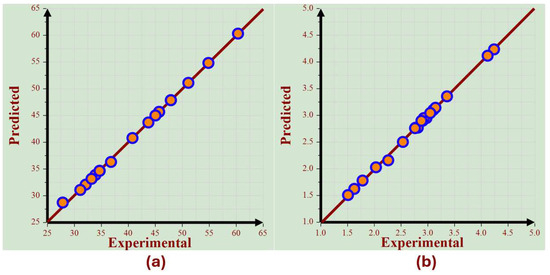
Figure 8.
The actual (experimental) values versus the predicted values for the (a) MRR and (b) Ra.
The graph in Figure 8a displays the relationship between the actual value and the predicted values of the MRR. It can be noted that all the data points aligned accurately with the predictions. The R2 value for MRR predictions was 99.94%, with an adjusted R2 value of 99.93% and a predicted R2 value of 99.91%, as shown in Table 3. These high values indicate that the model’s predictions were highly accurate.
The graph in Figure 8b displays the relationship between the actual values and the predicted values of Ra. It can be noted that all the data points aligned accurately with the predictions. The R2 value for the predictions made by the Ra model was 99.87%, with an adjusted R2 value of 99.86% and a predicted R2 value of 99.84%, as shown in Table 4. These high values indicate that the model’s predictions were highly accurate.

Table 4.
The total percentage error and regression analysis for the ANN model.
Finally, a high positive correlation factor in the ANN model indicates a strong relationship between the input parameters (spark ontime, spark offtime, wire feed, and current) and the output parameters (MRR and Ra). This strong correlation is important for parametric analysis because it shows that the input parameters have a significant and predictable influence on the output parameters. As a result, the analysis becomes more reliable and accurate and provides precise insights into how variations in inputs affect outputs.
Furthermore, the high positive correlation factor makes the optimization process easier by establishing a clear relationship between the parameters. This clarity enables optimization algorithms to navigate the parameter space more efficiently, resulting in optimal solutions with less computational effort and time. As a result, the optimization process becomes more reliable and efficient, leading to more accurate results.
Pareto analysis of variance (ANOVA) is a simplified method that applies the Pareto principle to assess the individual impact of each process parameter on the MRR and Ra. This statistical technique does not require an ANOVA table or an F-test, making it more accessible for practical applications. By focusing on the most significant parameters, it allows engineers and industrial practitioners to identify and prioritize the factors that contribute the most to the outcomes.
For instance, in this study, the input parameters chosen, spark ontime, spark offtime, wire feed, and current, are the most important in machining processes with a medium-speed WEDM. The Pareto analysis helps calculate each parameter’s percentage contributions, providing a clear and straightforward way to understand their relative importance. For instance, Figure 9 shows that the most crucial parameter in this study was the wire feed, which significantly impacted the MRR, while the spark ontime was the most influential on Ra, and this has led engineers in industrial environments and workshops to monitor these two input parameters carefully during the machining process with a medium-speed WEDM. Finally, this analytical approach benefits those who need to make data-driven decisions without delving into complex statistical procedures [16]. According to Figure 9a, the wire feed is the most significant factor in the MRR, accounting for 41.63% of the overall contribution. The wire feed, by which the wire is supplied to the workpiece, has a major impact on the MRR. This is because it leads to a rise in the applied current, resulting in a higher rate of heat energy transfer and, consequently, an increased rate of melting and evaporation [17].
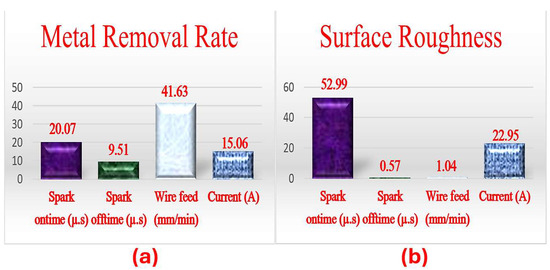
Figure 9.
Pareto ANOVA analysis of the medium-speed WEDM input parameters for the (a) MRR and (b) Ra.
Moreover, the spark ontime accounted for a substantial proportion of 20.07%, and the pulse duration substantially affected the MRR, because higher discharge energy causes more material to melt from the workpiece [18].
In addition, the current parameter significantly contributed 15.06% to the MRR. This suggests that the current had a strong impact on the MRR. The higher current leads to an increase in the rate of heat energy and, hence, in the rate of melting and evaporation. As a result, larger amounts of material melt, leading to an increase in the MRR [19]. In addition, the parameter spark offtime contributed 9.51%, showing that a longer spark offtime led to a decrease in the MRR. This is because a longer spark offtime results in a lower spark intensity. On the other hand, reducing the duration between sparks in a medium-speed WEDM increases the strength of the sparks. This results in a greater amount of material being melted and vaporized in the machining area, leading to an increase in the MRR [20].
The wire feed and spark ontime had the greatest impact on the MRR of the medium-speed WEDM machine. These parameters must be tuned to achieve maximum efficiency and effectiveness in the medium-speed WEDM process.
As seen in Figure 9b, it was determined that the spark ontime had the greatest impact, accounting for 52.99% of the Ra. This suggests that altering the timing of the spark can have an extensive negative impact on the Ra. Increasing the duration of spark activation leads to a rise in the strength of the spark and enlarges the craters on the machined surface, ultimately leading to poor surface quality [21].
Moreover, the current contribution percentage was 22.95%. This suggests that the present condition has a detrimental effect on the Ra, as the Ra rises in relation to the increase in current value caused by the rise in discharge energy. This leads to an increase in the size of craters on the machine surface, resulting in poor surface quality [22]. However, the contribution percentages for the spark offtime and wire feed are relatively low, specifically 0.57% and 1.04%, respectively. These parameters have a negligible influence on the Ra compared to the spark ontime and current.
The prediction performance of the training set and test set for the MRR and Ra is shown in Figure 10 and Figure 11, respectively. Figure 10 illustrates the MRR values obtained from actual (experimental) data and ANN predictions. It is inferred that the ANN predictions were significantly closer to the actual values. The error rates were also computed. The average percentage error obtained was 0.22955%, while the maximum percentage error of 3.252836% for the MRR was reported by comparing the experimental and ANN-predicted values.
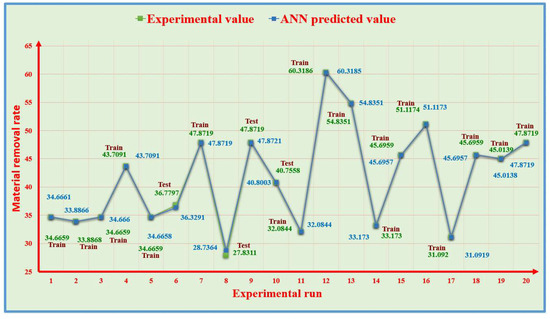
Figure 10.
Experimental result comparison of the ANN predictions for the MRR.
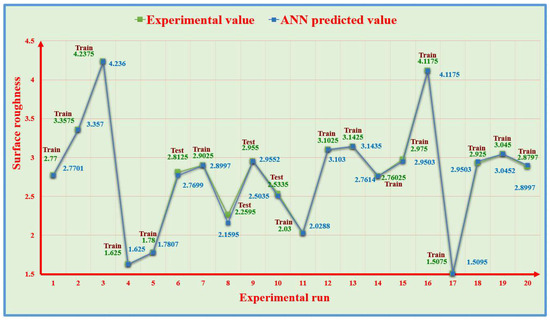
Figure 11.
Experimental result comparison of the ANN predictions for the Ra.
The actual Ra values were compared to the predictions made by the ANN, as depicted in Figure 11. The predictions made by the ANN were determined to be highly accurate, and the corresponding error percentages were also calculated. The average percentage error produced was 0.49993%, and the greatest error percentage of 4.425758% for the Ra was observed when comparing the experimental and predicted values using the ANN.
In conclusion, the model that combined the I-optimal design of the mixture technique with the feed-forward backpropagation neural network with a (4–8–2) structure, trained using the BR learning technique, successfully aligned closely with the trend of the actual value curve. A small number of the specific values of the model exhibited only a minor deviation from the predicted values. Thus, the model did not exhibit any apparent overfitting phenomena and consequently possessed a higher level of accuracy in predicting the MRR and Ra.
3.2. Response Surface Analysis of MRR and Ra with Developed ANN Model
A parametric analysis was conducted to analyze the effects of the input parameters (spark ontime, spark offtime, wire feed, and current) on the output parameters MRR and Ra. Three-dimensional response surface plots were generated using the ANN model. The graphs of surfaces provided additional clarification on the correlation between the input process parameters and responses and demonstrated the ability of the ANN model to estimate the MRR and Ra accurately.
Based on Figure 12a, it was found that the MRR rose as the spark ontime value increased. This is because a higher discharge energy resulted in more material melting from the workpiece, leading to higher MRR values [18]. Nevertheless, it was observed that when the spark offtime was short, increasing the spark ontime had a lesser impact on the rise in MRR than the spark offtime being long. This is because there was insufficient time for the molten material to be flushed out [23]. At a low spark ontime, it was seen that the MRR declined as the spark offtime increased. This is because there was greater time between two consecutive electrical discharges [24]. This can be seen in Figure 12a. However, at a high spark ontime, it was found that the spark offtime had little effect on the MRR.
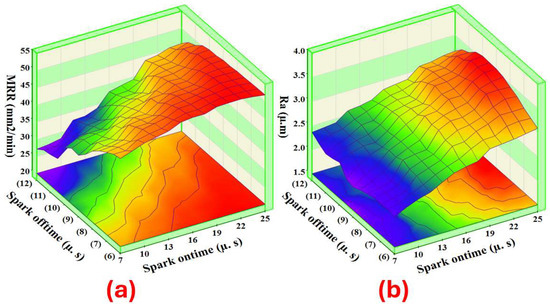
Figure 12.
Interaction of the spark ontime and spark offtime for the (a) MRR and (b) Ra.
According to Figure 12b, the Ra increased when the spark ontime value was raised. The reason for the poor surface quality is the higher discharge energy, which leads to larger craters on the machined surface [21]. Nevertheless, it was discovered that the spark offtime had minimal impact on the Ra.
As shown in Figure 13a, it was found that the MRR rose as the spark ontime value increased. This is because a higher discharge energy resulted in more material melting from the workpiece, leading to higher MRR values [18]. Nevertheless, the MRR increased when the current value was raised. The higher current leads to an increase in the rate of heat energy and, hence, in the rate of melting and evaporation. As a result, larger amounts of material melt, leading to an increase in the MRR [19]. According to Figure 13b, the Ra increased when the current value was raised, which was caused by the rise in discharge energy. This leads to an increase in the size of craters on the machine surface, resulting in poor surface quality [22].
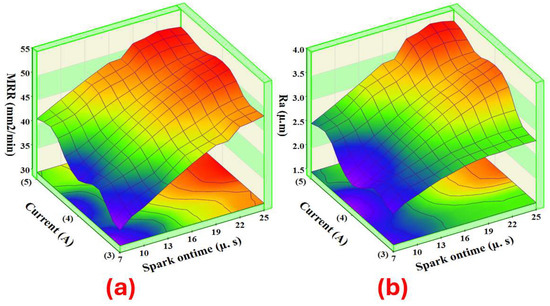
Figure 13.
Interaction of the spark ontime and current for the (a) MRR and (b) Ra.
According to Figure 14a, the MRR rose as the wire feed value increased. This is because the wire supplied to the workpiece significantly impacted the MRR. This is because it leads to a rise in the applied current, resulting in a higher rate of heat energy transfer and, consequently, an increased rate of melting and evaporation [17]. Nevertheless, the higher current leads to an increase in the rate of heat energy and, hence, in the rate of melting and evaporation. As a result, larger amounts of material melt, leading to an increase in the MRR [19]. According to Figure 14b, the Ra increased when the current value was raised due to the rise in discharge energy. This leads to an increase in the size of craters on the machine surface, resulting in poor surface quality [22]. Nevertheless, it was discovered that the wire feed had minimal impact on the Ra.
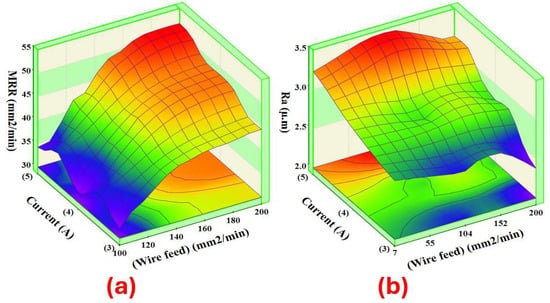
Figure 14.
Interaction of the wire feed and current for the (a) MRR and (b) Ra.
3.3. The Surface Burning Phenomenon of the Machined Samples with the Medium-Speed WEDM Process
During cutting with a medium-speed WEDM, the rapid change in the direction of the wire movement impacts the machining conditions. As a result, the surface of the workpiece often displays an unusual pattern, which researchers call zebra stripes or burn stripes [25]. This can be observed in Figure 4, where numerous reversal stripes are visible on the surface of the samples; this burn happens when significant amounts of energy are utilized, which leads to the evaporation of dielectric liquids. Consequently, a limited quantity of dielectric liquid is present during the wire and workpiece export process, leading to burning on the surface of the workpiece. As mentioned above, the medium-speed WEDM process changes the direction of the wire movement, which means there are two types of cutting: forward and reverse.
As shown in Figure 15, the cutting conditions for the two cutting types vary. In forward cutting, a working fluid is introduced into the processing area using a wire electrode. Moreover, the quantity of the working fluid between the electrodes improves due to the force of gravity, which facilitates the removal of discharge debris. In this way, the burn of the workpiece surface is considered minimal compared to reverse cutting [26].
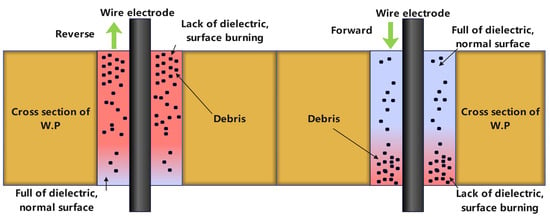
Figure 15.
Schematic of the surface burning during forward and reverse cutting.
A scanning electron microscope (JSM-6390 series, JEOL Group Companies, Tokyo, Japan) was used to analyze the machined surface of the sample (3), which had the worst surface. The surface morphology of this sample was examined using the SEM technique at a magnification of 750×, specifically focusing on the burn and nonburn stripes. Figure 16 shows that the burn stripe exhibited many big defects, such as craters, uneven material depositions, pockmarks, and microcracks. In contrast, the nonburn stripe showed smaller craters, pockmarks, little globules of debris, and no microcracks, proving how these burns dramatically worsen the machined surface.
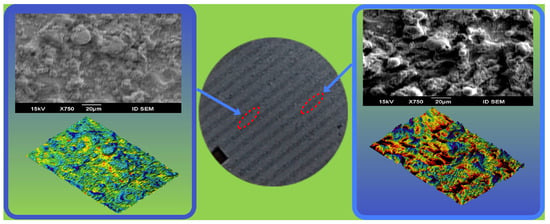
Figure 16.
SEM images of the burn and nonburn stripes of the sample (3).
Based on the above study, the leading cause of surface burning is the significant vaporization of working fluid due to high cutting energy and the inability to remove the discharge debris promptly. To prevent burns during the generation of high energy levels, it is necessary to ensure an adequate amount of inter-electrode working fluid or to minimize the vaporization of the working fluid during the cutting process with a medium-speed WEDM.
3.4. Utilizing a Non-Dominated Sorting Genetic Algorithm (NSGA-II) for Multi-Objective Optimization
Optimizing machine parameter settings is critical for effective medium-speed WEDM machining. This includes the difficult issue of maximizing the MRR while minimizing the Ra. As a result, the constructed ANN model was optimized using the NSGA-II technique.
This efficient method employs repeated alteration in point populations using the Genetic Algorithm to find non-dominant optimal Pareto solutions for various objective functions. This is because the medium-speed WEDM process is complicated, requiring two or three goals to be achieved simultaneously to pick the optimal solution.
In single-objective optimization, the best choice is often made by determining the global maxima or global minima, depending on the optimization problem’s special features. Multiple-objective optimization requires various solutions. There are many conventional approaches for identifying solutions to a multi-objective issue, including the min–max, distance function, and weighted sum processes [5].
However, these techniques have additional problems, such as weighing objectives determined by their relative significance. Authors must thoroughly understand ranking target functions before utilizing traditional optimization strategies. Genetic Algorithm techniques explore the design space without relying on gradient information or essential parallelism, giving them an effective and adaptable optimization strategy.
NSGA-II was created utilizing the Pareto technique and has shown to be an effective algorithm for resolving many optimization problems. NSGA-II is a useful optimization approach because of its speedy, non-dominated sorting, fast crowded distance estimation, and easy crowded comparison operator [2]. A flow chart of the NSGA-II algorithm is shown in Figure 17.
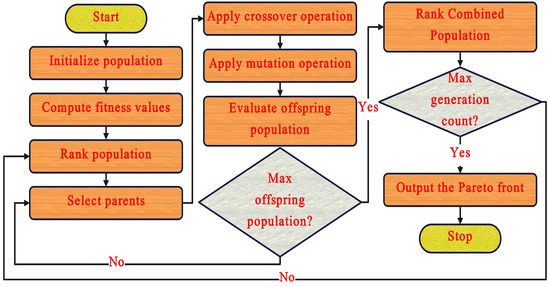
Figure 17.
NSGA-II algorithm flow chart.
The MATLAB Genetic Algorithm multi-objective toolbox was utilized to predict the optimal process parameters. The ANN model was created using the MATLAB toolbox, and the goals were to maximize the MRR and minimize the (Ra). The objective functions were formulated as Algorithm 1.
| Algorithm 1 |
| The objective function (1) |
| Max MRR = –Min MRR = Fun ((Spark _ ontime), (Spark _ offtime), (Wire feed), (Current)) (2) |
| The objective function (2). |
| Min Ra = Fun ((Spark _ ontime), (Spark _ offtime), (Wire feed), (Current)) (3) |
| Constraint_to. |
| 7 μs< (Spark _ ontime) < 25 μs |
| 6 μs < (Spark _ offtime) < 12 μs |
| 100 mm2/min < (Wire feed) < 200 mm2/min |
| 3 A < (Current) < 5 A |
3.4.1. Results from Multi-Objective Optimization Using (NSGA-II)
The NSGA-II generated 20 optimal solutions, presented in Table 5, based on the independent control variables. Figure 18 illustrates the Pareto front of the optimization results, representing the exploration space.

Table 5.
Optimal combination of the process parameters and non-dominated solutions with the NSGA-II algorithm.
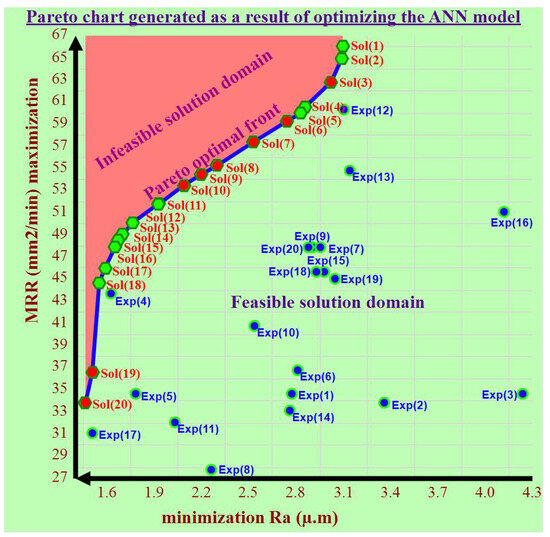
Figure 18.
Pareto front of non-dominated solutions derived with the NSGA-II algorithm for the ANN model.
Upon analysis, it was clear that Solution 1 was the most efficient solution for achieving the highest MRR, with an MRR of 66.0619 mm2/min and a Ra of 3.0966 µ.m. Experiment 12 produced the highest MRR among all the experiments, with a value of 60.319 mm2/min. Additionally, it had a Ra of 3.1025 µ.m. These data highlight the importance and effectiveness of the optimization process.
Similarly, Solution 20 was the most efficient solution for achieving the minimal Ra. It had an MRR of 33.8288 mm2/min and a Ra of 1.4593 µ.m. Experiment 17 produced the lowest Ra value among the experimental results, with an MRR of 31.092 mm2/min and a Ra of 1.5075 µ.m. These data further confirm the significance and effectiveness of the optimization process.
A widely accepted understanding of a direct correlation between the MRR and Ra indicated that an increase in the MRR would lead to a rise in the Ra and a worse surface quality. Nevertheless, there are instances where this is not true, as demonstrated by Experiment 3, which produced the poorest surface quality but did not surpass an MRR of 34.666 mm2/min. In addition, Experiment 8, which had the lowest MRR, did not yield the optimal surface finish. These observations emphasize the crucial significance of the optimization process in attaining the highest MRR while minimizing the Ra and obtaining the finest surface finish, which improved the machining performance productivity and roughness significantly.
Ultimately, it was seen that there was a compromise between the MRR and Ra, indicating that no alternative was fundamentally superior to another. All of these issues depend on the requirements of the engineer responsible for controlling a medium-speed WEDM. If a more productive MRR is preferred, solutions ranging from 1 to 7 can be chosen, even if it means compromising the Ra. Alternatively, if the Ra is in considerable demand, appropriate solutions ranging from 17 to 20 can be selected. Solutions 8–16 can be utilized to achieve an ideal equilibrium between high production and good surface quality. The decision-maker must choose the most advantageous results based on specific criteria. This highlights the intricate and subtle nature of the optimization process in industrial operations.
3.4.2. Experimental Confirmation with Optimal Solutions of Machining Settings
To validate the precision and importance of the optimal solutions obtained through the utilization of the NSGA-II, as indicated in Table 5, a total of 12 solutions can be performed. The other is incapable of functioning in the machine. However, these solutions may help in the manufacture of a medium-speed WEDM in the future. Table 6 shows the results of a confirmation test conducted on four optimal solutions (No. 1, No. 5, No. 13, and No. 18) using different input–parameter combinations and the four samples cut on a medium-speed WEDM machine for the confirmation test as seen in Figure 19.

Table 6.
Experimental confirmation with optimal machining settings.

Figure 19.
Four samples cut on a medium-speed WEDM machine for the confirmation test.
The confirmation experiments were conducted, documented, and compared with the relevant Pareto optimum solutions in Table 6. The relative error between the experimental results and the ideal values of the MRR and Ra was calculated from Equation (2), and it was found that the error was within acceptable limits, with a maximum of 1% for MRR and 2% for Ra.
4. Conclusions
This study aimed to create a predictive model for machining the Inconel 718 superalloy utilizing the medium-speed WEDM process. The experimental design for the medium-speed WEDM process was established using the I-optimal design of the mixture.
An ANN model was created to predict performance characteristics. The efficiency of the process optimization was assessed using the NSGA-II algorithm on an ANN model. The results suggested that the enhanced technique might reduce processing time and increase cost efficiency. The following conclusions were made from the findings derived from this study:
- The results of the analysis demonstrated that the percentage contributions of input parameters (wire feed, spark ontime, current, and spark offtime) to the MRR were 41.63%, 20.07%, 15.06%, and 9.51%, respectively.
- The results of the analysis also demonstrated that the spark ontime and current were the most vital factors influencing the Ra, with percentages reaching 52.99% and 22.95%, respectively.
- The I-optimal design was effectively employed to determine the correlation between the output parameters (MRR and Ra) and process parameters (spark ontime, spark offtime, wire feed, and current). This made the ANN model with a 4–8–2 structure exceptionally accurate in fitting with the actual (experimental) values for the MRR and Ra, which had total percentage errors of 0.22955% for the MRR and 0.49993% for the Ra.
- The multi-objective optimization technique identified the most favorable combinations of process variables to achieve the optimum performance to obtain the max MRR and min Ra. Twenty optimal solutions were selected from the Pareto frontiers. Twelve possible solutions could be performed on the machine, and others could not be operated. Nevertheless, this could be taken into account by manufacturers of medium-speed WEDMs and developed in the future.
- The optimal combination parameters for attaining the greatest MRR of 66.0619 mm2/min and Ra of 3.0966 μm on a medium-speed WEDM were the following: spark ontime of 25 µs, spark offtime of 6 µs, wire feed of 200 mm2/min, and current of 5 A.
- The best combination settings that could be applied on the medium-speed WEDM were a spark ontime of 7 µ.s, spark offtime of 6 µ.s, wire feed of 200 mm2/min, and current of 3 A to achieve the lowest Ra of 1.5496 μm and MRR of 44.6561 mm2/min.
- Confirmation experiments were compared to the relevant Pareto optimal solutions. The relative error between the experimental findings and the optimal solutions of the MRR and Ra were within acceptable limits, with a maximum prediction error of 1% for the MRR and 2% for the Ra.
Author Contributions
O.S. conducted the experiment, optimized and analyzed the experimental results, and wrote an original draft. M.H. supervised, reviewed, and made edits. D.W.J. contributed to the funding acquisition, review, and editing. C.M.L. contributed to the resources, funding acquisition, review, and editing. All authors have read and agreed to the published version of the manuscript.
Funding
This research was supported by the National Research Foundation of Korea (NRF) grant funded by the Korea government (MSIT) (No. 2022R1A2B5B0300188413).
Data Availability Statement
The authors confirm that the data supporting the findings of this study are available within the article.
Acknowledgments
The authors express their gratitude to Mostafa Mahmoud Shehata of the Central Metallurgical Research and Development Institute for his support and for giving the sample of Inconel 718 superalloy.
Conflicts of Interest
The authors declare no conflicts of interest.
References
- Yuan, J.; Wang, K.; Yu, T.; Fang, M. Reliable multi-objective optimization of high-speed WEDM process based on Gaussian process regression. Int. J. Mach. Tools Manuf. 2008, 48, 47–60. [Google Scholar] [CrossRef]
- Zhang, G.; Zhang, Z.; Ming, W.; Guo, J.; Huang, Y.; Shao, X. The multi-objective optimization of medium-speed WEDM process parameters for machining SKD11 steel by the hybrid method of RSM and NSGA-II. Int. J. Adv. Manuf. Technol. 2014, 70, 2097–2109. [Google Scholar] [CrossRef]
- Reddy, P.V.B.; Kumar, C.H.R.V.; Reddy, K.H. Modeling of wire EDM process using backpropagation (BPN) and General Regression Neural Networks (GRNN). In Frontiers in Automobile and Mechanical Engineering; IEEE: Chennai, India, 2010; pp. 317–321. [Google Scholar] [CrossRef]
- Singh, T.; Kumar, P.; Misra, J.P. Modelling of MRR during Wire-EDM of Ballistic grade alloy using Artificial Neural Network Technique. J. Phys. Conf. Ser. 2019, 1240, 12114. [Google Scholar] [CrossRef]
- Lalwani, V.; Sharma, P.; Pruncu, C.I.; Unune, D.R. Response surface methodology and artificial neural network-based models for predicting performance of wire electrical discharge machining of Inconel 718 alloy. J. Manuf. Mater. Process. 2020, 4, 44. [Google Scholar] [CrossRef]
- Hasan, M.M.; Saleh, T.; Sophian, A.; Rahman, M.A.; Huang, T.; Mohamed Ali, M.S. Experimental modeling techniques in electrical discharge machining (EDM): A review. Int. J. Adv. Manuf. Technol. 2023, 127, 2125–2150. [Google Scholar] [CrossRef]
- Choudhary, P.; Desale, Y.B.; Ranjan, G.; Kiran Naik, B.; Singh, V.K. Parametric optimization of wire EDM process for single crystal pure tungsten using Taguchi-Grey relational analysis. Sādhanā 2023, 48, 152. [Google Scholar] [CrossRef]
- Thakur, A.; Gangopadhyay, S. State-of-the-art in surface integrity in machining of nickel-based superalloys. Int. J. Mach. Tools Manuf. 2016, 100, 25–54. [Google Scholar] [CrossRef]
- Oniszczuk-Świercz, D.; Świercz, R.; Michna, Š. Evaluation of Prediction Models of the Microwire EDM Process of Inconel 718 Using ANN and RSM Methods. Materials 2022, 15, 8317. [Google Scholar] [CrossRef]
- Montgomery, D.C. Design and Analysis of Experiments, 9th ed.; John Wiley & Sons: Hoboken, NJ, USA, 2022. [Google Scholar]
- Mohamed, O.A.; Masood, S.H.; Bhowmik, J.L. Characterization and dynamic mechanical analysis of PC-ABS material processed by fused deposition modeling: An investigation through I-optimal response surface methodology. Measurement 2017, 107, 128–141. [Google Scholar] [CrossRef]
- Hewidy, M.; Salem, O. Integrating experimental modeling techniques with the Pareto search algorithm for multiobjective optimization in the WEDM of Inconel 718. Int. J. Adv. Manuf. Technol. 2023, 129, 299–319. [Google Scholar] [CrossRef]
- Chou, P.H.; Hwang, Y.R.; Yan, B.H. The study of machine learning for wire rupture prediction in WEDM. Int. J. Adv. Manuf. Technol. 2022, 119, 1301–1311. [Google Scholar] [CrossRef]
- Yusoff, Y.; Mohd Zain, A.; Sharif, S.; Sallehuddin, R.; Ngadiman, M.S. Potential ANN prediction model for multi-performance WEDM on Inconel 718. Neural. Comput. Appl. 2018, 30, 2113–2127. [Google Scholar] [CrossRef]
- Gramatica, P. On the development and validation of QSAR models. Methods Mol. Biol. 2013, 930, 499–526. [Google Scholar] [CrossRef] [PubMed]
- Hamzaçebi, C. Optimization of process parameters in oriented strand board manufacturing by Taguchi method. Bioresources 2016, 11, 5987–5993. [Google Scholar] [CrossRef]
- El-Taweel, T.A.; Hewidy, A.M. Parametric Study and Optimization of WEDM Parameters for CK45 Steel. Int. J. Eng. Pract. Res. 2013, 2, 156–169. [Google Scholar]
- El-Taweel, T.A. Multi-response optimization of EDM with Al-Cu-Si-TiC P/M composite electrode. Int. J. Adv. Manuf. Technol. 2009, 44, 100–113. [Google Scholar] [CrossRef]
- Hewidy, M.S.; El-Taweel, T.A.; El-Safty, M.F. Modelling the machining parameters of wire electrical discharge machining of Inconel 601 using RSM. J. Mater. Process Technol. 2005, 169, 328–336. [Google Scholar] [CrossRef]
- Kumar, H.; Manna, A.; Kumar, R. Modeling of Process Parameters for Surface Roughness and Analysis of Machined Surface in WEDM of Al/SiC-MMC. Trans. Indian. Inst. Met. 2018, 71, 231–244. [Google Scholar] [CrossRef]
- Raju, P.; Sarcar, M.M.M.; Satyanarayana, B. Optimization of Wire Electric Discharge Machining Parameters for Surface Roughness on 316 L Stainless Steel Using Full Factorial Experimental Design. Procedia Mater. Sci. 2014, 5, 1670–1676. [Google Scholar] [CrossRef][Green Version]
- Sreenivasa Rao, M.; Venkaiah, N. Experimental investigations on surface integrity issues of Inconel-690 during wire-cut electrical discharge machining process. Proc. Inst. Mech. Eng. B J. Eng. Manuf. 2018, 232, 731–741. [Google Scholar] [CrossRef]
- Praveen, N.; Kumar, N.S.; Prasad, C.D.; Giri, J.; Albaijan, I.; Mallik, U.S.; Sathish, T. Effect of pulse time (Ton), pause time (Toff), peak current (Ip) on MRR and surface roughness of Cu–Al–Mn ternary shape memory alloy using wire EDM. J. Mater. Res. Technol. 2024, 30, 1843–1851. [Google Scholar] [CrossRef]
- Singh, V.; Bhandari, R.; Yadav, V.K. An experimental investigation on machining parameters of AISI D2 steel using WEDM. Int. J. Adv. Manuf. Technol. 2017, 93, 203–214. [Google Scholar] [CrossRef]
- Oßwald, K.; Lochmahr, I. Effect of the relative velocity between electrodes in high-speed wire EDM (HSWEDM). In Procedia CIRP; Elsevier B.V.: Amsterdam, The Netherlands, 2020. [Google Scholar] [CrossRef]
- He, X.; Liu, Z.; Pan, H.; Qiu, M.; Zhang, Y. Increasing process efficiency of HSWEDM based on discharge probability detection. Int. J. Adv. Manuf. Technol. 2017, 93, 3647–3654. [Google Scholar] [CrossRef]
Disclaimer/Publisher’s Note: The statements, opinions and data contained in all publications are solely those of the individual author(s) and contributor(s) and not of MDPI and/or the editor(s). MDPI and/or the editor(s) disclaim responsibility for any injury to people or property resulting from any ideas, methods, instructions or products referred to in the content. |
© 2024 by the authors. Licensee MDPI, Basel, Switzerland. This article is an open access article distributed under the terms and conditions of the Creative Commons Attribution (CC BY) license (https://creativecommons.org/licenses/by/4.0/).