Article

Design, Fabrication, and Commissioning of Transonic Linear Cascade for Micro-Shock Wave Analysis

by
Mihnea Gall
1,2,
Valeriu Drăgan
1,
Oana Dumitrescu
1,*,
Emilia Georgiana Prisăcariu
1,
Mihaela Raluca Condruz
1,
Alexandru Paraschiv
1,
Valentin Petrescu
1 and
Mihai Vlăduț
1
1
Romanian Research and Development Institute for Gas Turbines COMOTI, 061126 Bucharest, Romania
2
Faculty of Aerospace Engineering, National University of Science and Technology POLITEHNICA Bucharest, 011061 Bucharest, Romania
*
Author to whom correspondence should be addressed.
J. Manuf. Mater. Process. 2024, 8(5), 201; https://doi.org/10.3390/jmmp8050201
Submission received: 8 August 2024 / Revised: 13 September 2024 / Accepted: 15 September 2024 / Published: 17 September 2024

Abstract

:
Understanding shock wave behavior in supersonic flow environments is critical for optimizing the aerodynamic performance of turbomachinery components. This study introduces a novel transonic linear cascade design, focusing on advanced blade manufacturing and experimental validation. Blades were 3D-printed using Inconel 625, enabling tight control over the geometry and surface quality, which were verified through extensive dimensional accuracy assessments and surface finish quality checks using coordinate measuring machines (CMMs). Numerical simulations were performed using Ansys CFX with an implicit pressure-based solver and high-order numerical schemes to accurately model the shock wave phenomena. To validate the simulations, experimental tests were conducted using Schlieren visualization, ensuring high fidelity in capturing the shock wave dynamics. A custom-designed test rig was commissioned to replicate the specific requirements of the cascade, enabling stable and repeatable testing conditions. Experiments were conducted at three different inlet pressures (0.7-bar, 0.8-bar, and 0.9-bar gauges) at a constant temperature of 21 °C. Results indicated that the shock wave intensity and position are highly sensitive to the inlet pressure, with higher pressures producing more intense and extensive shock waves. While the numerical simulations aligned broadly with the experimental observations, discrepancies at finer flow scales suggest the need for the further refinement of the computational models to capture detailed flow phenomena accurately.

1. Introduction

Shock wave interactions and their control strategies, either passive or active, have been a critical area of research due to their significant impact on various engineering applications. Understanding the characteristics of shock waves—orientation, position, strength, and unsteadiness—is crucial, as these factors significantly influence static and stagnation pressure distributions, boundary layer development, vortex formation, shear stress, and overall flow stability and losses. These factors, in turn, affect the performance of engineering components, impacting drag and engine efficiency. According to Hergt et al. [1], the current design process of transonic compressor blades may have limitations, particularly in predicting flow unsteadiness and its impact on the cascade performance. While simulations partly replicate shock wave fluctuations, discrepancies in magnitude persist, underscoring the need for advanced simulation techniques. Large eddy simulations (LESs) effectively reproduce shock wave/boundary layer interactions, revealing complex three-dimensional flow characteristics within the shock wave/boundary layer interaction (SWBLI) region [2]. This interaction induces pressure fluctuations downstream on the suction side, reaching up to approximately 2% of the local mean pressure [3]. An overview of the current understanding of these interactions, encompassing general characteristics, test section configurations, sources of unsteadiness, thermal transport interactions, and control strategies, is detailed in Ligrani’s [4] study. The survey presents a series of studies aimed at enhancing the performance and stability of supersonic and transonic cascades through various numerical and experimental methods. Concurrently, Giannelis [5] presents the advancements in transonic shock buffet and suppression technologies to mitigate shock oscillations effectively. Liu et al. [6] introduce a one-dimensional analytical shock loss prediction method tailored for supersonic cascades. This method divides the shock system into distinct processes, enabling rapid shock loss prediction and optimization, validated with notable reductions in the shock loss for ARL-SL19 and DLR-PAV-1.5 cascades. Wang et al. [7] examine the efficacy of the suction control in a Mach 2.4 supersonic cascade, demonstrating its role in stabilizing shock structures and pressure gradients, thereby enhancing the resistance to back pressure and reducing the mass flow loss. The influence of the back pressure on the structure of internal shock waves and secondary flows is significant. An analysis of the losses in a transonic cascade revealed that the wake region primarily encompasses six types of loss, with the total cascade loss decreasing as the back pressure increases [8].
Transition control methods aim to mitigate shock-induced flow separation in transonic compressor cascades. These methods, including adjustments in the free-stream turbulence levels, air-jet vortex generators (AJVGs), and surface roughness patches [9], play critical roles in stabilizing shock oscillations and enhancing the cascade performance [10]. Simurda et al. [11] outline a systematic approach to studying turbine blade cascades under supersonic conditions, addressing key challenges in the experimental modeling and wind tunnel configurations. Theoretical frameworks and empirical correlations [12,13] are continually refined to better understand the complex interactions between shock waves and compressor blades. This interdisciplinary approach not only enhances the fundamental understanding but also drives innovations in blade design, aiming to optimize efficiency, reduce losses, and mitigate detrimental effects like stall and separation. Moreover, experimental techniques show continuous evolution, complementing computational approaches through high-fidelity measurements of shock wave dynamics, boundary layer development, and flow stability using techniques such as particle image velocimetry (PIV) [14,15,16], Schlieren imaging [17], and pressure-sensitive paint (PSP) [18,19]. This interdisciplinary approach refines the theoretical frameworks and empirical correlations to deepen the understanding of shock wave interactions with compressor blades, driving innovations in turbomachinery design to optimize efficiency, reduce losses, and mitigate effects like stall and separation.
Furthermore, the choice of materials and manufacturing techniques significantly influences all methods and solutions. In recent years, additive manufacturing (AM) has emerged as one of the most precise fabrication techniques for customized geometries. Among the AM methods utilizing polymer powder, Selective Laser Sintering (SLS) stands out as the most widely adopted due to its advantages, such as its ease of mixing and controllable composition [20]. The study of shock waves in various sectors, such as the engineering, military, aerospace, etc., sectors, requires flexibility in the manufacturing process, especially when porous structures are involved [21,22]. AM allows for the creation of complex, lightweight structures with precisely controlled porosity, which is critical for applications involving shock wave mitigation and energy absorption [23,24]. For instance, materials designed with tailored porosity can dissipate shock energy more effectively, enhancing the safety and performance of protective gear and aerospace components [25,26]. Moreover, advancements in AM materials, such as the development of high-performance polymers and composites, have expanded the range of applications to which these techniques can be employed. High-performance polymers offer superior mechanical properties, thermal stability, and chemical resistance, making them suitable for harsh environments encountered in aerospace and military applications [27,28]. The continuous evolution of AM technologies and materials holds promise for even more innovative applications in the future.
Leveraging recent advancements in additive manufacturing (AM) and material sciences, this paper proposes a new and affordable linear cascade design, relevant to aerospace applications, for unimpeded Schlieren visualization. It explores the distinct challenges faced during the design of both the cascade and the blades, focusing on achieving the targeted flow characteristics while minimizing discrepancies between experimental outcomes and numerical simulations.

2. Materials and Methods

To investigate the flow characteristics and the influence of shock wave/boundary layer interaction in turbomachinery, and providing the flow visualization using the Schlieren technique, it was necessary to design and manufacture a transonic linear cascade wind tunnel. One critical aspect of the design was the possibility of studying varying intensities of shock waves while minimizing both the computational and experimental resources. Comprehensive attention was given to the aerodynamic and structural considerations to ensure an optimal performance under transonic conditions. This involved designing cascade blades that could withstand the high-speed flows and pressure variations typical of transonic environments, as well as ensuring that the wind tunnel could produce consistent and repeatable flow conditions for accurate testing and analysis.
The configuration further incorporates the blades of a vaned diffuser design as part of a microgas turbine centrifugal compressor. The 2D airfoil is the result of a linearization of a 3D stator vane used for a microjet compressor. In this application, the height of the vane is very low compared to the chord of the airfoil; moreover, the radius at which the vanes are positioned makes the hub curvature radius very similar to the shroud curvature radius, as shown in Figure 1.
Therefore, very few abatements from radial equilibrium were observed in the CFD (Computational Fluid Dynamics). Adding to this, the decision was made in favor of a linear cascade, as it was much more suited for visualization than an annular array.
The vaned diffuser has several particularities when discussing the Mach number distribution across the passage. Namely, due to the construction requirements, a local streamline curvature arises, which increases the Mach number locally, even under nominal conditions. This phenomenon is distinct from choked flow, where the entire passage experiences a high Mach number, restricting the flow to what is referred to as “stonewall” or choked flow.
In this case, the ensuing shock waves appear as a result of local acceleration due to the streamline curvature and are therefore manageable or can be eliminated altogether. This is because they are not a result of bulk flow but rather a localized effect. Such shock waves are also significantly less intense than those typically found under deep choke conditions in high-pressure-ratio compressors. However, they arise even under nominal conditions and at low speeds (or pressure ratios). Due to these properties, they can be studied even at low inlet pressures, making experimental exploration more affordable.
Another feature of this linear rig is that it utilizes the inherent mass flow differences across the passages. Specifically, the first passage allows more mass flow than the adjacent ones. Typically, experimentalists go to great lengths to mitigate this phenomenon; however, in our case, it proves advantageous. This is because, in one snapshot, we can observe what is representative of the nominal point of different speed lines.
The transformation and characteristics of the linear cascade are detailed in [29], along with the numerical simulations that were the pillar of the design process of the cascade. Table 1 presents the geometrical characteristics of the linear cascade.

2.1. Linear Cascade Design and Manufacturing

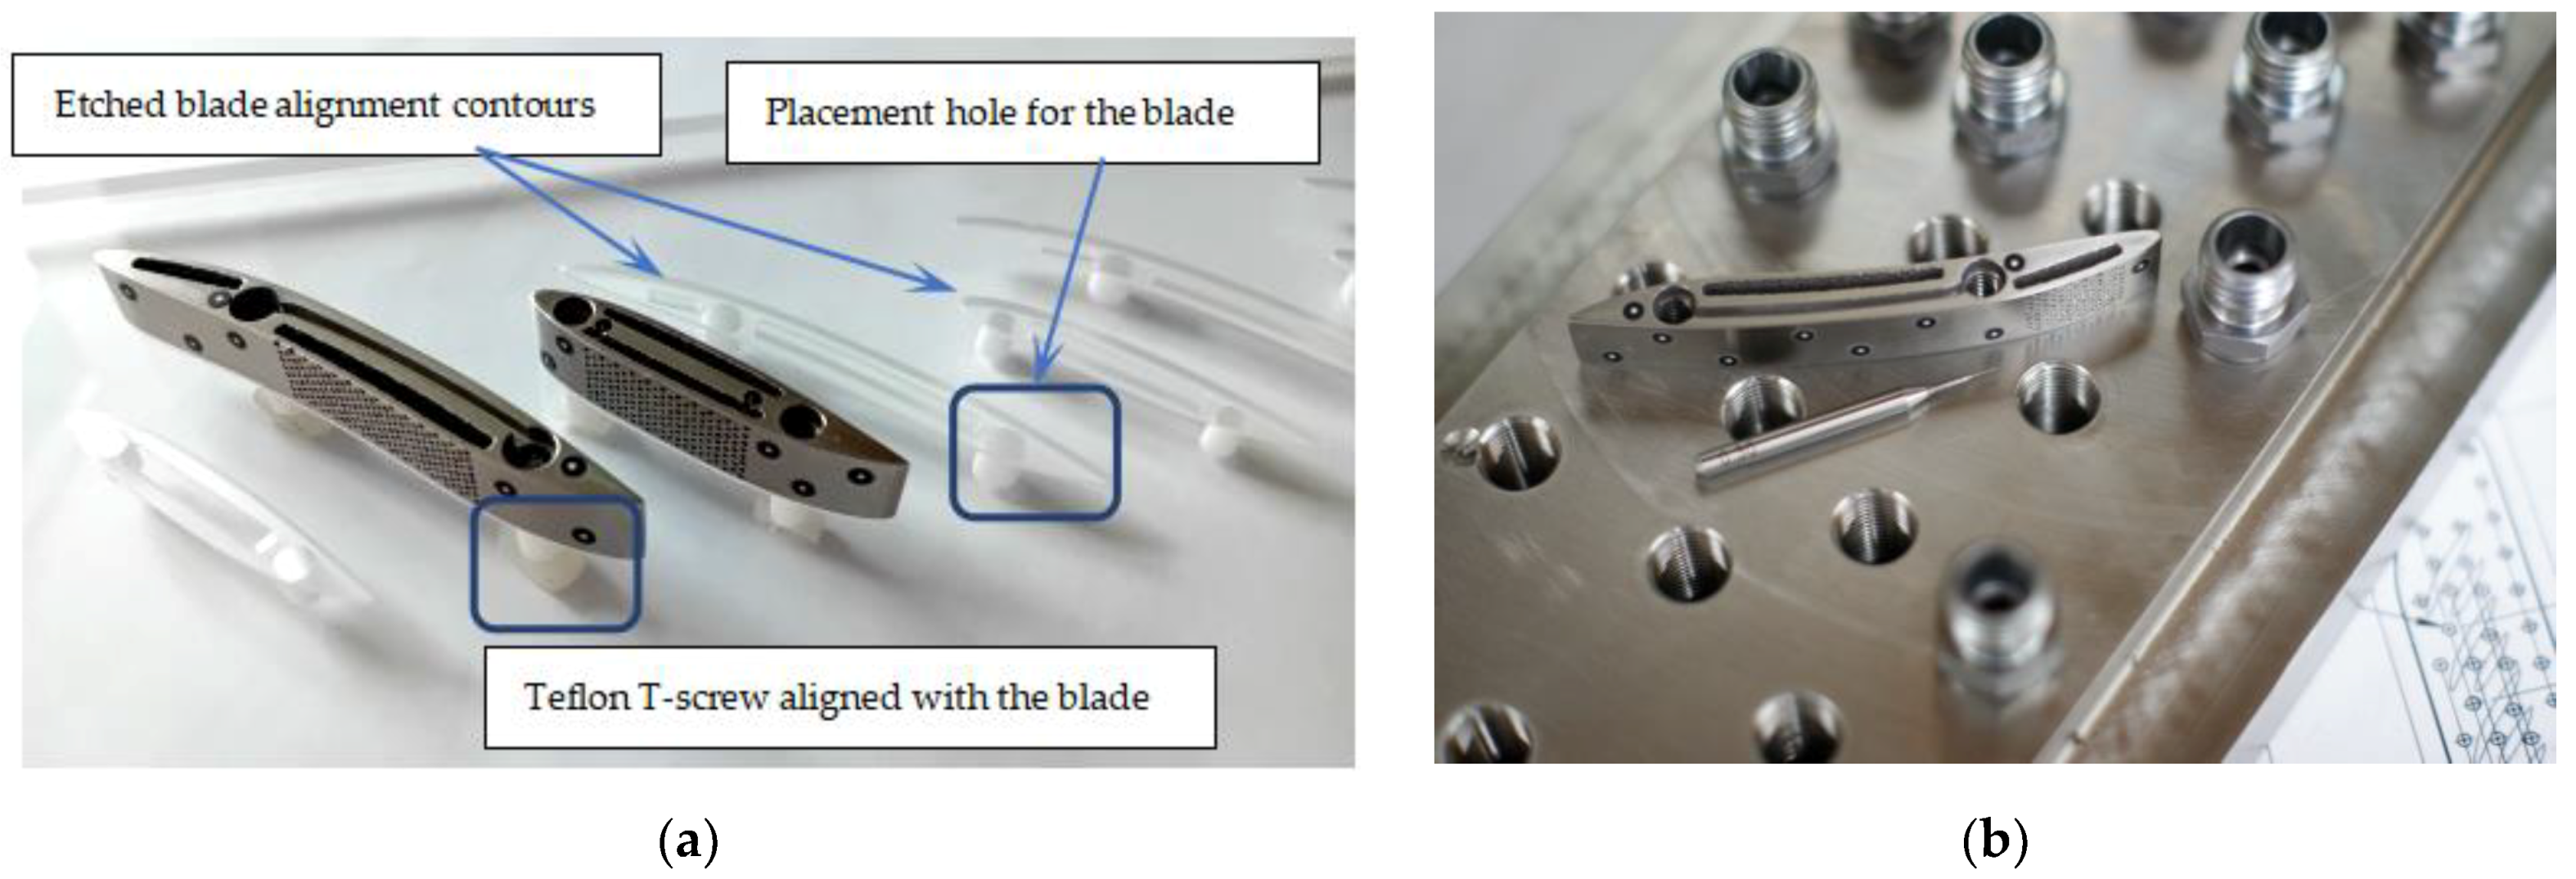
Several aspects had to come together when designing this demonstrator. The rig was designed around a quartz window with blades attached to it, forming a linear cascade. Primarily, the goal was to observe the finely detailed shock wave patterns forming in small-sized linear cascades—acknowledging the fact that simply having static pressure probes will never yield data with enough resolution. Another concern was that a total pressure probe would cause too high a perturbation if placed inside the flow passage. Therefore, two investigation methods were designed for this rig: a Schlieren through-and-through setup (Figure 2a) and an instrumented backplate with static pressure taps on the mid-passages (Figure 2b). The second window is interchangeable with the instrumented plate without disturbing the rest of the rig. Conversely, the main window—which holds the blades—can also be changed independently, making the experimental comparisons less prone to experimental setup differences. Further work will include pressure-sensitive paints [18] on the instrumented plate with real-time visualization through the main window (holding the blades) and also background-oriented Schlieren visualization for velocimetry data [30].
In terms of generic instrumentation, there is a total and static pressure measurement for the inlet, as well as a mass flow meter that feeds into the pressure regulator.
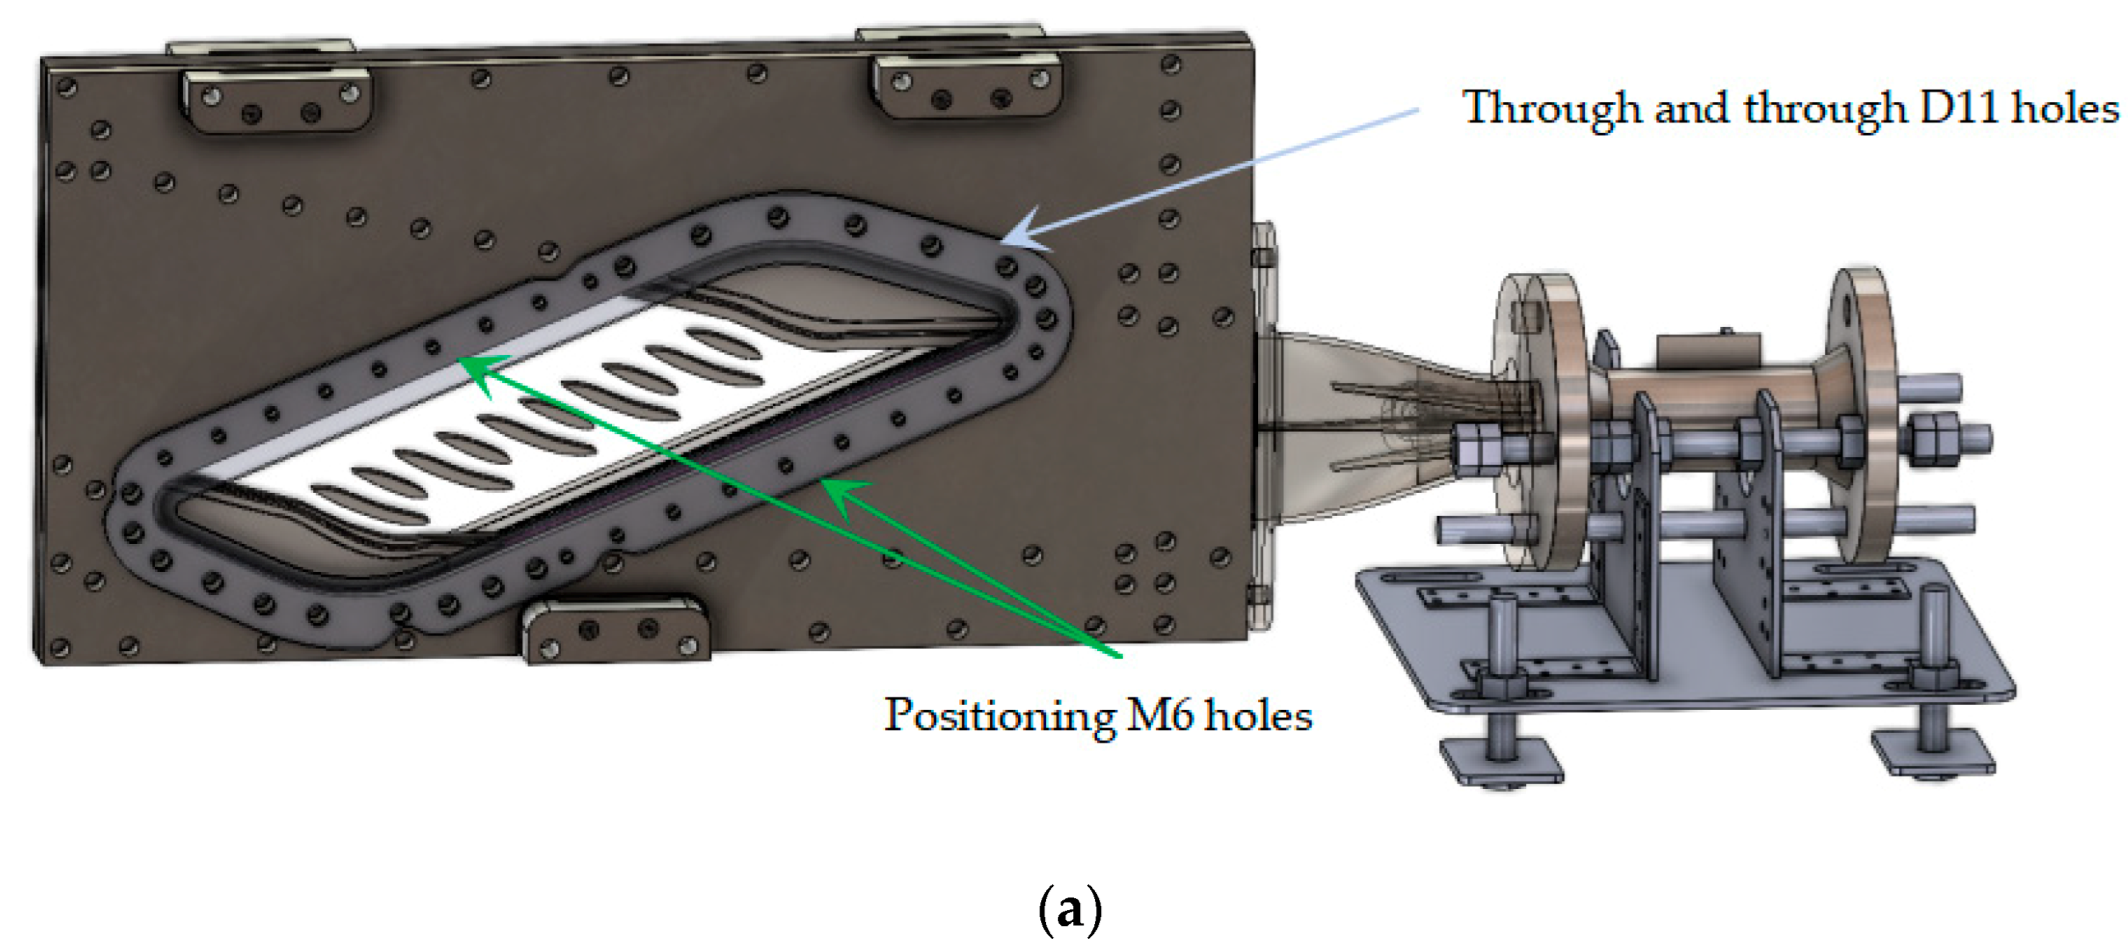
Figure 3a shows the 3D CAD (Computer-Aided Design) model of the technology demonstrator, along with the immediate components that connect the air pipe from the air supply line to the rig. The linear cascade fluid domain was dimensioned based on the CFD (Computational Fluid Dynamics) analysis presented in [29]. At the sides of the cascade, the walls of the top and bottom channels were constructed to match the geometric shape of the pressure and suction sides of the stator vane. Upstream of the linear cascade itself, the passage was kept straight, ensuring the incidence of the flow. On the downstream, however, the top and bottom walls were angled so that the flow distribution is somewhat even through the five passages. A small difference was kept by design, in order to be able to investigate multiple mass flows at the same time. The physical interpretation of this is that each passage represents the best efficiency point on different speed lines. As expected [31], the top passages let more mass flow pass than the lower ones.
Given that the entry angle into the stator is αinlet = 68°, the vanes were designed to ensure that the fluid’s inlet angle into the cascade matches this value, thereby aligning with the 3D model of the vaned diffuser.
The experimental setup features five channels (main vane and splitter vane) within the flow domain. Special consideration was given to the experimental area’s optical access to facilitate the visualization of shock waves using the Schlieren technique and to allow relatively straightforward vane replacement without complete disassembly. Two quartz plates were designed and manufactured to accommodate the vanes, while also ensuring the proper sealing of the flow field to prevent leakages and pressure losses. These could influence the flow measurements and, more importantly, could potentially perturb the flow field with high-speed secondary flows—obstructing the visibility of the main phenomenon.
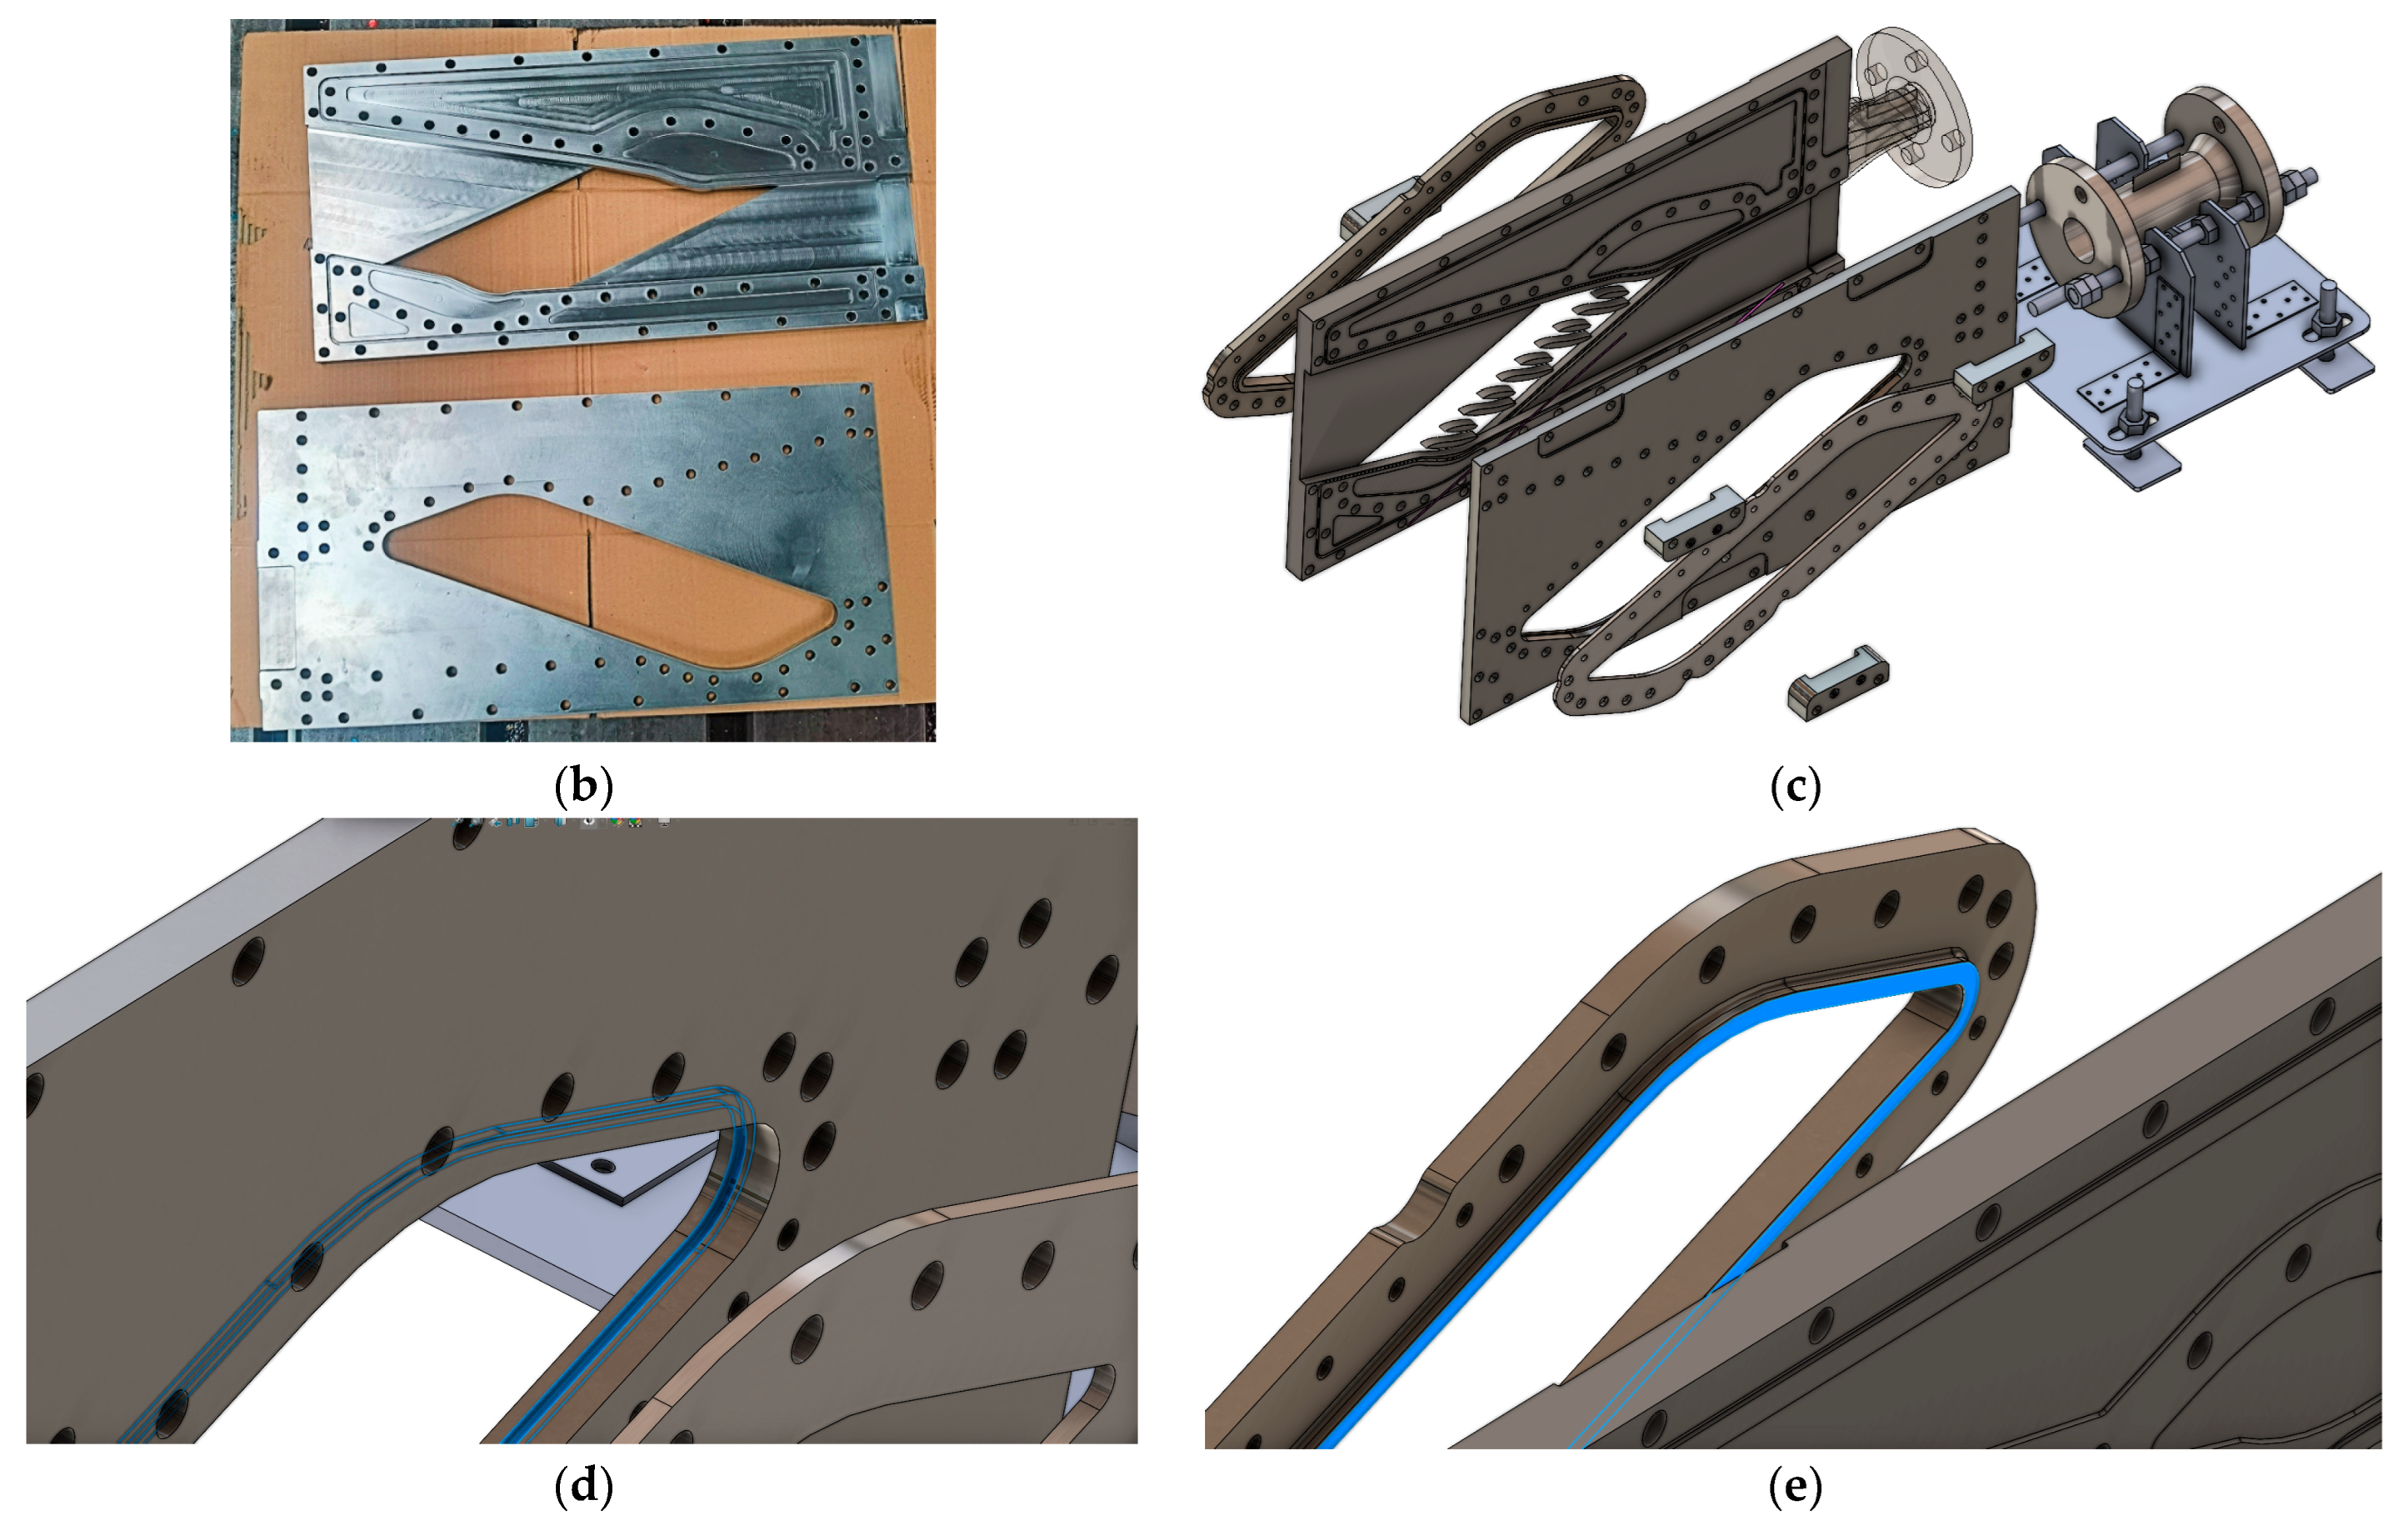
The two quartz windows are held in place by contoured hollow lids on each of the boards (main and secondary). In both cases, they provide an additional seal for the window–rig interface. Also depicted in Figure 3b–d are the two main sealing types for the windows: firstly, the O-ring channel on the rim where the windows are inserted, and secondly, the contoured pressing surface (the O-rings and gaskets themselves are not depicted). Because of their soft composition, the O-rings and gaskets used also provide vibration damping, preventing the windows from contacting the metal walls.
Since the investigated phenomenon extended into the boundary layer, special attention was placed on the positioning screws, which could not extend their heads into the visualization window, as is the case in other similar-sized and similar-purpose rigs [32]. Due to the large diameter needed—in order to prevent the screws exerting too much localized force into the quartz holes—the screws needed to have T-heads and also be made from a compliant material.
Figure 3 depicts the components defining the flow channel of the demonstrator. On the right side of the image, the main plate with the quartz window and the vane pattern milled on it are visible.
Figure 4 shows the assembly details of the linear cascade setup design with the vanes—the experimental model. In Figure 4a, the blades are fixed onto one of the quartz glass plates using PTFE screws. The proper incidence of the cascade is assured by the vane pattern milled into the quartz and by the two PTFE screws for each airfoil. Figure 4b illustrates a crucial assembly step where the model is connected to the adapter, ensuring that the adapter is correctly seated in the “pocket” at the channel’s entrance. Due to the secondary board design, the alignment can be less stringent, since the secondary quartz window is allowed to slide front to back by ~0.5 mm. In terms of the top-to-bottom alignment, the resting surfaces of both the main board and secondary board are relied upon. The surfaces are machined to achieve planarity values of 0.05 mm. This precision, corroborated by the planarity and parallelism of the active faces, leads to a proper 90° angle on both boards. In terms of the vane spanwise distance, the secondary board window was allowed to “float” with minimal tension. This was achieved by allowing it to rest on the metallic surfaces of the vanes on the aero-active side, while pushing it from the opposite side with the contour screws. Tensioning screws embedded in the secondary board were used to maintain the proper alignment of the quartz window. Even tension was applied through the use of a thick, soft (Shore A20) elastomeric material contoured to match the window–lid interface.
Apart from the alignment screws on the contour and the bottom surfaces, one final element ensures proper assembly: the fitting of the inlet distribution adapter. This tightly fits into the two spot faces on the main and secondary boards. The compliant properties of the PLA 3D-printed distribution adapter handle the tightening. The only permitted misalignment is front to back, but due to the tight fit and the long insertion length, leakages would be minimal. However, in practice with the rig, this has never been a problem.
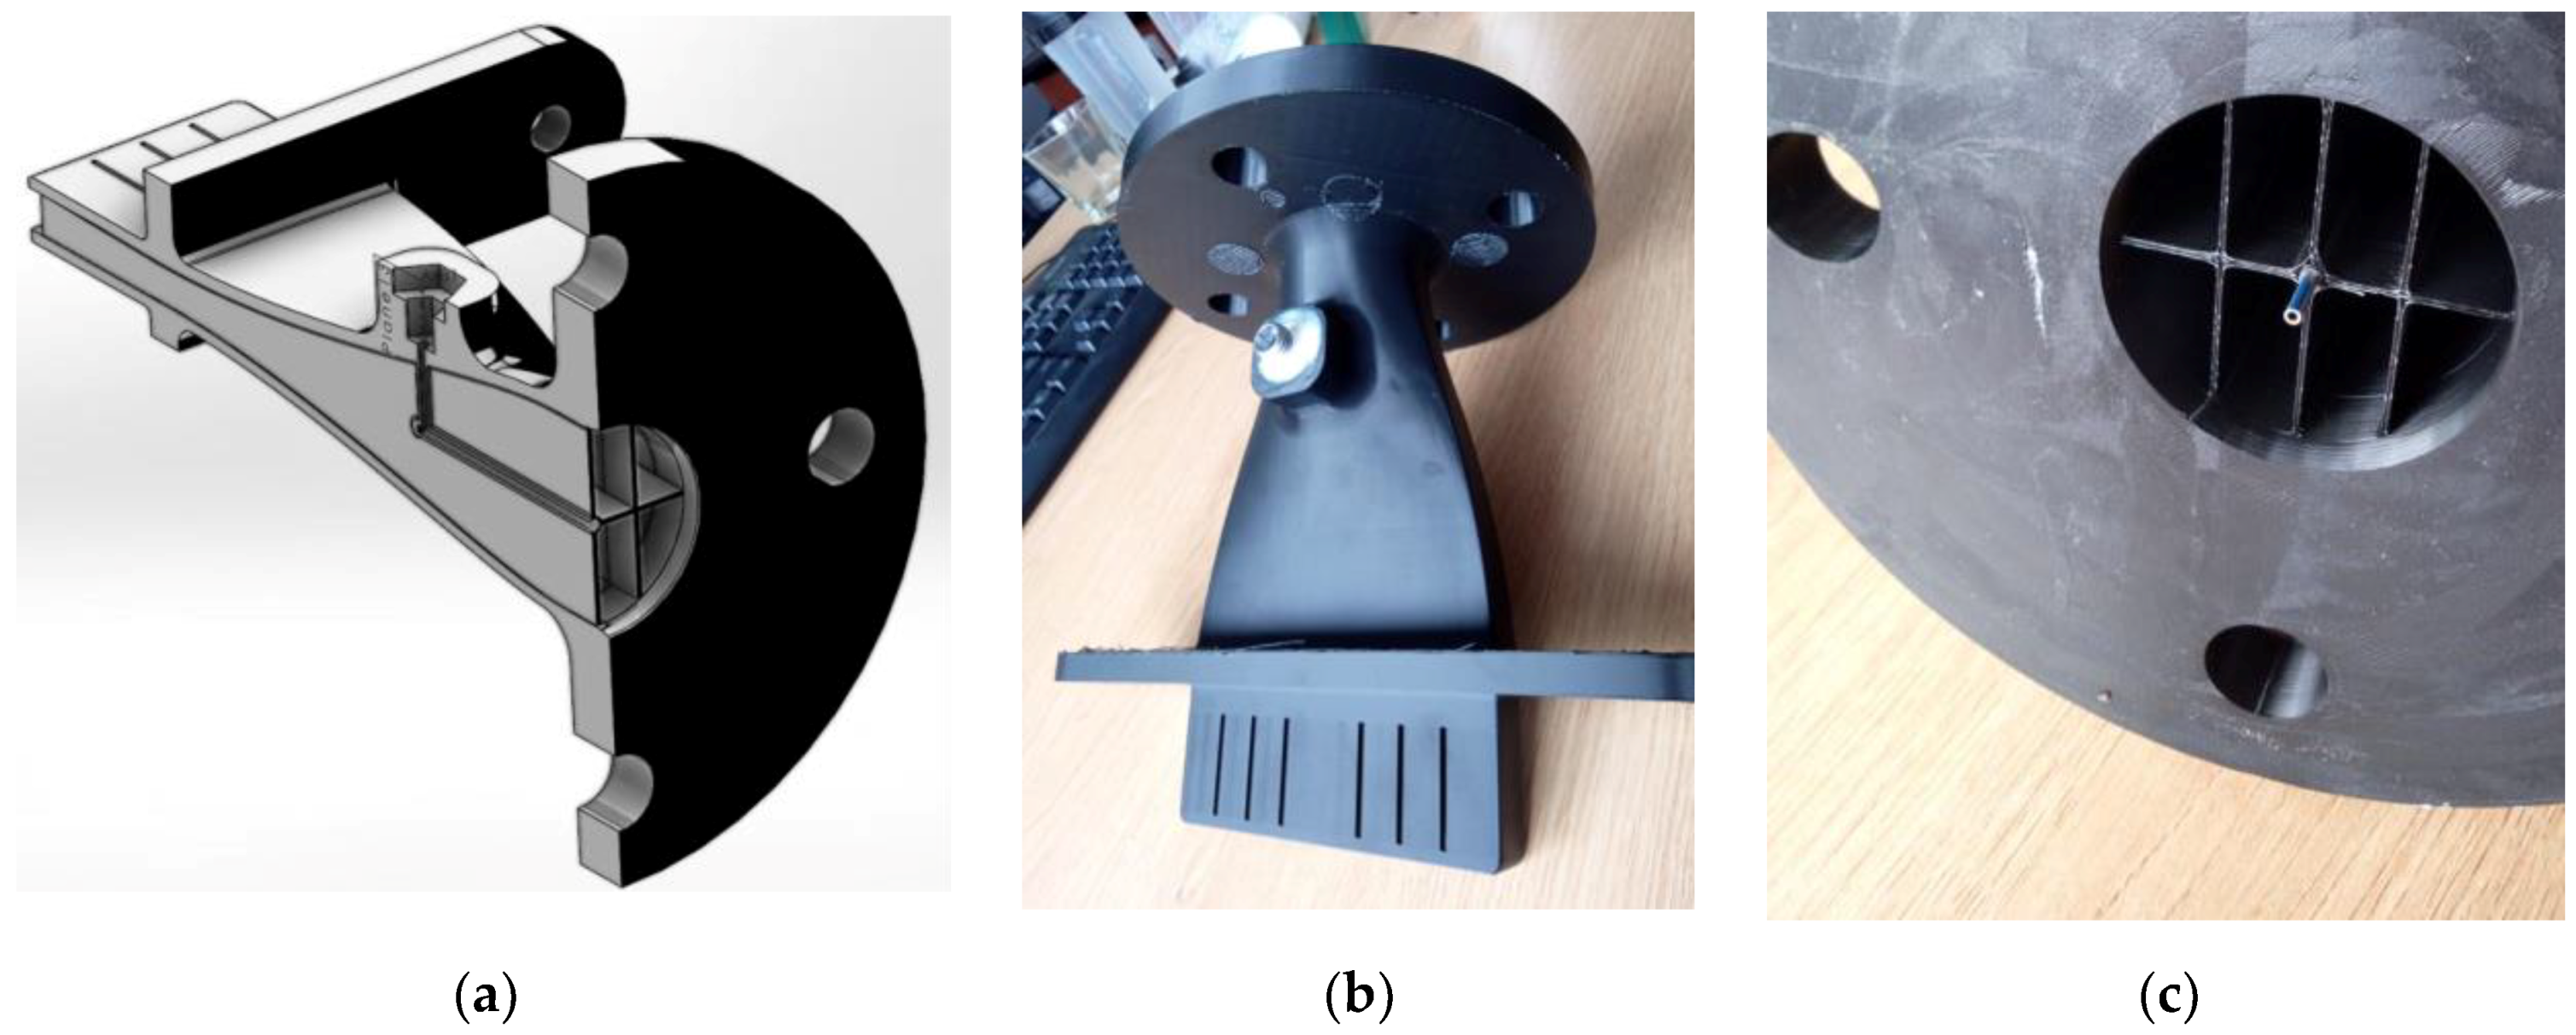
The distribution adapter presented in Figure 5 and Figure 6 has a series of internal walls that attempt to spread the flow evenly across the flow passage. This is achieved in two separate regions of the distributor: first, the flow passage transitions from a circular cross section into a rectangle. This requires walls in both the Ox and Oy directions and suppresses the Dean vortices that would otherwise form because of the sharp changes in the passage shape. Next, there is a pair of symmetrical small settling chambers, before the secondary distribution region. In this region, a series of miniature vanes straighten the flow and allow it to enter the main passage of the rig. Downstream, the fluid was thought to further balance its velocity distribution. However, it was observed through oil streaks that the air is largely unaltered, due to the effectiveness of the distribution adapter. This was also observed in CFD simulations [29].
In the final version of the distribution adapter, a total pressure probe was inserted into the middle of the inlet, which feeds into the side nipple connected to the pressure sensor [33]. This complements the static pressure measurement located in the same axial position and the mass flow measurements from the pressure regulator.
For connecting the PLA 3D-printed distribution adapter to the steel pipe upstream, a Shore A 20 hollow O-ring was also used. This ensured that all misalignments were dealt with without putting too much local stress on the PLA body.
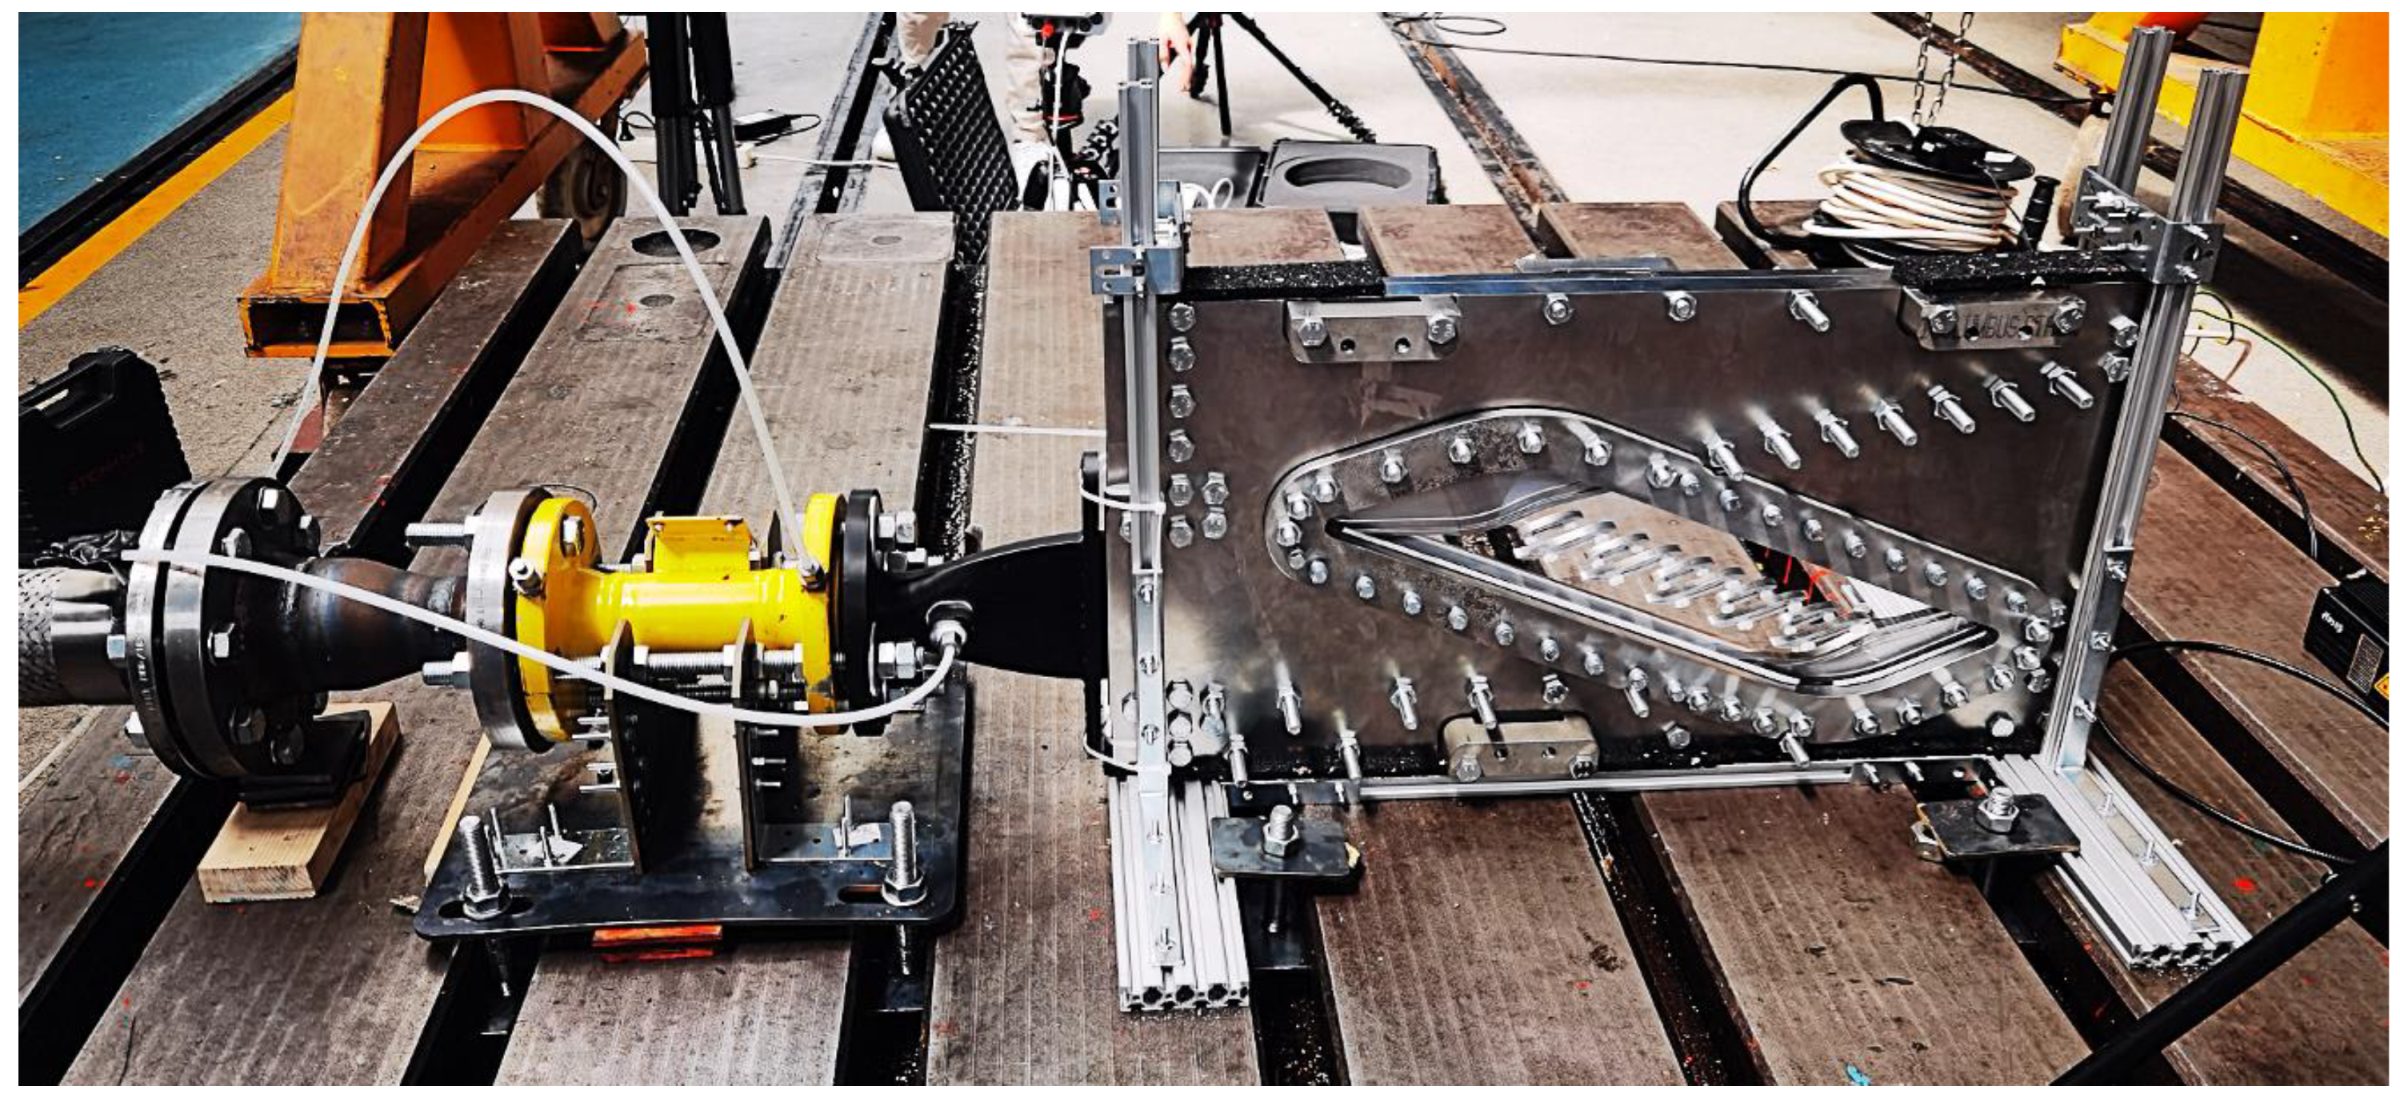
Figure 7 presents the experimental setup of the linear cascade connected to the air line and ready for testing. The image highlights the static and total pressure ports positioned at the adapter’s entrance, which are critical for establishing the transonic cascade’s operating conditions. Compared to Figure 4b, the distribution adapter can now accommodate a total pressure port too, compared to the previous bare orange distribution adapter. The data from these probes were used as the CFD boundary conditions and, later on, for comparing the results of the numerical simulations with the experimental measurements.

2.2. Vane Design and Manufacturing

The most critical aspect of the linear cascade setup is represented by the vane demonstrator design and manufacturing. In addition to visualizing shock waves, another key objective of the linear cascade setup is to explore passive control methods implemented on the blades to mitigate shock waves and manage secondary flows within a controlled environment. This requires a thorough investigation of the experimental solutions for both visualization and instrumentation, as outlined in [34,35,36,37,38,39,40], which provided the starting point for the experimental approach.
The manufacturing of the blades, particularly those with porous-wall structures, were significantly influenced by the selected manufacturing process and its capabilities and limitations [41]. Additive manufacturing technology was selected for the blade manufacturing, specifically the laser powder bed fusion (L-PBF) method, a selective laser melting process (SLM), enabling the possibility of designing and manufacturing the complex geometries essential for passive flow control. An iterative approach was used for tailoring the 3D CAD model of the blades.
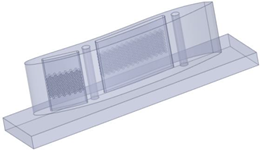
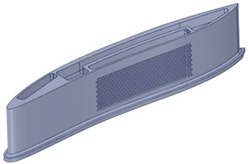
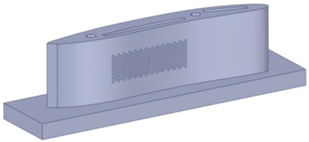
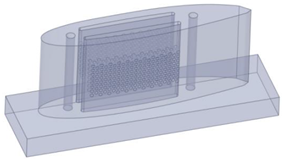
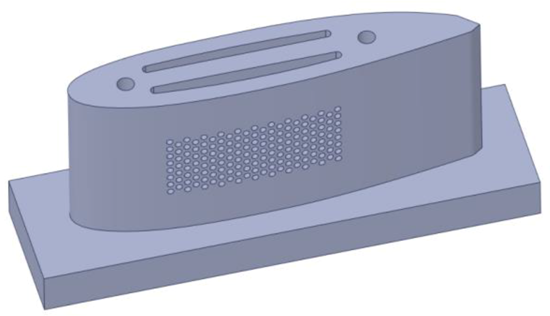
A preliminary 3D CAD model of the blades featuring a porous wall with a 0.5 mm hole diameter was initially designed and manufactured. This model is illustrated in Table 2 (first column), which shows the main and secondary blades.
A Lasertec 30 SLM (upgraded first generation, DMG Mori GmbH) AM machine was used. The material selected for production was a Ni-based superalloy powder, Inconel 625, an alloy frequently used in aeronautical applications due to its excellent performance under mechanically and thermally demanding conditions, as well as in corrosive environments. Inconel 625 powder recycled via internal recirculation was used for manufacturing. The powder characteristics were a particle size of 15–45 µm and particle size distributions of D10 = 20 µm, D50 = 30 µm, and D90 = 38 µm. The process parameters used for manufacturing the blades for the experimental models were as follows: temperature of the building plate: 80 °C; laser power: 250 W; scanning speed: 750 mm/s; layer thickness: 40 μm; hatch distance: 0.11 mm; and scanning strategy: 90°. The additive manufacturing process was performed in an inert gas atmosphere (argon).
However, following the manufacturing process and subsequent evaluation of the printed components, it became evident that several design changes were necessary.
The primary issue identified was that the quality (both the shape and nominal dimensions) of the holes in the perforated area was poor, which affected the performance and functionality of the components. This deformation was a result of the inherent limitations of the L-PBF method, which introduced discrepancies between the designed specifications and the actual printed features. To address this problem, it was determined that the hole sizes needed to be adjusted to account for the distortions caused by the AM process.
Additionally, another significant aspect that prompted changes to the blade model was the design of the fastening system for the blades within the cascade. The initial fastening mechanism was found to be inadequate, necessitating a redesign to ensure the proper integration and stability of the blades in their intended application. This adjustment was essential for achieving the desired performance and durability of the blade assembly.
The final 3D CAD model of the blades is shown in Table 2 (second column), with a hole diameter of 0.75 mm. For the final version, the blades were additive-manufactured with additional material to allow further machining, ensuring the smoothest possible surfaces.

2.2.1. Blade Manufacturing, Orifice Size of the Porous Wall: 0.5 mm

Figure 8 presents the first batch of additive-manufactured blades on the plate before the support material was removed. Once the powder was removed, the fabricated models were analyzed. As seen in the images of Figure 8b–e, several defects were identified in the models. The reduced wall thickness of the porous-wall secondary vane (Figure 8b) caused insufficient laser consolidation, while the perforations on the outer walls were found to be non-compliant with the design specifications. This issue arose because the perforations were designed too close to each other (0.2 mm apart), and for the nominal size of 0.5 mm, the shrinkage of the material during the manufacturing process was not considered. Additionally, powder particles can agglomerate and adhere to the molten material. Figure 8b–d show images in which surface defects are visible, defects like high roughness caused by balling and the trapping of the powder particles at the level of the powder bed and their partial melting and solidification within the perforations, resulting in blockages. At the upper end of the main reference vane (Figure 8e), particle agglomerations and melt pool splashes on the parts’ surfaces were observed.
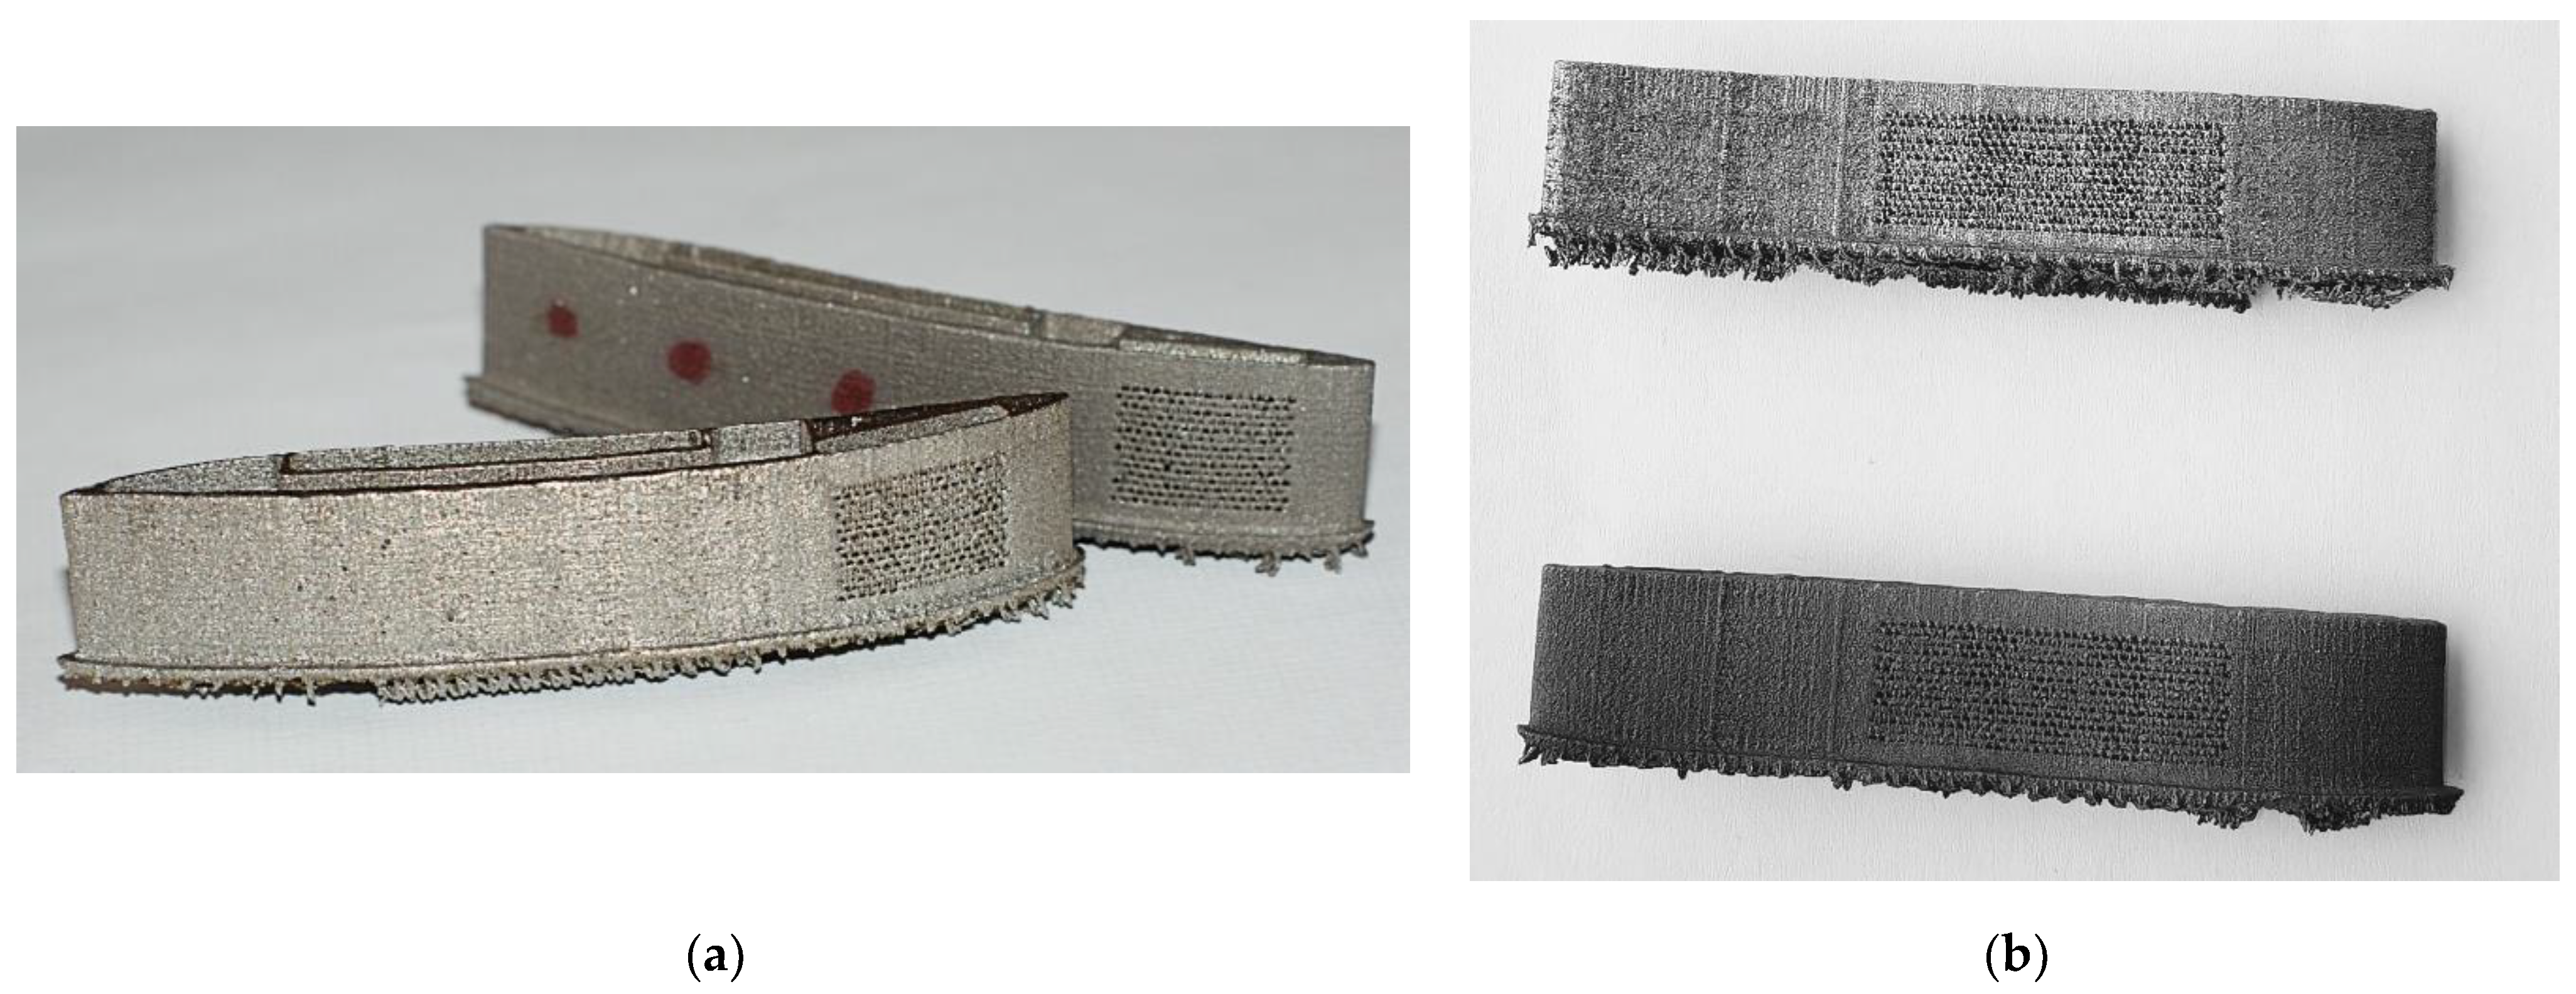
The blades were mechanically detached from the building plate, and the support material was removed. Two models were selected for surface enhancement through corundum blasting using the TC-SB 945-RESS blast booth equipped with the Contracor GX blast gun. Figure 9 shows the main blade before and after sandblasting.
Roughness measurements were performed on the airfoils of an experimental model in its as-printed state and on a model that had undergone sandblasting. The surface roughness was measured using the profile palpation method with the MarSurf PS 10 portable roughness measuring device. The average roughness values were obtained from six measurements made in different areas on each face of the airfoil. The measurements were made parallel to the airfoil chord. It was found that the surfaces of the parts in the as-printed state had roughness (Ra) values greater than 21 µm, which was the upper limit of the measuring device. In contrast, for the sandblasted parts, the average roughness values were Ra = 8.009 µm and Rz = 53.267 µm for the suction side of the airfoil and Ra = 9.024 µm and Rz = 57.297 µm for the pressure side of the airfoil.
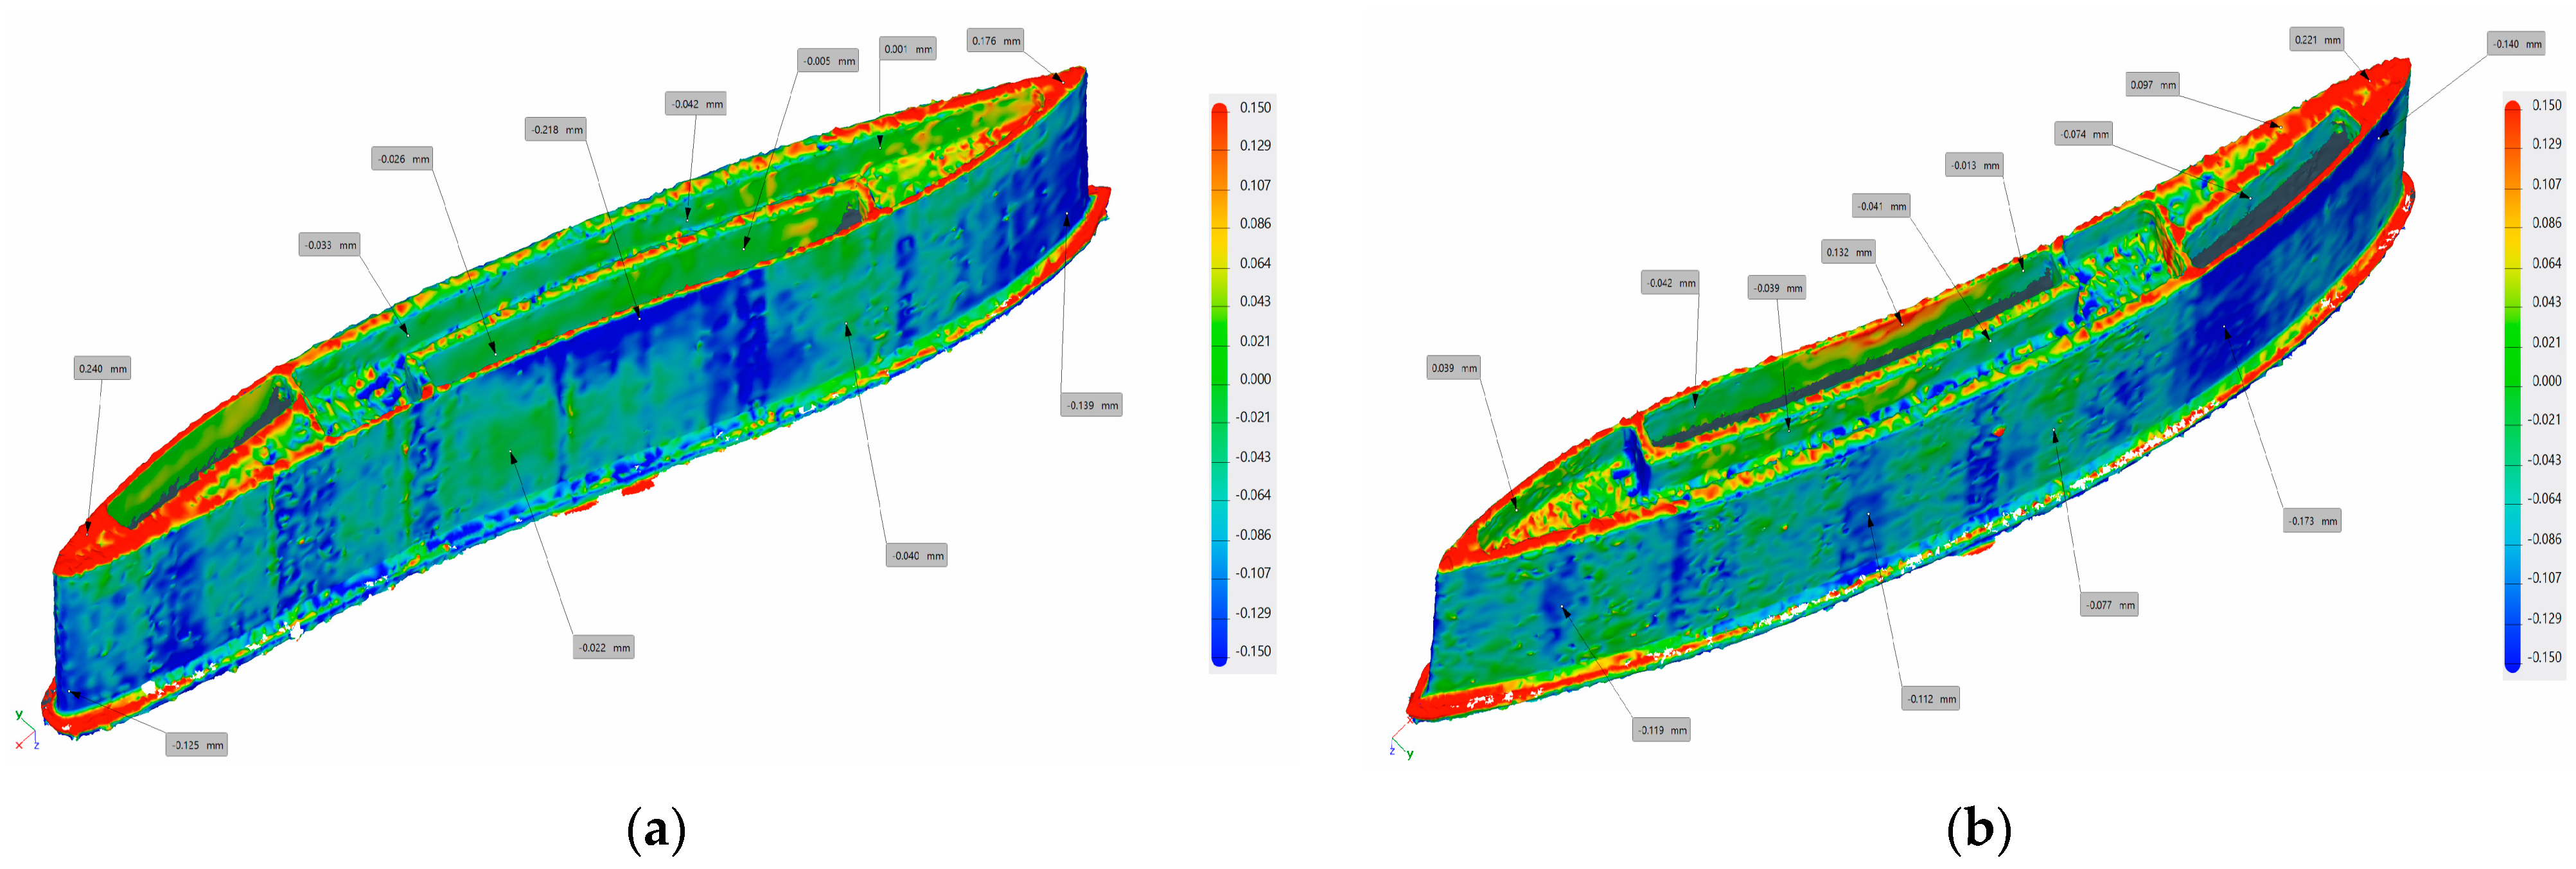
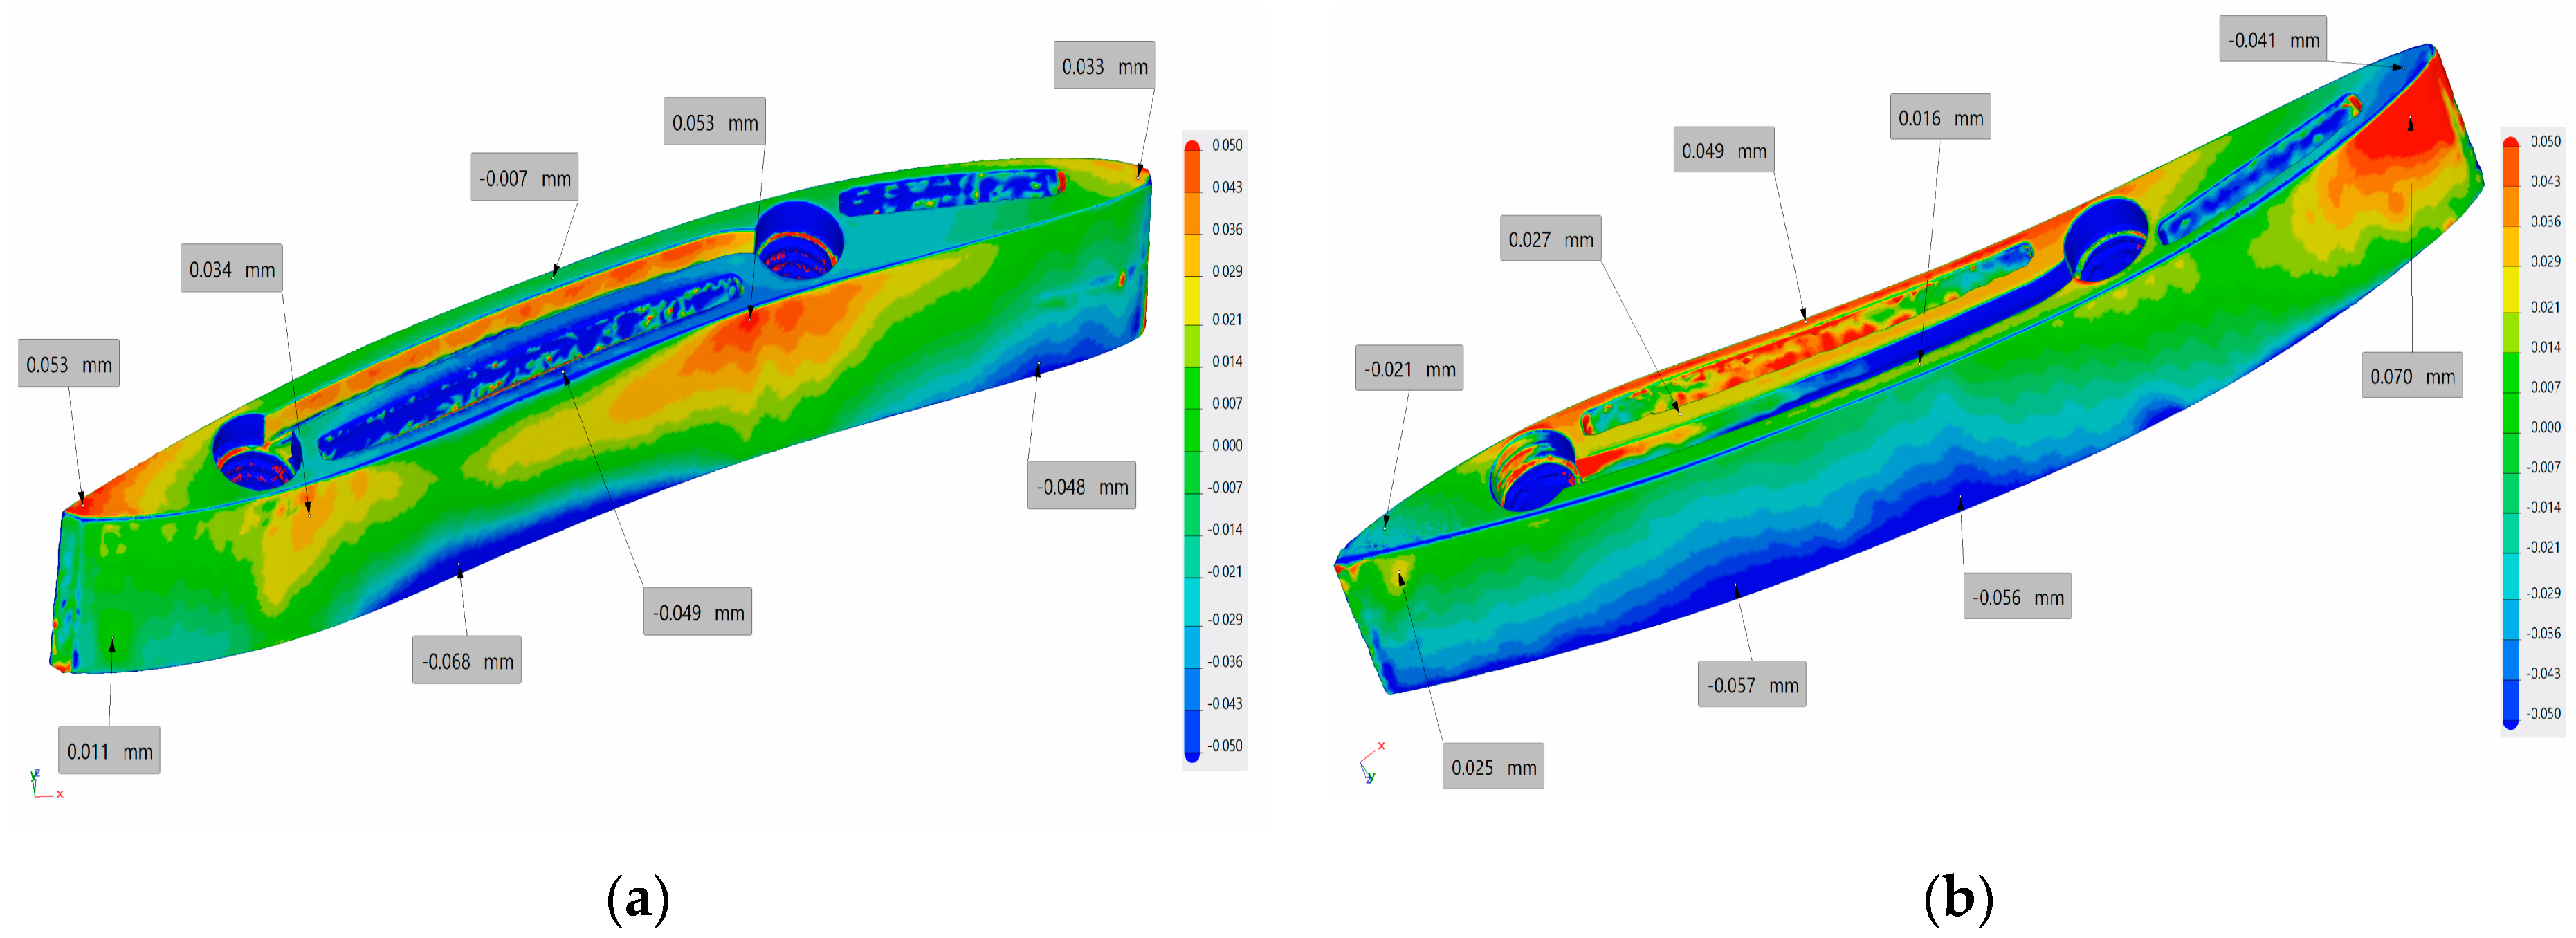
Three designs were selected for the surface roughness analysis: a stator vane without perforations, a stator vane with perforations, and a sandblasted stator vane with perforations. The purpose of this analysis was to determine the dimensional deviations of the additive-manufactured parts compared to the 3D CAD model. For this analysis, GOM-ZEISS ATOS 5M Compact optic scanner [42] (measurement accuracy: 1.9 μm) was used. The results of the surface roughness analysis are presented in Figure 10, Figure 11 and Figure 12.
The surface roughness analysis revealed an average dimensional deviation of ±0.15 mm. It was observed that the sandblasting process could not be controlled to achieve a uniform surface modification, resulting in some areas exhibiting greater deviations than others, both positive and negative. However, these dimensional deviations are considered acceptable for metal additive-manufactured parts without dimensional compensation [43,44].
Based on the results of the first manufacturing test, the following changes to the model were proposed:
  • Increasing the size of the perforations and spacing: the size of the perforations in the airfoil models and the distance between them needed to be increased to reduce their number and avoid manufacturing issues;
  • Material additions for enhanced dimensional accuracy: to achieve a dimensional accuracy superior to the values recorded in the first test, additional material had to be added to all model elevations to allow machining;
  • Designing a platform for CNC clamping: a platform needed to be added to the models’ bases to facilitate clamping them onto the CNC machine fixtures for further processing.

2.2.2. Blade Manufacturing, Orifice Size of the Porous Wall: 0.75 mm

Considering that the models were to be machined later, their surface quality was no longer a critical concern. Therefore, no further analyses were conducted regarding the dimensional accuracy or surface quality of the additive-manufactured models. Figure 13 shows representative images of the raw printed parts after detachment from the building plate and the partial removal of the support material.
Following the second manufacturing test, the following change to the model was proposed: rounding the ends of the base of the experimental model platform to reduce the material losses and minimize the risk of the detachment and degradation of the SLM machine scraper. This change aims to enhance the efficiency of the printing process and improve the overall quality of the printed models.

2.2.3. Blade Manufacturing, Orifice Size of the Porous Wall: 0.75 mm (Rounding the Ends of the Platform Base)

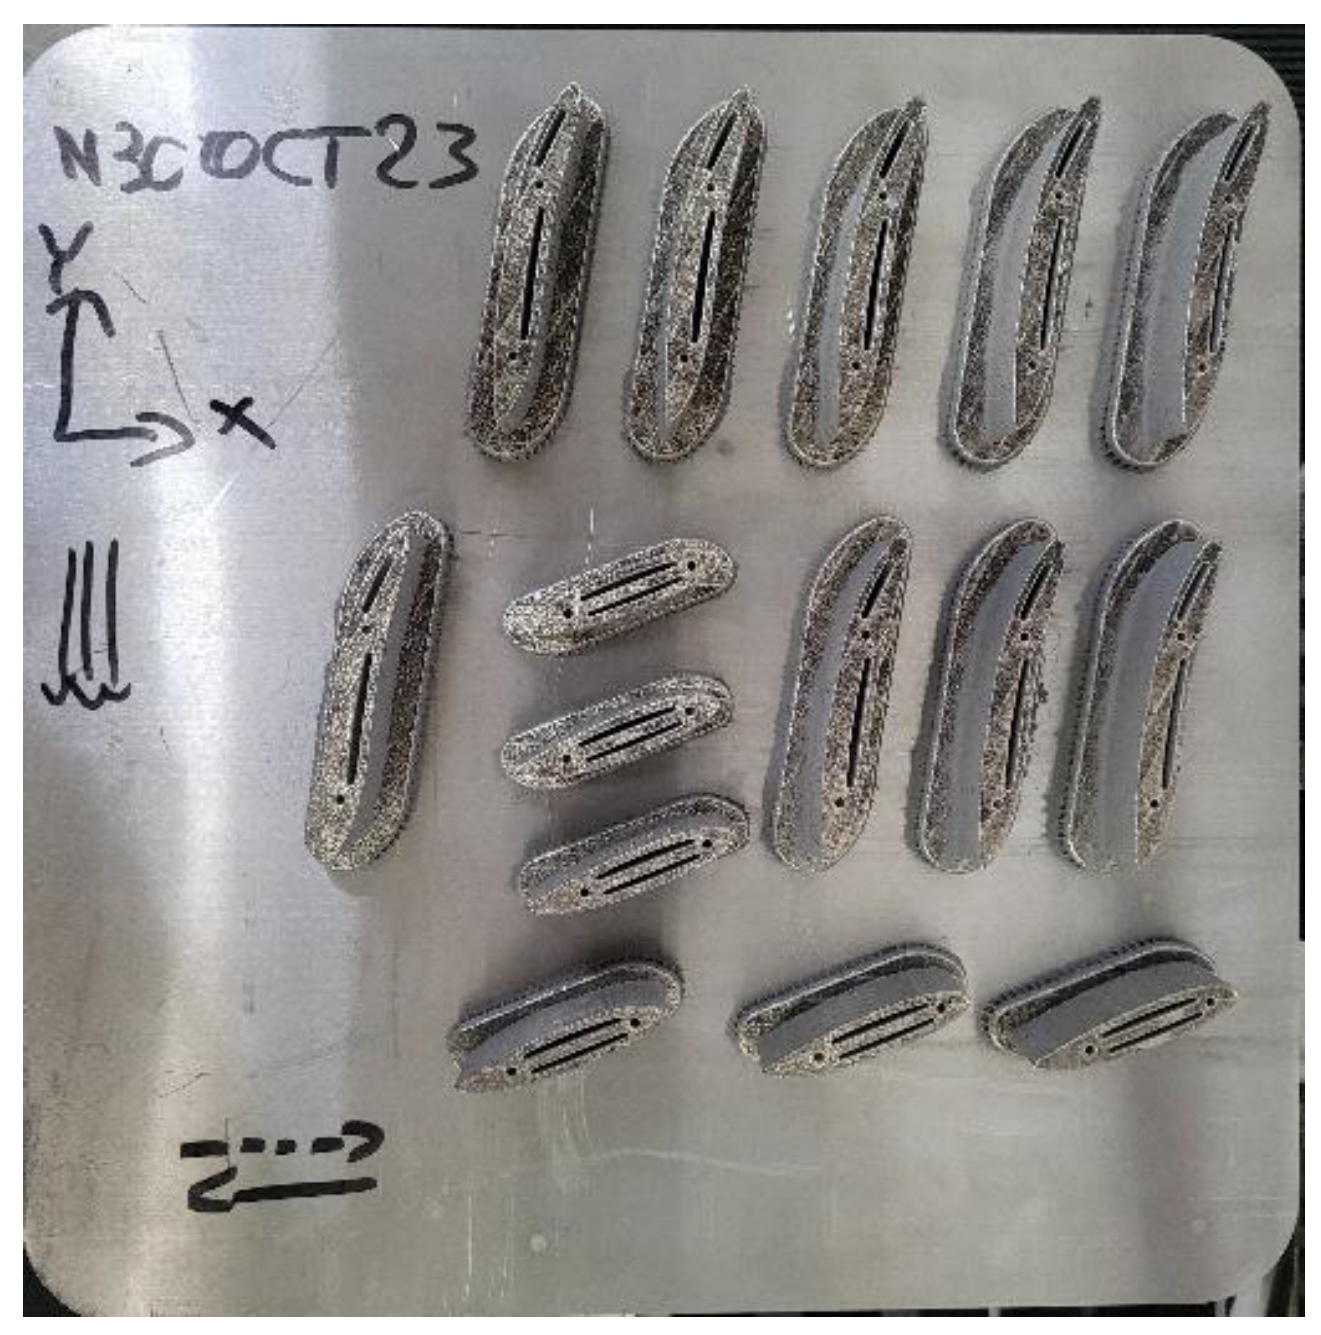
Figure 14 shows the additive-manufactured experimental models on the building plate. After the manufacturing process was finished, the models were mechanically detached from the building plate. Following detachment, the models were subjected to a machining process to refine their dimensions and surface quality according to the project specifications.
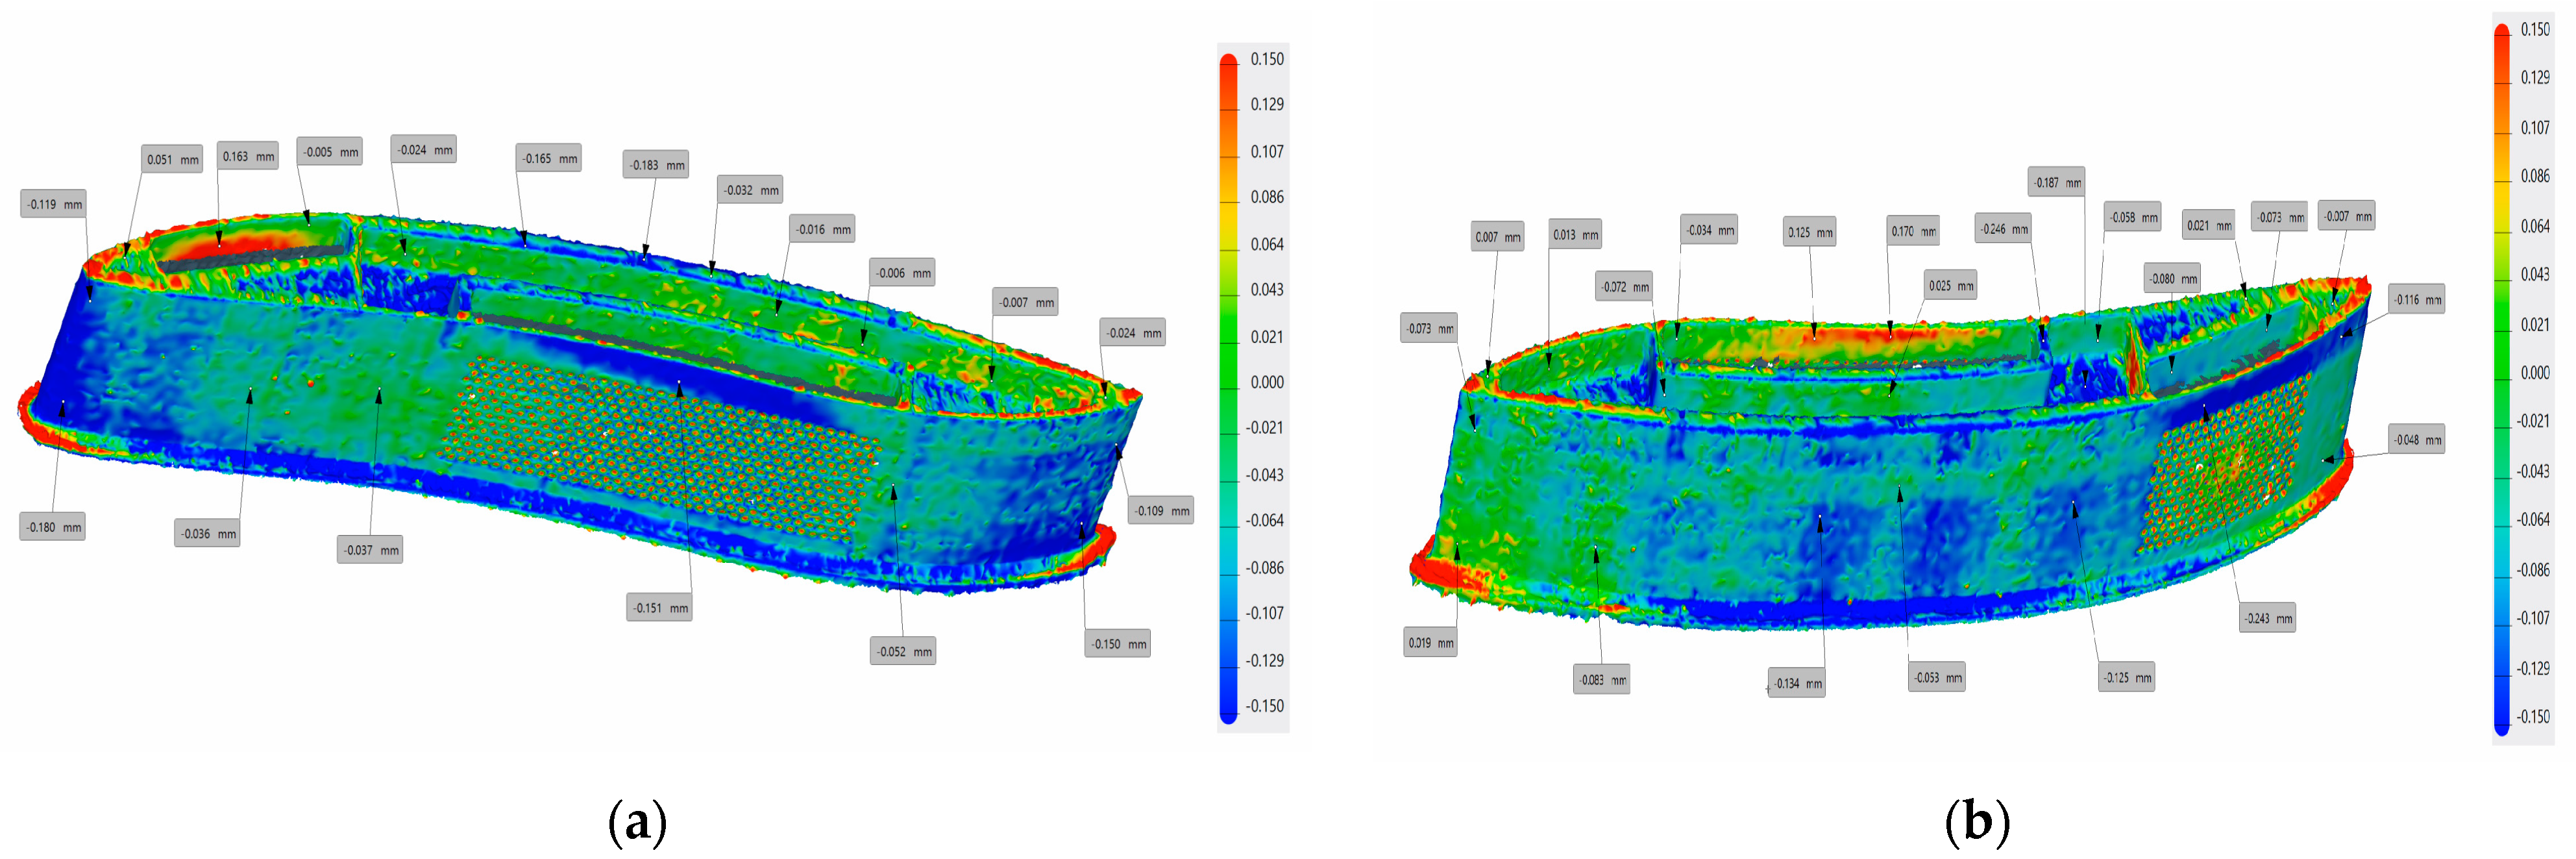
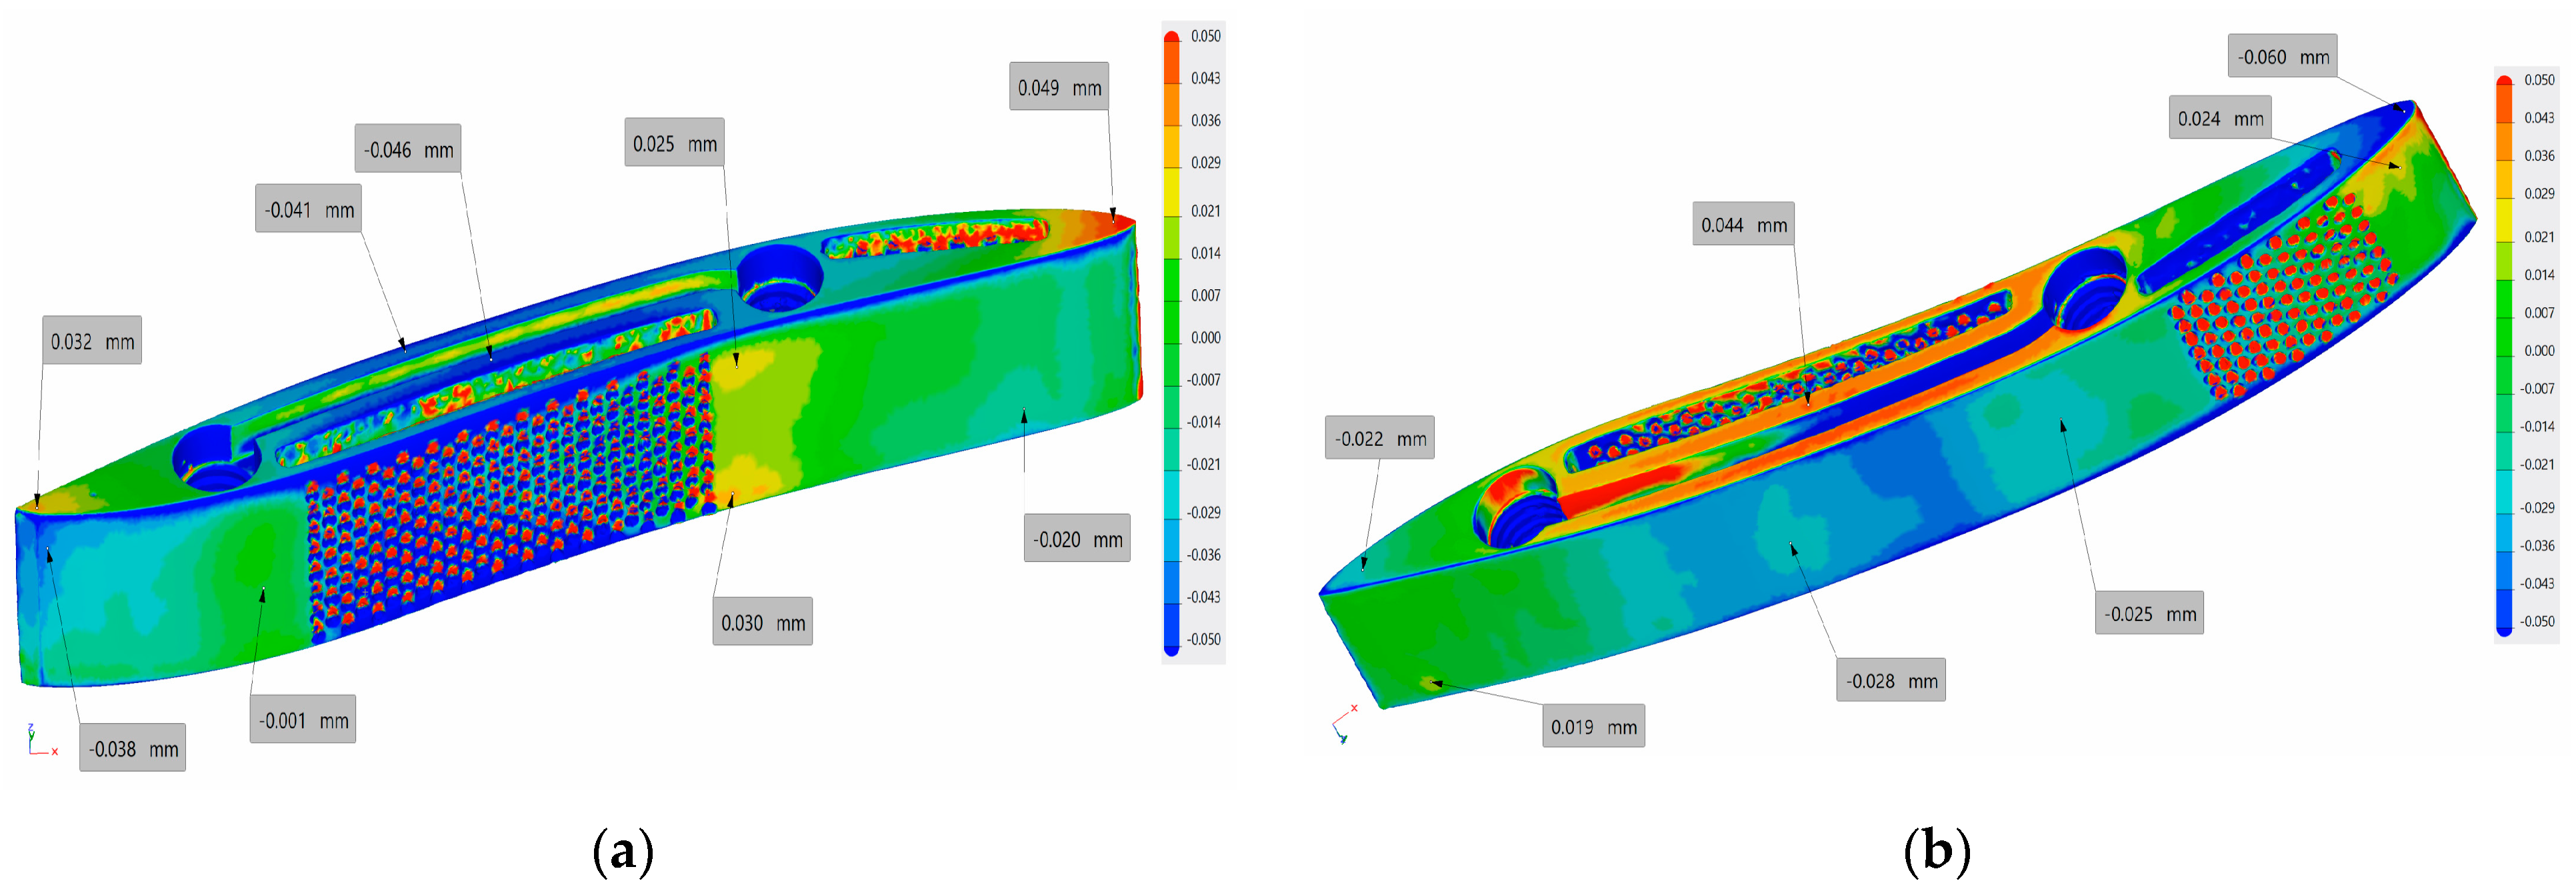
Figure 15 and Figure 16 present a detailed surface roughness analysis of the main blade after mechanical processing, comparing the blade configurations with and without perforations. This analysis involved measuring various geometric parameters of the manufactured blades and comparing them against the 3D model specifications. The results indicate that the manufactured-blade geometry was consistent with the design requirements, with an average dimensional deviation of ±0.04 mm from the 3D CAD model. This level of accuracy demonstrates that the mechanical processing methods employed were effective at achieving the desired blade specifications. The analysis confirmed that the blade configurations, both perforated and non-perforated, were consistent with the design dimensions, validating the precision of the fabrication process. The findings also highlight the success of the manufacturing techniques employed, ensuring that the blades met the performance criteria for the experimental setup.
The dimensions of the porous areas were determined based on the CFD analysis and are presented in Table 3. The following details describe the constructive solution of the cavities:
  • On the main vane, two areas with porous walls were implemented: one near the leading edge on the suction side with a depth of 2 mm and a length of 12 mm, and another on the pressure side with the same depth but a length of 27 mm. The grid configurations are 8 × 7 holes for the leading edge and 13 × 8 holes for the pressure side;
  • On the secondary vane, two porous areas with a depth of 2 mm, a length of 22 mm, and a grid of 11 × 8 holes were positioned in the middle of the vane.
While the holes in the design were specified with a diameter of 0.75 mm, the actual diameter measured after 3D printing was 0.5 mm. This reduction in the hole size was a result of the shrinkage that typically occurs during the 3D printing process.
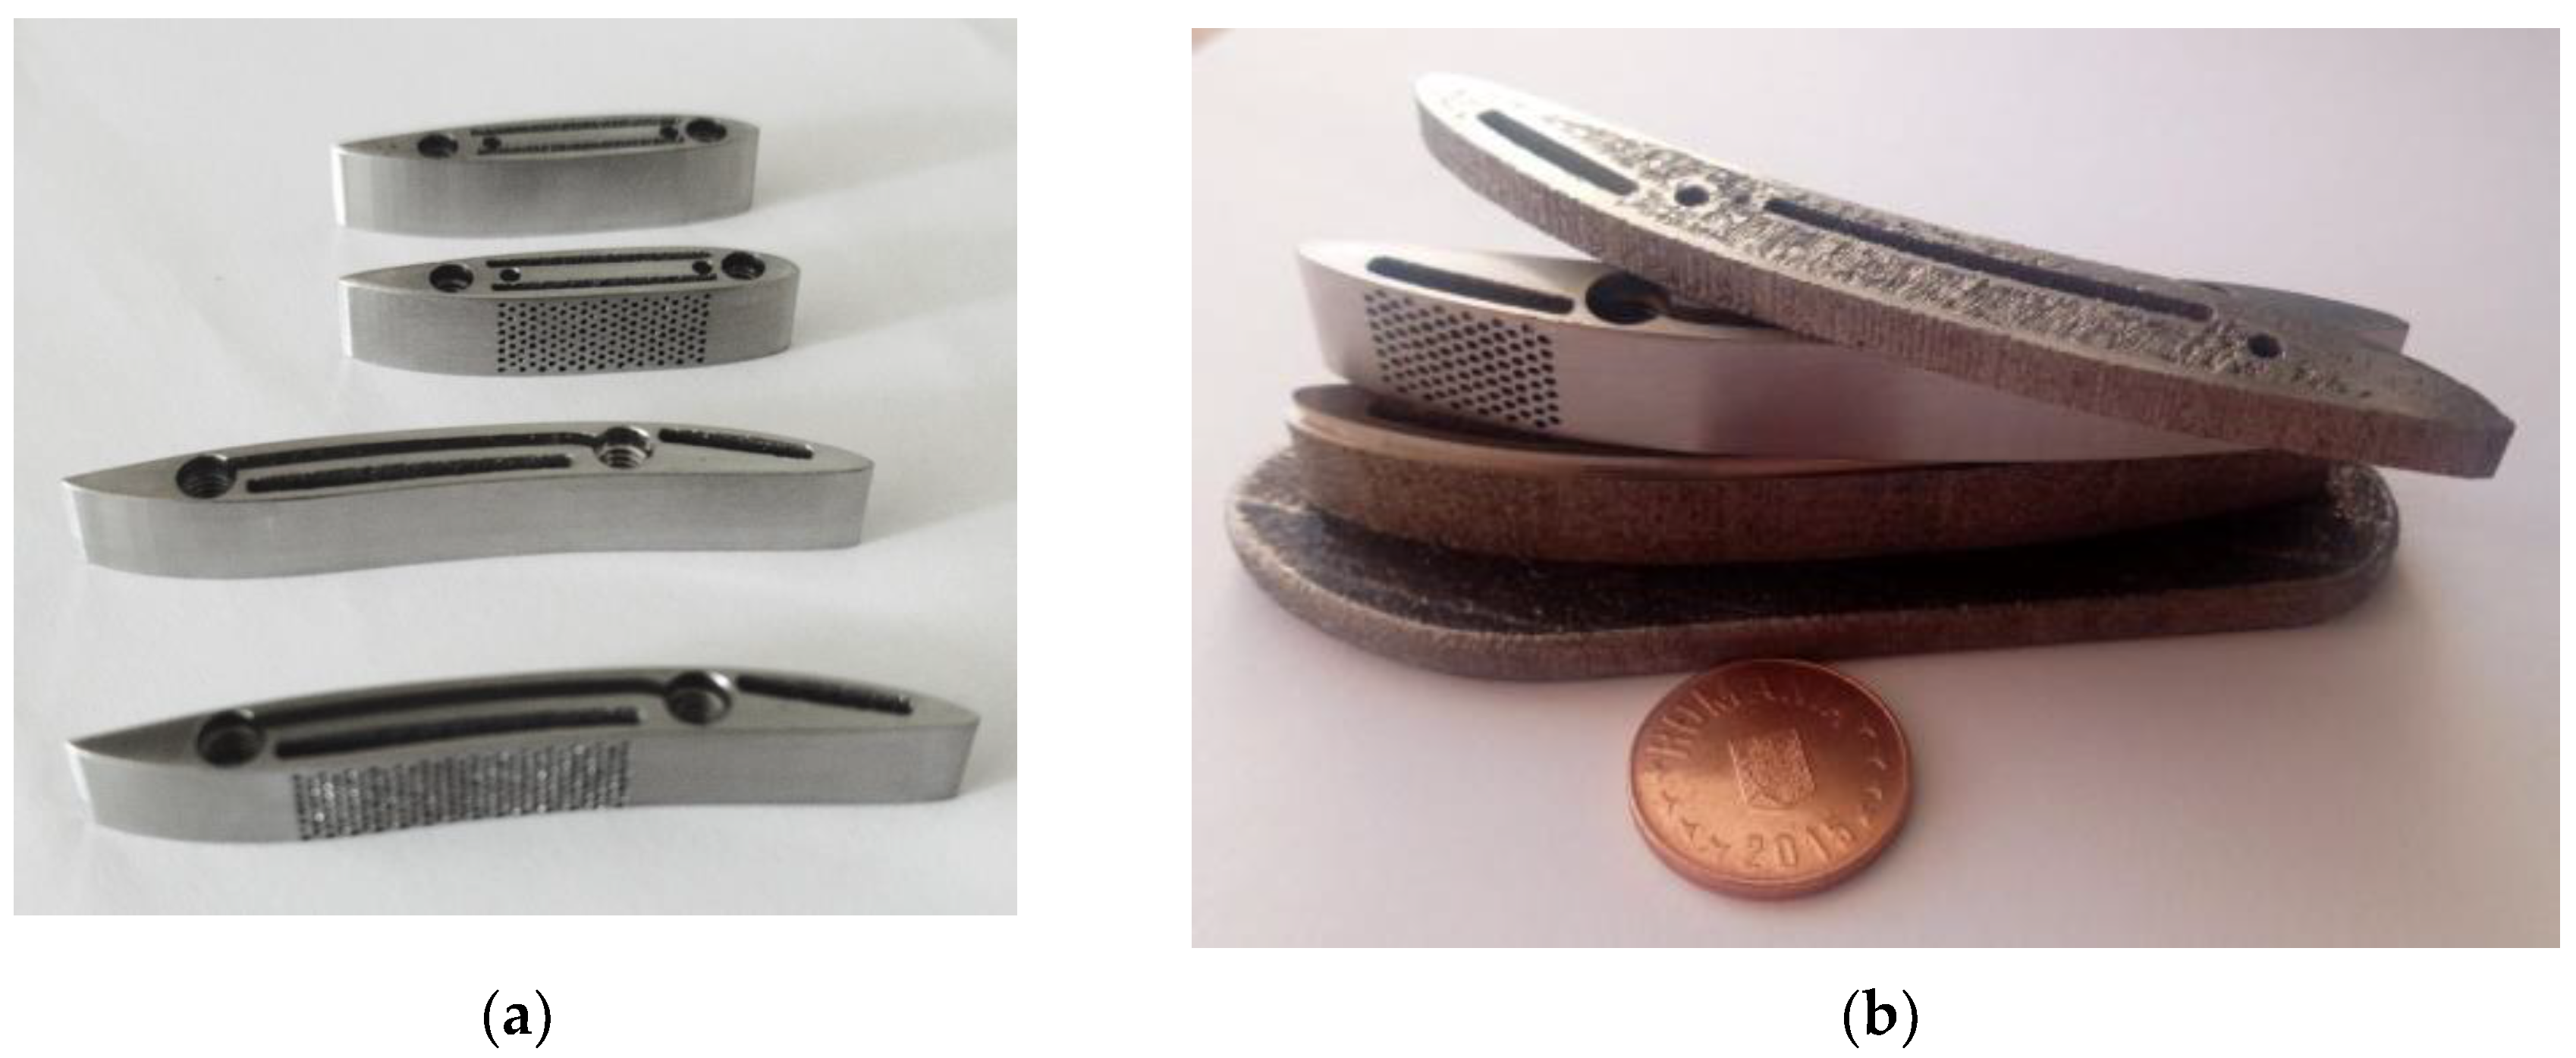
Figure 17 illustrates the four types of vanes used in the experimental setup: the main and secondary vanes, with and without porous-wall configurations. The figure presents the final shape of each vane type and highlights the specific areas where the porous walls are implemented.

2.3. Computational Setup of the Linear Cascade

Numerical analyses for the linear cascade were conducted using Ansys CFX, an implicit pressure-based solver. To accurately capture shock waves and solve the advection equation and turbulence model equations, high-order numerical schemes are required. The k-ω SST (Shear Stress Transport) turbulence model, widely used in turbomachinery flow simulations, was chosen for its ability to provide accurate performance predictions across various operating conditions [45,46]. This two-equation model uses bending functions to combine the k-epsilon model in the far field with the k-omega model near the walls. In this study, the precise resolution of the flow structure both near the blade walls and in the far field was crucial for understanding the shock wave behavior.
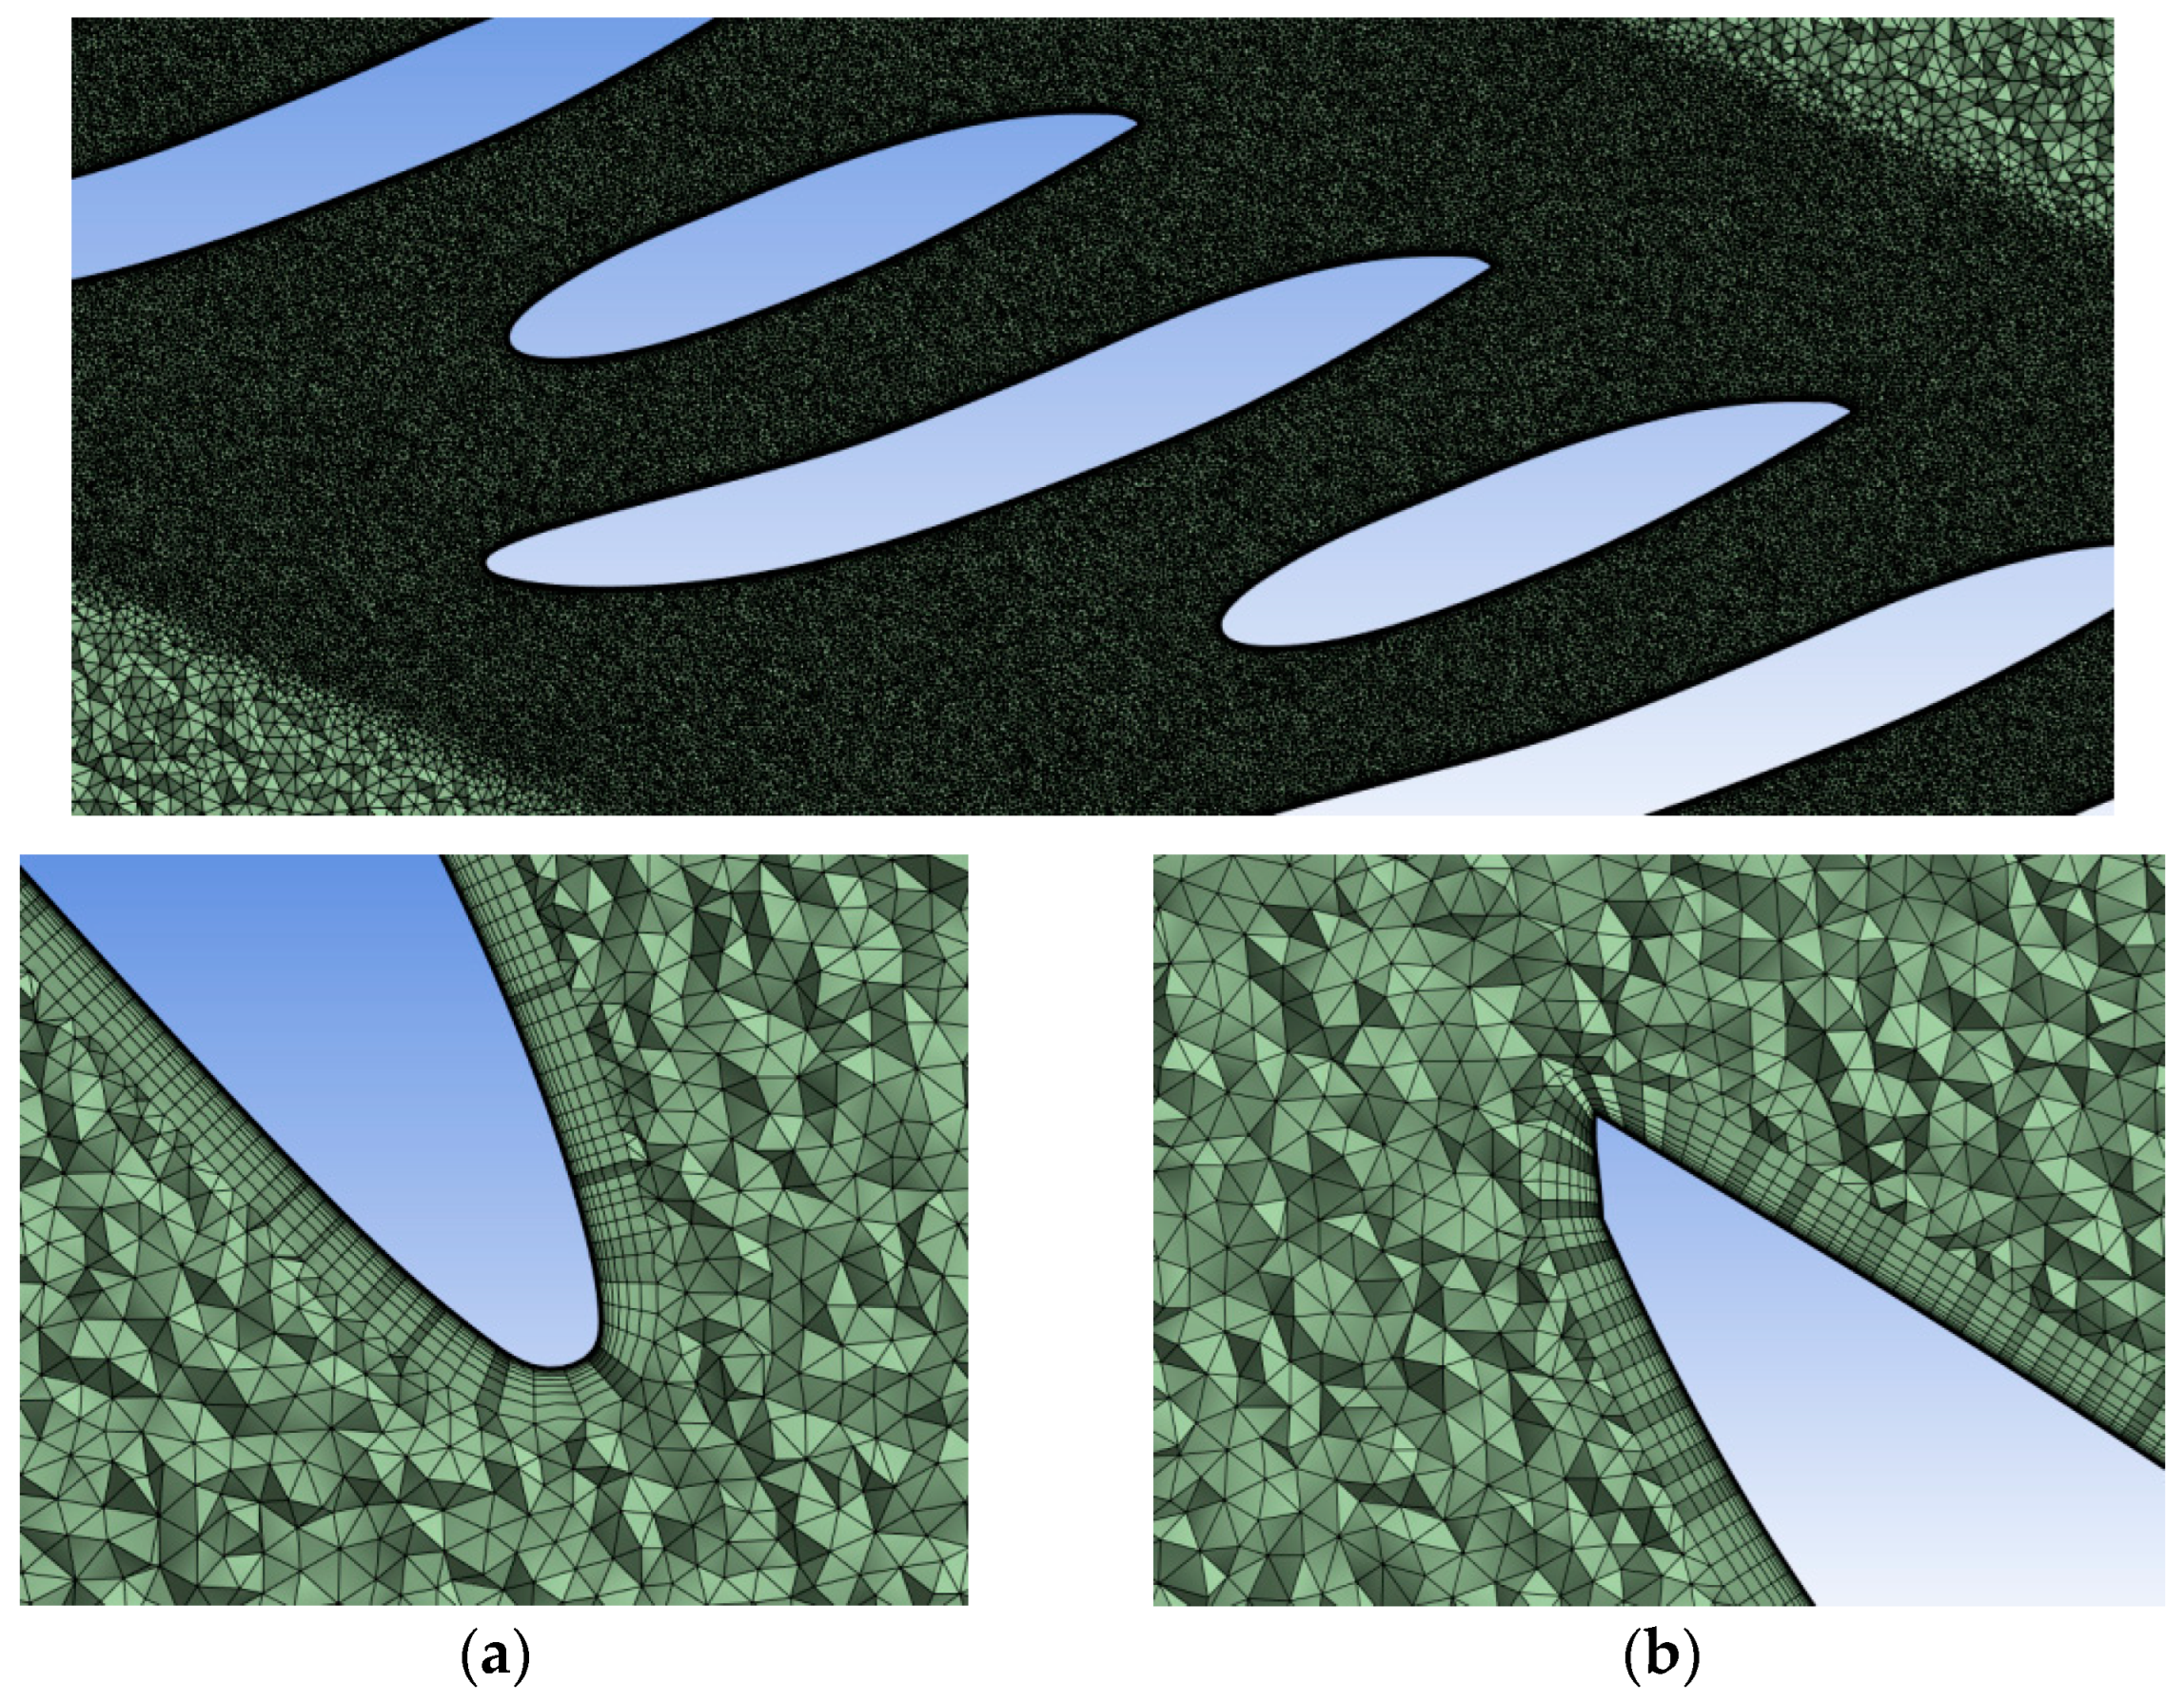
The computational grid, generated in Ansys Meshing, is unstructured and features local refinements both in the test area and around the vanes. To ensure a precise solution capable of capturing the shock structures, a grid independence study was performed across the entire cascade. Seven different grid resolutions were evaluated, ranging from coarse to highly refined meshes. All grids consisted of unstructured tetrahedral cells with low skewness to enhance the accuracy. The coarse grids (17, 26.5, and 30 million cells) were refined around the airfoils and in the wake region to achieve a y+ value close to 1. Grid variations were introduced by adjusting the number of layers in the radial and axial directions and modifying the overall geometry sizing.
For the finer grids (36, 42, 50, and 60 million cells), additional refinement was applied in the blade test area, increasing the mesh density and ensuring a more accurate representation of the shock wave structures. Additionally, for the finer grids, the number of layers in the inflation region was also increased to improve the boundary layer definition. The transition from the denser grid to the far field was executed gradually to avoid abrupt changes between adjacent cells.
Figure 18 presents the mesh convergence study, with the total pressure drop used as the metric to evaluate the grid density. The study revealed that beyond 42 million cells, further refinement had a minimal impact on the solution. However, to be sure a broader range of flow structures was captured in the shock wave region, the 50-million-cell grid resolution was chosen.
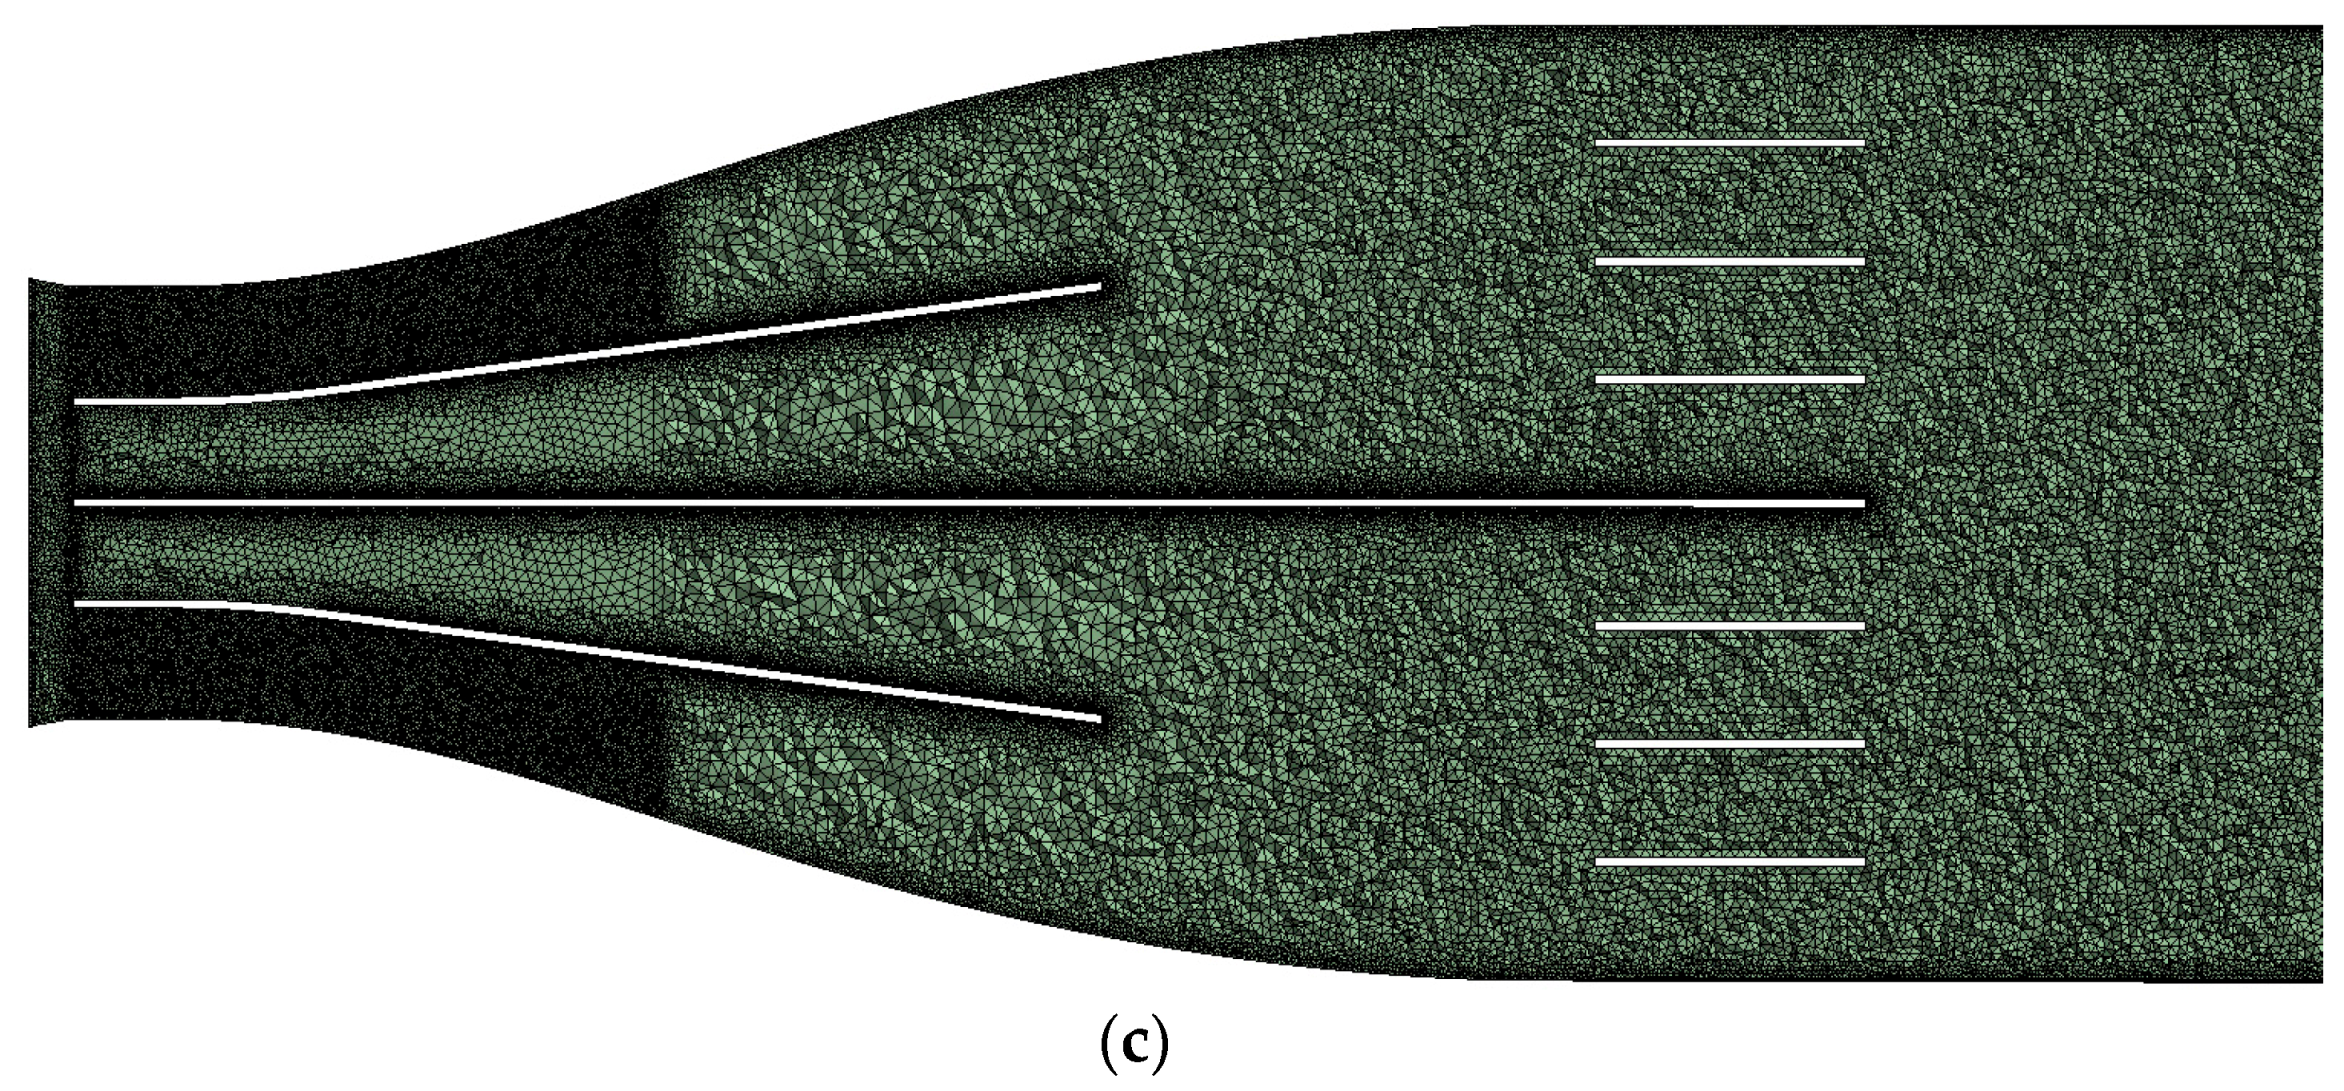
Figure 19a,b depict the computational grid of a working channel, highlighting the mesh refinement in the leading and trailing edge regions corresponding to the boundary layer area, while Figure 19c provides a detailed view of the grid corresponding to the adapter.
Figure 20 illustrates the distribution of the y+ on the blades, with a maximum value below 1.5 near the leading edge. The grid size for this case consists of approximately 50 million nodes.
Since the static pressure probe is positioned before the adapter that connects the air pipe to the linear cascade, the numerical domain also includes the adapter due to the unknown pressure loss it may introduce.
The numerical results presented in this paper correspond to a single operating point, with the following conditions: at the input boundary, the total pressure is 1.87 bar, and the total temperature is 294 K; at the output boundary, the atmospheric pressure is 1.01150 bar, reflecting the pressure on the day of the experimental campaign. The sidewalls, bottom, and top of the model, as well as the vanes, were modeled as adiabatic walls without roughness.
The convergence decision for stopping the simulations was rigorous. Specifically, the criteria included the maintenance of the imbalances in the mass, momentum, and energy for each component below an imposed threshold of 10−3. Additionally, residuals were monitored to ensure they dropped below a predefined threshold (for mass, momentum, and energy below 10−5). Finally, the balance between the mass flow rates at the inlet and outlet boundaries was checked to confirm consistent and stable simulation results.

3. Results

3.1. Numerical Analysis of the Linear Cascade

The main results obtained are illustrated in Figure 21, Figure 22 and Figure 23, which highlight the position and intensity of the shock waves in the channel for each individual channel. The designed cascade is asymmetric, with each channel operating at a slightly different flow rate. This design allows for the simultaneous study of different shock wave intensities and structures under identical incidence conditions, similar to sweeping along the optimal working line of a compressor at different speeds.
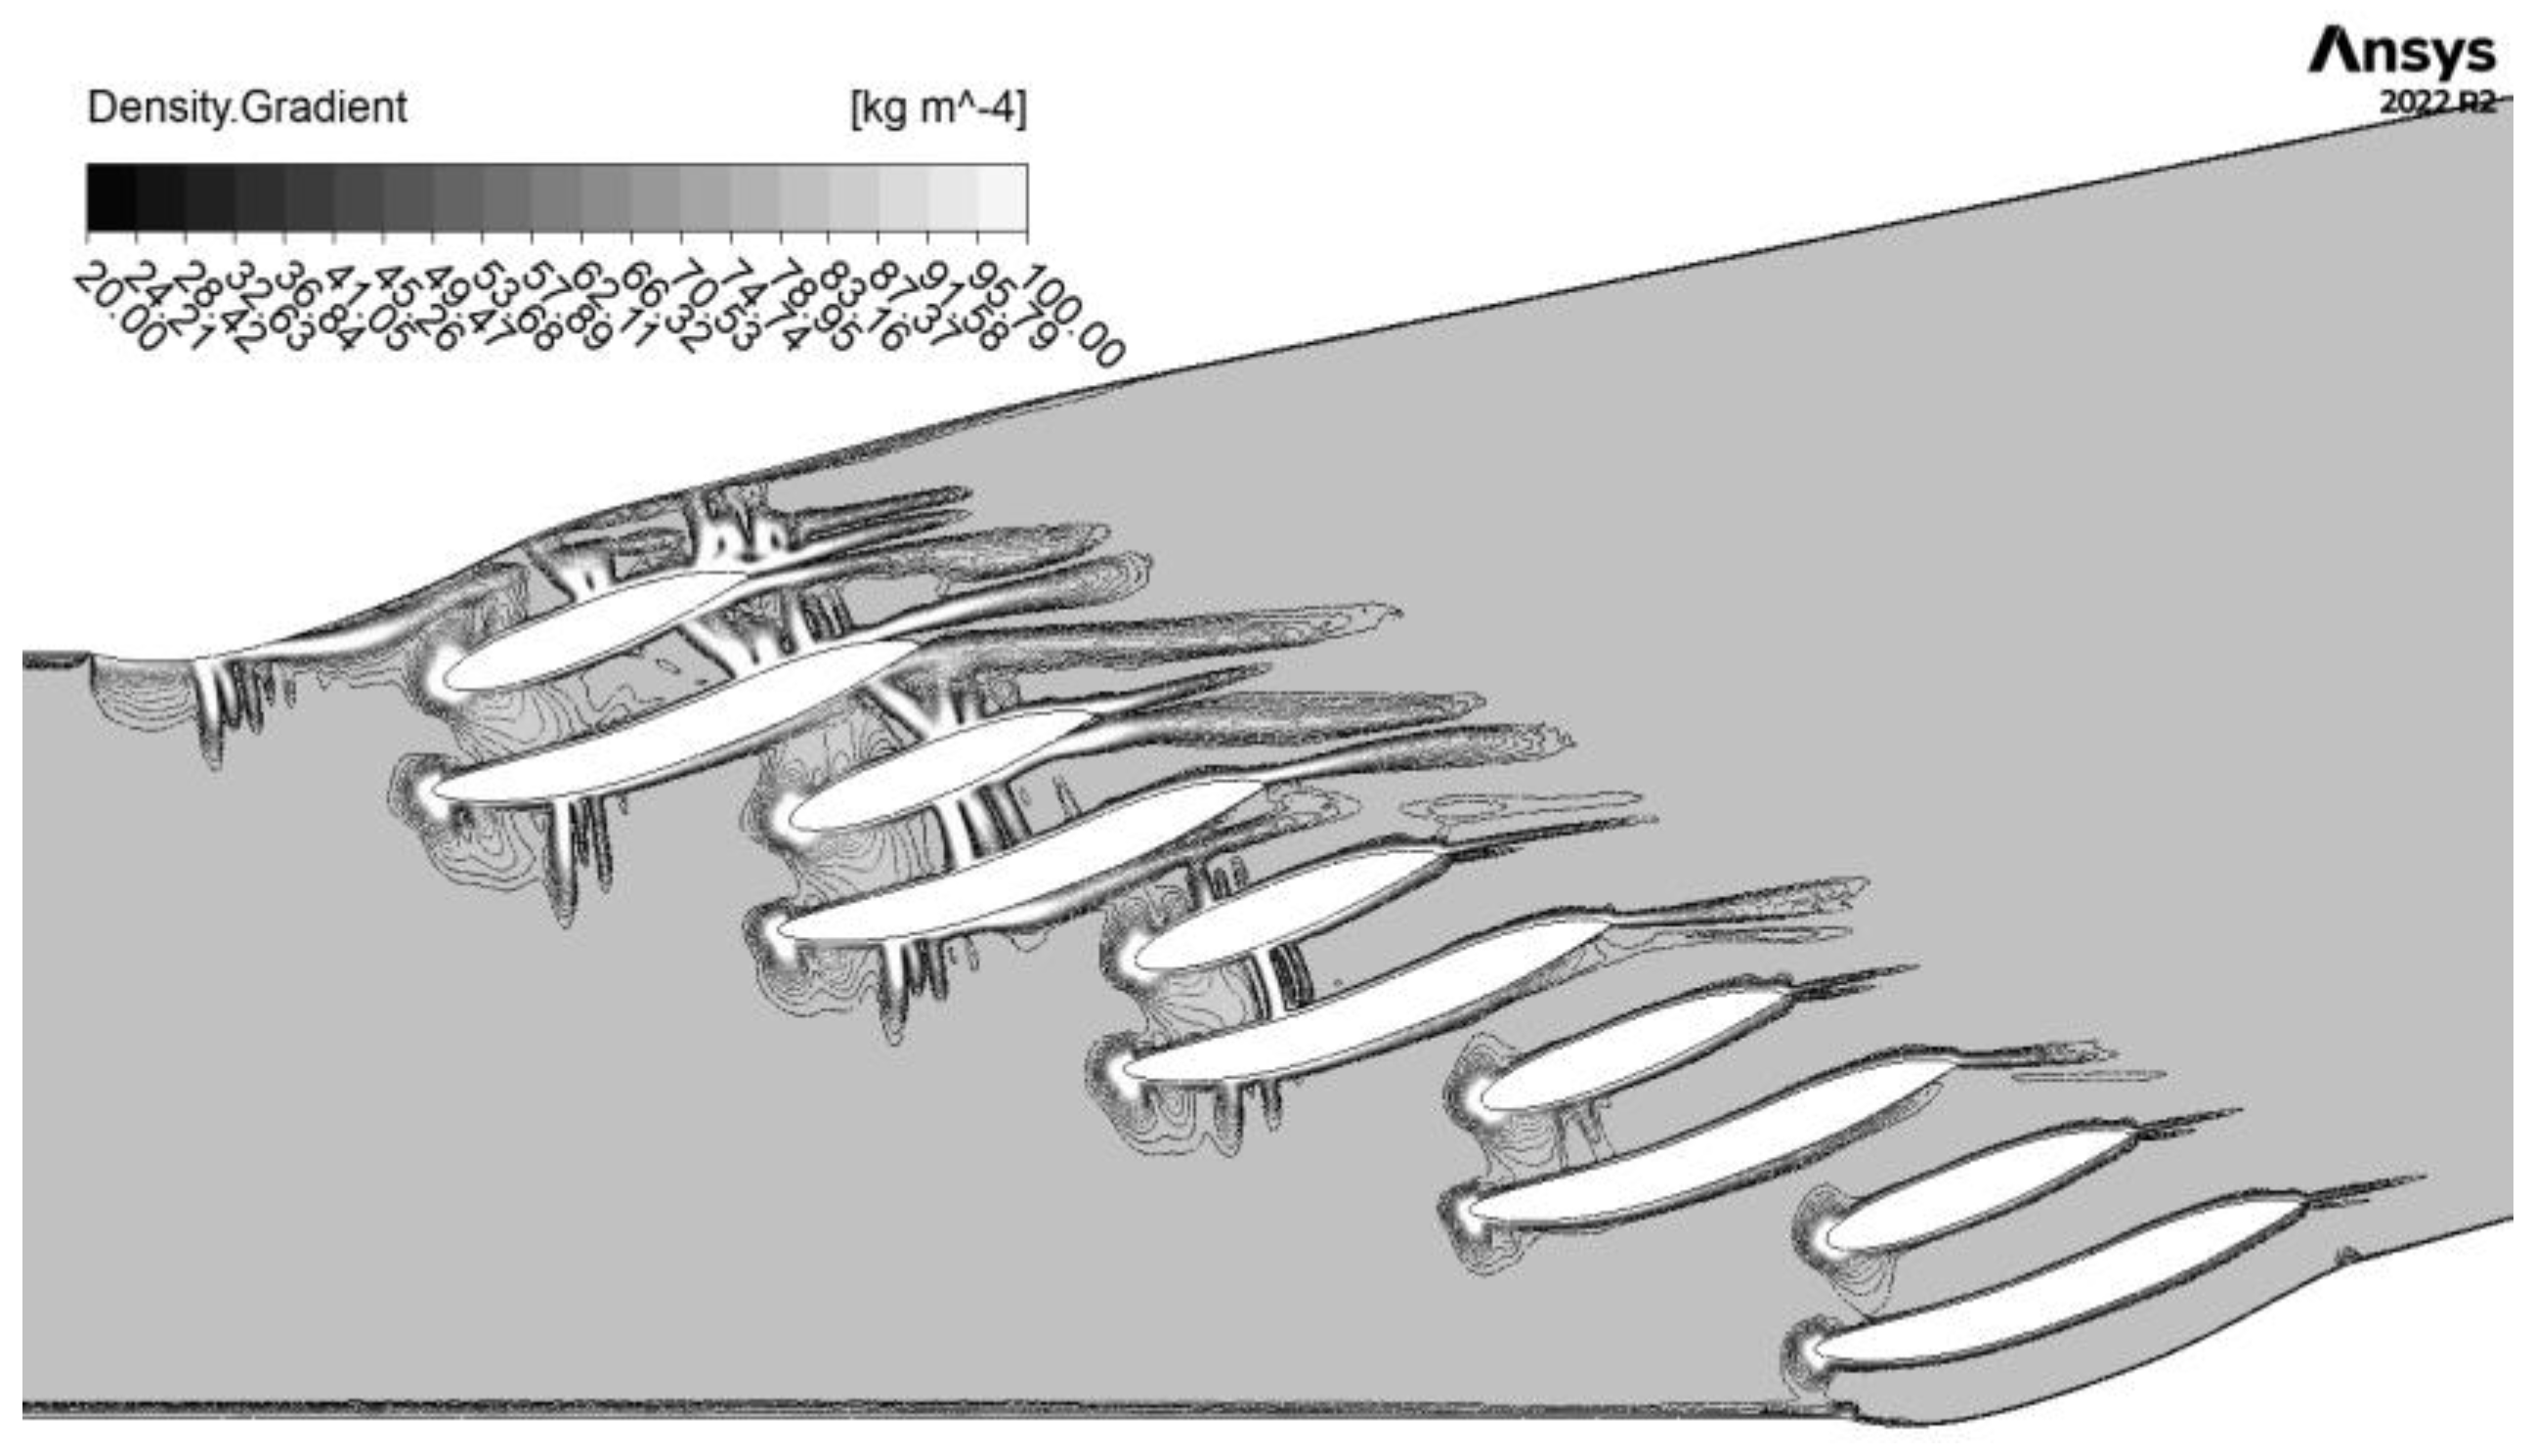
Figure 21a shows the static pressure distribution in a median plane. Areas of low static pressure indicate strong acceleration due to the channel shape followed by the presence of shock waves within the working channel. This observation is corroborated by the density gradient distribution shown in Figure 22. Due to the presence of shock waves, the mass-averaged total pressure losses are approximately 0.39508 bar, with the most affected area being the upper part of the cascade, where the wave intensity is higher.
These detailed results underscore the significant impact of shock waves on the pressure distribution and highlight the varying effects across different channels due to the asymmetric design.
In Figure 22, it is observed that the intensity of the shock waves is much more pronounced in the first three channels but decreases as the flow through the channel decreases, as seen in channel #5. In the first three channels, the shock waves are both the normal and “lambda” types, developing on both the leading edge of the main vane and the profile of the secondary vane. The wave structure in channel #1 indicates near-blocking operating conditions, but the absence of a negative incidence angle, typically associated with blocking, suggests that these points could be the nominal points of a high-speed operating line.
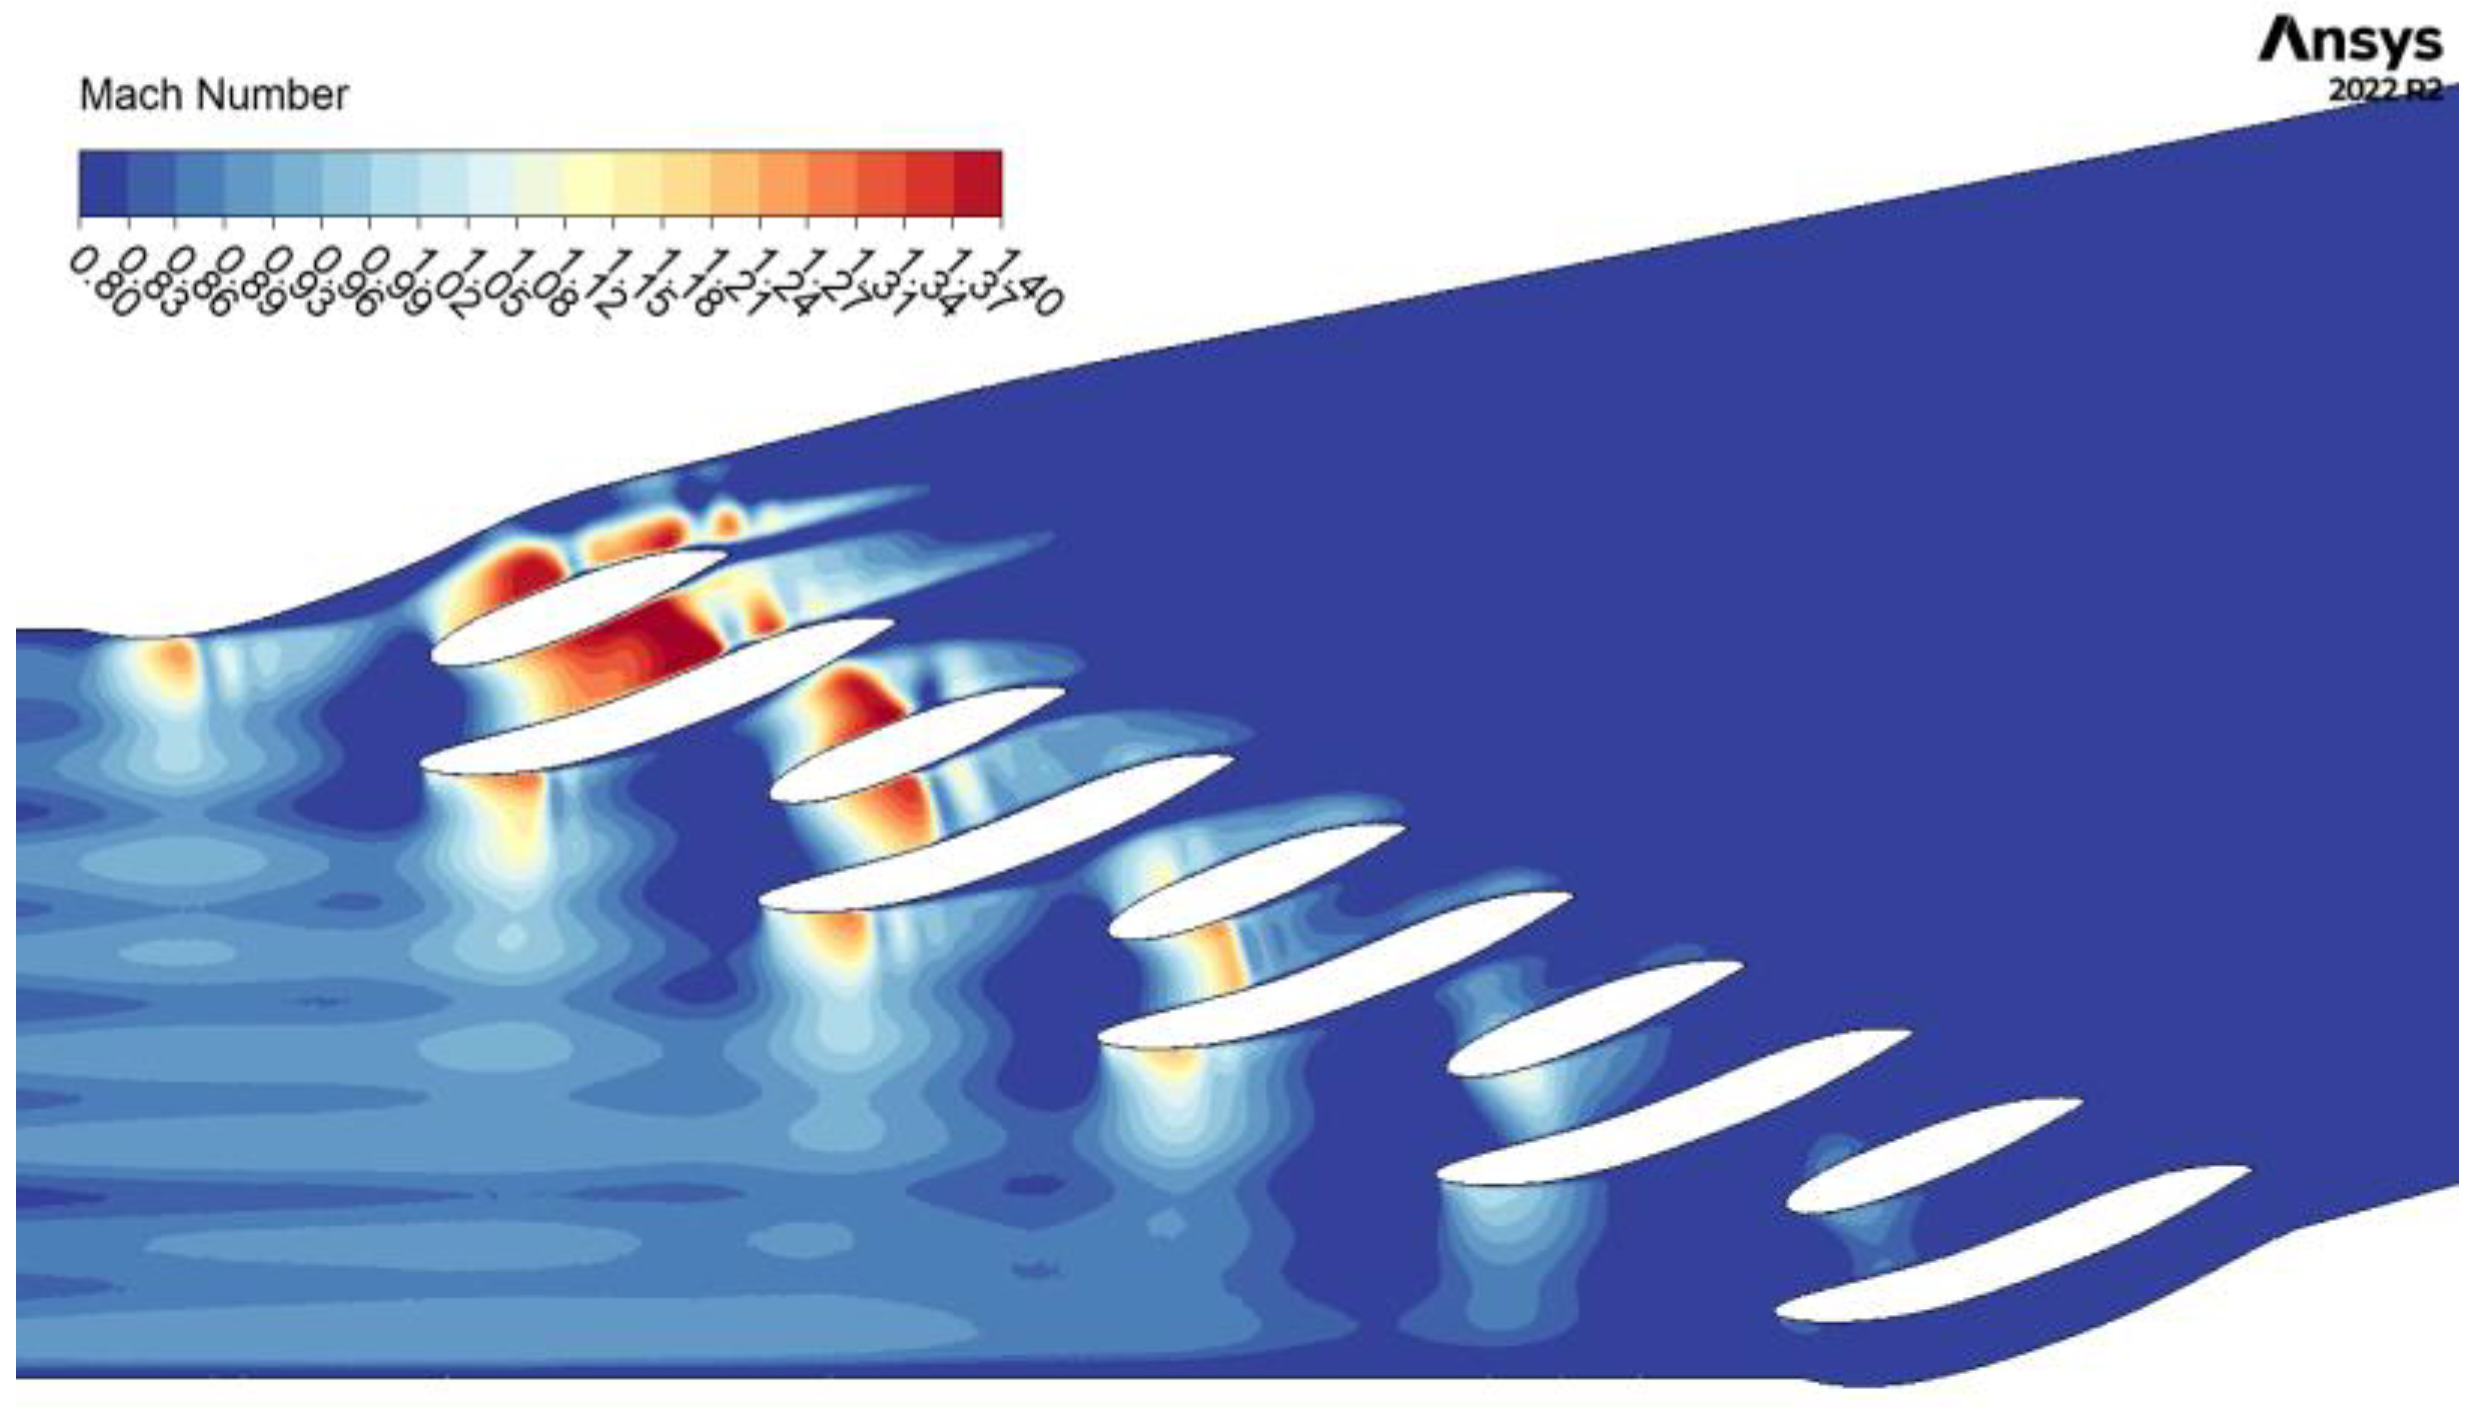
The Mach number distribution in the vane flow channel is highlighted in Figure 23. Zones of local acceleration are observed on the leading edge of the main vane and at the middle of the secondary vane. These acceleration regions lead to varying intensities of shock wave structures, ranging from strong structures near the first channel to weaker ones in channel #5.
Differences between the CFD and experimental analyses can also be observed in the distribution of the density gradient. Although the numerical analysis managed to capture the position and intensity of the shock waves at the macrolevel, certain flow structures were not captured numerically. This discrepancy indicates that while CFD provides a good overall representation, some finer details of the flow behavior, especially those influenced by complex turbulence and boundary layer interactions, might be missed in the simulation.

3.2. Installation Commissioning and Testing

The initial tests were conducted to calibrate the pressure regulator and the installation, ensuring the required fluid pressure at the inlet and verifying the system’s tightness. The air source for the tests was an oil-injected screw air compressor. Although the oil residue content in the compressed air was low, its presence could still be observed on the model walls, as indicated by the traces in the current line model.
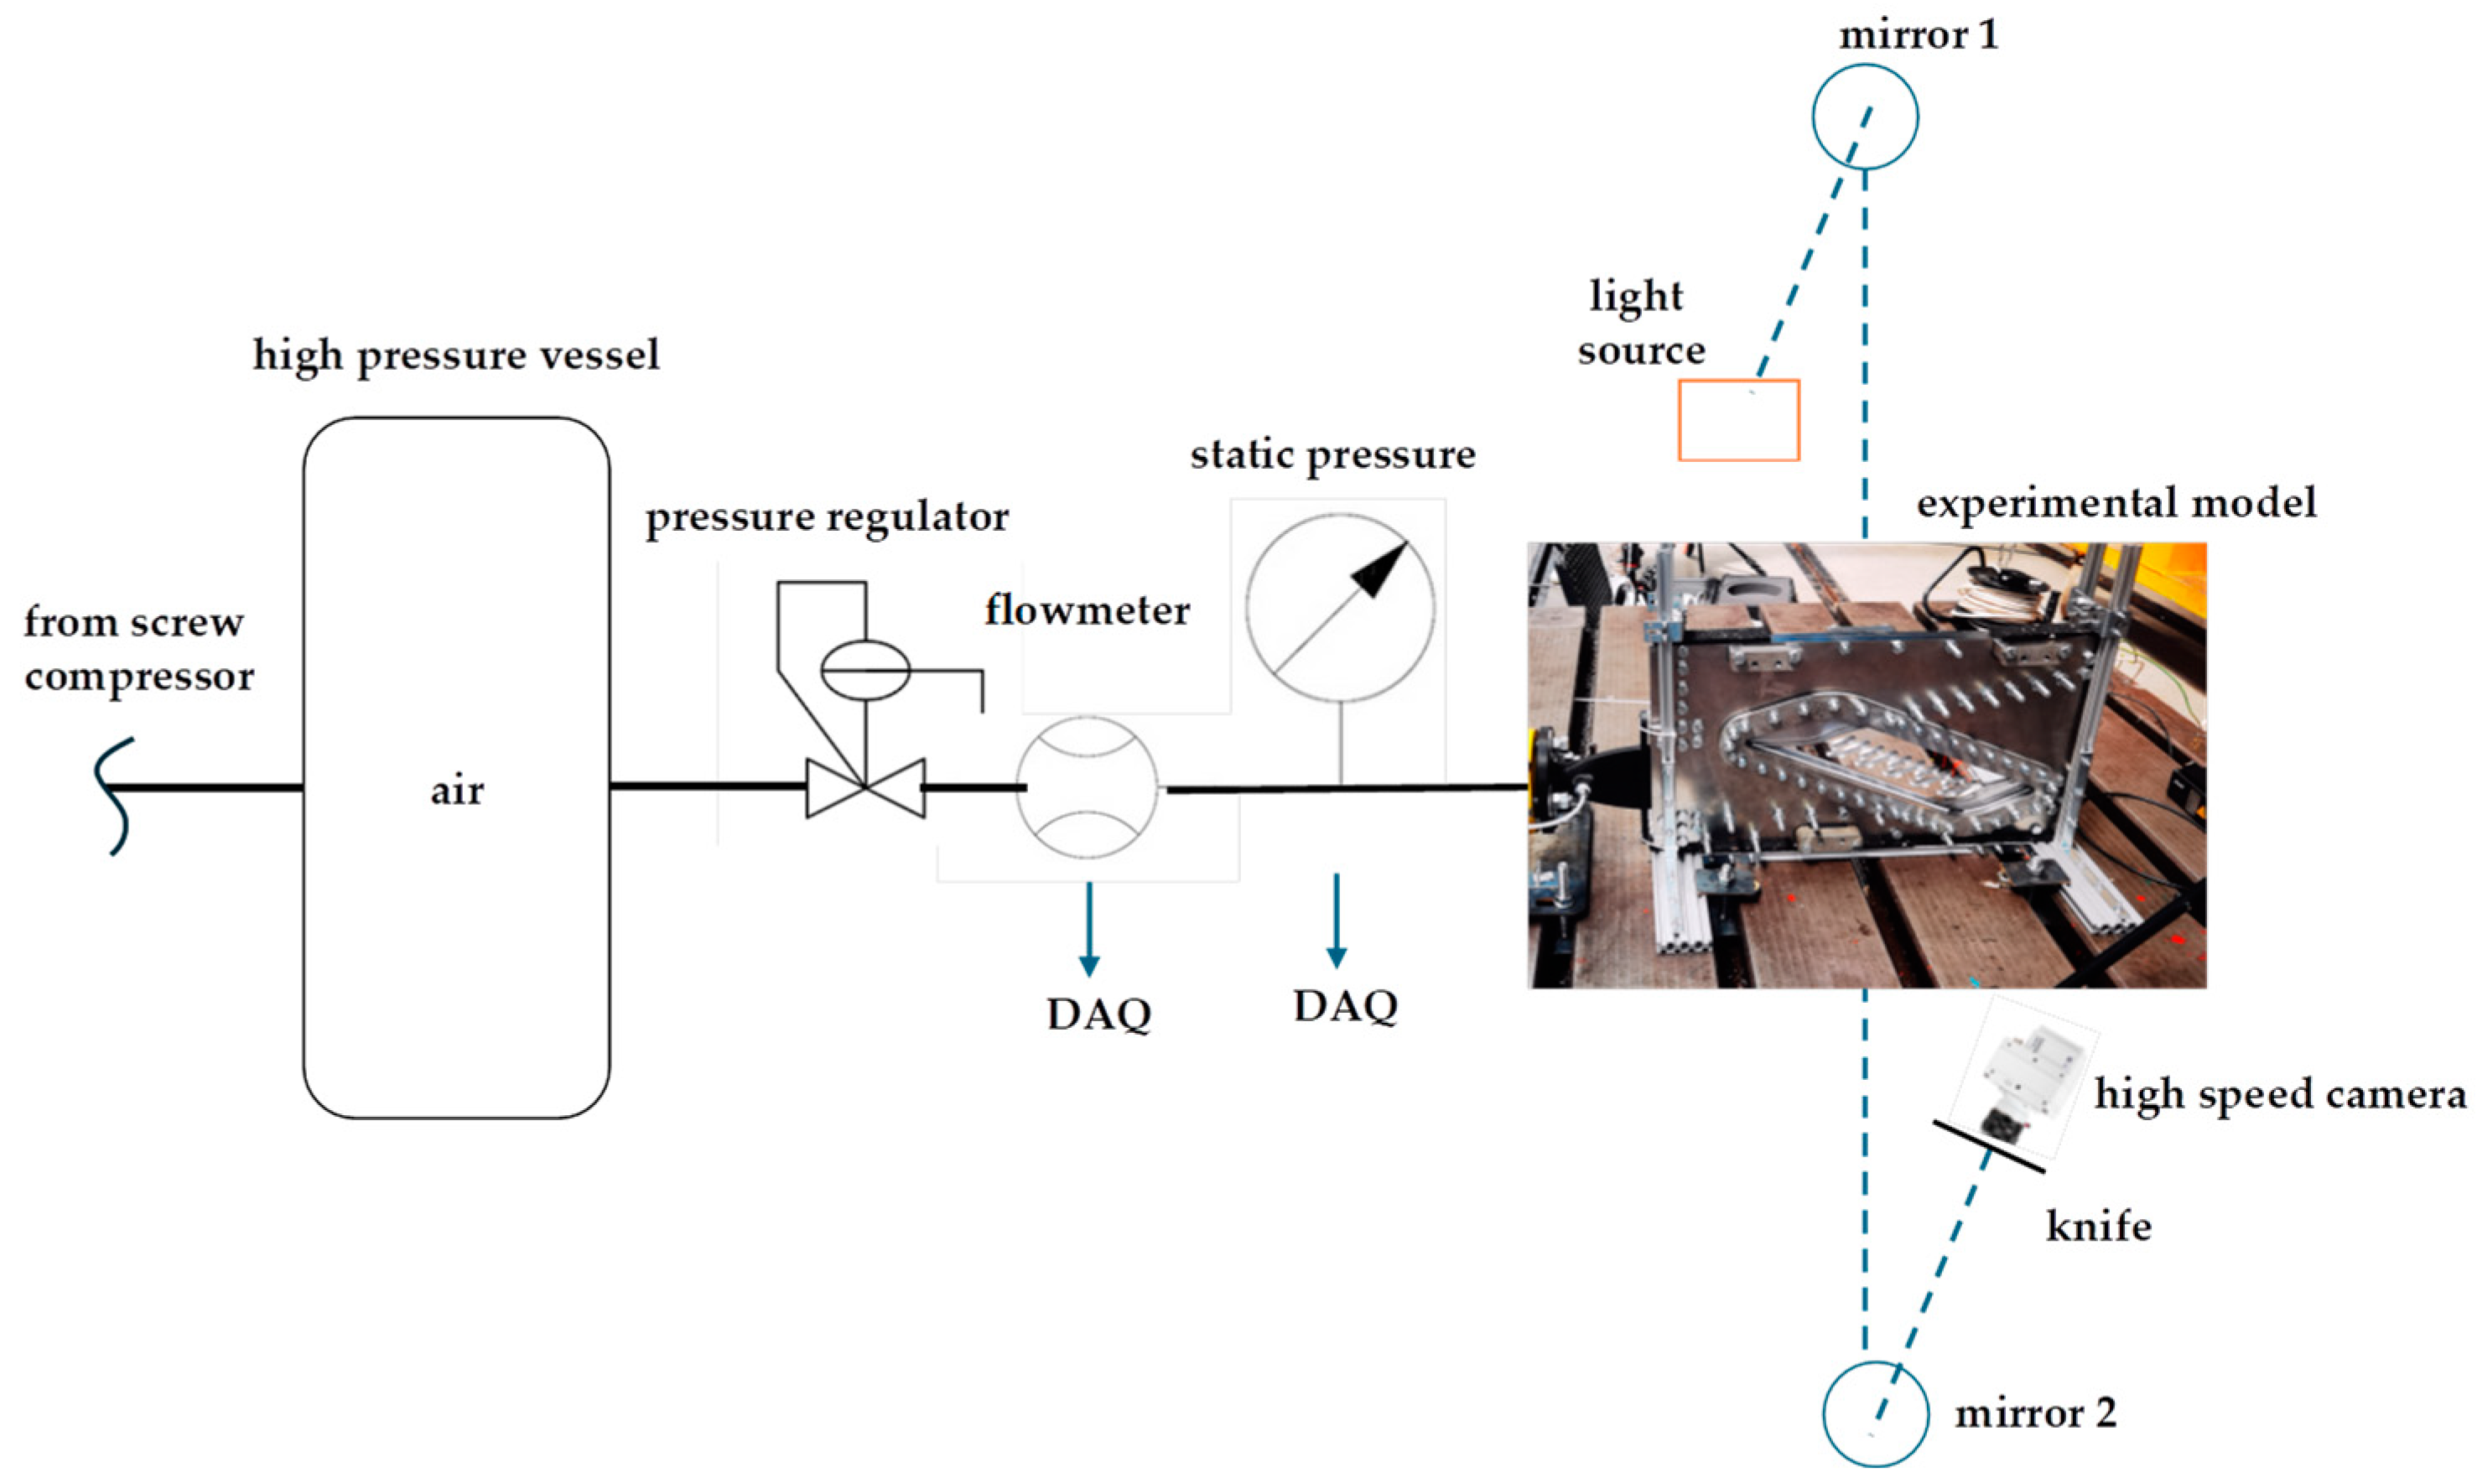
The PID diagram of the experimental rig is depicted in Figure 24 starting from the air source (screw compressor) down to the experimental model. To visualize the appearance of shock waves, the Schlieren visualization technique was employed. This optical method, when combined with a high-speed camera, provides a means to observe the fluid flow and capture the resulting phenomena with high temporal and spatial resolution. The Z-type Schlieren configuration, shown in Figure 24, was carefully aligned to visualize the fluid flow around the airfoils situated in the optical access area of the linear cascade.
The Z-type configuration uses a light source and a series of optical components (two parabolic mirrors and a knife for light cutoff) to create a visual representation of the density gradients in the flow field, which are indicative of shock waves and other flow features. Details of the Schlieren equipment and its setup can be found in [47], which provides a comprehensive overview of the components and calibration procedures used for this technique.
Schlieren visualization was selected over Particle Image Velocimetry (PIV) primarily due to its cost-effectiveness and versatility, and also because of the nature of the phenomenon under investigation. In this case, very weak shock waves are expected to result from the breakdown of the shock wave due to the porous material, making Schlieren visualization ideal. Additionally, it still allows for velocimetry using a variation of the background-oriented Schlieren technique [48,49]
Figure 25, Figure 26 and Figure 27 display the flow characteristics for three different operating regimes, with relative inlet static pressures of 0.7-bar gauge (absolute pressure of 1.7 bar), 0.8-bar gauge (absolute pressure of 1.8 bar), and 0.9-bar gauge (absolute pressure of 1.9 bar), all at a constant inlet temperature of 21 °C. These varying working conditions resulted in different shock wave intensities and positions within the working channel, as demonstrated in the figures. This variation in the boundary conditions justifies the use of different types and values, as this ensures a comprehensive understanding of how changes in the inlet pressure can significantly alter the shock wave dynamics, leading to more accurate and reliable performance predictions.
In the Schlieren images, high pressure and density values are highlighted in white tones, while low pressure and density values are represented in darker-gray tones. The Schlieren images reveal the presence of both normal shock waves and lambda-type shock waves in the channels. These shock waves are observed on the main blade and near the trailing edge, rather than on the secondary blade. The development of these shock waves is influenced by several factors, including the operating regime, which imposes boundary conditions for supersonic flow, the geometry of the stator, and the asymmetric nature of the network. The asymmetric network introduces local variations in the fluid flow around each vane, resulting in a linearly decreasing flow rate from the first to the last channel studied.
In Figure 25, it is shown that under the initial conditions, shock waves are primarily confined to the first two channels. As the flow rate increases, shock waves become evident in all working channels, as demonstrated in Figure 26 and Figure 27. This progression illustrates how higher flow rates lead to the development of shock waves across the entire range of channels.
The introduction of vanes with porous walls allows for the observation of several effects related to shock wave behavior. Specifically, these vanes reduce the intensity of the shock waves and facilitate their dissipation. Additionally, the use of porous walls leads to the formation of lambda-type shock waves where normal shock waves were previously observed. This change results from the altered boundary conditions and flow characteristics introduced by the porosity. For a detailed description of the behavior of airfoils with porous walls, one may consider reading [50].

4. Conclusions

This study provides significant insights into the shock wave behavior within a transonic linear cascade, emphasizing the impact of the operating conditions and the critical role of precise blade manufacturing. Several innovative features were integrated into the current rig, covering the full process from fabrication to final assembly:
  • Blade manufacturing—The blades were produced using a combination of additive manufacturing, electroerosion, and CNC milling, with each method compensating for the limitations of the others. The size, number, placement, and orientation of the holes required for each blade would have been prohibitively expensive using traditional drilling methods. Furthermore, the material, a nickel-based superalloy (Inconel), posed challenges due to its hardness, which would have significantly increased the cost of drilling and milling. Choosing this material enhances the relevance of the design for the aviation industry, as Inconel is commonly used in turbine blades. Blade alignment within the blade row was achieved using two Teflon bolts, which gently pressed the blades against the quartz window, reducing vibration. A control curve etched into the periphery of the window provided a means of visually monitoring the blade alignment while also functioning as a miniature plenum chamber, aiding the air seal between the two parts;
  • Test rig design and fabrication—The rig posed several engineering challenges, such as ensuring that the blades are both removable and air-tight, while consistently placed in the same position. Furthermore, blade mounting was constrained to the perimeter to avoid obstructing visualization. To ensure air tightness, the contact surfaces were machined with high precision and aligned in the same plane. Additionally, the top visualization window was allowed some spanwise play to ensure contact with the blade tips;
  • While the numerical simulations using Ansys CFX with an implicit pressure-based solver and high-order numerical schemes provided a broadly accurate representation of the shock wave characteristics, there were some limitations. The simulations captured the macrolevel shock wave positions and intensities effectively but missed some finer flow structures observed in the experimental data. This indicates the need for the further refinement of the numerical models to fully capture all the detailed flow phenomena;
  • The shock wave intensity and position are highly sensitive to changes in the inlet pressure. Higher inlet pressures result in stronger and more extensive shock waves across the cascade channels. Specifically, relative inlet pressures of 0.7-bar gauge, 0.8-bar gauge, and 0.9-bar gauge at an inlet temperature of 21 °C demonstrated varying shock wave characteristics, with the most pronounced effects observed at the highest pressure.
These insights are essential for the design and optimization of aerodynamic components in turbomachinery applications.

Author Contributions

Conceptualization, V.D., O.D. and M.G.; methodology, V.D., O.D., M.G., A.P. and M.R.C.; software, V.D., O.D., M.G., E.G.P., V.P. and M.V.; validation, V.D., O.D. and M.G.; formal analysis, V.D., O.D., M.G. and E.G.P.; investigation, V.D., O.D., M.G., E.G.P. and V.P.; resources, A.P., M.R.C. and M.V.; data curation, O.D. and E.G.P.; writing—original draft preparation, O.D., V.D. and M.R.C.; writing—review and editing, M.G.; E.G.P. and A.P.; visualization, V.D. and O.D.; supervision, O.D.; project administration, O.D. All authors have read and agreed to the published version of the manuscript.

Funding

This research was supported by a grant of the Ministry of Research, Innovation and Digitization, CCCDI—UEFISCDI, project number PN-III-P2-2.1-PED-2021-4204, within PNCDI III and the project “Operating range augmentation system through porous walls for centrifugal compressors”, acronym SPACELESS, grant no. 717PED/2022.

Data Availability Statement

Data are contained within the article.

Acknowledgments

This work was carried out through “Nucleu” Program, part of the National Plan for Research, Development and Innovation 2022–2027, supported by the Romanian Ministry of Research, Innovation and Digitalization, Grant No. PN23.12.01.02.

Conflicts of Interest

The authors declare no conflicts of interest.

References

  1. Hergt, A.; Klinner, J.; Wellner, J.; Willert, C.; Grund, S.; Steinert, W.; Beversdorff, M. The Present Challenge of Transonic Compressor Blade Design. ASME. J. Turbomach. 2019, 141, 091004. [Google Scholar] [CrossRef]
  2. Gaitonde, D.V.; Adler, M.C. Dynamics of Three-Dimensional Shock-Wave/Boundary-Layer Interactions. Annu. Rev. Fluid Mech. 2023, 55, 291–321. [Google Scholar]
  3. Hou, W.T.; Qiao, W.Y.; Luo, H.L. Shock-Wave/Boundary-Layer Interaction in a Transonic Turbine Cascade. Proc. Inst. Mech. Eng. Part G J. Aerosp. Eng. 2011, 225, 77–85. [Google Scholar] [CrossRef]
  4. Ligrani, P.M.; McNabb, E.; Collopy, H.; Anderson, M.; Marko, S.M. Recent investigations of shock wave effects and interactions. Adv. Aerodyn. 2020, 2, 4. [Google Scholar] [CrossRef]
  5. Giannelis, N.F.; Vio, G.A.; Levinski, O. A review of recent developments in the understanding of transonic shock buffet. Prog. Aerosp. Sci. 2017, 92, 39–84. [Google Scholar] [CrossRef]
  6. Liu, B.; Shi, H.; Yu, X. A new method for rapid shock loss evaluation and reduction for the optimization design of a supersonic compressor cascade. Proc. IMechE Part G J. Aerosp. Eng. 2018, 232, 2458–2476. [Google Scholar]
  7. Wang, Z.; Chang, J.; Li, Y.; Kong, C. Investigation of shock wave control by suction in a supersonic cascade. Aerosp. Sci. Technol. 2021, 108, 106382. [Google Scholar] [CrossRef]
  8. Meng, F.; Tang, J.; Li, J.; Gong, C.; Guo, P. Variations of the shock and secondary flow structure in a transonic compressor cascade with outlet back pressure. Phys. Fluids 2024, 36, 066114. [Google Scholar] [CrossRef]
  9. Gad-el-Hak, M. Flow Control: Passive, Active, and Reactive Flow Management; Cambridge University Press: Cambridge, UK, 2009; ISBN 13978-0511529535. [Google Scholar] [CrossRef]
  10. Klinner, J.; Hergt, A.; Grund, S.; Willert, C.E. Experimental investigation of shock-induced separation and fow control in a transonic compressor cascade. Exp. Fluids 2019, 60, 96. [Google Scholar] [CrossRef]
  11. Šimurda, D.; Luxa, M.; Šafařík, P.; Synáč, J.; Rudas, B. Measurements on supersonic turbine cascades—Methodical approach. In Proceedings of the XXII Symposium on Measuring Techniques in Turbomachinery Transonic and Supersonic Flow in Cascades and Turbomachines, Lyon, France, 4–5 September 2014. [Google Scholar]
  12. Zhang, Z.; Wen, C.; Zhang, W.; Liu, Y.; Jiang, Z. A theoretical method for solving shock relations coupled with chemical equilibrium and its applications. Chin. J. Aeronaut. 2022, 35, 47–62. [Google Scholar] [CrossRef]
  13. Sabnis, K.; Babinsky, H. A review of three-dimensional shock wave–boundary-layer interactions. Prog. Aerosp. Sci. 2023, 143, 100953. [Google Scholar] [CrossRef]
  14. Okada, M.; Simonassi, L.; Lopes, G.; Lavagnoli, S. Particle Image Velocimetry Measurements in a High-Speed Low-Reynolds Low-Pressure Turbine Cascade. ASME. J. Turbomach. 2024, 146, 031010. [Google Scholar] [CrossRef]
  15. Jiang, H.; Peng, X.; Xie, W.; Lu, S.; Gu, Y. Development of a Large-Scale High-Speed Linear Cascade Rig for Turbine Blade Tip Heat Transfer Study. Aerospace 2022, 9, 695. [Google Scholar] [CrossRef]
  16. Humble, R.A.; Scarano, F.; van Oudheusden, B.W. Particle Image Velocimetry Measurements of a Shock Wave/Turbulent Boundary Layer Interaction. Exp. Fluids 2007, 43, 173–183. [Google Scholar] [CrossRef]
  17. Wang, Z.; Chang, J.; Hou, W.; Yu, D. Throttling process of a supersonic cascade studied by high-frequency response pressure and high-speed schlieren. Sci. Rep. 2021, 11, 13550. [Google Scholar] [CrossRef]
  18. Gao, L.; Yang, G.; Gao, T.; Li, R.; Hu, X. Experimental Investigation of a Linear Cascade with Large Solidity Using Pressure Sensitive Paint and Dual-Camera System. J. Therm. Sci. 2021, 30, 682–695. [Google Scholar] [CrossRef]
  19. Lei, X.; Gao, L.; Chang, L.; Yang, G.; Mao, X. Application of Pressure-Sensitive Paint Measurement Technology in Pressure Measurement of Cascade Blade Surface. In Proceedings of the 9th Asian Joint Workshop on Thermophysics and Fluid Science, Utsunomiya, Japan, 27–30 November 2022; Suryan, A., Yaga, M., Ko, H.S., Guang, Z., Eds.; AJWTF2022 2022; Springer Proceedings in Physics. Springer: Singapore, 2022; Volume 396. [Google Scholar] [CrossRef]
  20. Jing, W.; Hui, C.; Qiong, W.; Hongbo, L.; Zhanjun, L. Surface modification of carbon fibers and the selective laser sintering of modified carbon fiber/nylon 12 composite powder. Mater. Des. 2017, 116, 253–260. [Google Scholar] [CrossRef]
  21. Gao, Y.; Lalevée, J.; Simon-Masseron, A. An Overview on 3D Printing of Structured Porous Materials and Their Applications. Adv. Mater. Technol. 2023, 8, 2300377. [Google Scholar] [CrossRef]
  22. Guddati, S.; Kiran, A.S.K.; Leavy, M.; Ramakrishna, S. Recent advancements in additive manufacturing technologies for porous material applications. Int. J. Adv. Manuf. Technol. 2019, 105, 193–215. [Google Scholar] [CrossRef]
  23. Gibson, I.; Rosen, D.W.; Stucker, B. Additive Manufacturing Technologies: 3D Printing, Rapid Prototyping, and Direct Digital Manufacturing, 2nd ed.; Springer: Berlin/Heidelberg, Germany, 2015; ISBN 978-1-4939-2112-6. [Google Scholar]
  24. Ngo, T.D.; Kashani, A.; Imbalzano, G.; Nguyen, K.T.; Hui, D. Additive manufacturing (3D printing): A review of materials, methods, applications and challenges. Compos. Part B Eng. 2018, 143, 172–196. [Google Scholar] [CrossRef]
  25. Kumar, S.; Kruth, J.P. Composites by rapid prototyping technology. Mater. Des. 2010, 31, 850–856. [Google Scholar] [CrossRef]
  26. Yan, C.; Hao, L.; Hussein, A.; Young, P. Ti-6Al-4V triply periodic minimal surface structures for bone implants fabricated via selective laser melting. J. Mech. Behav. Biomed. Mater. 2015, 51, 61–73. [Google Scholar] [CrossRef]
  27. Wendel, B.; Rietzel, D.; Kühnlein, F.; Feulner, R.; Horsch, C.; Schmachtenberg, E. Additive processing of polymers. Macromol. Mater. Eng. 2008, 293, 799–809. [Google Scholar] [CrossRef]
  28. Torrado, A.R.; Shemelya, C.M. Effects of PolyLactic Acid properties on 3D printed structures: Tensile strength, ductility, and malleability. J. Mater. Res. 2016, 31, 2387. [Google Scholar] [CrossRef]
  29. Dumitrescu, O.; Gall, M.; Dragan, V. A Three-Dimensional Design to Study the Shock Waves of Linear Cascade with Reduced Mass Flow Requirements. Appl. Sci. 2023, 13, 11029. [Google Scholar] [CrossRef]
  30. Shimazaki, T.; Ichihara, S.; Tagawa, Y. Background oriented schlieren technique with fast Fourier demodulation for measuring large density-gradient fields of fluids. Exp. Therm. Fluid Sci. 2022, 134, 110598. [Google Scholar] [CrossRef]
  31. Tateishi, A.; Watanabe, T.; Himeno, T.; Uzawa, S. Numerical method for an assessment of steady and motion-excited flowfields in a transonic cascade wind tunnel. J. Glob. Power Propuls. Soc. 2017, 1, 171–183. [Google Scholar] [CrossRef]
  32. Jutur, P.; Govardhan, R.N. Flutter in Started and Unstarted Transonic Linear Cascades: Simultaneous Measurements of Unsteady Loads and Shock Dynamics. ASME J. Turbomach. 2019, 141, 121004. [Google Scholar] [CrossRef]
  33. Pressure Transmitters Type MBS 33. Available online: https://assets.danfoss.com/documents/184624/AI308949780206en-000202.pdf (accessed on 4 April 2024).
  34. Yue, S.; Wang, Y.; Wang, H. Design and Optimization of Tandem Arranged Cascade in a Transonic Compressor. J. Therm. Sci. 2018, 27, 349–358. [Google Scholar]
  35. Tweedt, D.L.; Schreiber, H.A.; Starken, H. Experimental Investigation of the Performance of a Supersonic Compressor Cascade. ASME J. Turbomach. 1988, 110, 456–466. [Google Scholar]
  36. Casoni, M.; Magrini, A.; Benini, E. Supersonic Compressor Cascade Shape Optimization under Multiple Inlet Mach Operating Conditions. Aerospace 2019, 6, 64. [Google Scholar] [CrossRef]
  37. Watanabe, T.; Aotsuka, M. Unsteady aerodynamic characteristics of oscillating cascade with separation bubble in high subsonic flow. In Proceedings of the ASME Turbo Expo 2005: Power for Land, Sea, and Air, Reno, NV, USA, 6–9 June 2005; International Gas Turbine Institute: Houston, TX, USA, 2005; pp. 625–633. [Google Scholar] [CrossRef]
  38. Vogt, D.M.; Fransson, T.H. Experimental investigation of mode shape sensitivity of an oscillating low-pressure turbine cascade at design and off-design conditions. J. Eng. Gas Turbines Power 2006, 129, 530–541. [Google Scholar] [CrossRef]
  39. Kazawa, J.; Watanabe, T. Active suppression of cascade flutter with piezoelectric device. In Proceedings of the ASME Turbo Expo 2006: Power for Land, Sea, and Air, Barcelona, Spain, 8–11 May 2006; International Gas Turbine Institute: Houston, TX, USA, 2006; pp. 1091–1100. [Google Scholar] [CrossRef]
  40. Aotsuka, M.; Watanabe, T.; Machida, Y. Role of shock and boundary layer separation on unsteady aerodynamic characteristics of oscillating transonic cascade. In Proceedings of the ASME Turbo Expo 2003, Collocated with the 2003 International Joint Power Generation Conference, Atlanta, GA, USA, 16–19 June 2003; International Gas Turbine Institute: Houston, TX, USA, 2003; pp. 349–356. [Google Scholar] [CrossRef]
  41. Jadhav, A.; Jadhav, V.S. A review on 3D printing: An additive manufacturing technology. Mater. Today Proc. 2022, 62, 2094–2099. [Google Scholar] [CrossRef]
  42. Available online: https://www.metronicnet.com/uploads/archivos/20240111_zeiss_atos-compact-scan_brochure_en.pdf (accessed on 22 January 2024).
  43. Zhang, L.; Zhang, S.; Zhu, H.; Hu, Z.; Wang, G.; Zeng, X. Horizontal dimensional accuracy prediction of selective laser melting. Mater. Des. 2018, 160, 9–20. [Google Scholar] [CrossRef]
  44. Minetola, P.; Galati, M.; Calignano, F.; Iuliano, L.; Rizza, G.; Fontana, L. Comparison of dimensional tolerance grades for metal AM processes. Procedia CIRP 2020, 88, 399–404. [Google Scholar] [CrossRef]
  45. Gibson, L.; Galloway, L.; Kim, S.I.; Spence, S. Assessment of turbulence model predictions for a centrifugal compressor simulation. J. Glob. Power Propuls. Soc. 2017, 1, 142–156. [Google Scholar] [CrossRef]
  46. Balasubramanian, R.; Barrows, S.; Chen, J. Investigation of Shear-Stress Transport Turbulence Model for Turbomachinery Applications. In Proceedings of the 46th AIAA Aerospace Sciences Meeting and Exhibit, Reno, NA, USA, 7–10 January 2008; p. 212. [Google Scholar] [CrossRef]
  47. Prisăcariu, E.-G.; Prisecaru, T. Quantitative Color Schlieren for an H2–O2 Exhaust Jet Developing in Air. Fluids 2024, 9, 19. [Google Scholar] [CrossRef]
  48. Zhu, W.; Bons, J.; Gregory, J. Boundary layer and near wake measurements of a two-dimensional airfoil with background-oriented schlieren method. Exp. Fluids 2023, 64, 7. [Google Scholar] [CrossRef]
  49. Anand, P.; Zhang, J.; Rajendran, L.K.; Bane, S.P.; Vlachos, P.P. Quantifying numerical uncertainty in background-oriented schlieren. Exp. Fluids 2024, 65, 1. [Google Scholar] [CrossRef]
  50. Gall, M.; Dumitrescu, O.; Drăgan, V.; Crunțeanu, D.E. Effects of Perforated Plates on Shock Structure Alteration for NACA0012 Airfoils. Inventions 2024, 9, 28. [Google Scholar] [CrossRef]
Figure 1. Three-dimensional representation of the centrifugal compressor, part of a microgas turbine engine [29].
Jmmp 08 00201 g001
Figure 2. Testing vanes placed on the backplate: (a) clear window for Schlieren investigation; (b) backside of the instrumented plate, showing the placement of the static pressure taps and the drill bit used for the active face (0.3 mm).
Jmmp 08 00201 g002
Figure 3. Technological demonstrator: (a) 3D model of the technological demonstrator; (b) aerodynamic sides of the main and secondary boards (machined metallic parts); (c) 3D view of the demonstrator components. Seal types for the windows: (d) O-ring channel on the rim where the windows are inserted; (e) seal on the contoured pressing surface.
Jmmp 08 00201 g003aJmmp 08 00201 g003b
Figure 4. The experimental model: (a) vanes fixed on the quartz plate; (b) linear cascade setup connected to the air pipe through the adapter.
Jmmp 08 00201 g004
Figure 5. Adapter with integrated total pressure probe: (a) the 3D-printable model; (b) assembly; (c) pressure probe detail.
Jmmp 08 00201 g005
Figure 6. The adapter internal structure and placement in the fluid domain.
Jmmp 08 00201 g006
Figure 7. Linear cascade setup.
Jmmp 08 00201 g007
Figure 8. Representative images of the additive-manufactured models: (a) Blades on the plate before the support material was removed. Images of the defects identified in the experimental models, manufactured during the first job: (b) secondary blade; (c) leading edge of the main blade; (d) main blade; (e) top view of the main blade.
Jmmp 08 00201 g008aJmmp 08 00201 g008b
Figure 9. Main-blade experimental models: (a) suction side: raw printed (front blade) vs. sandblast (back blade); (b) pressure side: raw printed state (up) vs. sandblast (down).
Jmmp 08 00201 g009
Figure 10. The results of the surface roughness analysis carried out for the main stator vane without perforations in the raw printed state: (a) pressure side; (b) suction side.
Jmmp 08 00201 g010
Figure 11. The results of the surface roughness analysis carried out for the main stator blade with perforations in the raw printed state: (a) pressure side; (b) suction side.
Jmmp 08 00201 g011
Figure 12. The results of the surface roughness analysis carried out for the sandblasted main stator blade with perforations: (a) pressure side; (b) suction side.
Jmmp 08 00201 g012
Figure 13. Representative images of additive-manufactured experimental models—in raw printed state: (a) secondary blade with perforations; (b) main blade with perforations; (c) secondary blade without perforations; (d) main blade without perforations.
Jmmp 08 00201 g013
Figure 14. Experimental models of additive-manufactured blades—as-printed state.
Jmmp 08 00201 g014
Figure 15. The results of the surface roughness analysis carried out for the main stator vane without perforations, mechanically processed: (a) pressure side; (b) suction side.
Jmmp 08 00201 g015
Figure 16. The results of the surface roughness analysis carried out for the main stator vane with perforations, mechanically processed: (a) pressure side; (b) suction side.
Jmmp 08 00201 g016
Figure 17. Machining vane configurations: (a) reference case and porous-wall cases; (b) the 3D-printed porous blade was planed by electroerosion and rectified by milling, and the final surfaces were achieved by CNC.
Jmmp 08 00201 g017
Figure 18. Mesh convergence study.
Jmmp 08 00201 g018
Figure 19. The computational grid corresponding to the linear cascade. (a) main-blade leading edge; (b) main-blade trailing edge; (c) the adaptor that connects the air pipe with the demonstrator.
Jmmp 08 00201 g019aJmmp 08 00201 g019b
Figure 20. Distribution of the dimensionless distance to the wall (y+) around the reference vanes.
Jmmp 08 00201 g020
Figure 21. Pressure distribution in the linear cascade, median plane: (a) static pressure; (b) total pressure.
Jmmp 08 00201 g021
Figure 22. Density gradient distribution, median plane.
Jmmp 08 00201 g022
Figure 23. Mach number distribution, median plane.
Jmmp 08 00201 g023
Figure 24. Schlieren experimental setup for the linear cascade testing.
Jmmp 08 00201 g024
Figure 25. Schlieren raw images—without perforated wall, 0.7-bar gauge.
Jmmp 08 00201 g025
Figure 26. Schlieren raw images—without perforated wall, 0.8-bar gauge.
Jmmp 08 00201 g026
Figure 27. Schlieren raw images—without perforated wall, 0.9-bar gauge.
Jmmp 08 00201 g027
Table 1. Cascade parameters and flow conditions.
SymbolParameterMain BladeSplitter Blade
cBlade chord length [mm]71.1645.22
sPitch width [mm]5252
lBlade span [mm]1010
σSolidity1.3680.869
γStagger angle [°]51.5549.23
Table 2. The 3D CAD model of the blades with the porous area.
First BatchFinal Blade Model
Main BladeJmmp 08 00201 i001Jmmp 08 00201 i002
Jmmp 08 00201 i003Jmmp 08 00201 i004
Secondary BladeJmmp 08 00201 i005Jmmp 08 00201 i006
Jmmp 08 00201 i007Jmmp 08 00201 i008
Table 3. Geometrical details of aerodynamic profiles.
Main BladeSecondary Blade
Length [mm]7348
Maximum thickness [mm]77
Height [mm]1010
Length of the porous-wall area—suction side [mm]1523
Length of the porous-wall area—pressure side [mm]3023
Number of orifices—pressure side88104
Number of orifices—suction side8856
Disclaimer/Publisher’s Note: The statements, opinions and data contained in all publications are solely those of the individual author(s) and contributor(s) and not of MDPI and/or the editor(s). MDPI and/or the editor(s) disclaim responsibility for any injury to people or property resulting from any ideas, methods, instructions or products referred to in the content.