Article

Explainable AI Techniques for Comprehensive Analysis of the Relationship between Process Parameters and Material Properties in FDM-Based 3D-Printed Biocomposites

1
Department of Computer Engineering, Vishwakarma Institute of Information Technology, Pune 411046, India
2
Department of Mechanical Engineering, Vishwakarma Institute of Information Technology, Pune 411046, India
3
Faculty of Engineering, University of Debrecen, Ótemető Strt. 2-4, 4028 Debrecen, Hungary
*
Authors to whom correspondence should be addressed.
J. Manuf. Mater. Process. 2024, 8(4), 171; https://doi.org/10.3390/jmmp8040171
Submission received: 16 July 2024 / Revised: 1 August 2024 / Accepted: 5 August 2024 / Published: 6 August 2024

Abstract

:
This study investigates the complex relationships between process parameters and material properties in FDM-based 3D-printed biocomposites using explainable AI techniques. We examine the effects of key parameters, including biochar content (BC), layer thickness (LT), raster angle (RA), infill pattern (IP), and infill density (ID), on the tensile, flexural, and impact strengths of FDM-printed pure PLA and biochar-reinforced PLA composites. Mechanical testing was used to measure the ultimate tensile strength (UTS), flexural strength (FS), and impact strength (IS) of the 3D-printed samples. The extreme gradient boosting (XGB) algorithm was used to build a predictive model based on the data collected from mechanical testing. Shapley Additive Explanations (SHAP), Local Interpretable Model-Agnostic Explanations (LIME), and Partial Dependence Plot (PDP) techniques were implemented to understand the effects of the interactions of key parameters on mechanical properties such as UTS, FS, and IS. Prediction by XGB was accurate for UTS, FS, and IS, with R-squared values of 0.96, 0.95, and 0.85, respectively. The explanation showed that infill density has the most significant influence on UTS and FS, with SHAP values of +2.75 and +5.8, respectively. BC has the most significant influence on IS, with a SHAP value of +2.69. PDP reveals that using 0.3 mm LT and 30° RA enhances mechanical properties. This study contributes to the field of the application of artificial intelligence in additive manufacturing. A novel approach is presented in which machine learning and XAI techniques such as SHAP, LIME, and PDP are combined and used not only for optimization but also to provide valuable insights about the interaction of the process parameters with mechanical properties.

1. Introduction

Three-dimensional printing is gaining a lot of attention from industry as well as academia due to its ability to produce parts with the highest complexity, its ease of manufacturing, its reduced material waste, and its cost-effectiveness [1]. Fused deposition modeling (FDM) is a type of 3D printing in which materials are extruded from a nozzle and deposited layer by layer in the XY plane to create a 3D structure [2]. Commonly used materials in FDM include polylactic acid (PLA) and acrylonitrile butadiene styrene (ABS) [3]. Due to its limited strength, researchers are exploring synthetic and natural reinforcements to enhance its mechanical properties [4]. Biocomposites, i.e., polymer material reinforced with natural fibers, are among the most promising materials for FDM [5]. The mechanical properties of 3D-printed parts largely depend on the material properties and FDM process parameters used [6]. Rendas et. al. studied the effect of the printing temperature on the strength of the 3D-printed polyetheretherketone (PEEK). The results indicate that, at higher temperatures, the yield strength was reduced significantly [7]. Ahmad et al.’s study on oil-palm-fiber-reinforced ABS composites for FDM demonstrated that the 3 wt% fiber composite exhibited marginally higher tensile strength and modulus values compared to plain ABS [8]. Fisher et. al. investigated the effect of raster angle on the performance of carbon-fiber composites, and the results indicated a 130% rise in compressive strength when the angle was set to 0 degrees [9].
It is difficult to build a mathematical model for the prediction of the mechanical performance and quality of the 3D-printed parts as there are too many factors influencing the FDM process parameters and the variety of materials used. Machine learning (ML) is a promising pathway with which to prepare a prediction model, as it can discover underlying patterns with ease. For tensile strength prediction, Jatti et al. used the K-Nearest Neighbor (KNN) ML model, which resulted in better prediction capabilities, with an F1 score of 0.71 [10]. Deb et al. found that ensemble ML methods outperformed classical support vector and KNN models in predicting the surface quality and strength of 3D-printed items [11]. The lack of transparency in most predictive machine learning models can make it difficult to understand their decision-making processes, which may limit their use in critical applications. Explainable AI (XAI) can play a critical role in additive manufacturing by enhancing the transparency, trust, and efficacy of AI-driven processes.
Explainable machine learning (ML) is used to establish importance rankings for parameters, serving as an alternative tool for prioritization, and to uncover interaction effects between parameters [12]. XAI involves using techniques like model simplification, visualization tools, and rule-based systems to demystify complex AI models. By offering explanations for AI outputs, XAI not only helps users to trust and effectively utilize AI technologies but also facilitates better debugging, compliance, and refinement of AI systems. Novel methods for applying XAI in various applications have been suggested by researchers. For instance, Hrnjica and Softic find that the estimation of repair work can be reasonably assisted by explainable AI in the form of a focused, analytical, and trustworthy prediction model [13]. Leon Kellner analyzed these predictions using the SHAP explainable AI technique. In terms of ice mechanics, the impact rankings of experimental parameters and parameter interactions were examined and addressed [12]. The study conducted by Gawde et.al. provides AI-based predictive maintenance that can be utilized for industrial rotating machinery. They performed XAI integration, using “Local Interpretable Model Agnostic Explanation (LIME)”, “SHapley Additive exPlanation (SHAP)”, “Partial Dependence Plot (PDP)” and “Individual Conditional Expectation (ICE)” methods to interpret the results [14]. According to this study, P-wave velocity is the most crucial factor in predicting UCS and E. For UCS and E estimates, extreme gradient boosting, or XGBoost, was employed as a reliable predictive AI system. These findings suggested that XAI might should taken into consideration to clarify intricate connections between advances in energy resources and rock mechanics [15]. The study by Mishra et.al. focuses on predicting the surface roughness of PLA specimens created through additive manufacturing. Their study utilizes eight different supervised machine learning regression algorithms. To enhance the interpretability of these models, explainable AI techniques are employed. Their study also gives insights from the deployment of explainable AI techniques and provides a comparative analysis of the performance of all the algorithms deployed [16]. Thapaliyaa’s work investigates the use of five machine learning regression models to estimate the processing time and power consumption of CNC machines. Additionally, this study uses the XAI techniques SHAP and LIME to offer post hoc justifications for the predictions generated by these models. The results of the studies showed that the most accurate estimates for processing time and power usage came from random forest regression. The explanations made it clear that the main determinants of processing time and power consumption were the number of axis rotations and the number of fast traverse trips required to reach the machine’s zero point. These prediction models can be used by businesses that use CNC milling machines to plan and schedule operations more effectively, saving time and energy. They can also optimize the variables that affect processing and power usage [17].
According to the literature, the use of machine learning algorithms to predict mechanical characteristics in FDM 3D printing remains rather limited. To build trust in these models, clear and transparent explanations are essential. Uniquely, this study combines ML-based prediction modeling, performed using the dataset generated by mechanical testing, with uses XAI techniques like SHAP, LIME, and PDP to provide detailed insights into how different parameters affect the strength of 3D-printed biocomposites. Furthermore, as there are only a few research articles available on the use of explainable AI in additive manufacturing, our work makes an important contribution to the field. In this study, we examined the effect of five parameters on the tensile, flexural, and impact strength of a 3D-printed composite. The results of mechanical testing were used for the creation of the dataset. A mechanical strength prediction model was built using the XGB ML model. Furthermore, a detailed investigation was carried out using XAI techniques to understand the correlation between features and target parameters. Figure 1 illustrates a comprehensive framework that details the implementation of explainable AI, offering a clear overview of the systematic approach used in this research.

2. Materials and Methods

2.1. Fabrication of Test Specimen and Mechanical Testing

Biochar (BC) produced from rice husk and polylactic acid (PLA) granules was used to create a biocomposite filament for fused deposition modelling (FDM). Four batches were prepared: pure PLA, PLA with 1% BC, PLA with 3% BC, and PLA with 5% BC. Filaments with diameters of 1.75 mm were acquired from these batches using a single-screw extruder. CAD models of the specimens were prepared using CATIA V5 for utilization in tensile, flexural, and impact tests. The standards and major dimensions used for the tests are presented in Figure 2. There are numerous process parameters involved in the FDM-based 3D printing process. Based on the literature review, key process parameters were identified, and their levels of variation were decided in accordance with the biochar content (i.e., 0%, 1%, 3%, and 5%). The key process parameters selected were layer thickness (LT), raster angle (RA), infill density (ID), and infill pattern (IP). The non-observed parameters and the process parameters under observation are presented in Table 1, along with their values.
In this study, we investigated a total of five parameters, i.e., BC, LT, RA, ID, and IP, each with four levels. A Taguchi orthogonal array was used to design the experiments, resulting in a total of 16 experimental runs. Ultimaker-Cura 5.7.0 software was used to slice and set the FDM process parameters. All the test specimens were manufactured using the Smart Maker Dual Z200 (an FDM-based 3D printer). To ensure accuracy and repeatability, three samples of each experimental run were fabricated. Following the ASTM standard procedure, each specimen was tested to evaluate tensile, flexural, and impact strength. Tensile testing was conducted on a universal testing machine (UTM) (obtained from Kalpak Instruments and Controls, Pune, India) with a 10 kN load cell capacity. Using a three-point bending attachment on the same UTM, flexural tests were conducted. For impact testing, we utilized the Izod impact testing machine from International Equipment, Mumbai, India. The results of these mechanical tests were meticulously recorded for further analysis.

2.2. Data Processing and Machine Learning

The experimental data were collected, converted into a CSV file, and imported into the Google Colab platform. Before training the model, preprocessing was performed. This involved handling categorical data for the feature “infill pattern”. These categorical data were encoded into numerical values to facilitate model training and analysis. Infill patterns (IP), namely cubic, triangle, octate, and line, were assigned the values 0, 1, 2, and 3, respectively. We deployed a supervised machine learning (ML) regression algorithm developed using Python programming, an explainable artificial intelligence (XAI) pipeline which involves employing SHAP, LIME, and PDP to explain the models and create machine learning models by learning from data. The pipeline consists of several steps. In machine learning, assessing a model’s performance is a crucial step in building a model. Data scientists usually divide dataset into two sections—80% for training and 20% for testing—to perform this. The dataset is divided on a random basis into training and testing subsets, using the train–test split function to avoid any biases. It is common practice o use 70–80% of the data for training and the remaining 20–30% for testing. Overfitting, which happens when a model is unduly complicated and matches the training data too closely, is lessened by this 80/20 split. Data scientists can more accurately evaluate the model’s capacity to be generalized to new data via setting. XGB (extreme gradient boosting) is a powerful and efficient means of implementing gradient boosting, designed for speed and performance. It is widely used in machine learning competitions and real-world applications due to its high accuracy and scalability. XGB operates under the boosting framework, where multiple weak learners (typically decision trees) are combined to form a strong learner. It uses gradient descent to minimize the loss function. XGB incorporates regularization techniques such as L1 (Lasso) and L2 (Ridge) regularization. It employs a tree pruning technique known as “max depth”. For hyperparameter tuning, we used RandomizedSearchCV with the XGBRegressor model from the XGB library and employed the best estimator found by the random search. The best estimator used to predict the test data is post-hyperparameter tuning. Our configuration includes a learning rate of 0.25, a max depth of 10, a gbtree booster, and 100 estimators.
In this study, the performance of the machine learning model was evaluated using a coefficient of determination (R2), mean absolute error (MAE) and root-mean-squared error (RMSE) as metric features. A regression model is evaluated by using XAI tools like SHAP, LIME, and PDP to generate insights into the relation between input parameters and output parameters.

2.3. Implementation of Explainable AI Techniques

SHAP: Shapley Additive Explanations (SHAP) is an advanced technique used for understanding machine learning model predictions. A systematic approach to analyzing each feature’s contribution to model predictions is provided by SHAP. This can be utilized by calculating the “Shapley values” for every attribute, measuring the influence of each on predictions [18]. In this study, SHAP values and the XGBoost model’s variable importance are calculated for UTS, FS, and IS using the training set. SHAP values play a crucial role in understanding how individual features affect model predictions, enhancing interpretability, trust, and insights into machine learning models’ behavior. SHAP quantifies the influence of each feature on the model’s output for a specific instance or prediction. The method of evaluating the importance of various characteristics in impacting a machine learning model’s predictions using SHAP values is known as variable importance using SHAP. The values provide a means of quantifying the impact of every parameter on the model’s output for a certain instance or estimate. First, we calculated SHAP values for the XGBoost model. This involved running the model on the dataset and generating SHAP values for each instance. Once SHAP values for all instances were calculated, we aggregated them to calculate the overall impact of each feature across the dataset. After aggregating SHAP values, we ranked the features based on their absolute SHAP values. Features with higher absolute SHAP values were considered more important, as they had a greater impact on model predictions. The visualization of variable importance was performed using plots such as SHAP summary plots or bar charts. These plots show the relative importance of each feature in influencing model predictions.
LIME: Local Interpretable Model-Agnostic Explanations (LIME) is a post hoc local explanation technique which explains individual predictions based on any black box machine learning model in the region of a prediction with instances requiring explanation using locally interpretable models (decision trees, linear models, etc.) [19]. The LIME method works by altering the input sample slightly and tracking any changes in the black box model’s output, assessing the extent to which various factors influence the forecast outcomes by determining the degree of modification [20]. By making little adjustments to its parameters, LIME will produce slightly different versions of the training data (perturbations). We modified the assessed instances by making changes to other features and keeping one feature the same. Then, the model was trained on the perturbed instances and their corresponding predictions from the original complex model. We assessed the importance of different features in the interpretable model to understand which aspects of the instance are most influential in the prediction. Finally, we used the interpretable model to explain why the original complex model made its predictions for the selected instances. This explanation is usually given in terms of the contribution of different features.
PDP: In linear regression, the sign of the coefficient makes it simple to identify the link between the target and a feature. The links between the variables in a machine learning model and the target are identified using the Partial Dependence Plot (PDP) technique. It displays the small impact that one or two characteristics will have on the expected result. It displays whether there is a linear, monotonic, or more complex relationship between a feature and the target. Likewise, J. H. Friedman introduced PDP, and this is widely used in machine learning modeling [21]. PDP demonstrates how individual features affect the prediction outcomes of a machine learning model and provides a way to illustrate the connection between variables and prediction results [22].

3. Results and Discussion

3.1. Mechanical Testing and Machine Learning Model

Based on the design of the experiments, the parameter settings for 16 runs, performed with three samples each, are presented in Table 2. The findings of mechanical testing, i.e., ultimate tensile strength (UTS), flexural strength (FS), and impact strength (IS), are tabulated for each experimental run in the same table. A biocomposite with 5% BC, 0.3 LT, 100% ID, 30 RA, and cubic IP exhibits a maximum UTS of 36.95 MPa. On the contrary, the pure PLA resulted in a maximum FS of 68.66 MPa with a line pattern. The addition of 1% BC to PLA increased the IS by approximately 53% compared to pure PLA.
Table 2 also shows the XGBoost model’s predictions for the UTS, FS, and IS values for each experimental run. Also, readings with maximum UTS, FS and IS are given in bold. The model exhibits outstanding predictive performances, achieving an R-squared value of 0.96 for UTS, one of 0.95 for FS, and one of 0.85 for Impact IS. For training data, the absolute mean error values are 1.16, 1.7 and 1.7 for UTS, FS, and IS, respectively. For testing data, the absolute mean error values are 2.29, 3.33 and 2.96 for UTS, FS, and IS, respectively.
The hyperparameter tuning process played a crucial role in achieving these results. By employing techniques such as RandomizedSearchCV, we systematically explored a range of hyperparameters to identify the optimal combination for minimizing the MSE and enhancing model generalization. This careful tuning ensured that the model not only fitted the training data well but also performed effectively on unseen test data, thereby reducing the risk of overfitting.

3.2. SHAP Analysis

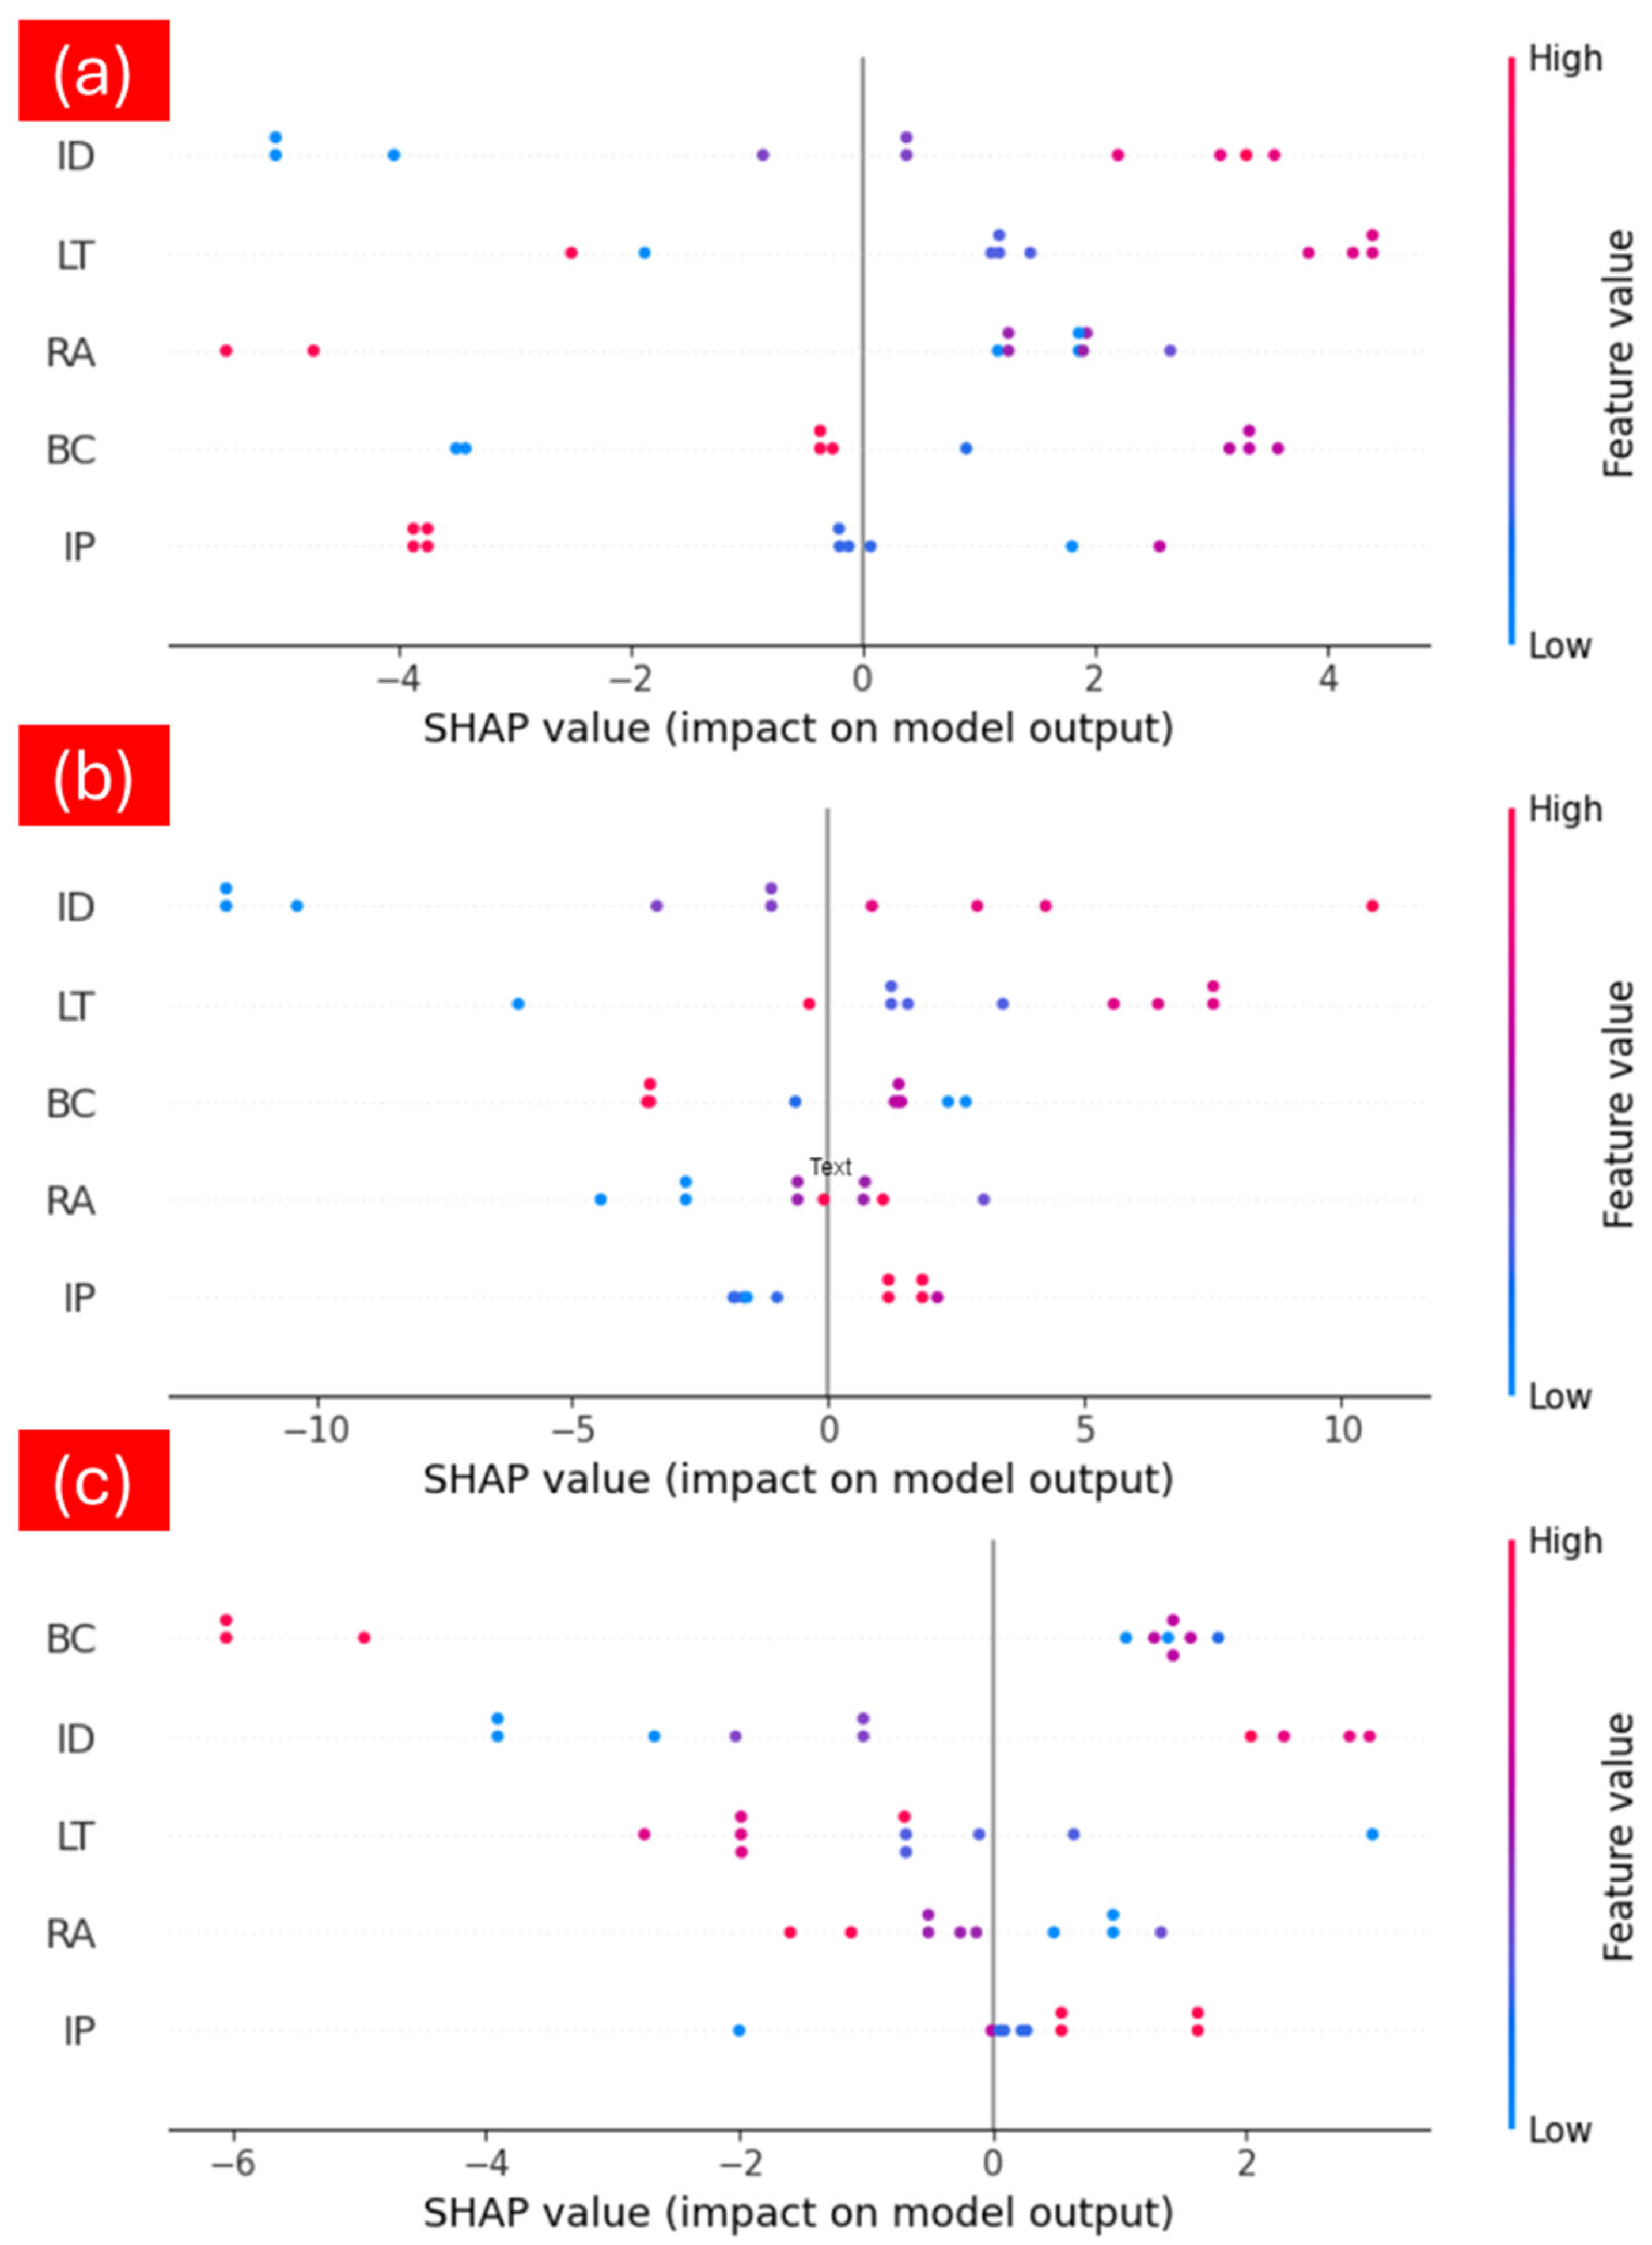
The y-axis in Figure 3 displays all the attributes, while the x-axis represents the SHAP value. Each feature and prediction have a SHAP value that corresponds to each point on the chart. Red indicates a characteristic with a higher value. Blue indicates a feature with a lower value. SHAP analysis provides useful insights into the intricate connections between process parameters and mechanical properties of 3D-printed biochar-reinforced PLA composites, which are detailed below.
Infill density (ID) significantly increased tensile, flexural, and impact strengths, highlighting the relevance of void reduction and material density. Higher values of ID (≥0.8) resulted in higher UTS and FS, as well as to ID being identified as the second most important feature for IS. Lower values of ID (≤0.6) led to a reduction in UTS and FS. Higher ID means more material and reduced void in the structure, which means greater load-bearing capacity. Hence, the strength increases with the increase in the ID value.
Layer thickness (LT) had a significant impact on the strength of the 3D-printed composite material. An LT value of 0.3 mm resulted in a higher UTS and FS, while other values resulted in a lower UTS and FS. An LT value of 0.1 mm resulted in a higher IS, whereas other values were linked to a lower IS. However, as per Figure 3c, it can be seen that the contribution of LT is lower in the case of IS. As per the literature, a finer layer thickness is expected to enhance layer adhesion and improve mechanical strength [23]. However, these findings imply that there cannot be generalization. Each mechanical property has an optimum LT value.
The addition of biochar (BC) as a reinforcing agent in PLA had less influence on UTS (see Figure 3a) and FS (refer Figure 3b), but its impact on IS was found to be the highest (refer Figure 3c). BC showed a nonlinear effect on mechanical properties. The average value of BC (=3%) enhanced the UTS of the composite, but lower and higher BC content resulted in lower UTS. In the case of IS, the BC content had a positive impact, except at 5%. Due to the addition of the BC, IS increased significantly. This effect may be attributed to increased interfacial bonding between BC and PLA materials. However, with a higher BC content, the increased voids resulted in a reduction in the energy absorbance capacity of the composite. These results suggest that the optimal value of BC, i.e., the amount of reinforcement required, differs for individual mechanical properties.
From Figure 3 and Figure 4, it can be seen that the effect of raster angle (RA) is nominal in the cases of FS and IS. However, the contribution of RA to UTS is significant. At lower values of RA (≤45), UTS increased considerably. RA represents the orientation of the depositing layer. The proper alignment of the printed layer with respect to the loading direction results in increased strength. For example, with a 0° RA, the printed layers coincide with the tensile loading direction, which means increased load bearing capacity. So, to increase the strength of the 3D structure, the RA value should move in the direction of the applied load.
Figure 3a shows that the line pattern (IP = 3) resulted in lower UTS values whereas the octate pattern resulted in higher UTS values. The SHAP values of all IPs are near zero and clustered together for FS and IS (refer to Figure 3b,c), suggesting that IP has a lower influence on FS and IS. Additionally, Figure 4 indicates that the mean SHAP value is consistently low compared to other process parameters for strength. The IP structure is likely to affect the stress distribution and energy absorption capabilities of the material, but the SHAP analysis suggests that this effect is negligible compared to the other process parameters.
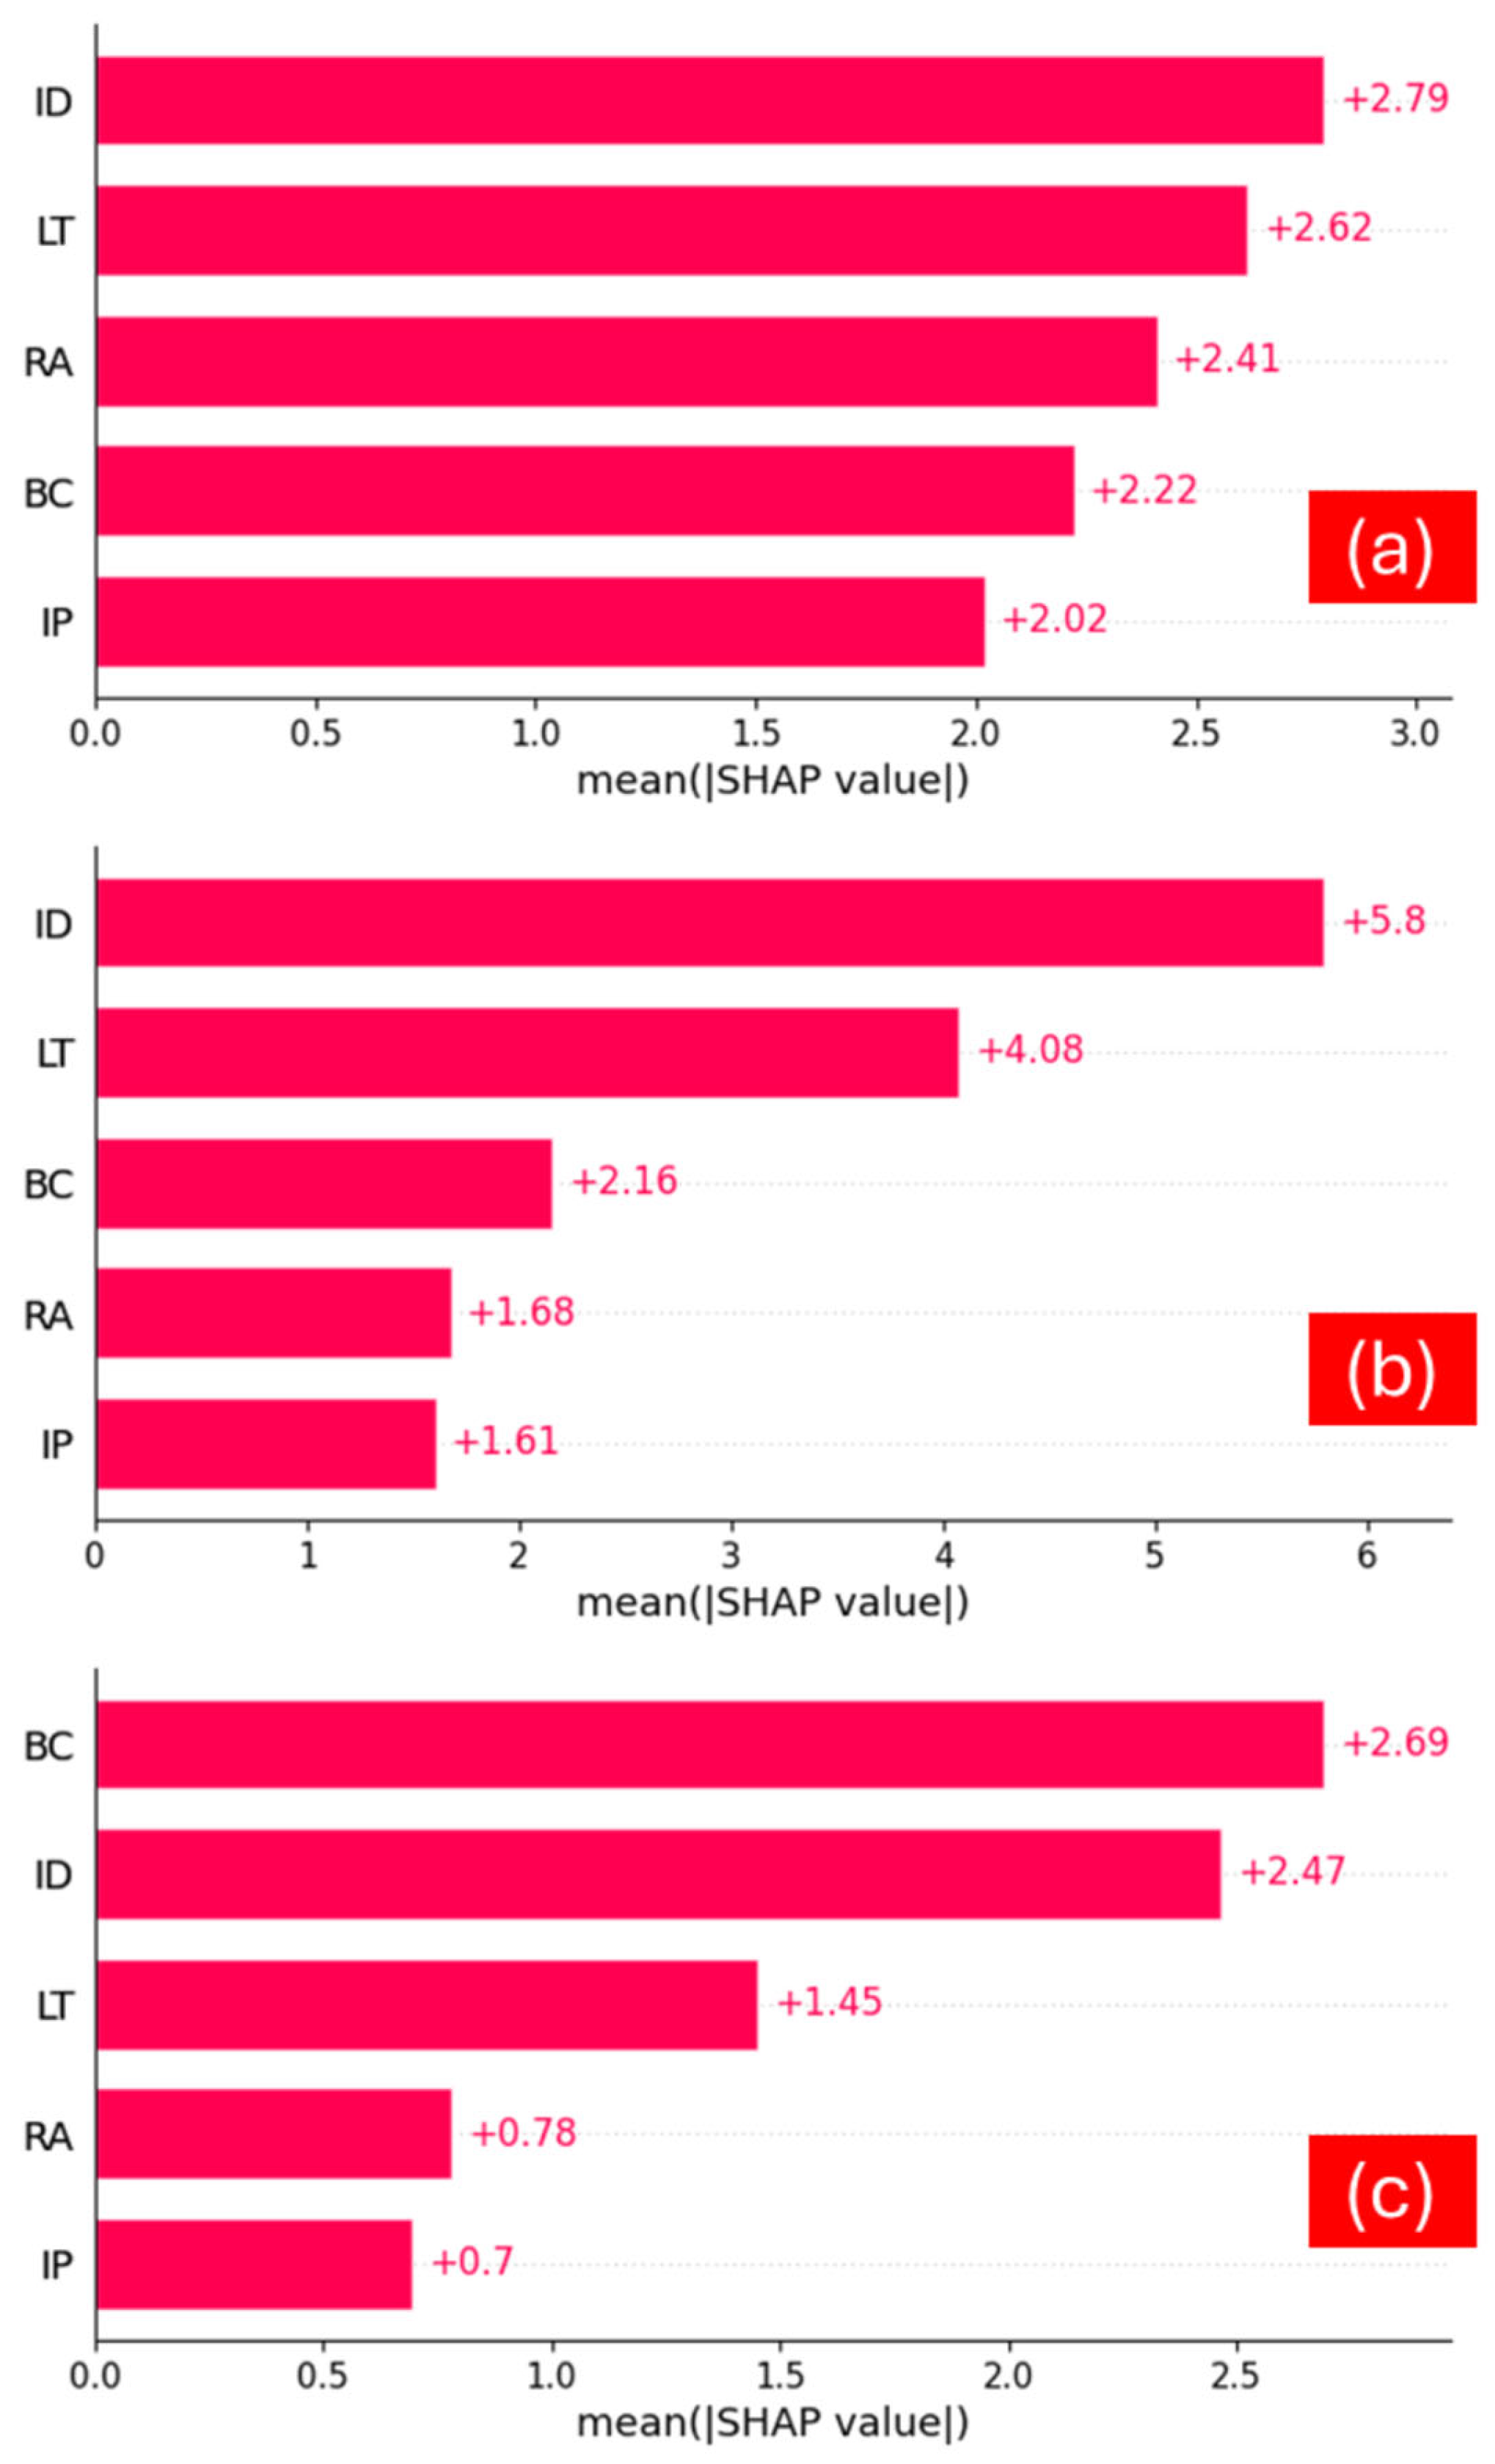
In the SHAP summary plot (see Figure 4), features are ranked according to their influence on the model’s predictions. The average absolute SHAP value for each characteristic, which shows their overall impact, is represented by the x-axis. For UTS, ID emerges as the most critical feature, significantly influencing the model’s predictions. The remaining features have relatively similar importance levels, although they are less impactful than ID.
For FS, ID again stands out as the most important feature, with a notable SHAP mean value of +5.8. This indicates a strong positive impact on FS predictions. Following ID, LT, BC, RA, and IP are the next most important features, respectively. Regarding IS, BC is identified as the most influential feature, followed by ID, LT, RA, and IP. This ranking suggests that BC plays a crucial role in determining IS, with other features also contributing, but to a lesser extent. Each of these features has a positive SHAP value, signifying their positive contribution to FS. Overall, for all output features (UTS, IS, and FS), the input features (ID, LT, BC, RA, and IP) positively impact the model’s predictions. This consistent positive influence, as reflected by the SHAP values, underscores the significance of these features in enhancing the mechanical properties of 3D-printed specimens. The detailed analysis provided by SHAP values aids in understanding the complex relationships between input parameters and their effects on the output features, facilitating more informed decision making in the optimization of additive manufacturing processes.

3.3. Lime Analysis

Figure 5 showcases a LIME explanation for the 4th instance in the test dataset, created using an XGB regressor. This detailed explanation is presented in a tabular format (see Table 3) and includes three key pieces of information, given from left to right: the model’s predictions, the feature contributions, and the actual values for each feature. In the feature contribution plot derived from LIME analysis (refer Figure 5), the features highlighted in blue indicate a negative contribution to the prediction, meaning they decrease the prediction score. Conversely, the features highlighted in orange indicate a positive contribution, meaning they increase the prediction score.
For this specific instance, where BC is 3, ID is 1, RA is 45, LT is 0.1, and IP is 2 (triangle), the LIME explanation plot reveals how these features impact the prediction of various mechanical properties. For UTS, the IP, LT, and BC parameters positively influence the prediction, pushing the score higher. Among these, the feature IP has the most significant contribution, with the highest LIME value, indicating its strong positive effect on the predicted UTS value. Regarding FS, the feature BC contributes positively, pushing the FS value up, while the other features contribute negatively, lowering the FS value for this instance. This suggests that, in this particular case, BC is the primary driver of a higher FS value. In the case of IS, BC, RA, and LT have positive contributions, increasing the IS value. However, ID and IP contribute negatively, reducing the IS value. This indicates that while BC, RA, and LT enhance the predicted IS, the effects of ID and IP counteract this increase.
All things considered, the LIME explanation plot offers a thorough grasp of how various features contribute to the model’s predictions in this particular case. It highlights the varying degrees of positive and negative impacts of each feature, providing insightful information about the model’s decision-making process. This detailed analysis is crucial for interpreting and validating the model’s predictions, especially in the context of optimizing additive manufacturing processes. In the LIME analysis, instances are modified by systematically altering various features while keeping one feature constant to observe its impact on the prediction for all output features. This approach involves generating perturbed instances and then training the model on these instances using the corresponding predictions from the original, complex model. This process helps in assessing the importance of different features in the interpretable model, providing insights into which aspects of the instance are most influential in the prediction.
Table 3 presents the LIME values for UTS, FS, and IS under different input conditions. We can ascertain each feature’s contribution to the model’s mechanical property predictions by looking at the LIME values.
In LIME analysis, the model is trained on these perturbed instances, using their corresponding predictions from the original complex model. We assessed the importance of using different features in the interpretable model to understand which aspects of the instance are most influential in the prediction. The following are our observations.
  • LT: thinner layers (≤0.30) are generally beneficial for UTS and IS, while thicker layers (>0.30) improve FS.
  • BC: a lower biochar content (≤3.00) positively influences all three-strength metrics. A higher biochar content (>3.00) negatively impacts these strengths.
  • RA: Smaller angles (≤30.00) decrease FS and IS slightly but have minimal impact on UTS. Larger angles (>30.00) improve FS and IS.
  • ID: Higher infill density (>0.80) significantly boosts all strength metrics, while lower density (≤0.80) negatively impacts them.
  • IP: Infill patterns with values ≤ 2.00 positively affect UTS but negatively impact FS and IS. Patterns > 2.00 have the opposite effect, enhancing FS and IS but reducing UTS.
These insights can guide process optimization in additive manufacturing, enabling the adjustment of parameters to achieve desired mechanical properties in 3D-printed specimens. The following are the optimized parameters resulted through the LIME analysis for achieving maximum strength for the local instance under consideration.
  • For UTS, a high positive value is obtained for LT ≤ 0.30, BC ≤ 3.00, RA > 30.00, ID > 0.80 and IP ≤ 2.00.
  • For FS, LT > 0.30, BC ≤ 3.00, RA > 30.00, ID > 0.80 and IP > 2.00, a high positive LIME value is obtained.
  • For IS, a positive LIME value is obtained with LT ≤ 0.30, BC ≤ 3.00, RA > 30.00, ID > 0.80 and IP > 2.00.

3.4. PDP Analysis

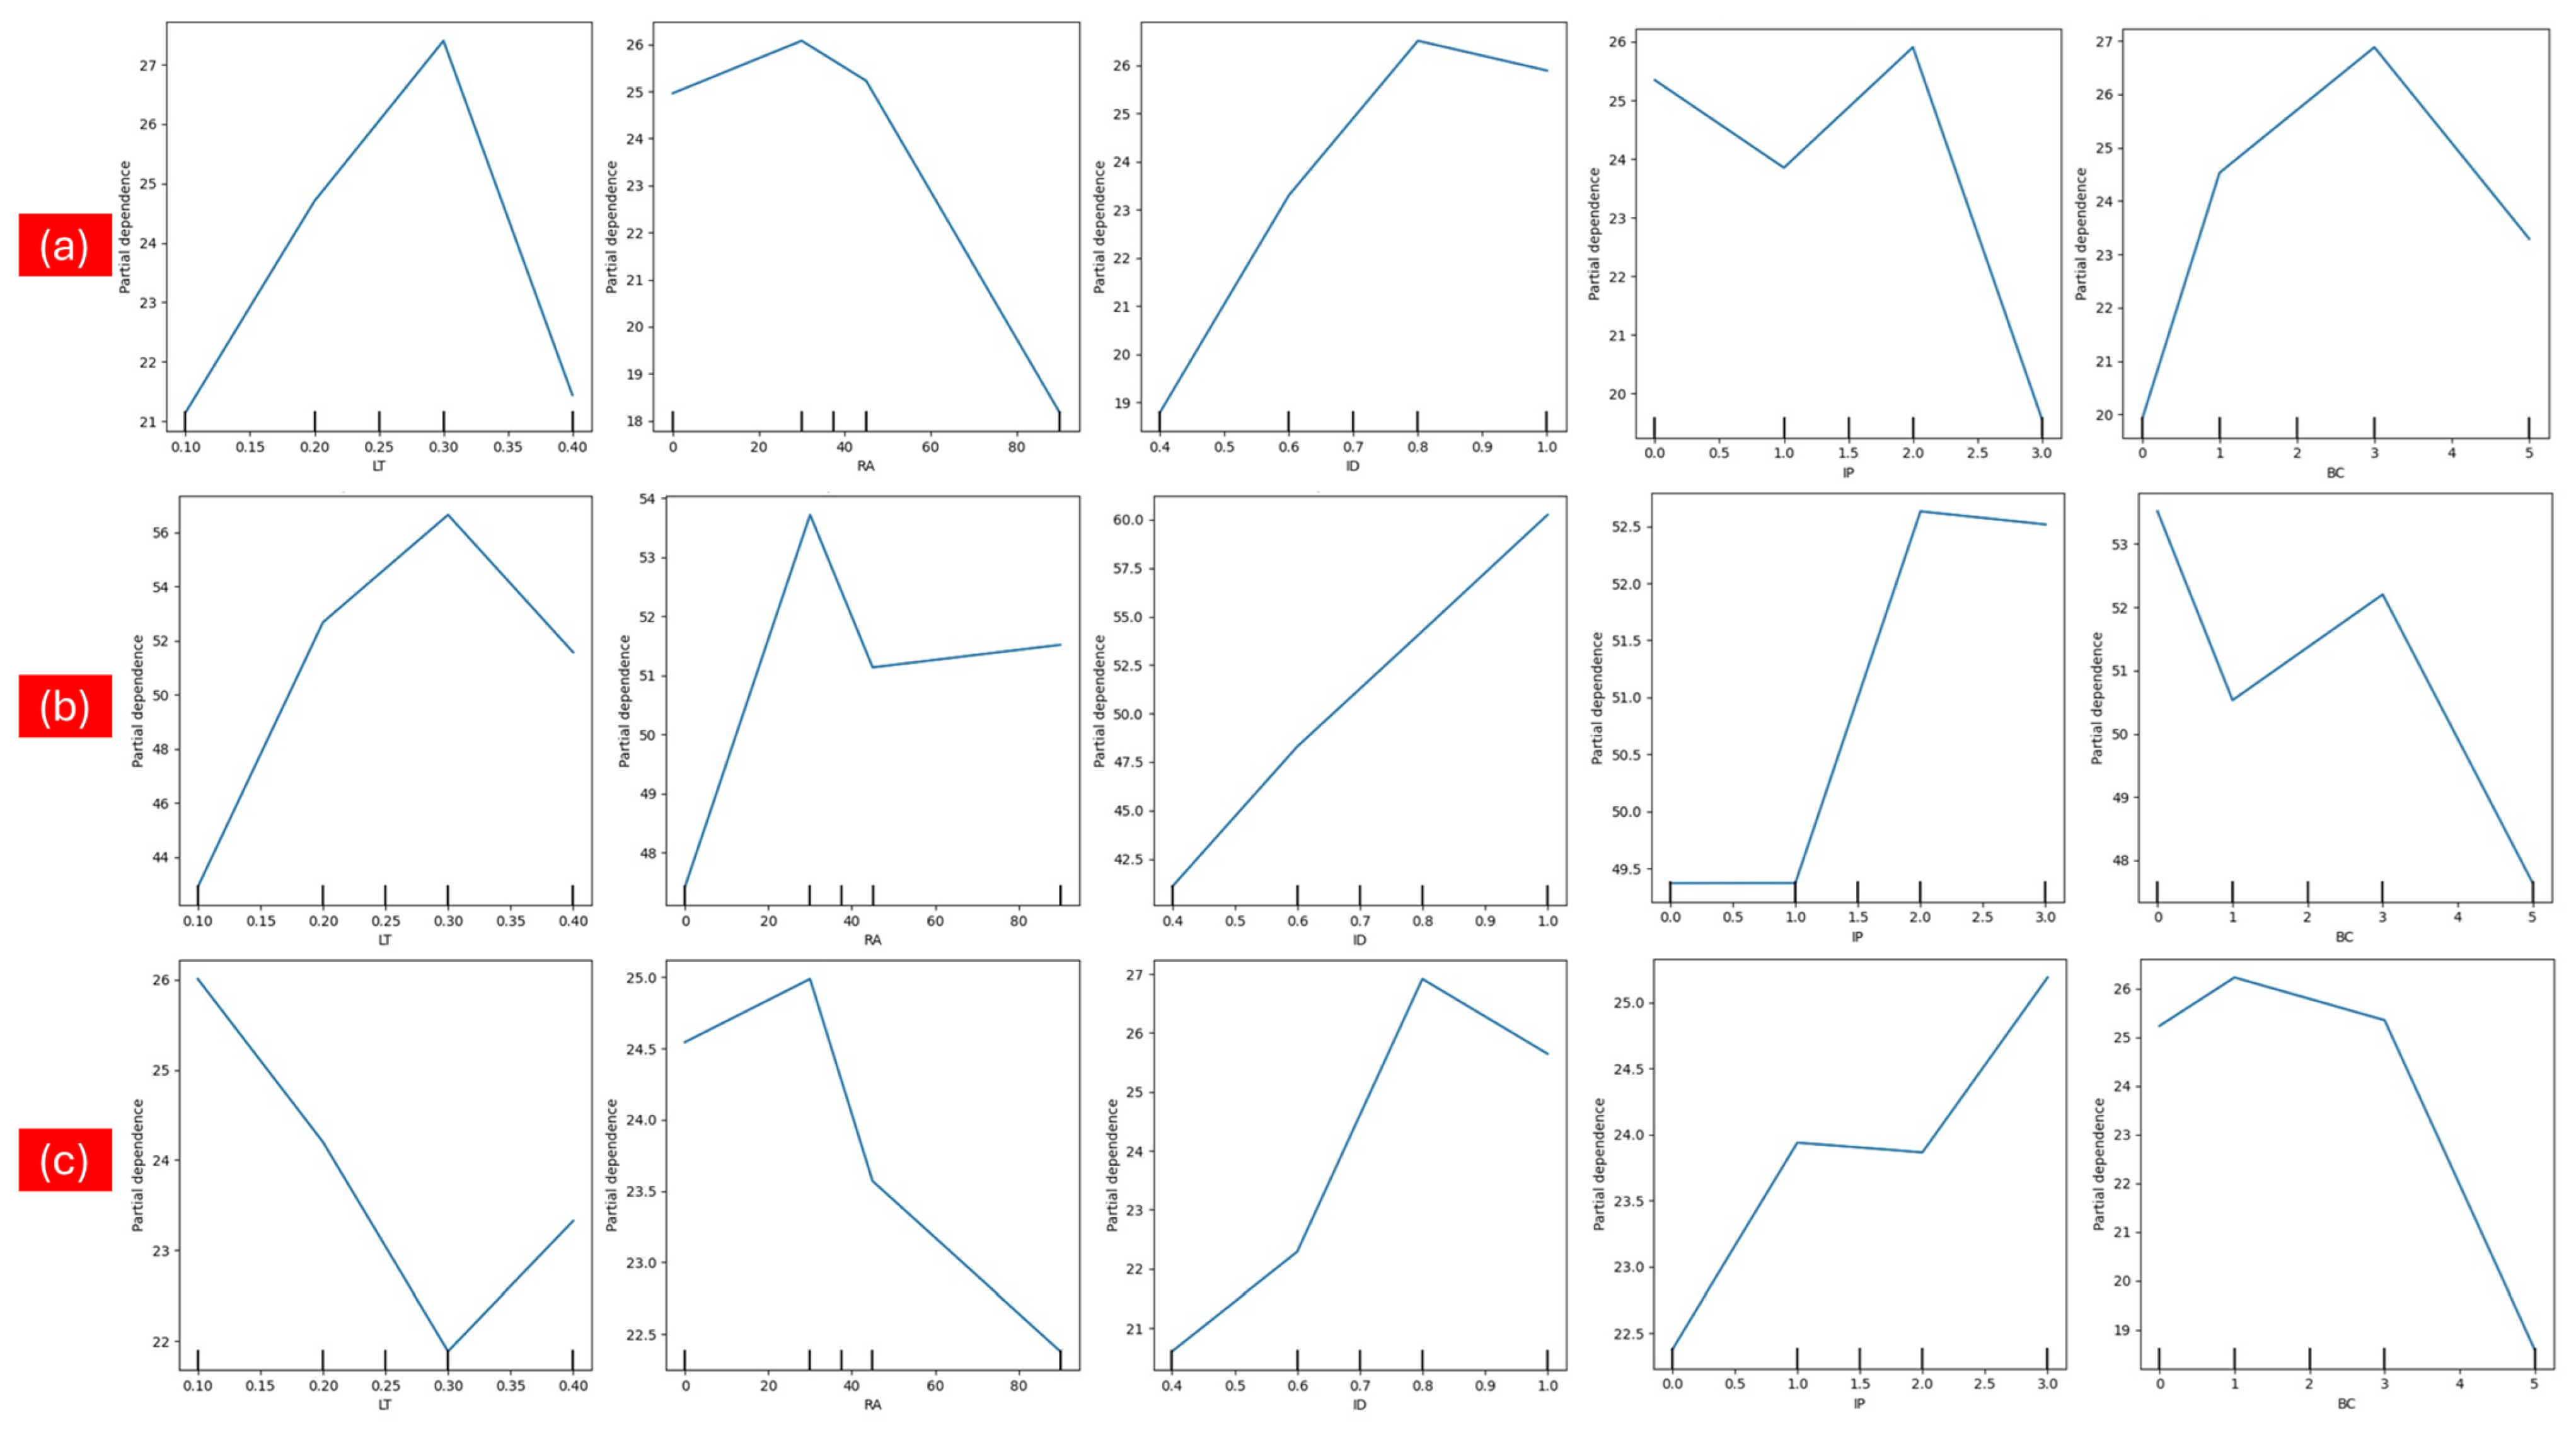
PDP plots were used to visualize the relation between the continuous variables and the projected probability of FS, IS, and UTS. PDP is used to investigate the interaction of individual process parameters and various mechanical strengths. These relationships are depicted in Figure 6. It is evident from Figure 6 that there is a nonlinear relationship between each variable and the predicted UTS, FS, and IS values. This nonlinearity indicates that the response of the mechanical strengths to changes in process parameters is not straightforward, but rather varies in a complex manner across the range of the parameters. The pick point in each plot corresponds to the optimum value of the corresponding process parameter.
The optimum values of process parameters to maximize the respective strengths are obtained from PDP and are listed in Table 4. The table provides a straightforward reference for setting the process parameters to their optimum levels to enhance the mechanical strengths of interest.

4. Conclusions

This study investigated how the different FDM-based 3D printing process parameters affected the mechanical properties of pure PLA and biochar-reinforced PLA composites using machine learning and explainable AI techniques. The key process parameters under investigation were biochar content (BC), layer thickness (LT), raster angle (RA), infill pattern (IP), and infill density. Mechanical testing was carried out on the 3D-printed test samples, and we measured the ultimate tensile (UTS), flexural (FS), and impact (IS) strengths. The XGBoost (XGB) algorithm was used to build the prediction model. The results demonstrate the superiority of the XGBoost algorithm, with a coefficient of determination value of 0.96 used for UTS. Three explainable AI (XAI) techniques, namely, SHAP, LIME, and Partial Dependence Plots (PDPs), were utilized to provide insights into the interaction of the process parameters with the various mechanical strengths. The results of XAI are summarized as follows:
  • All features are positively correlated, but ID is the most significant parameter, as illustrated by the SHAP mean plot of the XGB.
  • A density of 80% resulted in increased mechanical strength while still saving on material quantity.
  • In contrast to the literature, this study suggests that 0.3 mm of LT improves the UTS and FS values.
  • Based on the PDP analysis, it can be said that a 30° raster angle is optimum for enhancing the mechanical strengths.
  • The influence of BC was most dominant for IS, and 3% BC resulted in maximum UTS.
  • SHAP and PDP reveal that IP has a negligible impact on the mechanical strength of the 3D-printed specimens.
  • As the relationship between features and the target variable is complex and nonlinear, boosting ML models such as XGB can capture these relationships better than linear models.
  • To enhance mechanical properties of 3D-printed parts, this study suggests that the optimum process parameters are as follows: 0.3 mm LT, 1–3% BC, 30° RA, 80% ID and Octate IP.
This study was limited to specific process parameters; in the future, the impact of additional process parameters like nozzle temperature will need to be explored. The dataset used for machine learning was relatively small; hence, the result limits generalization. Overall, this study emphasizes the potential for combining machine learning and explainable AI techniques to optimize and understand the impacts of process parameters on the mechanical properties of 3D-printed composites.

Author Contributions

Conceptualization, N.K. and P.A.; methodology, N.K. and P.A.; software, N.K. and P.A.; validation, N.K., P.A. and M.A.; formal analysis, N.K. and P.A.; investigation, N.K. and P.A.; resources, M.A. and P.A.; data curation, N.K.; writing—original draft preparation, N.K. and P.A.; writing—review and editing, M.A. and A.K.; visualization, N.K.; supervision, M.A. and A.K.; funding acquisition, M.A. All authors have read and agreed to the published version of the manuscript.

Funding

This research received no external funding.

Data Availability Statement

Data are contained within the article.

Acknowledgments

This research was supported by the “University of Debrecen Program for Scientific Publication”.

Conflicts of Interest

The authors declare no conflicts of interest.

References

  1. Almeida, V.H.M.; Jesus, R.M.; Santana, G.M.; Pereira, T.B. Polylactic Acid Polymer Matrix (Pla) Biocomposites with Plant Fibers for Manufacturing 3D Printing Filaments: A Review. J. Compos. Sci. 2024, 8, 67. [Google Scholar] [CrossRef]
  2. Paramatti, M.; Romani, A.; Pugliese, G.; Levi, M. PLA Feedstock Filled with Spent Coffee Grounds for New Product Applications with Large-Format Material Extrusion Additive Manufacturing. ACS Omega 2024, 9, 6423–6431. [Google Scholar] [CrossRef]
  3. Zhang, S.; Meng, X.; Bhagia, S.; Ji, A.; Dean Smith, M.; Wang, Y.; Liu, B.; Yoo, C.G.; Harper, D.P.; Ragauskas, A.J. 3D Printed Lignin/Polymer Composite with Enhanced Mechanical and Anti-Thermal-Aging Performance. Chem. Eng. J. 2024, 481, 148449. [Google Scholar] [CrossRef]
  4. Mosi, G.; Ikua, B.W.; Kabini, S.K.; Mwangi, J.W. Characterization and Modeling of Mechanical Properties of Additively Manufactured Coconut Fiber-Reinforced Polypropylene Composites. Adv. Mater. Phys. Chem. 2024, 14, 95–112. [Google Scholar] [CrossRef]
  5. Anerao, P.; Kulkarni, A.; Munde, Y. A Review on Exploration of the Mechanical Characteristics of 3D-Printed Biocomposites Fabricated by Fused Deposition Modelling (FDM). Rapid Prototyp. J. 2023, 30, 430–440. [Google Scholar] [CrossRef]
  6. Anerao, P.; Kulkarni, A.; Munde, Y.; Shinde, A.; Das, O. Biochar Reinforced PLA Composite for Fused Deposition Modelling (FDM): A Parametric Study on Mechanical Performance. Compos. Part C Open Access 2023, 12, 100406. [Google Scholar] [CrossRef]
  7. Rendas, P.; Figueiredo, L.; Cláudio, R.; Vidal, C.; Soares, B. Investigating the Effects of Printing Temperatures and Deposition on the Compressive Properties and Density of 3D Printed Polyetheretherketone. Prog. Addit. Manuf. 2023, 1–17. [Google Scholar] [CrossRef]
  8. Ahmad, M.N.; Ishak, M.R.; Mohammad Taha, M.; Mustapha, F.; Leman, Z. Irianto Mechanical, Thermal and Physical Characteristics of Oil Palm (Elaeis guineensis) Fiber Reinforced Thermoplastic Composites for FDM—Type 3D Printer. Polym. Test. 2023, 120, 107972. [Google Scholar] [CrossRef]
  9. Fisher, T.; Almeida, J.H.S., Jr.; Falzon, B.G.; Kazancı, Z. Tension and Compression Properties of 3D-Printed Composites: Print Orientation and Strain Rate Effects. Polymers 2023, 15, 1708. [Google Scholar] [CrossRef]
  10. Mishra, A.; Jatti, V.S.; Messele Sefene, E.; Jatti, A.V.; Sisay, A.D.; Khedkar, N.K.; Salunkhe, S.; Pagáč, M.; Abouel Nasr, E.S. Machine Learning-Assisted Pattern Recognition Algorithms for Estimating Ultimate Tensile Strength in Fused Deposition Modelled Polylactic Acid Specimens. Mater. Technol. 2024, 39. [Google Scholar] [CrossRef]
  11. Deb, J.B.; Chowdhury, S.; Ali, N.M. An Investigation of the Ensemble Machine Learning Techniques for Predicting Mechanical Properties of Printed Parts in Additive Manufacturing. Decis. Anal. J. 2024, 12, 100492. [Google Scholar] [CrossRef]
  12. Kellner, L.; Stender, M.; Polach, F.; von Bock und Polach, B.; Ehlers, S. Predicting Compressive Strength and Behavior of Ice and Analyzing Feature Importance with Explainable Machine Learning Models. Ocean Eng. 2022, 255, 111396. [Google Scholar] [CrossRef]
  13. Hrnjica, B.; Softic, S. Explainable AI in Manufacturing: A Predictive Maintenance Case Study. In Advances in Production Management Systems. Towards Smart and Digital Manufacturing; IFIP Advances in Information and Communication Technology; Springer: Cham, Switzerland, 2020; Volume 592, pp. 66–73. [Google Scholar] [CrossRef]
  14. Gawde, S.; Patil, S.; Kumar, S.; Kamat, P.; Kotecha, K.; Alfarhood, S. Explainable Predictive Maintenance of Rotating Machines Using LIME, SHAP, PDP, ICE. IEEE Access 2024, 12, 29345–29361. [Google Scholar] [CrossRef]
  15. Nasiri, H.; Homafar, A.; Chelgani, S.C. Prediction of Uniaxial Compressive Strength and Modulus of Elasticity for Travertine Samples Using an Explainable Artificial Intelligence. Results Geophys. Sci. 2021, 8, 100034. [Google Scholar] [CrossRef]
  16. Mishra, A.; Jatti, V.S.; Sefene, E.M.; Paliwal, S. Explainable Artificial Intelligence (XAI) and Supervised Machine Learning-Based Algorithms for Prediction of Surface Roughness of Additively Manufactured Polylactic Acid (PLA) Specimens. Appl. Mech. 2023, 4, 668–698. [Google Scholar] [CrossRef]
  17. Thapaliya, S.; Valilai, O.F.; Wicaksono, H. Power Consumption and Processing Time Estimation of CNC Machines Using Explainable Artificial Intelligence (XAI). Procedia Comput. Sci. 2024, 232, 861–870. [Google Scholar] [CrossRef]
  18. Shaikh, A.S.; Samant, R.M.; Patil, K.S.; Patil, N.R.; Mirkale, A.R. Review on Explainable AI by Using LIME and SHAP Models for Healthcare Domain. Int. J. Comput. Appl. 2023, 185, 18–23. [Google Scholar] [CrossRef]
  19. Ribeiro, M.T.; Singh, S.; Guestrin, C. “Why Should I Trust You?”. In Proceedings of the 22nd ACM SIGKDD International Conference on Knowledge Discovery and Data Mining, San Francisco, CA, USA, 13–17 August 2016; ACM: New York, NY, USA, 2016; pp. 1135–1144. [Google Scholar]
  20. Salih, A.M.; Raisi-Estabragh, Z.; Galazzo, I.B.; Radeva, P.; Petersen, S.E.; Lekadir, K.; Menegaz, G. A Perspective on Explainable Artificial Intelligence Methods: SHAP and LIME. Adv. Intell. Syst. 2024, 2400304. [Google Scholar] [CrossRef]
  21. Friedman, J.H. Greedy Function Approximation: A Gradient Boosting Machine. Ann. Stat. 2001, 29, 1189–1232. [Google Scholar] [CrossRef]
  22. Goldstein, A.; Kapelner, A.; Bleich, J.; Pitkin, E. Peeking Inside the Black Box: Visualizing Statistical Learning With Plots of Individual Conditional Expectation. J. Comput. Graph. Stat. 2015, 24, 44–65. [Google Scholar] [CrossRef]
  23. Kuznetsov, V.; Solonin, A.; Urzhumtsev, O.; Schilling, R.; Tavitov, A. Strength of PLA Components Fabricated with Fused Deposition Technology Using a Desktop 3D Printer as a Function of Geometrical Parameters of the Process. Polymers 2018, 10, 313. [Google Scholar] [CrossRef] [PubMed]
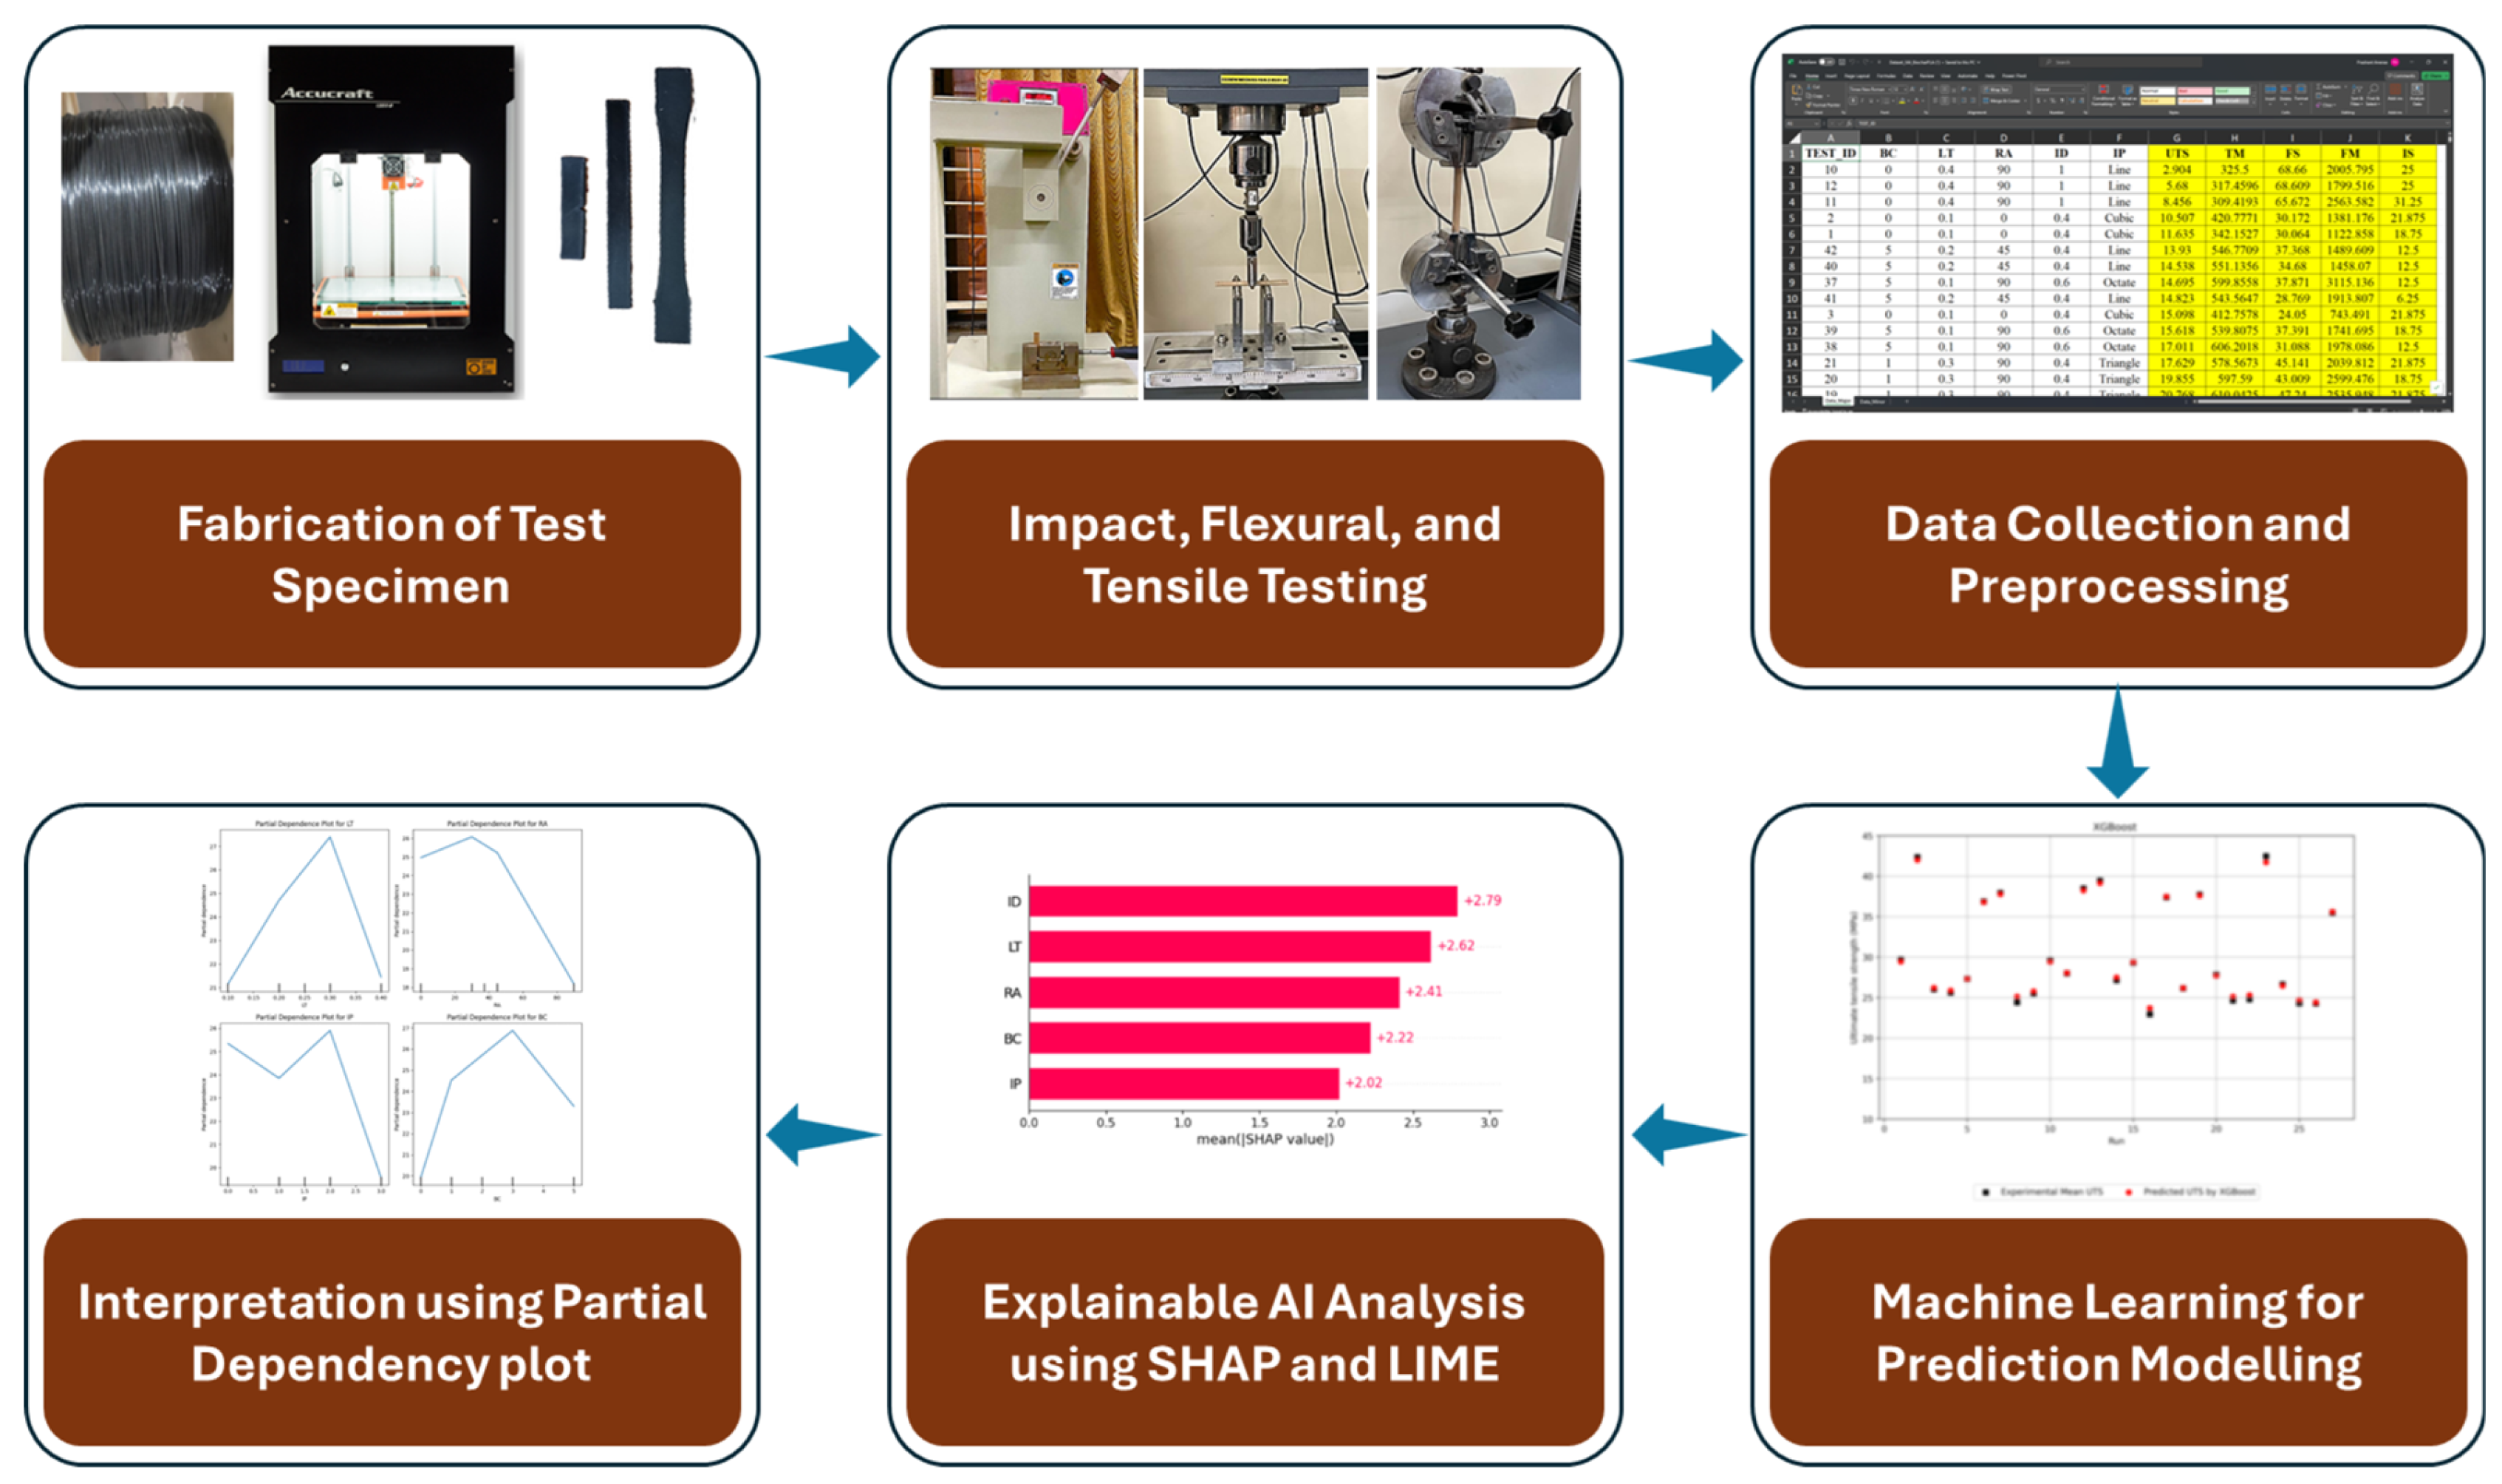
Figure 1. The framework outlines the steps in the implementation of explainable AI for the present research work.
Jmmp 08 00171 g001
Figure 2. Standards and dimensions used for tensile, flexural, and impact tests of FDM-based 3D printed specimens.
Jmmp 08 00171 g002
Figure 3. SHAP value’s impact on (a) UTS, (b) FS and (c) IS.
Jmmp 08 00171 g003
Figure 4. Variable importance of XGBoost model based on training set for (a) UTS, (b) FS and (c) IS.
Jmmp 08 00171 g004
Figure 5. LIME explanation plot for (a) UTS, (b) FS and (c) IS.
Jmmp 08 00171 g005
Figure 6. Partial dependence plot for (a) UTS, (b) FS, and (c) IS.
Jmmp 08 00171 g006
Table 1. FDM 3D-printing process parameters and corresponding settings.
Process ParameterFDM Settings
Nozzle temperature210 °C
Bed temperature50 °C
Printing speed60 mm/s
LT0.1 mm, 0.2 mm, 0.3 mm and 0.4 mm
RA0°, 30°, 45° and 90°
ID0.4, 0.6, 0.8, and 1
IPcubic, triangle, octet, and line
Nozzle temperature210 °C
Table 2. Experimental parameters, measured tensile, flexural, and impact strengths, and XGBoost model predictions for 3D-printed specimens.
RunBC
(%)
LT
(mm)
RA
(°)
IDIPExperimental UTS (MPa)Predicted UTS
(MPa)
Experimental
FS (MPa)
Predicted
FS (MPa)
Experimental IS (KJ/m2)Predicted
IS (KJ/m2)
ML Data Category
1.100.100.4Cubic11.6412.5730.0628.0418.7521.21Train
1.200.100.4Cubic10.5112.5730.1728.0421.8821.21Train
1.300.100.4Cubic15.1012.5724.0528.0421.8821.21Train
2.100.2300.6Triangle21.9722.5353.6552.6725.0024.64Train
2.200.2300.6Triangle22.8322.5351.8452.6725.0024.64Train
2.300.2300.6Triangle23.4522.5352.6652.6725.0024.64Test
3.100.3450.8Octate30.2131.6862.8664.9025.0025.51Train
3.200.3450.8Octate33.9831.6866.9864.9025.0025.51Train
3.300.3450.8Octate31.4231.6867.9264.9025.0025.51Test
4.100.4901Line5.686.1768.6167.6125.0027.16Train
4.200.4901Line2.906.1768.6667.6125.0027.16Train
4.300.4901Line8.466.1765.6767.6131.2527.16Train
5.110.1300.8Line20.8522.4351.6451.2637.5036.60Train
5.210.1300.8Line22.5522.4350.0851.2637.5036.60Train
5.310.1300.8Line23.7122.4351.9051.2637.5036.60Train
6.110.201Octate32.6833.0359.1459.5831.2531.35Train
6.210.201Octate32.9033.0357.6859.5831.2531.35Train
6.310.201Octate33.8133.0361.5259.5831.2531.35Train
7.110.3900.4Triangle17.6319.1045.1444.4021.8820.24Train
7.210.3900.4Triangle19.8619.1043.0144.4018.7520.24Train
7.310.3900.4Triangle20.7719.1047.2444.4021.8820.24Test
8.110.4450.6Cubic24.4126.1347.0445.2125.0022.70Train
8.210.4450.6Cubic26.7526.1345.4145.2125.0022.70Train
8.310.4450.6Cubic27.7526.1343.2945.2118.7522.70Train
9.130.1451Triangle29.4229.9256.1256.5831.2530.90Train
9.230.1451Triangle29.7129.9256.7656.5831.2530.90Train
9.330.1451Triangle27.4929.9257.3556.5831.2530.90Test
10.130.2900.8Cubic30.7828.2357.6359.3225.0025.30Train
10.230.2900.8Cubic26.3228.2360.8959.3225.0025.30Train
10.330.2900.8Cubic31.1628.2361.0759.3225.0025.30Test
11.130.300.6Line31.7429.5559.3657.7325.0025.15Train
11.230.300.6Line34.0829.5559.8157.7325.0025.15Test
11.330.300.6Line26.2229.5564.1657.7318.7525.15Test
12.130.4300.4Octate26.0425.7051.1450.7018.7522.78Train
12.230.4300.4Octate25.6125.7052.1950.7025.0022.78Train
12.330.4300.4Octate26.5425.7049.9850.7025.0022.78Train
13.150.1900.6Octate14.7015.5237.8735.0212.5014.86Train
13.250.1900.6Octate15.6215.5237.3935.0218.7514.86Train
13.350.1900.6Octate17.0115.5231.0935.0212.5014.86Train
14.150.2450.4Line14.5416.4734.6837.4912.5013.57Train
14.250.2450.4Line13.9316.4737.3737.4912.5013.57Test
14.350.2450.4Line14.8216.4728.7737.496.2513.57Test
15.150.3301Cubic33.5734.9658.0963.0418.7518.02Train
15.250.3301Cubic34.9134.9666.7263.0421.8818.02Train
15.350.3301Cubic36.9534.9666.1563.0412.5018.02Train
16.150.400.8Triangle23.7823.8141.1841.7625.0021.39Train
16.250.400.8Triangle22.6923.8140.2041.7618.7521.39Train
16.350.400.8Triangle22.2723.8135.7841.7612.5021.39Test
Table 3. Understanding the relationship between conditions and material properties through LIME analysis.
ConditionUTS LIME ValueFS LIME ValueIS LIME Value
LT ≤ 0.30+1.65−0.4+1.53
LT > 0.30−1.53+0.67−1.40
BC ≤ 3.00+1.12+2.12+1.12
BC > 3.00−0.94−2.25−1.14
RA ≤ 30.00−0.38−2.10−0.25
RA > 30.00+0.33+1.90+0.43
ID ≤ 0.80−5.38−13.04−4.80
ID > 0.80+5.42+13.24+4.74
IP ≤ 2.00+1.84−4.57−0.97
IP > 2.00−1.77+4.69+1.07
Table 4. Optimum process parameters resulted from PDP.
LTRAIDIPBC
UTS0.3 mm30°80%Octate3%
FS0.3 mm30°100%Octate0%
IS0.1 mm30°80%Line1%
Disclaimer/Publisher’s Note: The statements, opinions and data contained in all publications are solely those of the individual author(s) and contributor(s) and not of MDPI and/or the editor(s). MDPI and/or the editor(s) disclaim responsibility for any injury to people or property resulting from any ideas, methods, instructions or products referred to in the content.