Abstract
The additive manufacturing technology powder bed fusion of metal with a laser beam (PBF-LB/M) is industrially established for tool-free production of complex and individualized components and products. While the in-processing is based on a layer-by-layer build-up of material, both upstream and downstream process steps (pre-processing and post-processing) are necessary for demand-oriented production. However, there are increasing concerns in the industry about the efficient and economical implementation and validation of the PBF-LB/M. Individual products for mass personalization pose a particular challenge, as they are subject to sophisticated risk management, especially in highly regulated sectors such as medical technology. Additive manufacturing using PBF-LB/M is a suitable technology but a complex one to master in this environment. A structured system for holistic decision-making concerning technical and economic feasibility, as well as quality and risk-oriented process management, is currently not available. In the context of this research, a framework is proposed that demonstrates the essential steps for the systematic implementation and validation of PBF-LB/M in two structured phases. The intention is to make process-related key performance indicators such as part accuracy, surface finish, mechanical properties, and production efficiency controllable and ensure reliable product manufacturing. The framework is then visualized and evaluated using a practice-oriented case study environment.
1. Introduction
For a long time, additive manufacturing (AM) was seen as the technology of the future that would enable the next industrial revolution [1]. Almost unlimited freedom of design, economical manufacturing of small lot sizes, and short lead times are achieved through tool-free and cost-efficient production with independence from forging or casting, which are the ideal prerequisites for mass personalization production [1,2,3]. However, AM is now considered a traditional manufacturing technology [4], despite reservations and hurdles to implementing AM, which are still evident in many sectors and hampering further industrialization. Erenstone states that AM is moving beyond recent limitations as the field seems to be advancing at a sustainable rate [5]. In addition to structured technology analysis for implementation, it is essential to obtain qualification and certification for the cross-sector realization of production and technology diffusion into a wide range of applications [6].
1.1. Motivation
Point-by-point and layer-by-layer production brings several product benefits but also additional challenges for quality assurance [7]. In some AM technologies, over 100 process parameters influence material and part properties [8]. Particularly for products in medical technology, it is a major challenge to manufacture a safe product for commercial sale [9]. This is why many approaches in research and application are based on predictive engineering [9]. Knowing that there is no risk-free product, it is about ensuring that the best efforts have been made to offer an adequately safe product where the benefits outweigh the risks [9]. Predominantly in highly innovative fields, inadequate risk management can be attributed to the methods used or document-based approaches [10]. Another reason for the use of AM is the trend toward personalized products with a large number of variants and high quantities [11].
A special focus of previous research lies in the development of new processes and materials for AM [12], whereas less research is being conducted into the systematic implementation and validation of the AM process chain. Due to the cost structure of AM in small quantities, mass personalized products can be manufactured economically, such as those in demand in medical technology for customer-specific personalization on the human body [13,14,15]. Mass personalization production for medical devices refers to manufacturing medical equipment and devices tailored to individual patient needs [16]. However, the parallel AM of multiple individualized products poses special challenges in process control for the production of standard-compliant products. In particular, the powder bed fusion of metal with the laser beam (PBF-LB/M) process poses considerable challenges, such as thermal stresses, porosity, cracks, surface defects, and microstructural heterogeneity [17,18]. The structured and partially concurrent implementation and validation in coordinated individual steps provide the advantages of cost-efficient and rapid production and distribution of AM products.
1.2. Objective and Structure
For the reasons outlined in Section 1.1, this paper proposes a holistic framework for the implementation and validation of AM in the production process chain of manufacturing companies for mass personalization products. To compensate for a scarcity of financial, personnel, or time resources, small and medium-sized enterprises, in particular, require systematic approaches [19].
PBF-LB/M is considered to be the most widely used metal-based AM technology [20,21,22]. In addition, this technology is preferred for the production of medical technology products, where there is considerable pressure on risk management. The manufacturing of mass personalization products involves additional challenges for risk management, as only a few methods are applicable in scenarios with difficult access to data. Due to the cost structure of the PBF-LB/M, efficient and rapid implementation is particularly important in cost-driven industries. For this reason, both implementation and validation must be considered in parallel and approached holistically.
The objective of this paper is to explore and expand the state of scientific knowledge and to focus on practical guidance in this subject area. For this purpose, the state of the art in AM is reviewed, risk management approaches are discussed, and the special status of individual products is outlined. The framework for implementation and validation is then successively introduced before being tested on a laboratory scale. The results are discussed and objectively evaluated. Finally, a summary with the key takeaways is provided, and an outlook for future research work is drawn up.
2. State of the Art
2.1. Additive Manufacturing Process Chain
In addition to the development of a large number of AM technologies, immense progress has been made in the development of technologies, equipment, and materials for AM [23,24,25]. The various technologies are all based on the layer-by-layer principle but differ, e.g., in the raw material, the process sequence, and the final state of the products. For industrialization, the key characteristics are manufacturing precision (e.g., shape and dimensional accuracy, surface quality), build volume, and process speed [23,26]. Almost every AM technology defines the process parameters of the following three stages: pre-processing, in-processing, and post-processing [27]. The process parameters of the pre-process are defined in the in-processing via a slicing program and can include, e.g., geometry, wall thickness, material provision, and machine maintenance [27,28]. The in-processing parameters recorded in the slicing program define the printing speed, component orientation, layer height, infill density, and temperatures, among others [27,29]. After the actual AM process, mechanical, chemical, or thermal technologies are used in post-processing to modify component properties [24,27,30,31].
One of the major potentials of AM is the production of complex, individualized components into which functions can be integrated [2,32]. Unlike conventional manufacturing processes, no specific tools are required to produce several individualized products in one build job. AM can be used in decentralized production networks, with short delivery routes positively affecting transport costs and the risk of supply bottlenecks [2,33,34]. This makes it possible to increase the resilience of value-creation systems through AM [2,35].
In PBF-LB/M, a large number of manual and complex process steps (see Figure 1) with a low degree of automation are required to manufacture products [3]. The PBF-LB/M process works with a laser that selectively melts a metal powder in a powder bed [36]. This creates a melt pool that solidifies and forms a single layer [23]. Despite the freedom in the geometric design for complex features, process qualification deters wider adoption [8].

Figure 1.
Exemplary visualization of the PBF-LB/M process chain [3].
2.2. Technical Risk Management in AM Production Processes
In the literature, various definitions of risk, sometimes also referred to as consequence, can be found. The definitions typically differ regarding their scope and perspective [37,38,39,40]. The International Organization for Standardization (ISO) 31000, for example, states that any effect deviating from the expected result is to be considered a risk. Therefore, the term risk itself includes positive and negative impacts on the observed object [38]. In contrast, ISO 14971 clearly defines risk as a negative impact and a combination of the likelihood of its occurrence and its severity [37]. While the definition of risk differs, the definition of risk management is similar in the literature and mostly varies in its level of detail. It is described as a systematic order of actions to handle risk within an organization [37,38]. Different industries apply different standards for risk management. The focus of the present paper is on the production of medical products. For details on risk management in the automotive sector, International Automotive Task Force IATF 16949 can be viewed [41]. The standard for industry-independent risk management can be found in ISO 31000 [38]. While the above-mentioned standards focus on risk management in specific industries, ISO ASTM 52920 describes qualification principles in the AM sector and offers a more holistic approach. Yet the risk management section of this standard refers to ISO 14971 and ISO 31000 and does not offer additional methods and tools [42]. ISO 14971 describes the standard for risk management in the medical product industry. Accordingly, risk management consists of six main steps. As shown in Figure 2, the first two steps of risk analysis and risk evaluation are summarized as risk assessment. After the successful risk assessment, risk control, the evaluation of overall residual risk, risk management review, and production and post-production activities are to be carried out [37].
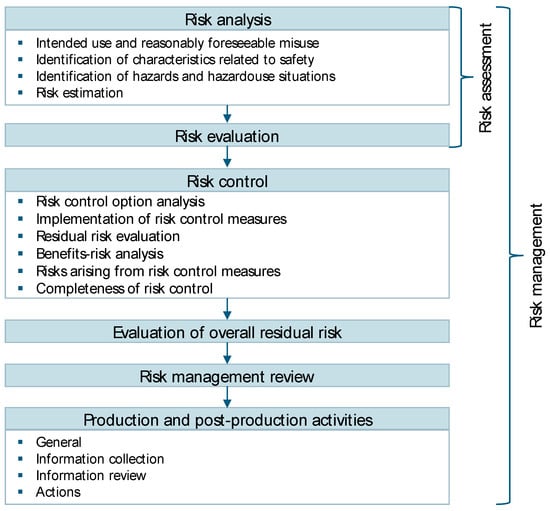
Figure 2.
Risk management process for medical products [37].
Additionally, manufacturers can use guideline ISO/Technical Report (TR) 24971 to implement an ISO 14971-compliant risk management process [39]. In the following, each step of risk management according to ISO 14971, as well as common methods used during the steps, are described.
Manufacturers of medical products are required to implement a process to perform a risk analysis. This process has to include the definition of the intended use as well as the so-called reasonably foreseeable misuse of the product and the analysis of these regarding potential hazards. Safety-related specifications for the product are to be defined [37]. ISO/TR 24971 offers several questions that can be used to determine the product’s requirements regarding its safety. In addition, the guideline lists the following methods that may be used to run a risk analysis [39]:
- Preliminary Hazard Analysis (PHA);
- Fault Tree Analysis (FTA);
- Event Tree Analysis (ETA);
- Failure Mode and Effects Analysis (FMEA);
- Hazard and Operability Study (HAZOP);
- Hazard Analysis and Critical Control Point (HACCP).
Not all these methods cover the entire process of a risk analysis and, therefore, should be viewed as support tools. Manufacturers of medical products are not limited to these methods, as stated in the guideline. As shown by Hunter, Neil, and Fenton, Bayesian Networks offer an alternative to the above-mentioned methods. Yet, further research is necessary to validate the proposed use of Bayesian Networks in this context [43].
An acceptable risk has to be determined before the risk evaluation can be performed. Afterward, the previously analyzed risk is compared to the acceptable risk. For additional information, ISO/TR 24971, which offers a framework to establish criteria for risk acceptability, can be viewed [39].
The risk control step contains several sub-steps, as seen above in Figure 2. First, risk control options need to be analyzed. The guideline separates between risk control options for the design and the manufacturing process. In addition to this, the FMEA method, the HACCP method, and international standards like the International Electrotechnical Commission IEC 60601-1 are mentioned and explained [44]. Once the risk control options have been analyzed, the selected options have to be implemented and their effectiveness verified. To verify the effectiveness of risk control options in the design, testing the product with users can be necessary. The guideline refers to several standards for the testing of medical products, such as ISO 14155 [39], all of which need to be documented in the risk management plan. After the implementation of all risk control options, the residual risk needs to be evaluated using the same method and criteria used for the initial risks, and a benefit–risk analysis has to be conducted. According to ISO 14791, the benefit–risk analysis may only be used to compare the residual use and technical risks with the benefits for users of the product. Economic benefits are explicitly excluded from this analysis [37,39]. ISO/TR 24971 offers a guideline and examples for the benefit–risk analysis. As the final steps of risk control, the risk resulting from risk control measures needs to be evaluated, and the previously conducted actions need to be checked for their completeness. The risk emerging from risk control measures can be determined by updating the risk analysis [39].
According to ISO 14971, manufacturers have to evaluate the overall residual risk [37]. The standard also states that the criteria for accepting the overall residual risk need to be indicated in the risk management plan, as well as the method used to determine the overall residual risk. ISO/TR 24971 offers a variety of methods for the overall residual risk evaluation, such as FTA and ETA [39]. Afterward, the risk management needs to be reviewed, and pre-, in-, and post-production process steps need to be conducted. In this context, post-market surveillance (PMS) should be mentioned, which refers to the monitoring and evaluation of medical products after they have been placed on the market. PMS aims to identify potential risks and undesirable side-effects so that they can be iteratively fed back into the risk management process to re-evaluate the benefit–risk ratio of the product and, if necessary, incorporate mitigation measures. For the latter, the guideline offers approaches to gather relevant data and information as well as questions to review the gathered information. Furthermore, actions for events like hazardous situations are provided [39].
2.3. Special Features with Individual Products and Mass Personalization
One key trend in industrial manufacturing is personalization, in which manufacturing technologies are combined with user information to create products [45]. These customer benefits can generate competitive advantages, which is why companies are strategically aligning themselves accordingly [45]. Due to technological advances in recent years, customization with customers choosing between different configurations has become popular, and the personalization of products has developed as a competitive factor. The technologies that enable the mass personalization of products include, for example, open software architectures along the supply chain and highly flexible manufacturing technologies such as AM [46,47]. In contrast to mass customization, mass personalization products are not only based on the configuration of the product by the customer but also on the customer creating their design, for example [46]. One way to differentiate between mass customization and mass personalization is to look at the target group. Mass personalization products are individual products precisely designed for the customer’s needs [47]. These products are aimed at a single customer at a time, while mass customization targets several customers at the same time due to its configuration options [47]. The trend of offering personalized products is not new. In fact, for the last two decades, companies have been offering mass personalization products [47]. These products include, for example, personalized t-shirt designs and personalized artwork in healthcare facilities [47]. To distinguish between mass production, mass customization, and mass personalization, Hu considers the four perspectives: production goal, desired product characteristics, customer role, and production system [46,48]. The summarized key differences can be viewed in Table 1.

Table 1.
Differentiation of mass production, mass customization, and personalized production [46,48].
AM is a technology with great potential for personalized products (see Section 2.1) [49,50]. In particular, the combination of 3D scanning, subsequent optimization, and rapid manufacturing opens up special added value for the production of customer-specific products [51]. Unlike traditional manufacturing processes, AM does not require any specific tools to manufacture or process steps to assemble the final part [52]. AM is particularly suitable for geometrically complex structures and individual adaptations, allowing products to be manufactured economically and irrespective of the quantity.
3. Approach and Methodology
3.1. Framework Overview
The described initial situation underscores the necessity for efficient and economical implementation and validation of AM for mass personalization products in medical technology. From an economic perspective, the success of a company hinges on its ability to accurately gauge the effort and the effects of implementing and validating AM. A structured W-model approach was developed to address this need, offering a path toward economic prosperity.
The W-model offers an easy-to-use method to examine the applicability of a product for AM. It combines suitable decision-making for product, technology, and material selection as well as methods for qualitative, production-orientated, and economic analyses. In addition to implementation, the fundamental steps of technical risk management and validation of the process chain are demonstrated.
The W-model consists of two consecutive V-models (see Figure 3), which can overlap in parts on a time axis and proceed in parallel. The first V-model contains the essential steps and considerations for implementing AM following Ilg [53]. The starting point is the interest of a company in AM products to check eligibility for the company’s product portfolio in the next step. This strategic decision forms the basis for the selection level, the technical adaptation, the AM of a prototype of the reference components, and the evaluation level. The transition from the first to the second V-model is the linking of a technology calendar (internal view) with the market/customer (external view). The second V-model provides a structured framework for the product and process development process, starting with a risk identification derived from the customer requirements. The key to a successful and structured V-development process is the implementation and iterative consideration of identified risks, both use-induced and technical, in the risk management process. If the product has been developed with sufficient reliability according to the specifications and meets customer requirements through qualification, verification, and validation, it can be approved for production. This approach is capable of having a significant impact on the quality prediction of product characteristics and minimizing the need for rework and re-production.

Figure 3.
W-model.
3.2. Phase 1: Implementation of AM in Production Process Chains
The core objective of the first V-model is the selection and evaluation of suitable products, technologies, and materials for planning the implementation of AM into the surrounding production system. Therefore, the starting point is the strategic decision to analyze and subsequently implement AM. Various standards provide guidance for the use of AM processes and, thus, for parts of the framework. VDI 3405 provides a general overview of AM, while DIN EN ISO/ASTM 52910 supports the design strategy and potential analysis, for example [54,55]. The holistic concept described in the following is closely orientated to Ilg’s preliminary considerations [53].
The first step of the selection level is to determine which products or product groups may be suitable for AM. For this purpose, the structure of the product portfolio should be disaggregated and subsumed into new categories: product groups for AM (PGfAM). To categorize products and components in PGfAM, they are evaluated according to requirement criteria, which in turn can be refined in sub-criteria. Criteria can vary depending on the industry and relate, for example, to technical requirements, costs, or times in development, procurement, production, or distribution. This procedure is typically structured as a matrix with a suitable rating scale. The aggregated values of the criteria in relation to a product/component identify the suitable PGfAM (see Figure 4).
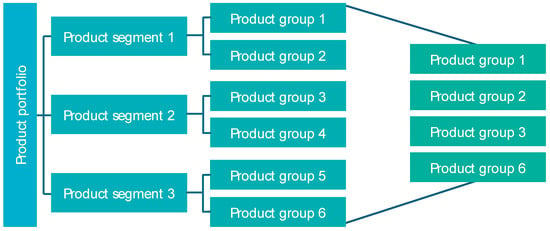
Figure 4.
Disaggregation and subsumtion into PGfAM.
After the components have been evaluated according to the criteria and categorized into criteria-specific product groups, the next step is to select components as case studies for closer analysis. The objective is to select components with the greatest possible potential benefits. A potential benefit is defined on a company-specific basis and can, for example, consist of the transferability of the analysis results to the largest possible number of other components. Other usual elements for analyzing the potential benefits are manufacturing costs, quantities, component complexity, throughput time, lightweight construction potential, component consolidation, and, particularly in the context of medical technology, individualization (see Figure 5). A utility value analysis can be used to calculate the benefit effect of an additively manufactured component and compare it using suitable visualization (e.g., network diagrams). Especially for companies that are new to AM, it has been shown that they should start with a small number of case studies.
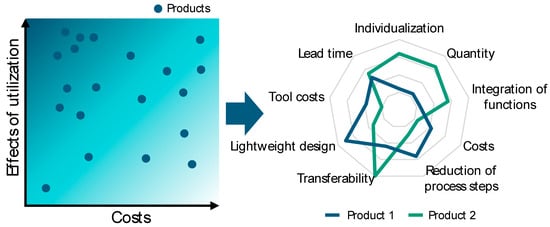
Figure 5.
Effect analysis and case study selection.
The next step is to analyze and select suitable materials and technologies for the components identified as case studies (see Figure 6). Whether the material or the technology is selected first depends on the requirements of the component. The various materials differ in terms of their properties, for example, in their tendency towards residual stresses and distortion. Complex geometries also depend heavily on the properties of the technologies, such as resolution and minimum wall thicknesses. Furthermore, the geometry leads to various challenges that must be taken into account when selecting materials and technologies and assessed depending on the requirements. In PBF-LB/M process-related thermal influences in combination with certain materials can cause stresses and distortion. A customer requirement could be, for example, the specification of a certain material in the component. In this case, the material is predetermined, and only technologies are considered that can process exactly this material. If the customer requirement consists of the fulfillment of certain requirements (e.g., mechanical properties, surface quality, biocompatibility), a technology and its post-processing methods that fulfill the requirements are selected first. Then, the material that can be ideally processed with this technology is selected. Both approaches are equally effective and run in individual cases in the same way. Ilg has prepared appropriate matrices for analyzing the suitability of the technologies and materials [53].
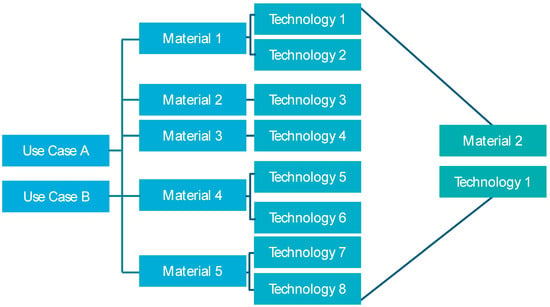
Figure 6.
Schematic selection of a suitable material-process-combination.
This concludes the selection level, and a transition step to the evaluation level begins. This is where the design of the component is optimized for AM, the process parameters are determined, and the entire process chain is configured. This transition step is necessary because the products are typically optimized for conventional production. Consequently, comparability is not given at this stage, as it results from the products optimized for the respective manufacturing processes. The step is completed by the physical realization of the component in the previously defined AM process chain. The steps of the evaluation level can be carried out based on this physically present component.
The evaluation level consists of the qualitative, production-related, and economic assessment of the case studies (see Figure 7). In the qualitative assessment, quality-relevant requirements for the components of the case studies are analyzed and evaluated for their degree of fulfillment (e.g., tolerances). The manufacturing technology evaluation analyses the additive process chain with regard to further optimization potential, e.g., the saving of post-processing steps by adjusting parameters in the in-process. The economic assessment of the production of the case studies is based on the manufacturing costs and the throughput time of the additive process chain.
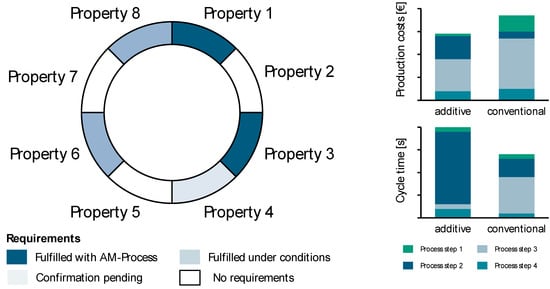
Figure 7.
Analysis of the valuation level.
The findings from the evaluation level are incorporated into the selection level through adjustments. As a result, some of these steps are repeated in a cycle of continuous improvement.
The final step of the first V-model summarizes the knowledge gained in a technology calendar, which includes the systematic synchronization of products and technologies over time (see Figure 8). This allows for deriving short-term optimization potential and recommendations for action as well as long-term development trends and strategies for application.
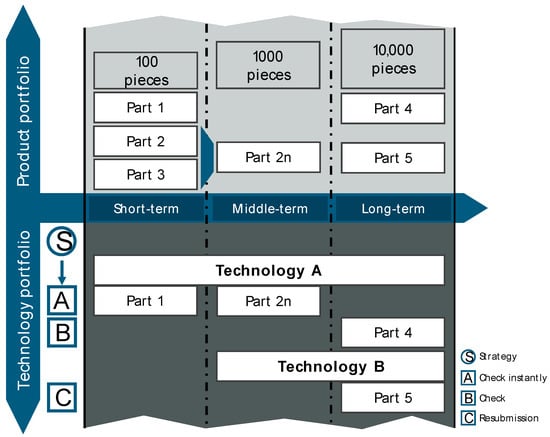
Figure 8.
Technology calendar.
Taking account of those assessments, a profound decision can be made on the question of whether a product or product group may or may not be suitable and profitable for AM in the production company.
3.3. Phase 2: Validation of AM in Production Process Chains
In addition to functional integration and the production of complex component structures, the special field of the W-model application is personalized production with lot size one (see Section 2.3). By analyzing all the cause-and-effect interactions between process parameters and process characteristics, this approach offers a significant advantage in ensuring the required quality in each process characteristic of the final product.
The second V-model provides a structured framework for the product and process development process (see Figure 9). Derived from the specified customer requirements from the market, the Hazard Identification for use-induced risks is carried out, in which potential risks associated with the product are identified. The User Requirements Specification (URS) defines the requirements of the product from the user’s perspective, while Design Input captures and documents these requirements. Subsequently, the requirements of the product are transferred to technical specification sheets. The requirements of the product and functional specifications form the basis for deriving technical risks. There is a regulatory requirement within medical technology to prepare evidence of a holistic risk management approach that provides evidence of a detailed consideration of technical risks from the design to the production process and control plan, as mentioned in Section 2. Compared to the given qualification principles by ISO ASTM 52920, the framework picks up on existing cross-industry approaches for implementation and validation and combines them in a process model [42]. The overall objective of a residual risk assessment of the product to be developed requires complete and traceable information on all use-induced and technical risks.
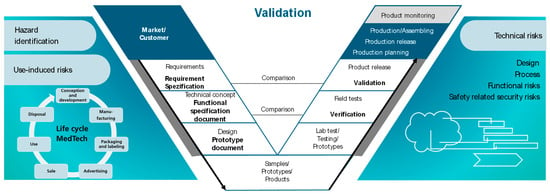
Figure 9.
V-model for the process and product development process [56].
Risk management plays a crucial role in identifying, evaluating, and mitigating technical risks throughout the product’s lifecycle [57]. Functional requirements enable product development to analyze design, prototypes, and product tests regarding the qualification that a system or product functions properly and delivers the expected results. In most cases, a qualification comprises an installation qualification (IQ), an operational qualification (OQ), and a performance qualification (PQ) [58]. The technical specification “Additive manufacturing—Qualification principles—Installation, operation and performance (IQ/OQ/PQ) of PBF-LB equipment” provides recommended practices for machine-related process qualification [59]. The six elements of process validation are process mapping, risk assessment, validation planning, installation qualification, operational qualification, and performance qualification. While the first three elements are outside the scope of this specific technical specification, it does not address risk management in the manner that is required to ensure the necessary level of quality assurance for strictly regulated branches. To fulfill the procedure model for a consistent, complete, and traceable risk management process for technical risks, design verification and validation are necessary to ensure that the product meets the functional requirements, which can be carried out by measuring certain properties (e.g., via the external shape of a product) as well as the user’s needs and the intended use in its environment.
To focus on the concept of quality-centered risk analysis of technical risks, there is a need to identify the product and process parameters as well as their cause–effect relationship (see Figure 10). A statement about the process’s capability of generating a product characteristic without testing can only be made if all process parameters are known to match congruent product characteristics per process step.
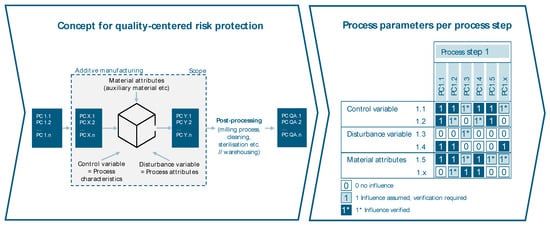
Figure 10.
Identification of cause–effect relationships of product and process parameters.
The process parameters are clustered into three categories: control variables, disturbance variables, and material attributes. Those parameters that can be actively adjusted or set are referred to as control variables. Disturbance variables can not be actively influenced, but their impact might be reduced by technological measures. A common example of a disturbance variable is the ambient temperature. Material attributes describe, for example, characteristics of the processed raw material, such as particle size distribution. Three different ratings are available for each cause–effect relationship between the relevant product characteristic and all process parameters. The ratings are “no influence”, “influence assumed, verification required”, and “influence verified”, while there is no weighting between those. A control variable rated with “no influence” has the same weight for the determination of the process capability as a variable rated with “influence verified” or “influence assumed, verification required”. Different sources, such as statistical analysis and literature reviews, can be used to determine the rating of each cause–effect relationship.
4. Verification
In this Section, the proposed methodology is executed using a case study from medical technology to test the individual steps and the approach in its entirety. To this end, the general circumstances of the case study are described, and the industry environment and technological realization are addressed. Following the description of the relevant background information on the testing procedure, the methodology is traced step by step, and the results are described.
4.1. Phase 1: Implementation of AM in Production Process Chains
In the examined company, the strategic decision was made to analyze the potential implementation of AM and to make a decision based on the findings. The case study is based on a real, industrially manufactured product from implant prosthetics in the dental industry. Due to confidentiality agreements, the first two steps, which are the results of the product portfolio screening and the component selection, cannot be presented in detail but correspond with the criteria set out in Figure 6.
The product analyzed in depth is an abutment for dental applications, which serves as a personalized connecting element between the dental implant and prosthesis. For this investigation, the design of the component was adapted based on confidentiality agreements. Due to the individuality of human dentition, the orientation of the teeth and, therefore, the angle of the abutment varies. Figure 11 shows the product with exemplary orientations of 60° (a), 75° (b), and 90° (c) for the denture.
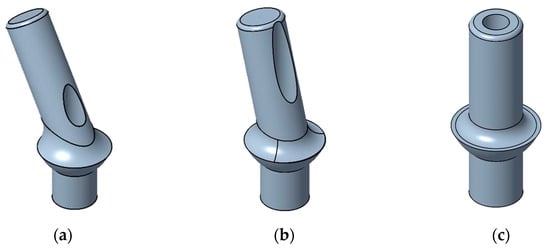
Figure 11.
Examples of the abutments designed for the case study: (a) abutment with orientation of 60°, (b) abutment with orientation of 75°, (c) abutment with orientation of 90°.
As the material for manufacturing the abutment is predetermined, the appropriate technology is selected to match the material. The titanium alloy TiAl6V4 is a common material in the field of dental medical technology and is also applied in conventional abutment manufacturing (see Figure 12) [60]. According to Tshephe et al., the AM technologies shown in Figure 12 are particularly suitable for this material [61].

Figure 12.
Material and technology analysis.
The available technologies are discussed in terms of their advantages and disadvantages in expert workshops, and technologies are selected grounded on in-depth technological knowledge.. Due to its demonstrated suitability for medical technology products (especially implants) and its potential for manufacturing the required mechanical properties and dimensional stability, the PBF-LB/M is used for further analysis [62,63]. If the analyses of the next steps show that this technology–material combination is not expedient, the relevant information is fed back for a second run of the subsequent steps.
In the next step, the design of the abutment is optimized for AM (see Figure 11), and the process chain is set up with all relevant pre-, in-, and post-processing production steps. The production process chain is strongly oriented towards the form described in Section 2.1.
The product is then manufactured in the predefined production process chain and subjected to assessments in terms of quality, production, and economic efficiency. Figure 13 shows the aggregated results—qualitative and manufacturing assessment (left diagram) as well as economic evaluation (right diagrams). The degree of fulfillment of the relevant quality characteristics achieved by the additive production technology ensures the technical feasibility of the product. In addition to technical feasibility, economic feasibility was assessed based on production costs and cycle time. This compares the entire process chain of AM with the process chain of conventional manufacturing in terms of the indicators relevant to the company.
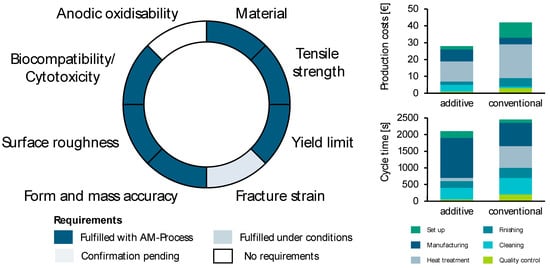
Figure 13.
Aggregated results for the qualitative, manufacturing, and economic evaluation of the case study.
All three analyses confirm the qualitative, manufacturing, and economic feasibility of the abutment produced by the PBF-LB/M process. Consequently, implementation is recommended and can be extended by the analysis results of other products and technologies.
In the final step, the implementation strategy is developed based on all results of previous analysis and visualized in the form of a technology calendar (see Figure 14). The implementation of the abutment should be checked instantly, and the first steps of validation (see Section 4.2) should be initiated. In addition to the abutment, three other products were analyzed in this case study. Two of these products can be consolidated into an assembly and additively manufactured as one product. The consolidated component is to be manufactured using the same material and technology, which means that the learning effects of the short-term additively manufactured abutment can be utilized. As a result, the implementation of AM for the abutment should take place within the next year, and the consolidated component is to follow in the next five years. For Component 3, production using a different AM technology, stereolithography, is the target. The implementation of this technology is planned for a long-term time horizon of seven years and should, therefore, be reviewed again (resubmission).
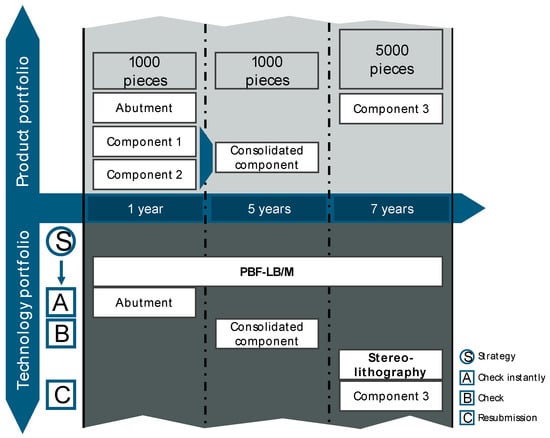
Figure 14.
Technology calendar for the considered case study.
4.2. Phase 2: Validation of AM in Production Process Chains
The product analyzed in this case study has several critical quality attributes (CQA). To determine these, the requirement specification was scrutinized. Among several CQAs, the angle between the base of the abutment and its body, as well as the roughness of the angled area, were chosen for the following in-depth analysis. After the determination of the relevant CQAs, all control variables, disturbance variables, and material attributes with a potential influence on the production of the CQAs were collected. For this step, a process walk-through on shopfloor level was conducted. The initial set of potentially relevant process parameters was determined during the walk-through. In several expert interviews, the initial set of parameters was reviewed and complimented. This approach led to a total of 28 potentially relevant process parameters clustered into the three categories, while two additional parameters of post-processing steps were found. Control variables include, for example, the laser power of the PBF-LB/M machine, the flow rate of the inert gas, and the set layer thickness. Disturbance variables include the degree of pollution of the optical protection glass and the ambient temperature. Material attributes, post-processing, and the design of the support structures, which is a control variable, are parameters that are considered out of scope for this research. Table 2 shows a selection of process parameters and their respective rating.

Table 2.
Analysis of relevant CQAs and process parameters.
For reasons of confidentiality, process data cannot be published in this case study; instead, the evaluation is based on accepted methods such as expert interviews and literature. Typical measurements of surface roughness (Appendix A), dimensional accuracy (Appendix B) in dependence of the angle, and the aggregated results (Appendix C) can be found in the appendices. Among several disturbance variables, the condition of the recoating blade during the processing time has a critical impact on the product attributes, especially the surface roughness. Hofmann et al. display the impact of a worn-out or damaged recoating blade on the surface of the component [78]. Therefore, the influence of this disturbance variable on the CQA is verified, which results in a score of two in Table 2. The influence of the configured laser power and the scanning speed received a score of two for their influence on each of the CQAs. Pacurar, Balc, and Prem show that among other control variables such as layer thickness and the temperature of the powder bed, the laser power and scanning speed have an impact on the accuracy of the process, which can lead to dimensional deviations of the component [72]. The impact of these control variables on the roughness of the surface has also been shown in the literature [68,70,71]. Therefore, it can be derived that there is a verified influence on the analyzed component. While the literature review has shown that several control and disturbance variables and their impact on different CQAs have already been verified, the influence of variables like the hatching distance on the angle between the base and the body of the component has yet to be verified. Therefore, Table 2 shows a score of one. Krauss conducts further studies on all key process parameters and examines their influence on quality characteristics. For example, he emphasizes the importance of heat dissipation in overhanging component areas [79]. Yavari et al. examine the porosity and microstructure [80].
Based on this procedure, targeted data can now be recorded to analyze the process capability of the system concerning the individual relevant process parameters. In addition, initial statements can be made about the extent of the influence of individual variables on the CQAs in the form of correlation analyses. Instead of analyzing every potential control and disturbance variable, the effort can be highly reduced by narrowing down the relevant variables.
5. Discussion of Results and Limitations
The industrial testing of the methodology described in Section 4 is subject to several limitations, as a complete validation of the methodology would go beyond the scope of a single publication. The methodology was initially developed for application in an industrial environment. Publication of company-specific data and results is only possible in part and under conditions of anonymization. This means that not all steps can be displayed in depth. However, valuable findings on applicability and potentially missing components can be drawn on this basis.
In the first phase, it was shown that the analysis results of the product portfolio screening could be used as a basis for selecting suitable components for AM. A suitable material–technology combination was identified based on the requirements for the component based on regulatory and customer-induced specifications. The subsequent explanations of the first and second phases focus on the selected case study. On the one hand, this allows the results of this case study to be discussed in more detail; on the other hand, verification of transferability through further case studies is pending. Although the effort required to set up the AM process chain for the comparative analyses of quality, manufacturing technology, and economic feasibility is comparatively high, this is the only way to obtain reliable data for deciding whether to implement the production or adapt the previous steps. By manufacturing the case study in the developed production process chain, it can be examined for economic analysis by recording the throughput time of the individual process steps (incl. pre- and post-processing) and assigning the corresponding costs. The production costs calculated can be supplemented by other cost types and compared with the process chain of conventional production. In the example case study, the production costs of AM are lower than those of conventional manufacturing, which means that implementation is recommended from an economic perspective, taking into account the cost types used. After production, the products can be examined for their requirements. The case study requires, among other things, tensile tests, examinations of micrographs, and examinations of surface roughness. In particular, technology-specific challenges such as thermal gradients, heat accumulation, and their effects on residual stresses and part distortion need to be considered in more detail (see, for example, [79,81,82]). Most requirements could be fulfilled directly or require a further post-processing step. This is the basis for the AM strategy for the next seven years, in which the implementation of the PBF-LB/M process chain is due in the short term.
Once the process chain is set up, the process steps are validated, starting with analyzing the process capability for each of the previously determined process variables and producing a standard product similar to the mass personalization products. After validating all variables and determining the nature of their impact on the CQAs, an in-depth analysis can be conducted. The objective of this analysis is to determine which adjustments of the CQAs can still be produced with the current process. In this way, a statement can be provided at an early stage for each related mass personalization product regarding the process capability for manufacturing a specification-compliant component. The small sample size of the measurements in Appendix A, Appendix B and Appendix C does not serve to prove statistical significance but merely to illustrate exemplary measurements. Statistical tests on individual CQAs were not carried out in the context of this case study, as the relevant literature is already available. Overall, the proposed framework in this paper offers a holistic approach to the implementation and validation of AM for mass personalization products within medical technology. Compared to the methods mentioned in ISO 14971, like FMEA or FTA, this approach provides answers to all required stages of the risk management process for medical devices [37]. Instead of choosing individual methods for each stage of the risk management process, one approach can be used to meet the requirements of standards.
6. Conclusions and Outlook
In summary, this paper provides insight into the structured and systematic implementation and validation of mass personalization products in medical technology. Supported by an approach model for a consistent, comprehensive, and traceable risk management process throughout the product lifecycle, the integration of the implementation and validation processes creates a holistic framework that ensures the effectiveness and compliance of mass personalization production for additively manufactured medical devices. The W-model provides an approach that already takes the validation steps into account when implementing the technology, which can reduce the validation process. The individual steps were explained and examined as examples in a case study. This has demonstrated that the approach works in an industrial context and allows efficient implementation and validation of AM in complex and highly regulated products. The basic design of the framework is structured to allow its flexible use. This applies, on the one hand, to the area of application and, on the other, to the expertise of the user. Individual steps can vary in terms of effort required depending on the preparatory work and available information/data. This, in turn, lowers the barriers to exploiting the potential of AM processes and enables diffusion into this sector. Due to the high variance in the product requirements and process parameters of different machines and technologies, this study did not aim to validate all elements. Therefore, the next step is to quantitatively validate the process characteristics (control and influencing variables) using statistical methods, computational models, and algorithms. To further increase efficiency in the implementation and validation of AM, automated analyses can be used to support various steps of the framework. Machine learning algorithms or simulations can be applied to prepare the tests, or multi-objective optimization approaches can be used to take into account the various requirements of the product when selecting materials and technologies in the implementation phase. Finally, the methodology is to be validated in a long-term study with a larger number of industrial application partners to assess the effectiveness of the model from a cost and time perspective.
Author Contributions
Conceptualization, H.G., S.O. and C.S.; methodology, H.G., S.O. and C.S.; validation, H.G. and S.O.; formal analysis, H.G.; investigation, H.G. and S.O.; data curation, H.G. and A.H.; writing—original draft preparation, H.G., S.O. and C.S.; writing—review and editing, C.S., A.H., A.S. and F.D.; visualization, H.G., S.O. and C.S. All authors have read and agreed to the published version of the manuscript.
Funding
This research received no external funding.
Data Availability Statement
The datasets presented in this article are not readily available due to confidentiality agreements. Requests to access the datasets should be directed to H.G.
Conflicts of Interest
The authors declare no conflicts of interest.
Appendix A
Three different angles of 60° (corresponds to 150° in the measuring product), 75° (corresponds to 165°), and 90° (corresponds to 180°) were used to carry out roughness measurements following ISO 4287/4288 [83,84]. For this purpose, the parts are measured enlarged 40 times with λc = 2.5 mm—divided into five sections and using a high-pass filter. The surface was analyzed using the profilometer VR5200 (Keyence Deutschland GmbH Neu-Isenbrug, Germany) with the measurement software VR-Series Viewer (Version 3.3.2.2337; Keyence Deutschland GmbH, Neu-Isenbrug, Germany) in combination with the VR-Series Analyzer (Version 3.3.3.282; Keyence Deutschland GmbH, Neu-Isenbrug, Germany). The example measurement of the 75°-component can be found in Figure A1.
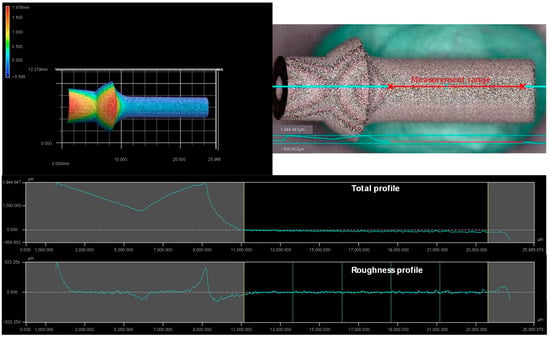
Figure A1.
Measurement results for surface roughness.
Appendix B
Analog to Appendix A, the example results for the dimensional stability of the 75° component are shown in Figure A2.
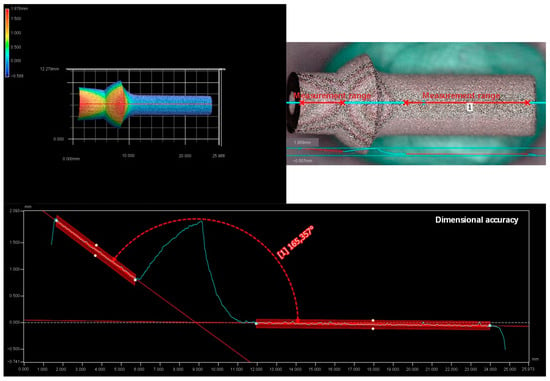
Figure A2.
Measurement results for dimensional accuracy.
Appendix C
Table A1 provides an overview of the manufacturing parameters used. Table A2 summarises the results of the sample measurements. As the focus of the case study is on the exemplary execution of the measurements, the sample size was limited to one per angle.

Table A1.
PBF-LB/M parameters.
Table A1.
PBF-LB/M parameters.
| Parameter | Value |
|---|---|
| Laser power | 119.25 W |
| Scan speed | 700 m/s |
| Laser spot diameter | 40.00 µm |
| Hatch distance | 50.00 µm |
| Layer thickness | 25.00 µm |
| Scan strategy | Bidirectional (ZigZag) |
| Shielding gas | Argon |

Table A2.
Summary of the results of the sample measurements.
References
- Meboldt, M.; Klahn, C. Industrializing Additive Manufacturing—Proceedings of Additive Manufacturing in Products and Applications—AMPA2017, 1st ed.; Springer International Publishing: Cham, Switzerland, 2018; ISBN 9783319668666. [Google Scholar]
- Groneberg, H.; Bock, T.; Doepper, F. Resilience in value creation systems through additive manufacturing: A decision model. Procedia Comput. Sci. 2023, 217, 296–305. [Google Scholar] [CrossRef]
- Groneberg, H.; Koller, J.; Mahr, A.; Döpper, F. Development of a systematic approach to identify non-value-adding operations in the LBM process chain. Procedia CIRP 2021, 104, 1613–1618. [Google Scholar] [CrossRef]
- Starodubova, A.; Iskhakova, D.; Gareeva, N. Efficiency of Business Models Based on Innovations (Additive Technologies) in a Circular Economy. In Challenges and Solutions in the Digital Economy and Finance: Proceedings of the 5th International Scientific Conference on Digital Economy and Finances (DEFIN 2022), St. Petersburg, 2022; Rumyantseva, A., Plotnikov, V., Minin, A.S., Anyigba, H., Eds.; Springer International Publishing: Cham, Switzerland, 2022; ISBN 9783031144103. [Google Scholar]
- Erenstone, J. 3D Printed Prostheses: The Path from Hype to Reality. Can. Prosthet. Orthot. J. 2023, 6, 4. [Google Scholar] [CrossRef] [PubMed]
- Chen, Z.; Han, C.; Gao, M.; Kandukuri, S.Y.; Zhou, K. A review on qualification and certification for metal additive manufacturing. Virtual Phys. Prototyp. 2022, 17, 382–405. [Google Scholar] [CrossRef]
- Bello, K.A.; Kanakana-Katumba, M.G.; Maladzhi, R.W. A Review of Additive Manufacturing Post-Treatment Techniques for Surface Quality Enhancement. Procedia CIRP 2023, 120, 404–409. [Google Scholar] [CrossRef]
- Jensen, S.C.; Carroll, J.D.; Pathare, P.R.; Saiz, D.J.; Pegues, J.W.; Boyce, B.L.; Jared, B.H.; Heiden, M.J. Long-term process stability in additive manufacturing. Addit. Manuf. 2023, 61, 103284. [Google Scholar] [CrossRef]
- Elahi, B. Safety Risk Management for Medical Devices, 2nd ed.; Academic Press: Amsterdam, The Netherlands, 2022; ISBN 9780323918237. [Google Scholar]
- Castaño Reyes, C.E. Ein modelbasierter Ansatz zur Verwirklichung eines Umfassenden Risikomanagements für Medizingeräte; RWTH Aachen University: Aachen, Germany, 2021. [Google Scholar]
- Rajamani, P.K.; Ageyeva, T.; Kovács, J.G. Personalized Mass Production by Hybridization of Additive Manufacturing and Injection Molding. Polymers 2021, 13, 309. [Google Scholar] [CrossRef] [PubMed]
- Mellor, S.; Hao, L.; Zhang, D. Additive manufacturing: A framework for implementation. Int. J. Prod. Econ. 2014, 149, 194–201. [Google Scholar] [CrossRef]
- Fritzsche, R.; Winter, S.; Lohmer, J. Logistik in Wissenschaft und Praxis; Springer Fachmedien Wiesbaden: Wiesbaden, Germany, 2021; ISBN 978-3-658-33479-6. [Google Scholar]
- Holmström, J.; Partanen, J.; Tuomi, J.; Walter, M. Rapid manufacturing in the spare parts supply chain. J. Manuf. Technol. Manag. 2010, 21, 687–697. [Google Scholar] [CrossRef]
- Mashhadi, A.R.; Esmaeilian, B.; Behdad, S. Impact of additive manufacturing adoption on future of supply chain. In Proceedings of the ASME 2015 International Manufacturing Science and Engineering, Charlotte, NC, USA, 8–12 June 2015. [Google Scholar] [CrossRef]
- Foith-Förster, P. Design of Matrix Production Systems for the Personalized Production of Mechatronic Machine Modules. Doctoral Dissertation, Universität Stuttgart, Stuttgart, Germany, 2023. [Google Scholar]
- Kleszczynski, S. Potenziale der Bildgestützten Prozessüberwachung zur Steigerung des Technologischen Reifegrades von Laser-Strahlschmelzverfahren. Doctoral Dissertation, Universität Duisburg-Essen, Duisburg, Germany, 2018. [Google Scholar]
- Martucci, A.; Aversa, A.; Lombardi, M. Ongoing Challenges of Laser-Based Powder Bed Fusion Processing of Al Alloys and Potential Solutions from the Literature—A Review. Materials 2023, 16, 1084. [Google Scholar] [CrossRef]
- Groneberg, H.; Schuh, C.; Steinhilper, R.; Doepper, F. Implementation of Methods for the Optimization of Processes and Production Systems: Catching the Mood of Small and Medium-sized German Enterprises. In Advances in Production Research; Schmitt, R., Schuh, G., Eds.; Springer International Publishing: Cham, Switzerland, 2019; ISBN 978-3-030-03450-4. [Google Scholar]
- Groneberg, H.; Horstkotte, R.; Pruemmer, M.; Bergs, T.; Döpper, F. Concept for the reduction of non-value-adding operations in Laser Powder Bed Fusion (L-PBF). Procedia CIRP 2022, 107, 344–349. [Google Scholar] [CrossRef]
- Gebhardt, A.; Kessler, J.; Thurn, L. 3D-Drucken: Grundlagen und Anwendungen des Additive Manufacturing (AM), 2., neu Bearbeitete und Erweiterte Auflage; Hanser: München, Germany, 2016; ISBN 9783446448452. [Google Scholar]
- Diniță, A.; Neacșa, A.; Portoacă, A.I.; Tănase, M.; Ilinca, C.N.; Ramadan, I.N. Additive Manufacturing Post-Processing Treatments, a Review with Emphasis on Mechanical Characteristics. Materials 2023, 16, 4610. [Google Scholar] [CrossRef] [PubMed]
- Dzemko, M.; Engelmann, B.; Hartmann, J.; Schmitt, J. Toward Shifted Production Strategies Through Additive Manufacturing: A Technology and Market Review for Changing Value Chains. Procedia CIRP 2019, 86, 228–233. [Google Scholar] [CrossRef]
- Kanishka, K.; Acherjee, B. Revolutionizing manufacturing: A comprehensive overview of additive manufacturing processes, materials, developments, and challenges. J. Manuf. Process. 2023, 107, 574–619. [Google Scholar] [CrossRef]
- Bhatia, A.; Sehgal, A.K. Additive manufacturing materials, methods and applications: A review. Mater. Today Proc. 2023, 81, 1060–1067. [Google Scholar] [CrossRef]
- Ituarte, I.F.; Coatanea, E.; Salmi, M.; Tuomi, J.; Partanen, J. Additive Manufacturing in Production: A Study Case Applying Technical Requirements. Phys. Procedia 2015, 78, 357–366. [Google Scholar] [CrossRef]
- Pollard, M.; Tran, P.; Dickens, T. Porosity Reducing Processing Stages of Additive Manufactured Molding (AMM) for Closed-Mold Composite Fabrication. Materials 2020, 13, 5328. [Google Scholar] [CrossRef] [PubMed]
- Kumar, R.; Kumar, M.; Chohan, J.S. Material-specific properties and applications of additive manufacturing techniques: A comprehensive review. Bull. Mater. Sci. 2021, 44, 181. [Google Scholar] [CrossRef]
- Spears, T.G.; Gold, S.A. In-process sensing in selective laser melting (SLM) additive manufacturing. Integr. Mater. Manuf. Innov. 2016, 5, 16–40. [Google Scholar] [CrossRef]
- Ge, J.; Pillay, S.; Ning, H. Post-Process Treatments for Additive-Manufactured Metallic Structures: A Comprehensive Review. J. Mater. Eng. Perform. 2023, 32, 7073–7122. [Google Scholar] [CrossRef]
- Peng, X.; Kong, L.; Fuh, J.Y.H.; Wang, H. A Review of Post-Processing Technologies in Additive Manufacturing. JMMP 2021, 5, 38. [Google Scholar] [CrossRef]
- Breuninger, J.; Becker, R.; Wolf, A.; Rommel, S.; Verl, A. Generative Fertigung mit Kunststoffen; Springer: Berlin/Heidelberg, Germany, 2013; ISBN 978-3-642-24324-0. [Google Scholar]
- Baldinger, M. Supply Chain Management für Additive Manufacturing: Konzepte, Werkzeuge und Prozesse für die Zusammenarbeit mit Dienstleistern zur Reduktion der Risiken beim Einstieg in Additive Manufacturing; ETH Library: Zürich, Germany, 2016. [Google Scholar]
- Feldmann, C.; Gorj, A. 3D-Druck und Lean Production, 1st ed.; Springer Fachmedien Wiesbaden: Wiesbaden, Germany, 2017; ISBN 978-3-658-18407-0. [Google Scholar]
- Molenda, P.; Groneberg, H.; Schötz, S.; Döpper, F. Resilience Balanced Scorecard: Measuring Resilience of Manufacturing Companies at Multiple Levels. Procedia CIRP 2023, 120, 189–194. [Google Scholar] [CrossRef]
- Park, M.; Venter, M.P.; Du Plessis, A. A lattice structure coupon sample for build quality control in metal additive manufacturing. Mater. Des. 2023, 235, 112436. [Google Scholar] [CrossRef]
- DIN EN ISO 14971; Medical Devices—Application of Risk Management to Medical Devices. Deutsches Institut für Normung e. V.: Berlin, Germany, 2022.
- DIN ISO 31000; Risk Management—Guidelines. Deutsches Institut für Normung e. V.: Berlin, Germany, 2018.
- ISO/TR 24971:2020; Medical Devices—Guidance on the Application of ISO 14971. Deutsches Institut für Normung e. V.: Berlin, Germany, 2020.
- Modarres, M. Risk Analysis in Engineering: Techniques, Tools, and Trends; Taylor & Francis: Boca Raton, FL, USA, 2006; ISBN 978-1-57444-794-1. [Google Scholar]
- IATF 16949:2016; Quality Management System Requirements for Automotive Production and Relevant Service Parts Organisations. AIAG: Southfield, MI, USA, 2016.
- ISO/ASTM 52920:2023; Additive Manufacturing—Qualification Principles—Requirements for Industrial Additive Manufacturing Processes and Production Sites. ISO: Geneva, Switzerland, 2023.
- Hunte, J.L.; Neil, M.; Fenton, N.E. A hybrid Bayesian network for medical device risk assessment and management. Reliab. Eng. Syst. Saf. 2024, 241, 109630. [Google Scholar] [CrossRef]
- DIN EN 60601-1; Medizinische elektrische Geräte—Teil 1: Allgemeine Festlegungen für die Sicherheit einschließlich der wesentlichen Leistungsmerkmale. Deutsches Institut für Normung e. V.: Berlin, Germany, 2022.
- Madrigal, J.; Jeong, S. Personalization Process of 3D Printed Products using Parametric Design. Arch. Des. Res. 2022, 35, 31–47. [Google Scholar] [CrossRef]
- Hu, S.J. Evolving Paradigms of Manufacturing: From Mass Production to Mass Customization and Personalization. Procedia CIRP 2013, 7, 3–8. [Google Scholar] [CrossRef]
- Kumar, A. From mass customization to mass personalization: A strategic transformation. Int. J. Flex. Manuf. Syst. 2007, 19, 533–547. [Google Scholar] [CrossRef]
- Hu, S.J.; Ko, J.; Weyand, L.; ElMaraghy, H.A.; Lien, T.K.; Koren, Y.; Bley, H.; Chryssolouris, G.; Nasr, N.; Shpitalni, M. Assembly system design and operations for product variety. CIRP Ann. 2011, 60, 715–733. [Google Scholar] [CrossRef]
- Wang, Y.; Ma, H.-S.; Yang, J.-H.; Wang, K.-S. Industry 4.0: A way from mass customization to mass personalization production. Adv. Manuf. 2017, 5, 311–320. [Google Scholar] [CrossRef]
- Aheleroff, S.; Mostashiri, N.; Xu, X.; Zhong, R.Y. Mass Personalisation as a Service in Industry 4.0: A Resilient Response Case Study. Adv. Eng. Inform. 2021, 50, 101438. [Google Scholar] [CrossRef]
- Zheng, P.; Yu, S.; Wang, Y.; Zhong, R.Y.; Xu, X. User-experience Based Product Development for Mass Personalization: A Case Study. Procedia CIRP 2017, 63, 2–7. [Google Scholar] [CrossRef]
- Lacroix, R.; Seifert, R.W.; Timonina-Farkas, A. Benefiting from additive manufacturing for mass customization across the product life cycle. Oper. Res. Perspect. 2021, 8, 100201. [Google Scholar] [CrossRef]
- Ilg, J. Systematische Eignungsanalyse Zum Einsatz Additiver Fertigungsverfahren: Anwendung Am Beispiel der Medizintechnik; Gabler: Wiesbaden, Germany, 2019; ISBN 978-3-658-24630-3. [Google Scholar]
- DIN EN ISO/ASTM 52910; Additive Fertigung—Konstruktion—Anforderungen, Richtlinien und Empfehlungen. Beuth Verlag GmbH: Berlin, Germany, 2022.
- VDI 3405; Additive Manufacturing Processes, Rapid Manufacturing: Basics, Definitions, Processes. Beuth Verlag GmbH: Düsseldorf, Germany, 2014.
- Bröhl, A.P.; Dröschel, W. (Eds.) Das V-Modell: Der Standard für die Softwareentwicklung mit Praxisleitfaden; 2. Auflage; Oldenbourg Wissenschaftsverlag: München, Germany, 1995; ISBN 3486234706. [Google Scholar]
- Su, G.; Deng, D. Regulatory requirements and optimization of multiple criteria decision analysis to quantify the benefit-risk assessment of medical devices. Expert. Rev. Med. Devices 2023, 20, 273–281. [Google Scholar] [CrossRef] [PubMed]
- Schlagintweit, S. Validating Additive Manufacturing Processes to Meet Medical Regulations: Ensure Safe and Reproducible Manufacturing Results; TÜV Rheinland Australia: Heidelberg West, VIC, Australia, 2021. [Google Scholar]
- ISO/ASTM TS 52930:2021; Additive Manufacturing—Qualification Principles—Installation, Operation and Performance (IQ/OQ/PQ) of PBF-LB Equipment. ISO: Geneva, Switzerland, 2021.
- Xie, Y.; Zhou, J.; Wei, Q.; Yu, Z.M.; Luo, H.; Zhou, B.; Tang, Z.G. Improving the long-term stability of Ti6Al4V abutment screw by coating micro/nano-crystalline diamond films. J. Mech. Behav. Biomed. Mater. 2016, 63, 174–182. [Google Scholar] [CrossRef] [PubMed]
- Tshephe, T.S.; Akinwamide, S.O.; Olevsky, E.; Olubambi, P.A. Additive manufacturing of titanium-based alloys- A review of methods, properties, challenges, and prospects. Heliyon 2022, 8, e09041. [Google Scholar] [CrossRef] [PubMed]
- Jang, T.-S.; Kim, D.; Han, G.; Yoon, C.-B.; Jung, H.-D. Powder based additive manufacturing for biomedical application of titanium and its alloys: A review. Biomed. Eng. Lett. 2020, 10, 505–516. [Google Scholar] [CrossRef] [PubMed]
- Huber, F.; Rasch, M.; Schmidt, M. Laser Powder Bed Fusion (PBF-LB/M) Process Strategies for In-Situ Alloy Formation with High-Melting Elements. Metals 2021, 11, 336. [Google Scholar] [CrossRef]
- Fox, J.C.; Moylan, S.P.; Lane, B.M. Effect of Process Parameters on the Surface Roughness of Overhanging Structures in Laser Powder Bed Fusion Additive Manufacturing. Procedia CIRP 2016, 45, 131–134. [Google Scholar] [CrossRef]
- Piscopo, G.; Salmi, A.; Atzeni, E. On the quality of unsupported overhangs produced by laser powder bed fusion. Int. J. Manuf. Res. 2019, 14, 198. [Google Scholar] [CrossRef]
- Shange, M.; Yadroitsava, I.; Du Plessis, A.; Yadroitsev, I. Roughness and Near-Surface Porosity of Unsupported Overhangs Produced by High-Speed Laser Powder Bed Fusion. 3D Print. Addit. Manuf. 2022, 9, 288–300. [Google Scholar] [CrossRef]
- Yang, T.; Liu, T.; Liao, W.; Wei, H.; Zhang, C.; Chen, X.; Zhang, K. Effect of processing parameters on overhanging surface roughness during laser powder bed fusion of AlSi10Mg. J. Manuf. Process. 2021, 61, 440–453. [Google Scholar] [CrossRef]
- Feng, S.; Kamat, A.M.; Sabooni, S.; Pei, Y. Experimental and numerical investigation of the origin of surface roughness in laser powder bed fused overhang regions. Virtual Phys. Prototyp. 2021, 16, S66–S84. [Google Scholar] [CrossRef]
- Gebhardt, A.; Kessler, J.; Schwarz, A. Produktgestaltung für die Additive Fertigung; Hanser: München, Germany, 2019; ISBN 978-3-446-46133-8. [Google Scholar]
- Charles, A.; Elkaseer, A.; Paggi, U.; Thijs, L.; Hagenmeyer, V.; Scholz, S. Down-facing surfaces in laser powder bed fusion of Ti6Al4V: Effect of dross formation on dimensional accuracy and surface texture. Addit. Manuf. 2021, 46, 102148. [Google Scholar] [CrossRef]
- Charles, A.; Elkaseer, A.; Thijs, L.; Hagenmeyer, V.; Scholz, S. Effect of Process Parameters on the Generated Surface Roughness of Down-Facing Surfaces in Selective Laser Melting. Appl. Sci. 2019, 9, 1256. [Google Scholar] [CrossRef]
- Pacurar, R.; Balc, N.; Prem, F. Research on how to improve the accuracy of the SLM metallic parts. AIP Conf. Proc. 2011, 1353, 1385–1390. [Google Scholar] [CrossRef]
- Yadroitsev, I.; Smurov, I. Surface Morphology in Selective Laser Melting of Metal Powders. Phys. Procedia 2011, 12, 264–270. [Google Scholar] [CrossRef]
- Nandwana, P.; Plotkowski, A.; Kannan, R.; Yoder, S.; Dehoff, R. Predicting geometric influences in metal additive manufacturing. Mater. Today Commun. 2020, 25, 101174. [Google Scholar] [CrossRef]
- Mugwagwa, L.; Dimitrov, D.; Matope, S.; Yadroitsev, I. Evaluation of the impact of scanning strategies on residual stresses in selective laser melting. Int. J. Adv. Manuf. Technol. 2019, 102, 2441–2450. [Google Scholar] [CrossRef]
- Mercelis, P.; Kruth, J.-P. Residual stresses in selective laser sintering and selective laser melting. Rapid Prototyp. J. 2006, 12, 254–265. [Google Scholar] [CrossRef]
- Qiu, C.; Wang, Z.; Aladawi, A.S.; Kindi, M.A.; Hatmi, I.A.; Chen, H.; Chen, L. Influence of Laser Processing Strategy and Remelting on Surface Structure and Porosity Development during Selective Laser Melting of a Metallic Material. Metall. Mater. Trans. A 2019, 50, 4423–4434. [Google Scholar] [CrossRef]
- Hofmann, A.; Grotz, T.; Köstler, N.; Mahr, A.; Döpper, F. Electrical Smoothing of the Powder Bed Surface in Laser-Based Powder Bed Fusion of Metals. J. Manuf. Mater. Process. 2024, 8, 112. [Google Scholar] [CrossRef]
- Krauss, H. Qualitätssicherung beim Laserstrahlschmelzen durch Schichtweise Thermografische In-Process-Überwachung; Utzverlag: München, Germany, 2017; ISBN 9783831672936. [Google Scholar]
- Yavari, R.; Smoqi, Z.; Riensche, A.; Bevans, B.; Kobir, H.; Mendoza, H.; Song, H.; Cole, K.; Rao, P. Part-scale thermal simulation of laser powder bed fusion using graph theory: Effect of thermal history on porosity, microstructure evolution, and recoater crash. Mater. Des. 2021, 204, 109685. [Google Scholar] [CrossRef]
- Kruth, J.-P.; Deckers, J.; Yasa, E.; Wauthlé, R. Assessing and comparing influencing factors of residual stresses in selective laser melting using a novel analysis method. Proc. Inst. Mech. Eng. Part B J. Eng. Manuf. 2012, 226, 980–991. [Google Scholar] [CrossRef]
- Kruth, J.P.; Froyen, L.; van Vaerenbergh, J.; Mercelis, P.; Rombouts, M.; Lauwers, B. Selective laser melting of iron-based powder. J. Mater. Process. Technol. 2004, 149, 616–622. [Google Scholar] [CrossRef]
- DIN EN ISO 4287; Geometrische Produktspezifikation (GPS)—Oberflächenbeschaffenheit: Tastschnittverfahren—Benennungen, Definitionen und Kenngrößen der Oberflächenbeschaffenheit. Beuth Verlag GmbH: Berlin, Germany, 2010.
- DIN EN ISO 4288; Geometrische Produktspezifikation (GPS)—Oberflächenbeschaffenheit: Tastschnittverfahren—Regeln und Verfahren für die Beurteilung der Oberflächenbeschaffenheit. Beuth Verlag GmbH: Berlin, Germany, 1998.
Disclaimer/Publisher’s Note: The statements, opinions and data contained in all publications are solely those of the individual author(s) and contributor(s) and not of MDPI and/or the editor(s). MDPI and/or the editor(s) disclaim responsibility for any injury to people or property resulting from any ideas, methods, instructions or products referred to in the content. |
© 2024 by the authors. Licensee MDPI, Basel, Switzerland. This article is an open access article distributed under the terms and conditions of the Creative Commons Attribution (CC BY) license (https://creativecommons.org/licenses/by/4.0/).