Article

Effect of Scanning Strategy on the Microstructure and Load-Bearing Characteristics of Additive Manufactured Parts

by
S. Silva Sajin Jose
1,
Santosh Kr. Mishra
1,* and
Ram Krishna Upadhyay
2,*
1
Department of Production Engineering, National Institute of Technology Tiruchirappalli, Tiruchirappalli 620015, Tamil Nadu, India
2
Gati Shakti Vishwavidyalaya, Vadodara 390004, Gujarat, India
*
Authors to whom correspondence should be addressed.
J. Manuf. Mater. Process. 2024, 8(4), 146; https://doi.org/10.3390/jmmp8040146
Submission received: 22 May 2024 / Revised: 3 July 2024 / Accepted: 4 July 2024 / Published: 5 July 2024

Abstract

:
Additive manufacturing has witnessed significant growth in recent years, revolutionizing the automotive and aerospace industries amongst others. Despite the use of additive manufacturing for creating complex geometries and reducing material consumption, there is a critical need to enhance the mechanical properties of manufactured parts to broaden their industrial applications. In this work, AISI 316L stainless steel is used to fabricate parts using three different strategies of the additively manufactured Laser Powder Bed Fusion (LPBF) technique, i.e., continuous, alternate, and island. This study aims to identify methods to optimize grain orientation and compaction support provided to the material under load, which influence the frictional and wear properties of the manufactured parts. The load-bearing capacity is evaluated by measuring the frictional and wear properties. The wear patch track is also examined to establish the physical mechanisms at the surface interface that lead to the smooth transition in response to the load. Grain orientation is compared across different strategies using Electron Backscatter Diffraction (EBSD) maps, and the influence of surface roughness on sliding behavior is also evaluated. The results demonstrate that the island scanning strategy yields the best performance for load-bearing applications, exhibiting superior grain orientation and hardness in the additively manufactured parts.

1. Introduction

Additive manufacturing (AM) is a three-dimensional manufacturing technique that uses diverse materials to fabricate intended applications to manufacture complicated parts at a cheaper cost and shortens the time that fabrication takes compared to the conventional method [1,2,3,4]. The materials used for additive manufacturing are as diverse as the products that are manufactured using the process. AM is very flexible in terms of the product’s design, shape, and texture; similarly, it is flexible enough in terms of material use. Materials commonly used in additive manufacturing include polymers, resins, carbon fiber, paper, metals, thermoplastics, ceramics, alloys, composites, etc. Other than polymers and metals are also used widely. Metals are the long-established raw material form used for load-bearing applications [2,3,4,5]. The rapidly developing paradigm of additive manufacturing has shown significant benefits in allowing the custom design of structural components with superior performance compared to conventional subtractive processing procedures [6].
Among the existing additive manufacturing methods, Laser powder bed fusion (LPBF) stands out as a highly promising technique that can directly transform metallic powders into fully dense parts [7]. During the LPBF process, the powder bed is selectively scanned layer wise, utilizing a high-intensity laser beam for melting. The solidified layer then piles up, creating complex geometries with tailored mechanical properties [8,9].
Among the various materials used for LPBF fabrication, stainless steel AISI 316L (from here onwards this material will be referred to as SS316L as provided by the manufacturer) is popular due to its suitability for widespread applications covering the nuclear, automotive, aerospace, marine, and medical sectors. These can be attributed to its high strength, excellent corrosion resistance, good weldability, good formability, and biocompatibility [10,11]. Stainless steel is well-suited for a variety of automotive, industrial, food processing, and medical applications due to its superior mechanical properties. These properties include hardness, tensile strength, formability, and impact resistance. The 316L steel is selected for its high strength, corrosion resistance, and weldability [5,12]. Research indicates that the increased stability of the oxide layer produced on AM 316L stainless steel samples may help to reduce the likelihood of localized corrosion [12]. Temperature, gravity, and capillary forces characterize the build density of the part in the LPBF process. It is difficult to be controlled, as no mechanical pressure is involved during the build stage like it is in molding [13]. The wear rate of the LPBF-manufactured parts significantly depends on the process parameters, which influence the overall density and the resulting microstructure. The density of the manufactured parts might not be as high as it could be if there is not enough melting of the powder, which creates several pores. The detrimental nature of pores can affect the wear rate [14]. A fine-grained structure has more grain boundaries and a higher dislocation density, improving the material’s wear resistance [15]. The process parameters of importance in LPBF include laser power, scanning speed, layer thickness, scan spacing, and scanning strategies. These parameters can directly impact the build density, and surface roughness of the fabricated parts, which in turn influences the material’s microstructure and mechanical properties [16,17]. Due to the distinct properties of materials, it is necessary to use optimized processing parameters to minimize defects such as unmelted particles, porosity, distortions, residual stresses, undesirable phases, segregation, and cracking [18]. The parts fabricated by LPBF can be porous due to a lack of fusion, keyhole porosity, gas pores that develop inside the metallic powders during their production by gas-atomization, and gas entrapment during the fabrication stage [19,20,21]. To ensure the reliability of the working conditions, additively manufactured SS316L parts must be rigorously analyzed. Researchers have adopted numerous strategies to control the process parameters of the SS316L parts fabricated using LPBF to achieve the desired mechanical and tribological behaviors.
Saxena et al. [22] have found that there is a significant impact of layer thickness on hardness. The hardness value increases when the layer thickness is maintained low, as it is relatively easier to melt the thin layer of powder particles, resulting in a dense structure. Shin et al. [23] reported that a lower density can be observed with increasing scan speeds, resulting in lower surface hardness values. Despite observing an increase in density after heat treatment at all scan speeds, there was a decrease in surface hardness. This is attributed to surface softening caused by the heat treatment. Sun et al. [24] reported that lower energy inputs can lead to incomplete fusion, resulting in the formation of pores, and the wear rate of LPBF samples increases with the rise in the volume porosity percentage. The pores in the SS316L parts serve as the sites for crack initiation and propagation, increasing the wear rate. Moreover, the fine microstructure formed by rapid solidification can result in increased hardness. The volumes of the pores can become compressed, resulting in lower hardness values [25]. Greco et al. [26] reported that increasing hatch spacing at a constant energy density input results in a lower scanning speed, indirectly allowing improved heat distribution. This results in the melting of a large amount of powder, leading to an increase in density and, thus, an improvement in the hardness values. The surface roughness increases with the increase in powder particle size, leading to incomplete fusion [27]. This generates loose grit particles as debris and increases the wear rate further
Larimian et al. [28] reported that the SS316L parts fabricated by different scanning strategies can result in unidentical grain growth directions, leading to a variation in their mechanical properties. Salman et al. [17] investigated the influence of various scanning strategies in fabricating SS316L parts. The variation in the scanning strategies has no impact on the phase formation. However, the scanning strategy considerably influenced the grains and cell size at the microstructural level, affecting the built samples’ overall bulk density. Fine-grained microstructures yield improved mechanical properties [29]. Ram et al. [1] studied the impact of scanning rotation in LPBF. A checkerboard hatch style is used to fabricate the SS316L specimen, with alternate layers in the build direction having scan rotation angles of 0° and 90°. The fabricated specimen showed lower friction values and moderate wear rates from scratch and sliding tests. Larimian et al. [28] reported the influence of scan speed, scan strategies, and energy density on the morphology and mechanical behaviors of LPBF-fabricated SS316L. The scanning strategy with the highest cooling rate resulted in higher density and fine microstructure. Decreasing the scanning speed increased the dendrite width, which can be attributed to the decreased cooling rate.
Altering the scanning strategy thus improves the microstructure, eliminating the voids and cracks and resulting in enhanced mechanical properties. This can be attributed to the variation in the thermal gradient resulting from the modification of the scanning vector length, which directly influences the melt pool and cooling rate [30]. The adopted LPBF methodology proved to be significant in reducing friction and wear. From the previous research on SS316L fabrication using the LPBF technique [1,24,25], it can be perceived that only a few studies have been reported on its tribological performance with different scanning strategies. The effect of altering hatch styles is rarely reported as it is challenging to change compared to the other processing parameters. The LPBF additive manufacturing process is utilized due to its processing advantages, such as fully melted metal powder and the formation of highly dense products with complex part geometries. It overcomes the processing problems present in other AM techniques (porosity, low density, low mechanical strength, etc.) for fabricating similar structures. The present work analyzes the effect of adjusting the scanning strategies on the load-bearing characteristics of SS316L in terms of friction and wear rates. It would pave the way for more applications of LPBF fabricated SS316L, where rolling and sliding contacts are involved.

2. Materials and Methods

A laser powder bed fusion (LPBF) was used to build stainless steel samples (equipment used: Concept Laser GmbH, Mlab Cusing R, Berlin, Germany) using SS316L powder (size~10–45 µm) supplied by Concept Laser GmbH is used. Table 1 shows the chemical composition of SS316L powder provided by Concept Laser GmbH. Data presented in Table 1 were confirmed with Energy Dispersive X-ray Spectroscopy (EDS, W-SEM, JSM-6010LA-JEOL Ltd., Tokyo, Japan). The average particle composition was aligned with the specifications presented by Concept Laser GmbH (Please refer Supplementary Information Figure S1). For fabrication, firstly, a computer-aided design (CAD) model (.stl format) of the object was created and then slicing, pre-processing, and printing were performed followed by post-processing. Table 2 [31] shows the processing parameters used for the Laser Powder Bed Fusion technique to build SS316L samples of three different scanning strategies: i.e., continuous, alternate, and island. Argon gas was used as an inert gas at an oxygen level below 1000 parts per million. The processing parameters were selected based on initial trials to ensure complete powder fusion and the least pore formation. Least pore formation signifies additive manufactured parts with an almost complete fusion of particles and only a few pores on the material. The SEM micrographs of the prepared samples built using the different scanning strategies are shown in Figure S2. Three strategies, i.e., continuous, alternate, and island, were used to build the samples. During continuous scanning, the scan vectors were rotated at 0° rotation. In the case of an alternate scanning strategy, the layers were built with a scanning rotation of 90°. For the island style, the powder deposition was unidirectional at a scanning rotation of 90° and divided into two square sections of 10 mm. Pore formation is shown by an arrow (yellow) resulting from some unmelted powder material sequence [32]. However, the overall pore formation was less in the island case than in continuous scanning, which suggests the suitability of complex scanning strategies for the better microstructure of samples prepared via the LPBF technique. Several trials were conducted to ensure the total fusion of particles and to generate defect-free samples of SS316L before choosing the final parameters. The attended density level was 99.9%, which signifies a low level of porosity (~0.1%). The calculated volume energy density of the sample was 92 J/mm3, calculated by Equation (1), where P: laser power; v: scanning speed; h: hatch space; and t: layer thickness.
E v = P v × h × t
Figure 1 shows the built sample with the dimensions of 20 × 20 × 20 mm (width × length × height) for the continuous, alternate, and island scanning strategy of the 316L stainless steel sample. For the continuous scanning, the scan vectors were rotated at 0° rotation. Similarly, all the successive layers in the build direction were built with a scanning rotation of 0°. For the alternate scanning strategy, the layers in the build direction were built with a scanning rotation of 90° (bidirectional). For the island hatch style, the powder layer in the SD-TD plane was unidirectional at a scanning rotation of 0° and divided into two square sections of 10 mm in size, with an overlap factor of 0 mm between the islands. The successive layers were rotated 90° relative to the previous layer. Hence, the scan vectors were oriented at 0°/90°. The prepared samples were subjected to microstructure, hardness, roughness, and tribological investigation.
The as-built sample was finished by grinding and polishing (equipment used: Double disc machine, Bainpol Metco, made in India) using different sizes of emery paper and diamond paste in order to make it suitable for microstructural studies. Further, the sample was polished using the vibratory polisher (equipment used: Vibromet 2, Buehler, made in Japan) for eight hours to obtain a mirror-like surface for electron backscatter diffraction (EBSD) analysis. The electron backscatter diffraction (equipment used: EBSD, JSM-7100F; JEOL, made in Japan) technique considering acceleration voltage 20 kV, specimen tilt 70°, and step size 10 nm was used to determine the grain structure of the built sample.
Atomic force microscopy (equipment used: AFM, Park XE 70, Seoul, Republic of Korea) was used to analyze the sample’s 3D topography. A scanning electron microscope was used to obtain the wear microstructure of the track surface (equipment used: W-SEM, JSM-6010LA, JEOL, Tokyo, Japan).
Friction and wear tests were performed on a laboratory-made ball-on-disk (BoD) tribometer. More details about the setup and scheme are detailed in the author’s other work [33]. The BoD test effectively simulates point contact, which is typically used in many practical applications, including bearings, gears, and rolling contact scenarios. From the BoD tribo test, the wear track on the disk can be clearly visualized to study the wear performance of the material further. The availability of BoD test equipment in our lab and its suitability for our research objectives made it the preferred choice. Table 3 shows the chemical composition of steel ball material and test conditions. The selection of ball material is based on the suitable application in industry, where major bearing steel equipment works in sliding or rotating conditions. The 5N load was selected based on the criteria of minimum contact force, which can replicate the amount of deformation subjected to the exerted load. The test was conducted at room temperature (23 °C) and relative humidity of 50%. After the tribological test, the 3D image of the wear track was analyzed by a 3D profilometer (equipment used: Contour GTK, Bruker, made in the USA) for calculating the wear rate with the help of Archard’s wear formula [33]. The wear volume was determined by adding the wear track’s width and depth profiles and multiplying them by length. This wear volume was then divided by the contact load and total sliding distance to determine the wear rate of prepared samples.
Vickers hardness (equipment used: Tinius Olsen-FH 10, The Netherlands) tester at 0.5 kg force was used to measure the hardness of SS316L samples prepared by the LPBF technique. During the test, a diamond pyramid indenter was pressed into the material with a 0.5 kg force. The size of the indentation was measured using a microscope. The Vickers hardness test was performed as per ASTM E384-17 standard for the finished sample [34].

3. Results and Discussion

3.1. Tribological Study

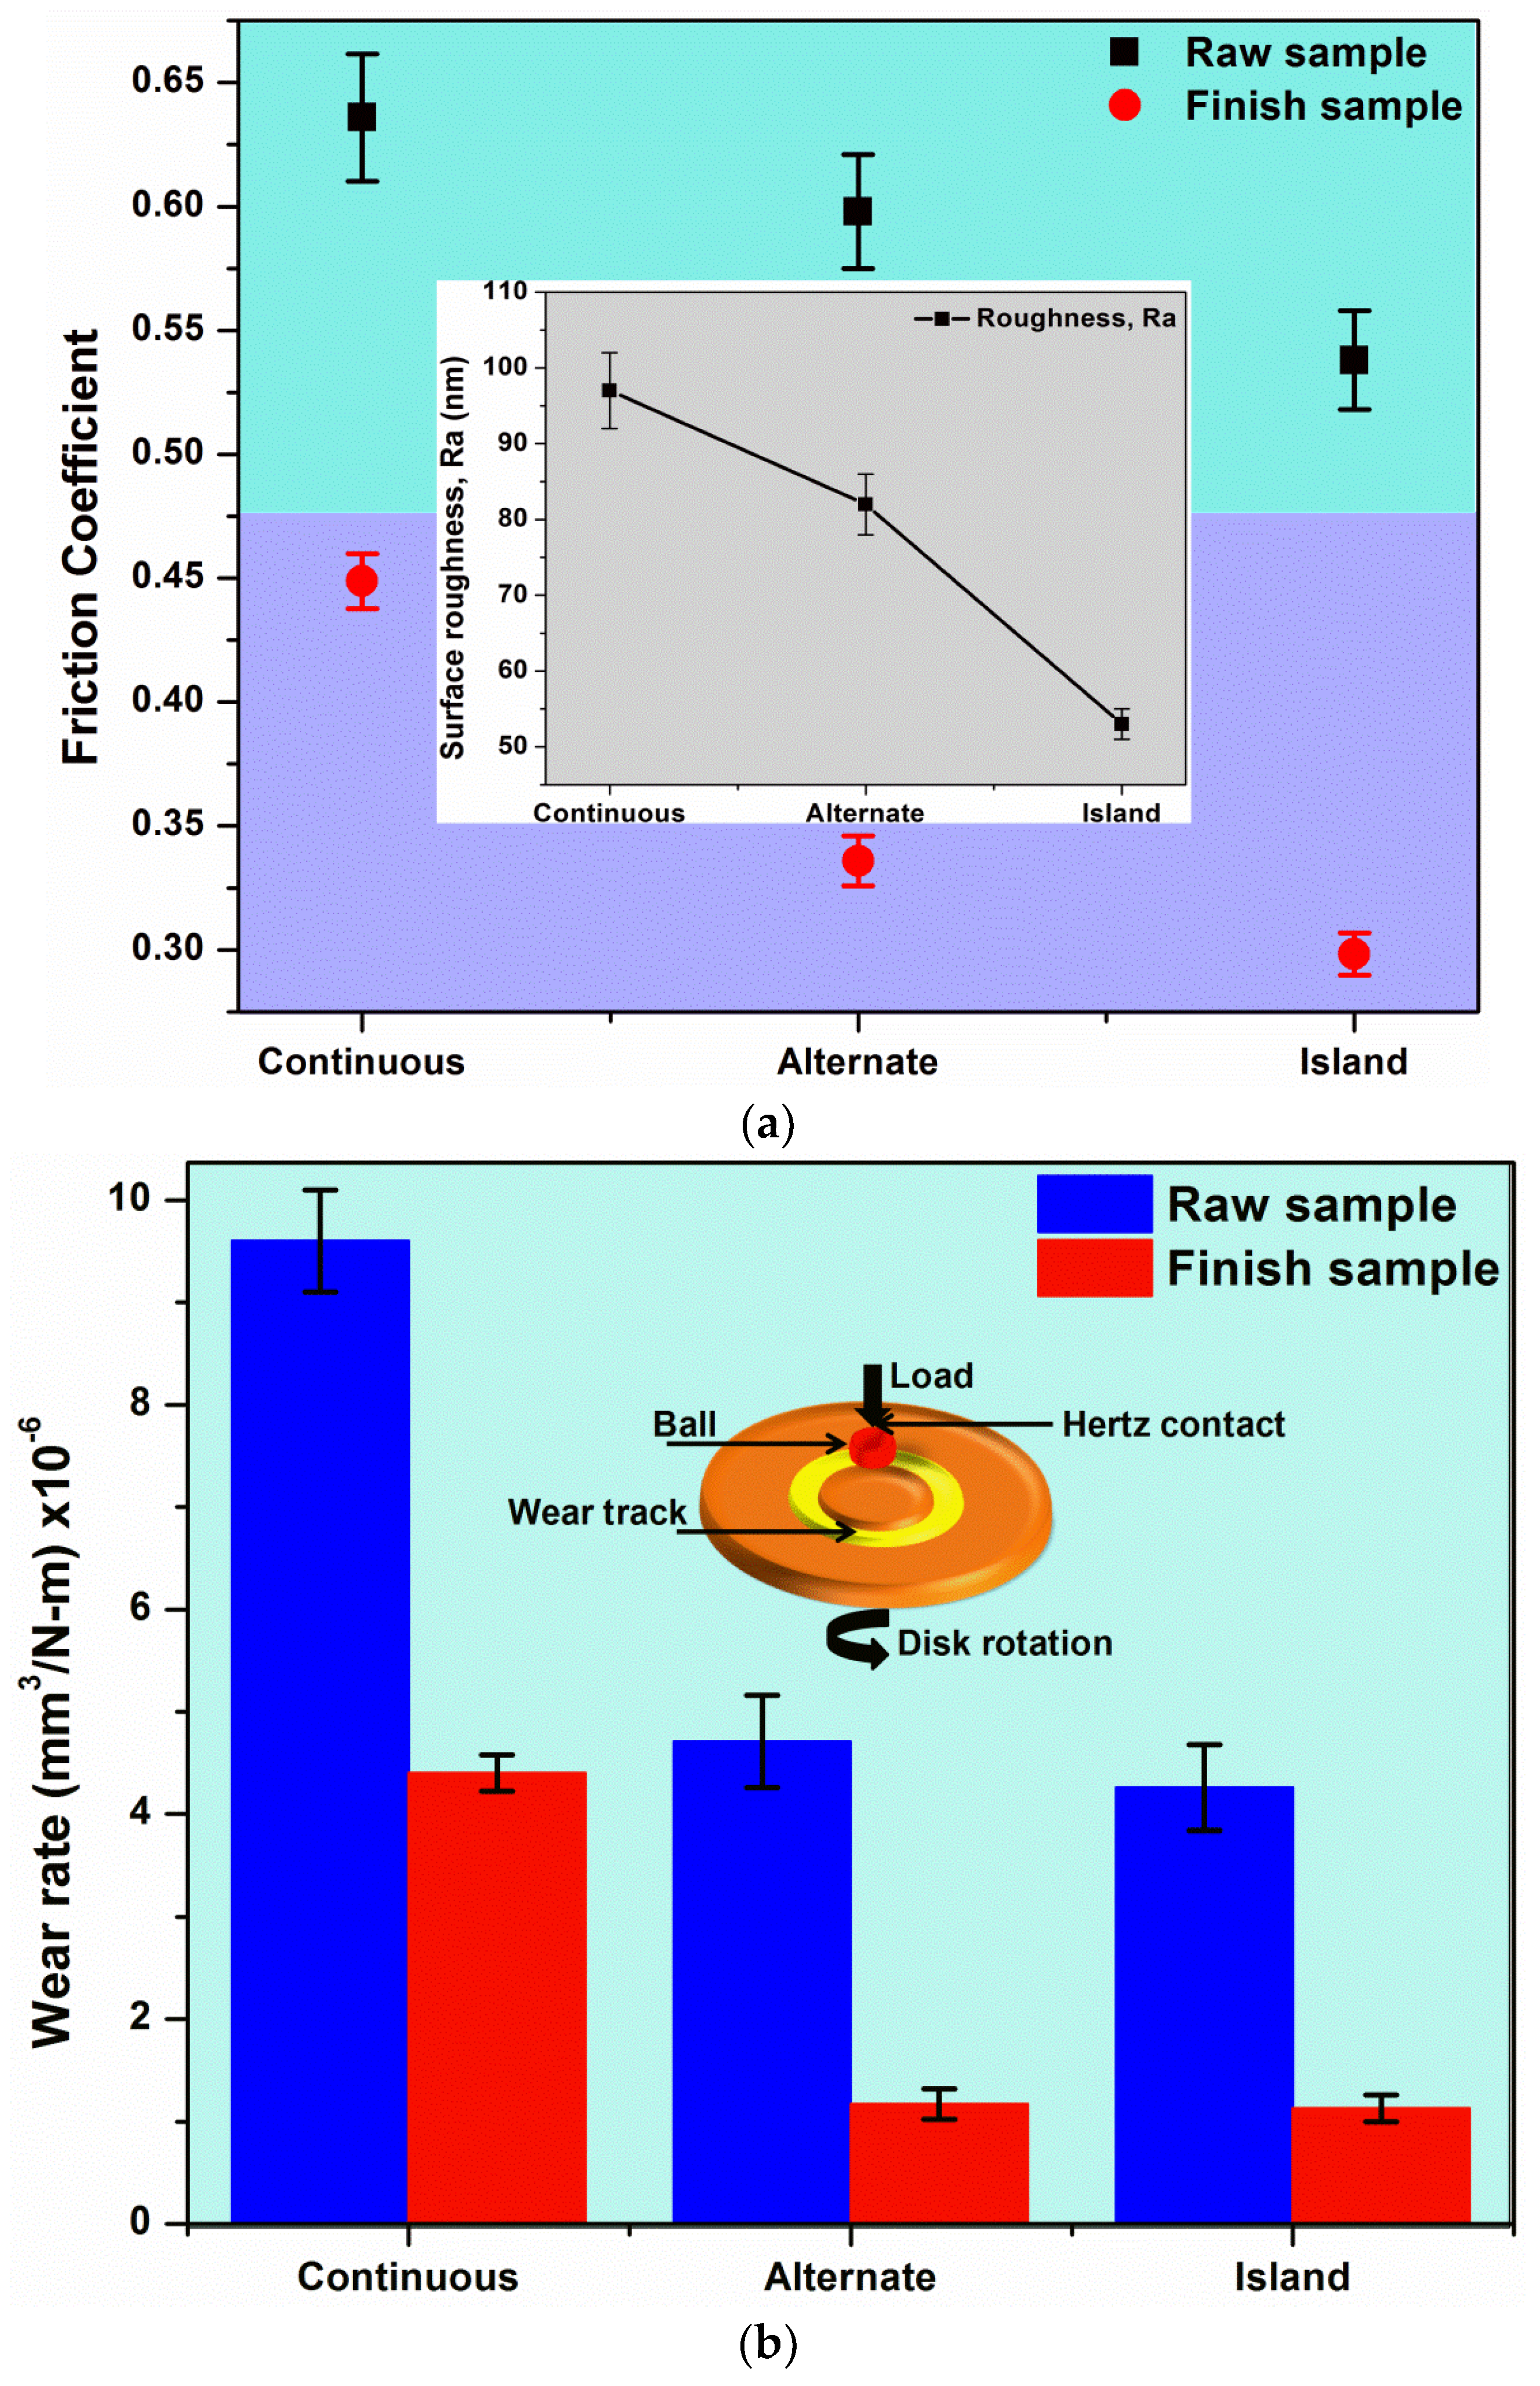
The ball-on-disk setup was to investigate the friction and wear properties of the prepared samples. Figure 2a,b shows the friction and wear performance of samples prepared with different scan strategies. The friction coefficient and wear rates depend on the load-carrying capacity of the lubrication film developed [35]. A sample made using a continuous scan strategy has the highest friction coefficient among all the test samples. In this case, the friction coefficient value reached ~0.63 for the as-built sample, which is minimized for the finished sample. The highest value of the as-built sample is due to the surface roughness (Ra ~5–8 µm) factor. On the other hand, the surface roughness of the finished sample (inset image, Figure 2a) is limited to only 97 nm, which leads to a reduction in the friction coefficient value (~0.44).
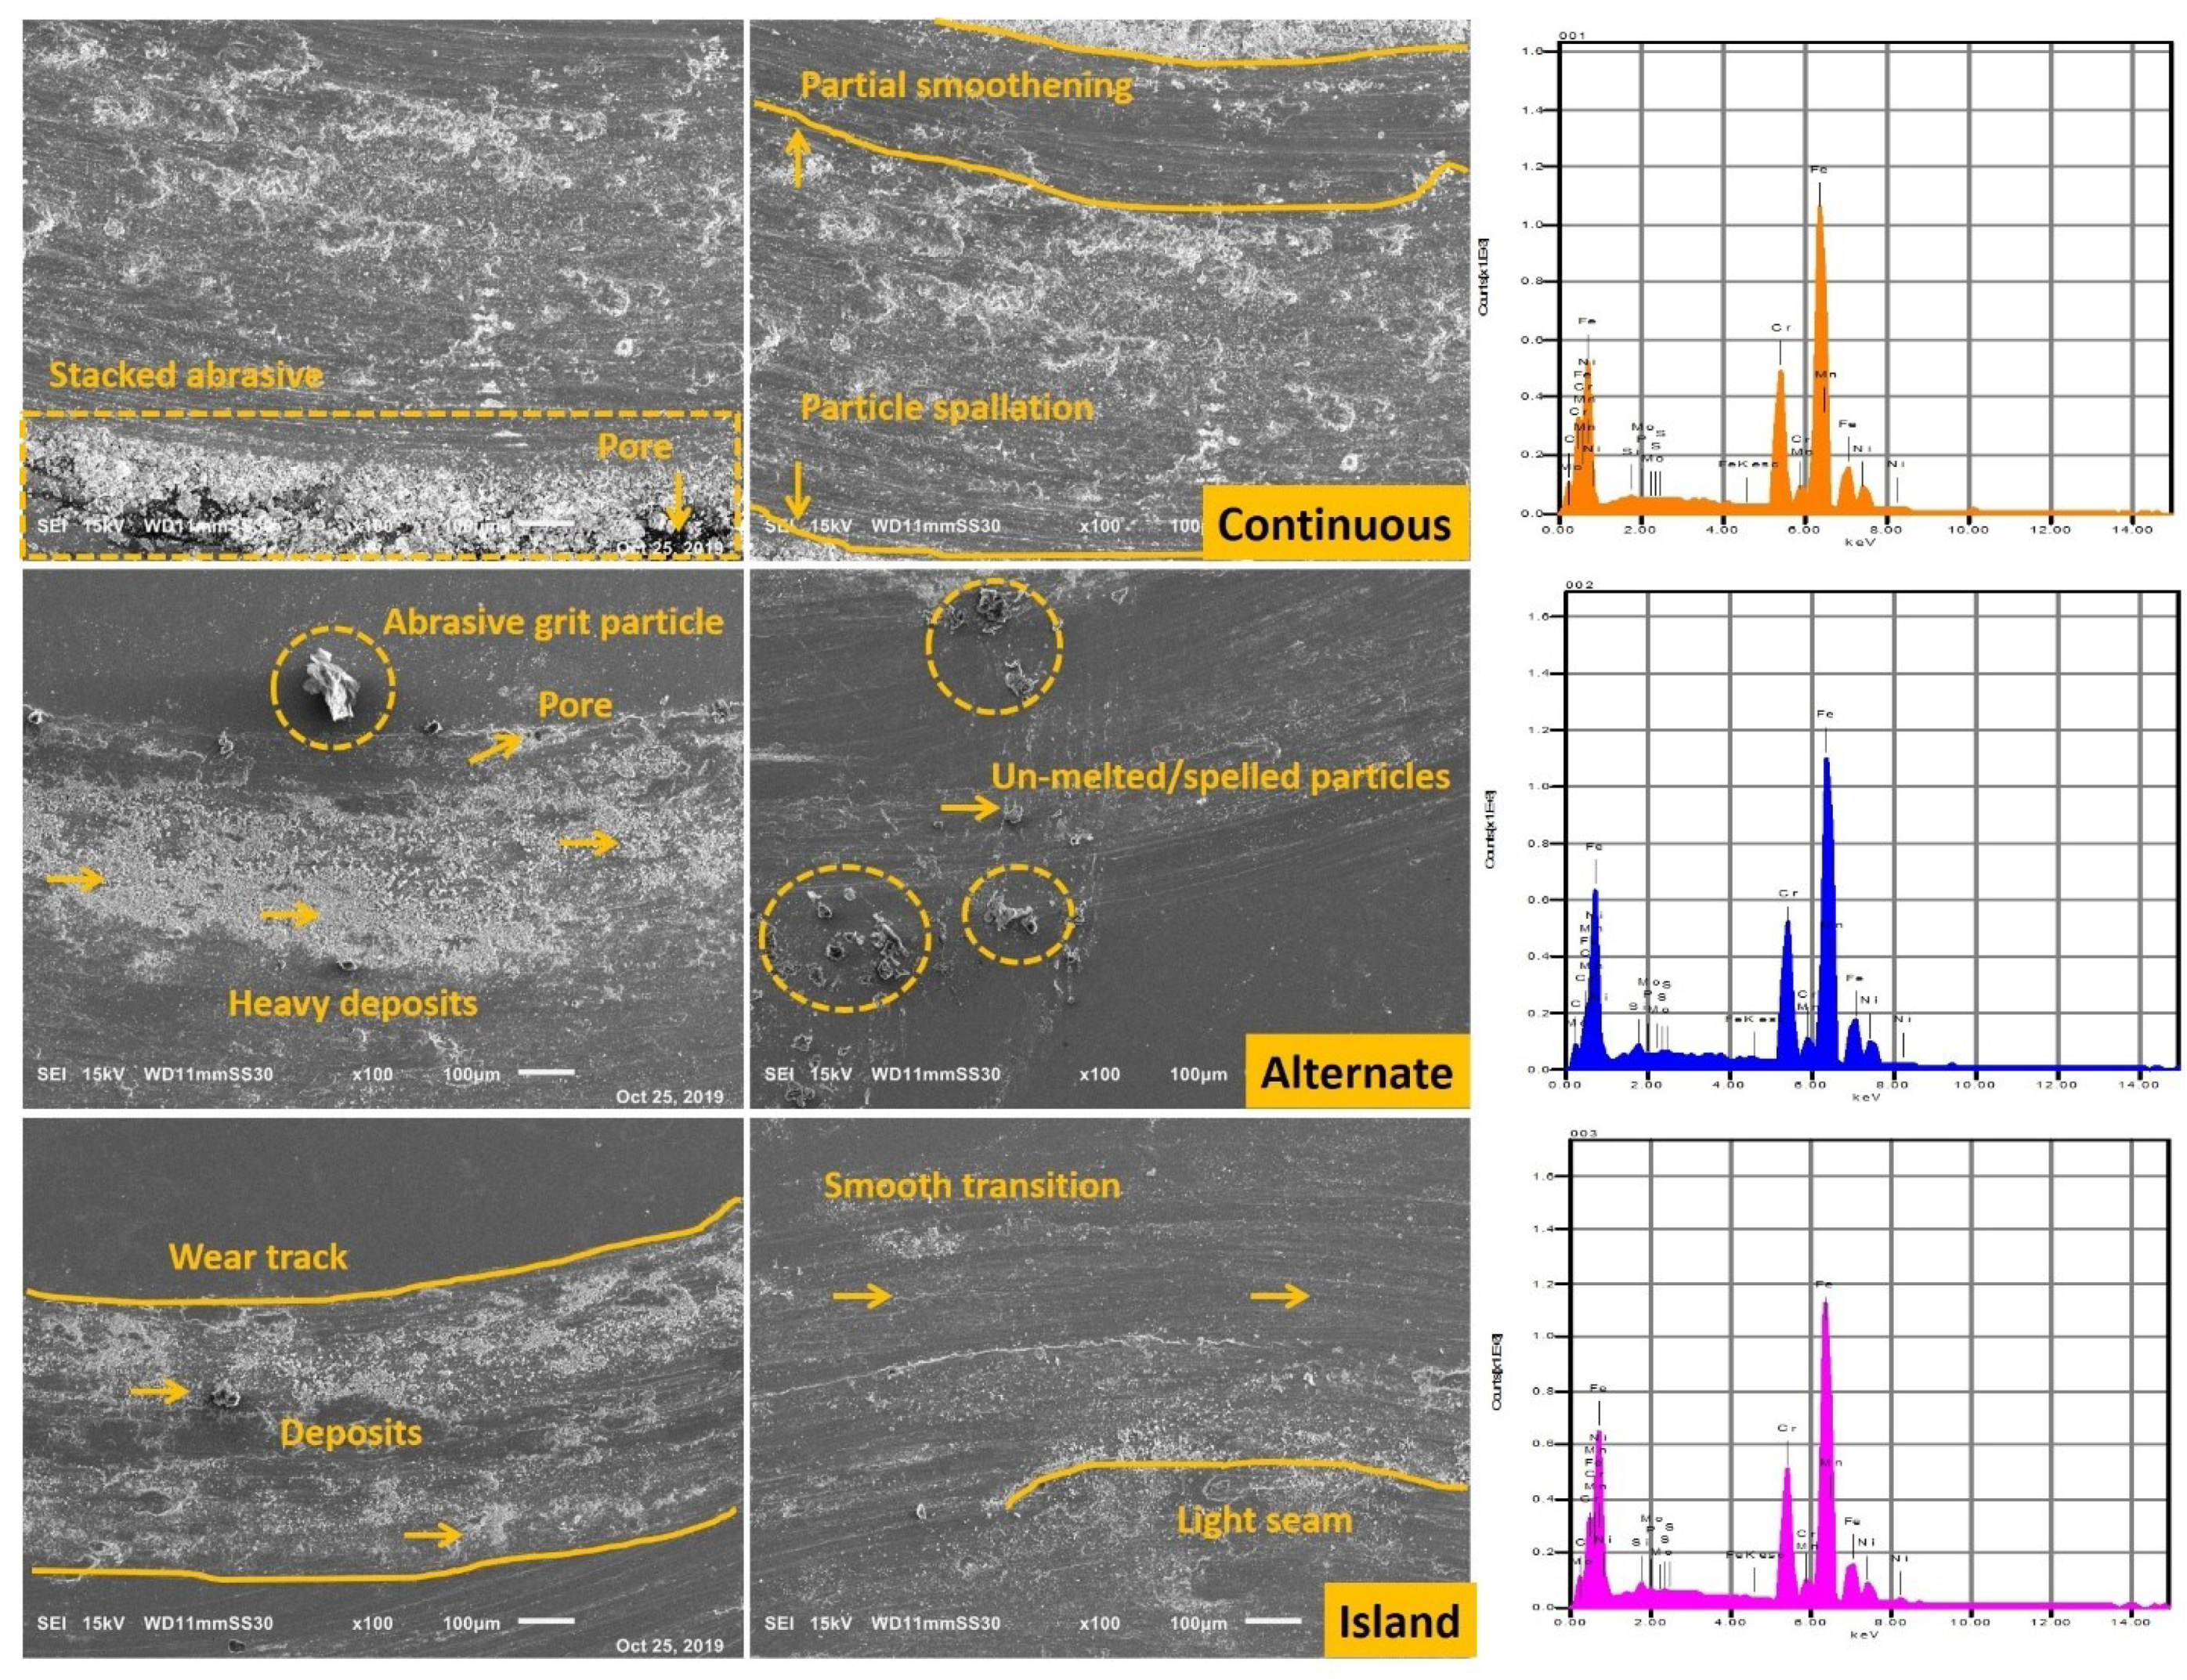
Similarly, as shown in Figure 2b, the wear rate in the continuous scan strategy of the finished sample was minimized by 45% compared to that of the as-built sample. For the as-built sample, the wear rate progresses with sliding distance due to the stacking of grit particles on the edges of the wear track junction (see Figure 3). Also, a few pore formations weaken the surface. Under the applied load in this pore region, surface spallation occurs, which affects the wear rate [36]. On the contrary, due to the low surface roughness of a finished sample, at least a portion of the sliding wear track has achieved partial smoothing, which minimizes the wear rate. The error bar in Figure 2a,b reflects the maximum and minimum measured data, which provides the average value of friction, surface roughness, and wear rate. The average value is measured by considering at least three measurements of selected data.
In an alternate scan strategy, the friction coefficient and wear rate are minimized further with a decrease in the surface roughness value of the finished sample. The as-built surface roughness value ranges between Ra ~5 and 7 µm. Although this value is high, due to the modified scan strategy and the reduction in pore formation, the friction coefficient and wear rate values are minimal compared to the continuous scan strategy (see Figure 2a,b). The friction coefficient value of the finished sample is ~0.34. The wear rate of the finished sample is minimized by 25% compared to the wear rate of the as-built sample. There has been no accumulation of particles on the edges of the wear track junction in the case of an alternate scan strategy (see Figure 3). Instead, a heavy deposit in the middle area is observed. A large expelled grit particle of a large size is also observed in the SEM imaging. In the finished sample, the appearance of grit particles with an unmelted powder sample (shown in a circle) is confirmed, which is responsible for the rise in the wear rate. These two factors (grit particles and unmelted powder) affect the true behavior of the alternate scanning strategy and hence receive only a moderate wear rate value.
The island scan strategy selected for the sample with its friction and wear behavior Figure 2a,b is found to be in good agreement with the surface roughness value due to closed packing/reduction in pore formation. The sample made using the island scan strategy has a higher compressive strength than the other samples due to the strong bonding of multiple sections. This strategy leads to a dense structure and barely allows for any pores to be formed. The surface roughness values of the as-built and polished samples are ~6 µm and ~0.53 nm. During the sliding test, the deposit number of grit particles deposited was lower under the island scan strategy. The attained value of the friction coefficient was ~0.29, which is within the workable limits of dry friction. The wear rate of the finished sample is reduced by 27% compared to the as-built sample.
The SEM image shown in Figure 3 shows a clear wear track during the sliding contact due to the smooth transition of the steel ball over the finished surface. The island scanning strategy is capable of sustaining all the forces acting on the surface due to the homogeneous distribution of loads on each island during the Hertz contact [1]. The calculated value of Hertzian contact stress (mean) is 1.159 GPa, and the maximum contact stress is 1.72 GPa. The scheme shown in Figure 2b below represents the Hertz contact stress. However, in the case of alternate and continuous scanning strategies, the maximum contact stress values are 1.65 GPa and 1.55 GPa, which is comparatively lower than the island scanning. While comparing all three scanning strategies, the equal contact load distribution under the island scan strategy provided a low wear rate value [28,29]. Similarly, compared to the continuous scan strategy used for the finished sample, the friction coefficient was also modified under this strategy by 66%. Hence, it is suggested that changing the scan strategy can successfully modify the material’s wear behavior under severe contact conditions. In all three scanning strategies, the three-body-abrasive wear mechanism governs the wear mechanism. In this, the grit particles (third body) slide between the contact area of the sample and the ball material. Also, the elemental map provides a lower concentration of chromium and nickel materials in continuous and alternate scanning than the island. This depletion can be attributed to the continuous delamination of passive layers due to the oxidation of chromium and nickel in the form of wear debris [25,37]. However, in the island strategy, the wear by delamination is prevented by the tribo-film formation [1]. Hence, the wear rate under continuous and alternate scanning strategies is higher.

3.2. Hardness

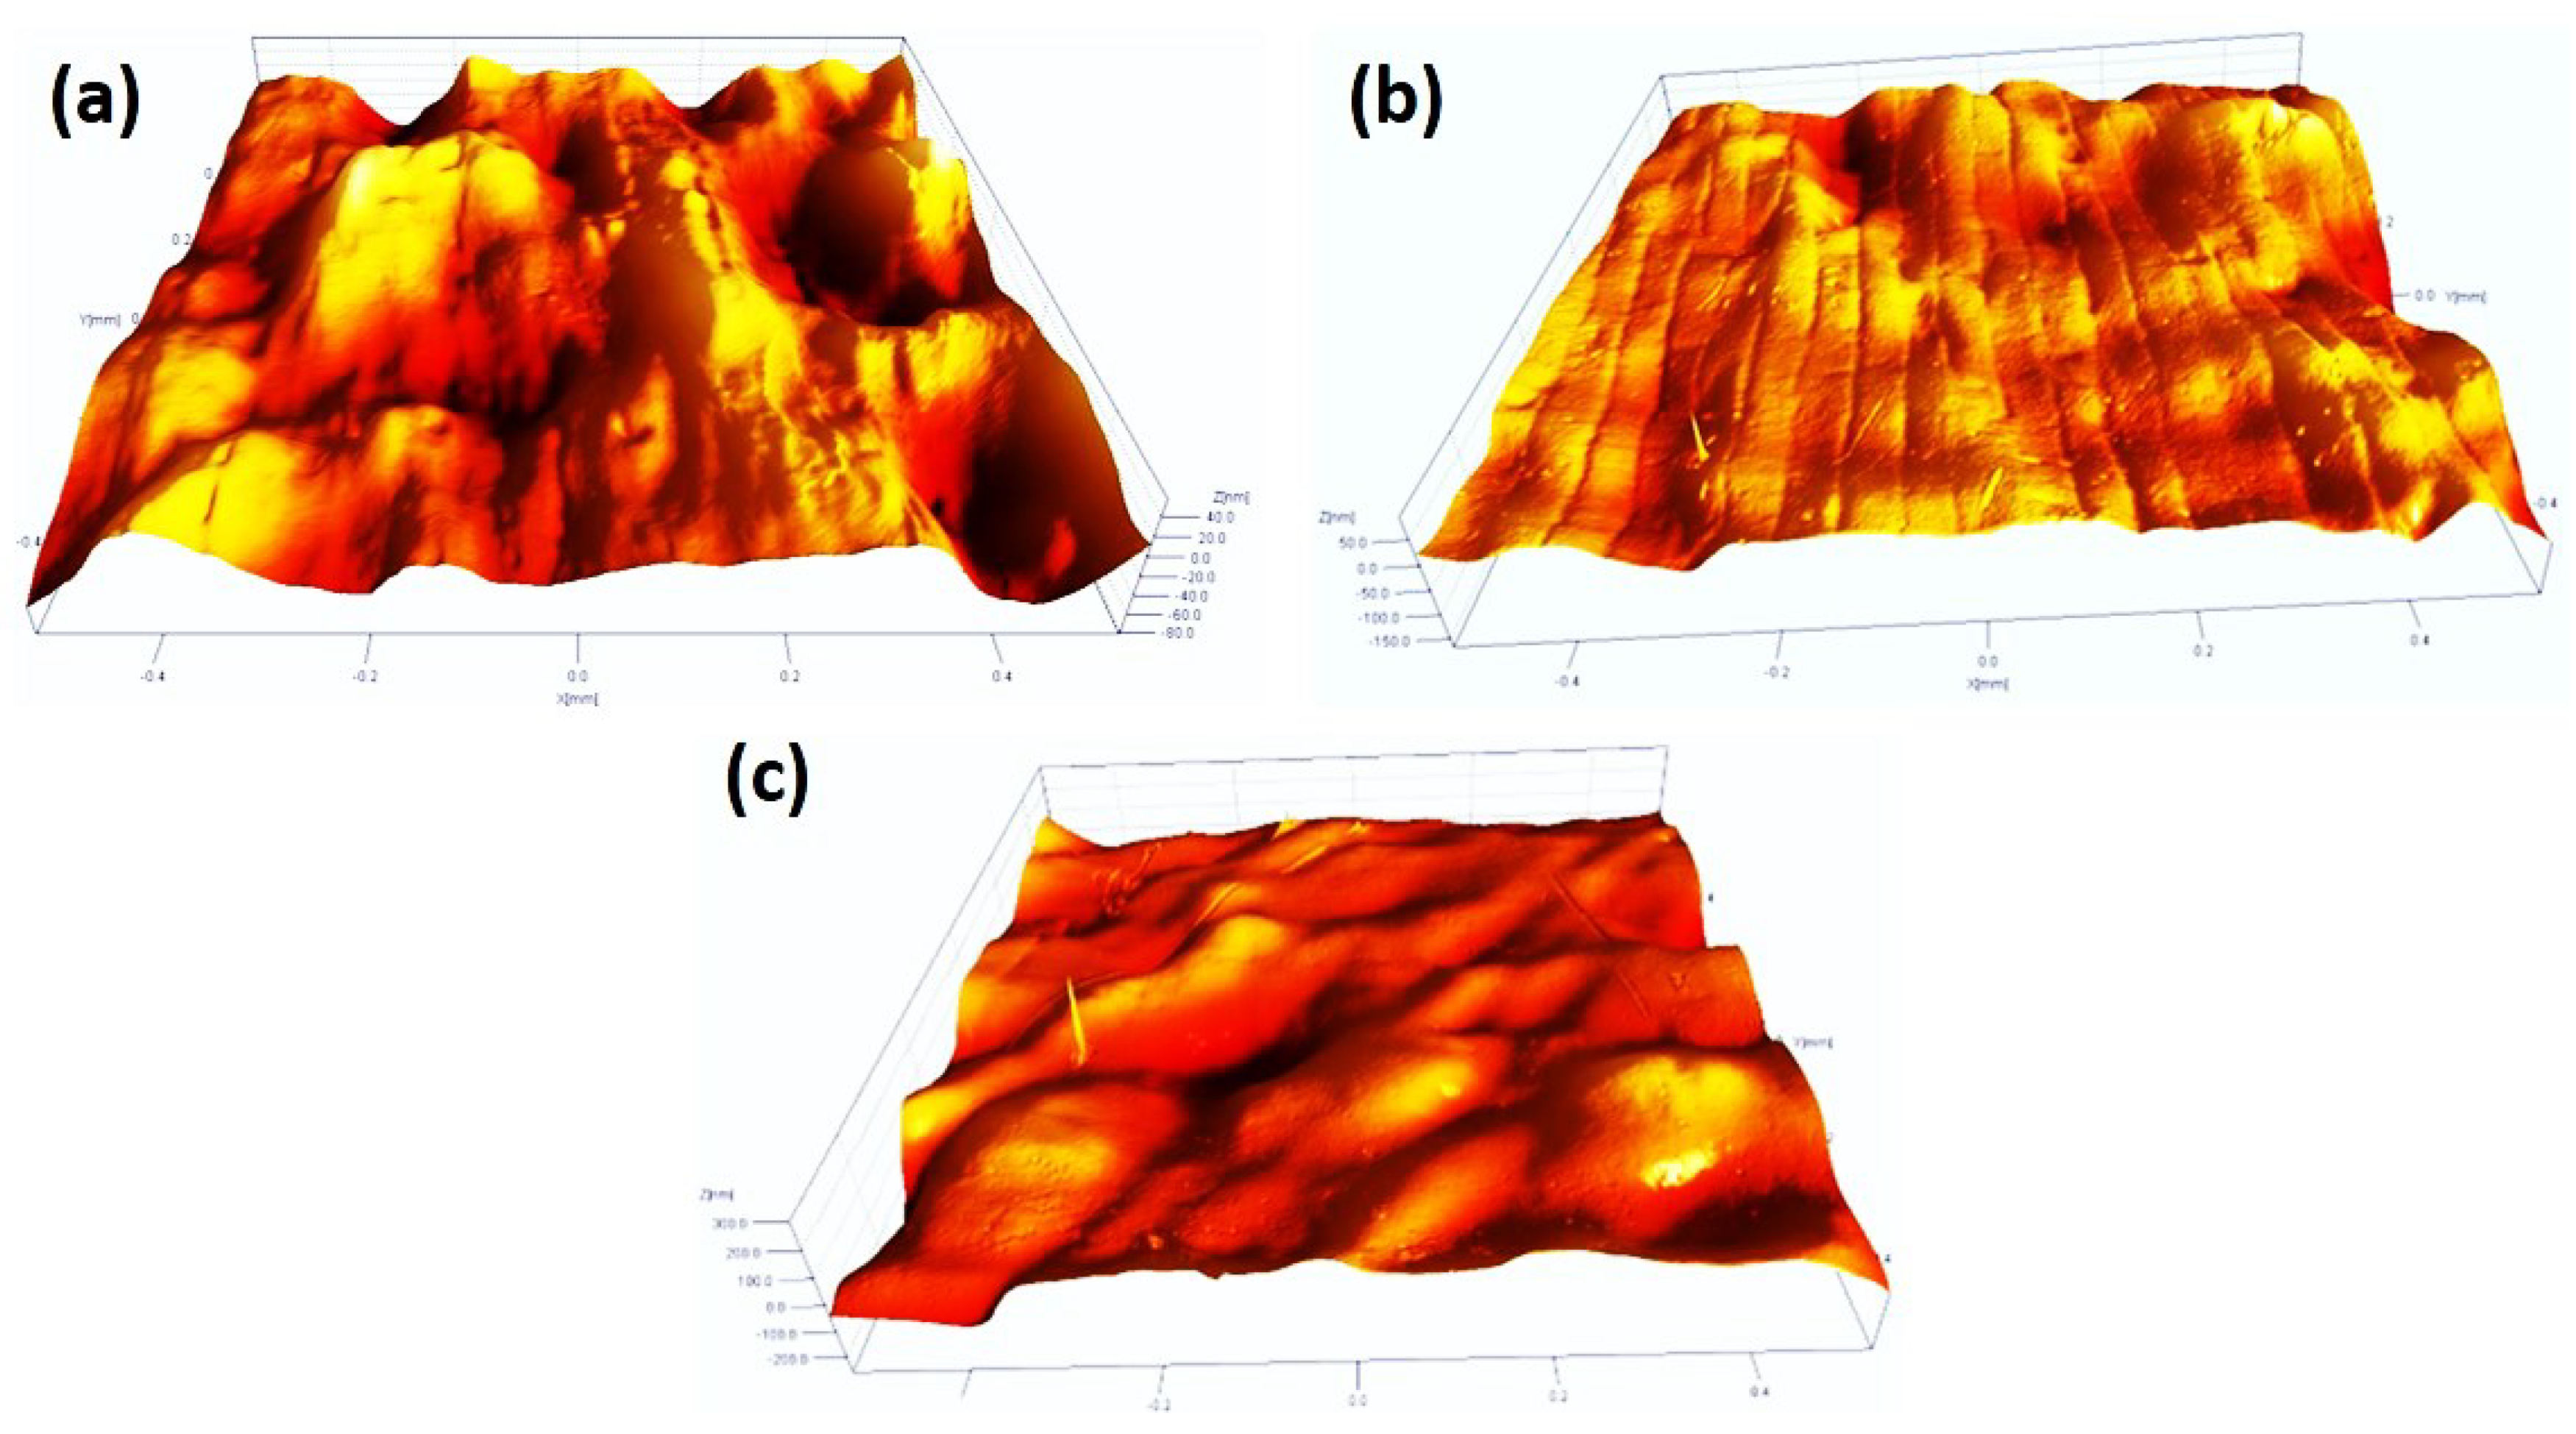
Table 4 shows the hardness data for the samples prepared through the LPBF technique. Among all the tested samples, the island scanning strategy outperforms the others and has a hardness value of 186 HV for the finished sample. Considering the alternate scanning technique, the hardness values are slightly modified compared to continuous scanning. Both the alternate and island stratifies have higher hardness values due to modifications in the microstructure. The hardness values of these samples can also be correlated with the friction and wear values, where island samples have better tribological properties than the other tested samples. Also, the surface topography of samples shown in Figure 4 suggests a relatively soft nature of the surface in the case of continuous and alternate scanning. This leads to the appearance of more bumps on the surface during AFM measurement. In the case of island scanning, the surface is hard; however, a slightly higher peak (on the left side of the topography image) resulted in some deviation in the hardness data.

3.3. EBSD Analysis

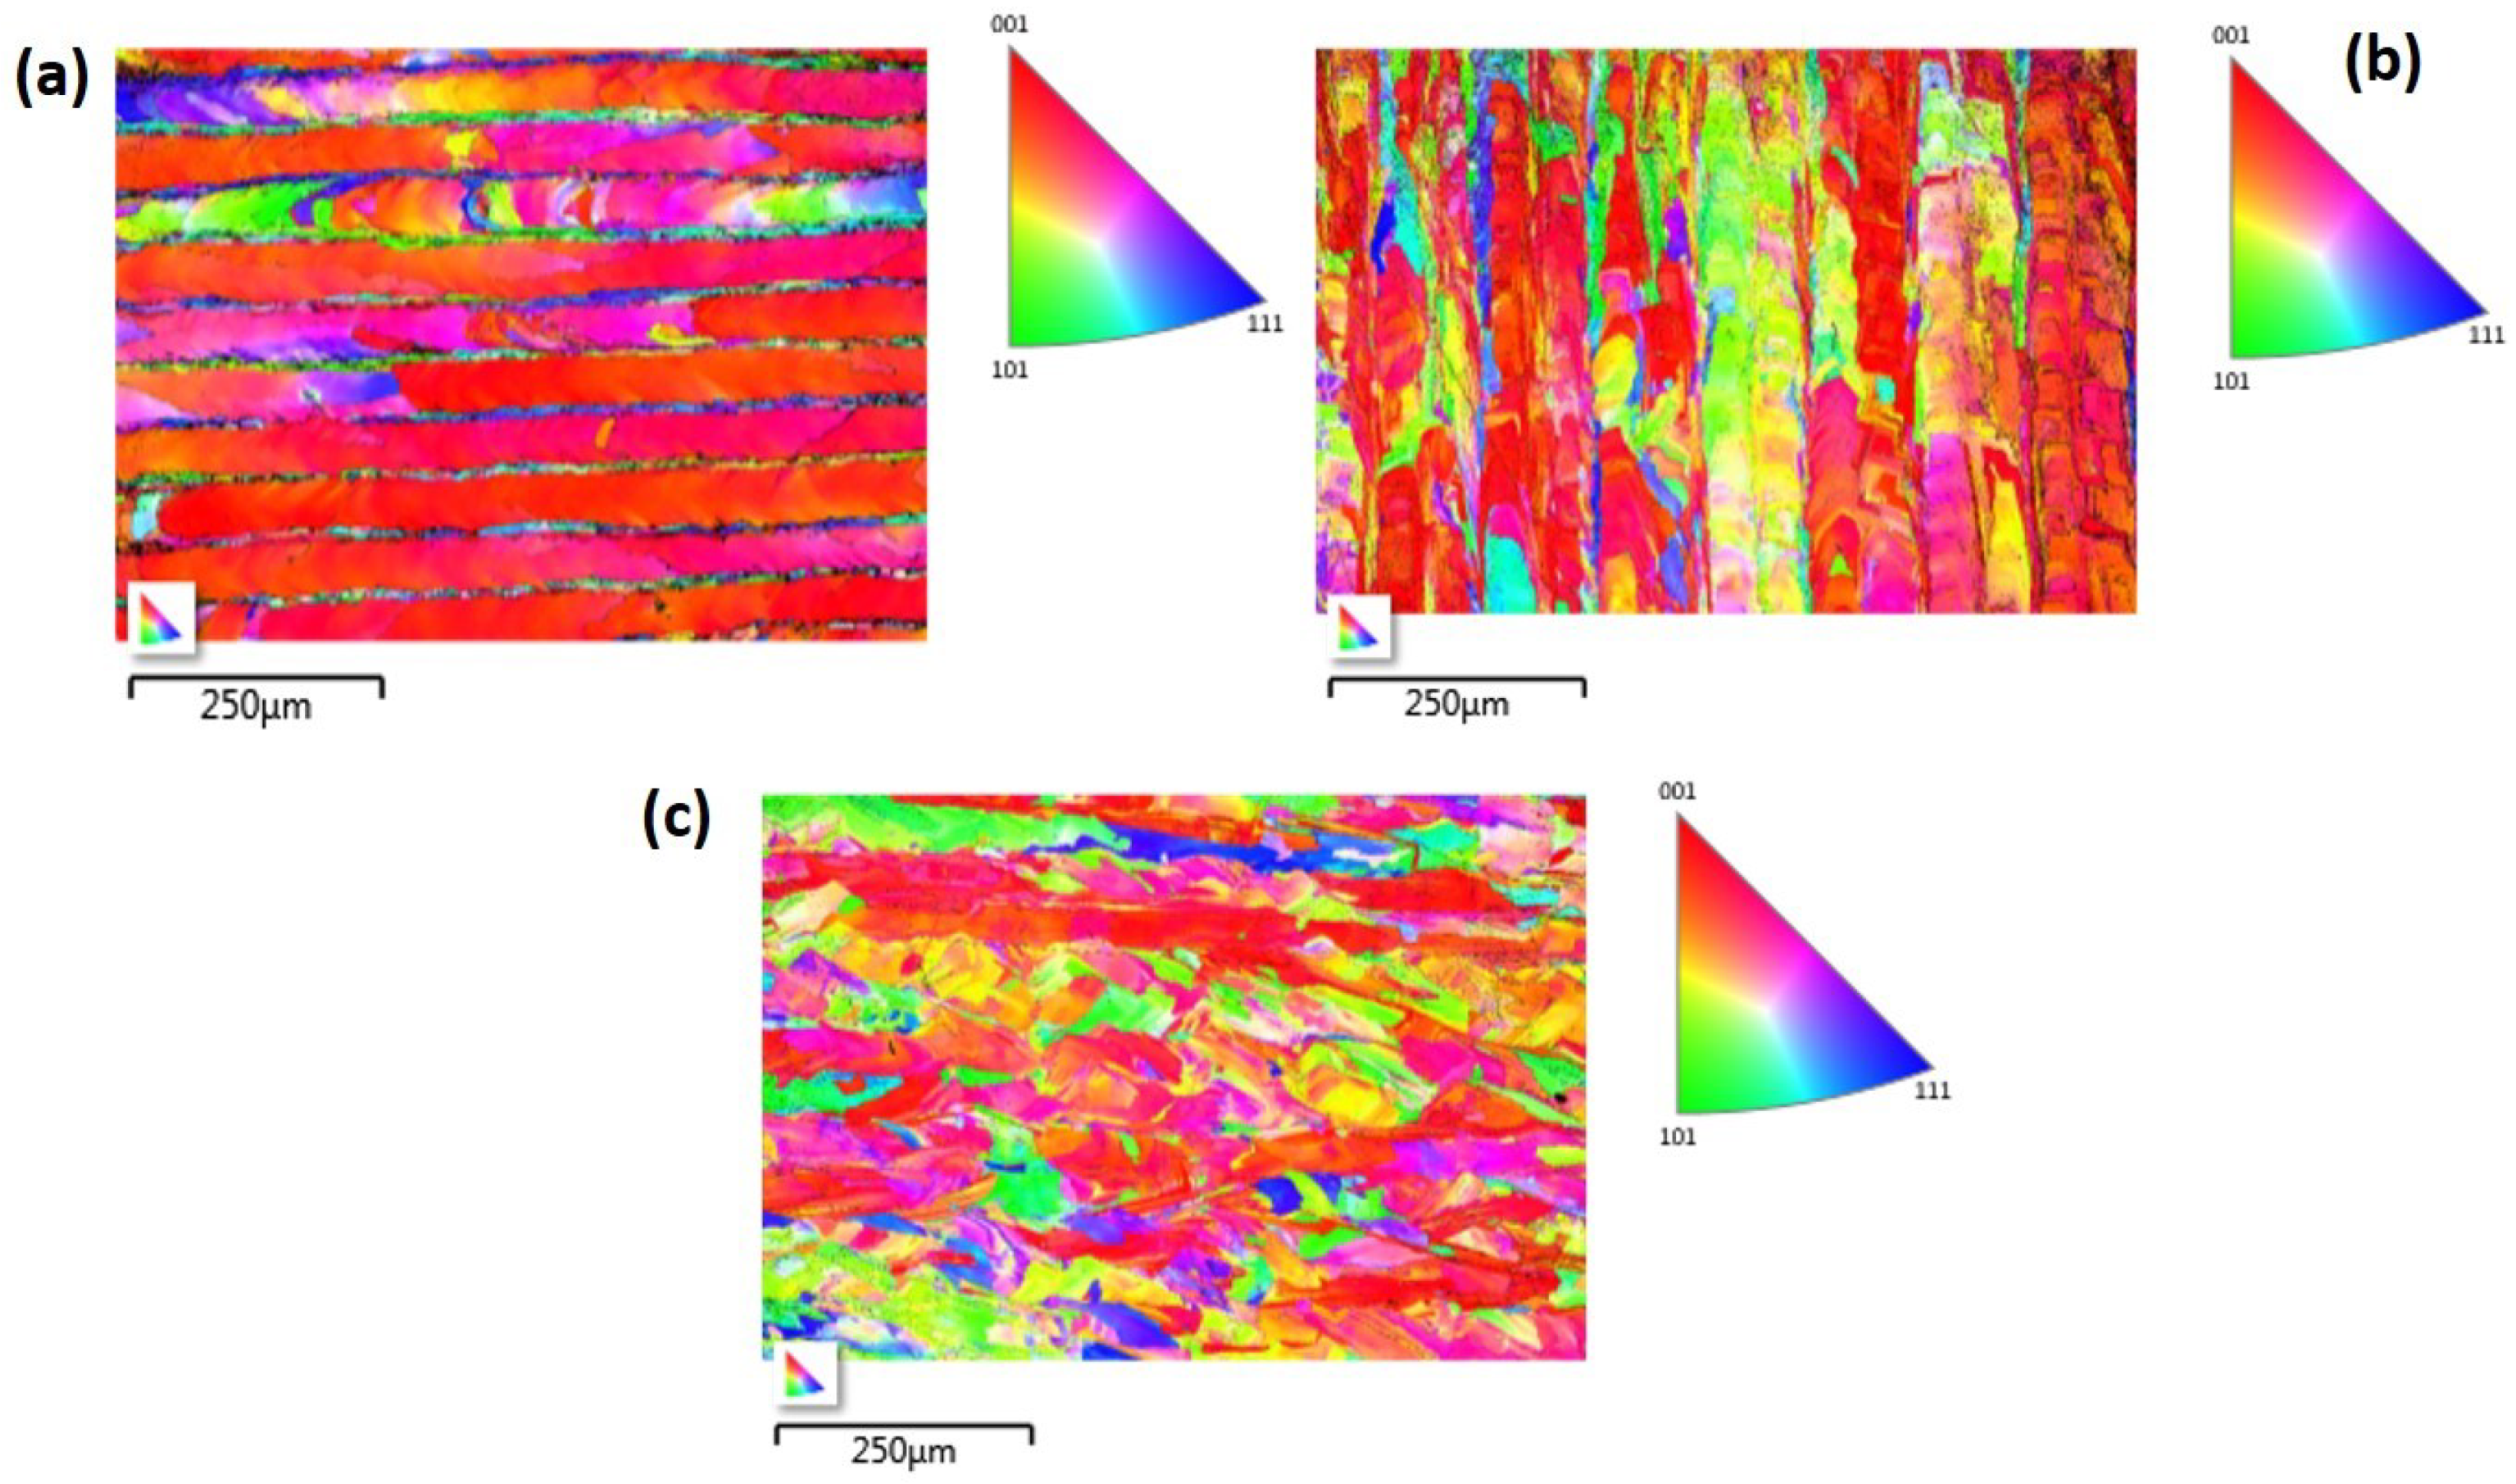
The EBSD grain orientation maps and the corresponding inverse pole figures (IPF) of the TD-SD plane in the build direction are shown in Figure 5a–c. Figure 5a shows the grain orientation maps of the continuous scanning strategy, which reveals a characteristic microstructure consisting of long columnar grains oriented towards the (001) plane (represented by red color). These long columnar grains are due to the steep temperature gradient, which is typical of the long scanning vector in the laser scanning direction [30]. The (101)- and (111)-oriented grains have a very low occurrence. Figure 5b shows the grain orientation maps of the alternate scanning strategy, in which the crystallographic texture is dominated by the grains oriented towards the (001) plane. The (101)-oriented grains also have a significant presence compared to the (111) oriented grains. From Figure 5c, the bimodular grain structure of the island scanning strategy comprising both columnar and cellular structures can be visualized [38]. This is contrary to the uniform columnar structure observed in the other strategies, which can be attributed to the lower thermal gradient of the scanning strategy along the scanning length. The columnar structure contains a combination of long and short grains with relatively smaller widths. There is no clear domination of a grain orientation in a single direction, and the directions are cluttered across the (001) and (101) planes.

3.4. Mechanism of Load-Bearing Capacity

a.
Continuous scanning
The longer scan vectors of the continuous strategy have a high-temperature gradient, which allows grain growth to occur, leading to a coarse microstructure [39,40]. Smoothing the wear track on rough surfaces requires additional effort. This accounts for the high coefficient of friction (Figure 2a). Furthermore, the layers made by the parallel hatches in the continuous scan strategy are weaker in supporting the load applied and resist the plowing action that occurs at the surface during the Hertzian contact. The applied load is concentrated along a location in one direction due to the presence of sharp asperities. This causes grain detachment, leading to delamination wear on the surface. This causes some of the pores to be exposed to the surface, particularly due to layer delamination and the presence of unmelted particles, as validated by [41]. The wear debris generated further increases the wear rate (Figure 2b). The run-in period to achieve a steady state is higher than the alternate and island strategies.
b.
Alternate scanning
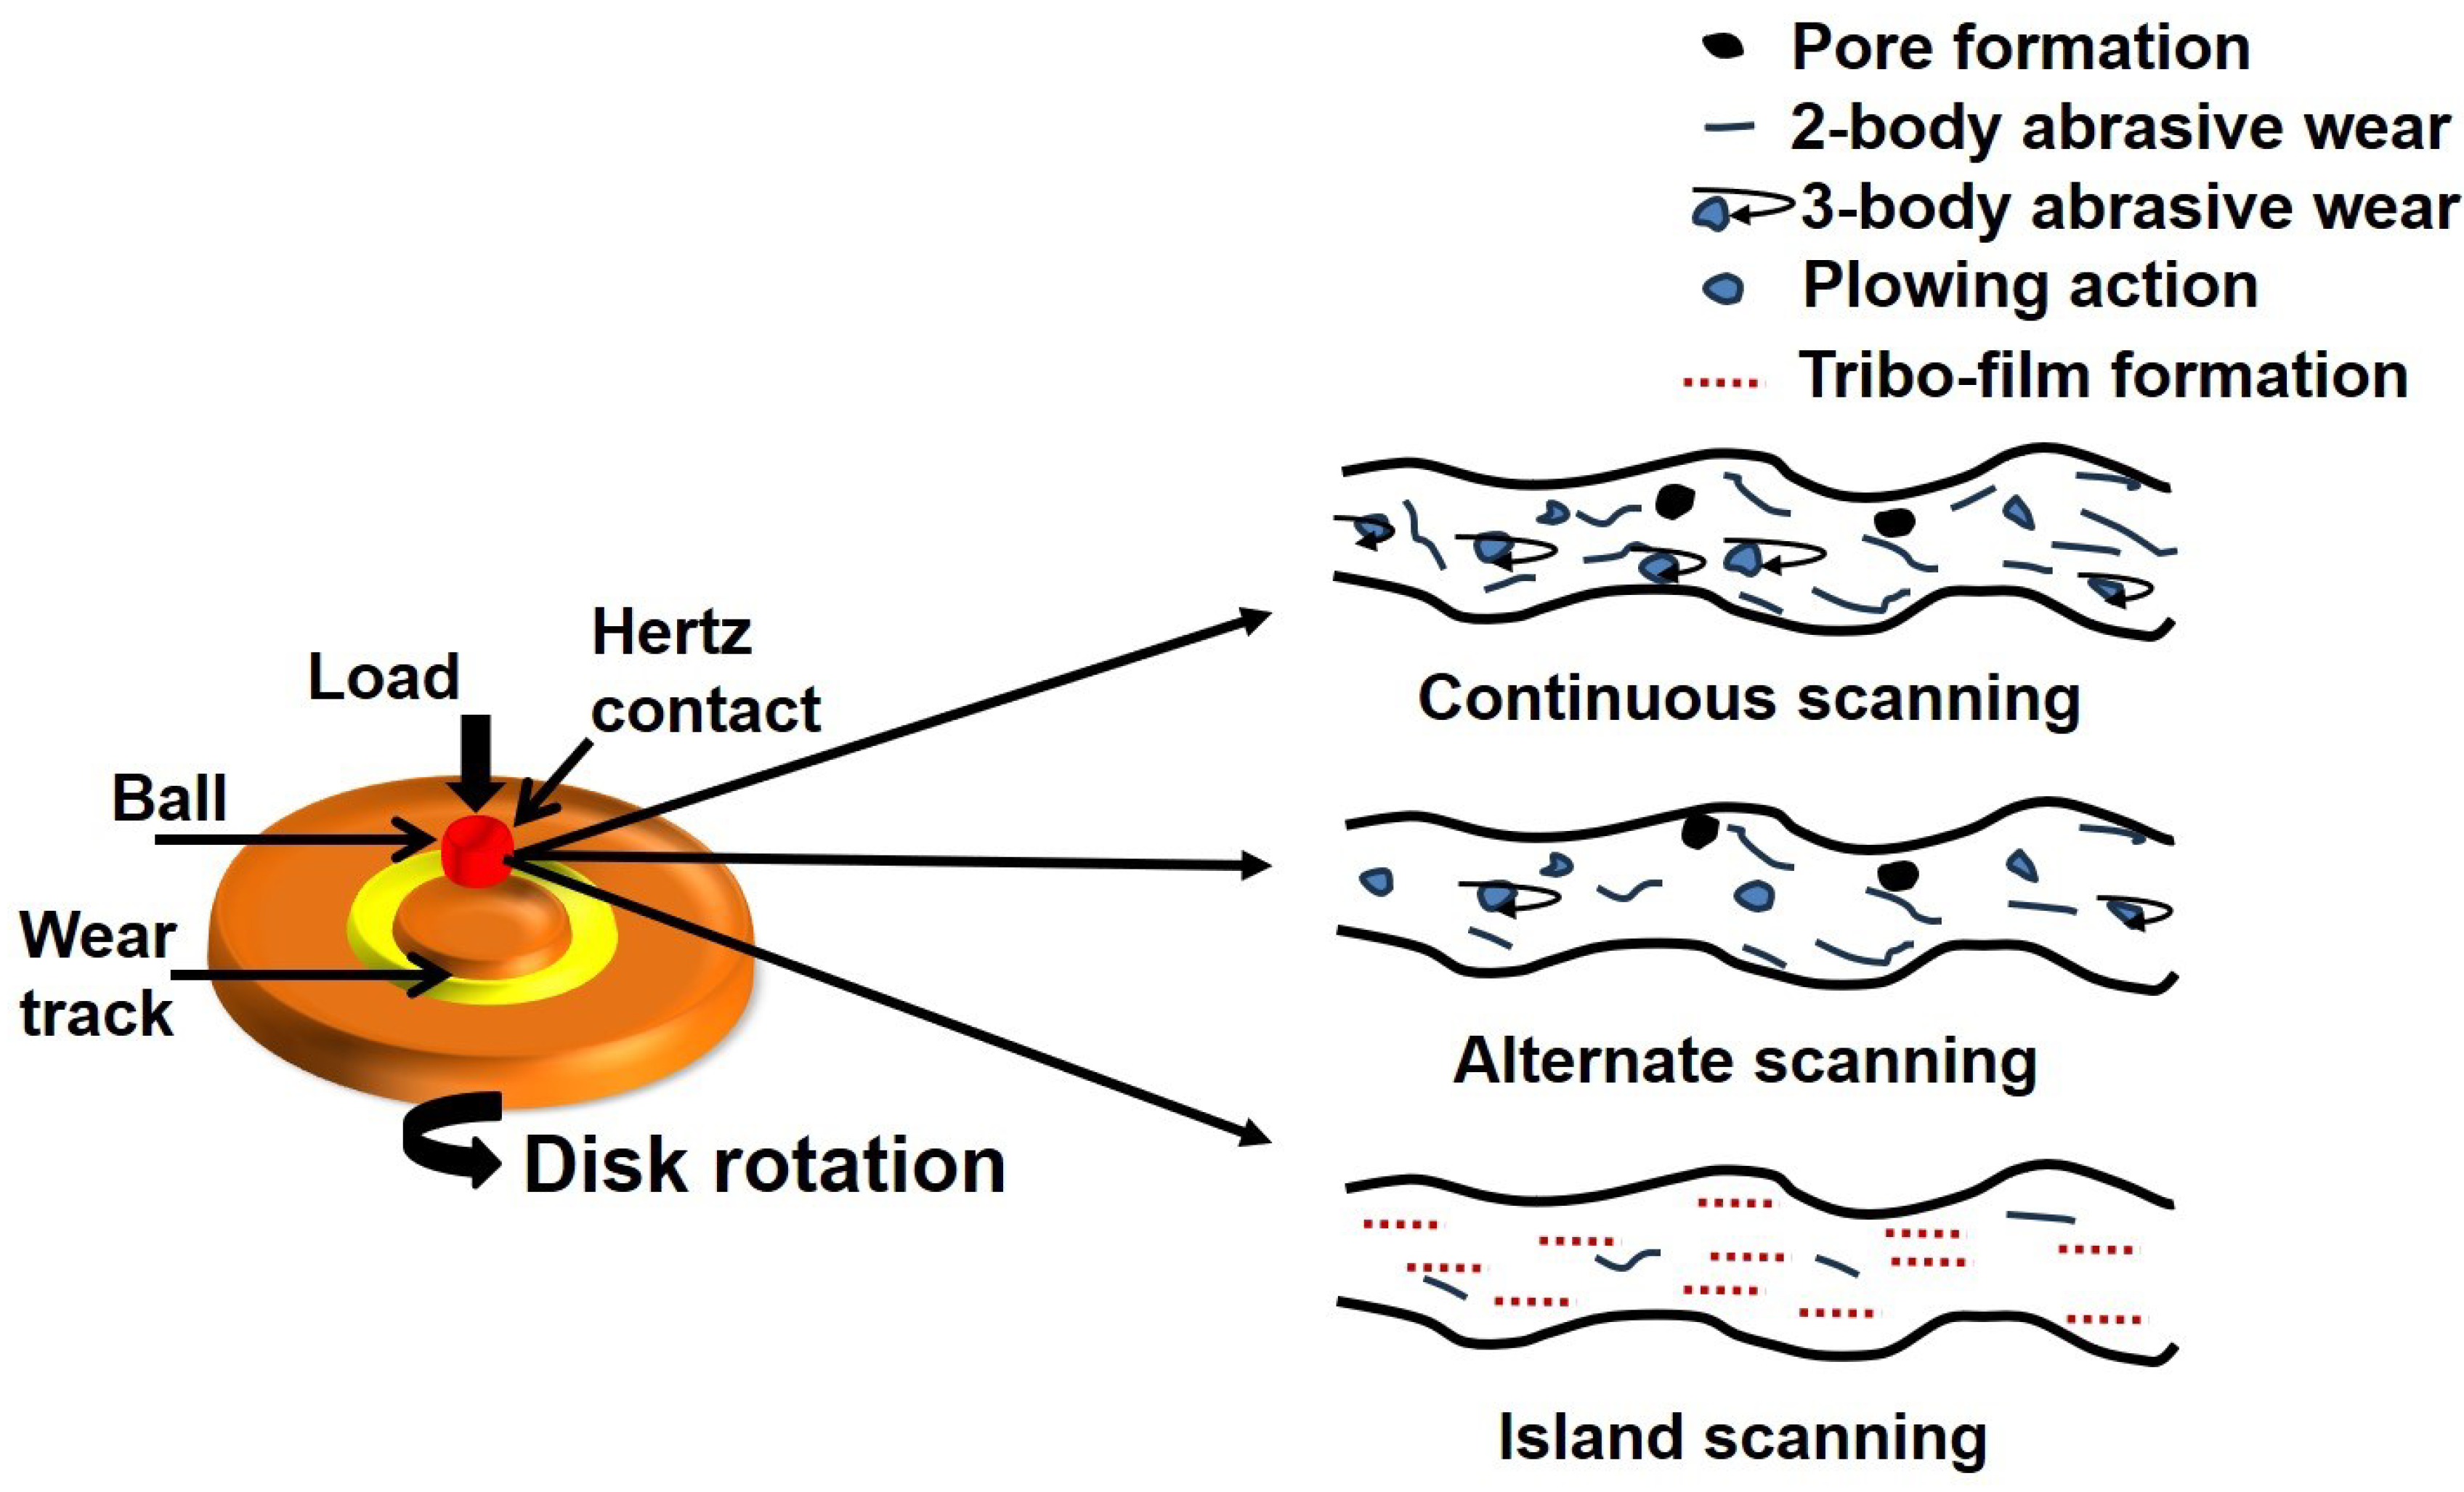
The wear resistance of the samples prepared by the alternate strategy is better than those prepared by continuous scanning. This can be attributed to the hatch style/design of the bidirectional alternate strategy, as the new layers have a scanning rotation of 90°. This design is more compact in comparison to the continuous scanning strategy, as depicted by the high hardness values (Table 4). The alternate hatching improves the wear resistance, as the asperities of the layers comparatively support the applied load better, thus reducing the plowing action on the surface (Figure 6).
c.
Island scanning
A lower temperature gradient along the scanning length of the island scanning strategy characterizes short scan vectors. This leads to the formation of closely packed and finer microstructures, resulting in high hardness values (Table 4). The surface roughness of the islands supports the applied load during the Hertzian contact; hence, it is capable of sustaining the high contact stresses that develop on the surface. This helps distribute the applied load evenly throughout the sliding area under contact. The surface delamination is prevented, and abrasive wear is reduced (Figure 6) due to build-up tribo-film formation [1]. The wear rate of the island strategy is lower than that of other strategies due to the formation of a lubricating tribo-film, reducing the metal-to-metal contact. The lubricating tribo-film forms a barrier between the contacting metal surfaces, providing a smooth layer that reduces direct metal-to-metal contact and decreases the coefficient of friction between the surfaces. This tribo-film contains good lubricating properties that create a low-shear-strength layer, causing smooth sliding between the pairs. It also protects the underlying metal surfaces from direct contact, which reduces the wear caused by two- or three-body abrasion and plowing actions (see Figure 6; island scanning strategy). As mentioned earlier in the friction results, it also helps distribute the applied load evenly across the whole contact surface, minimizing localized stress concentrations that can lead to wear. However, the obtained wear rate is low in the case of the island scanning strategy. The run-in period to achieve a steady state is the least among the other two strategies, resulting in a smooth transition.
The scanning approach used in additive manufacturing significantly impacts the surface roughness of the built parts. Due to uneven temperature distribution, continuous scanning can produce larger residual stresses and rougher surfaces [37]. Alternate scanning enhances surface quality by balancing thermal loads, whereas island scanning often provides the finest surface finish by reducing thermal gradients and residual stresses. For this reason, the island scanning strategy can be used for applications requiring high surface quality.

4. Conclusions

The impact of scanning strategies on the load-bearing characteristics of additively manufactured SS316L specimens is analyzed in the current study. The specimens are built using the LPBF technique, with three different scanning strategies—continuous, alternate, and island. The friction and wear properties are studied using a ball-on-disk setup under a fixed load of 5 N. The following conclusions have been drawn from the study:
(1)
Both continuous and alternate scanning strategies have long columnar grains with dominant grain orientations towards (001) planes. These long columnar grains develop due to the steep temperature gradient, which is typical of the long scanning vector in the laser scanning direction. However, the island scanning strategy yields a bimodular grain structure with a mix of long and short grains cluttered along the (001) and (101) planes. This is due to the low-temperature gradient along the scanning length compared to the other two strategies.
(2)
The samples prepared by the island scan strategy performed better in terms of tribological properties than the other two scan strategies, with the finished samples exhibiting a low friction coefficient (~0.29) and a lower wear rate. This superiority is attributed to the dense structure, reduced pore formation, and homogenous load distribution. The surface roughness of the islands supports the applied load, aiding the formation of a tribo-film, which prevents surface delamination during the Hertzian contact and, hence, is capable of sustaining high contact stresses developed on the surface. The island strategy has a higher sustained Hertzian contact stress of 1.75 GPa and has a lower wear rate, emerging as the preferred choice for mitigating wear under severe contact conditions.
(3)
The superior tribological properties of the island strategy can be correlated to its higher hardness values, with finished samples exhibiting a hardness of 186 HV. The increase in hardness values is due to microstructural modification such as grains, which increases the load-bearing capacity and hence provides a low wear rate compared to other scanning strategies.
The scope of future work can also be expanded to investigate the influence of varied environmental conditions on tribological performance, which would benefit broader industrial applications. Also, the impact of varying scan parameters on microstructural and mechanical properties under dynamic loading conditions can be explored.

Supplementary Materials

The following supporting information can be downloaded at: https://www.mdpi.com/article/10.3390/jmmp8040146/s1, Figure S1: Particle composition analysis of SS316L powder. Figure S2: Scanning electron microscopy image of as-built samples of (a) continuous, (b) alternate, and (c) island scanning through the LPBF technique. Figure S3: Extended version of EDS spectra after the sliding test. Figure S4: AFM image of (a) continuous, (b) alternate, and (c) island scanning.

Author Contributions

S.S.S.J.: Writing original draft, Analysis, Validation, Methodology, Investigation, Formal analysis, and Data curation. S.K.M.: Review, Analysis, Validation, Investigation, Formal analysis, Supervision. R.K.U.: Conceptualization, writing review & editing, Validation, Supervision, Methodology, Data curation. All authors have read and agreed to the published version of the manuscript.

Funding

This research received no external funding.

Data Availability Statement

All the data used in the work have been provided in the manuscript.

Acknowledgments

Authors would like to thank IIT Kanpur for providing the experimental facilities used in this work.

Conflicts of Interest

The authors declare no conflict of interest.

References

  1. Upadhyay, R.K.; Kumar, A. Scratch and wear resistance of additive manufactured 316L stainless steel sample fabricated by selective laser melting technique. Wear 2020, 458–459, 203437. [Google Scholar] [CrossRef]
  2. Kissel, H. Titanium powder and additive manufacturing: The perfect match. Met. Powder Rep. 2021, 72, 196–198. [Google Scholar] [CrossRef]
  3. Filip, P. Titanium-Nickel Shape Memory Alloys in Medical Applications. In Titanium in Medicine: Material Science, Surface Science, Engineering, Biological Responses and Medical Applications; Springer: Berlin/Heidelberg, Germany, 2021. [Google Scholar]
  4. Martin, A. Direct Metal Layer Sintering DMLS 3D Printing Guide, Electroloom. 18 August 2021. Available online: https://electroloom.com/direct-metal-layer-sintering-dmls-3d-printing-guide/ (accessed on 14 January 2024).
  5. GE Addictive. Metals in Additive Manufacturing. Available online: https://www.ge.com/additive/additive-manufacturing/information/metal-additive-manufacturing-materials (accessed on 14 January 2024).
  6. Baumard, A.; Ayrault, D.; Fandeur, O.; Bordreuil, C.; Beaume, F.D. Numerical prediction of grain structure formation during laser powder bed fusion of 316 L stainless steel. Mater. Des. 2021, 199, 109434. [Google Scholar] [CrossRef]
  7. Yakout, M.; Cadamuro, A.; Elbestawi, M.A.; Veldhuis, S.C. The Selection of Process Parameters in Additive Manufacturing for Aerospace Alloys. Int. J. Adv. Manuf. Technol. 2017, 92, 2081–2098. [Google Scholar] [CrossRef]
  8. Yasa, E. Chapter 3—Selective Laser Melting: Principles and surface quality. In Additive Manufacturing; Elsevier: Amsterdam, The Netherlands, 2021; pp. 77–120. [Google Scholar]
  9. Lyu, Y.; Wang, J.; Wan, Y.; Chen, Y. The Influence of Selective Laser Melting Process Parameters on the Property of TiAlN/TiN Multilayer Coating on the 316L Steel. Coatings 2019, 9, 377. [Google Scholar] [CrossRef]
  10. Hermawan, H.; Ramdan, D.; Djuansjah, J.R.P. Metals for Biomedical Applications. In Biomedical Engineering—From Theory to Applications; InTech: London, UK, 2011. [Google Scholar]
  11. Antony, K.; Arivazhagan, N.; Senthilkumaran, K. Numerical and Experimental Investigations on Laser Melting of Stainless Steel 316L Metal Powders. J. Manuf. Process. 2014, 16, 345–355. [Google Scholar] [CrossRef]
  12. Lodhi, M.; Deen, K.; Greenlee-Wacker, M.; Haider, W. Additively manufactured 316L stainless steel with improved corrosion resistance and biological response for biomedical applications. Addit. Manuf. 2019, 27, 8–19. [Google Scholar]
  13. Kruth, J.-P.; Badrossamay, M.; Yasa, E.; Deckers, J.; Thijs, L.; Humbeeck, J. Part and Material Properties in Selective Laser Melting of Metals. In Proceedings of the 16th International Symposium on Electromachining, ISEM 2010, Shanghai, China, 19–23 April 2010. [Google Scholar]
  14. Kan, W.H.; Chiu, L.N.S.; Lim, C.V.S.; Zhu, Y.; Tian, Y.; Jiang, D.; Huang, A. A critical review on the effects of process-induced porosity on the mechanical properties of alloys fabricated by laser powder bed fusion. J. Mater. Sci. 2022, 57, 9818–9865. [Google Scholar] [CrossRef]
  15. Soren, A.; Ghosh, D.; Kumar, S.; Mandal, S. Comprehending the correlation between microstructural features and wear performance in multiphase lightweight steels. Mater. Lett. 2023, 352, 135134. [Google Scholar] [CrossRef]
  16. Nandhakumar, R.; Venkatesan, K. A Process Parameters Review on Selective Laser Melting-Based Additive Manufacturing of Single and Multi-Material: Microstructure, Physical Properties, Tribological, and Surface Roughness. Mater. Today Commun. 2023, 35, 105538. [Google Scholar] [CrossRef]
  17. Salman, O.O.; Brenne, F.; Niendorf, T.; Eckert, J.; Prashanth, K.G.; He, T.; Scudino, S. Impact of the Scanning Strategy on the Mechanical Behavior of 316L Steel Synthesized by Selective Laser Melting. J. Manuf. Process. 2019, 45, 255–261. [Google Scholar] [CrossRef]
  18. Ghanavati, R.; Naffakh-Moosavy, H. Additive manufacturing of functionally graded metallic materials: A review of experimental and numerical studies. J. Mater. Res. Technol. 2021, 13, 1628–1664. [Google Scholar] [CrossRef]
  19. Liverani, E.; Toschi, S.; Ceschini, L.; Fortunato, A. Effect of Selective Laser Melting (SLM) Process Parameters on Microstructure and Mechanical Properties of 316L Austenitic Stainless Steel. J. Mater. Process. Technol. 2017, 249, 255–263. [Google Scholar] [CrossRef]
  20. Frazier, W.E. Metal Additive Manufacturing: A Review. J. Mater. Eng. Perform. 2014, 23, 1917–1928. [Google Scholar] [CrossRef]
  21. Choo, H.; Sham, K.-L.; Bohling, J.; Ngo, A.; Xiao, X.; Ren, Y.; Depond, P.J.; Matthews, M.J.; Garlea, E. Effect of Laser Power on Defect, Texture, and Microstructure of a Laser Powder Bed Fusion Processed 316L Stainless Steel. Mater. Des. 2019, 164, 107534. [Google Scholar] [CrossRef]
  22. Saxena, P.; Gajera, H.; Shah, D.; Pancholi, N. Effect of SLM Process Parameters on Hardness and Microstructure of Stainless Steel 316 Material. Mater. Today Proc. 2022, 50, 1653–1659. [Google Scholar] [CrossRef]
  23. Shin, W.-S.; Son, B.; Song, W.; Sohn, H.; Jang, H.; Kim, Y.-J.; Park, C. Heat Treatment Effect on the Microstructure, Mechanical Properties, and Wear Behaviors of Stainless Steel 316L Prepared via Selective Laser Melting. Mater. Sci. Eng. A 2021, 806, 140805. [Google Scholar] [CrossRef]
  24. Sun, Y.; Moroz, A.; Alrbaey, K. Sliding Wear Characteristics and Corrosion Behaviour of Selective Laser Melted 316L Stainless Steel. J. Mater. Eng. Perform. 2014, 23, 518–526. [Google Scholar] [CrossRef]
  25. Li, H.; Ramezani, M.; Li, M.; Ma, C.; Wang, J. Tribological Performance of Selective Laser Melted 316L Stainless Steel. Tribol. Int. 2018, 128, 121–129. [Google Scholar] [CrossRef]
  26. Greco, S.; Gutzeit, K.; Hotz, H.; Kirsch, B.; Aurich, J.C. Selective laser melting (SLM) of AISI 316L—Impact of laser power, layer thickness, and hatch spacing on roughness, density, and microhardness at constant input energy density. Int. J. Adv. Manuf. Technol. 2020, 108, 1551–1562. [Google Scholar] [CrossRef]
  27. Gu, D.D.; Meiners, W.; Wissenbach, K.; Poprawe, R. Laser Additive Manufacturing of Metallic Components: Materials, Processes and Mechanisms. Int. Mater. Rev. 2012, 57, 133–164. [Google Scholar] [CrossRef]
  28. Larimian, T.; Kannan, M.; Grzesiak, D.; AlMangour, B.; Borkar, T. Effect of Energy Density and Scanning Strategy on Densification, Microstructure and Mechanical Properties of 316L Stainless Steel Processed via Selective Laser Melting. Mater. Sci. Eng. A 2020, 770, 138455. [Google Scholar] [CrossRef]
  29. Mishra, A.K.; Upadhyay, R.K.; Kumar, A. Surface wear anisotropy in AlSi10Mg alloy sample fabricated by selective laser melting: Effect of hatch style, scan rotation and use of fresh and recycled powder. J. Tribol. 2021, 143, 021701. [Google Scholar] [CrossRef]
  30. Li, L.; Chen, H.; Wang, X.; Liao, Z. Effects of vector length on the melt pool morphology and grain structure characteristics of Alloy 718 in laser powder bed fusion. J. Mater. Process. Technol. 2024, 326, 118317. [Google Scholar] [CrossRef]
  31. Concept Laser GmbH. In Mlab Cusing R Operating Manual; Concept Laser GmbH: Berlin, Germany, 2019.
  32. Khairallah, S.A.; Anderson, A.T.; Rubenchik, A.; King, W.E. Laser powder-bed fusion additive manufacturing: Physics of complex melt flow and formation mechanisms of pores, spatter, and denudation zones. Acta Mater. 2016, 108, 36–45. [Google Scholar] [CrossRef]
  33. Upadhyay, R.K.; Kumar, A. Epoxy-graphene-MoS2 composites with improved tribological behavior under dry sliding contact. Tribol. Int. 2019, 130, 106–118. [Google Scholar] [CrossRef]
  34. Standard Test Method for Microindentation Hardness of Materials. (n.d.). Available online: https://www.astm.org/e0384-17.html (accessed on 14 April 2024).
  35. Gupta, M.K.; Demirsöz, R.; Korkmaz, M.E.; Ross, N.S. Wear and friction mechanism of stainless steel 420 under various lubrication conditions: A tribological assessment with ball on flat test. J. Tribol. 2022, 145, 041703. [Google Scholar] [CrossRef]
  36. Ralls, A.M.; John, M.; Noud, J.; Lopez, J.; LeSourd, K.; Napier, I.; Hallas, N.; Menezes, P.L. Tribological, Corrosion, and Mechanical Properties of Selective Laser Melted Steel. Metals 2022, 12, 1732. [Google Scholar] [CrossRef]
  37. Wang, L.; Seyeux, A.; Marcus, P. Thermal stability of the passive film formed on 316L stainless steel surface studied by ToF-SIMS. Corros. Sci. 2020, 165, 108395. [Google Scholar] [CrossRef]
  38. Carter, L.N.; Martin, C.; Withers, P.J.; Attallah, M.M. The influence of the laser scan strategy on grain structure and cracking behaviour in SLM powder-bed fabricated nickel superalloy. J. Alloys Compd. 2014, 615, 338–347. [Google Scholar] [CrossRef]
  39. Mugwagwa, L.; Dimitrov, D.; Matope, S.; Yadroitsev, I. Investigation Of The Effect Of Scan Vector Length On Residual Stresses In Selective Laser Melting Of Maraging Steel 300. S. Afr. J. Ind. Eng. 2019, 30, 60–70. [Google Scholar] [CrossRef]
  40. Neikter, M.; Huang, A.; Wu, X. Microstructural characterization of binary microstructure pattern in selective laser-melted Ti-6Al-4V. Int. J. Adv. Manuf. Technol. 2019, 104, 1381–1391. [Google Scholar] [CrossRef]
  41. Kudzal, A.; McWilliams, B.; Hofmeister, C.; Kellogg, F.; Yu, J.; Taggart-Scarff, J.; Liang, J. Effect of scan pattern on the microstructure and mechanical properties of Powder Bed Fusion additive manufactured 17-4 stainless steel. Mater. Des. 2017, 133, 205–215. [Google Scholar] [CrossRef]
Figure 1. (a) Continuous, (b) alternate (color lines shows the direction change), and (c) island scanning strategies and (d) schematic of plane identification with build direction (BD), scan direction (SD), and transverse direction (TD).
Jmmp 08 00146 g001
Figure 2. (a) Dry sliding friction performance and surface roughness (inset image) of samples prepared with different scan strategies; (b) wear behavior with the scheme of Hertzian contact under ball-on-disk test.
Jmmp 08 00146 g002
Figure 3. SEM images (~100 µm) with corresponding elements of all the prepared samples after the tribology test. The extended version of EDS spectra after the sliding test is provided in the supplementary information (Figure S3) for better visibility.
Jmmp 08 00146 g003
Figure 4. AFM image of (a) continuous, (b) alternate, and (c) island scanning. Please refer to Supplementary Information Figure S4 for the extended version of AFM images.
Jmmp 08 00146 g004
Figure 5. EBSD analysis of (a) continuous, (b) alternate, and (c) island scanning conducted on the SD-TD plane.
Jmmp 08 00146 g005
Figure 6. Contact model of the surface under different scanning strategies, i.e., continuous, alternate, and island. In continuous and alternate scanning, the wear mechanism is governed by the abrasive particle detachment and plowing action of materials under the sliding contact. Depending on the surface pore, the plowing action is sometimes intense at the contact interface, resulting in three-body abrasive wear. On the other hand, due to the tribo-film mechanism, the surface is restricted to only abrasive wear, i.e., two-body abrasive wear mechanism, and provides less friction and wear.
Jmmp 08 00146 g006
Table 1. Chemical composition of SS316L powder provided by Concept Laser GmbH.
ElementCrNiMoMnSiPCS
Wt.%16.5–18.510–132–2.50–20–10–0.0450–0.0300–0.030
Table 2. Parameters used in the Laser Powder Bed Fusion process.
Gas Flow Rate (m3/s)Gas Pressure (Pascal)Laser Power (W)Scan Speed (mm/s)Layer Thickness (µm)Hatch Space (µm)Focus Diameter (µm)Exposure Time
(µs)
0.0000666667200,00090700255650100
Table 3. Chemical composition of bearing steel ball (AISI 52100).
ElementCCrSiMnPFeS
Wt.%0.981.300.150.250.02597.270.025
Ball diameter4 mm
Ball Roughness3 µm
Sliding velocity0.41 m/s
Rotation1000 RPM
Total sliding cycles30,000
Load5 N
Table 4. Vickers hardness of LPBF sample.
SampleHardness (Finished Samples)
Continuous155 (±11)
Alternate162 (±9)
Island186 (±7)
Disclaimer/Publisher’s Note: The statements, opinions and data contained in all publications are solely those of the individual author(s) and contributor(s) and not of MDPI and/or the editor(s). MDPI and/or the editor(s) disclaim responsibility for any injury to people or property resulting from any ideas, methods, instructions or products referred to in the content.