Article

Minimum Quantity Lubrication (MQL) Supply through Internal Cooling Channels in Drilling Processes

1
Leibniz-Institute for Materials Engineering IWT, Badgasteiner Str. 3, 28359 Bremen, Germany
2
Faculty of Production Engineering, University of Bremen, Bibliothekstr. 1, 28359 Bremen, Germany
3
MAPEX Center for Materials and Processes, University of Bremen, 28359 Bremen, Germany
4
Institute of Physics, University of Oldenburg, Küpkersweg 70, 26129 Oldenburg, Germany
*
Author to whom correspondence should be addressed.
J. Manuf. Mater. Process. 2024, 8(2), 69; https://doi.org/10.3390/jmmp8020069
Submission received: 5 March 2024 / Revised: 21 March 2024 / Accepted: 21 March 2024 / Published: 29 March 2024

Abstract

:
Minimum quantity lubrication (MQL) technologies possess great potential for improving the sustainability of manufacturing processes, which can reduce the absolute quantity of metalworking fluid (MWF) and also enable near-dry chips that are easier to recycle. During drilling in particular, the MWF is transported to the contact zone through internal cooling channels of the drilling tool. The MWF supply and its associated flow behaviour in the transfer from the outlet of the cooling channels to the contact zone have not been sufficiently investigated yet. Great potential is seen in the proper delivery of the MQL into the contact zone. This work aims to visualize and quantify the cooling lubricant supply into the cutting zone using the MQL technique. The visualization of the MQL application is made possible by high-speed shadowgraphic imaging. Detailed image processing is used to evaluate the resulting images. The developed evaluation routine allows for the assessment of the impact of the main process parameters such as the varying pressure of the aerosol generator and the cooling channel diameter. It is found that the oil leaves the cooling channels at the tip of the drill bit in the form of ligaments. An increase in pressure and cooling channel diameter leads to an increase in the frequency of oil ligament separation. Three main flow regimes are identified with different separation frequencies. Low inlet pressures result in intermittently dispersed droplets. The most upper pressure levels lead to an almost continuous dispersion of the oil. At the same time, the air and oil mass flow rates also increase.

1. Introduction

Drilling is one of the most widely used manufacturing processes [1]. Due to the kinematics of the drilling process, where the tool penetrates the workpiece, the thermal and mechanical load increases rapidly as the depth of penetration of the drilling tool increases. As a result, this process can often not be carried out without using MWF, as this would lead to a massive reduction in tool life [2]. Therefore, as with most conventional machining operations, MWF reduces thermal and mechanical loads and improves chip removal. The application of MWF leads to an increase in productivity and basically fulfils three main tasks: lubrication, cooling, and chip evacuation [2,3,4]. However, the use of MWF is not only associated with positive factors but also has a considerable influence on the economy, ecology, safety, and recyclability performance of the manufacturing processes [1,5].
The constantly growing environmental awareness and the increased legal requirements in recent decades have led to a desire to reduce MWF, particularly among industrial users, especially as the share of conventional lubricant supply, including peripherals, accounts for approximately 7–17% of the total production costs of a component [6]. Based on this knowledge, various alternative supply strategies to conventional flooding lubrication have been developed and investigated in recent decades. These strategies include minimum quantity lubrication (MQL), which has shown great potential in several investigations. Sustainability is one of the main advantages of MQL due to the significantly lower quantities of oil consumption [7]. Compared to conventional flooding lubrication, in which volume flow rates ranging from 20 to 60 L/min are used, in MQL much smaller quantities of oil, between 5 mL/h and 200 mL/h, are needed [1,8,9,10]. In MQL, the oil is sprayed with compressed air and atomized based on various atomization principles, creating an aerosol (oil mist) of air and oil droplets [11]. The compressed air also acts as a carrier medium and transports the oil droplets through the system, depending on the supply strategies used. The oil mist reaches the contact zone and ensures lubrication and cooling of the active surfaces [8]. Lubrication by the oil mist reduces the friction and, thus, lowers process temperatures compared to dry machining. It has been shown that smaller droplets in the oil mist contribute to better wetting of the workpiece surface. The air flow significantly influences the droplet size [12,13]. The effects of MQL compared to other types of MWF supply show various positive aspects. A comparison of MQL with dry machining and pure air supply shows that longer tool life, lower torques, and better hole quality can be achieved when using MQL [14,15,16,17]. The comparison between MQL and flooding lubrication does not always allow any clear conclusions to be drawn. Masoudi et al. showed that MQL leads to lower surface roughness, cutting forces, and tool wear compared to flooding lubrication [14,18,19]. Other authors have found the opposite when using MQL compared to flooding lubrication, i.e., higher tool wear, higher cutting forces, and roughness [16,20]. Several studies show that the thermal load is higher when MQL is used instead of flooding lubrication [16,20]. However, due to the relatively small amount of oil used, the MQL supply results in almost dry chips, which in turn are easier to recycle [21].
Three main supply systems have been established for delivering the MQL aerosol flow: external and internal supply, whereby the internal supply can be divided into one-channel and two-channel systems. With external supply, the oil mist generated is transported into the contact zone via external nozzle systems. The number, distance, and outlet cross-section of the external supply nozzles have a decisive influence on the resulting process outcome [1,21]. External supply is usually used in sawing, milling, and turning processes due to the comparatively good accessibility of the chip formation zone. With internal supply, the oil mist is transported directly into the contact zone between the tool and the material through cooling channels located in the tool. In a one-channel system, the oil mist of the MQL is generated upstream of the machine in an aerosol generator and then transported through the spindle, the tool holder, and the tool into the contact zone. The disadvantage of this type of supply is the relatively long transport route to the contact zone, the interfaces between the components involved, and the centripetal forces due to the rotation of the spindle, tool holder, and tool. As a result, the larger droplets of the oil mist may settle as a wall film in the channels and it can be expected that mainly small droplets reach the contact zone [1,8,19,22].
In contrast, with a two-channel system, the aerosol is generated just before the tool holder. In this system, air and oil are conveyed separately as a single phase through the spindle and brought together just before the tool holder. Atomization takes place during the merging process [1]. Due to the supply system, the influence of the transport to the tool holder and the influence of the rotation of the tool spindle can be neglected, making the system particularly suitable for applications with high spindle speeds, such as high-speed cutting (HSC), where high centripetal forces occur [1,8].
The internal supply strategy has proven to be particularly effective in situations where the chip formation zone is difficult to access, such as drilling. Internal supply during drilling is made possible by cooling channels inside in the tool and has already been successfully established in industrial practice [1,8,23]. The cooling channels in the tool generally have a large ratio of channel length to channel diameter (L/D), which in turn affects the aerosol properties [19]. Simulation-based studies have shown that the majority of aerosol droplets (>90%) in the cooling channels collide with the channel walls, leading to the formation of a wall film within the cooling channels [22,23,24]. Experimental studies on the MQL supply at the outlet of the cooling channels by Stampfer et al. also indicate the presence of a wall film [19]. The effects of a wall film in the MQL supply on the wetting and lubricating ability of the tool cutting edges have so far been largely unexplored. In addition to the internal MWF supply of the drill borehole bottom, effective MQL supply during drilling also depends on other factors. These include the lubricant used, the geometric design of the internal cooling channels, and the oil and air mass flows [19].
The various research works carried out to date indicate that knowledge of the MQL liquid supply into the working zone and the state of the aerosol (oil mist) at the outlet of the internal MQL supply is limited. A better understanding of the supply conditions in the chip formation zone is, therefore, expected to reveal the potential for increasing the efficiency of the manufacturing process and improving the ecological balance. For this purpose, a detailed investigation of the flow behaviour of the supplied oil aerosol at the outlet of the cooling channels is carried out by varying the air and oil mass flow rates, which in turn depend on the adjustable pressures (air and aerosol pressure) of the aerosol generator used in this work. Based on the current state of the art, the present work aims at a visualization and quantification of the minimum quantity lubrication at the outlet of the cooling channels of the drilling tool to enable a deeper understanding of the MQL supply of the contact zone during drilling.
It is expected that with a deeper understanding of the flow behaviour and its influencing variables in the oil mist supply, an increase in the lubricating effect and, thus, the tool life can be realized. It is therefore necessary to answer the following scientific research questions in order to achieve the objectives of the present work:
  • In which state does the oil mist generated in the aerosol generator leave the cooling channels?
  • Which influence do the control variables of the aerosol generator have on the state of the escaping oil–air mixture and the air and oil mass flows?
  • Can dimensionless numbers be determined for the MQL supply used?
To answer the research questions resulting from the objective, various measurement methods (Figure 1) are applied. On the one hand, the flow is to be visualized, and on the other hand, the influence of the control variables of the MQL is to be quantified with the help of suitable variables to be identified. The flow behaviour of the oil mist at the outlet from the internal cooling channels is visualized using the shadowgraphy method. In addition, suitable measurement methods are used to determine the air and oil mass flows, leaving the drilling tool with varied control variables. The image series of the liquid state of the oil mist resulting from shadowgraphy are evaluated and quantified with the aid of an evaluation unit. In the further course of the work, the air and oil mass flows are used to describe the fluidic processes and, above all, to transfer the findings to general fluid parameters that are independent of the specific aerosol generator and tool used. An analysis of the influencing variables of the control variables of the MQL is carried out using the aforementioned measurement methods.

2. Experimental Setup and Measurement Methods

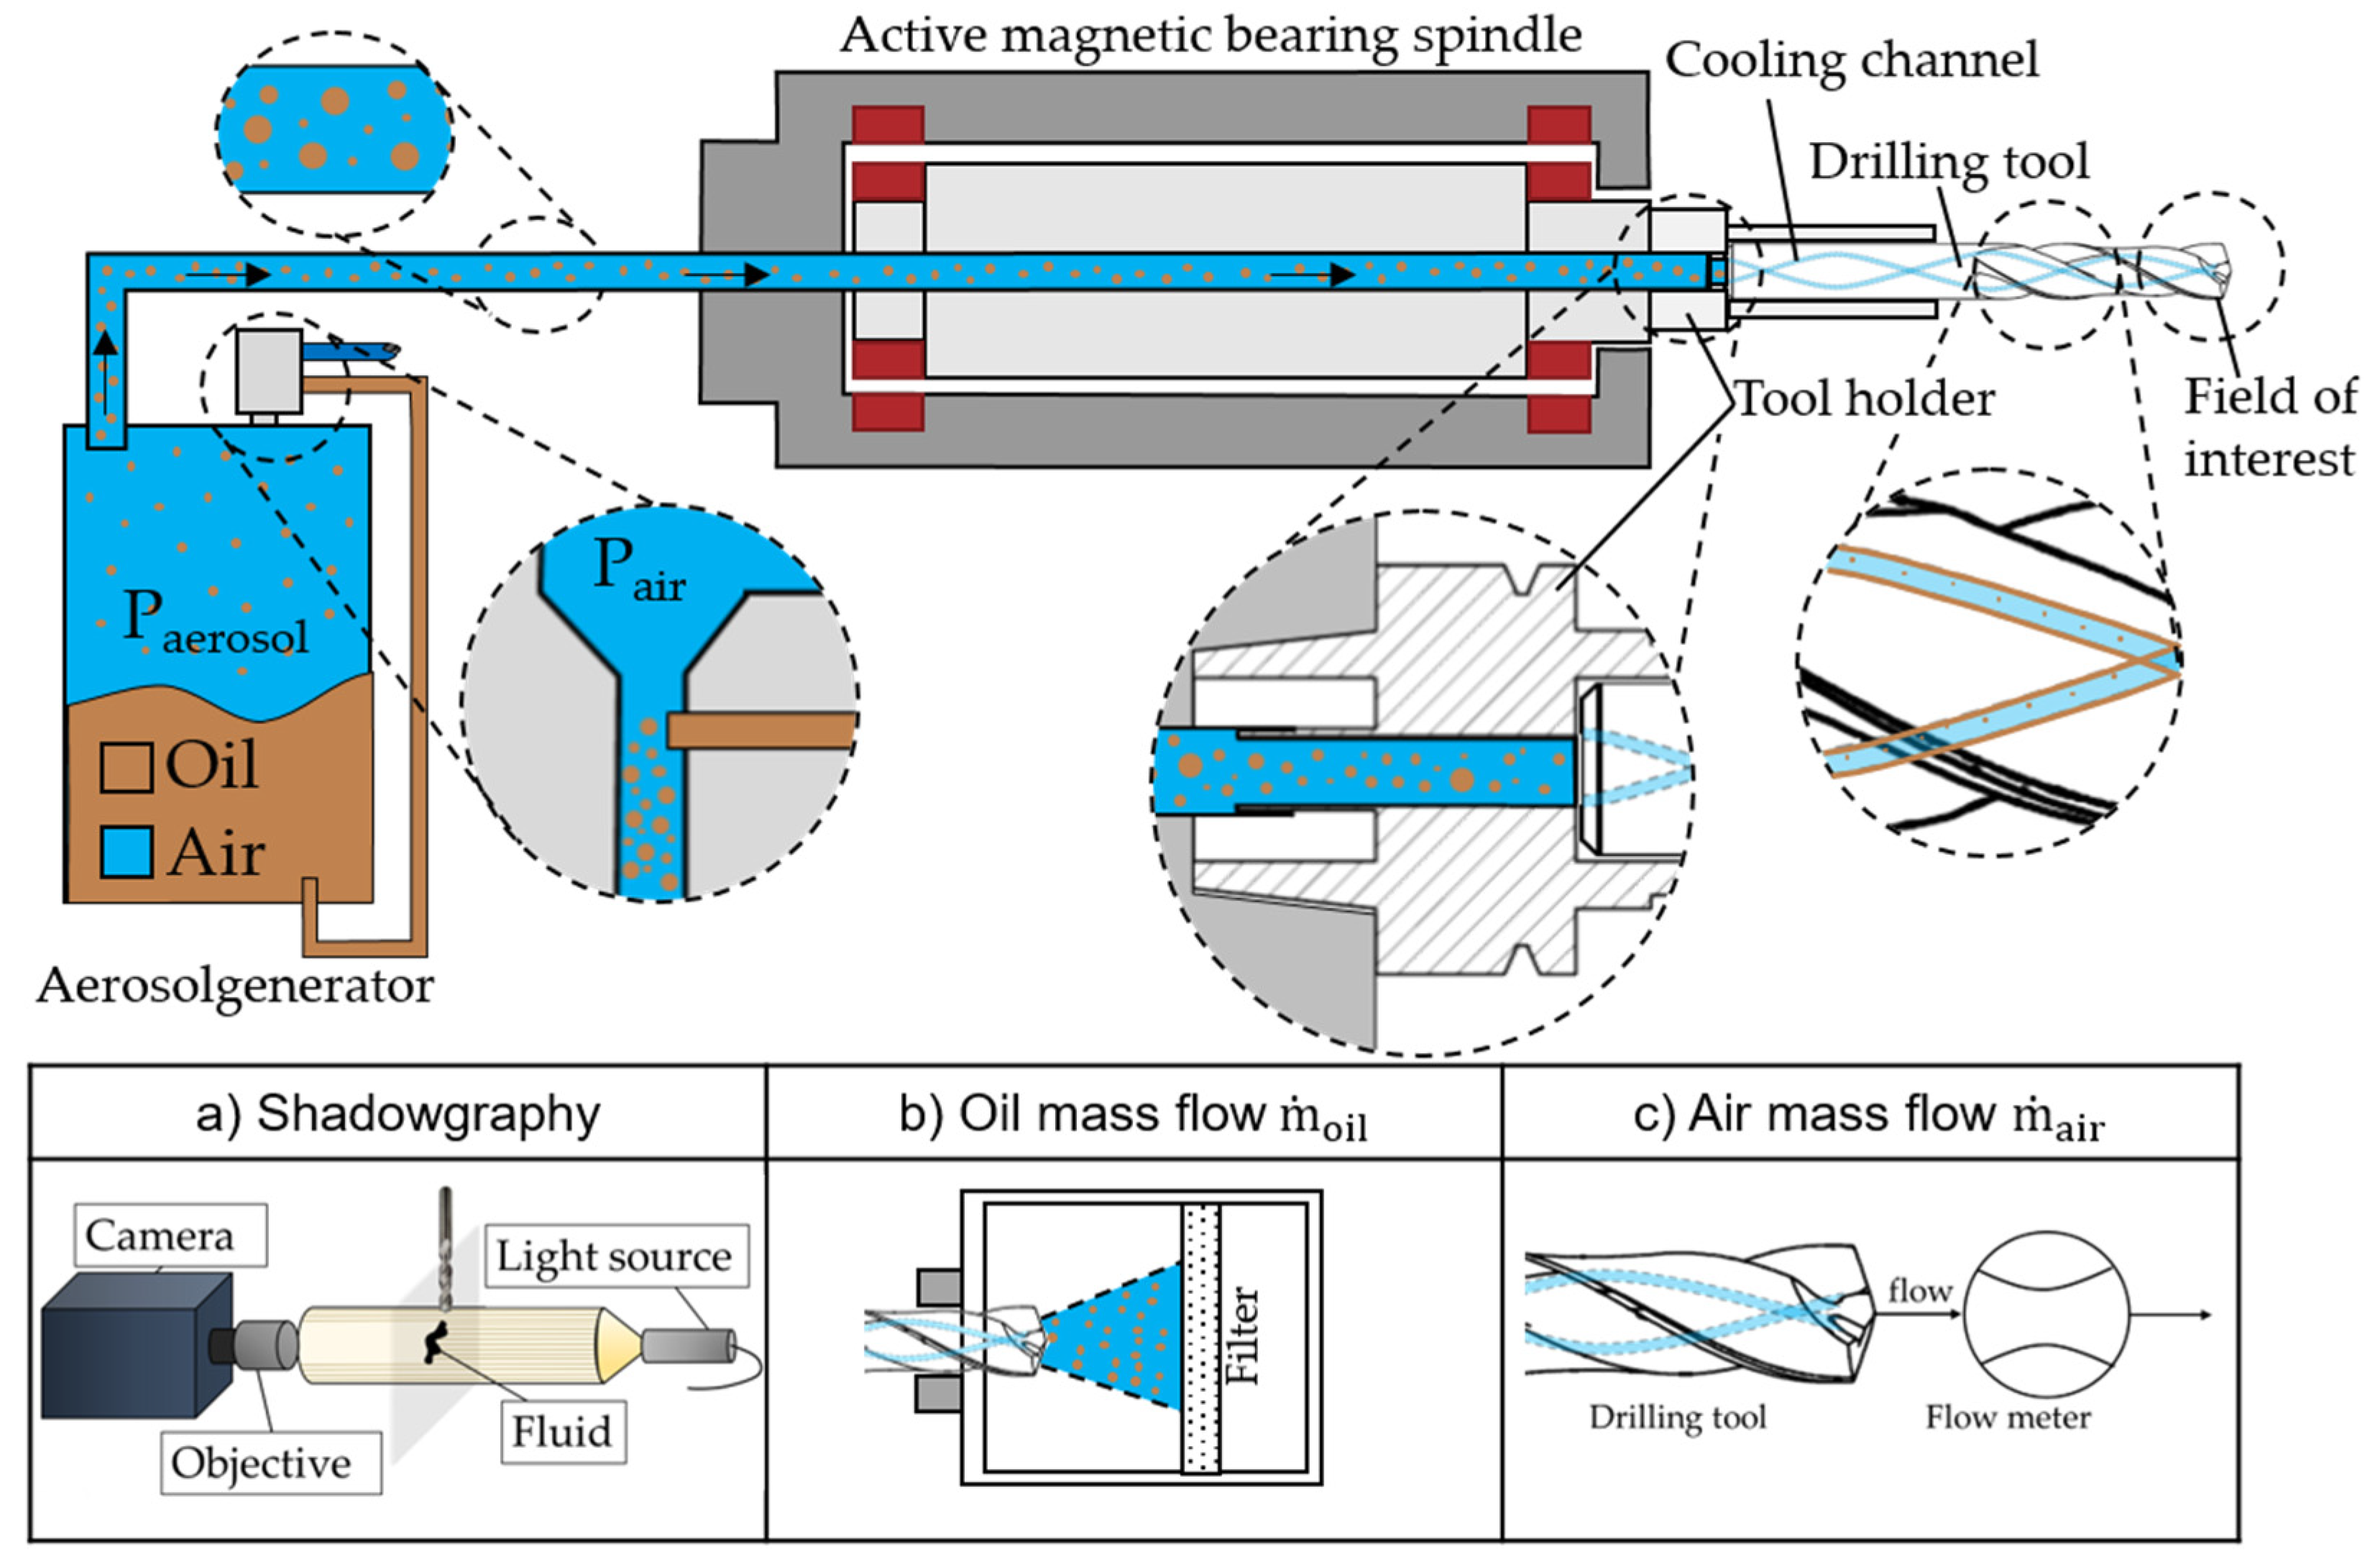
Figure 1 shows the underlying overall system of the aerosol generator and supply used in this work and the path of the oil mist generated to the contact zone. Furthermore, an overview of the test setups and measurement methods to investigate the flow behaviour of the oil mist at the outlet of the internal cooling channels is shown. The aerosol generation is carried out with an HPM Breeze LSJ30 air spray injector (HPM Technologie GmbH, Dettingen an der Erms, Germany). This device is a single-channel system in which the oil mist is generated before being transported through the lines into the tool spindle. The synthetic oil Alumicut 659 (Setral Chemie GmbH, Seeshaupt, Germany) is applied, the physical parameters and material values of which are listed in Table 1. The operation of the aerosol generator is based on the Venturi principle, in which the outlet from the Venturi nozzle is connected to the pressurized tank (pressure Paero). The ambient air used for the Venturi nozzle is pressurized (pressure Pair) in advance with the aid of a compressor to a defined pressure higher than that of the downstream pressurized tank, in order for the aerosol generator to function correctly. The pressurized ambient air flows through the Venturi nozzle during operation, which increases the air velocity depending on the taper ratio due to the geometric design. Due to mass and energy conservation, the pressure in the taper decreases, resulting in a pressure difference to the oil reservoir, which causes the oil to be injected from the pressurized tank into the Venturi. In the tapered cross-section of the nozzle, the liquid is atomized due to the high relative velocities between the oil and air flow. This leads to the formation of the dispersed phase of the aerosol or so-called oil mist, a mixture of air and dispersed oil droplets. After the nozzle, the resulting oil mist is transported directly back into the tank, where the pure oil for atomization by the nozzle is stored. This design enables the filtering of larger and thus more inert oil droplets of the oil mist, as these collide directly with the oil reservoir. This aerosol generator produces droplets in the aerosol of sizes in the order of <20 µm.
The pressure difference required for the nozzle to function is regulated via two adjustable pressures, the first for the air and the second for the pressurized tank at the Venturi nozzle outlet. The air inlet pressure is referred to as “air pressure” Pair, while the pressure at the other end of the Venturi nozzle in the pressurized tank is defined as “aerosol pressure” Paero. In the aerosol generator, the Venturi nozzle is attached to the upper part of the pressurized tank, which allows for different preset pressure parameter combinations. The oil mist is fed into the contact zone between the tool and the workpiece via a valve and the prevailing pressure difference between the aerosol pressure in the pressurized tank and the ambient pressure Pambient is measured. As a result, the oil mist in the pressurized tank is extracted and transported via the channels through the tool spindle, the tool holder, and the tool into the contact zone.
It is to be noted that a minimal difference between air and aerosol pressure must prevail, otherwise it is not possible to proper operate the aerosol generator. Therefore, it is not possible to set an arbitrary aerosol pressure at a given air pressure. In particular, the air pressure must be at least 1 bar higher than the aerosol pressure.
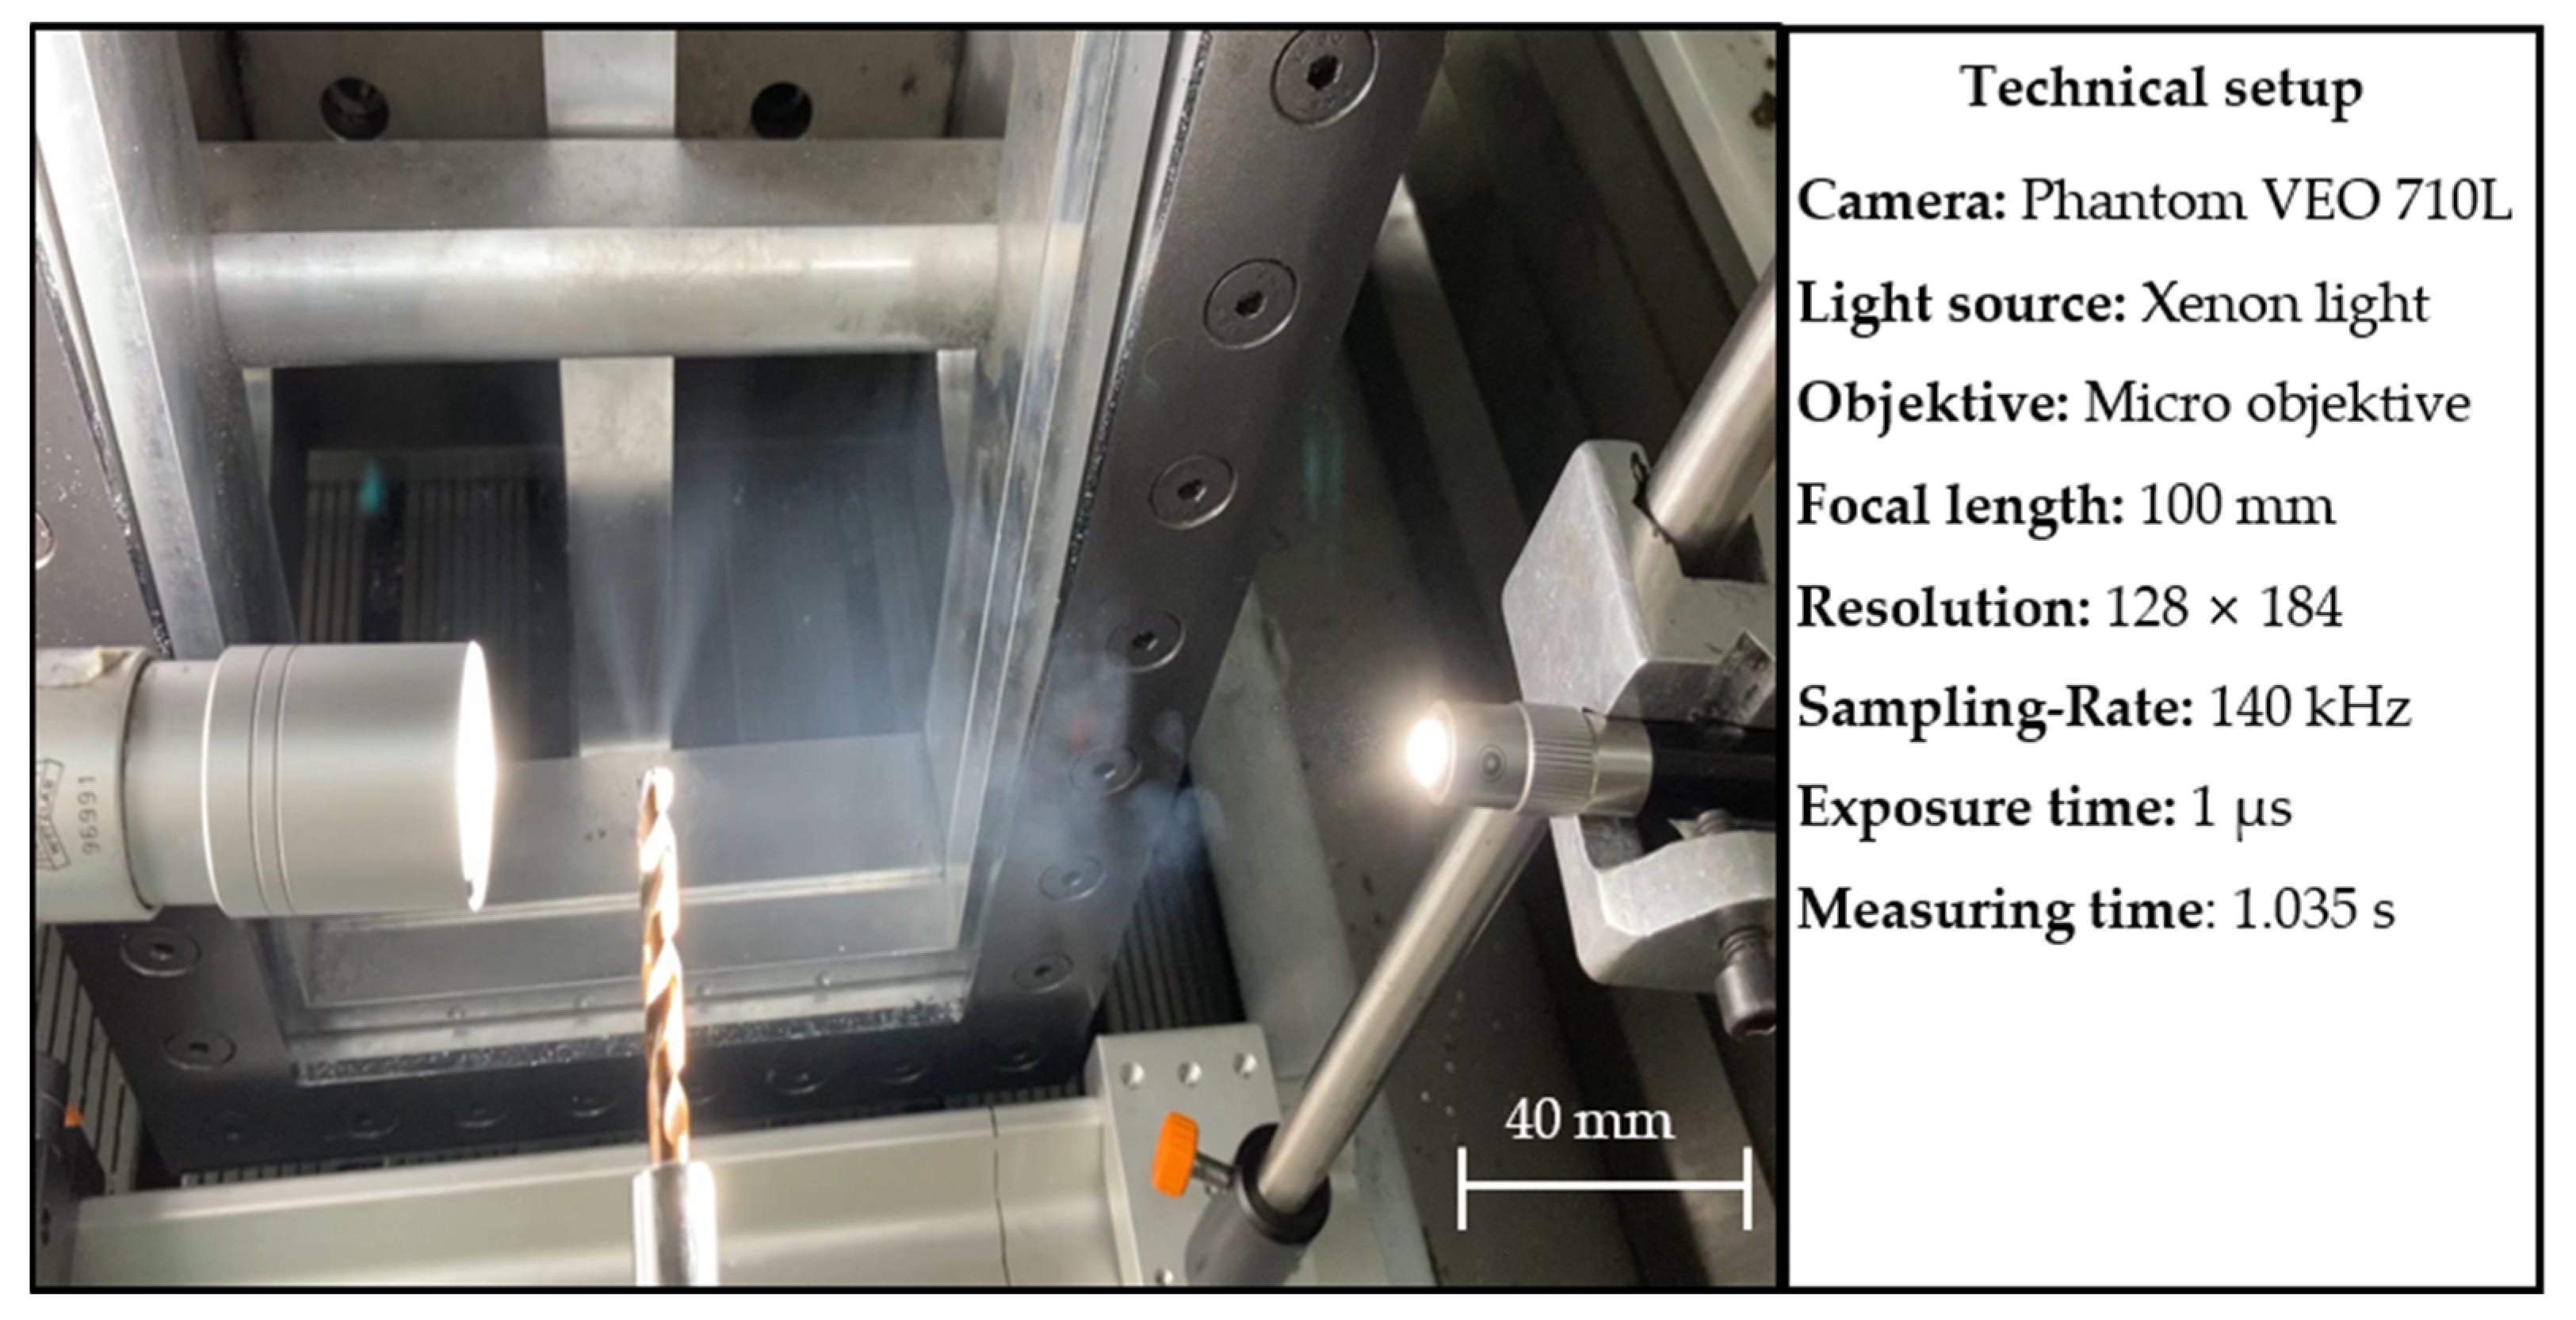
The MQL aerosol flow emerging from the drilling tool at the outlet of the cooling channels is visualized using high-speed shadowgraphy. The experimental setup is shown in 
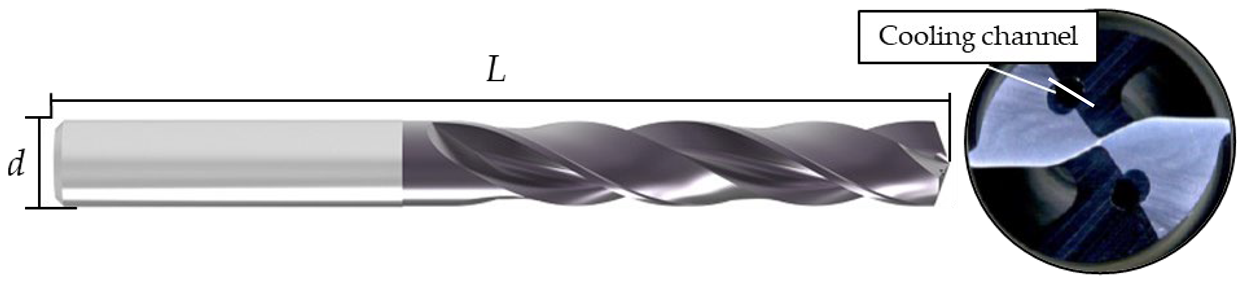
Figure 2. A high-speed camera and a light source are positioned collinearly opposite to each other, with the MWF to be examined (oil mist) between them. With the MQL supply, high exit rates of the oil mist from the cooling channel are to be expected due to the assumed high air velocities above 200 m/s. Thus, a high-speed camera needs to be used (Phantom VEO 710L (Vision Research Ltd.-UK, Leicester, UK), recording rate 140 kHz). In addition, a micro lens is utilized due to the cooling channel diameters of only 0.8 mm and 1 mm of the drilling tools examined (Table 2). With the method used, the oil droplets in the oil mist may lead to reflection or absorption of the incident light so that the camera sensor in this area captures little or no light. The result is grey or black pixels in the high-speed images (Figure 3). The use of a statically held drill without rotation allows an exact assignment of the pixels.
To quantify the set MQL conditions with the resulting oil mist, the influence of the air and oil mass flow rates was investigated. To measure the oil mass flow rate, a setup has been used in which the oil droplets of the aerosol were separated in a coalescence filter, collected, and its mass weighed over a defined time interval. Figure 1b shows a schematic diagram of the setup with the tip of the drilling tool enclosed in a container containing the filter. The test setup described is designed to ensure that the flow from the drilling tool is affected as little as possible to obtain the most realistic oil mass per time. To measure the oil mass, the filter was weighed before and after a 30 min time interval using a precision balance (Pioneer from Ohaus). The oil mass flow rate was calculated from the resulting mass difference and the defined time interval.
The air mass flow rate, m ˙ , is calculated on the basis of the detected volumetric flow rate, the gas density, and the ideal gas law.
m ˙ = ρ · V ˙ = V ˙ · P a i r R s · T a i r
The air volumetric flow rate V ˙ , air pressure Pair, and temperature Tair were recorded directly at the outlet from the cooling ducts. The air flow rate has been determined using the thermal heat loss method with an SFAH 100 flow meter (Festo Vertrieb GmbH & Co. KG, Esslingen, Germany). The air pressure was determined using a PT5414 static pressure sensor (ifm electronic GmbH, Essen, Germany). The ambient temperatures during the measurements were used for the temperature Tair. The air velocity u at the cooling channel exit is calculated using the measured data and the cross-section area of the cooling channel as follows:
m ˙ = ρ · V ˙ u = m ˙ ρ · A
The main adjustable process variables (air and aerosol pressure) at the aerosol generator were varied in a full factorial design of experiments to analyse their influence on the flow of the MQL at the outlet of the cooling channels. The air pressure has been varied from 6 bar to 12 bar, and the aerosol pressure ranges from 5 bar to 11 bar. The selected parameter ranges allow for an effective operation of the aerosol generator taking into account the condition that the pressure difference must not be less than 1 bar.
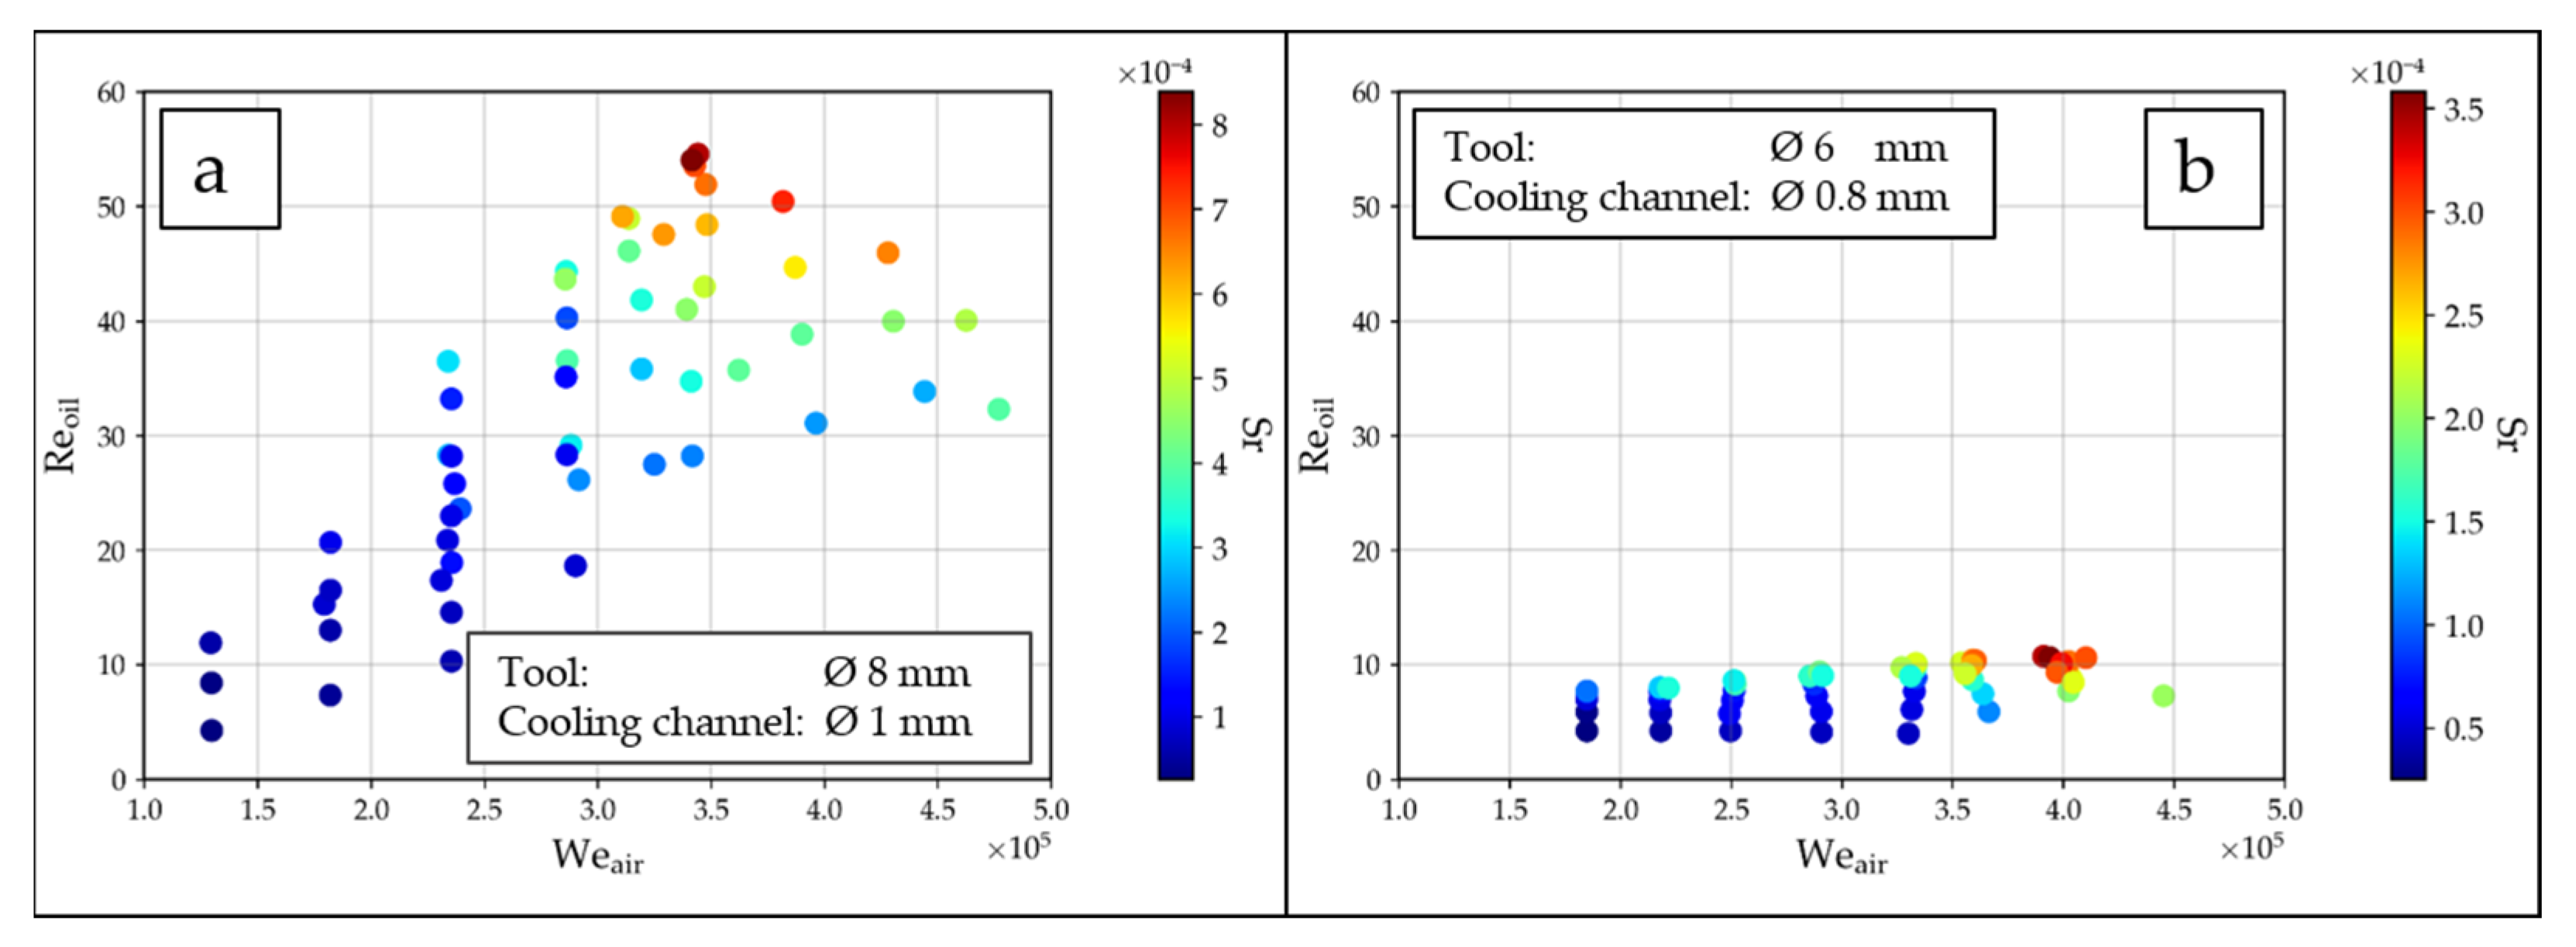
In addition to the influence of the air and oil mass flows on the MQL supply, the effects of different tools and, therefore, different cooling channel diameters were investigated. Due to the dependence of the outer tool diameters on the cooling channel diameters, the relevant geometric information on the two drilling tools used is shown in Table 2.

3. Evaluation Method

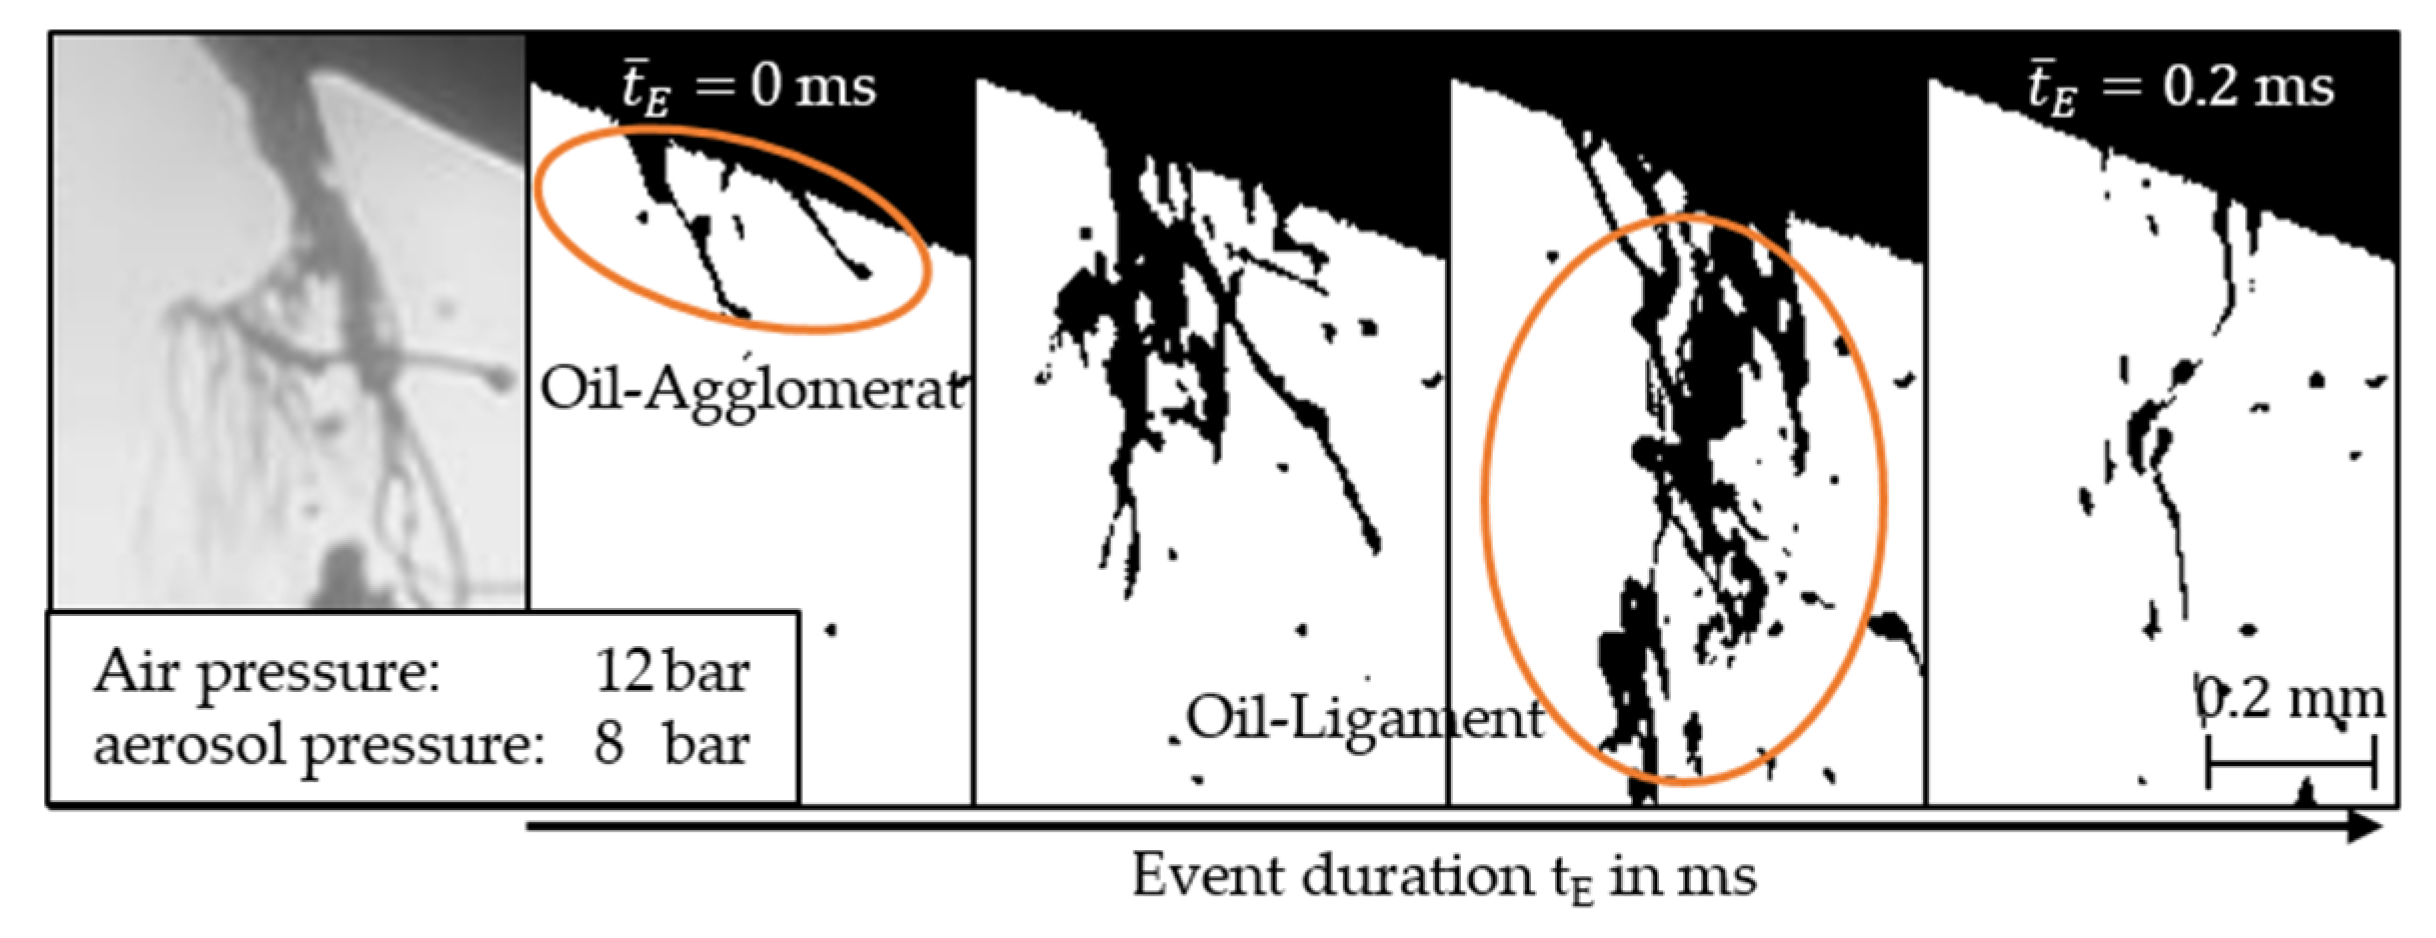
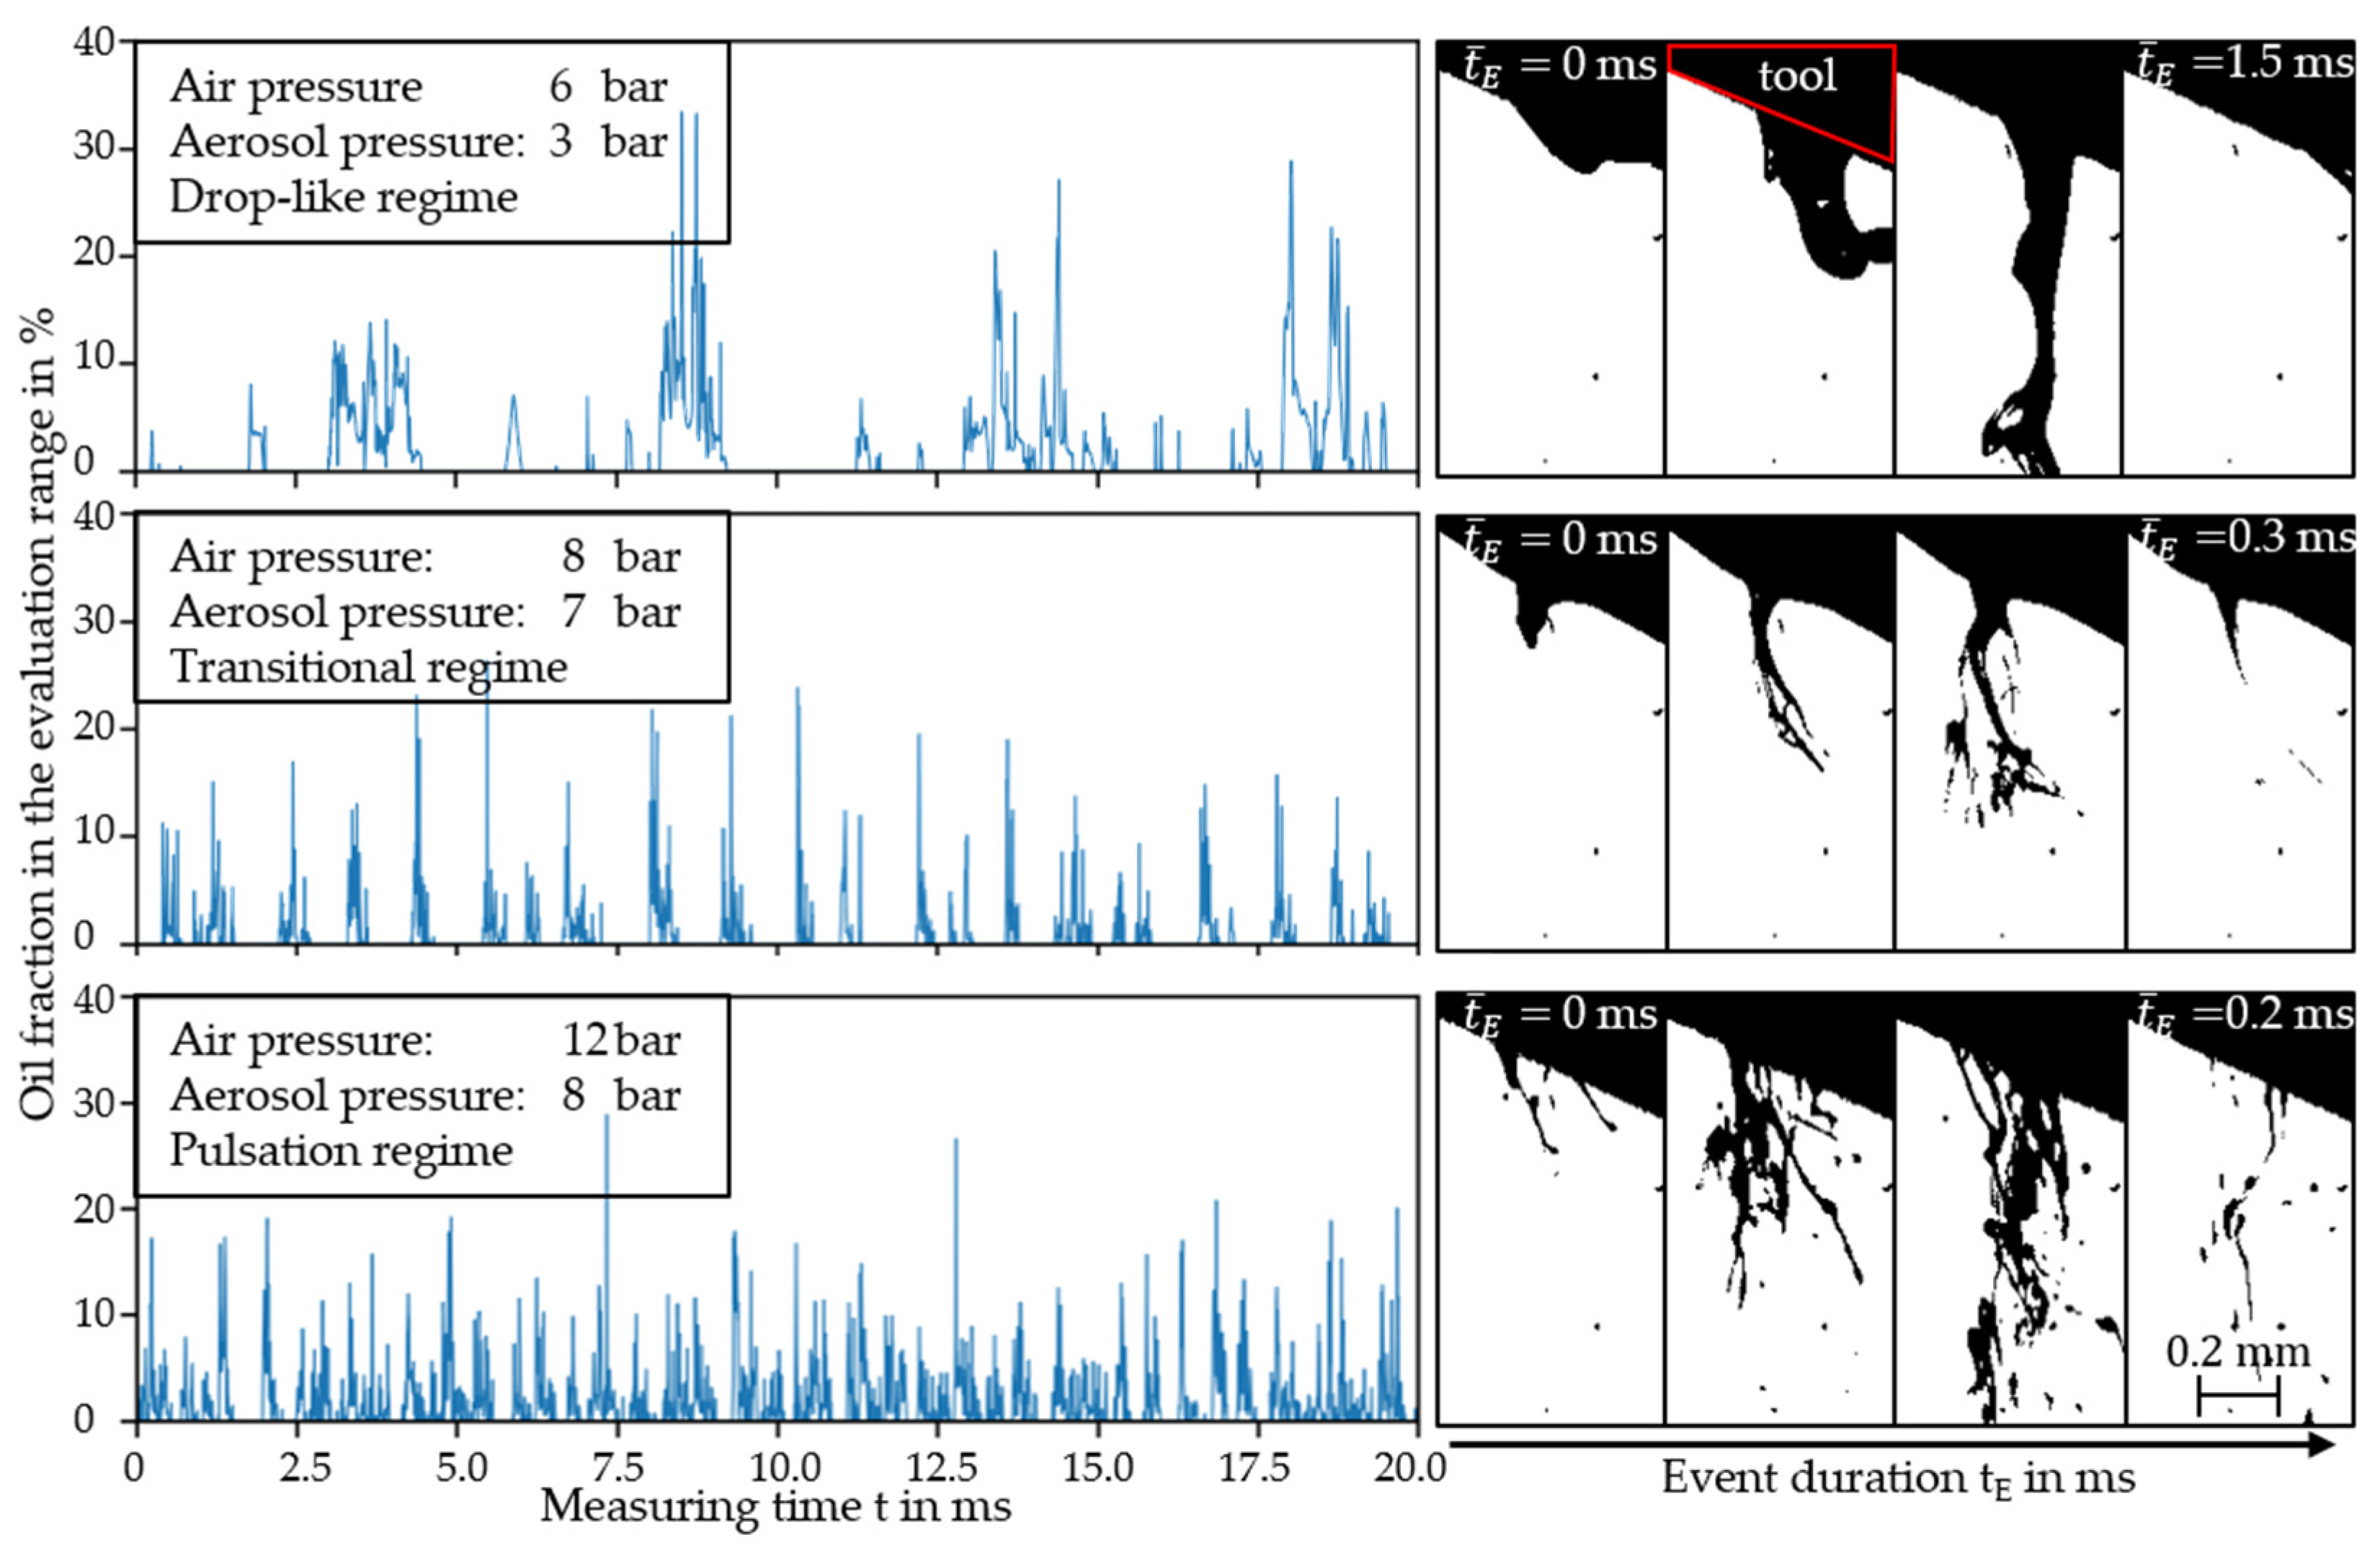
The images from the shadowgraphy show that when MQL is supplied during drilling, the oil initially collects at the outlet of the cooling channels as an oil agglomerate and separates at specific intervals in the form of a so-called ligament. This observation was also made by Stampfer et al. [19]. This process will henceforth be referred to as an “event” in the context of this work. Figure 3 illustrates a sequence of a typical event.
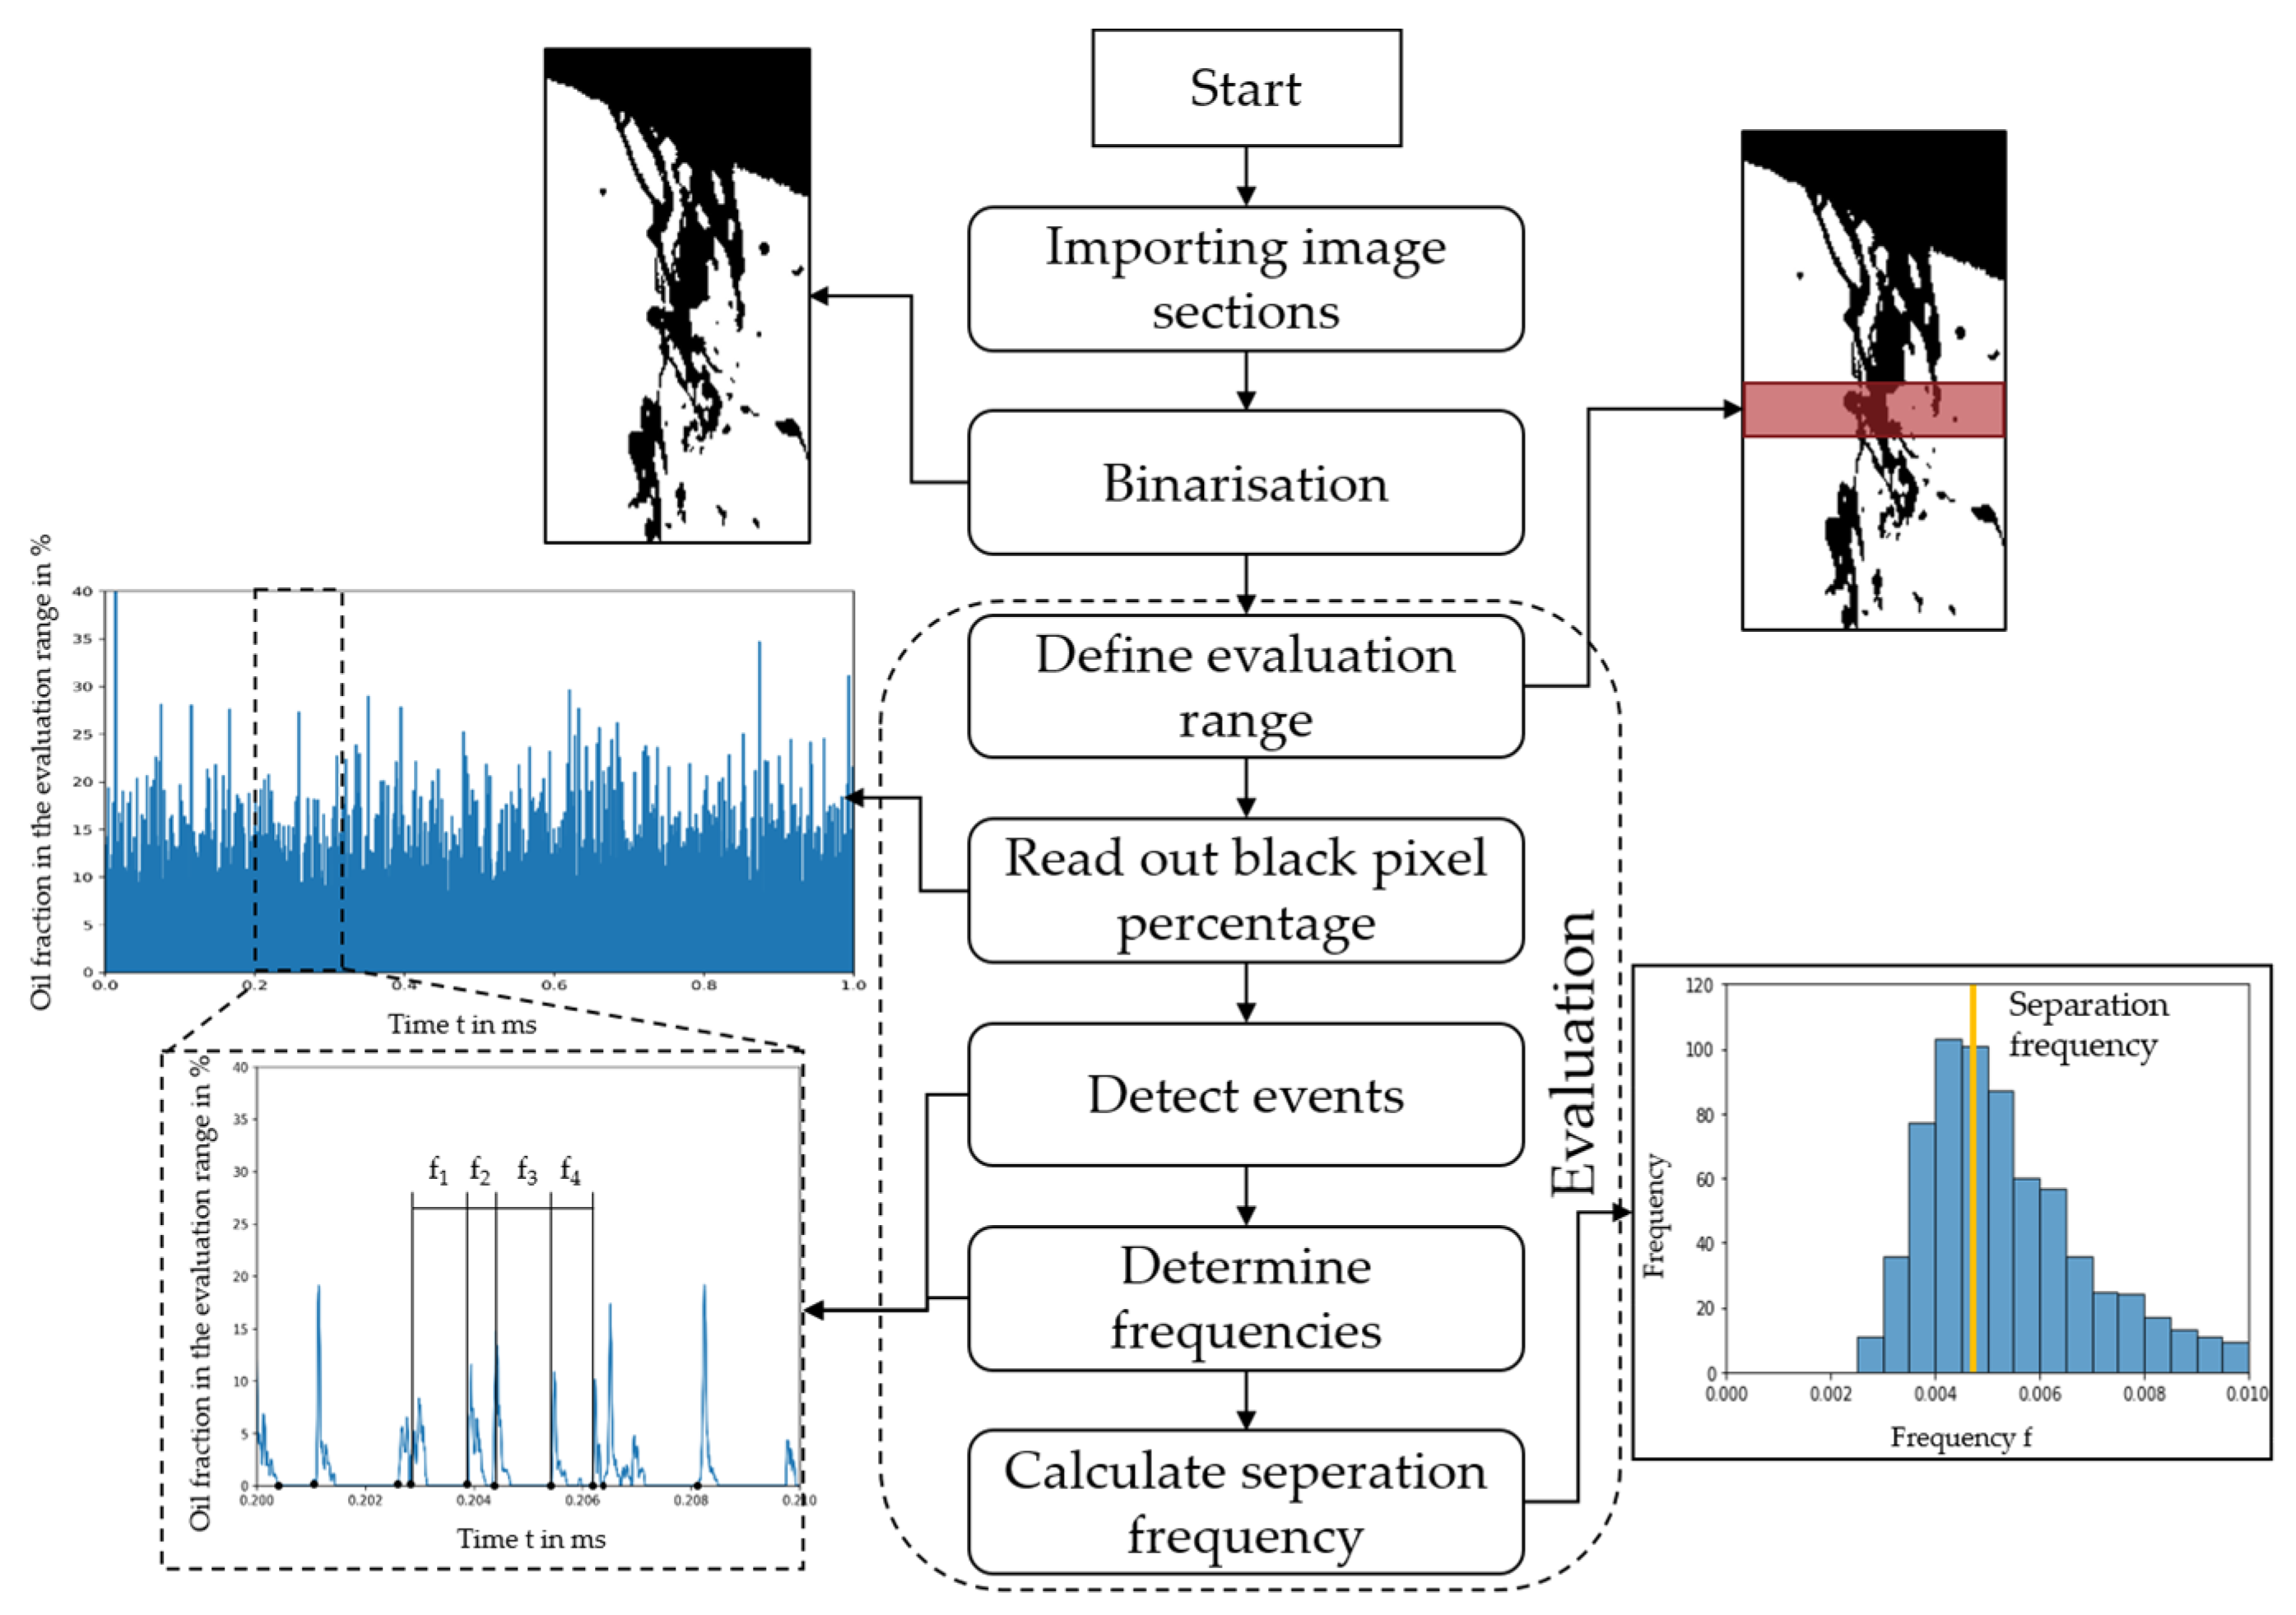
A computer-aided evaluation process was used to detect the events in order to ensure a fast, uniform, and objective analysis of the resulting images based on a Python routine. Based on the resulting events, the separation frequency is defined, which is used to quantify the flow behaviour of the oil portion of the MQL supply. The separation frequency describes the statistical distance between the events, i.e., the start at which the oil wall film is deposited at the cooling channel outlet in the form of an oil ligament (Figure 3).
Figure 4 shows a simplified programme flow chart of the evaluation unit developed in this work for detecting the events and calculating the separation frequency. The image series resulting from the shadow impact method are read in image by image by the evaluation unit. The 8-bit images are binarized using a suitable threshold value of 128 to ensure a clear distinction between the oil and the environment. As a result of the binarization, the oil in the image was displayed in black (value of 0) and the surroundings in white (value of 255). Based on this, a fixed rectangular evaluation area has been defined to detect the events where each black pixel is counted. This procedure allows to determine the proportion of black pixels in the evaluation area. If the proportion of black pixels in the evaluation area exceeds 1%, this is a preliminary event. Below this threshold, it could be oil residue from a previous event that is delayed in moving through the evaluation area. In addition, a further condition was implemented to ensure that it was actually an event. For this purpose, an evaluation line was defined at the bottom edge of the image section (see Figure 4). As with the evaluation area, this records black pixels. Evaluation at this line is carried out during the provisional event duration, i.e., from the start to the end of the event. This confirms the existence of the event. This condition is necessary because, particularly at low pressures of the aerosol generator, oil accumulates at the outlet of the cooling channels, which increases in size over time in the form of large drops and moves strongly in the image section before the separation process. As a result, the movement in this area may be incorrectly evaluated as one or even several events. Based on the detected events with the starts and ends of the associated event, the event durations and periods were determined. The following relationship was used to determine the event frequency from the event periods.
f = 1 t
Based on the determined frequencies f between the events, a frequency distribution was created to identify a suitable statistical evaluation parameter to describe the frequencies. Using the frequency distribution, it is possible to identify which location parameter is particularly suitable for describing the collected frequencies. The frequency distributions are described using the median as the characteristic evaluation parameter. This evaluation parameter is henceforth referred to as the “separation frequency”.

4. Results and Discussion

4.1. Influence of the Control Variables of the MQL Supply Conditions on the Separation Frequency

Figure 5 illustrates a typical example of the behaviour of the MQL exiting from the drilling tool, as well as the event frequency and duration for an exemplary pressure combination (air pressure and aerosol pressure). The figure also shows the impact of the control variables of the MQL and the event occurrence, whose effect on the process variables is quantified in the further course of the work. The diagrams for the respective pressure combinations show the proportion of black pixels detected over a time interval. In addition, the start and end of the event detected by the evaluation script described in Section 5 can be found in the diagrams. This behaviour can be used to visualize the event frequency or separation frequency for the respective pressure combination. The diagram shows that at the lowest pressures (air pressure 6 bar and aerosol pressure 3 bar), the highest number of black pixels per event are found, but fewer events occur for each time. It can also be seen that the separation frequency increases with increasing levels of pressure, while the proportion of black pixels in the evaluation range is the opposite. The right-hand side of the figure shows an example event for each of the pressure combinations in various successive states. In addition, the average event durations are also shown when displaying the individual events for the various pressure combinations. It can be seen that the event duration decreases with increasing pressure. The three exemplary pressure combinations consistently show that the separation frequency increases with increasing air and oil pressure while the event duration decreases. One possible reason for the findings with the pressure combinations shown could be the relative velocity between air and oil. A higher relative velocity increases the shear on the oil film surface, thereby increasing the instabilities on the oil film surface and causing the oil agglomerated at the outlet of the cooling channels to be detached more frequently and atomized more strongly. The stronger atomization of the oil can be observed in the exemplary events at higher pressures. This could also be a reason for the smaller number of black pixels in the evaluation area, as the smaller oil ligaments are accelerated more quickly by the prevailing air flow due to the stronger atomization and their lower inertia.
Figure 6 illustrates the results of the investigation of the pressure impact on the flow regimes for the drilling tools with different cooling channel diameters. The separation frequencies of the oil at the cooling channel outlet associated with the varied pressures are indicated by the coloured bars to the right of the figures. Each individual measurement point has its colour code representing the specific separation frequency. Based on this, the outflow of the MQL oil has been correlated within three different regimes depending on the evaluated frequencies. These regimes are the drop-like regime, the transitional regime and pulsation regime. The grey shaded area without data in Figure 6 includes pressure combinations that cannot be operated with the aerosol generator. The colour scale of the separation frequency illustrates that, in general, an increase in both pressures leads to an increase in separation frequency. The classification of the pressures into the flow regimes is based on the magnitude of the separation frequency, where all frequencies from 0 to 1500 Hz are assigned to the “drop-like regime”, from 1500 Hz to 3000 Hz to the “transitional regime”, and above 3000 Hz to the “pulsating regime”. In the drop-like regime, the separation frequencies of the oil agglomerate at the cooling channel outlet are still relatively low as comparatively few events occur here. In the transitional regime, the separation frequency gradually increases. In the pulsation regime, the separation frequency is high, indicating higher oil mass flow rates. It can therefore be concluded that an increase in the pressure combinations contributes to an increase in the separation frequency [20]. In general, it is expected that an increase in separation frequency will lead to an increase in oil and probably air mass flow, but this remains to be proven. The increase in the separation frequency; thus, the mass flows also lead to an increase in the relative velocity. An increase in the relative speed of the faster air to the comparatively slower oil film leads to the formation of disturbances in the form of waves and oscillations on the liquid surface (oil film); these vibrations are amplified with increasing relative velocity, which favours atomisation in the form of oil ligaments. The underlying effect may be associated with a Kelvin–Helmholz-like instability (KHI) on the film/gas interface and separation flow [25]. It is clearly noticeable that the droplet-like regime is larger for the smaller cooling channel, while the transitional regime and pulsating regime are smaller. This behaviour highlights that a larger cooling channel diameter at an identical pressure combination results in a higher separation frequency. In turn, it can be deduced that a larger cooling channel diameter can result in a higher air and oil mass flow rate, which in turn can improve the MQL supply and, thus, the wetting of the workpiece surface.

4.2. MQL Process Flow Parameterisation

Since the supplied mass flow rates of oil and air are physically relevant for the effective chip formation and transport processes, these values have been assessed as a function of the air and aerosol pressures (Figure 7). The air mass flow rate is calculated from Equation (1) with the parameters listed in Table 3. The colouring of the curve indicates constant air pressures. The distribution in Figure 7a illustrates that the air mass flow rate depends on the aerosol pressure and the air pressure. The increase in the air mass flow rate is almost the same for different predefined air pressures. However, a critical aerosol pressure, which itself depends on the air pressure, exists; below that, the air mass flow rate is approximately constant.
The MQL generation and transport process from the atomizer through the tool and finally in the working zone in principle can be seen as an inline arrangement of a compressible two-phase flow through two successive nozzle constriction systems. The first constriction is the Venturi for aerosol generation and, the next is for the tool’s internal cooling channels. While for the first nozzle (Venturi) the pressure ratio pair/paero mainly determines the oil mass flow rate, the latter nozzle (tool) affects the air mass flow rate behaviour through the pressure ratio paero/pambient. The air mass flow rate behaviour indicated in Figure 7 is due to the possible choking of the gas flow in the nozzle. When the pressure ratio of aerosol pressure to ambient pressure paero/pambient exceeds the critical value (at Ma = 1), the flow chokes and the gas mass flow rate is almost constant. At lower pressure ratios, the mass flow rate is linear, increasing with increases in the aerosol pressure. This behaviour is only dependent from the air pressure with respect to the increasing gas density at the inlet of the tool.
In addition, the channel diameter significantly affects the total air mass flow rate.
The decrease in the cooling channel diameter from 1 mm (Figure 7a) to 0.8 mm (Figure 7b) drastically increases the internal pressure loss and thus leads to a reduction in the mass flow rates at constant pressure. With the tool diameters, it can be seen that despite the same pressure combinations, the air mass flow increases with a larger tool diameter of 8 mm and the associated larger cooling channel diameter of 1 mm. This larger cooling channel diameter and the associated larger cross-sectional area results in larger pressure losses in the channel with a decreasing cross-sectional area. A similar behaviour can also be assumed for the tool diameter of 6 mm where the critical aerosol pressure sets in later, at which point there is an increase in the air mass flow. The results show that with the aerosol generator used, the air pressure is initially the dominant influencing parameter unless the aerosol pressure is smaller than a threshold value. When the threshold value is reached, the air mass flow rate increases linearly with the aerosol pressure.
To describe the processes involved in the MQL supply, the oil mass flow rates and the air mass flow rates have been detected with respect to the system pressures. Figure 8 shows the oil mass flow rate for the investigated pressure combinations and drilling tools (Figure 8a: 8 mm tool diameter, Figure 8b: 6 mm tool diameter). The figure shows that the tool diameter also has a significant influence on the oil mass flow rate.
It is evident that the oil mass flow rate changes with the preset air pressure (colour coding of the curves in Figure 8a,b). Based on the Venturi principle of the aerosol generator, higher pressure differences lead to higher oil fractions in the aerosol. Both figures indicate a certain maximum oil mass flow rate when the aerosol pressure is changed at a constant air pressure. This indicates that competing mechanisms influence the oil mass flow rate with a choked flow condition in the Venturi. For a preset air pressure, an increase in aerosol pressure leads at first to an increase in the oil flow rate in the aerosol generator until a threshold aerosol pressure is reached (e.g., Figure 7a: Pair = 12 bar, Paero,threshold = 6 bar). For higher values than the threshold aerosol pressure, the content of oil in the aerosol decreases as the pressure difference decreases as well (lower oil content), while at the same time, the air mass flow rate increases (Figure 7). The results show that the aerosol generator provides the maximal oil mass flow rate at an air pressure of 12 bar and an aerosol pressure of 6 bar.
Due to the condition that a minimal difference between air and aerosol pressure must prevail, it is not possible to set an arbitrary aerosol pressure at one given air pressure. The air pressure must be at least 1 bar higher than the aerosol pressure. As a result, for comparatively low air pressures, the allowable aerosol pressure values are limited to a range in which only an increase in the oil mass flow rate can be observed.
The mass flow behaviour and the MQL supply frequency during drilling through internal cooling channels presented in Figure 6, Figure 7 and Figure 8 are summarized in Figure 9. The separation frequency for both drilling tools are plotted against the air and oil mass flow rates. A comparison between the tool diameters shows, based on the findings for the air and oil mass flow rates, that the separation frequency already increases at lower air and oil mass flow rates. For drilling tools with a diameter of 6 mm and relatively low oil mass flow rates, the air mass flow rate has no significant influence on the separation frequency. Only from an oil mass flow rate of 5 mg/s and high air mass flow rates above 700 mg/s is there an increase in the separation frequency. The increase in the oil and air mass flow rates results in a constantly increasing separation frequency. The strong influence of the oil mass flow compared to the air mass flow also occurs for the 8 mm drilling tool. Here, the separation frequency increases steadily at a constant air mass flow rate. It should be emphasized for the tool diameter of 8 mm that the highest separation frequency corresponds to the highest oil mass flow rate, but is not related to the highest air mass flow rates. Here, the oil mass flow is the more significant influencing variable for the highest possible separation frequency. This finding can also be explained because an increasing oil mass flow simultaneously leads to a larger quantity of oil at the outlet of the cooling channels in the drilling tool and the oil wall film increases. The disturbances in the shear layer, which increase due to the high air velocity, are favoured by a higher film thickness of the oil wall film. This causes small wave structures to form on the oil film surface, which are increasingly accelerated by the high air velocity. The process of constantly increasing wave structures due to the high relative speed ultimately leads to the detachment of the oil agglomerate from the tool in the form of an oil ligament.
Nevertheless, the air mass flow is not completely irrelevant in addition to the oil mass flow because a high air velocity is necessary to excite the wave structures in order to detach the oil ligaments. However, from a minimum value of air flow, the oil mass flow and the associated film thickness appear to become more influential.

4.3. Visualisation of the Results in Reynolds and Weber Numbers

In order to transfer the knowledge gained to different systems and, for instance, larger tools or other aerosol generators, dimensionless parameters have been determined. The oil mist consists of two phases, an air phase and an oil phase, each of which can be described by a dimensionless parameter. The aerodynamic Weber W e a i r number is used to describe the air impact on the oil phase:
W e a i r = ρ a i r     u a i r 2     D C C σ
where D C C is the cooling channel diameter. Material data for air are taken from the literature and a simplified air velocity is calculated according to measurements and Bernoulli’s equation.
The liquid film Reynolds number R e o i l is used to describe the oil phase at the tool exit, taking into account the measured oil parameters on the one hand and the film speed u o i l .
R e o i l = ρ o i l     u o i l     D C C μ o i l
The material data of the oil for calculating the W e a i r are listed in Table 1. The oil velocity was calculated using Equation (2) on the basis of the oil film parameters taken from simulations using the Eulerian–Lagrangian–Eulerian Model (ELE) [24] and the measured oil mass flow rate. The separation Strouhal number S r is calculated on the basis of the existing data.
S r = f     D H ( F i l m ) u a i r
Figure 10 shows the separation Strouhal number for the two drilling tools plotted against the Weber and Reynolds numbers. The highest Strouhal number for the 6 mm drill is 3.5 × 10⁻⁴, while for the 8 mm drill, it more than doubles to 8.4 × 10⁻⁴, with the lowest for both around 2.5 × 10⁻⁵. The W e a i r ist quite similar for both tools. The maximum R e o i l for the 8 mm drill is 54.5, which is approximately five times higher than that for the 6 mm drill at 10.7. There is not much difference observed in the lowest values between the two drill diameters, with R e o i l at about 4.
This indicates an effective starting point for the supply of minimum quantity lubrication regardless of the cooling channel diameter. It can therefore be concluded that the Strouhal number is a function of W e a i r and R e o i l and can be used to estimate oil depostion in the bore ground based on the given parameters.
Air flow is most effective at Weber numbers between 1 × 10⁵ and 5 × 10⁵, while no such range can be identified for the oil. The oil is more dependent on the cooling channel diameter.

5. Conclusions and Outlook

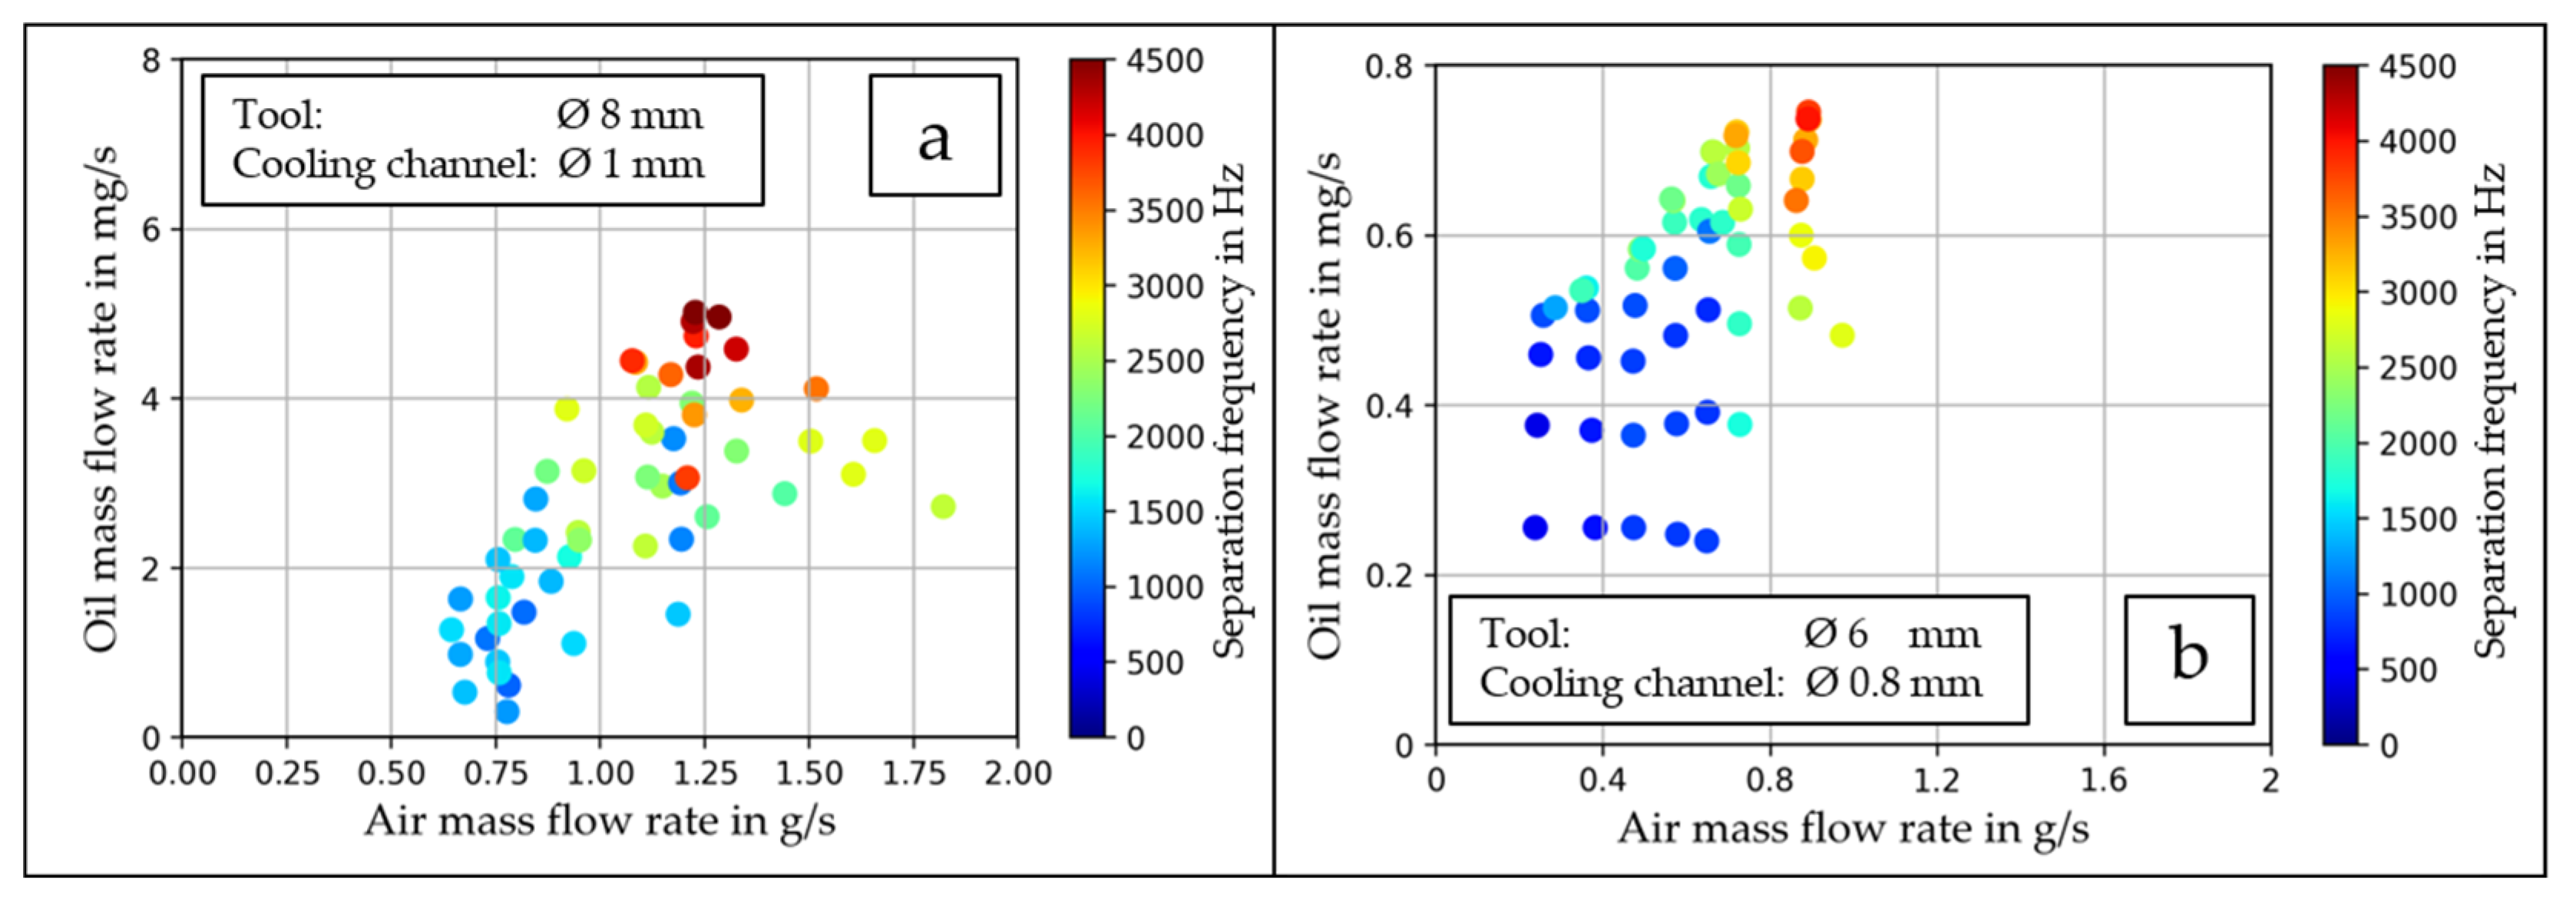
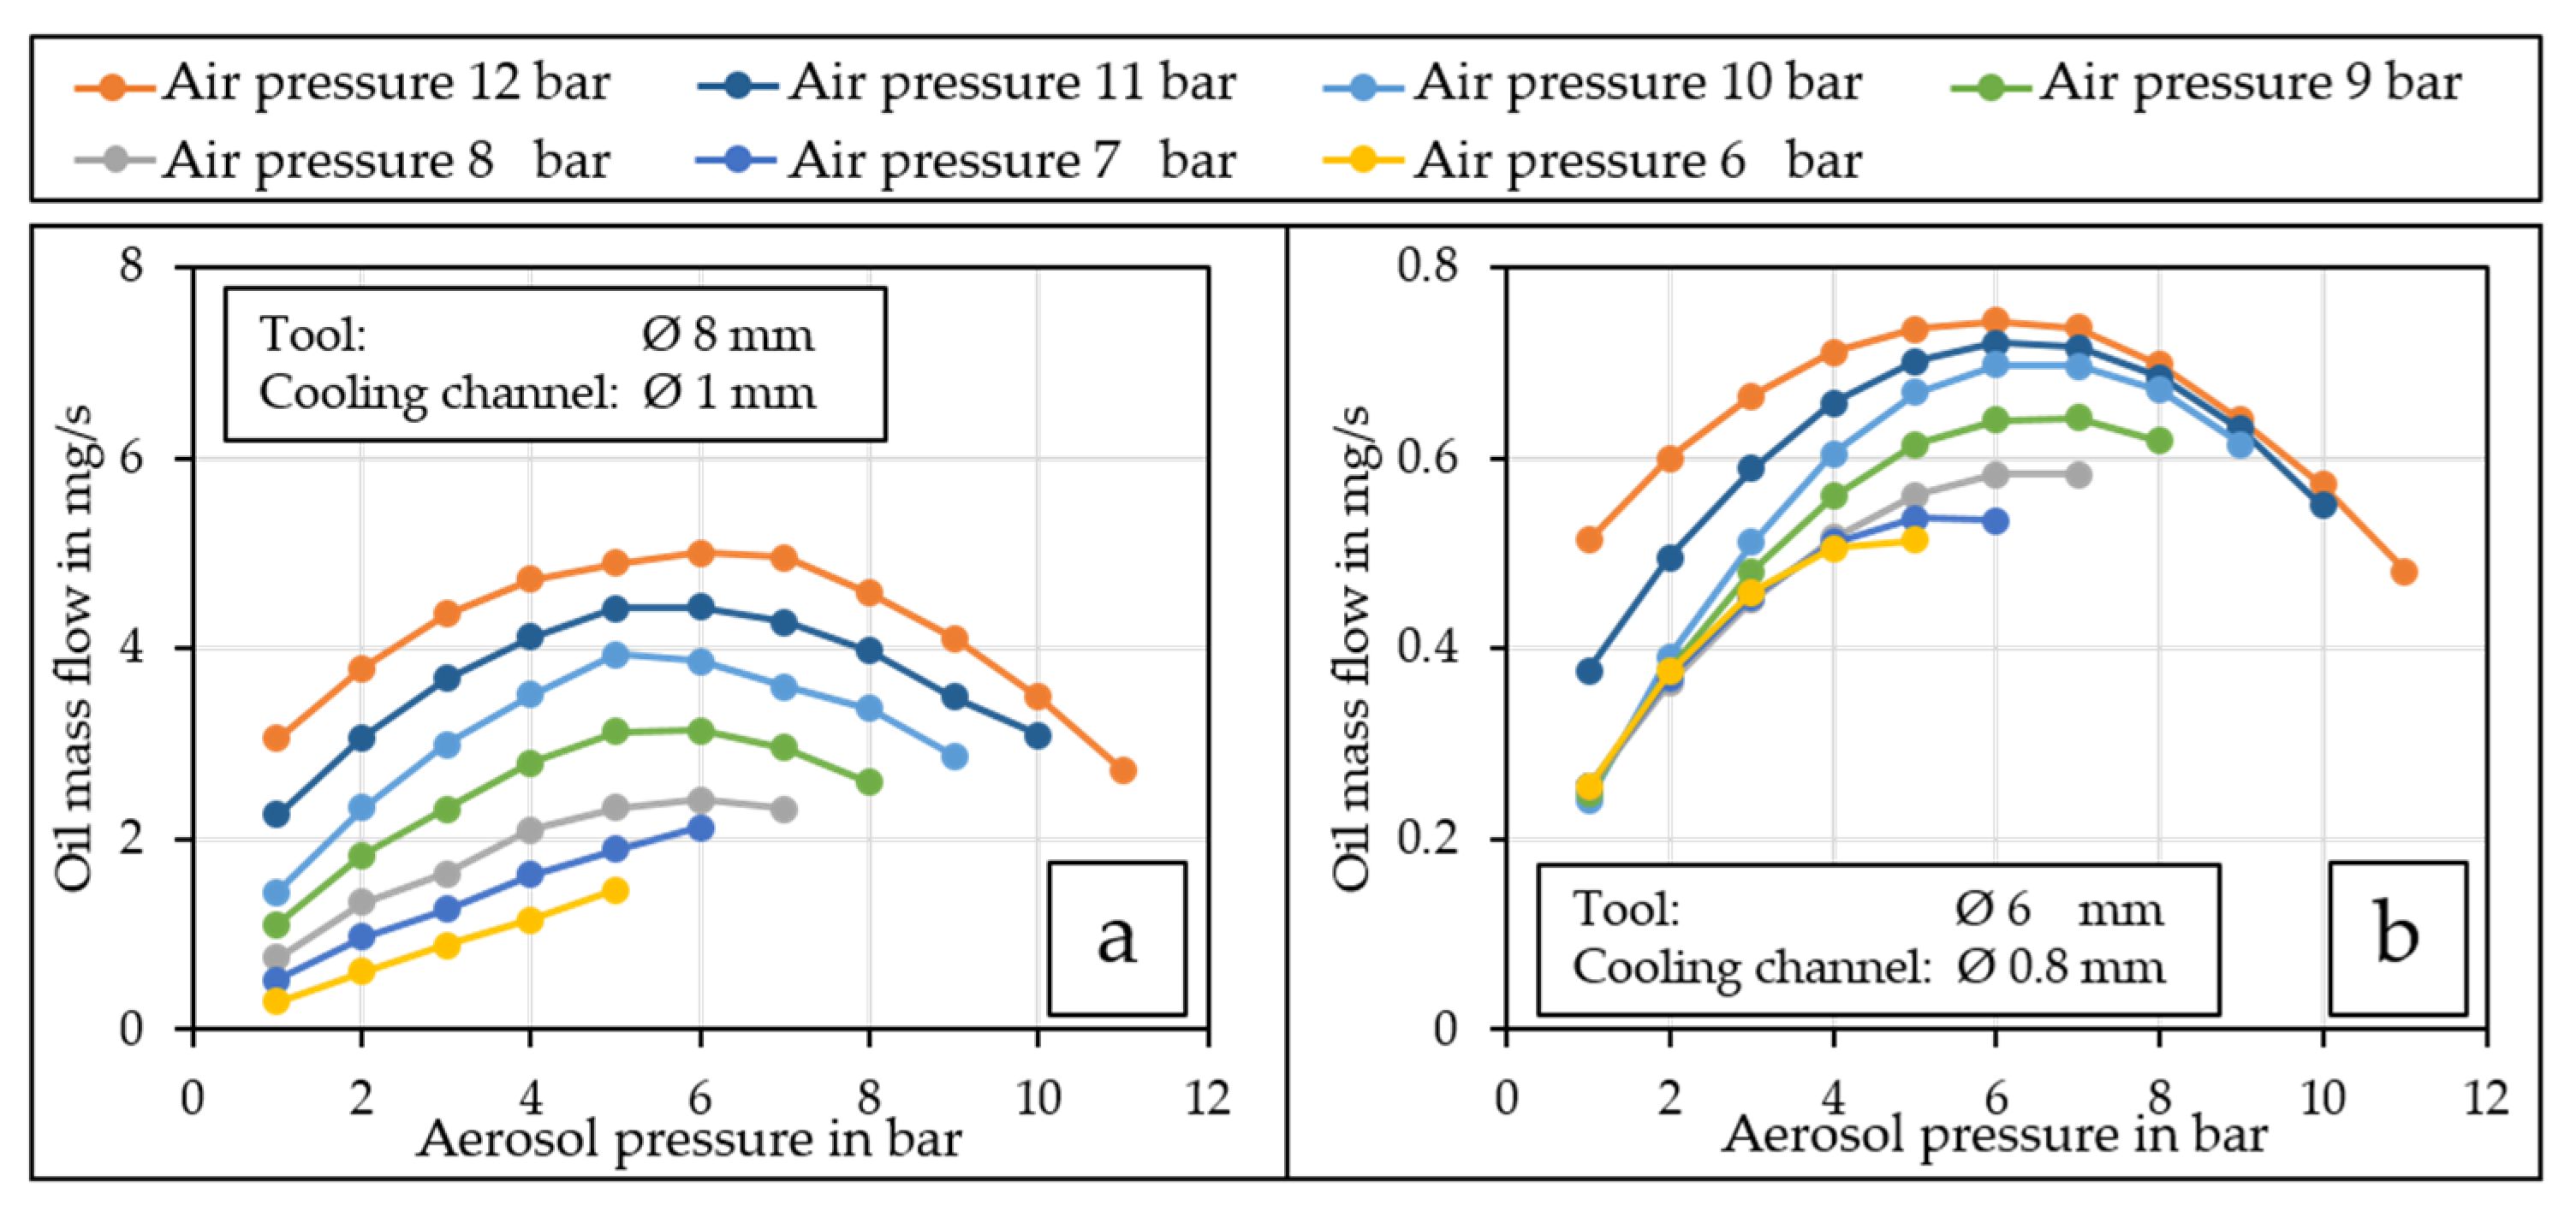
Investigations of the flow behaviour of the MQL supply have shown that the oil mist generated in the aerosol generator essentially emerges from the cooling channels in the tool in the form of oil ligaments instead of the expected aerosol. Changing the system pressures that can be set on the aerosol generator affects the resulting oil and air mass flow rates as well as the separation frequencies of the oil ligaments. In the case of the air mass flow rate, the pressures essentially lead to an increase in flow rate. It has been found that up to critical aerosol pressure, the influence of the air pressure dominates. Once the critical aerosol pressure is reached, it can be seen that both the oil mass flow and the air mass flow change significantly depending on the air pressure used. The air mass flow increases drastically while the oil mass flow stagnates or even decreases. This is associated with choking of the nozzle at a critical pressure ratio.
The oil mass flow rate generally increases with increasing air pressure for a given aerosol pressure. From an air pressure of 8 bar and increasing aerosol pressures, a downward parabolic curve can be seen for the oil mass flow rate, which becomes clearer with increasing air and aerosol pressures. At an air pressure of 12 bar and an aerosol pressure of 6 bar, the oil mass flow rate reaches a maximum. On the basis of the knowledge gained, it can be concluded that the best lubricating effects can also be achieved with the abovementioned parameters.
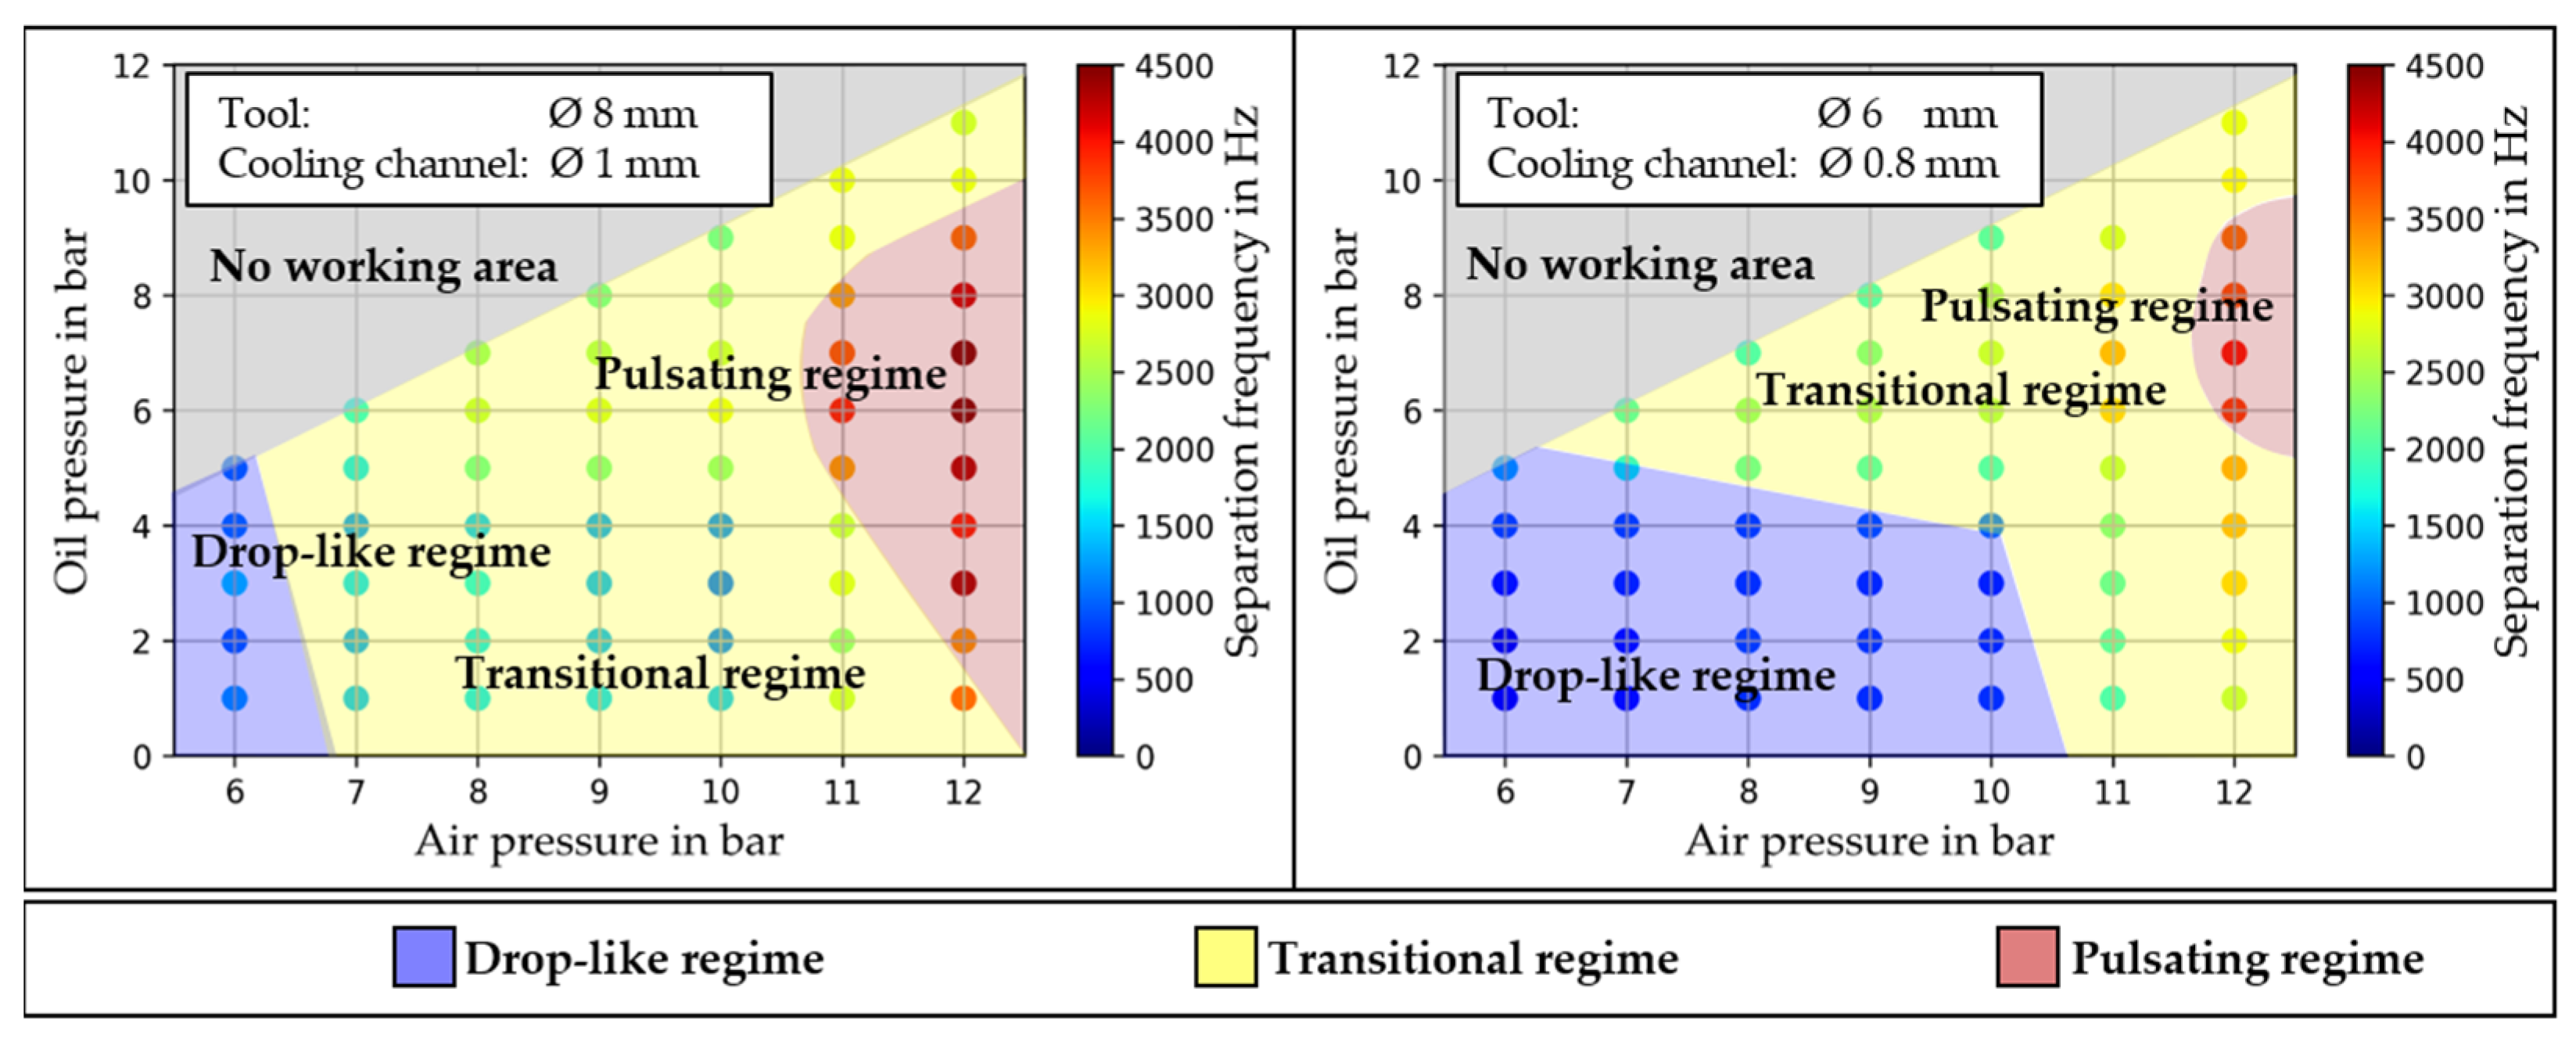
The influence of the pressures on the separation frequency is also evident. It increases with increasing air pressure. As with the oil mass flow, the aerosol pressure shows a downward parabolic curve from an air pressure of 8 bar. The separation frequency also reaches a maximum at an air pressure of 12 bar and an oil pressure of 6 bar. When transferring the air and oil mass flows in relation to the separation frequency, it can be seen that an increase in the mass flows leads to an increase in the separation frequency. Furthermore, flow regimes can be represented based on the separation frequencies, each of which has a characteristic exit behaviour of the oil from the cooling channels.
In addition, a larger cooling channel diameter generally leads to an increase in the air and oil mass flow rate and, thus, also to an increase in the separation frequency.
Further research potential can be derived from the findings on the flow behaviour of the MQL supply during drilling. This includes investigating the influence of the MQL supply on the mechanical and thermal load during drilling. The optimum oil mass flow rate identified in this work should be investigated, which can be expected to improve the lubricating effect. This would also contribute to better process results. In addition to the effect of the MQL supply on the drilling process, the influence of various MWF on the MQL supply also needs to be investigated. Furthermore, the determined air velocities at the outlet from the cooling channels have been estimated analytically so far. This should be validated with suitable measurement methods. Moreover, the influence of different cooling channels with different shapes, lengths, and outlet geometries should be investigated in future work. To this end, Raval et al. have already shown the potential for designing the cooling channels in the drilling tool, which in turn can be evaluated with the knowledge gained in this work [23].

Author Contributions

Conceptualization, L.S. and J.S.; methodology, L.S.; software, L.S.; formal analysis, L.S., L.B. and T.T.; investigation, L.S. and K.A.; resources, B.K. and U.F.; data curation, L.S.; writing—original draft preparation, L.S.; writing—review and editing, T.T., K.A., L.B., J.S., B.K. and U.F.; visualization, L.S.; supervision, K.A., J.S., B.K. and U.F.; project administration, B.K. and U.F.; funding acquisition, B.K. and U.F. All authors have read and agreed to the published version of the manuscript.

Funding

The research work has been supported by the German Research Foundation (DFG, Deutsche Forschungsgemeinschaft), grant number FR 912/46-1 and KA 1006/30-2, project “Fully coupled simulation of the fluid dynamics of the coolant/lubricant flow and the cutting process in vibration-assisted drilling—ViBohr” within the research priority program SPP 2231 FluSimPro.

Data Availability Statement

The data presented in this study are available on request from the corresponding author.

Acknowledgments

The authors gratefully acknowledge the contribution of J. Hatcher and J. Gakovi in performing essential parts of the experimental program.

Conflicts of Interest

The authors declare no conflicts of interest.

References

  1. Tai, B.L.; David, A.S.; Richard, J.F.; Albert, J.S. Minimum Quantity Lubrication (MQL) in Automotive Powertrain Machining. Procedia CIRP 2014, 14, 523–528. [Google Scholar] [CrossRef]
  2. Filipovic, A.; Stephenson, D.A. Minimum Quantity Lubrication (MQL) Applications in Automotive Power-Train Machining. Mach. Sci. Technol. 2008, 10, 3–22. [Google Scholar] [CrossRef]
  3. Naveena, B.; Thaslima, S.S.M.; Savitha, V.; Krishna, B.N.; Raj, D.S.; Karunamoorthy, L. Simplified MQL system for drilling AISI 304 SS using cryogenically treated drills. Mater. Manuf. Process. 2017, 32, 1679–1684. [Google Scholar] [CrossRef]
  4. Masoudi, S.; Vafadar, A.; Hadad, M.; Jafarian, F. Experimental investigation into the effects of nozzle position, workpiece hardness, and tool type in MQL turning of AISI 1045 steel. Mater. Manuf. Process. 2017, 33, 1011–1019. [Google Scholar] [CrossRef]
  5. Walker, T. The MQL Handbook—A Guide to Machining with Minimum Quantity Lubrication; UNIST, Inc.: Grand Rapids, MI, USA, 2017; pp. 34–35. [Google Scholar]
  6. Thamke, D. Technologische und Ökonomische Aspekte der Trocken- und Minimalmengenbearbeitung am Beispiel des Einlippentiefbohrens. Ph.D. Thesis, Universität Dortmund, Dortmund, Germany, 1999. [Google Scholar]
  7. Duflou, J.R.; Sutherland, J.W.; Dornfeld, D.; Herrmann, C.; Jeswiet, J.; Kara, S.; Hauschild, M.Z.; Kellens, K. Towards energy and resource efficient manufacturing: A processes and systems approach. CIRP Ann. 2012, 61, 587–609. [Google Scholar] [CrossRef]
  8. Dasch, J.M.; Kurgin, S.K. A characterisation of mist generated from minimum quantity lubrication (MQL) compared to wet machining. Int. J. Mach. Mach. Mater. 2010, 7, 82–95. [Google Scholar] [CrossRef]
  9. Richter, A. Tool Spray; Cutting Tool Engineering: Illinois, IL, USA, 2008; p. 60. [Google Scholar]
  10. Obikawa, T. Machining with Least Quantity Lubrication. In Comprehensive Materials Processing, 1st ed.; Hashmi, S., Batalha, G.F., Van Tyne, C.J., Yilbas, B., Eds.; Elsevier: Oxford, UK, 2014; pp. 81–255. [Google Scholar]
  11. Sharma, V.S.; Gupta, M.; Hegab, H.; Arora, N.; Khan, A.M.; Jamil, M.; Bellos, E. A comprehensive review on Minimum Quantity Lubrication (MQL) for machining processes using nano-cutting fluids. Mater. Manuf. Process. 2015, 30, 935–953. [Google Scholar] [CrossRef]
  12. Tai, B.L.; Dasch, J.M.; Shih, A.J. Evaluation and Comparison of Lubricant Properties in Minimum Quantity Lubrication Machining. Mach. Sci. Technol. 2011, 15, 376–391. [Google Scholar] [CrossRef]
  13. Maruda, R.W.; Krolczyk, G.M.; Feldshtein, E.; Pusavec, F.; Szydlowski, M.; Legutko, S.; Sobczak-Kupiec, A. A study on droplets sizes, their distribution and heat exchange for minimum quantity cooling lubrication (MQCL). Int. J. Mach. Tools Manuf. 2016, 100, 81–92. [Google Scholar] [CrossRef]
  14. Lerma, I.; Jimenez, M.; Edinbarough, I.; Krell, J.; Hung, N.P. Characterization of Micromist for Effective Minimum Quantity Lubrication. Adv. Mater. Res. 2015, 1115, 43–46. [Google Scholar] [CrossRef]
  15. Heinemann, R.; Hinduja, S.; Barrow, G.; Petuelli, G. Effect of MQL on the tool life of small twist drills in deep-hole drilling. Int. J. Mach. Tools Manuf. 2016, 46, 1–6. [Google Scholar] [CrossRef]
  16. Neugebauer, R.; Drossel, W.; Wertheim, R.; Hochmuth, C.; Dix, M. Resource and Energy Efficiency in Machining Using High-Performance and Hybrid Processes. Procedia CIRP 2012, 1, 3–16. [Google Scholar] [CrossRef]
  17. Nam, J.S.; Lee, P.; Lee, S.W. Experimental characterization of micro-drilling process using nanofluid minimum quantity lubrication. Int. J. Mach. Tools Manuf. 2011, 51, 649–652. [Google Scholar] [CrossRef]
  18. Aoyama, T. Development of a Mixture Supply System for Machining with Minimal Quantity Lubrication. CIRP Ann. 2002, 51, 289–292. [Google Scholar] [CrossRef]
  19. Stampfer, B.; Zanger, F.; Schulze, V. In-Process Analysis of Minimum Quantity Lubrication during Drilling of AISI 4140. In Advances in Production Research; Springer: Berlin/Heidelberg, Germany, 2018; pp. 541–550. [Google Scholar]
  20. Weinert, K.; Inasaki, I.; Sutherland, J.W.; Wakabayashi, T. Dry Machining and Minimum Quantity Lubrication. CIRP Ann. 2004, 53, 511–537. [Google Scholar] [CrossRef]
  21. Rahim, E.A.; Dorairaju, H. Evaluation of mist flow characteristic and performance in Minimum Quantity Lubrication (MQL) machining. Measurement 2018, 123, 213–225. [Google Scholar] [CrossRef]
  22. Buss, L.; Schumski, L.; Sölter, J.; Avila, K.; Karpuschewski, B.; Fritsching, U. Minimum Quantity Lubrication (MQL) multiphase dynamics of a vibration-assisted drilling process. CIRP Procedia 2023, 117, 420–425. [Google Scholar] [CrossRef]
  23. Raval, J.K.; Tai, B.L. Mist Flow in Through-Tool Minimum Quantity Lubrication Drilling: Two-Phase Flow Simulation and Experimental Observation. J. Manuf. Sci. Eng. 2022, 145, 1–30. [Google Scholar] [CrossRef]
  24. Falcone, M.; Buss, L.; Fritsching, U. Eulerian–Lagrangian–Eulerian Simulations of Two-Phase Minimum Quantity Lubrication Flow in Internal Drill Bit Channels. Processes 2022, 10, 600. [Google Scholar] [CrossRef]
  25. Drazin, P.G. Kelvin-Helmholtz Instability. In Introduction to Hydrodynamic Stability; Cambridge University Press: Cambridge, UK, 2002; pp. 45–61. [Google Scholar]
Figure 1. Schematic diagram of the aerosol generator and the subsequent transport route to the drilling tool. The test setups and measurement methods used in this work are also shown.
Jmmp 08 00069 g001
Figure 2. Experimental setup of the shadowgraphy method for visualizing the MQL flow.
Jmmp 08 00069 g002
Figure 3. Representation of an event at different times for an exemplary pressure combination.
Jmmp 08 00069 g003
Figure 4. Evaluation method of the images resulting from the shadowgraphy method to visualize the oil ligaments emerging from the cooling channels.
Jmmp 08 00069 g004
Figure 5. Representation of the detected black pixels from the evaluation script for event detection and the visualization of an associated random event at different times for three different pressure combinations.
Jmmp 08 00069 g005
Figure 6. Influence of the control variables (air pressure and aerosol pressure) on the determined separation frequency of the oil ligaments for the cooling channel diameters 8 mm and 6 mm.
Jmmp 08 00069 g006
Figure 7. Influence of the control variables (air pressure and aerosol pressure) on the air mass flow for cooling channel diameters of 8 mm (a) and 6 mm (b).
Jmmp 08 00069 g007
Figure 8. Influence of the control variables (air pressure and aerosol pressure) on the oil mass flow for cooling channel diameters 8 mm (a) and 6 mm (b).
Jmmp 08 00069 g008
Figure 9. The separation frequencies plotted against the measured air and oil mass flow rate for cooling duct diameters 8 mm (a) and 6 mm (b).
Jmmp 08 00069 g009
Figure 10. Separation frequency plotted against Weber and Reynolds numbers to take into account the geometric variables and material data for the cooling channel diameters of 8 mm (a) and 6 mm (b).
Jmmp 08 00069 g010
Table 1. Physical properties of Alumicut 659.
Temperature
in °C
Density
in kg/m³
Viscosity
in mPa·s
Surface Tension
in mN/m
20896.1520.4232.21
35885.8512.0530.54
50875.678.2529.17
65865.135.8128.10
Table 2. Technical specifications of the drilling tools.
ModelUNI.8,00.R.5D.IK.DIN6535.HA
ManufacturerCeratizit GmbH, Kempten, Germany
Cutting materialVollhartmetall
CoatingTiAlN
Diameter d in mm86
Length L in mm9182
Cooling channel diameter dc in mm10.8
Cooling channel length Lc in mm10289
Number of cooling channels2
Jmmp 08 00069 i001
Table 3. Variables recorded during air flow measurement.
Ambient Temperature Tair in KAmbient Pressure Pair in BarSpecific Gas Constant RS in J/kg KAir Density at Ambient Condition in kg/m³
290.750.999287.051.197
Disclaimer/Publisher’s Note: The statements, opinions and data contained in all publications are solely those of the individual author(s) and contributor(s) and not of MDPI and/or the editor(s). MDPI and/or the editor(s) disclaim responsibility for any injury to people or property resulting from any ideas, methods, instructions or products referred to in the content.

