

A Comprehensive Study on the Optimization of Drilling Performance in Hybrid Nano-Composites and Neat CFRP Composites Using Statistical and Machine Learning Approaches

 , and
, and
Abstract
1. Introduction
2. Material and Methods
2.1. Materials
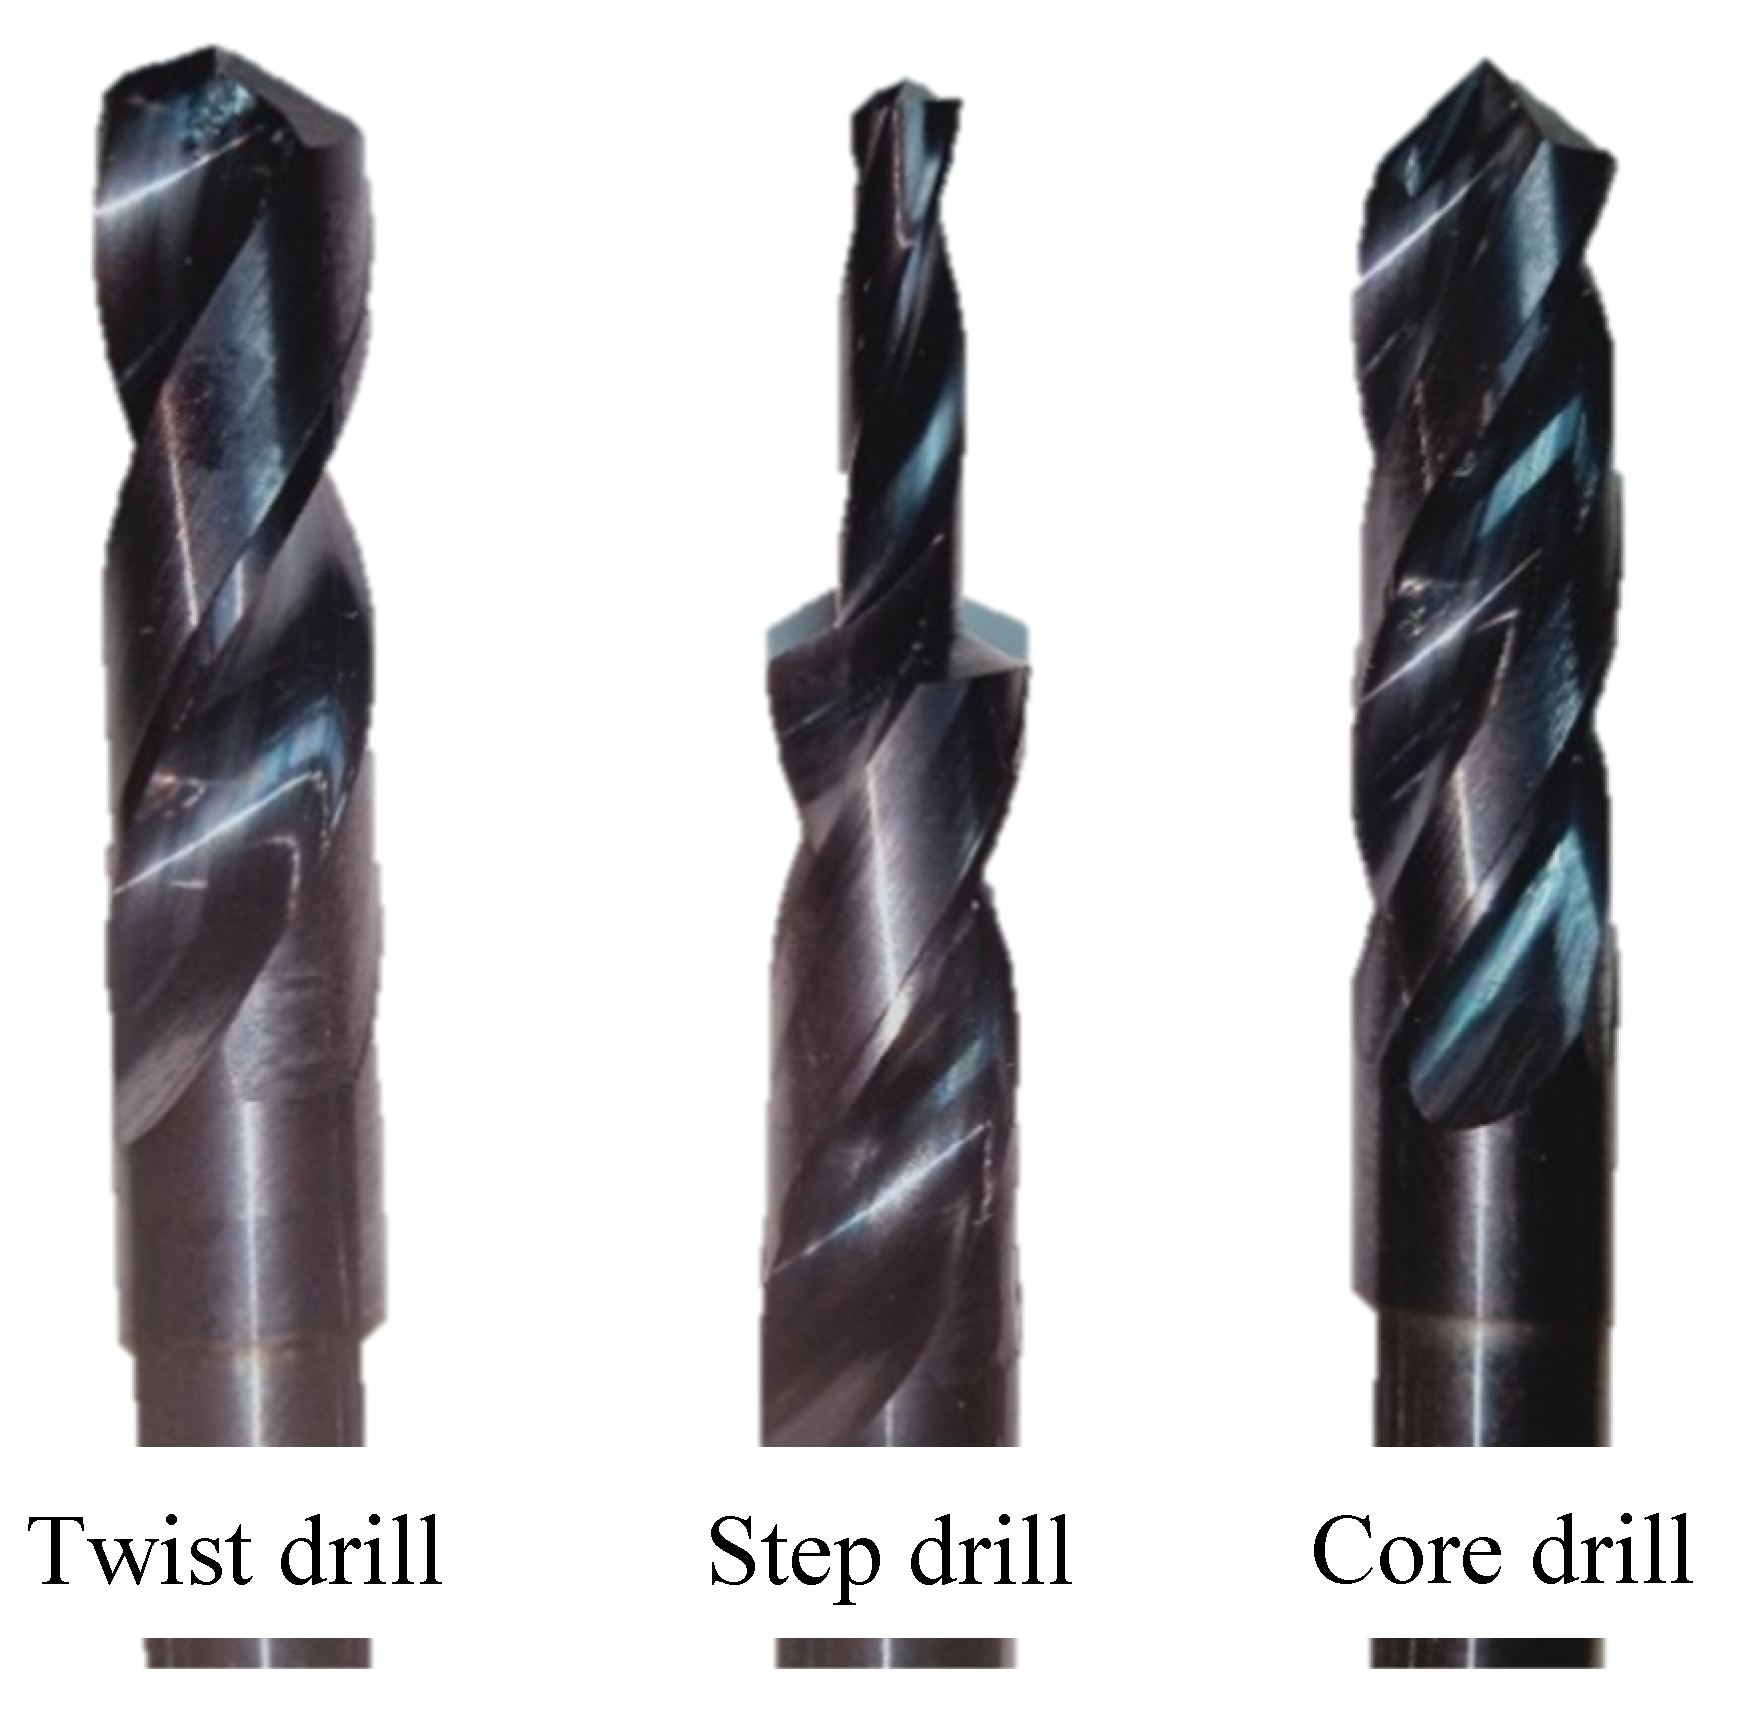
2.2. Machining Parameters
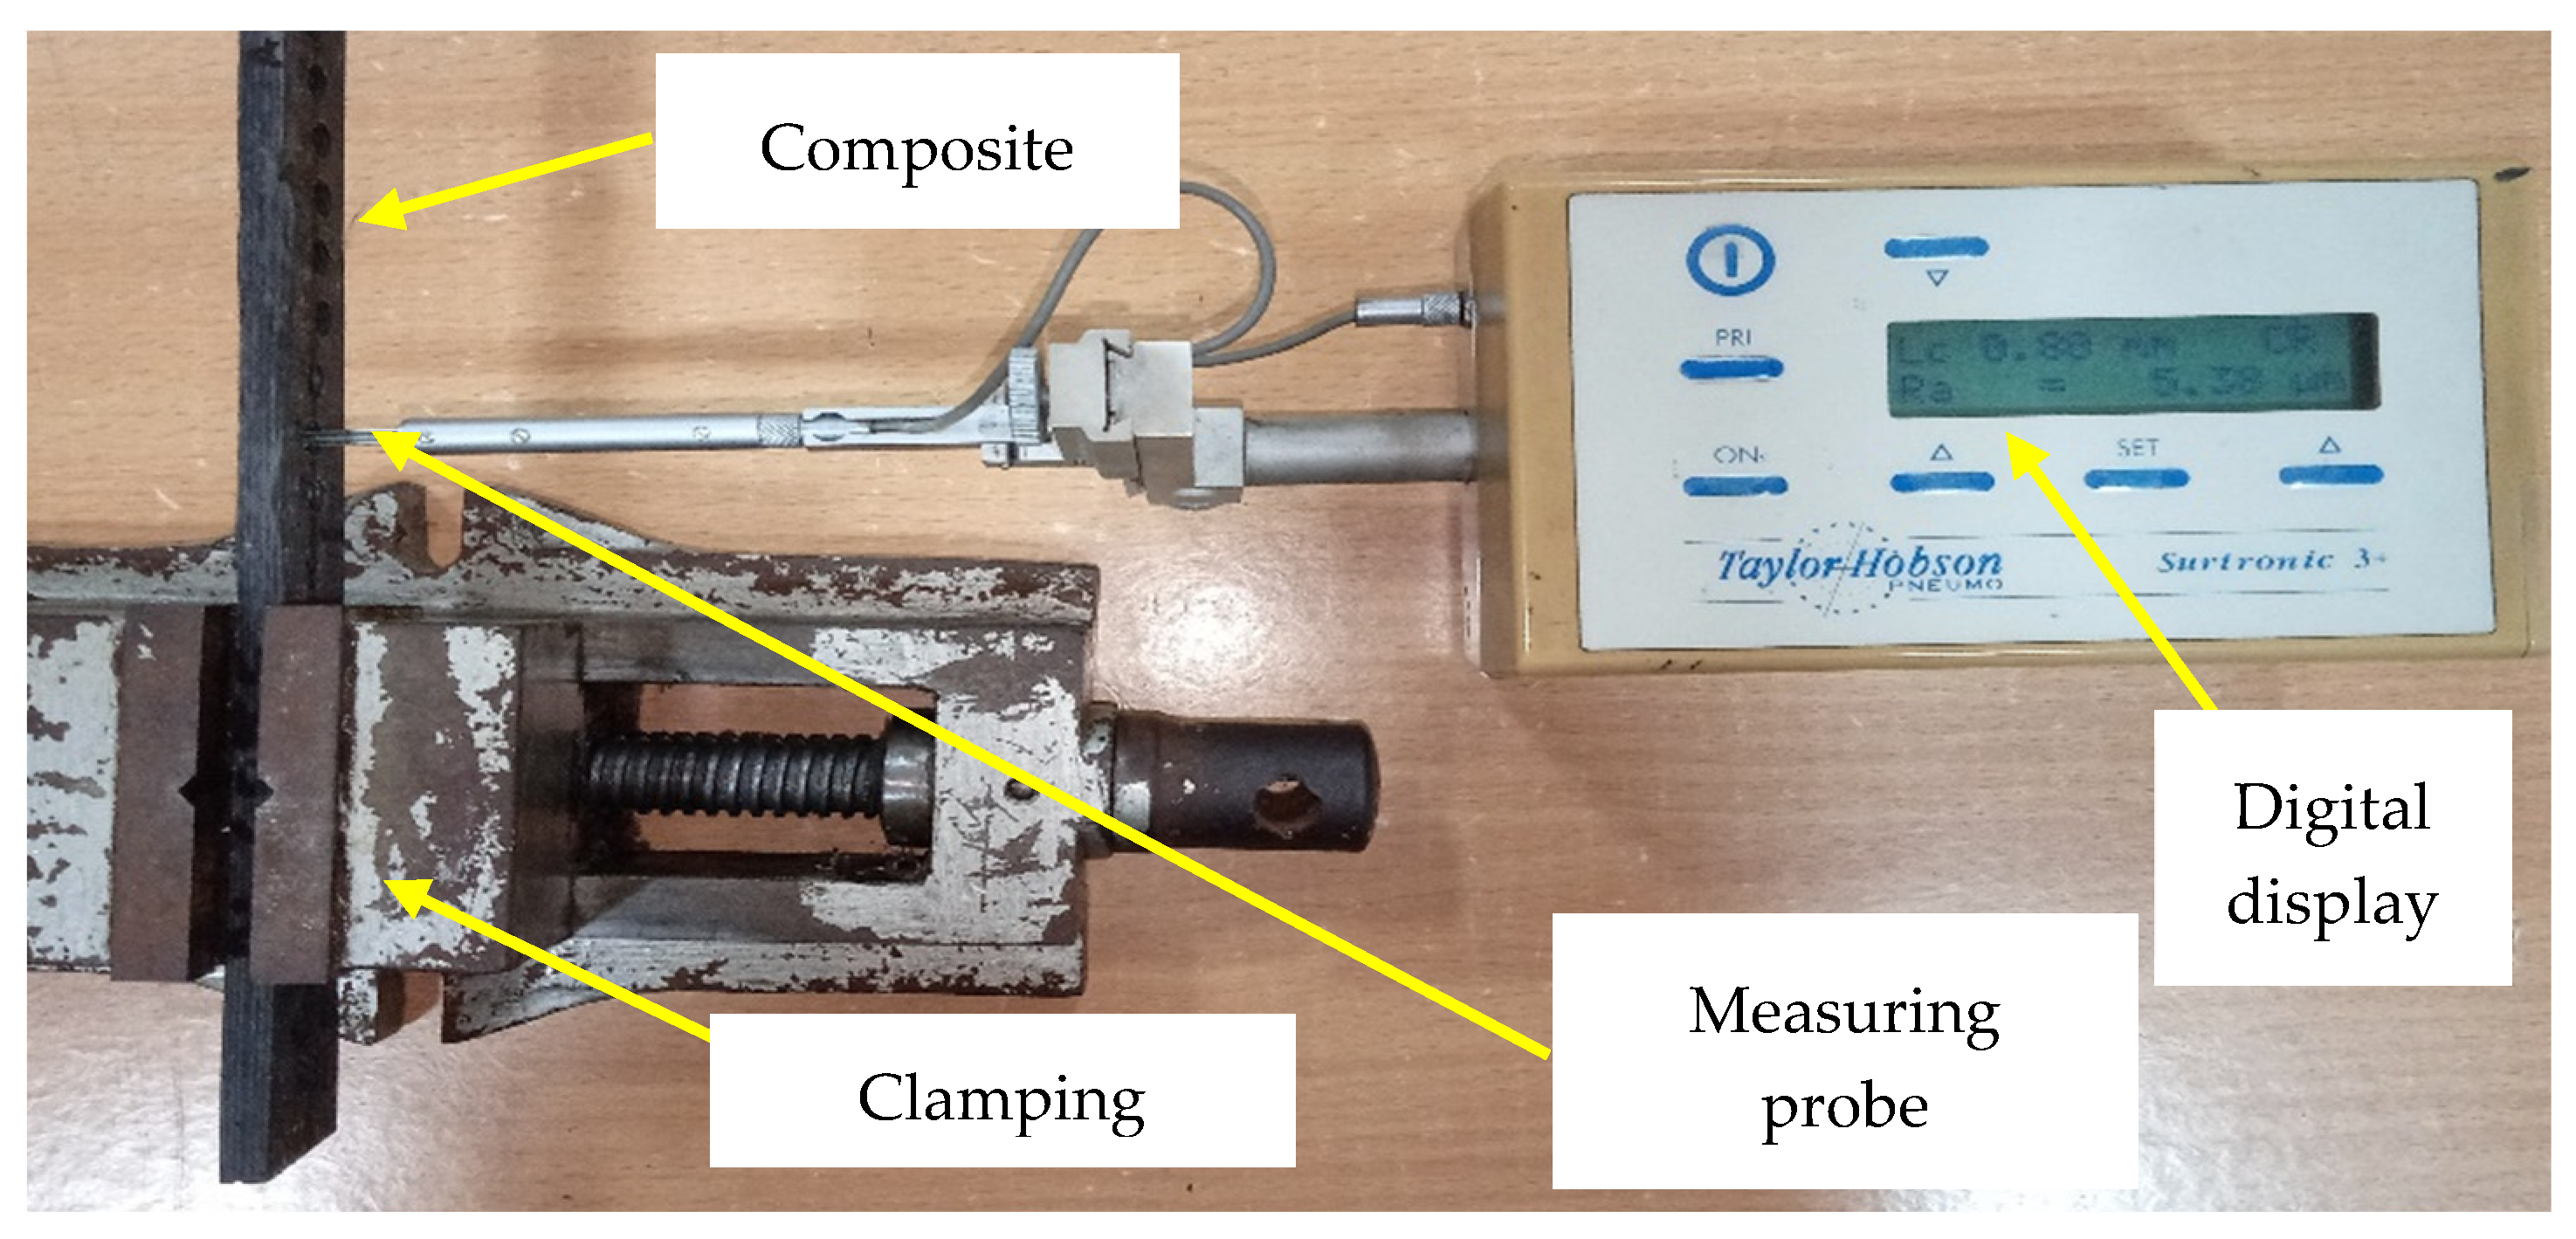
2.3. Surface Roughness Measurement
2.4. Statistical Tools
2.5. Optimization of Process Parameters Using RSM
2.6. Prediction Methods
2.6.1. Artificial Neural Network (ANN)
- Input layer: number of input parameters = number of neurons placed in the input layer.
- Hidden layer: a greater number of neurons placed compared to the input layer.
- Output layer: number of output parameters = number of neurons.
2.6.2. Random Forest (RF)
3. Results and Discussion
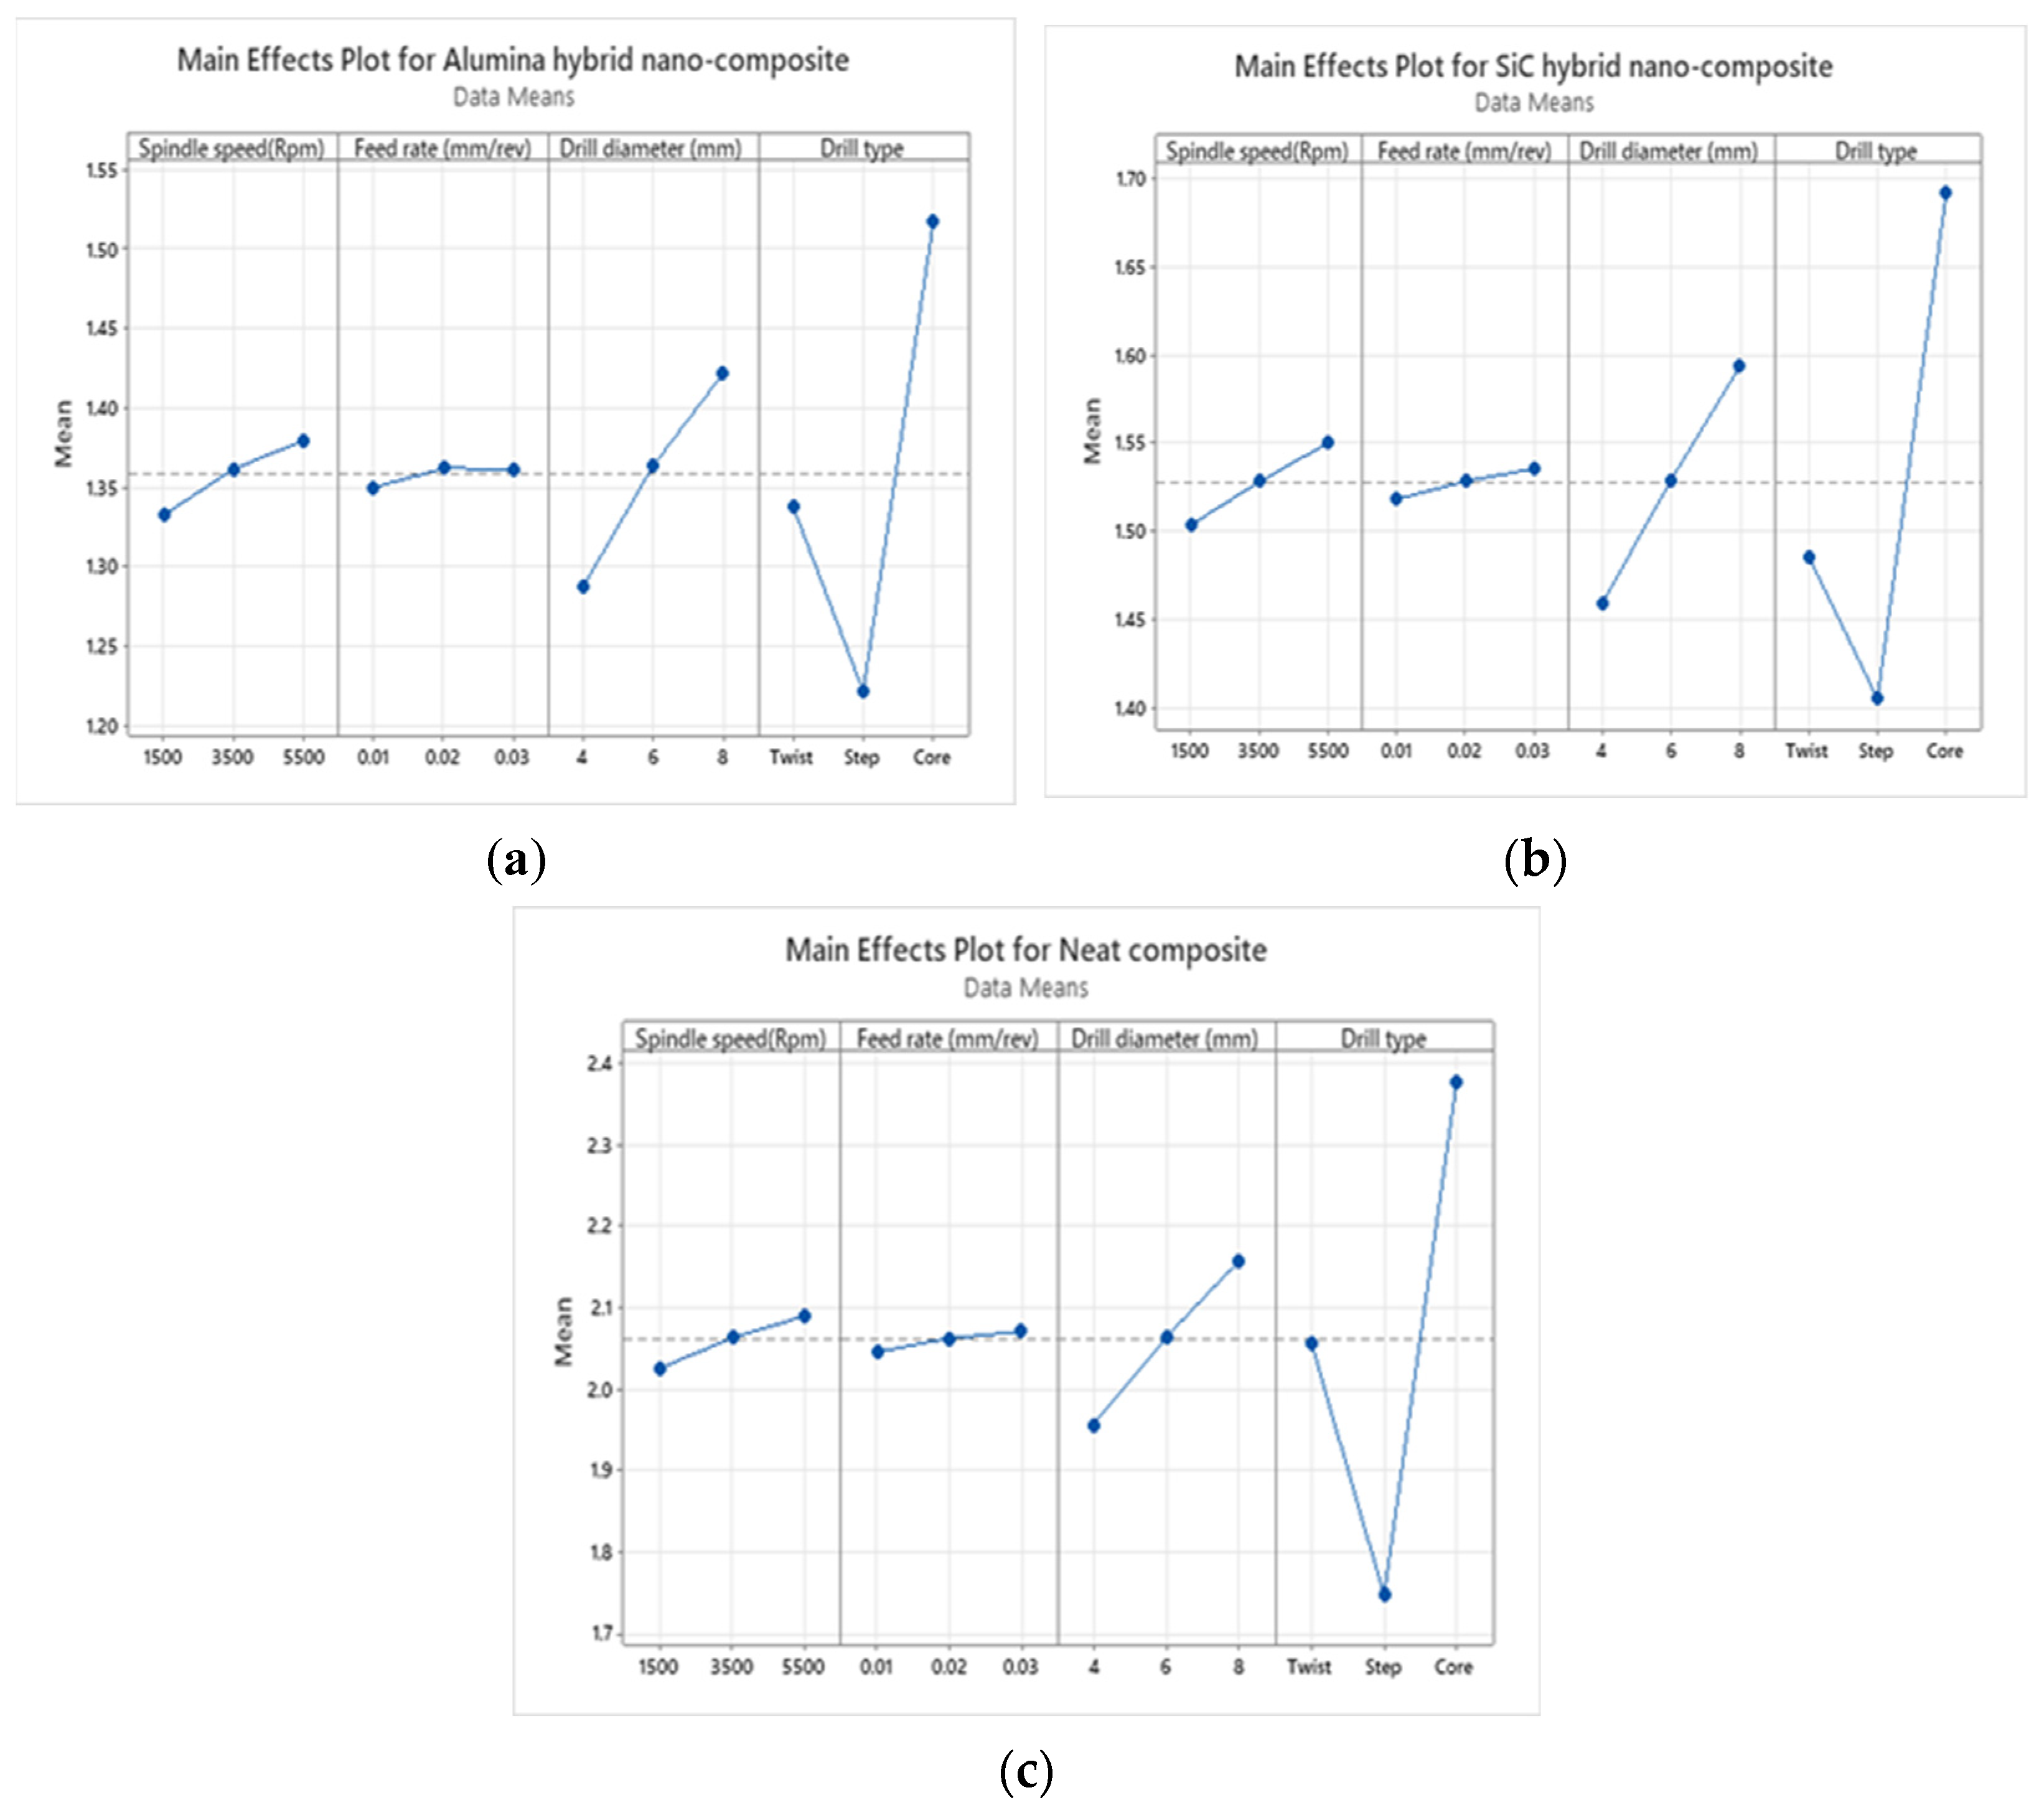
3.1. Analysis of Main Effects Plot
3.2. ANOVA Analysis
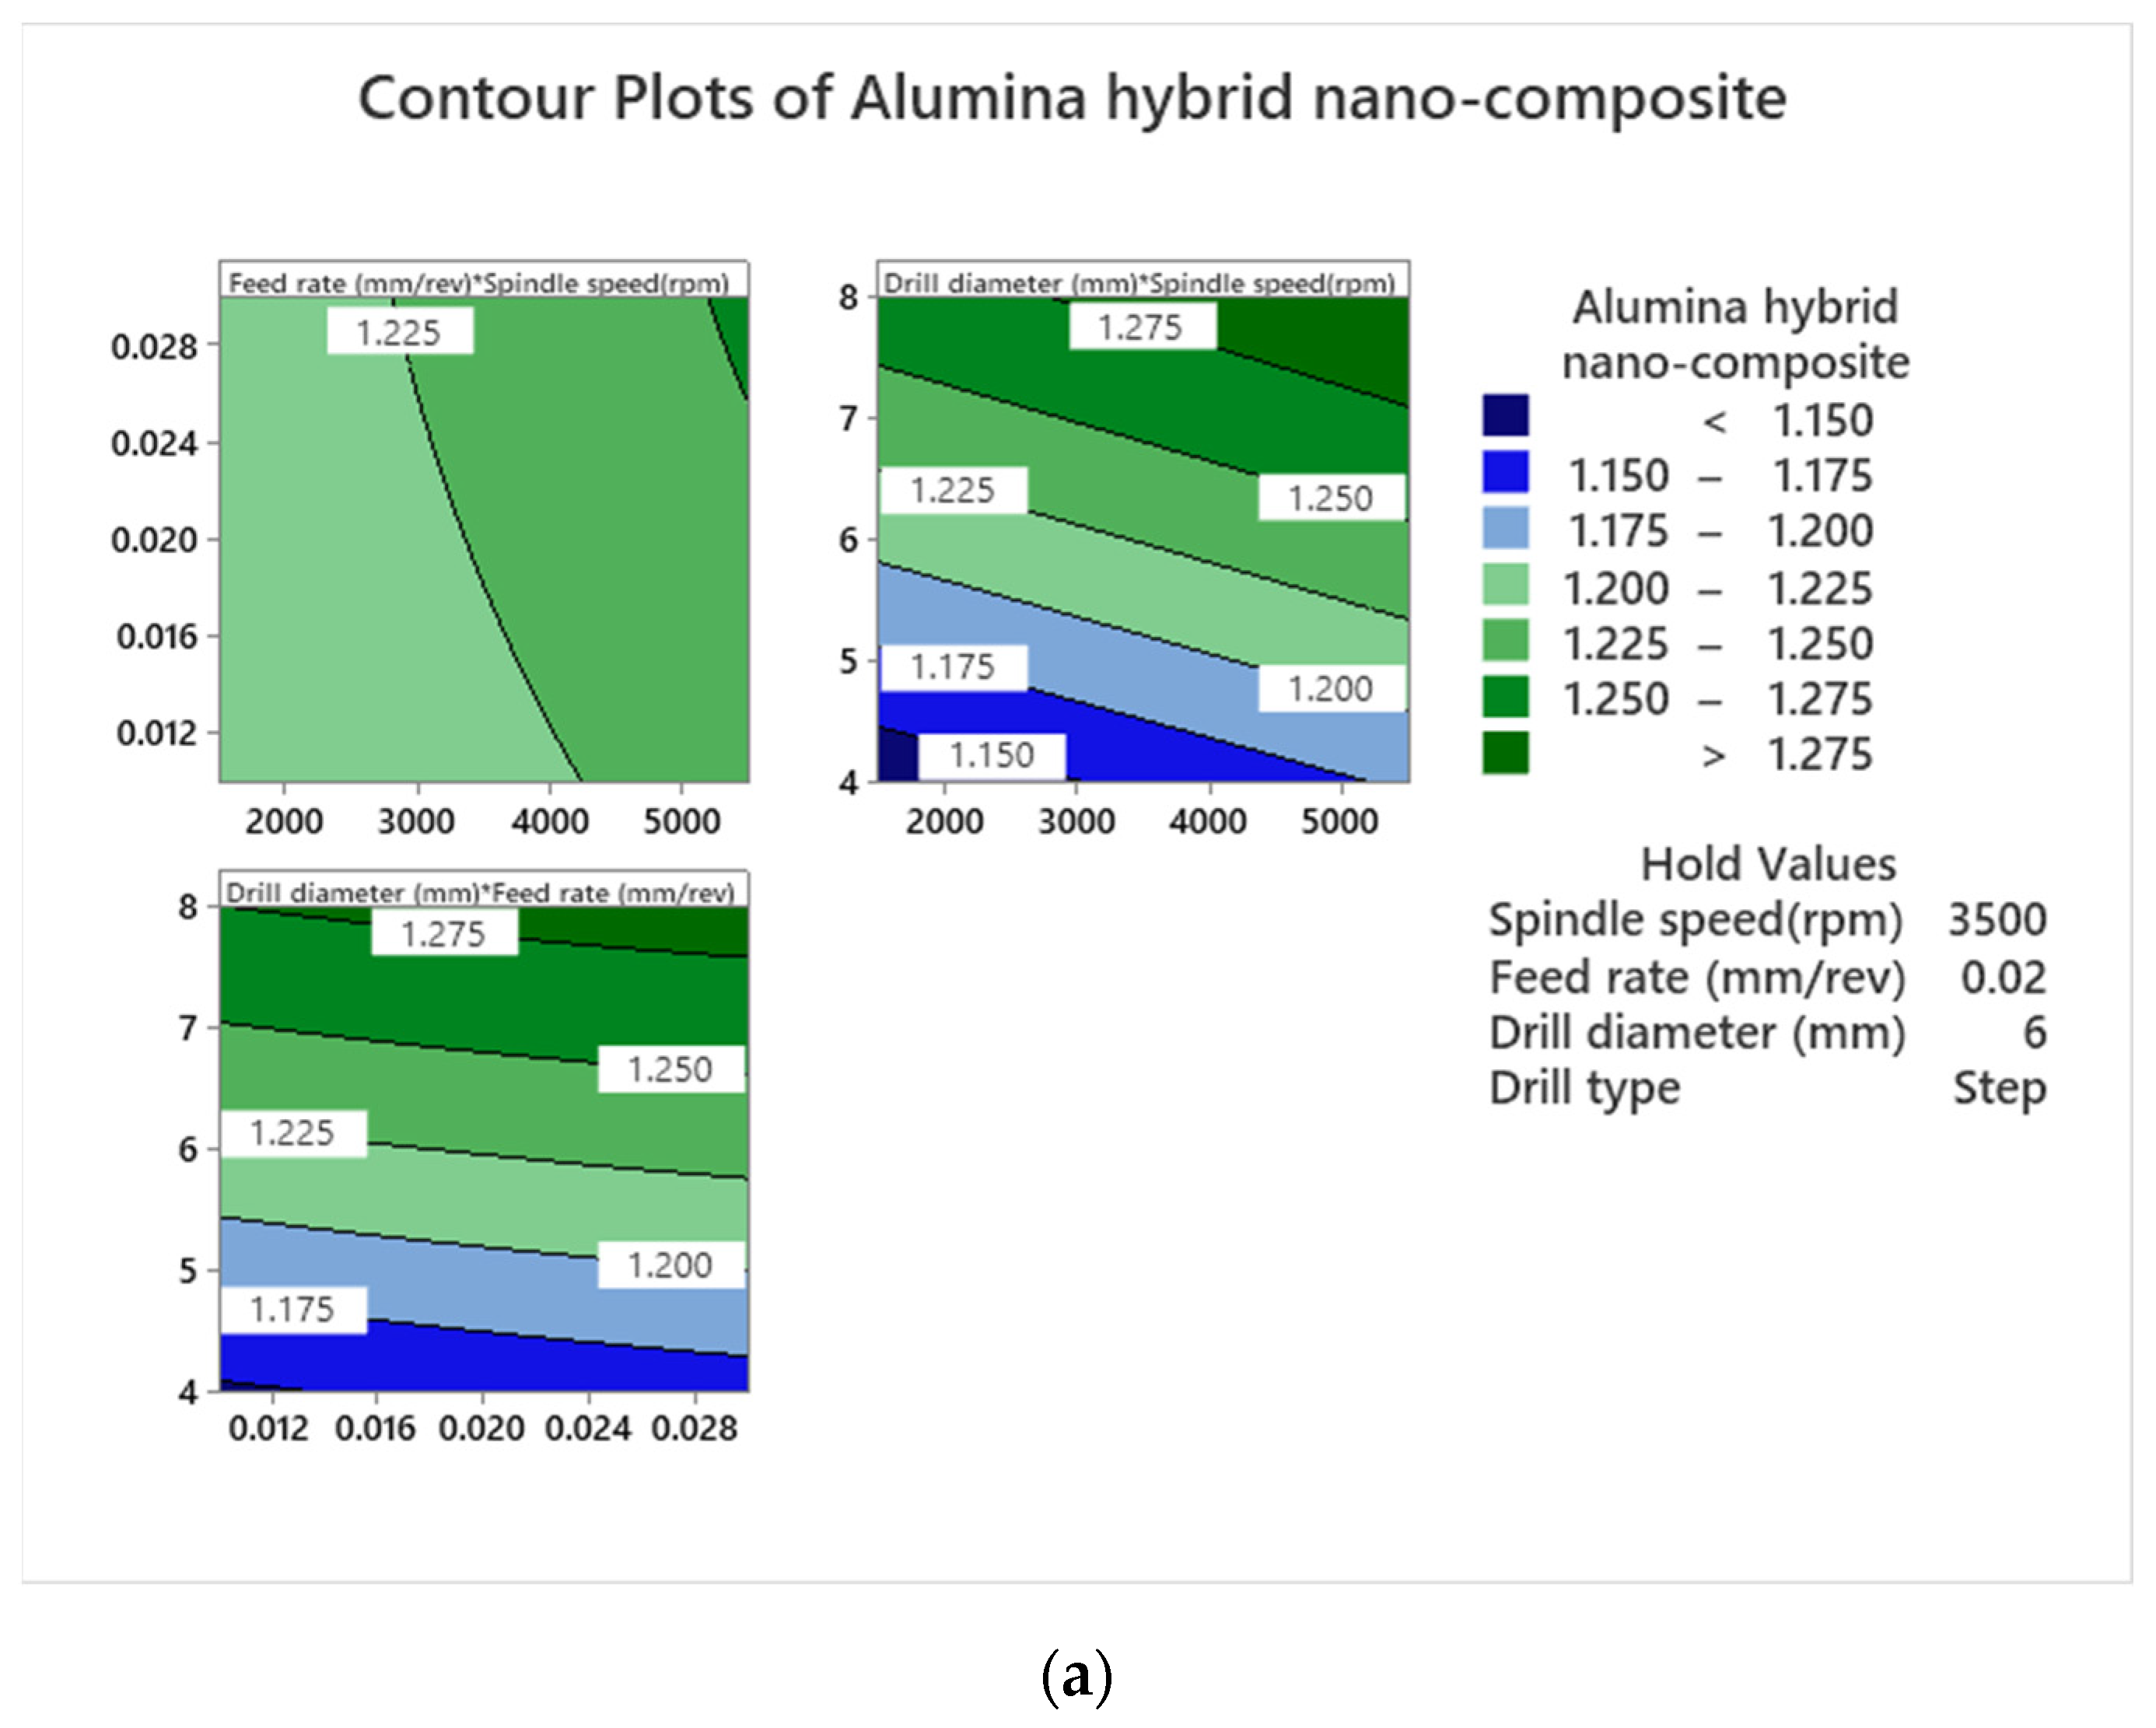
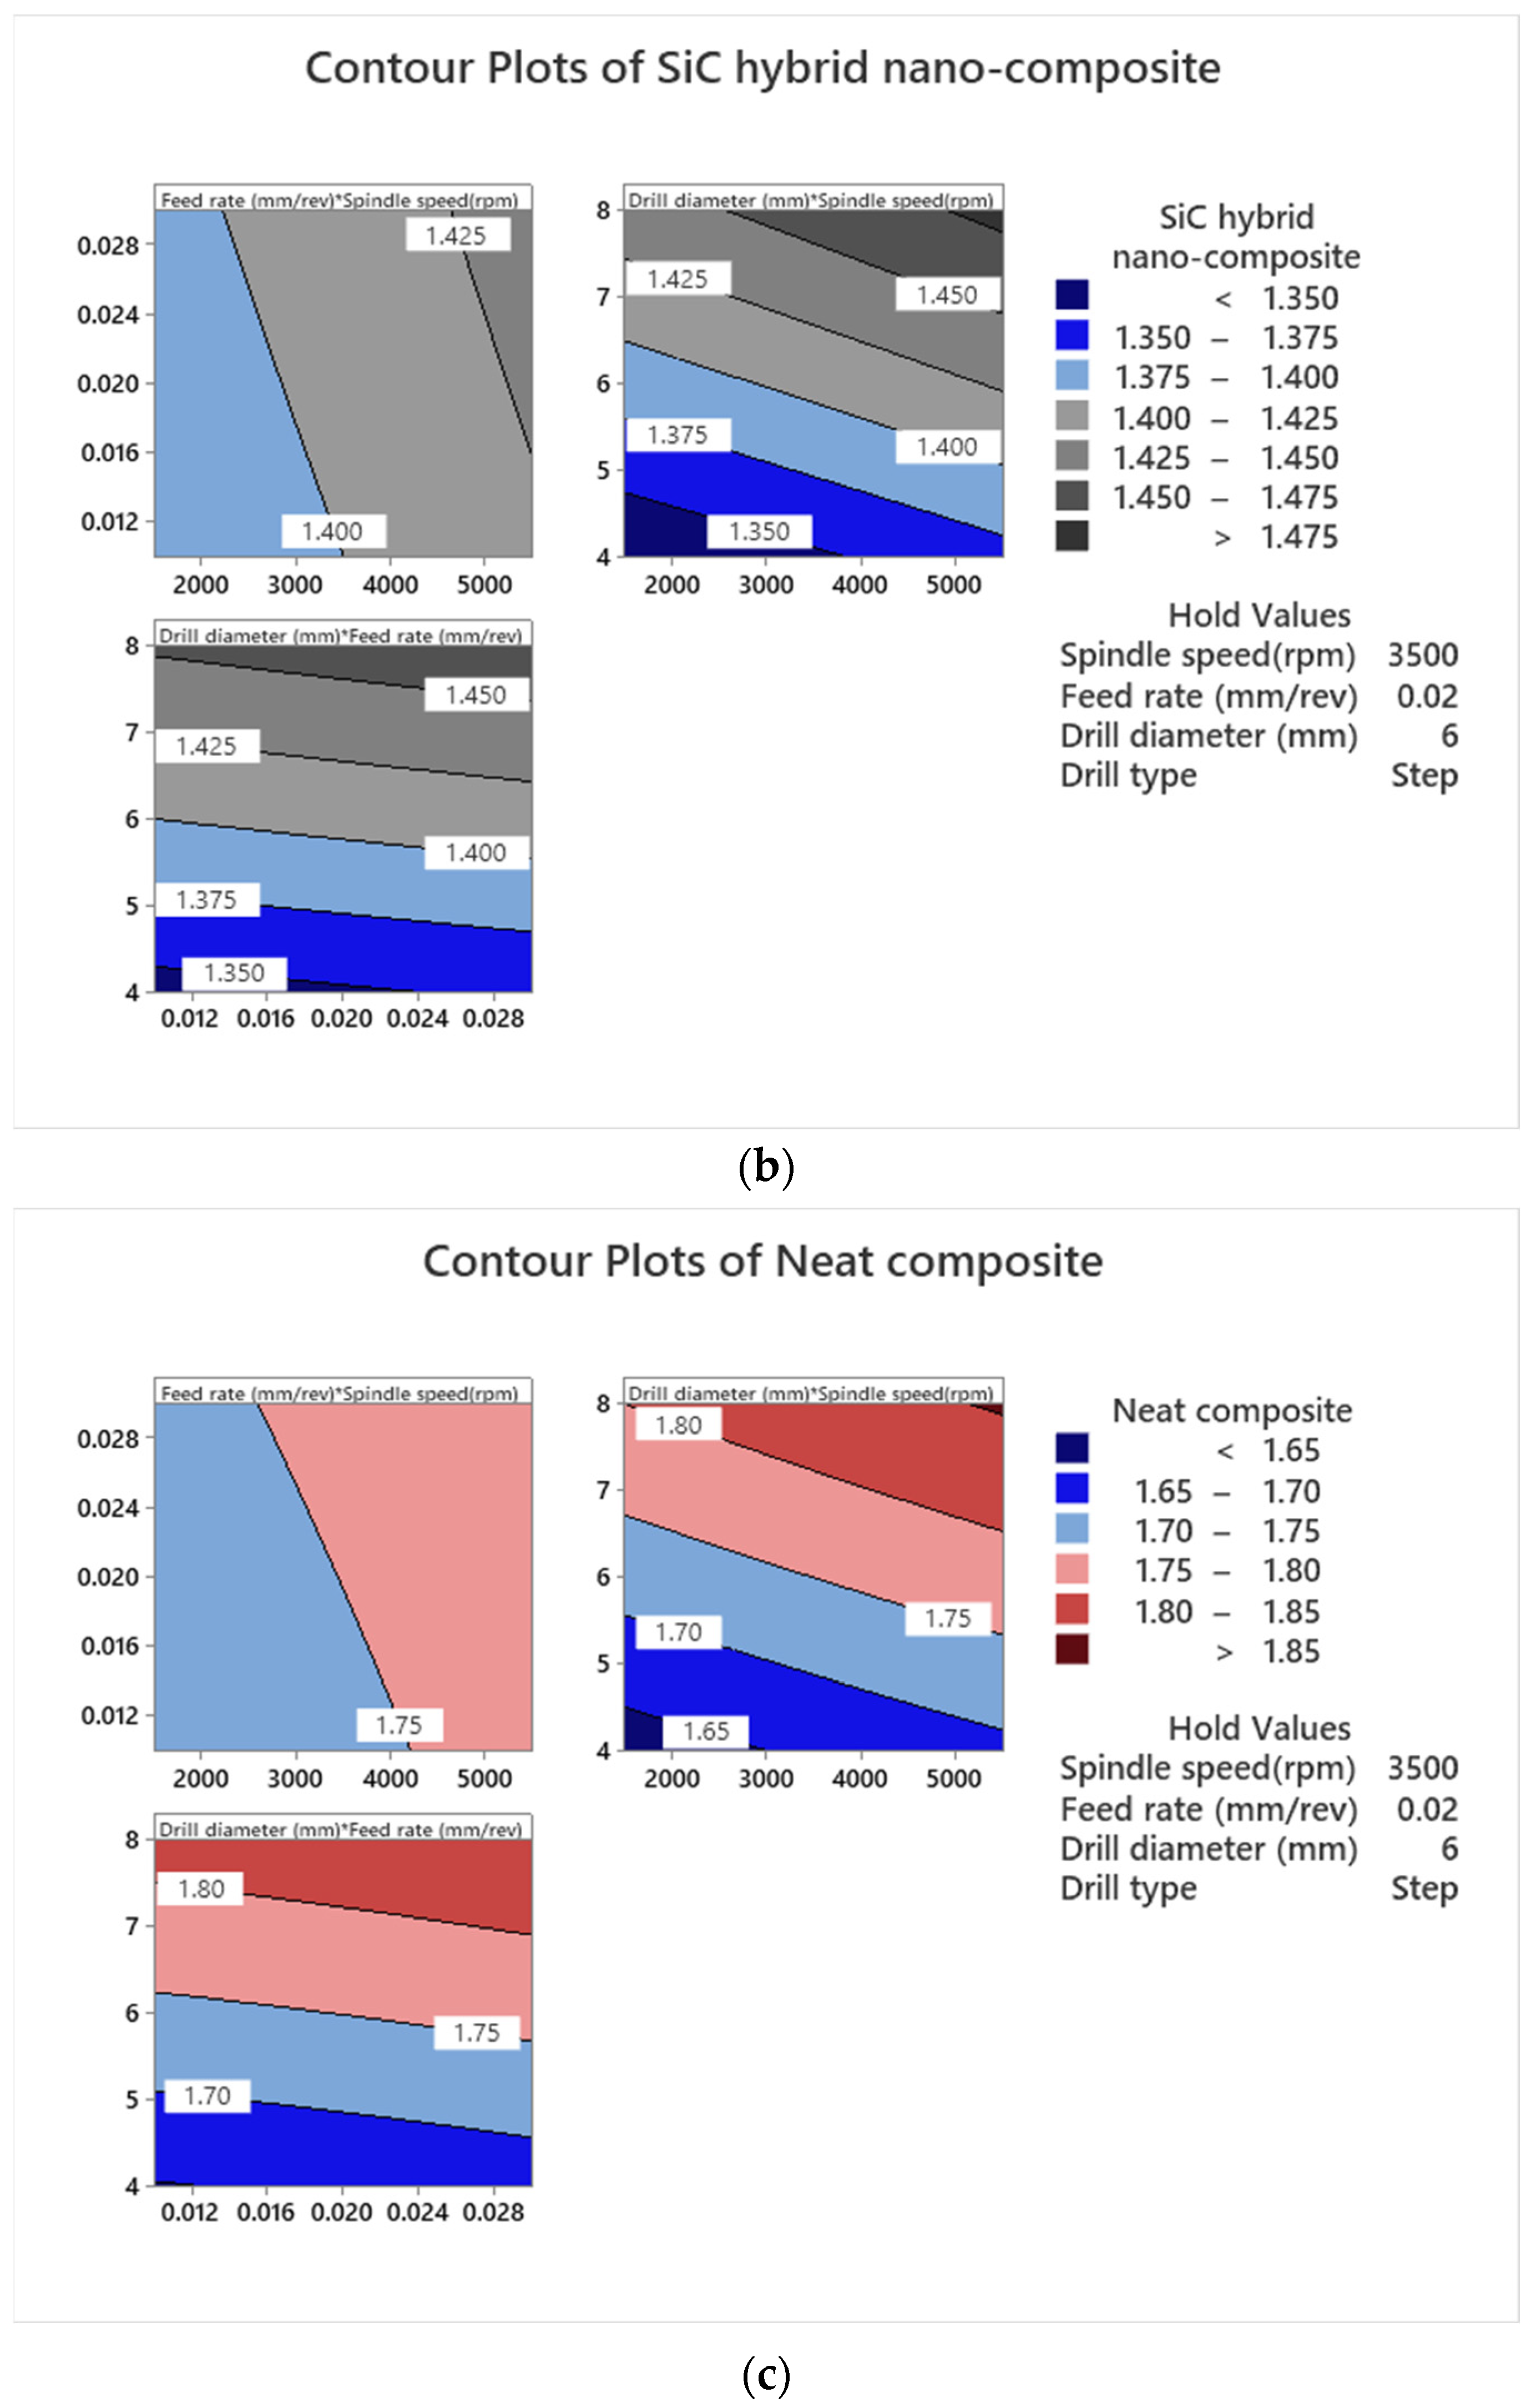
3.3. Contour Plot Analysis
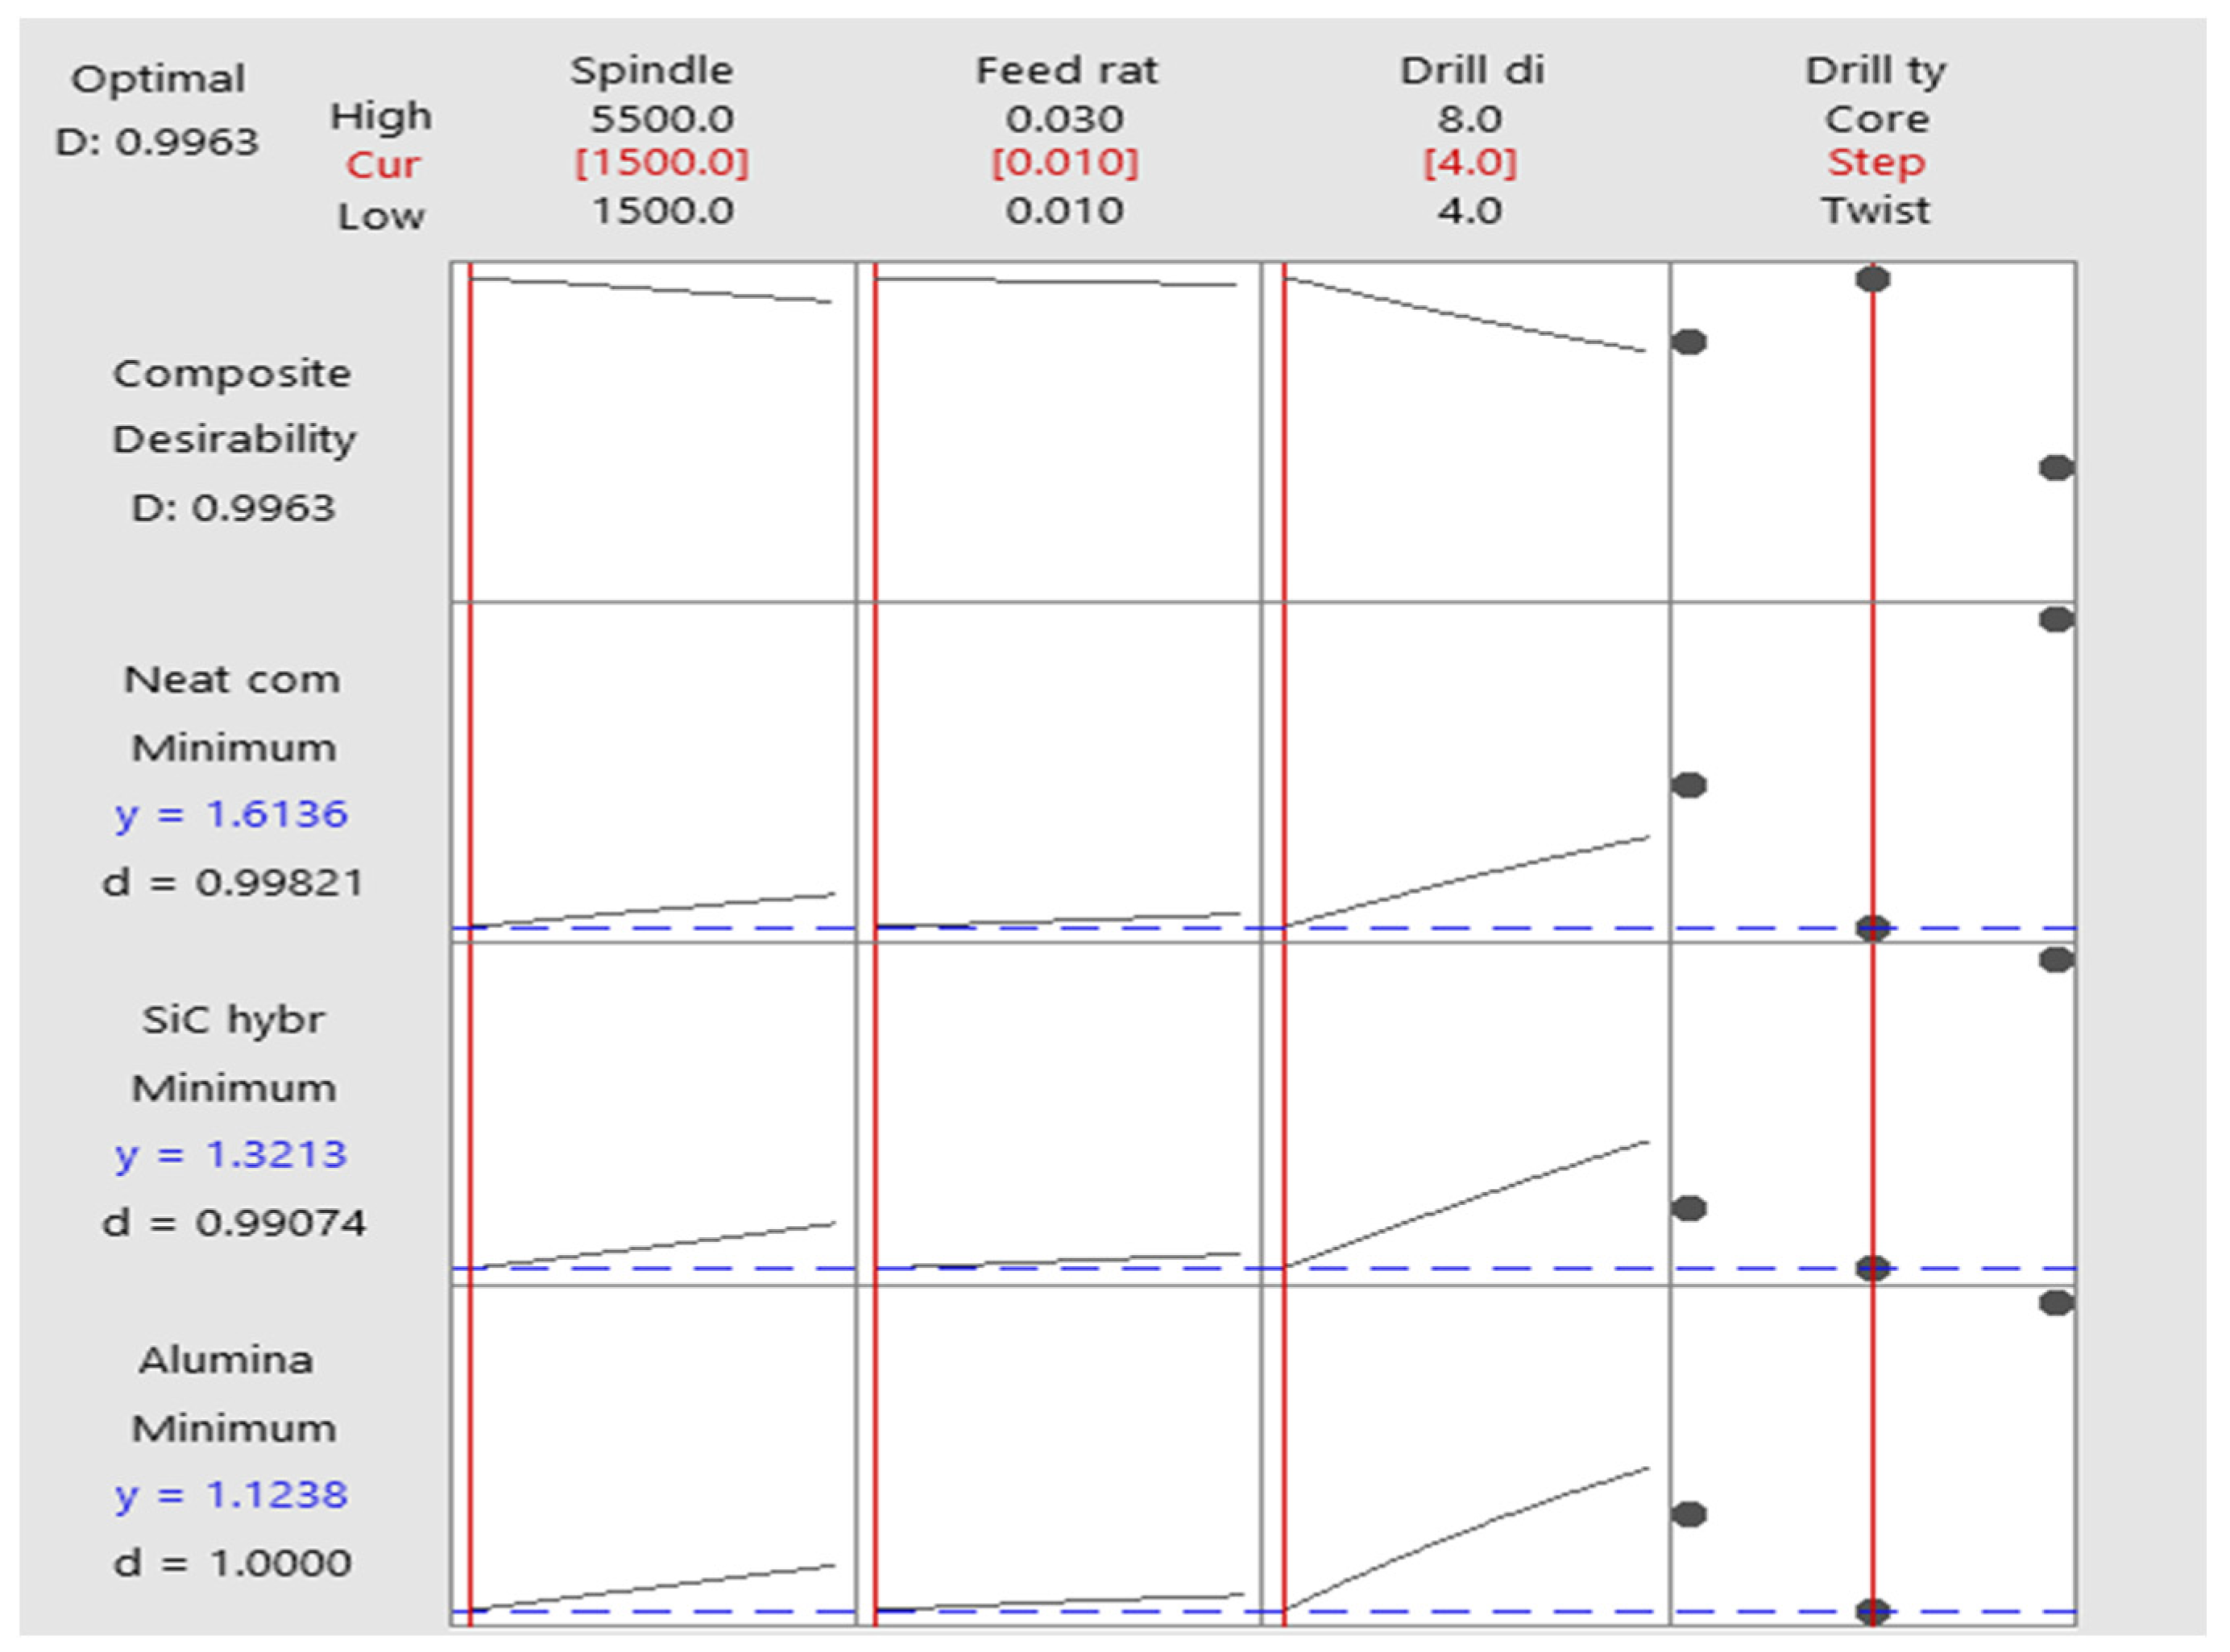
3.4. Optimization of Process Parameters
3.5. Confirmation Test
3.6. Validation Test
3.7. Prediction Output
4. Conclusions
- The input drilling parameters namely spindle speed, feed, drill diameter, and drill type significantly influenced the surface roughness of the investigated nano-composites. The maximum surface roughness value was observed for a higher drill diameter of 8 mm, followed by 6 and 4 mm drill diameters.
- The minimum surface roughness was observed for the Al2O3 hybrid nano-composite, followed by the SiC hybrid nano-composite, and maximum surface roughness was noted for the neat CFRP composite.
- Surface roughness increases with increasing spindle speed, feed, and drill diameter, and the drill type step drill has shown better performance in reducing surface roughness.
- ANOVA results indicated that the drill type followed by drill diameter showed a higher percentage contribution to surface roughness.
- The optimization of surface roughness was evaluated using the desirability function approach. From the optimization plot, it was possible to determine the surface roughness by redefining the values of input process parameters within the experimental range.
- The experimental results obtained during the drilling of the hybrid nano-composites and the neat CFRP composite using a step drill, core drill, and twist drill adequately correspond with the RSM-predicted values.
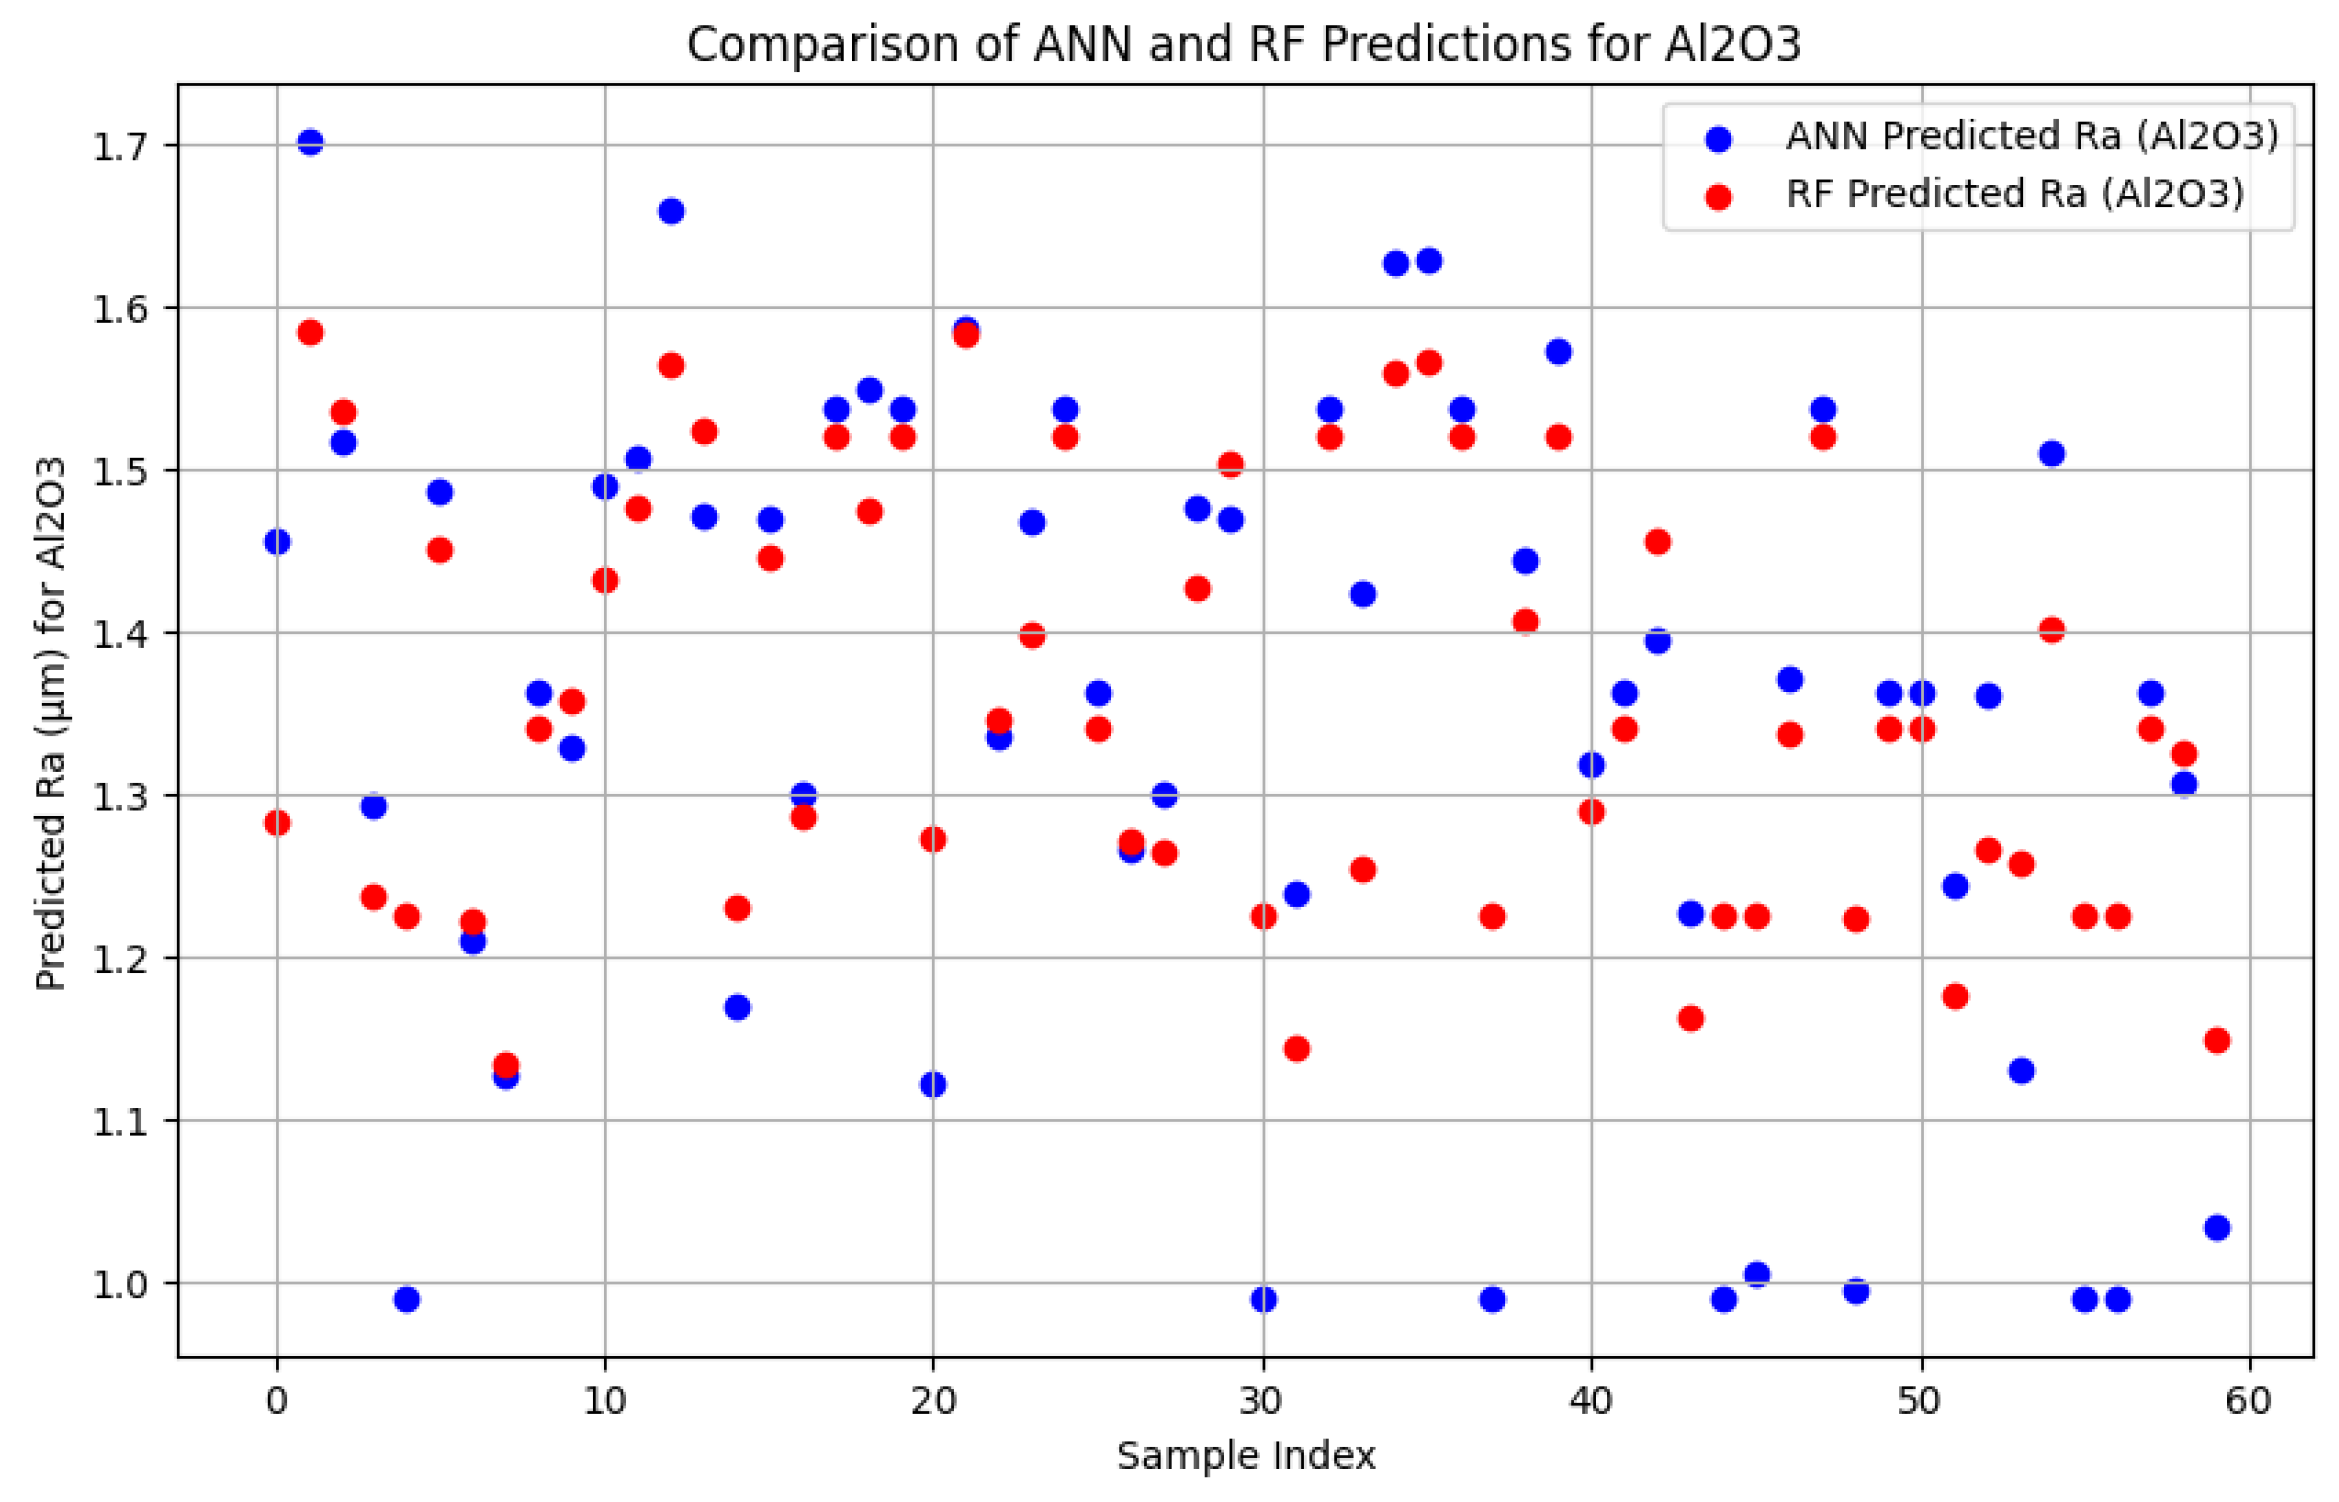
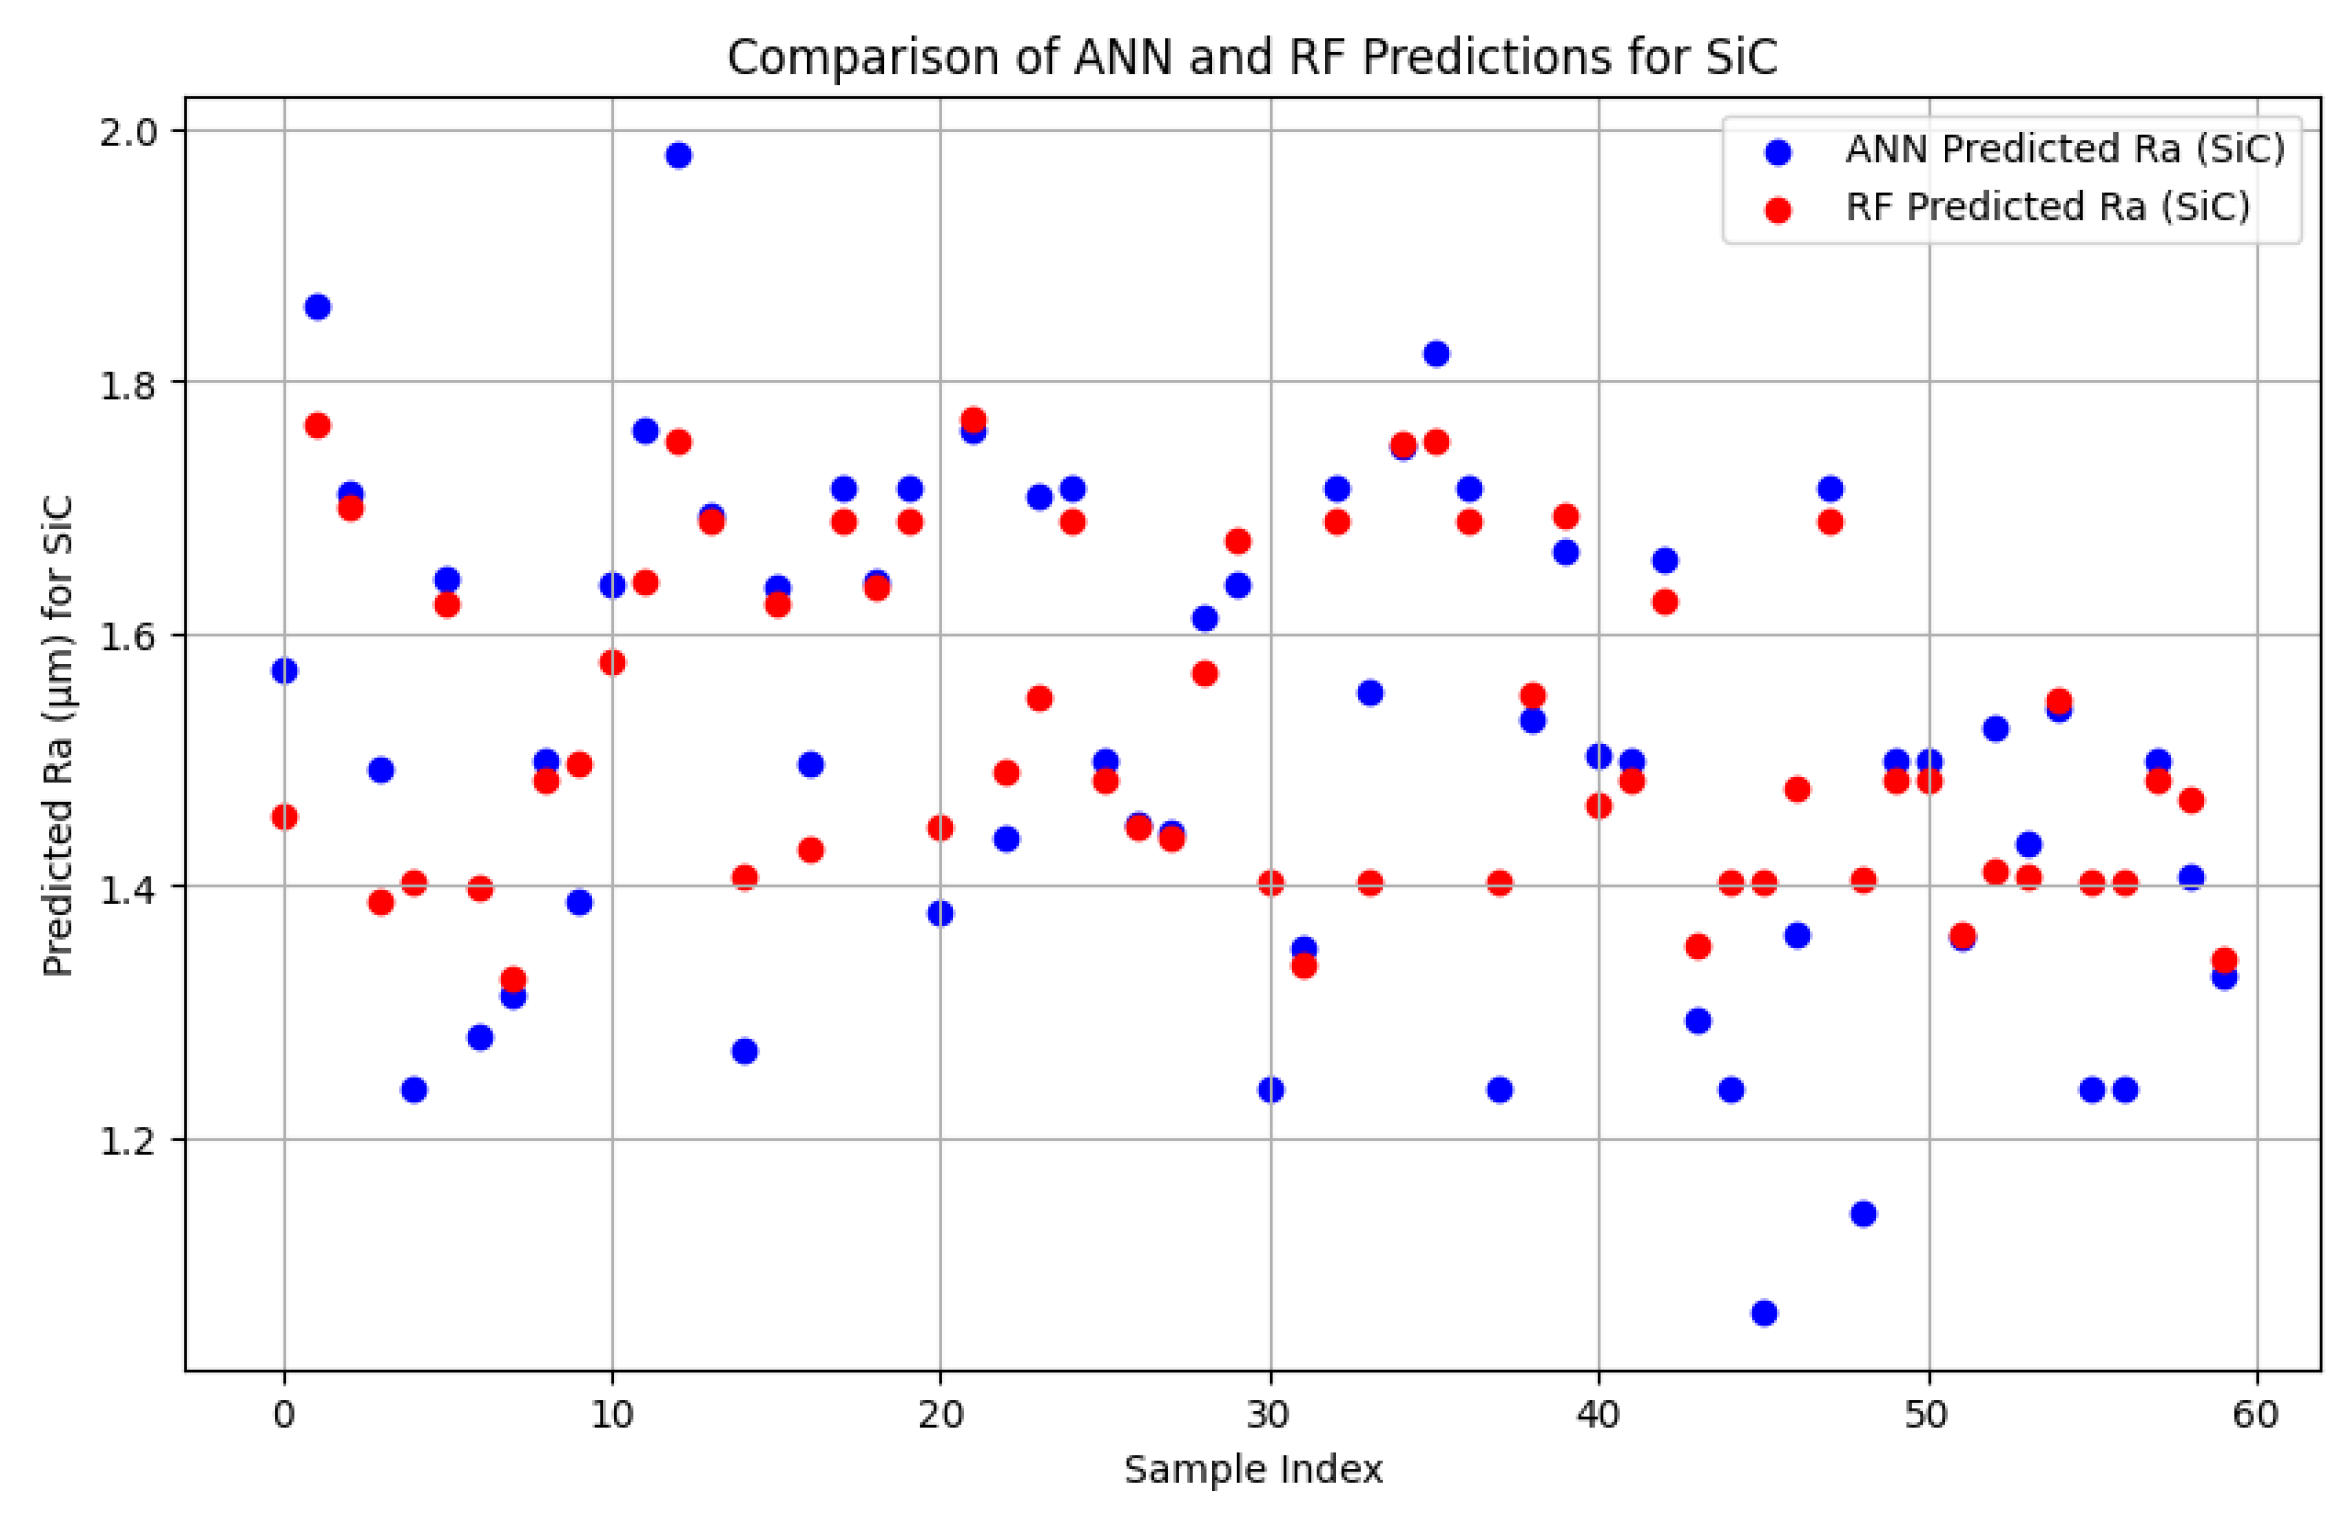
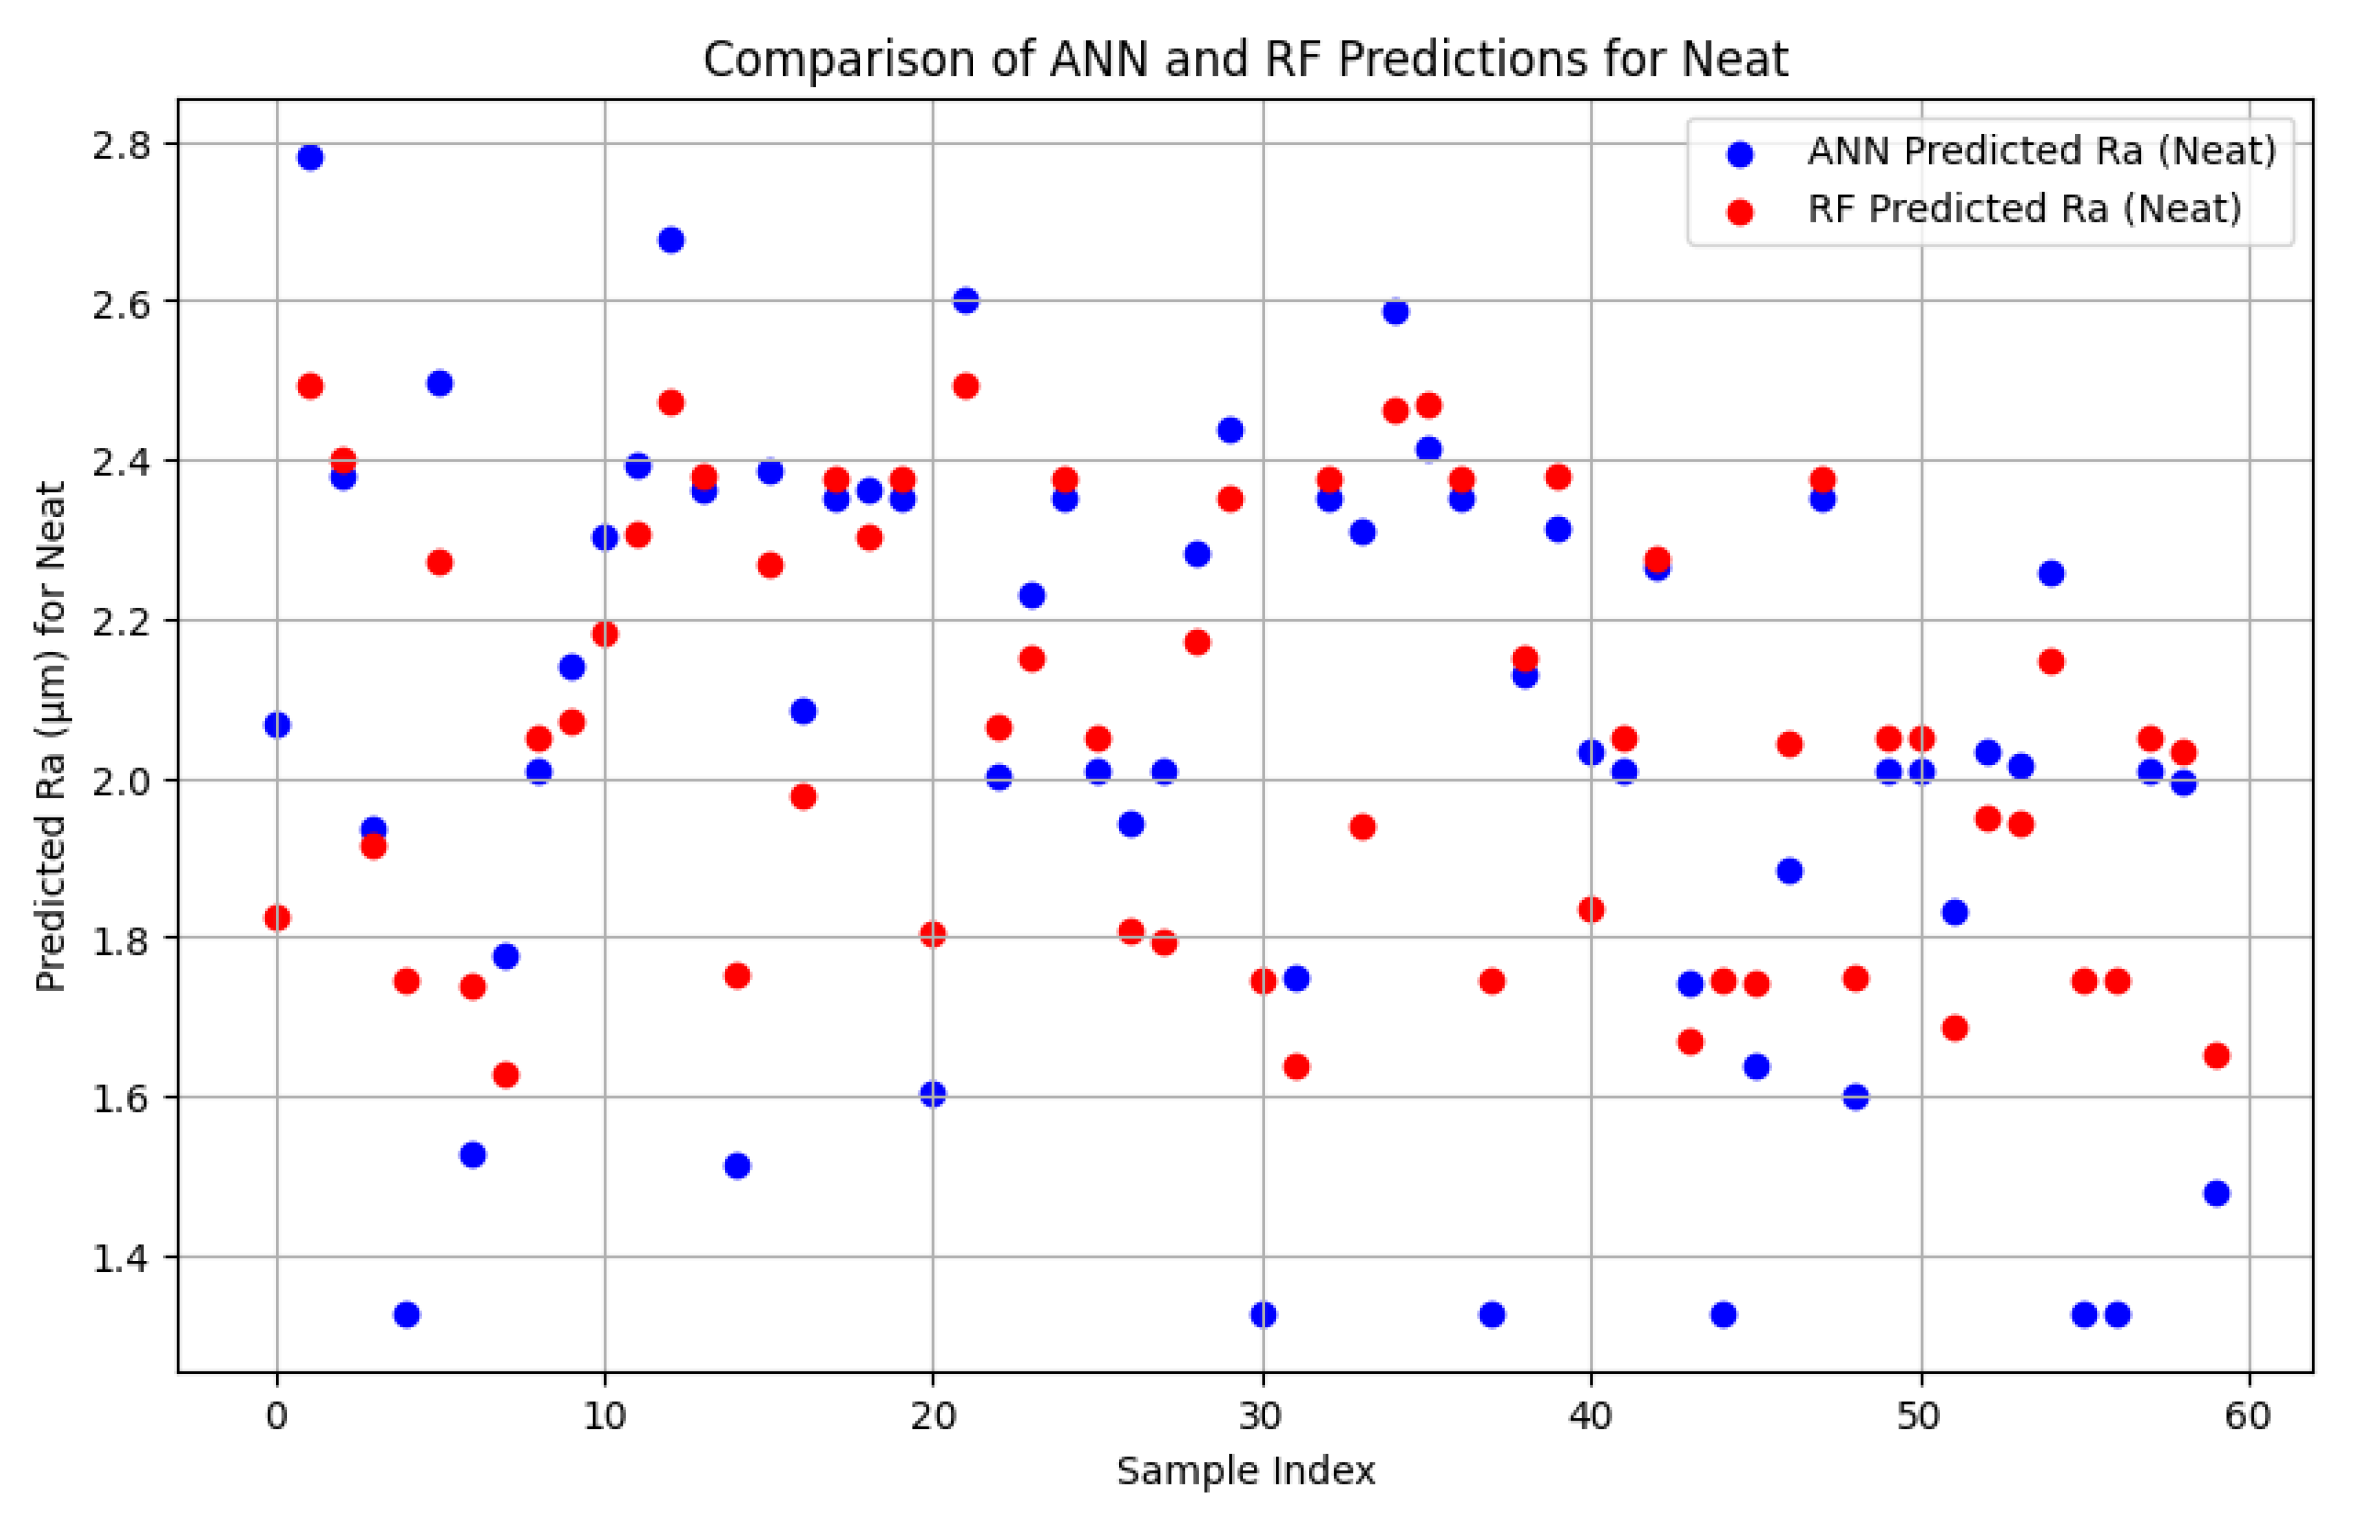
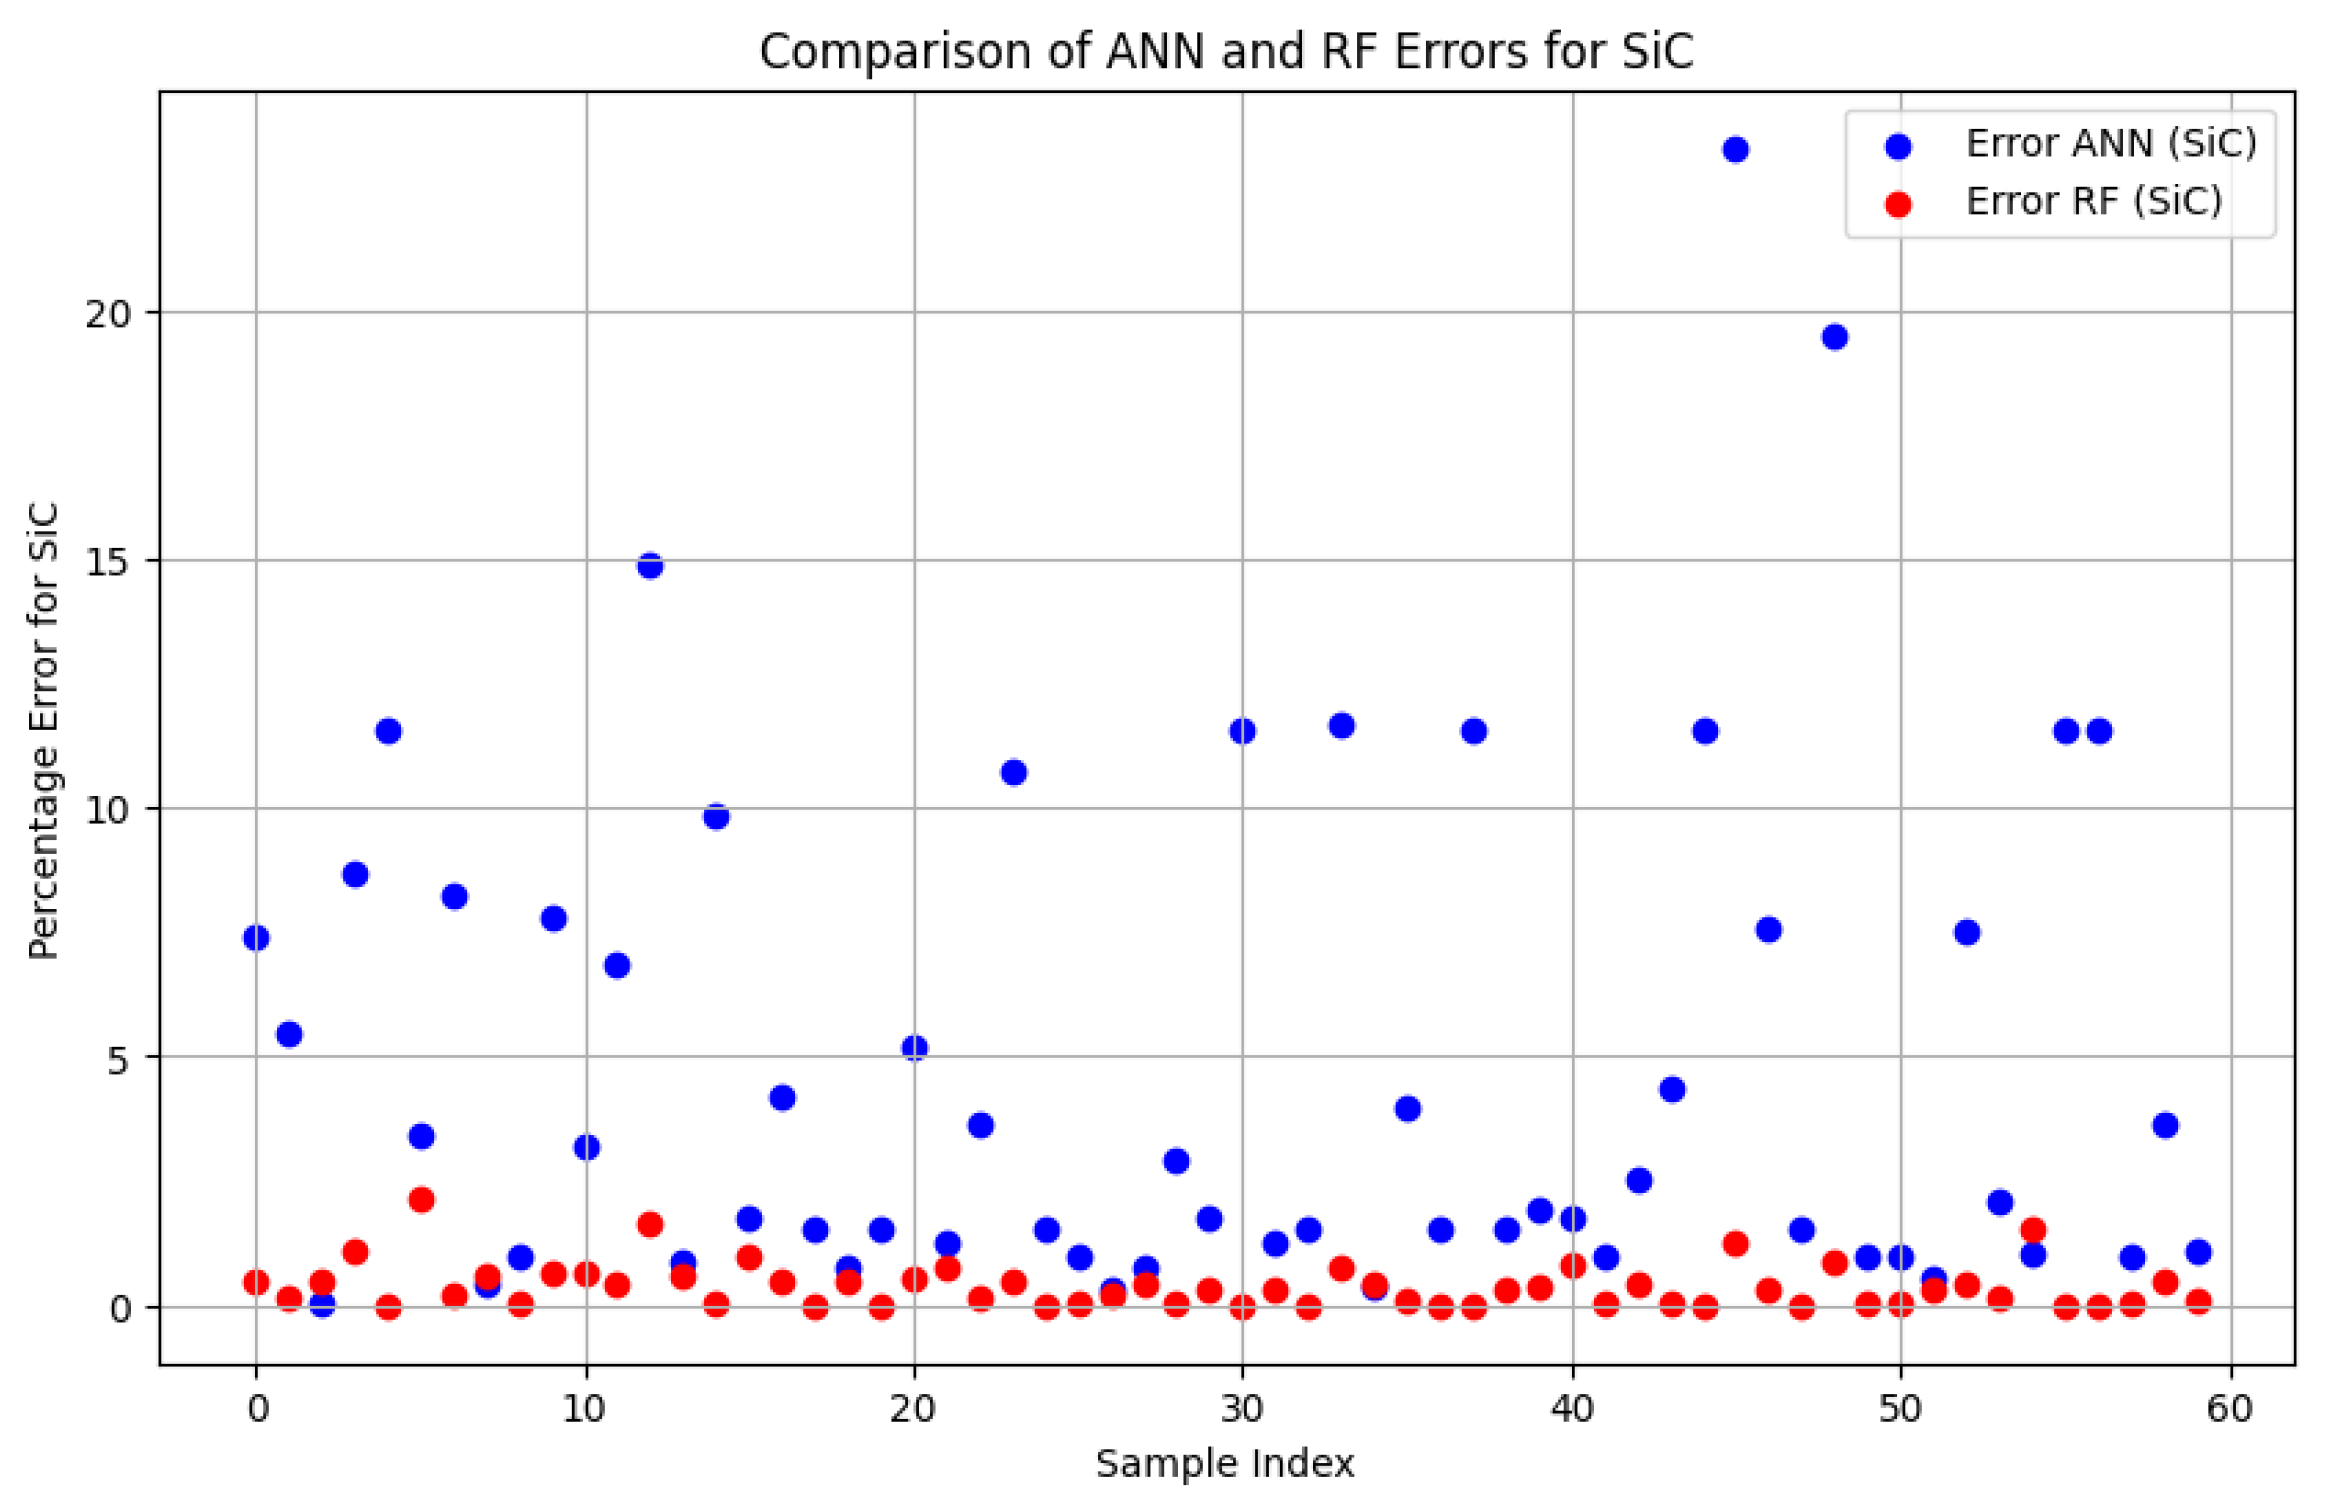
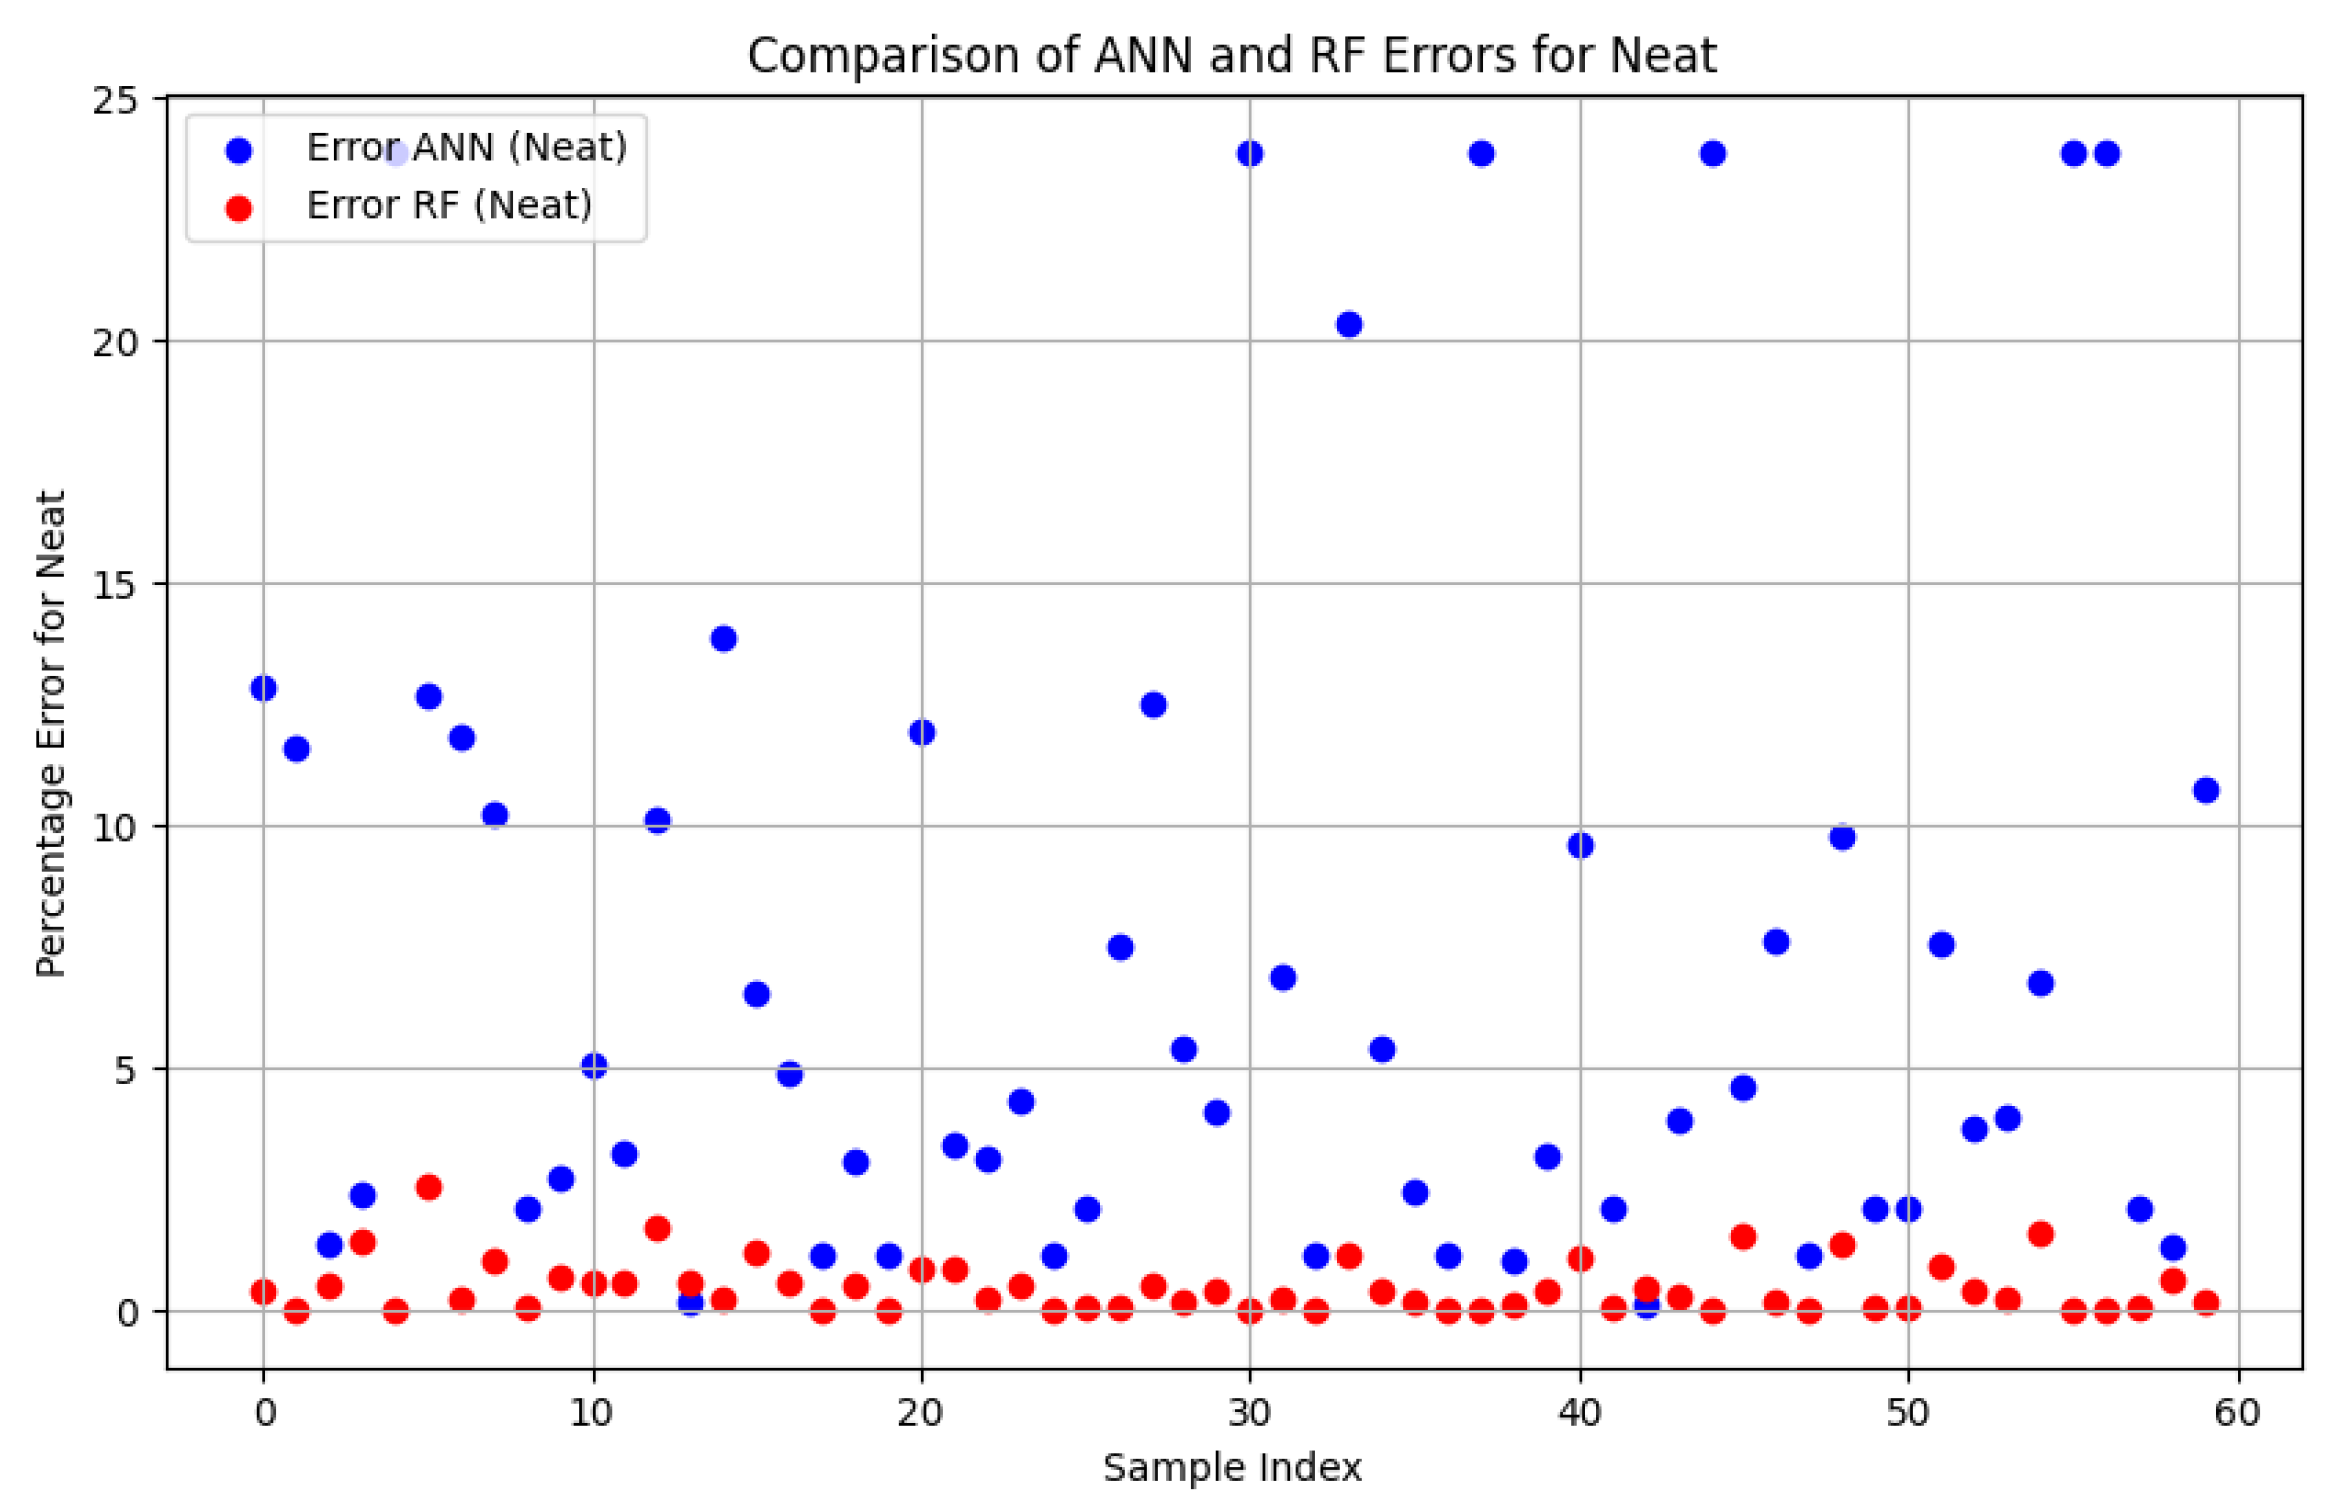
- The comparative analysis of ANN and RF predictions for the hybrid nano-composites and the neat CFRP composite provides visual insights into the performance of each model across different materials.
- The relative error predictions of both ANN and RF concerning the RSM-predicted Ra values, while comparing the results, shows that RF outperforms ANN and RSM due to its interpretability nature.
- The optimized drilling parameters along with the machine learning approach can be employed to other composites, such as glass, Kevlar, and polyimide fiber, for determining their surface roughness qualities.
Author Contributions
Funding
Data Availability Statement
Conflicts of Interest
References
- Ze, G.K.; Pramanik, A.; Basak, A.K.; Prakash, C.; Shankar, S.; Radhika, N. Challenges Associated with Drilling of Carbon Fiber Reinforced Polymer (CFRP) Composites—A Review. Compos. Part C Open Access 2023, 11, 100356. [Google Scholar] [CrossRef]
- Xu, J.; Yin, Y.; Paulo Davim, J.; Li, L.; Ji, M.; Geier, N.; Chen, M. A Critical Review Addressing Drilling-Induced Damage of CFRP Composites. Compos. Struct. 2022, 294, 115594. [Google Scholar] [CrossRef]
- Nuhiji, B.; Swait, T.; Bower, M.P.; Green, J.E.; Day, R.J.; Scaife, R.J. Tooling Materials Compatible with Carbon Fibre Composites in a Microwave Environment. Compos. Part B Eng. 2019, 163, 769–778. [Google Scholar] [CrossRef]
- Kaybal, H.B.; Ulus, H.; Demir, O.; Şahin, Ö.S.; Avcı, A. Effects of Alumina Nanoparticles on Dynamic Impact Responses of Carbon Fiber Reinforced Epoxy Matrix Nanocomposites. Eng. Sci. Technol. Int. J. 2018, 21, 399–407. [Google Scholar] [CrossRef]
- Li, N.; Li, Y.; Zhou, J.; He, Y.; Hao, X. Drilling Delamination and Thermal Damage of Carbon Nanotube/Carbon Fiber Reinforced Epoxy Composites Processed by Microwave Curing. Int. J. Mach. Tools Manuf. 2015, 97, 11–17. [Google Scholar] [CrossRef]
- Sheikh-Ahmad, J.Y. Machining of Polymer Composites; Springer: Berlin/Heidelberg, Germany, 2009; Volume 387355391, ISBN 9780387355399. [Google Scholar]
- Wetzel, B.; Haupert, F.; Qiu Zhang, M. Epoxy Nanocomposites with High Mechanical and Tribological Performance. Compos. Sci. Technol. 2003, 63, 2055–2067. [Google Scholar] [CrossRef]
- De Cicco, D.; Asaee, Z.; Taheri, F. Use of Nanoparticles for Enhancing the Interlaminar Properties of Fiber-Reinforced Composites and Adhesively Bonded Joints—A Review. Nanomaterials 2017, 7, 360. [Google Scholar] [CrossRef]
- Mohanty, A.; Srivastava, V.K.; Sastry, P.U. Investigation of Mechanical Properties of Alumina Nanoparticle-loaded Hybrid Glass/Carbon-fiber-reinforced Epoxy Composites. J. Appl. Polym. Sci. 2014, 131, 39749. [Google Scholar] [CrossRef]
- Swain, P.T.R.; Biswas, S. Effect of Moisture Absorption on the Mechanical Properties of Ceramic Filled Jute/Epoxy Hybrid Composites. IOP Conf. Ser. Mater. Sci. Eng. 2017, 178, 12010. [Google Scholar] [CrossRef]
- Shahabaz, S.M.; Shetty, P.K.; Shetty, N.; Sharma, S.; Divakara Shetty, S.; Naik, N. Effect of Alumina and Silicon Carbide Nanoparticle-Infused Polymer Matrix on Mechanical Properties of Unidirectional Carbon Fiber-Reinforced Polymer. J. Compos. Sci. 2022, 6, 381. [Google Scholar] [CrossRef]
- Shahabaz, S.M.; Mehrotra, P.; Kalita, H.; Sharma, S.; Naik, N.; Noronha, D.J.; Shetty, N. Effect of Al2O3 and SiC Nano-Fillers on the Mechanical Properties of Carbon Fiber-Reinforced Epoxy Hybrid Composites. J. Compos. Sci. 2023, 7, 133. [Google Scholar] [CrossRef]
- Davim, J.P.; Reis, P.; Antonio, C.C. Experimental Study of Drilling Glass Fiber Reinforced Plastics (GFRP) Manufactured by Hand Lay-Up. Compos. Sci. Technol. 2004, 64, 289–297. [Google Scholar] [CrossRef]
- Tsao, C.C.; Hocheng, H.; Chen, Y.C. Delamination Reduction in Drilling Composite Materials by Active Backup Force. CIRP Ann. 2012, 61, 91–94. [Google Scholar] [CrossRef]
- Rathod, D.; Rathod, M.; Patel, R.; Shahabaz, S.M.; Shetty, S.D.; Shetty, N. A Review on Strengthening, Delamination Formation and Suppression Techniques during Drilling of CFRP Composites. Cogent Eng. 2021, 8, 1941588. [Google Scholar] [CrossRef]
- Palanikumar, K.; Davim, J.P. Mathematical Model to Predict Tool Wear on the Machining of Glass Fibre Reinforced Plastic Composites. Mater. Des. 2007, 28, 2008–2014. [Google Scholar] [CrossRef]
- Ameur, M.F.; Habak, M.; Kenane, M.; Aouici, H.; Cheikh, M. Machinability Analysis of Dry Drilling of Carbon/Epoxy Composites: Cases of Exit Delamination and Cylindricity Error. Int. J. Adv. Manuf. Technol. 2017, 88, 2557–2571. [Google Scholar] [CrossRef]
- Feng, Z.; Gani, H.; Damayanti, A.D.; Gani, H. An Explainable Ensemble Machine Learning Model to Elucidate the Influential Drilling Parameters Based on Rate of Penetration Prediction. Geoenergy Sci. Eng. 2023, 231, 212231. [Google Scholar] [CrossRef]
- Solati, A.; Hamedi, M.; Safarabadi, M. Combined GA-ANN Approach for Prediction of HAZ and Bearing Strength in Laser Drilling of GFRP Composite. Opt. Laser Technol. 2019, 113, 104–115. [Google Scholar] [CrossRef]
- Murthy, B.R.N.; Rodrigues, L.L.R.; Sharma, N.Y.; Anjaiah, D. Influence of Process Parameters on the Quality of Hole in Drilling of GFRP Composites-an Experimental Investigation Using DOE. In Proceedings of the 2010 International Conference on Mechanical and Electrical Technology, Singapore, 10–12 September 2010; IEEE: Piscataway, NJ, USA, 2010; pp. 87–90. [Google Scholar]
- Montgomery, D.C. Design and Analysis of Experiments; John Wiley & Sons: Hoboken, NJ, USA, 2017; ISBN 1119113474. [Google Scholar]
- Jayabal, S.; Natarajan, U. Optimization of Thrust Force, Torque, and Tool Wear in Drilling of Coir Fiber-Reinforced Composites Using Nelder–Mead and Genetic Algorithm Methods. Int. J. Adv. Manuf. Technol. 2010, 51, 371–381. [Google Scholar] [CrossRef]
- Enemuoh, E.U.; El-Gizawy, A.S.; Okafor, A.C. An Approach for Development of Damage-Free Drilling of Carbon Fiber Reinforced Thermosets. Int. J. Mach. Tools Manuf. 2001, 41, 1795–1814. [Google Scholar] [CrossRef]
- Karthikeyan, R.; Jaiganesh, S.; Pai, B.C. Optimization of Drilling Characteristics for Al/SiC p Composites Using Fuzzy/GA. Met. Mater. Int. 2002, 8, 163–168. [Google Scholar] [CrossRef]


| Sl. No. | Parameters | |||
|---|---|---|---|---|
| Spindle Speed (rpm) | Feed (mm/rev) | Drill Diameter (mm) | Drill Type | |
| 1 | 1500 | 0.01 | 4 | Twist |
| 2 | 3500 | 0.02 | 6 | Step |
| 3 | 5500 | 0.03 | 8 | Core |
| Composite Type | Drill Type | Regression Equation |
|---|---|---|
| Al2O3 hybrid nano-composite | Twist | 0.9415 + 0.00.020018 × SS + 1.36 × F + 0.06897 × DD − 0.000000×S×SSS − 9. 4 × F × F − 0.002027 × DD × DD + 0.000088 × SS × F − 0.000001 × SS × DD − 0.1000 × F × DD |
| Step | 0.8863 + 0.000014 × SS + 1.36 × F + 0.06112 × DD − 0.000000 × SS × SS − 9.4 × F × F − 0.002027 × DD × DD + 0.000088 × SS × F − 0.000001 × SS × DD − 0.1000 × F × DD | |
| Core | 1.1867 + 0.000016 × SS + 1.05 × F + 0.06012 × DD − 0.000000 × SS × SS − 9.4 × F × F − 0.002027 × DD × DD + 0.000088 × SS × F − 0.000001 × SS × DD − 0.1000 × F × DD | |
| SiC hybrid nano-composite | Twist | 1.1715 + 0.000011 × SS + 0.98 × F + 0.04702 × DD + 0.000000 × SS × SS − 1.5 × F × F − 0.000788 × DD × DD + 0.000010 × SS × F + 0.000000 × SS × DD + 0.0021 × F × DD |
| Step | 1.1656 + 0.000008 × SS + 0.66 × F + 0.03712 × DD + 0.000000 × SS × SS − 1.5 × F × F − 0.000788 × DD × DD + 0.000010 × SS × F + 0.000000 × SS × DD + 0.0021 × F × DD | |
| Core | 1.4042 + 0.000010 × SS + 0.97 × F + 0.04317 × DD + 0.000000 × SS × SS − 1.5 × F × F − 0.000788 × DD × DD + 0.000010 × SS × F + 0.000000 × SS × DD + 0.0021 × F × DD | |
| Neat CFRP composite | Twist | 1.5652 + 0.000021 × SS + 1.23 × F + 0.07933 × DD − 0.000000 × SS × SS + 8.9 × F × F − 0.001777 × DD × DD + 0.000015 × SS × F − 0.000001 × SS × DD − 0.0479 × F × DD |
| Step | 1.3385 + 0.000020 × SS + 1.08 × F + 0.06688 × DD − 0.000000 × SS × SS + 8.9 × F × F − 0.001777 × DD × DD + 0.000015 × SS × F − 0.000001 × SS × DD − 0.0479 × F × DD | |
| Core | 1.8969 + 0.000023 × SS + 1.10 × F + 0.07738 × DD − 0.000000 × SS × SS + 8.9 × F × F − 0.001777 × DD × DD + 0.000015 × SS × F − 0.000001 × SS × DD − 0.0479 × F × DD |
| Spindle Speed (rpm) | Feed (mm/rev) | Drill Dia (mm) | Drill Type | Experimental Ra (µm) | RSM-Predicted Ra (µm) | Error (%) | ||||||
|---|---|---|---|---|---|---|---|---|---|---|---|---|
| Al2O3 | SiC | Neat | Al2O3 | SiC | Neat | Al2O3 | SiC | Neat | ||||
| 5500 | 0.01 | 8 | Step | 1.292 | 1.468 | 1.843 | 1.288 | 1.463 | 1.834 | 0.31 | 0.32 | 0.46 |
| 5500 | 0.01 | 8 | Core | 1.585 | 1.774 | 2.51 | 1.588 | 1.764 | 2.494 | −0.21 | 0.54 | 0.65 |
| 5500 | 0.02 | 6 | Core | 1.543 | 1.723 | 2.416 | 1.544 | 1.710 | 2.412 | −0.09 | 0.75 | 0.16 |
| 1500 | 0.01 | 4 | Twist | 1.216 | 1.391 | 1.893 | 1.216 | 1.373 | 1.891 | 0.01 | 1.27 | 0.10 |
| 3500 | 0.02 | 6 | Step | 1.224 | 1.411 | 1.751 | 1.226 | 1.402 | 1.745 | −0.13 | 0.67 | 0.33 |
| 1500 | 0.01 | 4 | Core | 1.417 | 1.576 | 2.235 | 1.420 | 1.589 | 2.217 | −0.19 | −0.83 | 0.82 |
| 3500 | 0.01 | 6 | Step | 1.203 | 1.395 | 1.735 | 1.218 | 1.395 | 1.734 | −1.23 | 0.01 | 0.05 |
| 1500 | 0.01 | 4 | Step | 1.134 | 1.317 | 1.612 | 1.123 | 1.320 | 1.612 | 0.94 | −0.24 | 0.03 |
| 3500 | 0.02 | 6 | Twist | 1.343 | 1.481 | 2.067 | 1.342 | 1.484 | 2.053 | 0.08 | −0.18 | 0.67 |
| 5500 | 0.02 | 6 | Twist | 1.371 | 1.512 | 2.097 | 1.369 | 1.506 | 2.084 | 0.11 | 0.39 | 0.63 |
| 5500 | 0.03 | 8 | Twist | 1.435 | 1.612 | 2.192 | 1.441 | 1.588 | 2.194 | −0.45 | 1.49 | −0.07 |
| 5500 | 0.03 | 4 | Core | 1.478 | 1.651 | 2.317 | 1.486 | 1.649 | 2.320 | −0.56 | 0.13 | −0.14 |
| 1500 | 0.01 | 8 | Core | 1.559 | 1.731 | 2.437 | 1.553 | 1.724 | 2.433 | 0.40 | 0.40 | 0.16 |
| 3500 | 0.01 | 6 | Core | 1.513 | 1.684 | 2.357 | 1.516 | 1.680 | 2.366 | −0.20 | 0.24 | −0.39 |
| 3500 | 0.03 | 6 | Step | 1.224 | 1.419 | 1.768 | 1.232 | 1.408 | 1.758 | −0.62 | 0.79 | 0.56 |
| 1500 | 0.03 | 4 | Core | 1.432 | 1.61 | 2.249 | 1.428 | 1.608 | 2.242 | 0.30 | 0.14 | 0.29 |
| 5500 | 0.03 | 4 | Twist | 1.294 | 1.442 | 1.983 | 1.297 | 1.437 | 1.989 | −0.22 | 0.32 | −0.31 |
| 3500 | 0.02 | 6 | Core | 1.527 | 1.694 | 2.381 | 1.521 | 1.690 | 2.378 | 0.40 | 0.26 | 0.14 |
| 5500 | 0.01 | 4 | Core | 1.466 | 1.637 | 2.289 | 1.471 | 1.629 | 2.293 | −0.35 | 0.46 | −0.19 |
| 3500 | 0.02 | 6 | Core | 1.527 | 1.694 | 2.381 | 1.521 | 1.690 | 2.378 | 0.40 | 0.26 | 0.14 |
| 3500 | 0.02 | 8 | Step | 1.283 | 1.457 | 1.824 | 1.280 | 1.454 | 1.820 | 0.22 | 0.22 | 0.20 |
| 5500 | 0.03 | 8 | Core | 1.598 | 1.783 | 2.533 | 1.595 | 1.784 | 2.517 | 0.16 | −0.06 | 0.64 |
| 3500 | 0.03 | 6 | Twist | 1.362 | 1.495 | 2.078 | 1.348 | 1.493 | 2.068 | 1.03 | 0.12 | 0.50 |
| 1500 | 0.03 | 8 | Twist | 1.395 | 1.547 | 2.149 | 1.391 | 1.543 | 2.140 | 0.30 | 0.28 | 0.43 |
| 3500 | 0.02 | 6 | Core | 1.527 | 1.694 | 2.381 | 1.521 | 1.690 | 2.378 | 0.40 | 0.26 | 0.14 |
| 3500 | 0.02 | 6 | Twist | 1.343 | 1.481 | 2.067 | 1.342 | 1.484 | 2.053 | 0.08 | −0.18 | 0.67 |
| 1500 | 0.03 | 8 | Step | 1.275 | 1.442 | 1.815 | 1.267 | 1.444 | 1.807 | 0.64 | −0.11 | 0.42 |
| 1500 | 0.01 | 8 | Step | 1.267 | 1.435 | 1.794 | 1.261 | 1.431 | 1.786 | 0.51 | 0.29 | 0.45 |
| 5500 | 0.01 | 8 | Twist | 1.423 | 1.585 | 2.175 | 1.428 | 1.568 | 2.168 | −0.35 | 1.07 | 0.33 |
| 1500 | 0.02 | 6 | Core | 1.492 | 1.672 | 2.342 | 1.497 | 1.669 | 2.343 | −0.36 | 0.17 | −0.04 |
| 3500 | 0.02 | 6 | Step | 1.224 | 1.411 | 1.751 | 1.226 | 1.402 | 1.745 | −0.13 | 0.67 | 0.33 |
| 1500 | 0.03 | 4 | Step | 1.146 | 1.326 | 1.633 | 1.138 | 1.333 | 1.637 | 0.73 | −0.50 | −0.24 |
| 3500 | 0.02 | 6 | Core | 1.527 | 1.694 | 2.381 | 1.521 | 1.690 | 2.378 | 0.40 | 0.26 | 0.14 |
| 1500 | 0.03 | 4 | Twist | 1.227 | 1.397 | 1.925 | 1.230 | 1.392 | 1.919 | −0.26 | 0.34 | 0.29 |
| 1500 | 0.03 | 8 | Core | 1.535 | 1.742 | 2.454 | 1.553 | 1.743 | 2.455 | −1.17 | −0.05 | −0.04 |
| 3500 | 0.02 | 8 | Core | 1.573 | 1.755 | 2.479 | 1.573 | 1.754 | 2.474 | −0.02 | 0.06 | 0.22 |
| 3500 | 0.02 | 6 | Core | 1.527 | 1.694 | 2.381 | 1.521 | 1.690 | 2.378 | 0.40 | 0.26 | 0.14 |
| 3500 | 0.02 | 6 | Step | 1.224 | 1.411 | 1.751 | 1.226 | 1.402 | 1.745 | −0.13 | 0.67 | 0.33 |
| 3500 | 0.02 | 8 | Twist | 1.412 | 1.562 | 2.164 | 1.412 | 1.556 | 2.153 | −0.01 | 0.40 | 0.50 |
| 3500 | 0.03 | 6 | Core | 1.535 | 1.712 | 2.397 | 1.524 | 1.699 | 2.391 | 0.73 | 0.76 | 0.26 |
| 5500 | 0.03 | 8 | Step | 1.302 | 1.484 | 1.862 | 1.301 | 1.477 | 1.857 | 0.05 | 0.49 | 0.26 |
| 3500 | 0.02 | 6 | Twist | 1.343 | 1.481 | 2.067 | 1.342 | 1.484 | 2.053 | 0.08 | −0.18 | 0.67 |
| 3500 | 0.02 | 4 | Core | 1.451 | 1.625 | 2.261 | 1.452 | 1.619 | 2.267 | −0.08 | 0.37 | −0.28 |
| 5500 | 0.01 | 4 | Step | 1.169 | 1.362 | 1.682 | 1.167 | 1.353 | 1.676 | 0.18 | 0.69 | 0.35 |
| 3500 | 0.02 | 6 | Step | 1.224 | 1.411 | 1.751 | 1.226 | 1.402 | 1.745 | −0.13 | 0.67 | 0.33 |
| 1500 | 0.02 | 6 | Step | 1.192 | 1.389 | 1.727 | 1.206 | 1.385 | 1.717 | −1.19 | 0.28 | 0.60 |
| 3500 | 0.01 | 6 | Twist | 1.327 | 1.472 | 2.035 | 1.334 | 1.474 | 2.041 | −0.53 | −0.13 | −0.27 |
| 3500 | 0.02 | 6 | Core | 1.527 | 1.694 | 2.381 | 1.521 | 1.690 | 2.378 | 0.40 | 0.26 | 0.14 |
| 5500 | 0.02 | 6 | Step | 1.258 | 1.429 | 1.781 | 1.245 | 1.418 | 1.774 | 1.02 | 0.78 | 0.40 |
| 3500 | 0.02 | 6 | Twist | 1.343 | 1.481 | 2.067 | 1.342 | 1.484 | 2.053 | 0.08 | −0.18 | 0.67 |
| 3500 | 0.02 | 6 | Twist | 1.343 | 1.481 | 2.067 | 1.342 | 1.484 | 2.053 | 0.08 | −0.18 | 0.67 |
| 5500 | 0.03 | 4 | Step | 1.187 | 1.371 | 1.708 | 1.188 | 1.366 | 1.703 | −0.10 | 0.38 | 0.31 |
| 5500 | 0.01 | 4 | Twist | 1.289 | 1.423 | 1.962 | 1.275 | 1.418 | 1.960 | 1.05 | 0.37 | 0.12 |
| 3500 | 0.02 | 4 | Twist | 1.245 | 1.415 | 1.943 | 1.256 | 1.405 | 1.939 | −0.85 | 0.68 | 0.21 |
| 1500 | 0.01 | 8 | Twist | 1.389 | 1.525 | 2.127 | 1.385 | 1.524 | 2.115 | 0.32 | 0.09 | 0.56 |
| 3500 | 0.02 | 6 | Step | 1.224 | 1.411 | 1.751 | 1.226 | 1.402 | 1.745 | −0.13 | 0.67 | 0.33 |
| 3500 | 0.02 | 6 | Step | 1.224 | 1.411 | 1.751 | 1.226 | 1.402 | 1.745 | −0.13 | 0.67 | 0.33 |
| 3500 | 0.02 | 6 | Twist | 1.343 | 1.481 | 2.067 | 1.342 | 1.484 | 2.053 | 0.08 | −0.18 | 0.67 |
| 1500 | 0.02 | 6 | Twist | 1.312 | 1.457 | 1.994 | 1.314 | 1.461 | 2.023 | −0.19 | −0.30 | −1.43 |
| 3500 | 0.02 | 4 | Step | 1.157 | 1.345 | 1.651 | 1.155 | 1.343 | 1.656 | 0.18 | 0.15 | −0.30 |
| Standard deviation | 0.133 | 0.131 | 0.270 | 0.133 | 0.132 | 0.270 | 0.494 | 0.412 | 0.367 | |||
| Source | Al2O3 Hybrid Nano-Composite | SiC Hybrid Nano-Composite | Neat CFRP Composite | ||||||
|---|---|---|---|---|---|---|---|---|---|
| F-Value | p-Value | Contribution | F-Value | p-Value | Contribution | F-Value | p-Value | Contribution | |
| SS (rpm) | 271.56 | 0.000 | 1.57% | 375.32 | 0.000 | 1.58% | 439.08 | 0.000 | 0.72% |
| F (mm/rev) | 17.07 | 0.000 | 0.10% | 51.13 | 0.000 | 0.21% | 67.15 | 0.000 | 0.11% |
| DD (mm) | 2237.39 | 0.000 | 12.96% | 3115.81 | 0.000 | 13.10% | 4294.96 | 0.000 | 7.00% |
| D | 7317.61 | 0.000 | 84.75% | 10,072.15 | 0.000 | 84.70% | 28,227.18 | 0.000 | 92.00% |
| Square | 6.51 | 0.001 | 0.11% | 0.96 | 0.423 | 0.01% | 3.88 | 0.015 | 0.02% |
| SS (rpm) × S (rpm) | 0.01 | 0.920 | 0.05% | 0.09 | 0.768 | 0.00% | 0.19 | 0.666 | 0.01% |
| F (mm/rev) × F (mm/rev) | 0.12 | 0.730 | 0.01% | 0.00 | 0.948 | 0.00% | 0.09 | 0.761 | 0.00% |
| DD (mm) × DD (mm) | 8.96 | 0.005 | 0.05% | 1.89 | 0.177 | 0.01% | 5.90 | 0.019 | 0.01% |
| 2-Way Interaction | 5.16 | 0.000 | 0.27% | 5.65 | 0.000 | 0.21% | 6.13 | 0.000 | 0.09% |
| SS (rpm) × F (mm/rev) | 1.22 | 0.277 | 0.01% | 0.02 | 0.878 | 0.00% | 0.03 | 0.866 | 0.00% |
| SS (rpm) × DD (mm) | 6.35 | 0.016 | 0.04% | 0.22 | 0.644 | 0.00% | 1.79 | 0.189 | 0.00% |
| SS (rpm) × D | 2.58 | 0.088 | 0.03% | 1.59 | 0.217 | 0.01% | 1.00 | 0.378 | 0.00% |
| F (mm/rev) × DD (mm) | 1.59 | 0.215 | 0.01% | 0.00 | 0.975 | 0.00% | 0.31 | 0.579 | 0.00% |
| F (mm/rev) × D | 0.53 | 0.593 | 0.01% | 0.76 | 0.473 | 0.01% | 0.09 | 0.910 | 0.00% |
| DD (mm) × D | 15.53 | 0.000 | 0.18% | 22.96 | 0.000 | 0.19% | 25.42 | 0.000 | 0.08% |
| R-square value | 99.76 | 99.82 | 99.93 | ||||||
| R-square adjusted value | 99.66 | 99.75 | 99.82 | ||||||
| Optimum Input Process Parameters | Composite Type | Experimental Value | RSM-Predicted Value | Error (%) | |||
|---|---|---|---|---|---|---|---|
| SS (rpm) | F (mm/rev) | DD (mm) | D | ||||
| 1500 | 0.01 | 4 | Step | Al2O3 hybrid nano-composite | 1.127 | 1.123 | 0.28 |
| SiC hybrid nano-composite | 1.332 | 1.321 | 0.81 | ||||
| Neat CFRP composite | 1.642 | 1.613 | 1.76 | ||||
| Experiment No. | Spindle Speed (rpm) | Feed (mm/rev) | Drill Diameter (mm) | Drill Type |
|---|---|---|---|---|
| 1 | 1500 | 0.02 | 4 | Twist |
| 2 | 5500 | 0.03 | 6 | Step |
| 3 | 1500 | 0.01 | 8 | Core |
| Composite Type | Optimum Input Process Parameters | Experimental Value | RSM-Predicted Value | Error (%) | |||
|---|---|---|---|---|---|---|---|
| SS (rpm) | F (mm/rev) | DD (mm) | D | ||||
| Al2O3 hybrid nano-composite | 1500 | 0.02 | 4 | Twist | 1.224 | 1.310 | 7.03 |
| 5500 | 0.03 | 6 | Step | 1.253 | 1.285 | 2.55 | |
| 1500 | 0.01 | 8 | Core | 1.553 | 1.502 | 3.28 | |
| SiC hybrid nano-composite | 1500 | 0.02 | 4 | Twist | 1.383 | 1.368 | 1.08 |
| 5500 | 0.03 | 6 | Step | 1.424 | 1.345 | 5.55 | |
| 1500 | 0.01 | 8 | Core | 1.724 | 1.716 | 0.46 | |
| Neat CFRP composite | 1500 | 0.02 | 4 | Twist | 1.904 | 1.853 | 2.68 |
| 5500 | 0.03 | 6 | Step | 1.787 | 1.685 | 5.71 | |
| 1500 | 0.01 | 8 | Core | 2.433 | 2.498 | 2.67 | |
| Spindle Speed (rpm) | Feed (mm/rev) | Drill Diameter (mm) | Drill Type | ANN Predicted Ra (Al2O3) | ANN Predicted Ra (Sic) | ANN Predicted Ra (Neat) | RF Predicted Ra (Al2O3) | RF Predicted Ra (Sic) | RF Predicted Ra (Neat) | Error ANN (Al2O3) | Error ANN (Sic) | Error ANN (Neat) | Error RF (Al2O3) | Error RF (Sic) | Error RF (Neat) |
|---|---|---|---|---|---|---|---|---|---|---|---|---|---|---|---|
| 5500 | 0.01 | 8 | 1 | 1.456352 | 1.571367 | 2.069188 | 1.28377 | 1.45562 | 1.82663 | 13.07 | 7.41 | 12.82 | 0.33 | 0.5 | 0.4 |
| 5500 | 0.01 | 8 | 0 | 1.702711 | 1.860966 | 2.782625 | 1.5858 | 1.76628 | 2.494 | 7.22 | 5.5 | 11.57 | 0.14 | 0.13 | 0 |
| 5500 | 0.02 | 6 | 0 | 1.517819 | 1.710853 | 2.380019 | 1.53677 | 1.70136 | 2.39969 | 1.7 | 0.05 | 1.33 | 0.47 | 0.51 | 0.51 |
| 1500 | 0.01 | 4 | 2 | 1.293901 | 1.492233 | 1.935694 | 1.23783 | 1.38834 | 1.91747 | 6.41 | 8.68 | 2.36 | 1.8 | 1.12 | 1.4 |
| 3500 | 0.02 | 6 | 1 | 0.990383 | 1.239939 | 1.328297 | 1.226 | 1.402 | 1.745 | 19.22 | 11.56 | 23.88 | 0 | 0 | 0 |
| 1500 | 0.01 | 4 | 0 | 1.486014 | 1.643242 | 2.497839 | 1.45184 | 1.62345 | 2.27398 | 4.65 | 3.41 | 12.67 | 2.24 | 2.17 | 2.57 |
| 3500 | 0.01 | 6 | 1 | 1.209693 | 1.279833 | 1.529487 | 1.22147 | 1.39773 | 1.73778 | 0.68 | 8.26 | 11.79 | 0.28 | 0.2 | 0.22 |
| 1500 | 0.01 | 4 | 1 | 1.127849 | 1.31431 | 1.777092 | 1.13339 | 1.32767 | 1.62793 | 0.43 | 0.43 | 10.24 | 0.93 | 0.58 | 0.99 |
| 3500 | 0.02 | 6 | 2 | 1.363549 | 1.498434 | 2.009733 | 1.34172 | 1.48377 | 2.0527 | 1.61 | 0.97 | 2.11 | 0.02 | 0.02 | 0.01 |
| 5500 | 0.02 | 6 | 2 | 1.328551 | 1.388244 | 2.140685 | 1.35766 | 1.49629 | 2.07034 | 2.95 | 7.82 | 2.72 | 0.83 | 0.64 | 0.66 |
| 5500 | 0.03 | 8 | 2 | 1.490139 | 1.638373 | 2.305222 | 1.43205 | 1.5773 | 2.18138 | 3.41 | 3.17 | 5.07 | 0.62 | 0.67 | 0.58 |
| 5500 | 0.03 | 4 | 0 | 1.506602 | 1.762022 | 2.394908 | 1.47622 | 1.64163 | 2.30721 | 1.39 | 6.85 | 3.23 | 0.66 | 0.45 | 0.55 |
| 1500 | 0.01 | 8 | 0 | 1.660435 | 1.980778 | 2.678755 | 1.56443 | 1.75276 | 2.47348 | 6.92 | 14.89 | 10.1 | 0.74 | 1.67 | 1.66 |
| 3500 | 0.01 | 6 | 0 | 1.470755 | 1.69469 | 2.362745 | 1.52385 | 1.69013 | 2.37947 | 2.98 | 0.87 | 0.14 | 0.52 | 0.6 | 0.57 |
| 3500 | 0.03 | 6 | 1 | 1.17039 | 1.26903 | 1.51443 | 1.2299 | 1.40707 | 1.75407 | 5 | 9.87 | 13.85 | 0.17 | 0.07 | 0.22 |
| 1500 | 0.03 | 4 | 0 | 1.470053 | 1.636276 | 2.388436 | 1.44558 | 1.62352 | 2.26901 | 2.94 | 1.76 | 6.53 | 1.23 | 0.97 | 1.2 |
| 5500 | 0.03 | 4 | 2 | 1.299501 | 1.497535 | 2.085393 | 1.28589 | 1.42999 | 1.97819 | 0.19 | 4.21 | 4.85 | 0.86 | 0.49 | 0.54 |
| 3500 | 0.02 | 6 | 0 | 1.53751 | 1.716213 | 2.35087 | 1.521 | 1.69 | 2.378 | 1.09 | 1.55 | 1.14 | 0 | 0 | 0 |
| 5500 | 0.01 | 4 | 0 | 1.550188 | 1.641287 | 2.362509 | 1.47563 | 1.63718 | 2.30393 | 5.38 | 0.75 | 3.03 | 0.31 | 0.5 | 0.48 |
| 3500 | 0.02 | 6 | 0 | 1.53751 | 1.716213 | 2.35087 | 1.521 | 1.69 | 2.378 | 1.09 | 1.55 | 1.14 | 0 | 0 | 0 |
| 3500 | 0.02 | 8 | 1 | 1.122149 | 1.378606 | 1.602812 | 1.27283 | 1.44604 | 1.80487 | 12.33 | 5.19 | 11.93 | 0.56 | 0.55 | 0.83 |
| 5500 | 0.03 | 8 | 0 | 1.586365 | 1.761309 | 2.602341 | 1.58391 | 1.77032 | 2.49542 | 0.54 | 1.27 | 3.39 | 0.7 | 0.77 | 0.86 |
| 3500 | 0.03 | 6 | 2 | 1.336592 | 1.438408 | 2.003405 | 1.34641 | 1.49066 | 2.06407 | 0.85 | 3.66 | 3.12 | 0.12 | 0.16 | 0.19 |
| 1500 | 0.03 | 8 | 2 | 1.468507 | 1.708831 | 2.232491 | 1.39783 | 1.55035 | 2.15086 | 5.57 | 10.75 | 4.32 | 0.49 | 0.48 | 0.51 |
| 3500 | 0.02 | 6 | 0 | 1.53751 | 1.716213 | 2.35087 | 1.521 | 1.69 | 2.378 | 1.09 | 1.55 | 1.14 | 0 | 0 | 0 |
| 3500 | 0.02 | 6 | 2 | 1.363549 | 1.498434 | 2.009733 | 1.34172 | 1.48377 | 2.0527 | 1.61 | 0.97 | 2.11 | 0.02 | 0.02 | 0.01 |
| 1500 | 0.03 | 8 | 1 | 1.26572 | 1.448932 | 1.942375 | 1.27066 | 1.44708 | 1.80806 | 0.1 | 0.34 | 7.49 | 0.29 | 0.21 | 0.06 |
| 1500 | 0.01 | 8 | 1 | 1.300653 | 1.442074 | 2.009445 | 1.26474 | 1.4374 | 1.79518 | 3.14 | 0.77 | 12.51 | 0.3 | 0.45 | 0.51 |
| 5500 | 0.01 | 8 | 2 | 1.475928 | 1.613553 | 2.284549 | 1.42778 | 1.56828 | 2.17075 | 3.36 | 2.91 | 5.38 | 0.02 | 0.02 | 0.13 |
| 1500 | 0.02 | 6 | 0 | 1.469299 | 1.639699 | 2.438071 | 1.50356 | 1.67446 | 2.3521 | 1.85 | 1.76 | 4.06 | 0.44 | 0.33 | 0.39 |
| 3500 | 0.02 | 6 | 1 | 0.990383 | 1.239939 | 1.328297 | 1.226 | 1.402 | 1.745 | 19.22 | 11.56 | 23.88 | 0 | 0 | 0 |
| 1500 | 0.03 | 4 | 1 | 1.238851 | 1.350103 | 1.749304 | 1.14411 | 1.33714 | 1.64055 | 8.86 | 1.28 | 6.86 | 0.54 | 0.31 | 0.22 |
| 3500 | 0.02 | 6 | 0 | 1.53751 | 1.716213 | 2.35087 | 1.521 | 1.69 | 2.378 | 1.09 | 1.55 | 1.14 | 0 | 0 | 0 |
| 1500 | 0.03 | 4 | 2 | 1.423592 | 1.554698 | 2.309336 | 1.25528 | 1.40284 | 1.94098 | 15.74 | 11.69 | 20.34 | 2.06 | 0.78 | 1.15 |
| 1500 | 0.03 | 8 | 0 | 1.627112 | 1.749065 | 2.587803 | 1.55896 | 1.75057 | 2.46465 | 4.77 | 0.35 | 5.41 | 0.38 | 0.43 | 0.39 |
| 3500 | 0.02 | 8 | 0 | 1.629802 | 1.823364 | 2.413243 | 1.56664 | 1.7523 | 2.47004 | 3.61 | 3.95 | 2.46 | 0.4 | 0.1 | 0.16 |
| 3500 | 0.02 | 6 | 0 | 1.53751 | 1.716213 | 2.35087 | 1.521 | 1.69 | 2.378 | 1.09 | 1.55 | 1.14 | 0 | 0 | 0 |
| 3500 | 0.02 | 6 | 1 | 0.990383 | 1.239939 | 1.328297 | 1.226 | 1.402 | 1.745 | 19.22 | 11.56 | 23.88 | 0 | 0 | 0 |
| 3500 | 0.02 | 8 | 2 | 1.444109 | 1.531701 | 2.131912 | 1.40664 | 1.5507 | 2.15089 | 2.27 | 1.56 | 0.98 | 0.38 | 0.34 | 0.1 |
| 3500 | 0.03 | 6 | 0 | 1.572901 | 1.665941 | 2.315238 | 1.52149 | 1.69308 | 2.38152 | 3.21 | 1.95 | 3.17 | 0.16 | 0.35 | 0.4 |
| 5500 | 0.03 | 8 | 1 | 1.319746 | 1.502715 | 2.03471 | 1.2895 | 1.46505 | 1.83691 | 1.44 | 1.74 | 9.57 | 0.88 | 0.81 | 1.08 |
| 3500 | 0.02 | 6 | 2 | 1.363549 | 1.498434 | 2.009733 | 1.34172 | 1.48377 | 2.0527 | 1.61 | 0.97 | 2.11 | 0.02 | 0.02 | 0.01 |
| 3500 | 0.02 | 4 | 0 | 1.395865 | 1.6597 | 2.264282 | 1.45666 | 1.62613 | 2.27745 | 3.87 | 2.51 | 0.12 | 0.32 | 0.44 | 0.46 |
| 5500 | 0.01 | 4 | 1 | 1.228172 | 1.294105 | 1.741528 | 1.16271 | 1.35276 | 1.67171 | 5.24 | 4.35 | 3.91 | 0.37 | 0.02 | 0.26 |
| 3500 | 0.02 | 6 | 1 | 0.990383 | 1.239939 | 1.328297 | 1.226 | 1.402 | 1.745 | 19.22 | 11.56 | 23.88 | 0 | 0 | 0 |
| 1500 | 0.02 | 6 | 1 | 1.005 | 1.062691 | 1.638218 | 1.22567 | 1.40241 | 1.74332 | 16.67 | 23.27 | 4.59 | 1.63 | 1.26 | 1.53 |
| 3500 | 0.01 | 6 | 2 | 1.371796 | 1.362519 | 1.885923 | 1.33754 | 1.47839 | 2.0446 | 2.83 | 7.56 | 7.6 | 0.27 | 0.3 | 0.18 |
| 3500 | 0.02 | 6 | 0 | 1.53751 | 1.716213 | 2.35087 | 1.521 | 1.69 | 2.378 | 1.09 | 1.55 | 1.14 | 0 | 0 | 0 |
| 5500 | 0.02 | 6 | 1 | 0.994668 | 1.141733 | 1.600672 | 1.22443 | 1.40565 | 1.74993 | 20.11 | 19.48 | 9.77 | 1.65 | 0.87 | 1.36 |
| 3500 | 0.02 | 6 | 2 | 1.363549 | 1.498434 | 2.009733 | 1.34172 | 1.48377 | 2.0527 | 1.61 | 0.97 | 2.11 | 0.02 | 0.02 | 0.01 |
| 3500 | 0.02 | 6 | 2 | 1.363549 | 1.498434 | 2.009733 | 1.34172 | 1.48377 | 2.0527 | 1.61 | 0.97 | 2.11 | 0.02 | 0.02 | 0.01 |
| 5500 | 0.03 | 4 | 1 | 1.243497 | 1.358665 | 1.831364 | 1.17602 | 1.36168 | 1.68777 | 4.67 | 0.54 | 7.54 | 1.01 | 0.32 | 0.89 |
| 5500 | 0.01 | 4 | 2 | 1.362128 | 1.524907 | 2.033442 | 1.26568 | 1.41161 | 1.95207 | 6.83 | 7.54 | 3.75 | 0.73 | 0.45 | 0.4 |
| 3500 | 0.02 | 4 | 2 | 1.130603 | 1.433997 | 2.015887 | 1.25715 | 1.40698 | 1.94287 | 9.98 | 2.06 | 3.97 | 0.09 | 0.14 | 0.2 |
| 1500 | 0.01 | 8 | 2 | 1.509835 | 1.539907 | 2.257786 | 1.40215 | 1.54727 | 2.14824 | 9.01 | 1.04 | 6.75 | 1.24 | 1.53 | 1.57 |
| 3500 | 0.02 | 6 | 1 | 0.990383 | 1.239939 | 1.328297 | 1.226 | 1.402 | 1.745 | 19.22 | 11.56 | 23.88 | 0 | 0 | 0 |
| 3500 | 0.02 | 6 | 1 | 0.990383 | 1.239939 | 1.328297 | 1.226 | 1.402 | 1.745 | 19.22 | 11.56 | 23.88 | 0 | 0 | 0 |
| 3500 | 0.02 | 6 | 2 | 1.363549 | 1.498434 | 2.009733 | 1.34172 | 1.48377 | 2.0527 | 1.61 | 0.97 | 2.11 | 0.02 | 0.02 | 0.01 |
| 1500 | 0.02 | 6 | 2 | 1.306254 | 1.408035 | 1.996562 | 1.32548 | 1.46827 | 2.0353 | 0.59 | 3.63 | 1.31 | 0.87 | 0.5 | 0.61 |
| 3500 | 0.02 | 4 | 1 | 1.034241 | 1.328674 | 1.478657 | 1.14936 | 1.34206 | 1.65323 | 10.46 | 1.07 | 10.71 | 0.49 | 0.07 | 0.17 |
Disclaimer/Publisher’s Note: The statements, opinions and data contained in all publications are solely those of the individual author(s) and contributor(s) and not of MDPI and/or the editor(s). MDPI and/or the editor(s) disclaim responsibility for any injury to people or property resulting from any ideas, methods, instructions or products referred to in the content. |
© 2024 by the authors. Licensee MDPI, Basel, Switzerland. This article is an open access article distributed under the terms and conditions of the Creative Commons Attribution (CC BY) license (https://creativecommons.org/licenses/by/4.0/).
Share and Cite
Nargis, T.; Shahabaz, S.M.; Acharya, S.; Shetty, N.; Malghan, R.L.; Shetty, S.D. A Comprehensive Study on the Optimization of Drilling Performance in Hybrid Nano-Composites and Neat CFRP Composites Using Statistical and Machine Learning Approaches. J. Manuf. Mater. Process. 2024, 8, 67. https://doi.org/10.3390/jmmp8020067
Nargis T, Shahabaz SM, Acharya S, Shetty N, Malghan RL, Shetty SD. A Comprehensive Study on the Optimization of Drilling Performance in Hybrid Nano-Composites and Neat CFRP Composites Using Statistical and Machine Learning Approaches. Journal of Manufacturing and Materials Processing. 2024; 8(2):67. https://doi.org/10.3390/jmmp8020067
Chicago/Turabian StyleNargis, Tanzila, S. M. Shahabaz, Subash Acharya, Nagaraja Shetty, Rashmi Laxmikant Malghan, and S. Divakara Shetty. 2024. "A Comprehensive Study on the Optimization of Drilling Performance in Hybrid Nano-Composites and Neat CFRP Composites Using Statistical and Machine Learning Approaches" Journal of Manufacturing and Materials Processing 8, no. 2: 67. https://doi.org/10.3390/jmmp8020067
APA StyleNargis, T., Shahabaz, S. M., Acharya, S., Shetty, N., Malghan, R. L., & Shetty, S. D. (2024). A Comprehensive Study on the Optimization of Drilling Performance in Hybrid Nano-Composites and Neat CFRP Composites Using Statistical and Machine Learning Approaches. Journal of Manufacturing and Materials Processing, 8(2), 67. https://doi.org/10.3390/jmmp8020067