Article

Effect of Liquid Miscibility Gap on Defects in Inconel 625–GRCop42 Joints through Analysis of Gradient Composition Microstructure

1
School of Mechanical, Industrial, and Manufacturing Engineering, Oregon State University, Corvallis, OR 97330, USA
2
Advanced Technology and Manufacturing Institute (ATAMI), Corvallis, OR 97330, USA
3
Electron Microscopy Facility, Oregon State University, Corvallis, OR 97330, USA
*
Author to whom correspondence should be addressed.
J. Manuf. Mater. Process. 2024, 8(1), 42; https://doi.org/10.3390/jmmp8010042
Submission received: 28 January 2024 / Revised: 8 February 2024 / Accepted: 12 February 2024 / Published: 14 February 2024
(This article belongs to the Special Issue Joining of Unweldable Materials: Concepts, Techniques and Processes)

Abstract

:
Joining of Cu-based dispersion-strengthened alloys to Ni-based superalloys has garnered increased attention for liquid rocket engine applications due to the high thermal conductivity of Cu-based alloys and high temperature tensile strength of Ni-based superalloys. However, such joints can suffer from cracking when joined via liquid state processes, leading to part failure. In this work, compositions of 15–95 wt.% GRCop42 are alloyed with Inconel 625 and characterized to better understand the root cause of cracking. Results indicate a lack of miscibility between Cu-deprived and Cu-rich liquids in compositions corresponding to 30–95 wt.% GRCop42. Two distinct morphologies are observed and explained by use of CALPHAD; Cu-deprived dendrites with Cu-rich interdendritic zones at 30–50 wt.% GRCop42 and Cu-deprived spheres surrounded by a Cu-rich matrix at 60–95 wt.% GRCop42. Phase analysis reveals brittle intermetallic phases precipitate in the 60–95 wt.% GRCop42 Cu-deprived region. Three cracking mechanisms are proposed herein that provide guidance on the avoidance of defects Ni-based superalloy to Cu-based dispersion strengthened alloy joints.

1. Introduction

Fabrication by use of multi-materials is necessary where spatially dependent differing properties are required for a given component application. Two alloys that provide such multi-property functionality are GRCop42 and Inconel 625. GRCop42 is a high temperature Cu-Cr-Nb alloy known for its high thermal conductivity and creep resistance due to the formation of Cr2Nb precipitates [1]. Inconel 625 is a Ni-based superalloy known for its high tensile strength at elevated temperatures coupled with excellent fatigue and oxidation resistance [2,3]. The joining of GRCop and Ni-based superalloys has garnered increased attention in recent years due to the high thermal conductivity of GRCop42 for thermal management and the superior mechanical properties of Inconel 625 for high temperature applications [4,5,6,7,8,9,10,11]. One notable example lies in work performed at the NASA Marshall Space Flight Center, where researchers have fabricated a rocket exhaust chamber consisting of an outer Inconel 625 housing joined into a GRCop84 interlayer [12,13]. The same research center has also reported on an assembly consisting of a nozzle made from NASA-HR-1 (Ni-Fe-Cr) joined to a GRCop42 exhaust chamber [5]. In both cases, the multi-property functionality allows for GRCop to provide an efficient medium for required thermal dissipation, while the Ni-based superalloy provides required high temperature strength and ductility.
A number of researchers have reported cracking when joining GRCop with Inconel, compromising the integrity of the joint to withstand load. Gradl et al. [14] reported cracking when depositing Inconel 625 onto GRCop42 using wire electron beam welding. The researchers [14] attributed cracking to residual stress. Hales et al. [6] conducted an in-depth investigation of cracking observed when longitudinally joining Inconel 625 onto a GRCop84 cylinder using electron beam welding. The researchers attributed cracking to process-induced mixing of the GRCop84 and Inconel, resulting in a lesser yield strength Cu-Ni30 phase susceptible to hot cracking. This explanation, however, does not explain why cracking does not occur in phases with even more Cu (resulting in lesser yield strength). Despite research reporting cracking in Inconel 625–GRCop42 joints, other researchers have reported the fabrication of defect free GRCop–Inconel joints [4,5,7]. Hence, there is no consensus among researchers as to under what conditions and for what reasons cracking occurs in GRCop–Inconel joints.
When joining dissimilar metals using liquid state processes, remelting combined with Marangoni mixing of the two parent materials results in the formation of new alloys [15]. Mixing-resultant alloys have been known to crack due to the precipitation of brittle intermetallic phases [16,17,18]. In addition, mixing-resultant alloys can have a higher liquidus–solidus temperature range, which is known to increase susceptibility of solidification cracking [19,20]. The composition of the mixing-resultant alloy depends on the extent of remelting, which is a function of the joining process parameters along with thermal and physical properties [21]. When investigating joining of two parent alloys, researchers have accounted for all potential remelting/mixing conditions by fabricating and characterizing individual gradient alloys (alloys that are mixtures of the parent alloys). By doing this, it is possible to determine at what composition and for what reason failure can occur. Jasthi et al. [22] fabricated via cold spray and characterized a number of GRCop42–HR1 (Fe-Ni-Cr alloy) gradient compositions in terms of microstructure and present phases. The results suggest that increasing HR-1 content leads to a reduction in the σ (Fe-Cr) brittle intermetallic phase. Kim et al. [23] printed a compositionally graded material (CGA, a material which introduces gradual compositional changes from one alloy to another [24,25,26]) from Inconel 718 to SS 316L. The researchers [23] found that from 20 wt.% to 30 wt.% Inconel 718 defects exist due to carbides and intermetallic phases; excluding these compositions from the CGA showed a lack of defects. These studies [22,23] highlight the importance of studying individual gradient alloys when joining dissimilar metals.
To the authors’ knowledge, failure mechanisms that occur when a liquid miscibility gap exists within the dissimilar metal joint material system have not been documented. From a thermodynamic standpoint, miscibility is governed by the Gibbs free energy equation [27]. A liquid miscibility gap occurs when the Gibbs free energy of mixing ( Δ G m i x i n g ) is positive because of a highly endothermic enthalpy of mixing ( Δ H m i x i n g ), which overrides the entropy of mixing term ( T Δ S m i x i n g ) [27]. Despite Cu and Ni (the main constituent elements of GRCop42 and Inconel 625, respectively) being able to form a solid solution, lack of miscibility has been reported in supercooled Cu-Cr [28] and Cu-Nb [29] liquids (Cr and Nb are constituent elements of Inconel 625). While evidence of a liquid miscibility gap in the form of distinct Cu-rich and Cu-deprived structures is observed, no failures are reported in these alloys.
The objective of this work is to evaluate and identify at what compositions and due to what mechanisms failure occurs in Inconel 625–GRCop42 joints when processed via liquid state joining methods. To do this, a method was chosen which utilizes arc melting to simulate the dissimilar metal mixing that occurs in liquid joining of Inconel 625–GRCop42 joints. The use of arc melting represents a novel method of quickly isolating individual gradient compositions for characterization without the inhomogeneity and reheating that occurs in other processes, such as laser-based metal additive manufacturing. The solidification path of each gradient composition is deduced through investigation of morphology. Next, the underlying crystal structure and composition is investigated to determine the presence of brittle crack-causing phases. Lastly, the mechanical properties of the present phases are investigated by use of microhardness. This work demonstrates the feasibility of using the arc melting process to create specific gradient compositions, and allows for the identification of failure within Inconel 625–GRCop42 joints due to a liquid miscibility gap.

2. Materials and Methods

2.1. Materials and Arc Melting Process

Inconel 625 wire was provided by Arcos Industries. Powder GRCop42 feedstock was provided by the Powder Alloy Corporation. The chemical composition of each material as provided by the manufacturer, and is shown in Table 1.
Arc melting was used to fabricate mixed Inconel 625–GRCop42 compositions [30]. The use of arc melting presents the following advantages: (1) arc melting allows for a long (>3s) dwell time within the liquid state, minimizing lack of mixing between the constituent metals (macrosegregation); (2) arc melting has a lower cost and is faster than using additive methods. Desired amounts of each alloy were weighed, and then arc melted together in an Edmund-Buhler AM200 arc melter using 300 A. The total weight of each sample ranged from 10 g to 20 g, and upon melting created a ”button” shape. Based on the size of the melt pool, the arc melted sample cooling rate is higher than cast-iron mold casting [31], but lower than wire arc additive manufacturing [32]. When melting dissimilar compositions together, it is imperative that the constituents undergo sufficient mixing to eliminate macrosegregation due to lack of mixing. Therefore, each sample was flipped and remelted 7 times. The GRCop42 powder was consolidated for arc melting by pressing into pellets and then sintering for 4 h at 800 C in a vacuum furnace. To gain an overview of the phase diagram, compositions corresponding to 15, 30, 50, 60, 70, 75, 85, 90, and 95 wt.% GRCop42 were investigated. Specific compositions were chosen based off of the results from each subsequent composition result in order to fully characterize the Inconel 625–GRCop42 system in terms of microstructural morphology and present phases.

2.2. Microstructural Characterization

After arc melting, the samples were cut using wire electric discharge machining (EDM), mounted, and ground using SiC papers from 180 to 1200 grit. Afterwards, the samples were polished using 1 μ m and then 0.05 μ m alumina slurry, followed by a 0.05 μ m silica slurry and a 12-h vibratory polish using a 0.02 μ m silica slurry. The samples were chemically etched with Ferric Chloride for 2 s to reveal the microstructure.
An FEI Quanta 3D dual beam scanning electron microscope (SEM) equipped with energy dispersive X-ray spectroscopy (EDS) and electron backscatter diffraction (EBSD) detectors was used to measure elemental composition and determine phase volume fraction. For compositional measurements, a minimum of five scans were collected from different regions to capture spatial variation. Both point and window wide spectra were collected for a minimum of 3 min. A voltage of 15 kV and a working distance of 10 mm was used. EBSD images were extracted from unetched samples and cleaned using the neighbor CI correlation in AMETEK OIM software (version 8.0) with minimum confidence index of 0.1 (this is a dimensionless parameter in the software (version 8.0)). A minimum of three phase maps were collected at different magnifications when determining phase volume fraction.
To provide a 3D view for volume analysis of the arc melted samples, computer tomographic (CT) imaging was performed using a Zeiss Xradia Context MicroCT. An effective voxel size of 9.5 μ m and a voltage of 160 kV was used. Three dimensional visualization and quantification of volume was performed using Dragonfly software (version 2022.2).
In order to gain insight into crystal structure, XRD was performed using a Rigaku Smartlab XRD with a Cu source on unmounted samples. An aperture width of 2 mm was used to select the exposure region. A generator voltage of 40 kV and current of 44 mA was used. The 2 θ from 20° to 80° was measured with an increment of 0.02° with a step time of 4 s.
An FEI Titan 80-200 TEM/STEM with an accelerating voltage of 200 keV was used to extract selected area diffraction (SAD) patterns to provide additional insights into the crystal structure. The TEM is equipped with four Bruker SDD detectors, allowing for additional measurement of elemental composition and generation of elemental distribution maps. The TEM sample was etched to a thickness of <120 nm by use of a focused ion beam installed onto a Helios 650 Ultra Resolution Dual Beam FEG SEM.
To gauge mechanical properties, Vickers microhardness values were measured using a Leco LM-248AT machine with a load of 500 gf and a 15 s dwell time. A minimum of 10 indents were collected to obtain the average and uncertainty range of hardness for each region of interest.

2.3. Computation

The Calculation of Phase Diagrams (CALPHAD) approach was used to conduct a computational study of equilibrium phases in order to aid in analysis of the solidification path at each composition of interest [27,33,34]. Thermo-Calc (version 2022a) was used in conjunction with python coding via the TC-python API. The TCCU4 database [35], which is assessed for the Cu-Ni-Cr system, was used as simulation input. Only non-impurity elements (Cu, Ni, Cr, Mo, Nb) were considered within the simulation to limit computational cost.

3. Results

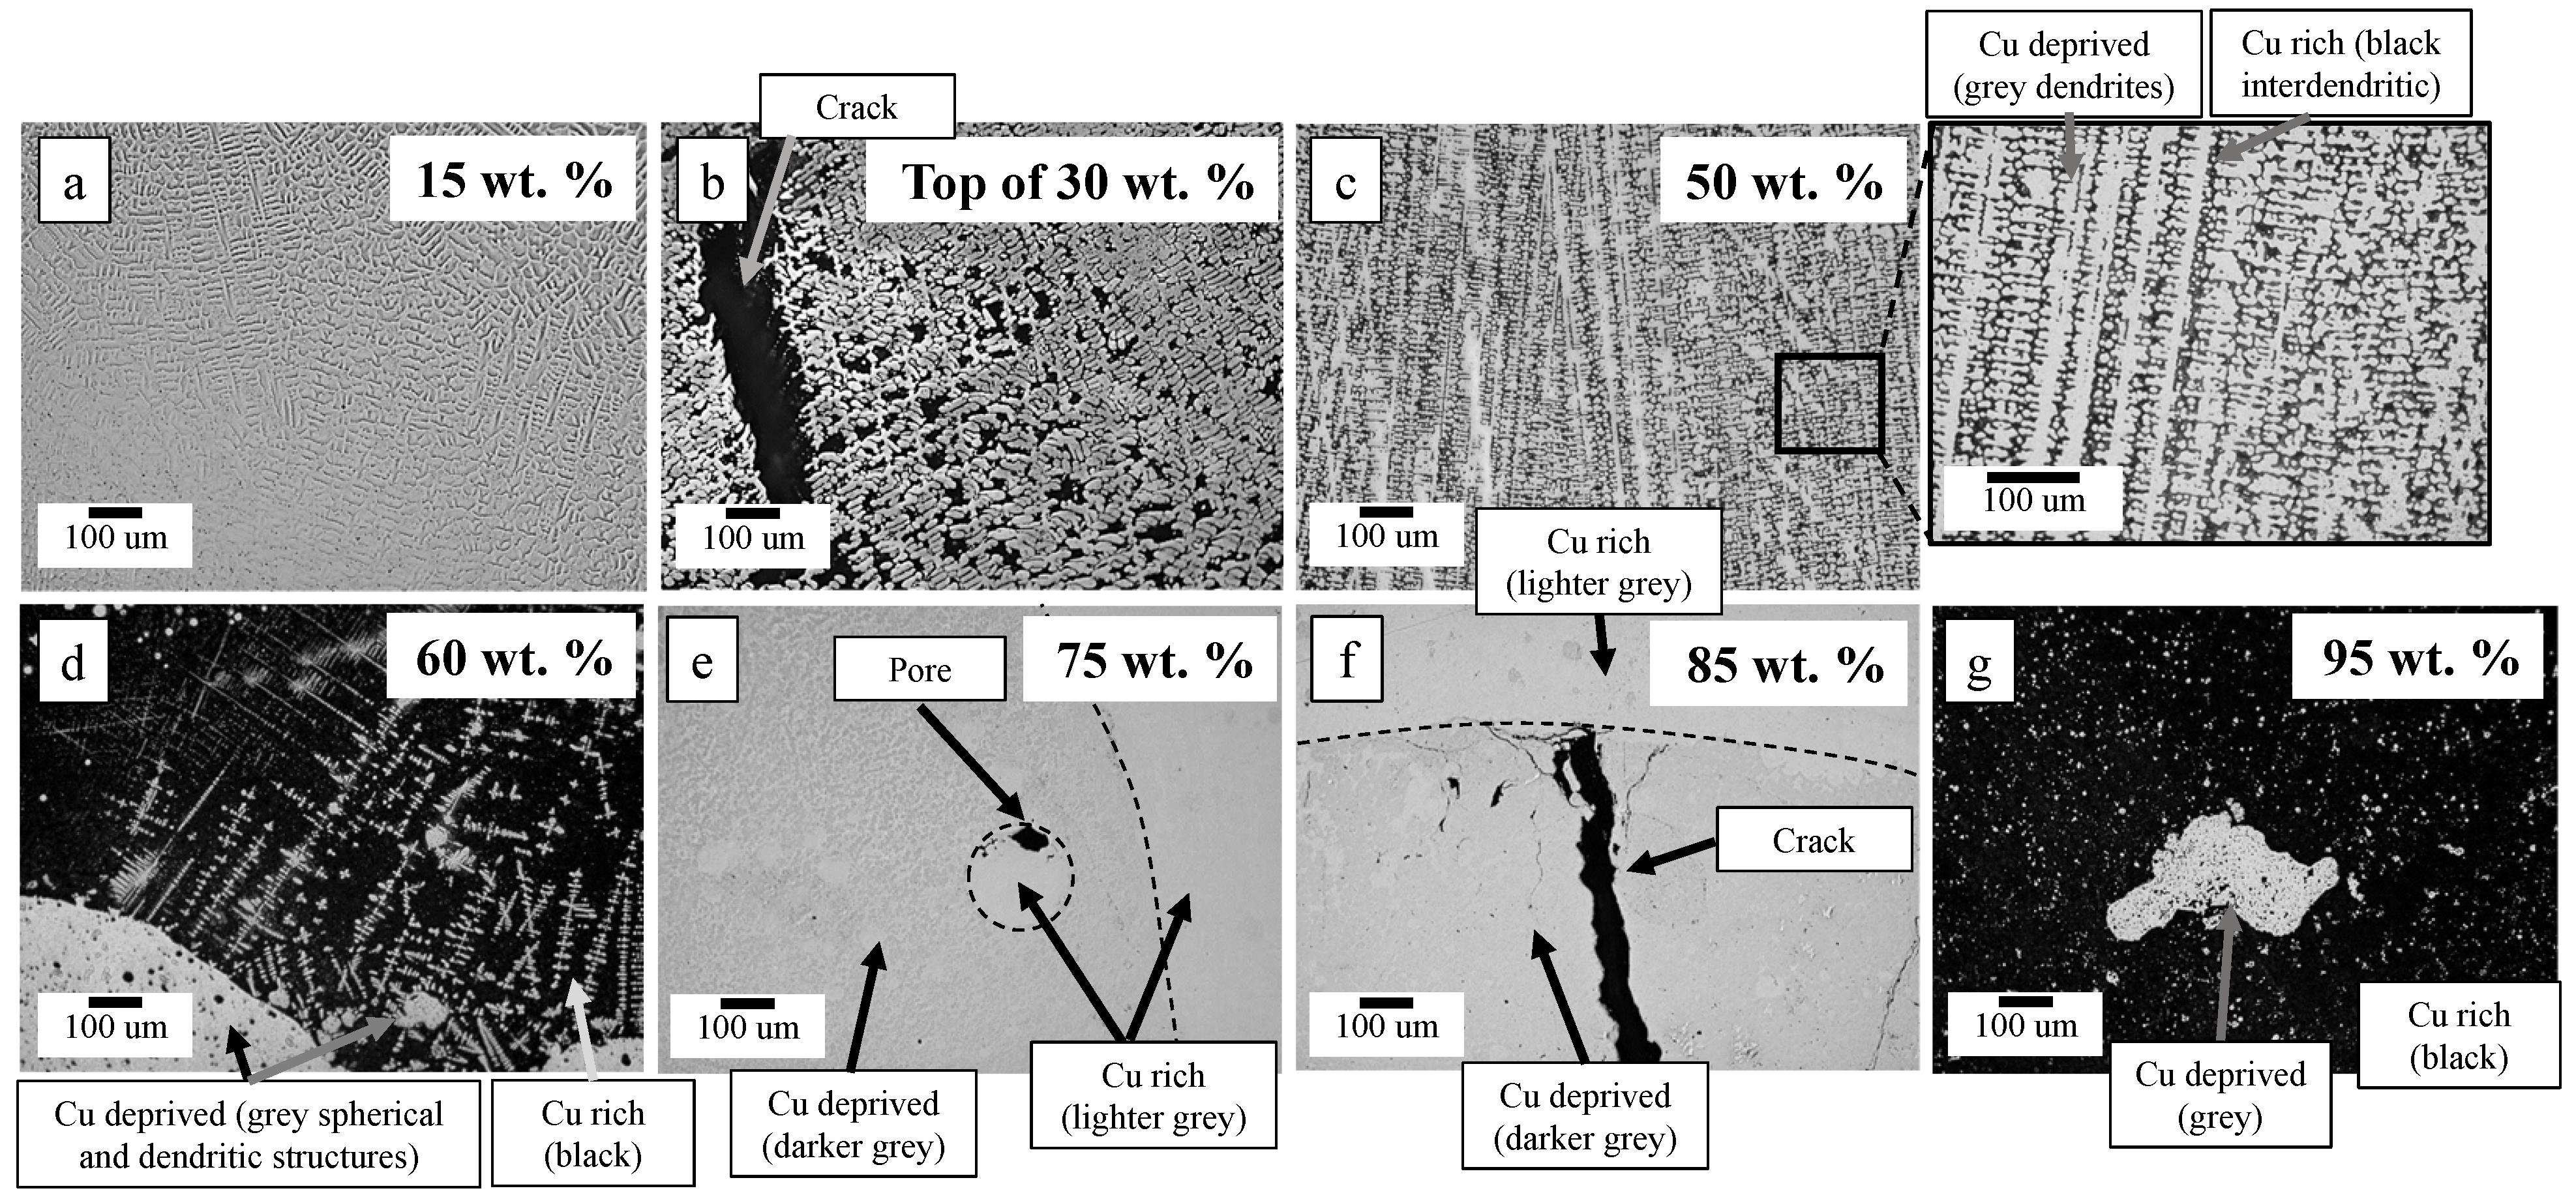
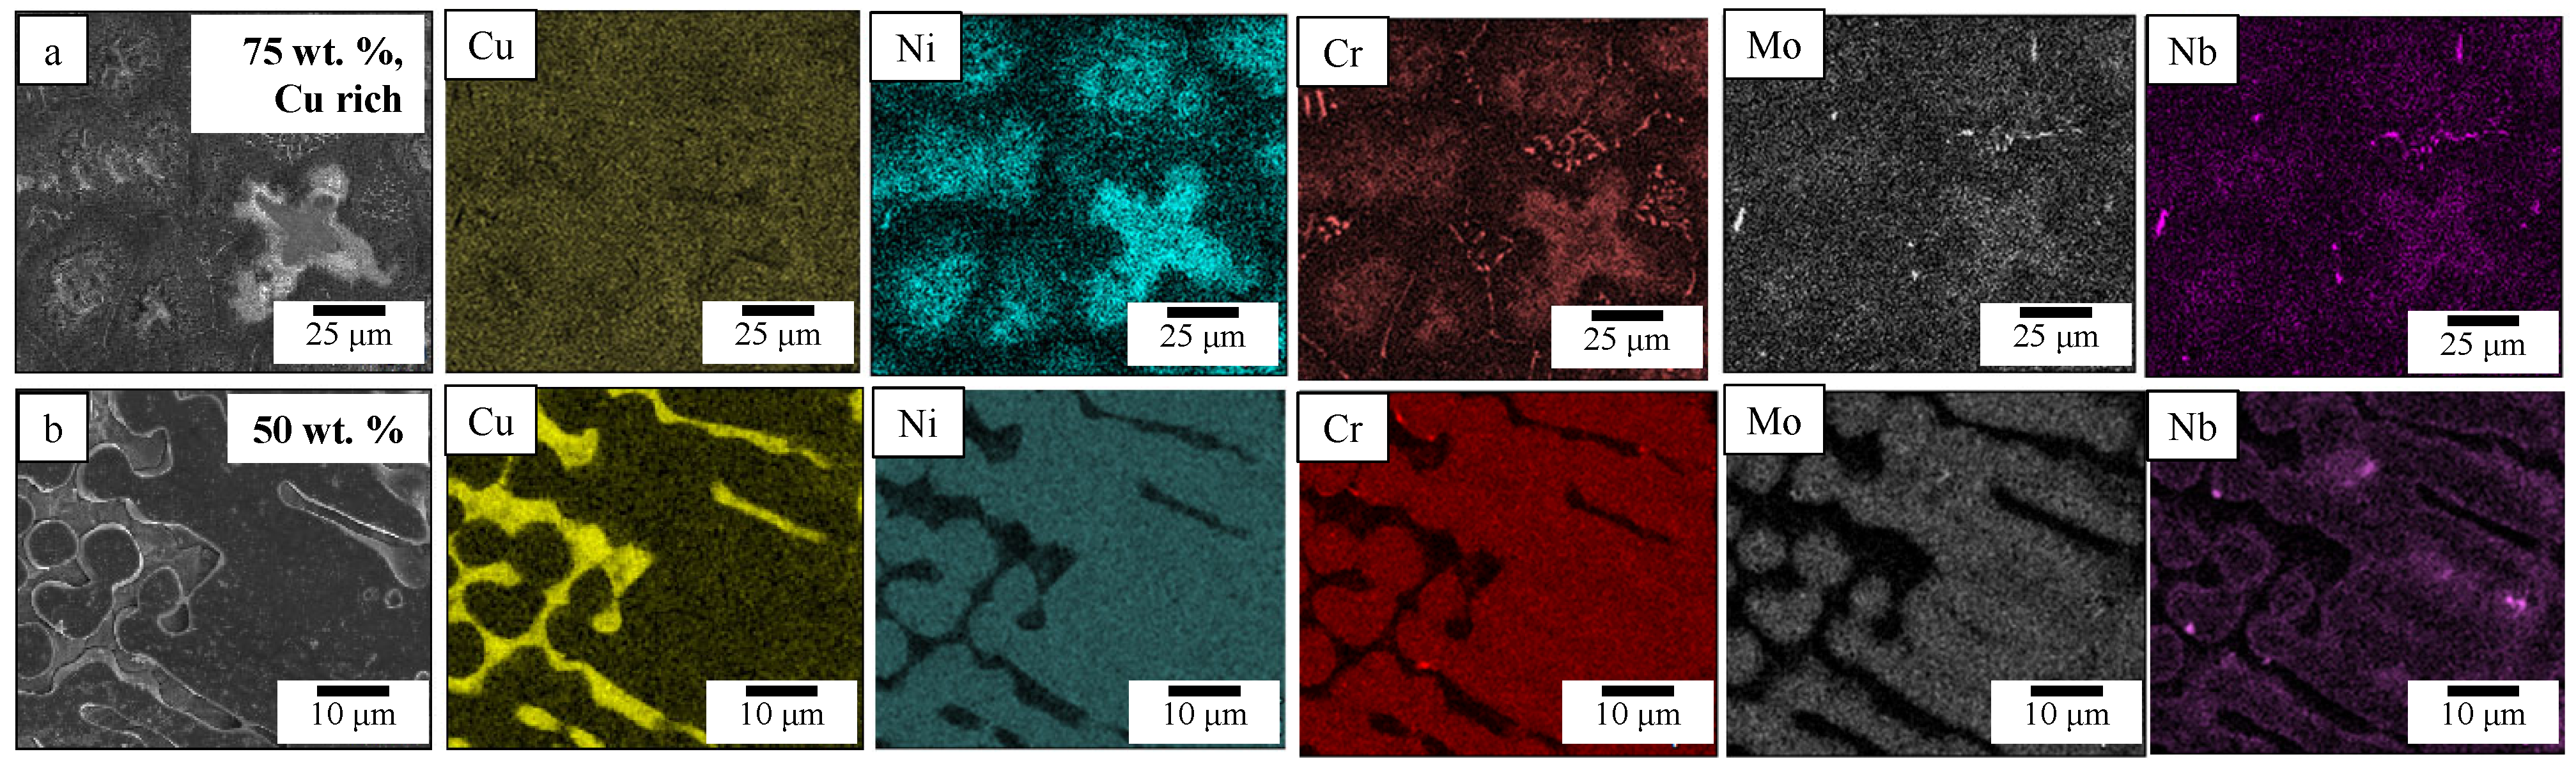
3.1. Microstructure Morphology and Composition
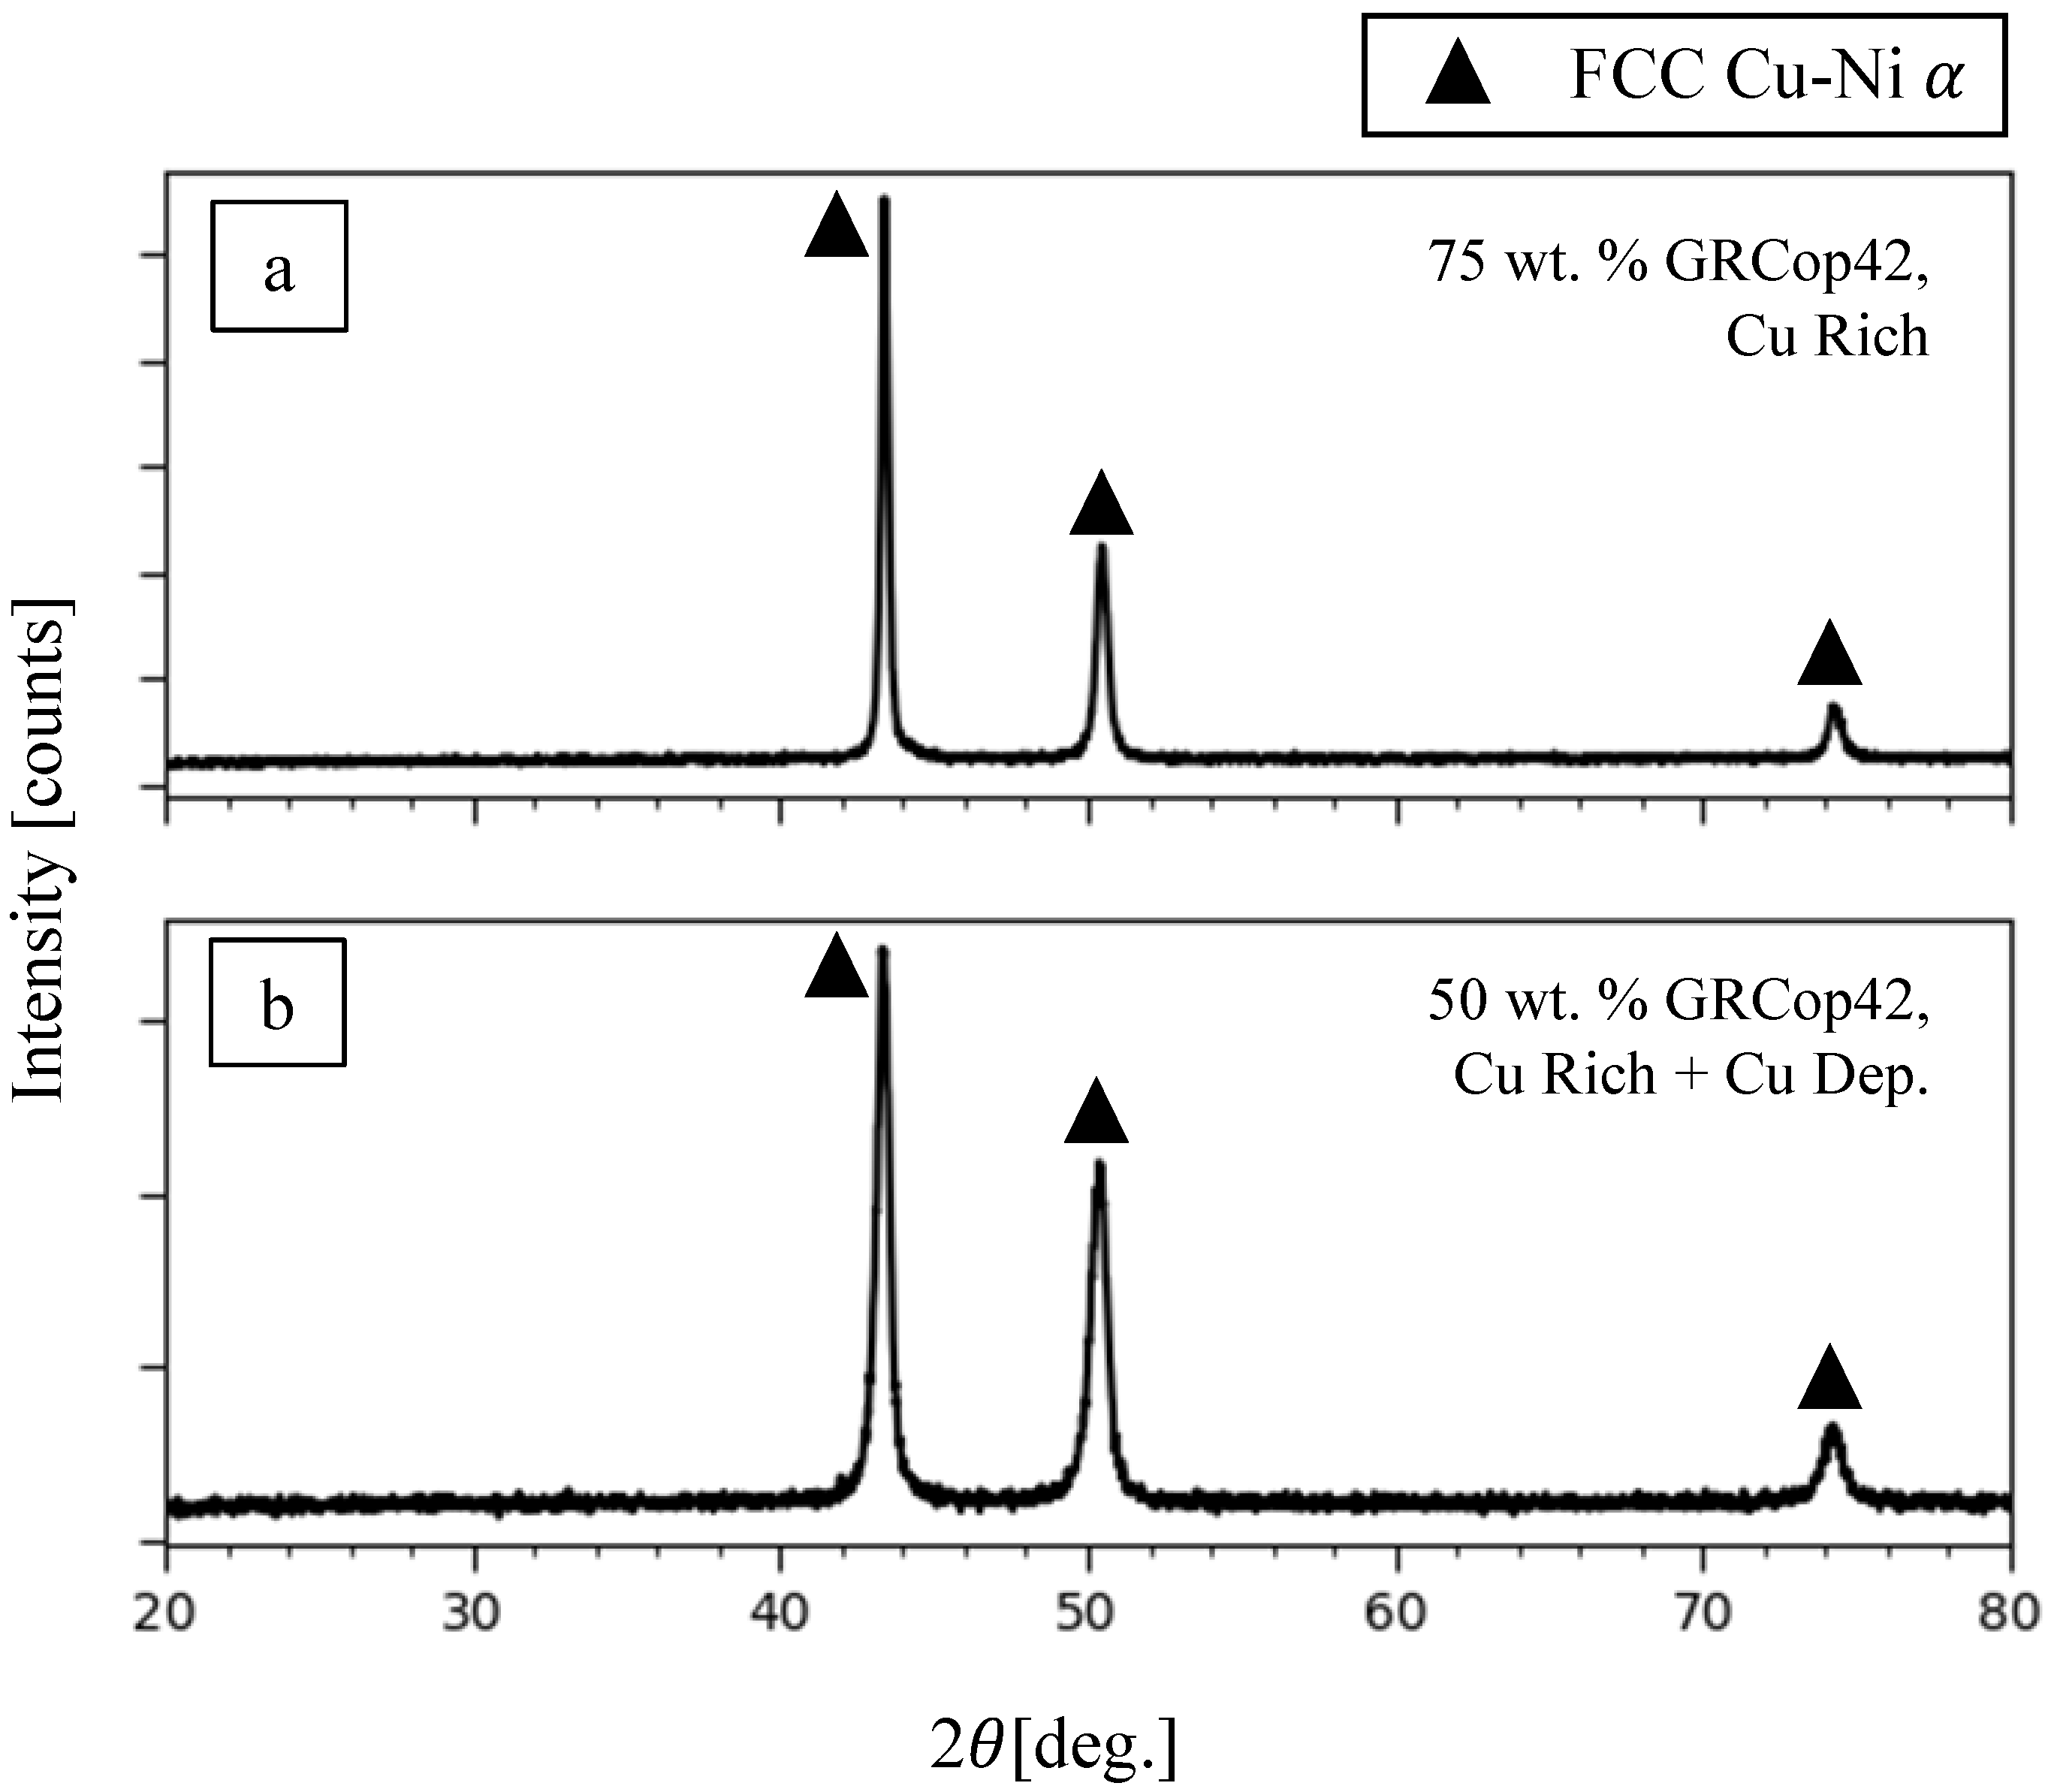
The 15 wt.% GRCop42 sample consists of a solid solution with a dendritic microstructure, as shown in Figure 1a. In the 30 and 50 wt.% GRCop42 samples, Cu-deprived dendrites were observed with Cu-rich interdendritic regions as shown in Figure 1b,c. Cracking of the type shown in Figure 1b was observed towards the top of the 30 and 50 wt.% GRCop42 samples.
At 60 wt.% GRCop42, Cu-deprived regions embody both a spherical and dendritic morphology, as shown in Figure 1d. The 70–95 wt.% samples show no Cu-deprived dendrites; only spherical Cu-deprived regions were observed towards the bottom of the samples. Within spherical Cu-deprived regions, porosity was found at the top of Cu-rich bubbles trapped within Cu-deprived regions, as shown in Figure 1e. Cracking, as shown in Figure 1f, was observed within the Cu-deprived regions of the 70–95 wt.% GRCop42 samples. Within the Cu-rich region of the 60–95 wt.% GRCop42 samples, Cu-deprived precipitates are observed. A summary of the morphologies, defects observed, and Cu-deprived volume fraction as a function of composition is shown in Table 2. The Cu-deprived region volume fraction was calculated based off EDS measurements and was further validated using CT scanning as specified in Appendix A.

3.2. Phase Analysis

3.2.1. Cu-Rich Regions

For all arc melted compositions, the Cu-rich region was found to consist of an FCC crystal structure. In the 60–95 wt.% GRCop42 samples, the Cu-rich region was found to contain Cr-Ni islands along with Nb-Mo precipitates. A representative EDS map of the 75 wt.% GRCop42 Cu-rich region is provided in Figure 2a. The Cr-Ni islands and Nb-Mo precipitates did not contain a sufficient volume fraction to be detectable by XRD in any of the samples; the XRD spectrum of the 75 wt.% GRCop42 sample Cu-rich region with only FCC peaks is shown in Figure 3a.

3.2.2. 15–50 wt.% GRCop42 Cu-Deprived Regions

In 15–50 wt.% GRCop42 compositions the Cu-deprived region was found to consist of a Ni-rich solid solution with an FCC crystal structure. A representative EDS map of the 50 wt.% GRCop42 sample is provided in Figure 2b, and shows that Cr, Mo, and Nb are dissolved within the Ni solid solution. The corresponding XRD spectrum is shown in Figure 3b. The Cu-deprived regions of the 60–95 wt.% GRCop42 samples did not occupy enough area to investigate via XRD, and therefore were investigated using electron microscopy as shown in the following section.

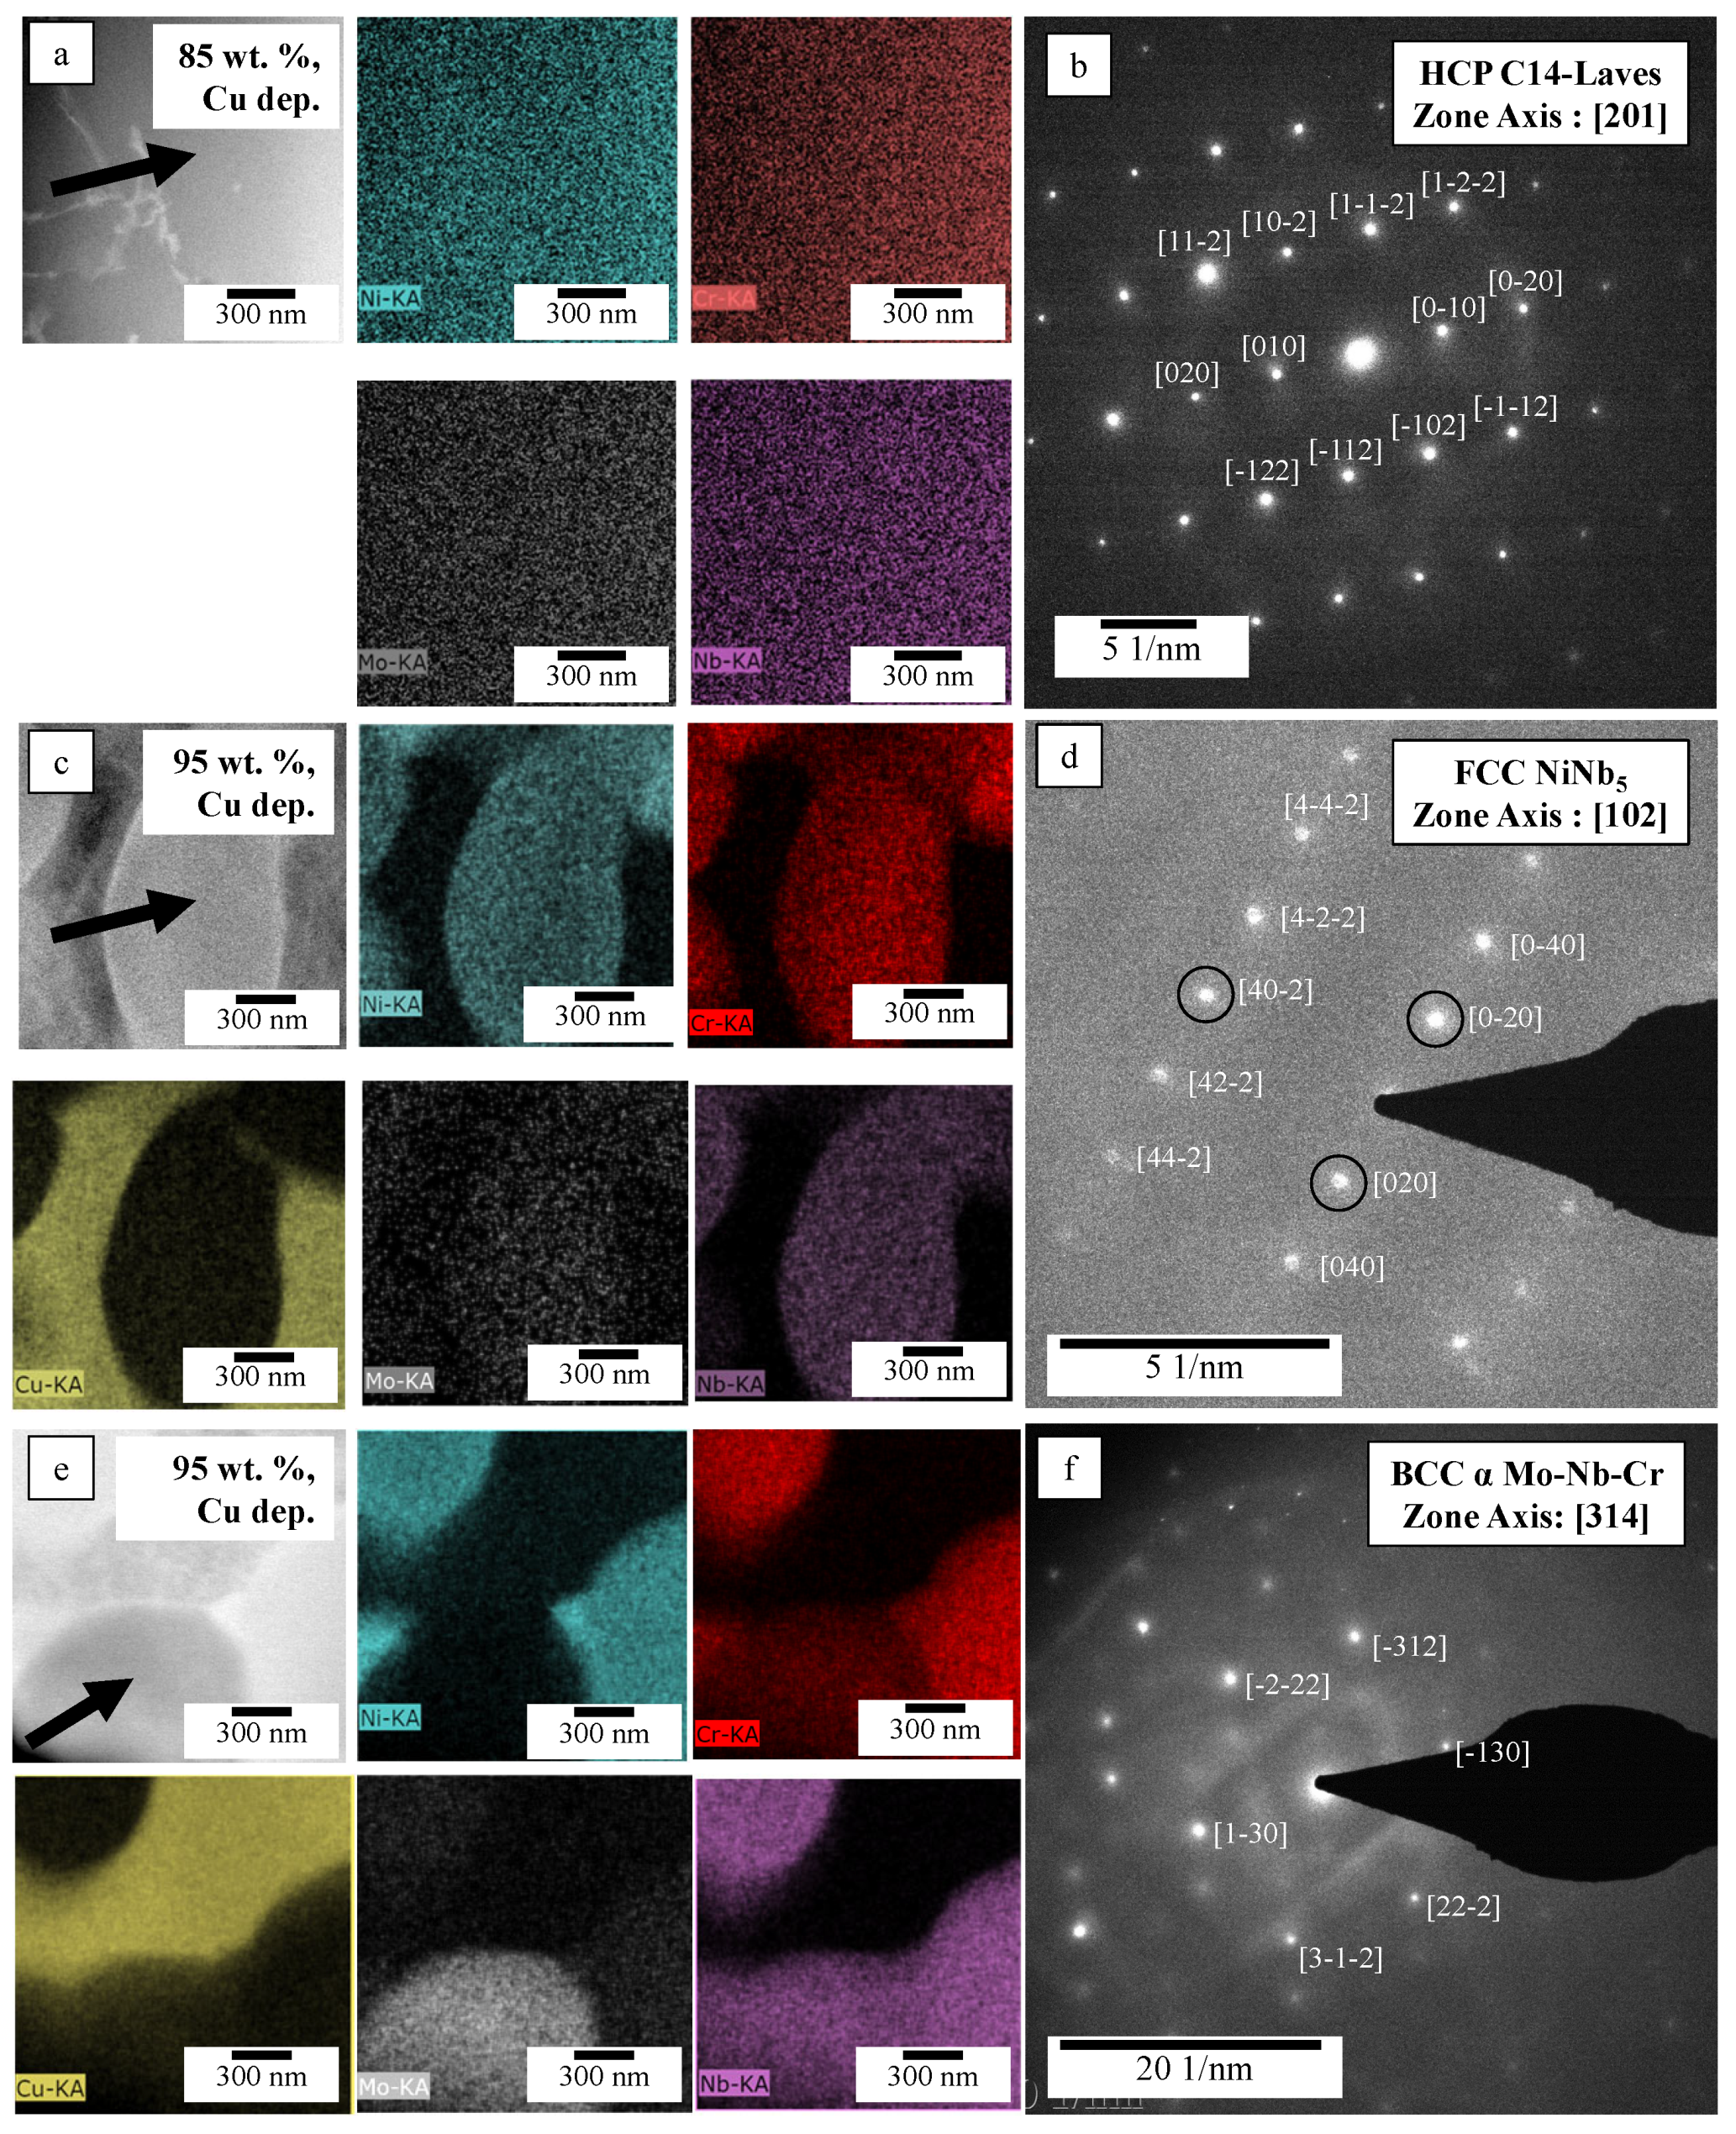
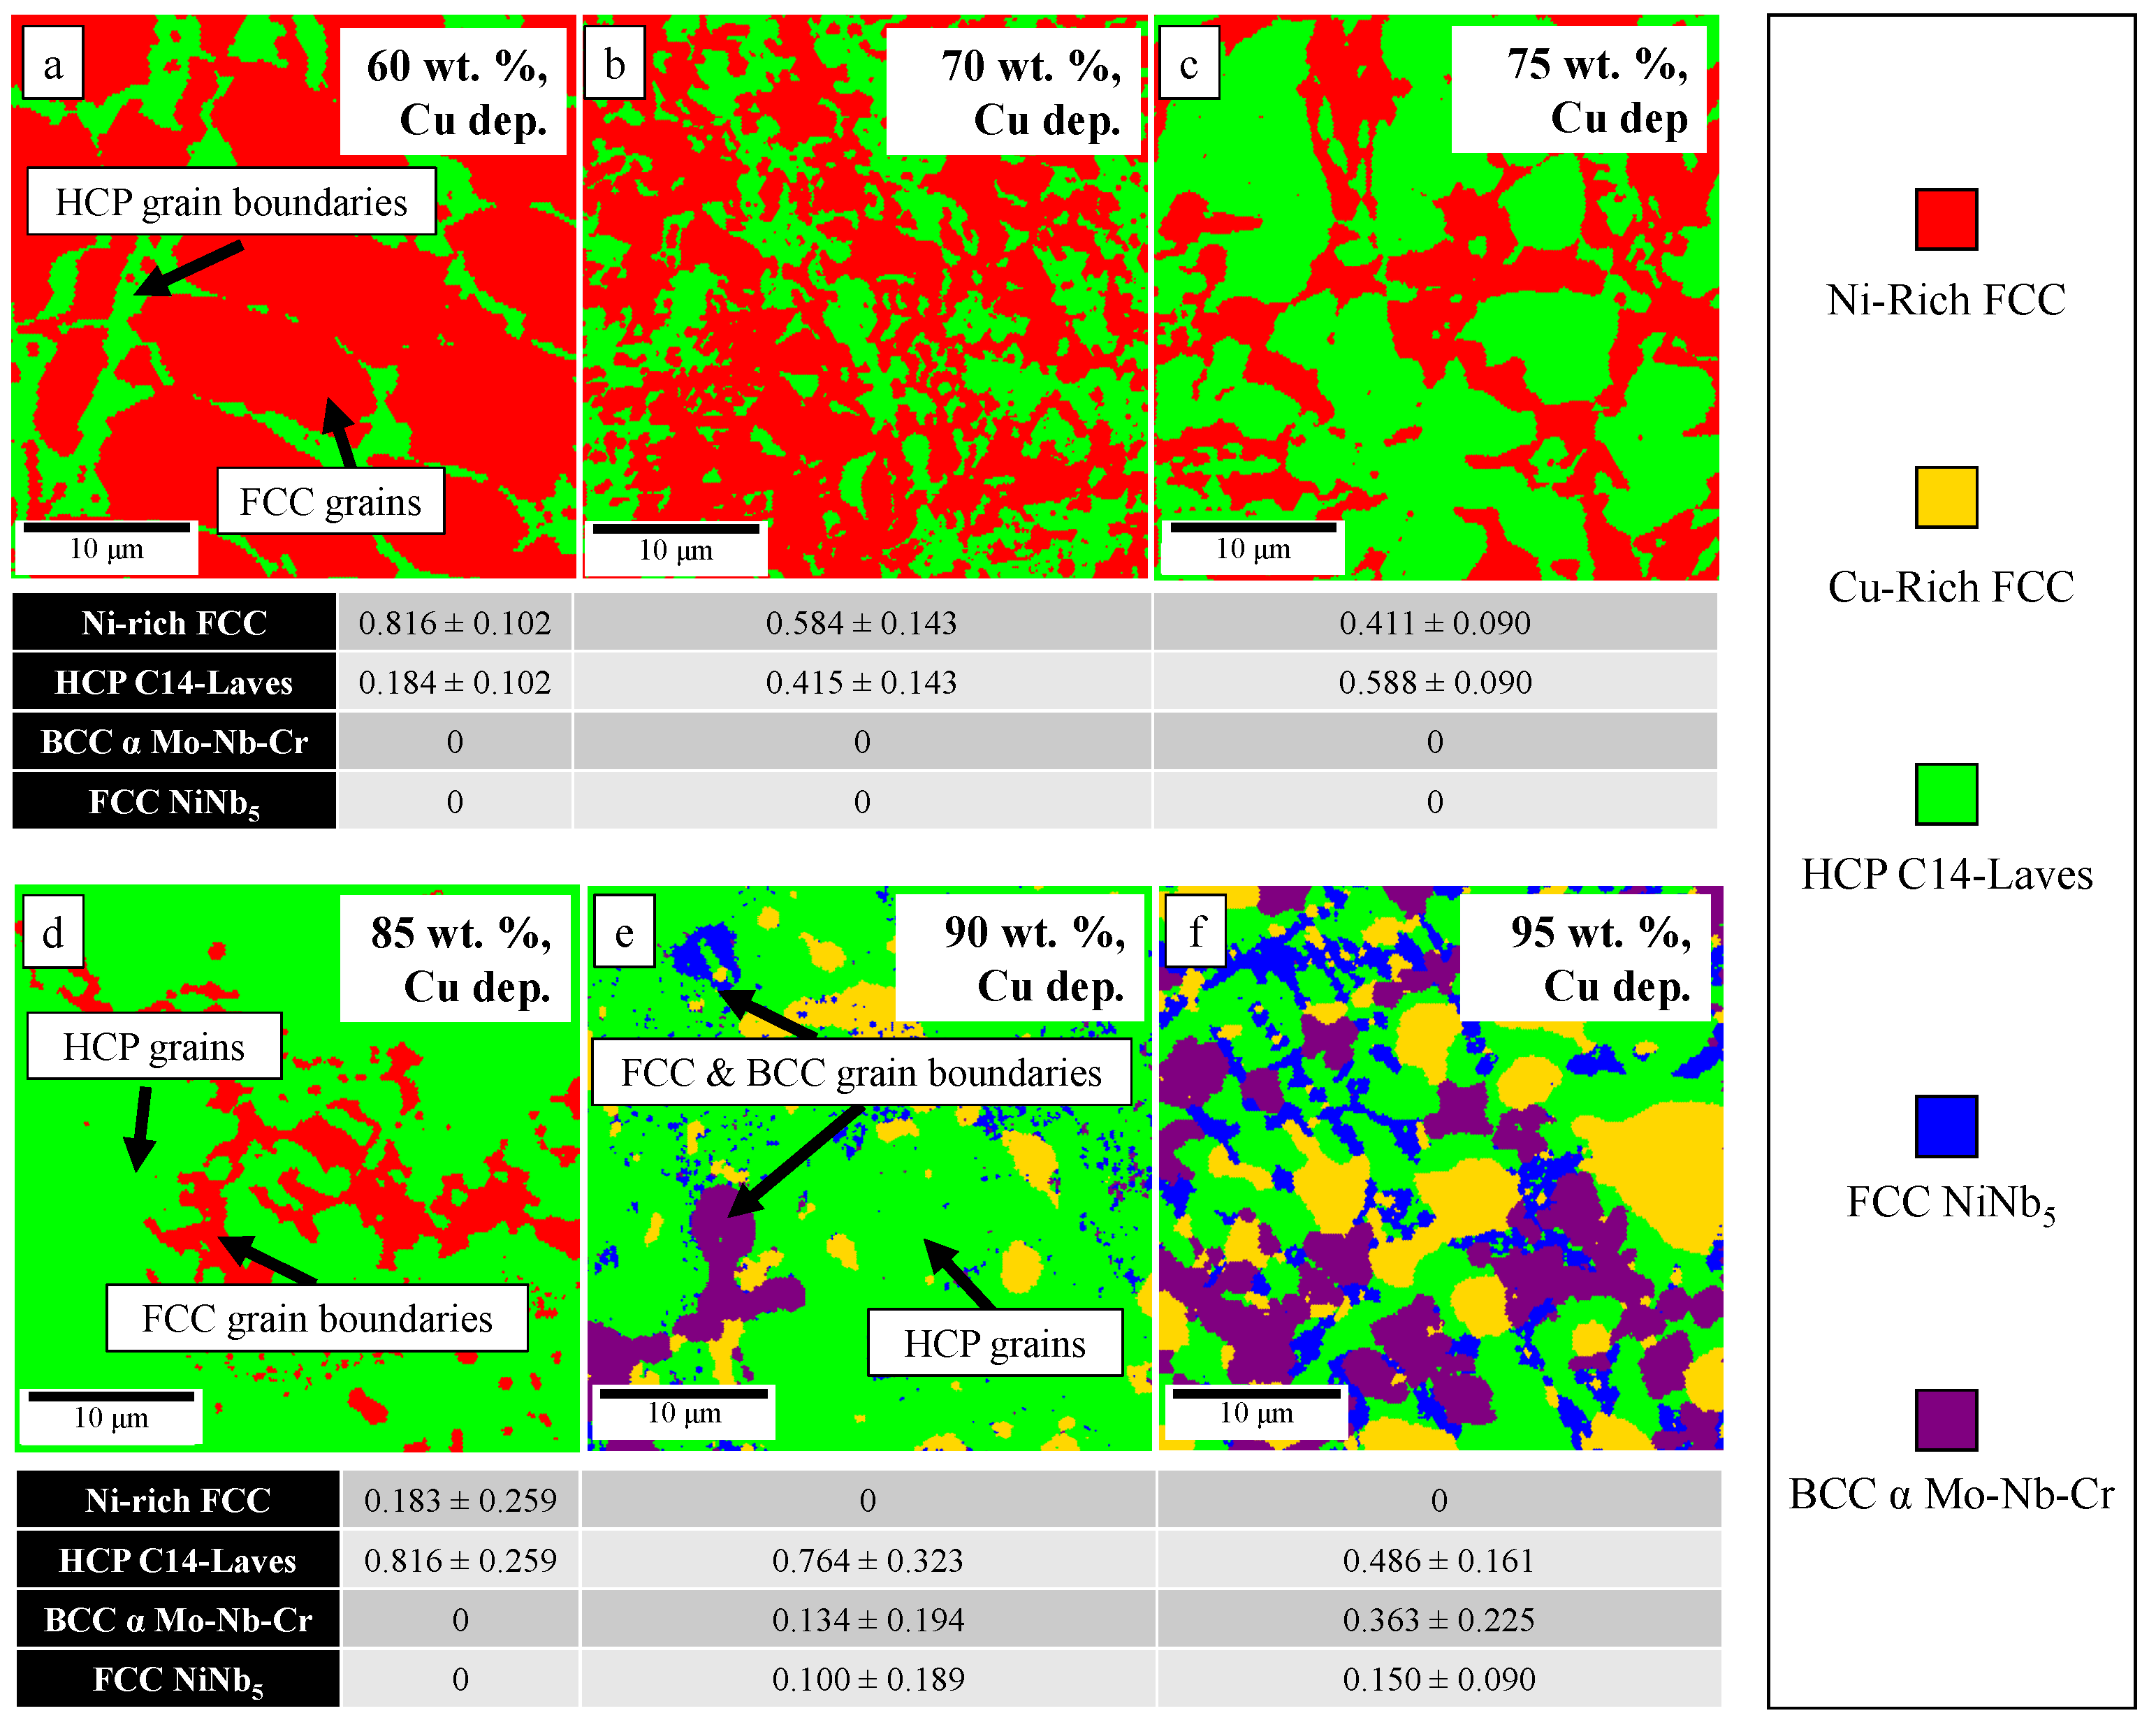
3.2.3. 60–95 wt.% GRCop42 Cu-Deprived Regions

The 60–90 wt.% GRCop42 Cu-deprived regions were found to contain Ni-Nb-Cr-Mo, Nb-Ni, and Mo-Nb-Cr intermetallic phases. To investigate these further, TEM samples were extracted from the 85 and 95 wt.% GRCop42 Cu-deprived regions for EDS spectra and SAD pattern collection. Figure 4a shows the STEM-EDS map of the Ni-Nb-Cr-Mo phase. The corresponding SAD pattern in Figure 4b is identified as belonging to a hexagonal closed packed (HCP) P63/mmc crystal structure [36]. This crystal structure was reported in Inconel 718 GRCop42 joints by Iams et al. [37], and is commonly referred to as HCP C14 Laves or high temperature Cr2Nb [38,39]. STEM-EDS composition data in Table 3 shows that from 85 to 95 wt.% GRCop42, the HCP C14 Laves decreases in Ni content and increases in Nb content. The Nb-Ni rich zone is identified as having a face centered (FCC) Fd-3m crystal structure [40], as shown in Figure 4c,d. This phase has a stoichiometric composition of NiNb5, and was reported by Nash et al. [41] to be a non-equilibrium phase which forms at 1350 °C. The SAD pattern and EDS map in Figure 4e,f show that the Mo-Nb-Cr rich zone corresponds to a body centered (BCC) Im-3m phase [42]. This phase is referred to as the α phase in the Mo-Nb-Cr ternary system, and is observed at equilibrium [42].
EBSD phase maps of the 60–95 wt.% GRCop42 Cu-deprived regions with corresponding phase area fractions are shown in Figure 5a–f. As can be seen in Figure 5a, the 60 wt.% GRCop42 Cu-deprived region is composed of Ni-rich FCC grains with the HCP C14-Laves phase occupying grain boundaries. As the wt.% of GRCop42 increases, the HCP C14-Laves phase volume fraction increases (Figure 5a–d). Once 85 wt.% GRCop42 is reached, the Ni-rich FCC phase occupies the HCP C14-Laves phase grain boundaries (Figure 5d). At 90 wt.% GRCop42, BCC α Mo-Nb-Cr and FCC NiNb5 phases replace the Ni-rich phase at the HCP C14-Laves phase boundaries. In the 95 wt.% GRCop42 Cu-deprived region, the BCC α Mo-Nb-Cr and FCC NiNb5 phases grow in area fraction. The Cu-rich FCC phase was found in the Cu-deprived region of the 90 and 95 wt.% GRCop42, shown in Figure 5e,f. Since this Cu-rich phase appears to result from entrapped Cu-rich liquid and not precipitate from Cu-deprived liquid, its area fraction was disregarded and the area fractions provided in Figure 5 are normalized to exclude the FCC Cu. Further details on Cu-deprived and Cu-rich liquids are provided in Section 4.1.

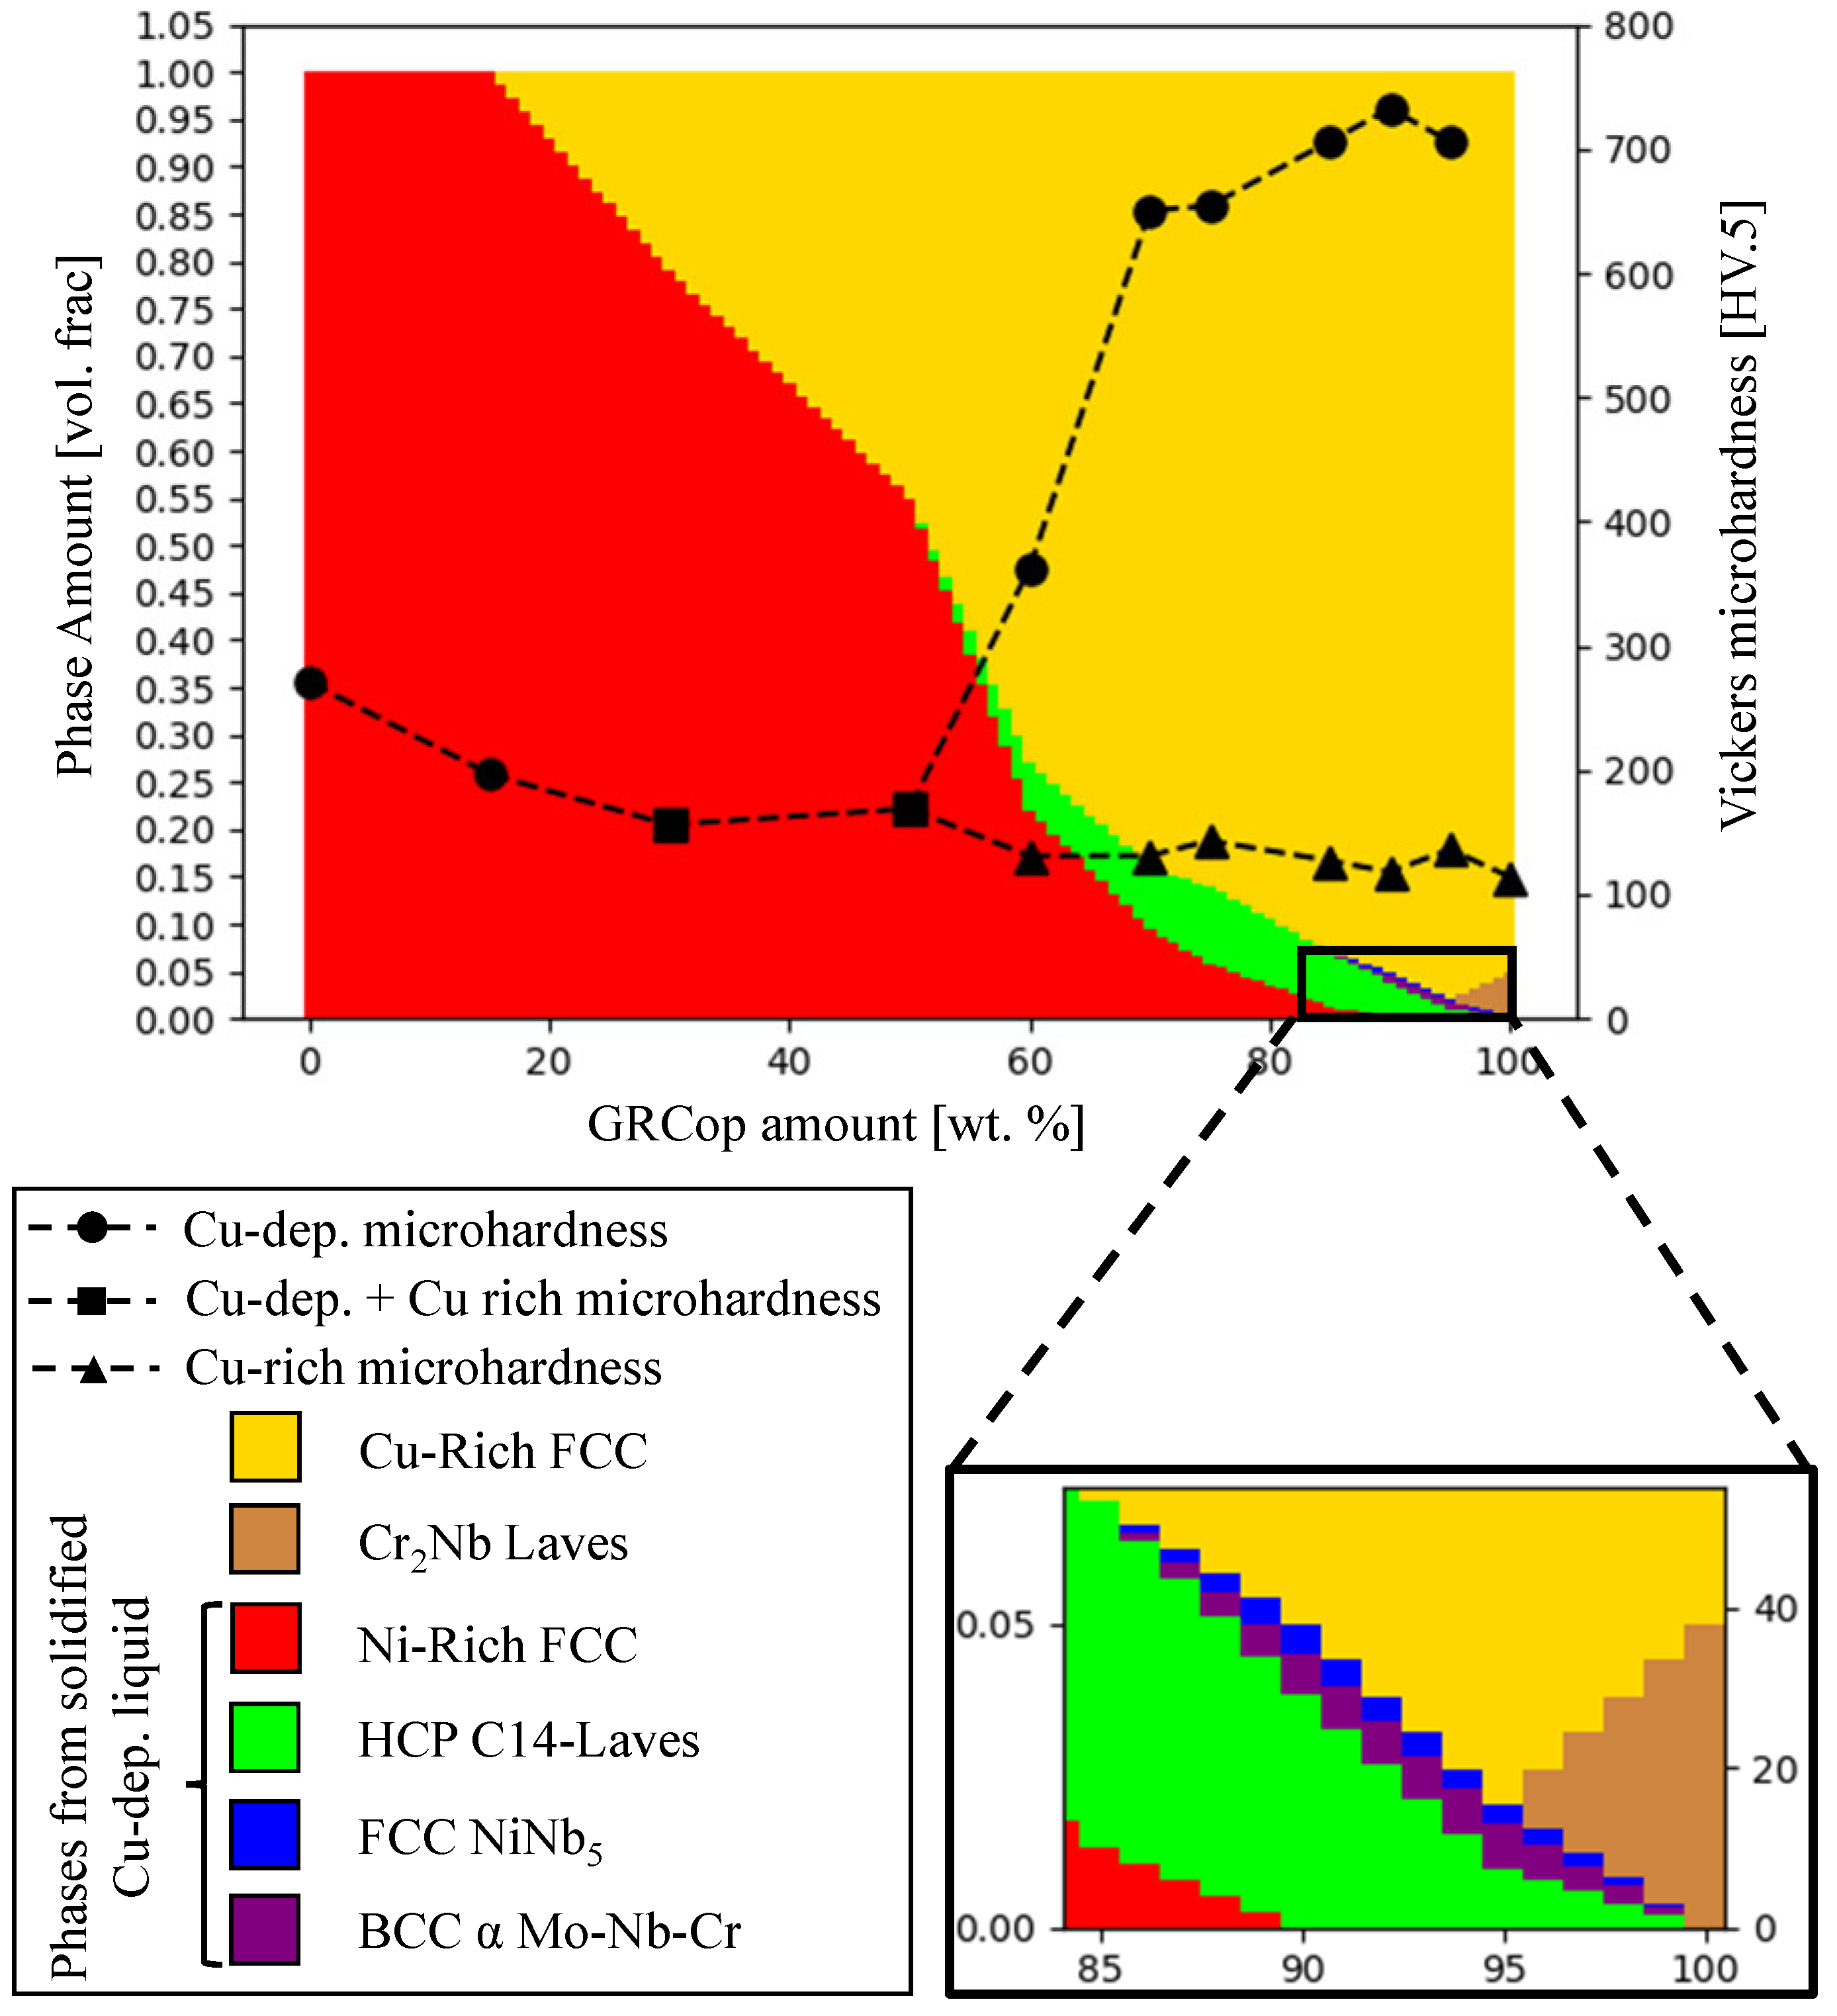
3.2.4. Microhardness

Figure 6 shows measured Vickers microhardness of Cu-deprived and Cu-rich regions. The measurements are overlaid onto an Inconel 625–GRCop42 phase diagram constructed by interpolating the Cu-deprived volume fraction in Table 2 combined with the Cu-deprived phase fractions reported in Figure 5. In the 30 and 50 wt.% GRCop42 sample, the hardness indenter covers both Cu-rich and Cu-deprived regions. In the 15–50 wt.% GRCop42 samples, the hardness is slightly lower than that of pure Inconel 625. The increase in microhardness in the Cu-deprived region of the 60, 70, 75, and 85 wt.% GRCop42 samples correlates with the increase in HCP C14-Laves phase volume fraction. The microhardness of the Cu-rich region in the 60–95 wt.% GRCop42 sample is roughly equal to that of pure GRCop42.

4. Discussion

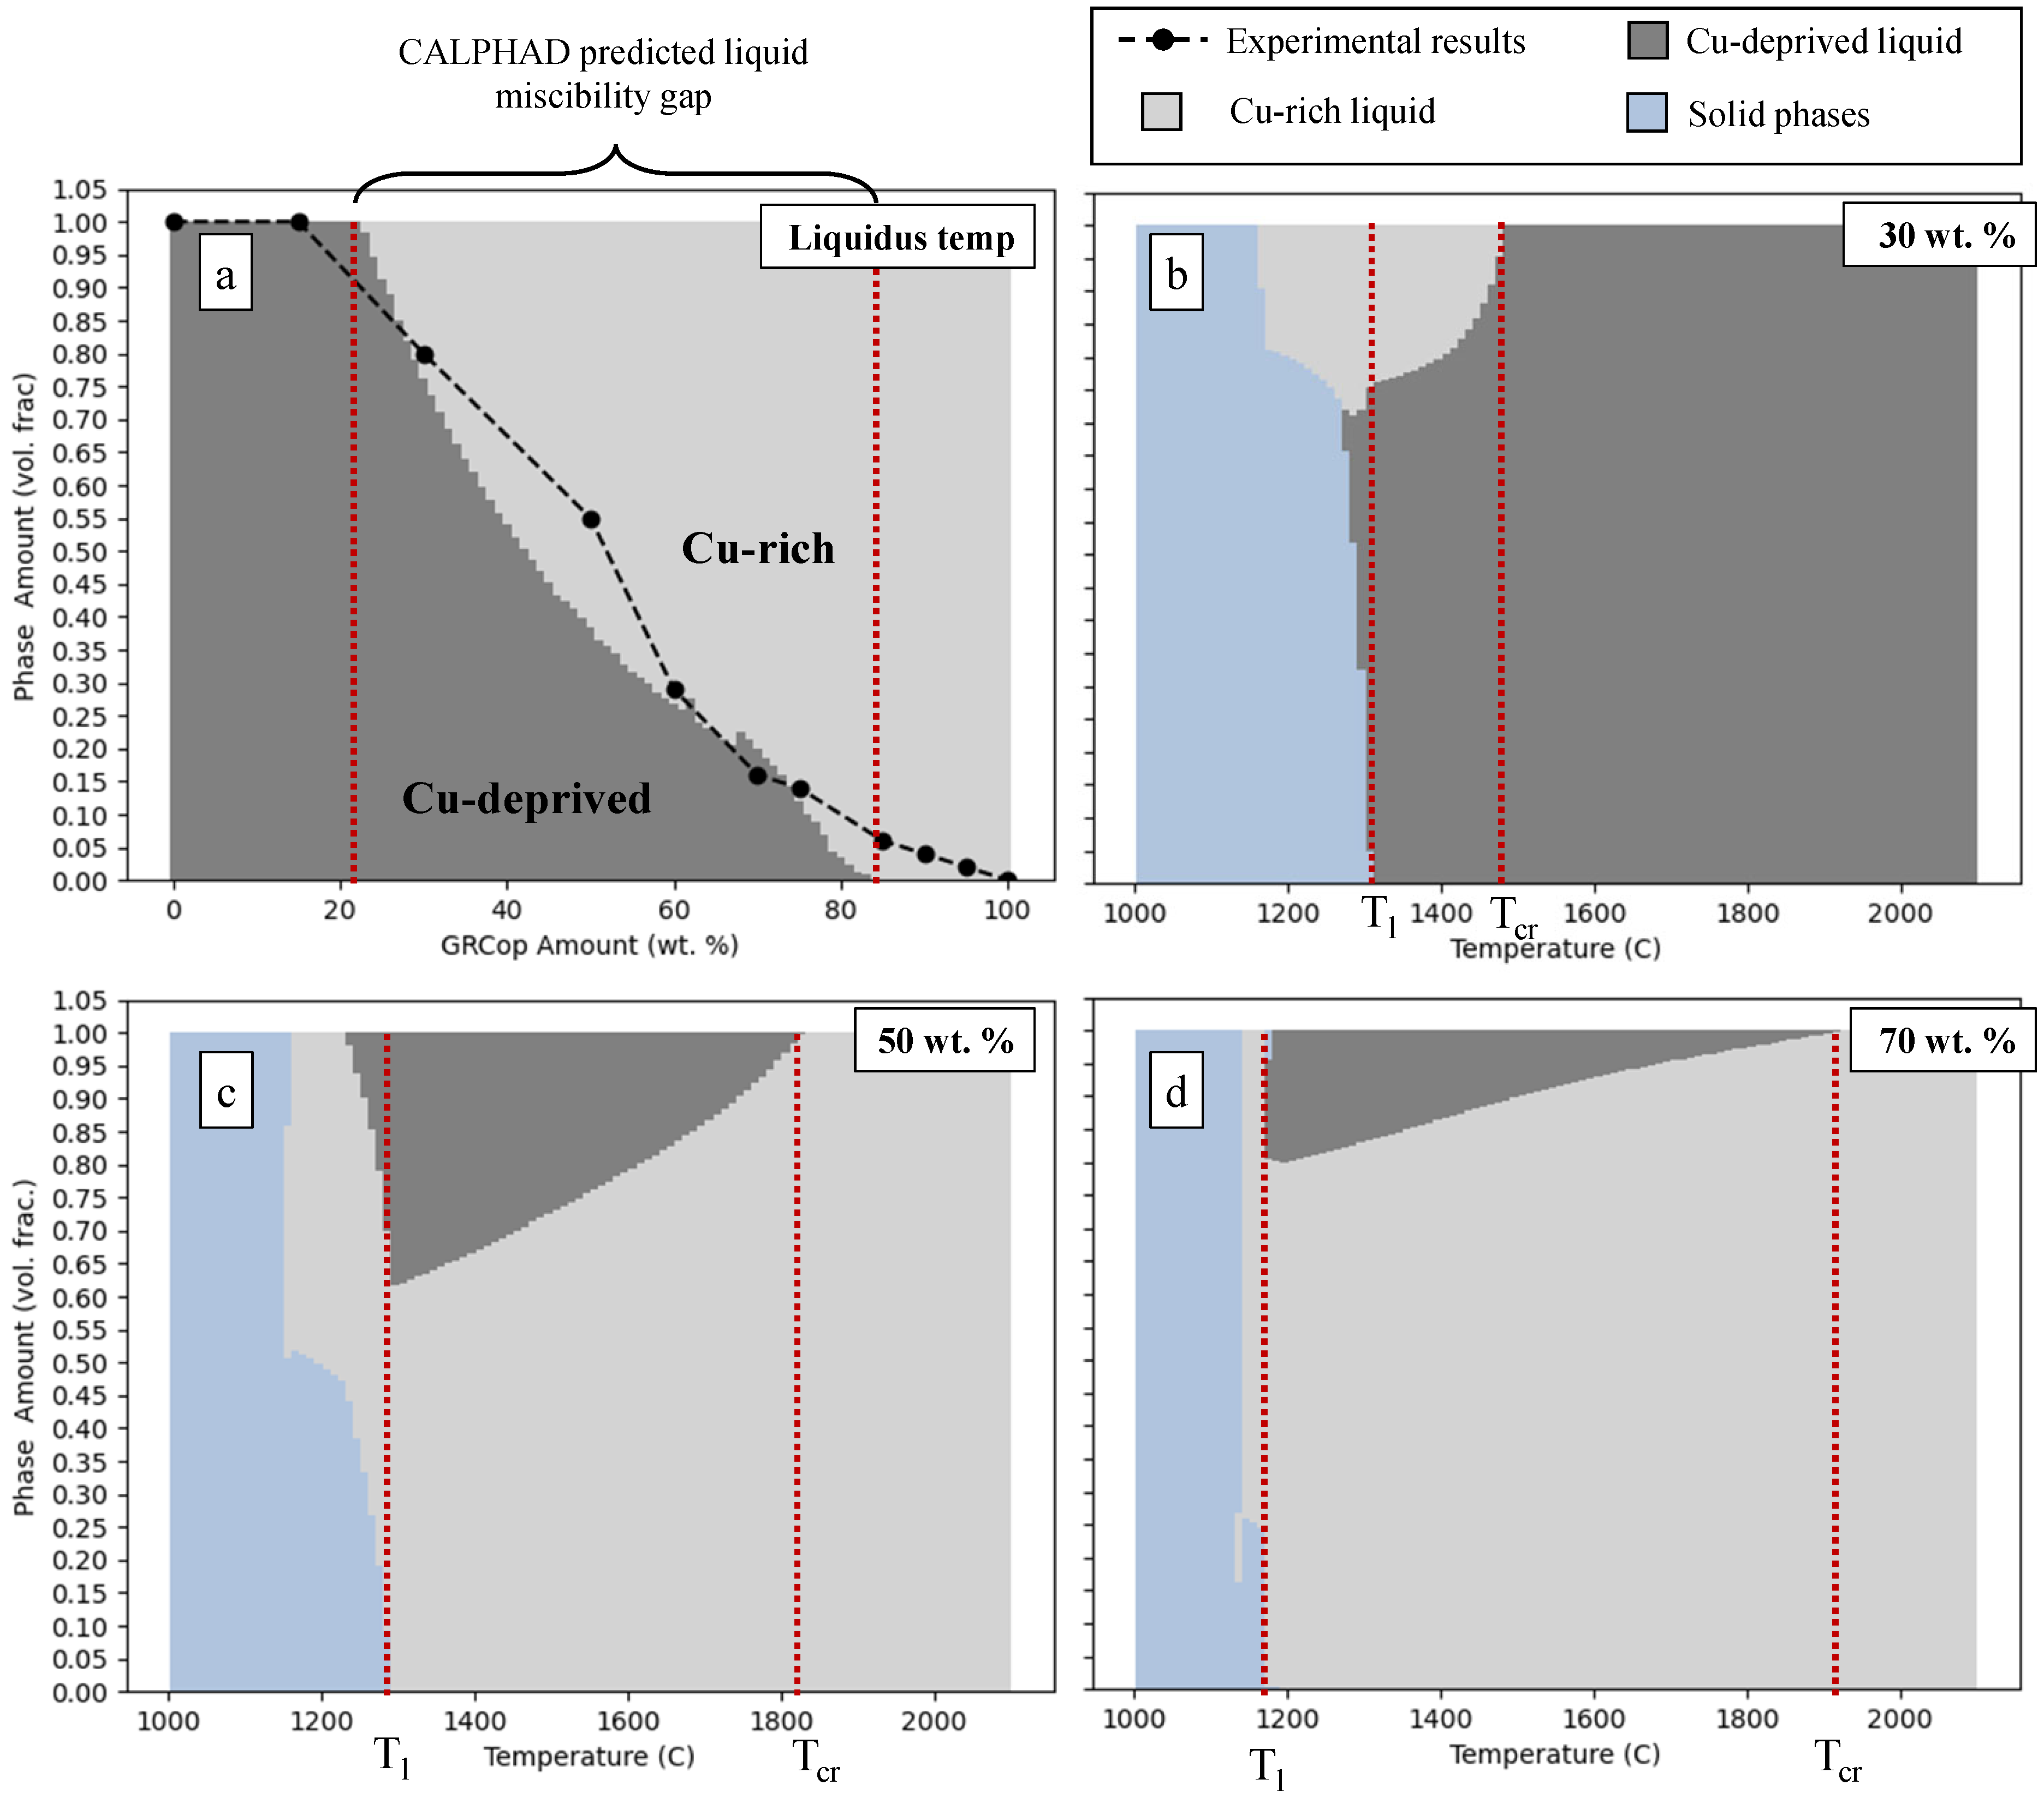
4.1. A Liquid Miscibility Gap in Inconel 625–GRCop42 Mixtures and Formation of Cu-Deprived and Cu-Rich Regions

The presence of Cu-deprived and Cu-rich regions in the 30–95 wt.% GRCop42 samples is explained for the first time in this study by the existence of a liquid miscibility gap (i.e., unmixable liquids) in the Inconel 625–GRCop42 system. In contrast to the reported literature, which considers miscibility gaps in Cu-Cr and Cu-Nb binary supercooled systems [28,29], in this work, CALPHAD modeling (which is able to account for the quinary elemental system) shows a lack of liquid state miscibility above the liquidus (Figure 7a–d). The liquidus phase volume fraction plotted as a function of GRCop42 composition in Figure 7a indicates that the miscibility gap is predicted to start at 20 wt.% GRCop42 and end at 80 wt.%. In contrast, results from Table 2 (overlaid onto Figure 7a) show the existence of a Cu-deprived region in the 85–95 wt.% GRCop42 samples, indicating a discrepancy between the CALPHAD model and experimental results. This could indicate that further refinement of the TCCU4 database is necessary to accurately model the formation of Cu-deprived Cu-rich regions through the entire Inconel 625–GRCop42 system.
According to Figure 1 and Table 2, the solidification path in Inconel 625–GRCop42 miscibility gap compositions (30–95 wt.% GRCop42) results in two distinct morphologies: (1) Cu-rich Cu-deprived dendritic in 30–50 wt.% GRCop42 samples (Figure 1 b,c) and (2) Cu-deprived spherical in 60–95 wt.% GRCop42 samples (Figure 1 d–g). The presence of these two morphologies can be explained by considering the critical temperature ( T c r , the maximum temperature at which two liquids are present) and the volume fraction of each liquid. Spherical morphologies can only form when both the Cu-deprived and Cu-rich compositions are in the liquid state (when the temperature is above the liquidus; T > T l ). Liquid separation only occurs below the critical temperature (below maximum temperature at which two liquids are present; T < T c r ). CALPHAD modeling in Figure 7b–d shows that as the GRCop42 content increases, the T c r T l temperature range increases due to increase in T c r and decrease in T l . In addition, Table 2 shows that as GRCop42 content increases, the Cu-deprived volume fraction decreases (at 60 wt.% GRCop42 the Cu-deprived volume fraction is 0.27). It is hypothesized that from 60 to 95 wt.% GRCop42, the T c r T l range is high enough and the Cu-deprived volume fraction is low enough to allow for density differences and surface energy minimization to result in liquid coalescence and therefore the forming of a Cu-deprived spherical morphology. This is supported by research by Ohnuma et al. [43], who showed the liquid with the lesser volume fraction tends to form spherical structures. Liquid separation due to density differences and surface energy minimization has been previously reported by Wang et al. [31]. From 30 to 50 wt.% GRCop42, T c r T l is relatively lower, meaning that the liquids do not have enough time to separate and coalesce. At these compositions, the Cu-deprived liquid also solidifies prior to the Cu-rich liquid (Figure 7b,c). As the Cu-deprived liquid solidifies from the bottom of the sample upward, it pushes the Cu-rich liquid aside, resulting in the observed Cu-rich Cu-deprived dendritic microstructure.

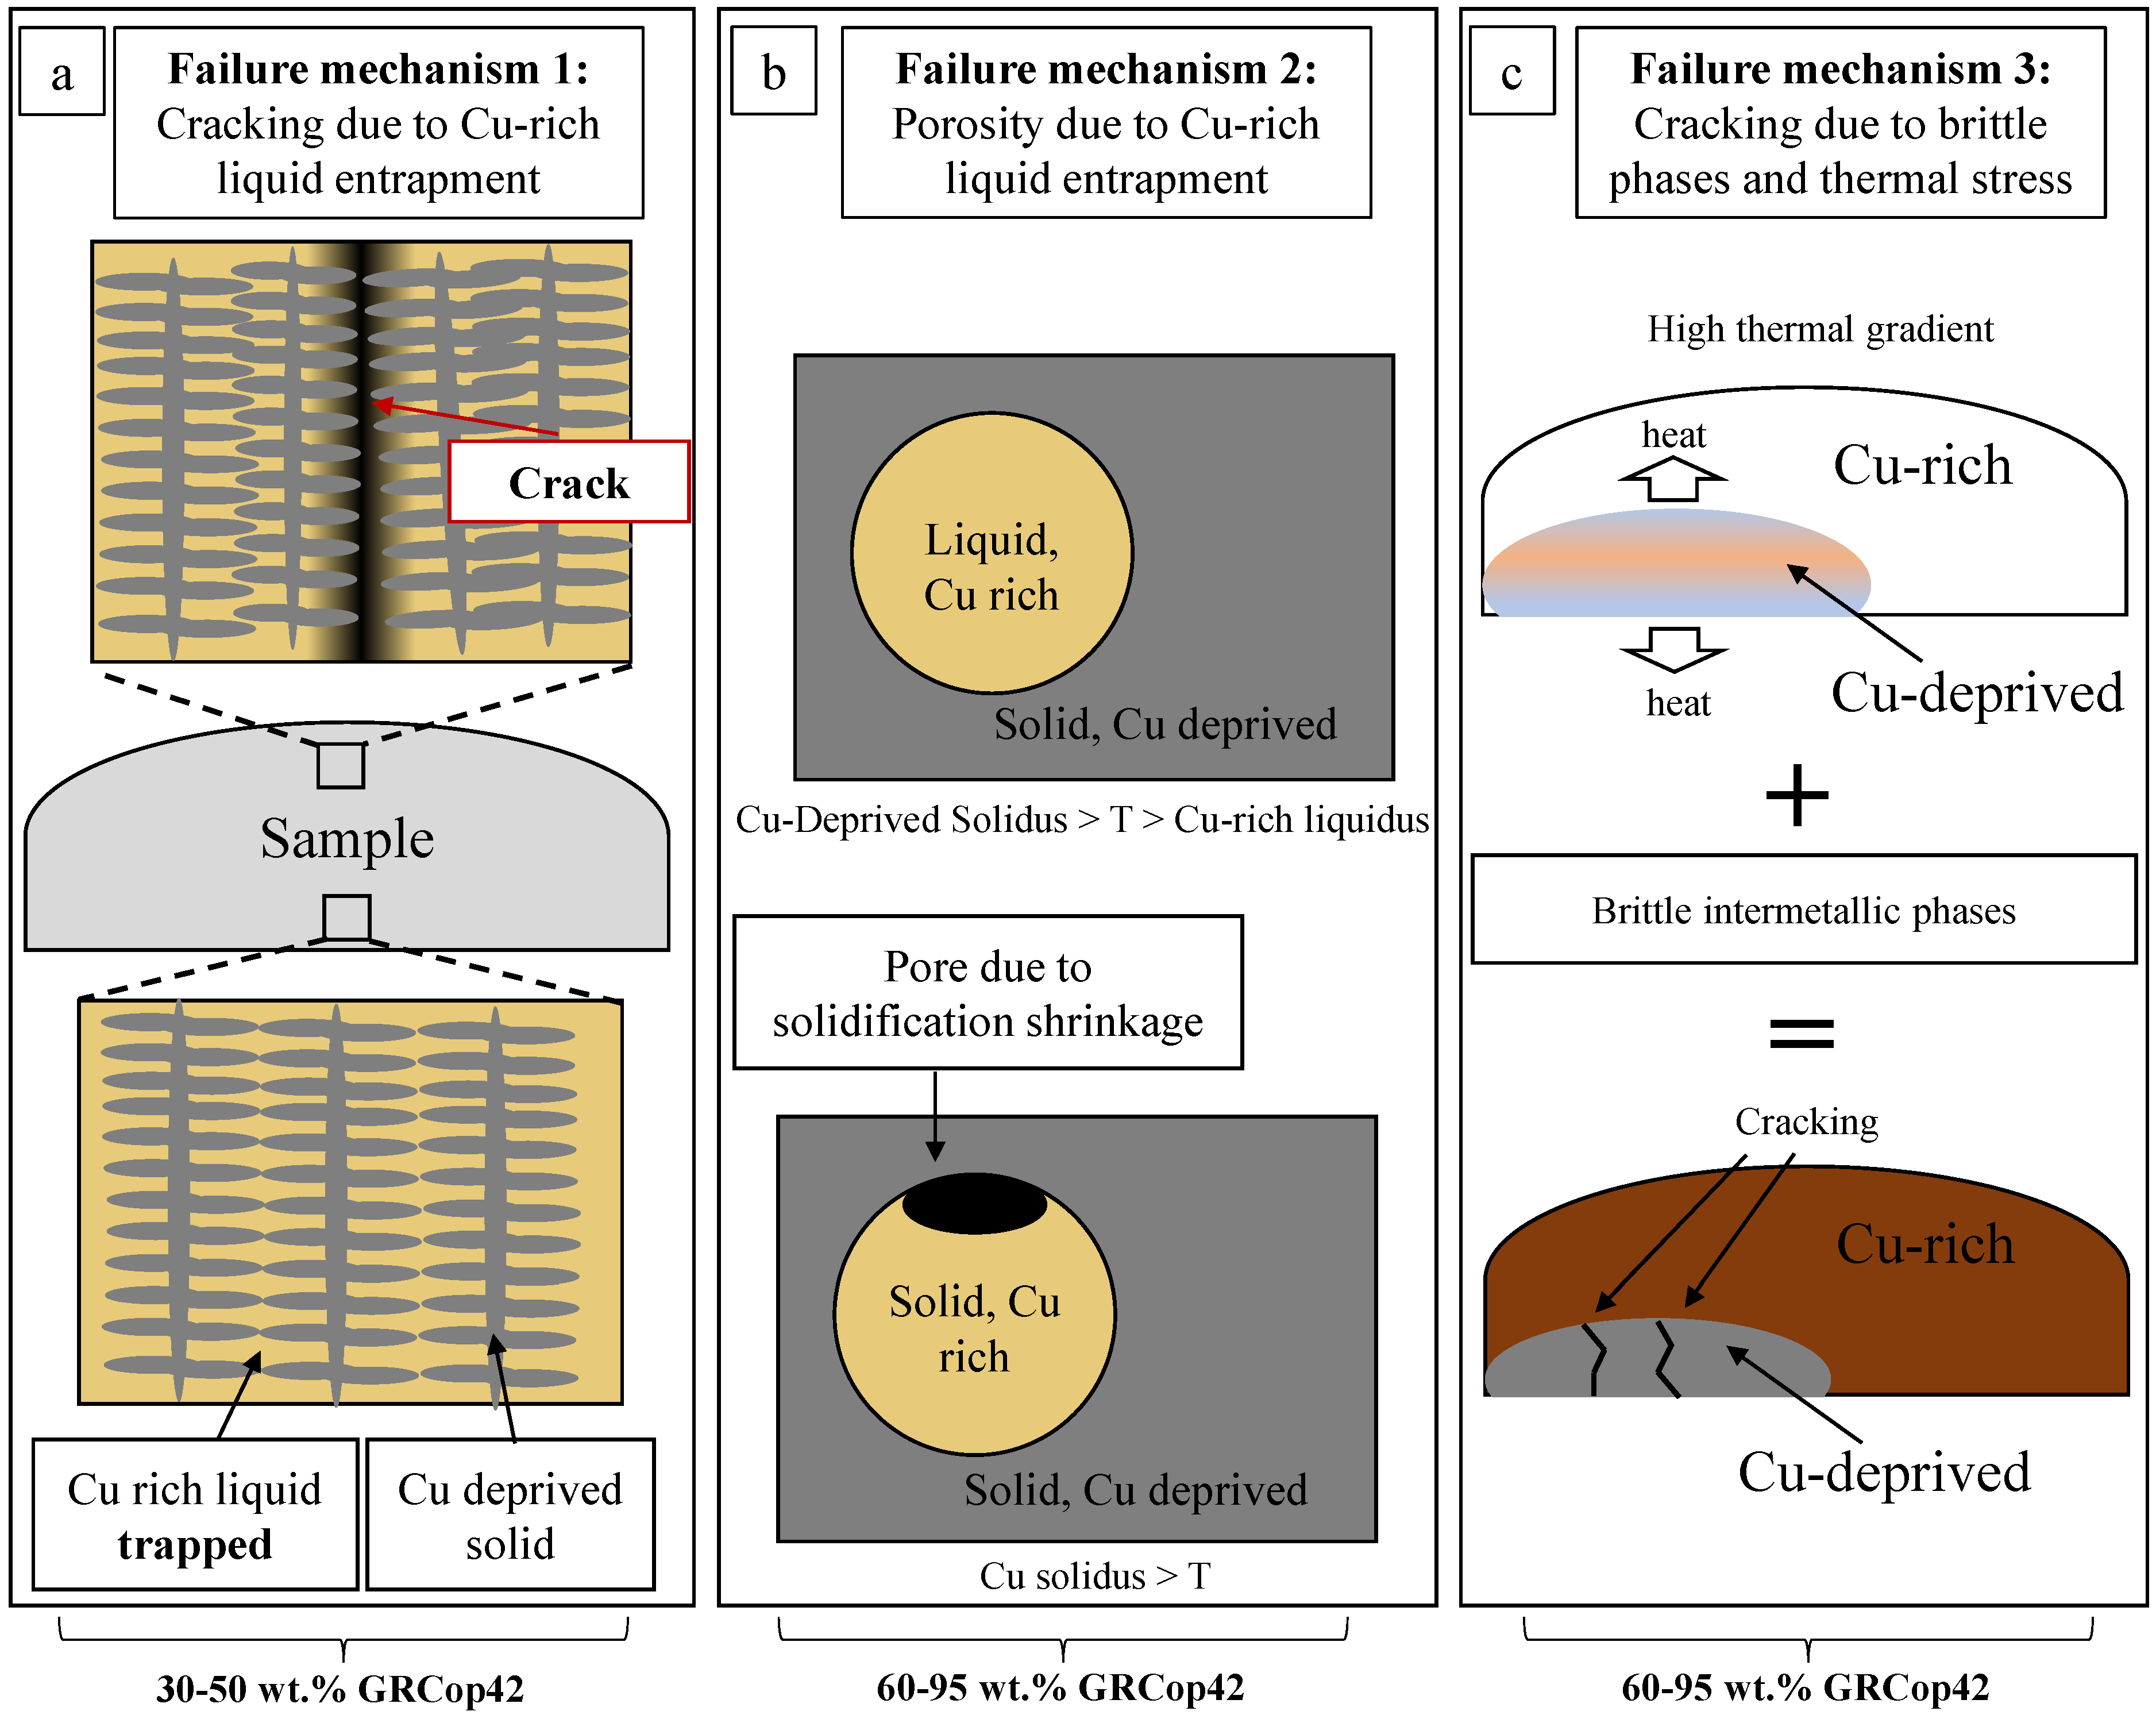
4.2. Failure Mechanisms in Inconel 625–GRCop42 Alloys

Three Inconel 625–GRCop42 alloy failure mechanisms are proposed (Figure 8a–c): (1) cracking due to Cu-rich liquid entrapment, (2) porosity due to Cu-rich liquid entrapment, (3) cracking due the combined presence of brittle phases and thermal stress. In the first failure mechanism, after undergoing separation the Cu-deprived liquid solidifies prior to the Cu-rich liquid. In the 30 wt.% and 50 wt.% GRCop42 samples, the earlier solidification of Cu-deprived liquid results in Cu-rich liquid being caught within the solidified Cu-deprived dendrite arms. This Cu-rich liquid entrapment leads to a lack of Cu-rich liquid at the final region of solidification, which in the case of arc melted samples is located at the top of the part as shown in Figure 1b. A schematic of this cracking mechanism is shown in Figure 8a. The herein described cracking mechanism is similar to the one described by Kou [20], where cracking due to lack of interdendritic liquid in single liquid solidification is outlined.
In the second failure mechanism, in samples with Cu-deprived spherical microstructure (60–95 wt.% GRCop42), Cu-rich spherical satellites become trapped in the Cu-deprived region due to Marangoni mixing, which occurs due to a surface tension gradient in the liquid as it cools [21]. As mentioned previously, the Cu-deprived region solidifies first entrapping the Cu-rich liquid. The subsequent solidification shrinkage of the Cu-rich liquid results in porosity, as shown in Figure 1e and Figure 8b. Porosity can serve as a stress concentration zone upon load application, allowing for crack initiation [44].
For the third failure mechanism, the Cu-deprived spherical microstructure regions (60–95 wt.% GRCop42) experience a high thermal gradient during solidification due to being surrounded by a highly conductive Cu-rich matrix. This induces a thermal stress onto the Cu-deprived regions. Thermal stresses in high thermal gradient process (such as AM processes) have been shown to be on the order of 1000 MPa [45]. As shown in Section 3.2 and Section 3.2.4, the intermetallic HCP C14-Laves, FCC NiNb5, and BCC α Mo-Nb-Cr phases lead to increased hardness due to impediment of dislocation motion (embrittlement). The cracking observed in the 70–95 wt.% samples (Figure 1f,g) is due to the intermetallic phases preventing resolution of the thermal stress, as shown in Figure 8c. The lack of observed cracking in the 60 wt.% GRCop42 sample can be explained by the relatively low intermetallic phase volume fraction (Figure 5), which allows for the Ni-rich FCC phase to resolve thermal stress. This is confirmed by the lower microhardness values of the Cu-deprived region of the 60 wt.% GRCop42 (Figure 6). Our results align with the findings of Hales et al. [6], where failure in Inconel 625 deposited onto GRCop84 was reported at a composition corresponding to ∼70 wt.% GRCop84. However, the explanation provided by Hales et al. [6] attributed failure to hot cracking, whereas in this study it is found that brittle HCP C14-Laves, FCC NiNb5, and BCC α Mo-Nb-Cr phases exist near this composition which could lead to the observed fracture.

5. Conclusions

In this study, compositions corresponding to 15, 30, 50, 60, 70, 75, 85, 90, and 95 wt.% GRCop42 alloyed with Inconel 625 were arc melted and characterized with the goal of identifying cracking mechanisms. Findings show evidence of a liquid miscibility gap between a Cu-rich and Cu-deprived liquid in the 30–95 wt.% GRCop42 samples. For the 30 and 50 wt.% GRCop42 samples, the miscibility gap results in Cu-deprived dendrites with Cu-rich interdendritic regions. For the 60–95 wt.% GRCop42 samples, the miscibility gap results in consolidated spherical Cu-deprived regions which contain HCP C14-Laves, FCC NiNb5, and BCC α Mo-Nb-Cr brittle intermetallic phases. The difference between the Cu-deprived Cu-rich dendritic morphology and Cu-deprived spherical morphology is hypothesized to be governed by the T c r T l temperature range and the volume fraction of each liquid. The following failure mechanisms are proposed for cracking in Inconel 625–GRCop42 alloys:
  • At 30–50 wt.% GRCop42, Cu-rich liquid is entrapped within interdendritic boundaries, resulting in a Cu-rich liquid deficiency and cracking at the last region of solidification.
  • At 60–95 wt.% Cu-rich liquid can become entrapped within Cu-deprived regions, leading to porosity due to solidification shrinkage.
  • At 60–95 wt.% GRCop42, cracking occurs in Cu-deprived regions due to a combination of a brittle intermetallic phases and high thermal strain induced by arc melting.
Based on the listed failure mechanisms, it can be concluded that joining Inconel 625 and GRCop42 should be conducted with as little liquid state mixing as possible to avoid liquid miscibility gap inducing compositions and subsequent failure mechanisms. Further optimization is required to optimize process-induced mixing or develop a transition composition that allows for the miscibility gap to be avoided.

Author Contributions

Conceptualization, J.P. and S.P.; methodology, J.P.; software, J.P.; formal analysis, J.P.; investigation, J.P., P.A.E.; resources, S.P., D.X. and B.K.P.; writing—original draft preparation, J.P.; writing—review and editing, D.X., P.A.E., B.K.P. and S.P.; supervision, S.P. and B.K.P.; project administration, S.P. and B.K.P.; funding acquisition, S.P. and B.K.P. All authors have read and agreed to the published version of the manuscript.

Funding

This work relates to Department of Navy award (Award Number N00014-20-1-2836 in collaboration with University of Tennessee, Knoxville) issued by the Office of Naval Research. The United States Government has a royalty-free license throughout the world in all copyrightable material contained herein. Any opinions, findings, and conclusions or recommendations expressed in this material are those of the author(s) and do not necessarily reflect the views of the Office of Naval Research. Additionally, the authors greatly acknowledge the funding from the National Science Foundation (NSF CAREER award # 2338253).

Data Availability Statement

The raw data supporting the conclusions of this article will be made available by the authors on request.

Acknowledgments

The authors would like to sincerely acknowledge Mark Rice and Maria Wright for their support and management. The first author would like to acknowledge and thank the following people for having served as mentors: Sam Miller, Michael Kenworthy, Hans Mayer, Daniel Waldorf, and Xuan Wang.

Conflicts of Interest

The authors declare no conflicts of interest. The funders had no role in the design of the study; in the collection, analyses, or interpretation of data; in the writing of the manuscript; or in the decision to publish the results.

Appendix A

EDS measurements of the Cu-deprived region are provided in Table A1. These compositions were used to estimate the weight fraction of the Cu-deprived region using Equation (A1), which is derived from conservation of mass.
f d e p = C t o t a l f r i c h C rich C d e p
Table A1. SEM-EDS measured elemental compositions of Cu-deprived regions within the 30, 50, 70, 75, 85, 90 and 95 wt.% GRCop42 samples.
SampleCuNiCrMoNb
wt.% GRCop42wt.%wt.%wt.%wt.%wt.%
3016.6 ± 2.052.3 ± 1.919.6 ± 1.77.6 ± 1.23.7 ± 2.5
5016.5 ± 2.050.9 ± 1.319.9 ± 2.77.9 ± 2.74.7 ± 3.8
6011.8 ± 1.444.3 ± 1.822.2 ± 1.212.5 ± 1.59.3 ± 0.9
709.3 ± 2.638.9 ± 1.921.4 ± 0.916.2 ± 0.314.2 ± 0.3
756.4 ± 1.838.4 ± 1.023.0 ± 1.315.5 ± 2.516.6 ± 0.9
852.8 ± 1.228.3 ± 4.622.0 ± 2.519.3 ± 1.427.6 ± 2.4
904.4 ± 3.025.2 ± 7.717.2 ± 2.519.4 ± 13.434.0 ± 4.5
955.1 ± 1.214.1 ± 2.313.7 ± 1.219.2 ± 4.547.9 ± 1.9
In Equation (A1), f d e p is the weight fraction of the Cu-deprived region, f r i c h is the weight fraction of the Cu-rich region, C t o t a l is the weight percentage an element in the overall alloy, C d e p is the weight percentage of that element in the Cu-deprived region, and C r i c h is the weight percentage of that element in the Cu-rich region. Since solubility of Mo in Cu is nearly 0 [46], the Mo wt.% was used to estimate the weight fraction of the Cu-deprived region by setting C r i c h = 0 . This assumption is backed up by EDS spectra which showed a Mo content in the Cu-deprived region of < 0.8 wt.% in all samples. The weight fraction of the Cu-deprived region as calculated using Equation (A1) is provided in Table A2.
Table A2. Calculated Cu-deprived region amounts in weight fraction and volume fraction.
SampleCu-dep. AmountCu-dep. Amount
wt.% GRCop42wt. frac.vol. frac
300.79 ± 0.1260.79 ± 0.124
500.55 ± 0.1890.55 ± 0.188
600.27 ± 0.0340.27 ± 0.034
700.16 ± 0.0030.16 ± 0.003
750.14 ± 0.0240.14 ± 0.024
850.07 ± 0.0050.07 ± 0.005
900.05 ± 0.0320.05 ± 0.034
950.02 ± 0.0050.02 ± 0.005
To convert from weight fraction to volume fraction, Equation (A2) was first used to calculate the composition of the Cu-rich region. This method was determined as more robust than directly measuring the composition of the Cu-rich region, because precipitates within the Cu-rich region added noise to spectrum results.
C r i c h = C t o t a l C d e p r i v e d f d e p 1 f d e p
The calculated Cu-rich and measured Cu-deprived (Table A1) compositions were then input into Thermocalc to find the density of the Cu-rich and Cu-deprived regions. The results are provided in Table A3. For the Cu-deprived region, the TCNI11 (Ni-based alloys) database was used, while for the Cu-rich region the TCCU4 (Cu-based alloys) database was used. The volume fraction of the Cu-deprived region was then calculated using Equation (A3).
V d e p = f d e p ρ r i c h f d e p ρ r i c h + f r i c h ρ d e p
In Equation (A3), ρ r i c h is the density of the Cu-rich region while ρ d e p is the density of the Cu-deprived region (values provided in Table A3). The volume fraction of the Cu-deprived region calculated using Equation (A3) is provided in Table A2. As can be observed, the Cu-deprived weight fraction and volume fraction are found to be similar. This is because the density of the Cu-deprived and Cu-rich region are found to be similar, per Table A3.
Table A3. Density values at 500 K as calculated using Thermocalc. The TCNI11 database was used for the Cu-deprived region density, while the TCCU4 database was used for the Cu-rich region density.
SampleCu-Rich DensityCu-Deprived Density
wt.% GRCop42g/cm3g/cm3
308.738.50
508.758.49
608.718.49
708.718.51
758.738.45
858.738.29
908.748.33
958.748.48
In order to verify the accuracy of the presented method, an 85 wt.% GRCop42 sample as CT scanned as outlined in Section 2.2. A side view and top view of the sample with corresponding view cutout locations is provided in Figure A1a,b, respectively. Based of the contrast difference between the Cu-rich and Cu-deprived regions, the volume of the Cu-deprived region was found and divided by the total volume of the sample. Using this method, the Cu-deprived phase volume fraction was found to be 0.074. By comparing this value to the volume fraction as obtained by the presented composition-based method (0.07 ± 0.005, Table A2), good agreement is found between the presented composition-based method and the ground truth CT scanning method.
Figure A1. CT scan of the 85 wt.% GRCop42 sample showing (a) a side view and (b) a top view. The dotted lines show corresponding view cutout locations. The light gray region corresponds to a Cu-deprived composition, while the dark gray region corresponds to a Cu-rich region.
Jmmp 08 00042 g0a1

References

  1. Ellis, D.L.; Michal, G.M. Mechanical and Thermal Properties of Two Cu-Cr-Nb Alloys and NARloy-Z; NASA Conractor Report 198529; NASA: Cleveland, OH, USA, 1996. [Google Scholar]
  2. Anam, M.A. Microstructure and Mechanical Properties of Selective Laser Melted Superalloy Inconel 625; Elsevier: Amsterdam, The Netherlands, 2018. [Google Scholar]
  3. Reed, R.C. The Superalloys Fundamentals and Applications; Cambridge University Press: Cambridge, UK, 2006; Volume 9780521859042. [Google Scholar] [CrossRef]
  4. Gradl, P.R.; Protz, C.S.; Ellis, D.L.; Greene, S.E. Progress in additively manufactured copper-alloy GRCOP-84, GRCOP-42, and bimetallic combustion chambers for liquid rocket engines. In Proceedings of the International Astronautical Congress, IAC, 2019, Washington, DC, USA, 21–25 October 2019. [Google Scholar]
  5. Gradl, P.R.; Protz, C.; Fikes, J.; Clark, A.; Evans, L.; Miller, S.; Ellis, D.; Hudson, T. Lightweight thrust chamber assemblies using multi-alloy additive manufacturing and composite overwrap. In Proceedings of the AIAA Propulsion and Energy 2020 Forum, Virtual Event, 24–26 August 2020. [Google Scholar] [CrossRef]
  6. Hales, S.; Domack, C. Electron Beam Freeform Fabrication of Dissimilar Materials: Cracking in Inconel ® 625 Deposited on GRCop-84; National Aeronautics and Space Administration: Washington, DC, USA, 2020. [Google Scholar]
  7. Anderson, R.; Terrell, J.; Schneider, J.; Thompson, S.; Gradl, P. Characteristics of Bi-metallic Interfaces Formed During Direct Energy Deposition Additive Manufacturing Processing. Metall. Mater. Trans. B Process. Metall. Mater. Process. Sci. 2019, 50, 1921–1930. [Google Scholar] [CrossRef]
  8. Pan, T.; Zhang, X.; Yamazaki, T.; Sutton, A.; Cui, W.; Li, L.; Liou, F. Characteristics of Inconel 625—Copper bimetallic structure fabricated by directed energy deposition. Int. J. Adv. Manuf. Technol. 2020, 109, 1261–1274. [Google Scholar] [CrossRef]
  9. Onuike, B.; Heer, B.; Bandyopadhyay, A. Additive manufacturing of Inconel 718—Copper alloy bimetallic structure using laser engineered net shaping (LENS™). Addit. Manuf. 2018, 21, 133–140. [Google Scholar] [CrossRef]
  10. Blakey-Milner, B.; Gradl, P.; Snedden, G.; Brooks, M.; Pitot, J.; Lopez, E.; Leary, M.; Berto, F.; du Plessis, A. Metal additive manufacturing in aerospace: A review. Mater. Des. 2021, 209, 110008. [Google Scholar] [CrossRef]
  11. Gradl, P.R.; Protz, C.S.; Garcia, C.P.; Mireles, O.R.; MartinLeary. Introduction to and Applications of Additive Manufacturing for Propulsion. In Metal Additive Manufacturing for Propulsion Applications; American Institute of Aeronautics and Astronautics: Reston, VA, USA, 2023; Chapter 1; pp. 1–48. [Google Scholar] [CrossRef]
  12. Gradl, P.R.; Protz, C.; Zagorski, K.; Doshi, V.; McCallum, H. Additive manufacturing and hot-fire testing of bimetallic grcop-84 and c-18150 channel-cooled combustion chambers using powder bed fusion and inconel 625 hybrid directed energy deposition. In Proceedings of the AIAA Propulsion and Energy Forum and Exposition, 2019, Indianapolis, IN, USA, 19 August 2019. [Google Scholar] [CrossRef]
  13. Gradl, P.R.; Protz, C.; Cooper, K.; Garcia, C.; Ellis, D.; Evans, L. Grcop-42 development and hot-fire testing using additive manufacturing powder bed fusion for channel-cooled combustion chambers. In Proceedings of the AIAA Propulsion and Energy Forum and Exposition, 2019, Indianapolis, IN, USA, 19 August 2019; 2019. [Google Scholar] [CrossRef]
  14. Gradl, P.R.; Teasley, T.; Protz, C.; Garcia, M.; Kantzos, C.; Ellis, D. Advancing GRCop-based Bimetallic Additive Manufacturing to Optimize Component Design and Applications for Liquid Rocket Engines. In Proceedings of the AIAA Propulsion and Energy Forum, Virtual Event, 9–11 August 2021. [Google Scholar] [CrossRef]
  15. Kadoi, K.; Shinozaki, K. Effect of Chemical Composition on Susceptibility to Weld Solidification Cracking in Austenitic Weld Metal. Metall. Mater. Trans. A Phys. Metall. Mater. Sci. 2017, 48, 5860–5869. [Google Scholar] [CrossRef]
  16. Kah, P.; Vimalraj, C.; Martikainen, J.; Suoranta, R. Factors influencing Al-Cu weld properties by intermetallic compound formation. Int. J. Mech. Mater. Eng. 2015, 10, 10. [Google Scholar] [CrossRef]
  17. Atabaki, M.M.; Nikodinovski, M.; Chenier, P.; Ma, J.; Harooni, M.; Kovacevic, R. Welding of Aluminum Alloys to Steels: An Overview. J. Manuf. Sci. Prod. 2014, 14, 2. [Google Scholar] [CrossRef]
  18. Abdul Karim, M.; Park, Y.D. A Review on Welding of Dissimilar Metals in Car Body Manufacturing. J. Weld. Join. 2020, 38, 8–23. [Google Scholar] [CrossRef]
  19. Liu, J.; Kou, S. Crack susceptibility of binary aluminum alloys during solidification. Acta Mater. 2016, 110, 84–94. [Google Scholar] [CrossRef]
  20. Kou, S. A simple index for predicting the susceptibility to solidification cracking. Weld. J. 2015, 94, 374–388. [Google Scholar]
  21. Kou, S. Welding Metallurgy; John Wiley & Sons, Inc.: Hoboken, NJ, USA, 2002. [Google Scholar] [CrossRef]
  22. Jasthi, B.K.; Kuca, T.S.; Ellingsen, M.D.; Ellis, D.L.; Kandadai, V.A.; Curtis, T.R. Microstructure and mechanical properties of cold spray additive manufactured Cu-Cr-Nb and Fe-Ni-Cr alloys. Addit. Manuf. 2023, 61, 103354. [Google Scholar] [CrossRef]
  23. Kim, S.H.; Lee, H.; Yeon, S.M.; Aranas, C.; Choi, K.; Yoon, J.; Yang, S.W.; Lee, H. Selective compositional range exclusion via directed energy deposition to produce a defect-free Inconel 718/SS 316L functionally graded material. Addit. Manuf. 2021, 47, 102288. [Google Scholar] [CrossRef]
  24. Hofmann, D.C.; Kolodziejska, J.; Roberts, S.; Otis, R.; Dillon, R.P.; Suh, J.O.; Liu, Z.K.; Borgonia, J.P. Compositionally graded metals: A new frontier of additive manufacturing. J. Mater. Res. 2014, 29, 1899–1910. [Google Scholar] [CrossRef]
  25. Reichardt, A.; Shapiro, A.A.; Otis, R.; Dillon, R.P.; Borgonia, J.P.; McEnerney, B.W.; Hosemann, P.; Beese, A.M. Advances in additive manufacturing of metal-based functionally graded materials. Int. Mater. Rev. 2021, 66, 1–29. [Google Scholar] [CrossRef]
  26. Feenstra, D.R.; Banerjee, R.; Fraser, H.L.; Huang, A.; Molotnikov, A.; Birbilis, N. Critical review of the state of the art in multi-material fabrication via directed energy deposition. Curr. Opin. Solid State Mater. Sci. 2021, 25, 1899–1910. [Google Scholar] [CrossRef]
  27. Liu, Z.K. First-principles calculations and CALPHAD modeling of thermodynamics. J. Phase Equilibria Diffus. 2009, 30, 517–534. [Google Scholar] [CrossRef]
  28. Yang, Z.; Jin, Q. Effects of Cr content and electromagnetic stirring on the phase separation of Cu-Cr alloy. Mater. Res. Express 2022, 9, 5. [Google Scholar] [CrossRef]
  29. Munitz, A.; Venkert, A.; Landau, P.; Kaufman, M.J.; Abbaschian, R. Microstructure and phase selection in supercooled copper alloys exhibiting metastable liquid miscibility gaps. J. Mater. Sci. 2012, 47, 7955–7970. [Google Scholar] [CrossRef]
  30. Koutsky, J.; Kletečka, Z. Vacuum arc re-melting and its influence on mechanical properties of steels. Vacuum 1969, 19, 187–189. [Google Scholar] [CrossRef]
  31. Wang, C.P.; Liu, X.J.; Takaku, Y.; Ohnuma, I.; Kainuma, R.; Ishida, K. Formation of core-type macroscopic morphologies in Cu-Fe base alloys with liquid miscibility gap. Metall. Mater. Trans. A Phys. Metall. Mater. Sci. 2004, 35, 1243–1253. [Google Scholar] [CrossRef]
  32. Li, S.; Li, J.Y.; Jiang, Z.W.; Cheng, Y.; Li, Y.Z.; Tang, S.; Leng, J.Z.; Chen, H.X.; Zou, Y.; Zhao, Y.H.; et al. Controlling the columnar-to-equiaxed transition during Directed Energy Deposition of Inconel 625. Addit. Manuf. 2022, 57, 102958. [Google Scholar] [CrossRef]
  33. Kaufman, L.; Ågren, J. CALPHAD, first and second generation—Birth of the materials genome. Scr. Mater. 2014, 70, 3–6. [Google Scholar] [CrossRef]
  34. Kaufman, L.; Bernstein, H. Computer calculation of phase diagrams. With special reference to refractory metals. Met. Powder Rep. 2000, 55, 2004171. [Google Scholar]
  35. Thermo-Calc Software, TCCU Cu-Alloys Database. version 4. Thermo-Calc Software: Stockholm, Sweden, 2023.
  36. Grüner, D.; Ormeci, A.; Kreiner, G. Crystal structure of niobium chromium nickel, Nb(Cr1-xNix)2 (x = 0.49). New Cryst. Struct. 2014, 221, 269–270. [Google Scholar] [CrossRef]
  37. Iams, A.; Lienert, T.; Otazu, D.; Ramoni, M. Effects of deposition sequence on microstructural evolution in additively manufactured Cu-Cr-Nb alloy/superalloy bimetallic structures. Addit. Manuf. Lett. 2023, 6, 100151. [Google Scholar] [CrossRef]
  38. Šlapáková, M.; Zendegani, A.; Liebscher, C.H.; Hickel, T.; Neugebauer, J.; Hammerschmidt, T.; Ormeci, A.; Grin, J.; Dehm, G.; Kumar, K.S.; et al. Atomic scale configuration of planar defects in the Nb-rich C14 Laves phase NbFe2. Acta Mater. 2020, 183, 362–376. [Google Scholar] [CrossRef]
  39. Du, Y.; Liu, S.; Chang, Y.A.; Yang, Y. A thermodynamic modeling of the Cr–Nb–Ni system. Calphad 2005, 29, 140–148. [Google Scholar] [CrossRef]
  40. Kripyakevich, P.I.; Pylaeva, E.N. Crystalline Structures of Some Compounds in the Nb- Ni and Ta-Ni Systems. Sov. Phys. Crystallogr. 1967, 12, 294–296. [Google Scholar]
  41. Nash, P.; Nash, A. The Nb-Ni (Niobium-Nickel) system. Bull. Alloy. Phase Diagrams 1986, 7, 124–130. [Google Scholar] [CrossRef]
  42. Goldschmidt, H.J.; Brand, J.A. The constitution of the chromium-niobium-molybdenum system. J. Less Common Met. 1961, 3, 44–61. [Google Scholar] [CrossRef]
  43. Ohnuma, I.; Saegusa, T.; Takaku, Y.; Wang, C.P.; Liu, X.J.; Kainuma, R.; Ishida, K. Microstructural evolution of alloy powder for electronic materials with liquid miscibility gap. J. Electron. Mater. 2009, 38, 2–9. [Google Scholar] [CrossRef]
  44. Gor, M.; Soni, H.; Wankhede, V.; Sahlot, P.; Grzelak, K.; Szachgluchowicz, I.; Kluczyński, J. A critical review on effect of process parameters on mechanical and microstructural properties of powder-bed fusion additive manufacturing of ss316l. Materials 2021, 14, 6527. [Google Scholar] [CrossRef] [PubMed]
  45. Chen, S.g.; Gao, H.j.; Zhang, Y.d.; Wu, Q.; Gao, Z.h.; Zhou, X. Review on residual stresses in metal additive manufacturing: Formation mechanisms, parameter dependencies, prediction and control approaches. J. Mater. Res. Technol. 2022, 17, 2950–2974. [Google Scholar] [CrossRef]
  46. Okamoto, H. Phase Diagrams for Binary Alloys; ASM International: Materials Park, OH, USA, 2010. [Google Scholar]
Figure 1. Optical micrographs of (a) 15 wt.% GRCop42, (b) cracking at the top of 30 wt.% GRCop42, (c) 50 wt.% GRCop42, (d) 60 wt.% GRCop42, (e) porosity 75 wt.% GRCop42, (f) cracking in 85 wt.% GRCop42, and (g) 95 wt.% GRCop42. For the etched samples (c,d,g), dark regions are Cu-rich while gray regions are Cu-deprived. The bold numbers at the top right of each micrograph correspond to the wt.% of GRCop42.
Jmmp 08 00042 g001
Figure 2. SEM-EDS maps of (a) the Cu-rich region of the 75 wt.% GRCop42 sample and (b) the 50 wt.% GRCop42 sample. The bold number to the top right corresponds to the wt.% of GRCop42.
Jmmp 08 00042 g002
Figure 3. XRD spectrum of (a) the 75 wt.% GRCop42 Cu-rich region and (b) 50 wt.% GRCop42. Both spectra show only FCC peaks.
Jmmp 08 00042 g003
Figure 4. STEM-EDS maps showing the (a) HCP C14-Laves in the 85 wt.% GRCop42 Cu-deprived region along with (b) the corresponding SAD pattern in the [201] zone axis, (c) FCC NiNb5 phase in the 95 wt.% GRCop42 Cu-deprived region along with (d) the corresponding SAD pattern in the [102] zone axis, and BCC α Mo-Nb-Cr phase in the 95 wt.% GRCop42 Cu-deprived region with (e) the corresponding SAD pattern in the [314] zone axis. The arrows in (a,c,e) point to the location of SAD pattern collection. The circled spots in (d) are attributed to double diffraction.
Jmmp 08 00042 g004
Figure 5. EBSD phase maps of the Cu-deprived region in the (a) 60, (b) 70, (c) 75, (d) 85, (e) 90, and (f) 95 wt.% GRCop42 samples. The bold number in the top left corner of each image corresponds to the wt.% of GRCop42. The table below each image shows the area fraction of the present phases. For (e,f) the area fraction is normalized to exclude the entrapped Cu FCC phase.
Jmmp 08 00042 g005
Figure 6. Vickers microhardness of the Cu-deprived region and Cu-rich region from Table 2 and overlaid onto phase volume fractions from Figure 5.
Jmmp 08 00042 g006
Figure 7. Equilibrium modeling of phase volume fractions as a function of (a) GRCop42 wt.% at each composition’s liquidus and as a function of temperature at (b) 30 wt.% GRCop42, (c) 50 wt.% GRCop42, and (d) 70 wt.% GRCop42. For (a), the estimated volume fraction of the Cu-deprived region from Table 2 was overlaid.
Jmmp 08 00042 g007
Figure 8. Illustration of proposed miscibility gap failure mechanisms in Inconel 625–GRCop42 mixtures.
Jmmp 08 00042 g008
Table 1. Composition of GRCop42 powder and Inconel 625 wire feedstock. All elements were determined by optical emission spectroscopy. All values in weight percent.
AlloyNiCrNbTaMoCuTiFeAlSiOther
Inconel 62564.822.23.498.60.0160.210.260.140.090.194
GRCop42-3.32.7--Bal-----
Table 2. Summary of observed morphology, defects, and calculated Cu-deprived volume fraction per sample. The methodology for volume fraction calculations is provided in Appendix A.
SampleMicrostructure MorphologyMacro DefectsCu-Dep. Amount
wt.% GRCop42 vol. frac.
15Dendritic solid solutionNone1
30Cu-deprived dendrites with Cu-rich interdendritic regionsCracking at top of part0.79
50""0.55
60Cu-deprived spherical region and Cu-deprived dendrites in Cu-rich matrixPorosity in Cu-deprived spherical regions0.27
70Cu-deprived spherical region in Cu-rich matrixPorosity and cracking in Cu-deprived region0.16
75""0.14
85""0.07
90""0.05
95""0.02
Table 3. STEM-EDS measured elemental compositions of phases in the 85 and 95 wt.% GRCop42 samples.
SamplePhaseCuNiCrMoNb
wt.% GRCop42 wt.%wt.%wt.%wt.%wt.%
85HCP C14-Laves-34.9 ± 3.119.9 ± 1.815.3 ± 4.629.8 ± 2.7
95HCP C14-Laves-22.6 ± 2.118.2 ± 1.75.9 ± 1.8453.2 ± 5.3
95FCC NiNb5-18.2 ± 1.813.1 ± 1.3-68.7 ± 6.8
95BCC α
Mo-Nb-Cr
-1.0 ± 0.14.5 ± 0.449.9 ± 4.644.6 ± 4.7
Disclaimer/Publisher’s Note: The statements, opinions and data contained in all publications are solely those of the individual author(s) and contributor(s) and not of MDPI and/or the editor(s). MDPI and/or the editor(s) disclaim responsibility for any injury to people or property resulting from any ideas, methods, instructions or products referred to in the content.

