Article

Identification of the Optimal Blank Holder Force through In-Line Measurement of Blank Draw-In in a Deep Drawing Process

by
Maria Emanuela Palmieri
,
Andrea Nono Dachille
and
Luigi Tricarico
*
Department of Mechanical, Mathematic and Management Engineering, Politecnico di Bari, 70125 Bari, Italy
*
Author to whom correspondence should be addressed.
J. Manuf. Mater. Process. 2023, 7(6), 190; https://doi.org/10.3390/jmmp7060190
Submission received: 7 October 2023 / Revised: 22 October 2023 / Accepted: 23 October 2023 / Published: 24 October 2023

Abstract

:
During the forming process, variations in noise parameters can negatively impact product quality. To prevent waste from these fluctuations, this study suggests a method for the in-line optimisation of the deep drawing process. The noise parameter considered is the friction coefficient, assuming the variability in lubrication conditions at the blank–tool interface. The proposed approach estimates the noise factor variability during the process by tracking the draw-in of the blank at critical points. Using this estimation, the optimal blank holder force (BHF) is calculated and then adjusted in-line to modify blank sliding and prevent critical issues on the component. For this purpose, a Finite Element (FE) model of a deep drawing case study was developed, and numerical simulation results were used to construct surrogate models while estimating both the friction coefficient and optimal BHF. The FE model’s predictive capability was verified through preliminary experimental tests, and the control logic was numerically validated. Results show the effectiveness of this control type. By adjusting the BHF just once, a defect-free component is achieved. This method overcomes the limitations of feedback controls, which often need multiple adjustment steps. The time required to estimate the friction coefficient and the maximum time available for adjusting the BHF without causing defects was identified.

1. Introduction

The sheet-metal-forming industry is increasingly exploring the adoption of Industry 4.0 practices to enhance productivity and product quality [1,2,3].
In large-scale production, despite executing a process with optimised design parameters, the final component does not always meet quality specifications. This discrepancy arises from uncontrollable fluctuations in the process.
Fluctuations can be associated with alterations in material properties, blank thickness, or changes in the dimensions of the cut blank [3,4,5,6]. Harsch [7] conducted a study on the influence of these fluctuations on the production of kitchen sinks. The research brought to light differences in material properties of blanks purchased from various suppliers.
Another source of process uncontrollable fluctuation is related to the variation in lubrication conditions. This happens when there is a temperature rise due to the plastic work, when lubrication is non-uniformly applied on the blank surface, or when there is residual lubricant on the tools [5,8,9,10].
The presence of these fluctuation leads to prolonged try-out phases and increased scrap rates. Effectively controlling these production variations becomes a major challenge for the robust and cost-effective design of relevant series forming processes [11,12,13]. In this regard, various research endeavours have led to the development and continuous improvement of process monitoring strategies and active control systems for forming processes. Most of these studies were conducted to the deep drawing process, for which the most significant design parameter is the blank holder force [14,15]. By adjusting this force, it is possible to prevent defects typically related to formability issues (wrinkles, thinning, and splits) or cosmetic defects (surface deflections) [16].
Several studies [17,18,19,20] proposed a feedforward control for minimising the effect of process fluctuations. Several practical solutions were explored for measuring noise parameters in this type of control. For instance, Fisher et al. [17,18,19] measured the material properties using an eddy current system and the blank thickness via laser triangulation sensors.
To attain a reproducible and automated adjustment of the process, many authors proposed implementing a feedback-type control systems [21,22,23,24,25,26,27,28,29]. In this type of control, it is crucial to identify a parameter for in-line monitoring, such as the sliding of the blank. This parameter is compared with its reference value obtained under ideal conditions. Based on the difference between these two values, the necessary adjustment for the main control variable, typically the blank holder force, is determined.
Feedback control demands detection, fast and efficient evaluation, decision making, and actuation during the process. In the case of the deep drawing process, this processing cycle is usually very quickly, and implementing feedback control might be impractical if the press used does not meet certain specifications [30].
For this reason, the main idea of this study is to verify the possibility to avoid feedback control. To achieve this, the approach is to vary the blank holder force not based on the instant-by-instant difference between the optimal and measured draw-in, but rather by directly imposing the optimal blank holder force in the new working conditions. Since the previous work [29] revealed that the most significant noise factor is the friction coefficient, this study considers a process variability only related to the friction coefficient. The new working conditions are consequently linked only to the fluctuation in lubrication conditions at the blank-tool interface.
Starting from database associating the blank sliding to the effective friction coefficient and the optimal blank holder force corresponding to a friction coefficient, the new process condition is in-line estimated on the basis of the draw-in measurements. The approach is comparable to implementing an internal press-side feedforward control. Unlike the traditional feedforward process in which the friction coefficient is estimated before the stamping operation, in the control type proposed in this study, the friction coefficient is estimated from the draw-in measurements and are thus assessed in line during the forming operation.
The databases in this study were obtained through numerical simulation plans, and the results were used to develop meta-models (surrogate models) capable of estimating the friction coefficient based on the blank sliding and the optimal blank holder force based on the previous estimated friction coefficient.
The obtained results demonstrate that by directly setting the blank holder force to the optimal value in the new working conditions, there is no need to adopt a feedback control. However, this holds true if this type of control is executed within a certain processing time.

2. Materials and Methods

During the forming process, the fluctuation of noise parameter adversely affects product quality. To avoid the consequent waste increase, this work proposes a methodology for the in-line optimisation of the deep drawing process in the case of an uncontrollable variation in lubrication conditions.
The proposed solution involves the use of sensors capable of measuring during the forming process the displacement of some points of the blank and based on these draw-in trends, defining both the new value of the friction coefficient acting at the tool–blank interface and the new corresponding optimal condition that guarantees a defect-free part. This new optimal condition is obtained by adjusting the blank holder force that acts as a process actuator.
The activity was performed on a case study, i.e., a T-shaped component obtained starting from a blank in DC05 steel with a thickness of 0.75 mm, measuring 450 mm × 680 mm. The case study component is shown in Figure 1.
The steel DC05 was chosen since it exhibits excellent deep drawing capability thanks to its good deformation behaviour. Combined with very high elongation values (of about 40% [31,32]), this steel offer a yield strength ranging from 140 MPa to 180 MPa [31,32] and a tensile strength ranging from 270 MPa to 330 MPa [31,32].
The methodology adopted for this study is summarised in Figure 2.
In detail:
  • First, experimental tests were carried out to assess the blank draw-in acquisition system’s capabilities to determine the optimal design conditions and to examine how alterations in lubrication conditions impact the quality indices of the stamped component.
  • Second, a Finite Element (FE) model of the deep drawing process was developed and then calibrated using experimental results. The calibrated FE model was employed to perform numerical simulation plans aimed at establishing the process knowledge in form of database. Database were used to develop surrogate models for estimating the friction coefficient acting at the blank–tool interface and the blank holder force, both of which assure the satisfaction of the part quality indices.
  • Finally, for the validation of the control strategy, the numerical model was used as a digital twin of the physical press machine. Specifically, the adjusted value of the blank holder force was set in the numerical model, while the blank draw-in and the part quality indices were measured to check the correspondence with the expected draw-in and the fulfilment of quality criteria.
In the following subsections, a more detailed explanation of these points is provided.

2.1. Experimental Deep Drawn Test

The experimental deep drawing tests were realised using a 3000 kN hydraulic press machine (Figure 3a), designed by the company GIGANT Italia as part of the MIUR PICO&PRO project (COD.ID.ARS01_01061). The press is equipped with a passive blank holder that is moved by a hydraulic actuator with a maximum force of 1000 kN and a latency time of 100 ms.
During the experimental tests, laser triangulation sensors (LK-G5000 Keyence, Osaka, Japan) were used for the experimental acquisition of blank draw-in in the tools (Figure 3b). These sensors were strategically placed at points A, B, and C, as previously indicated in Figure 1. With a sampling speed of 392 kHz, an accuracy level within ±0.02%, and a repeatability of 0.01 µm, these sensors allowed for precise measurements throughout the in-line process. For controlling the draw-in measurements, a 100 Mbps Ethernet communication interface was ultimately selected to connect the laser triangulation sensors to a Siemens S7-1500 Programmable Logic Controller (PLC) with CPU 1515T-2 PN.
Preliminary tests were carried out with varying the blank holder forces (BHFs) and the drawing depths (p) with the aim of determining their optimal values range that avoid defects on the part. For the case of study, as already highlighted in the studies by Palmieri et al. [28,29], the main defects are cosmetic and formability defects.
Finally, to assess the effects of friction coefficient variability during the deep drawing operation, tests were realised under optimal process conditions (BHFopt* and popt*), with variations in lubrication conditions at the blank–tool interface. For example, to test the effect of a significant decrease in the friction coefficient, a black nylon sheet was placed between the blank and the tools (Figure 3b).

2.2. FE Modelling of the Process

The FE modelling of the deep drawing process for the case study component was performed using AutoForm®R10 software.
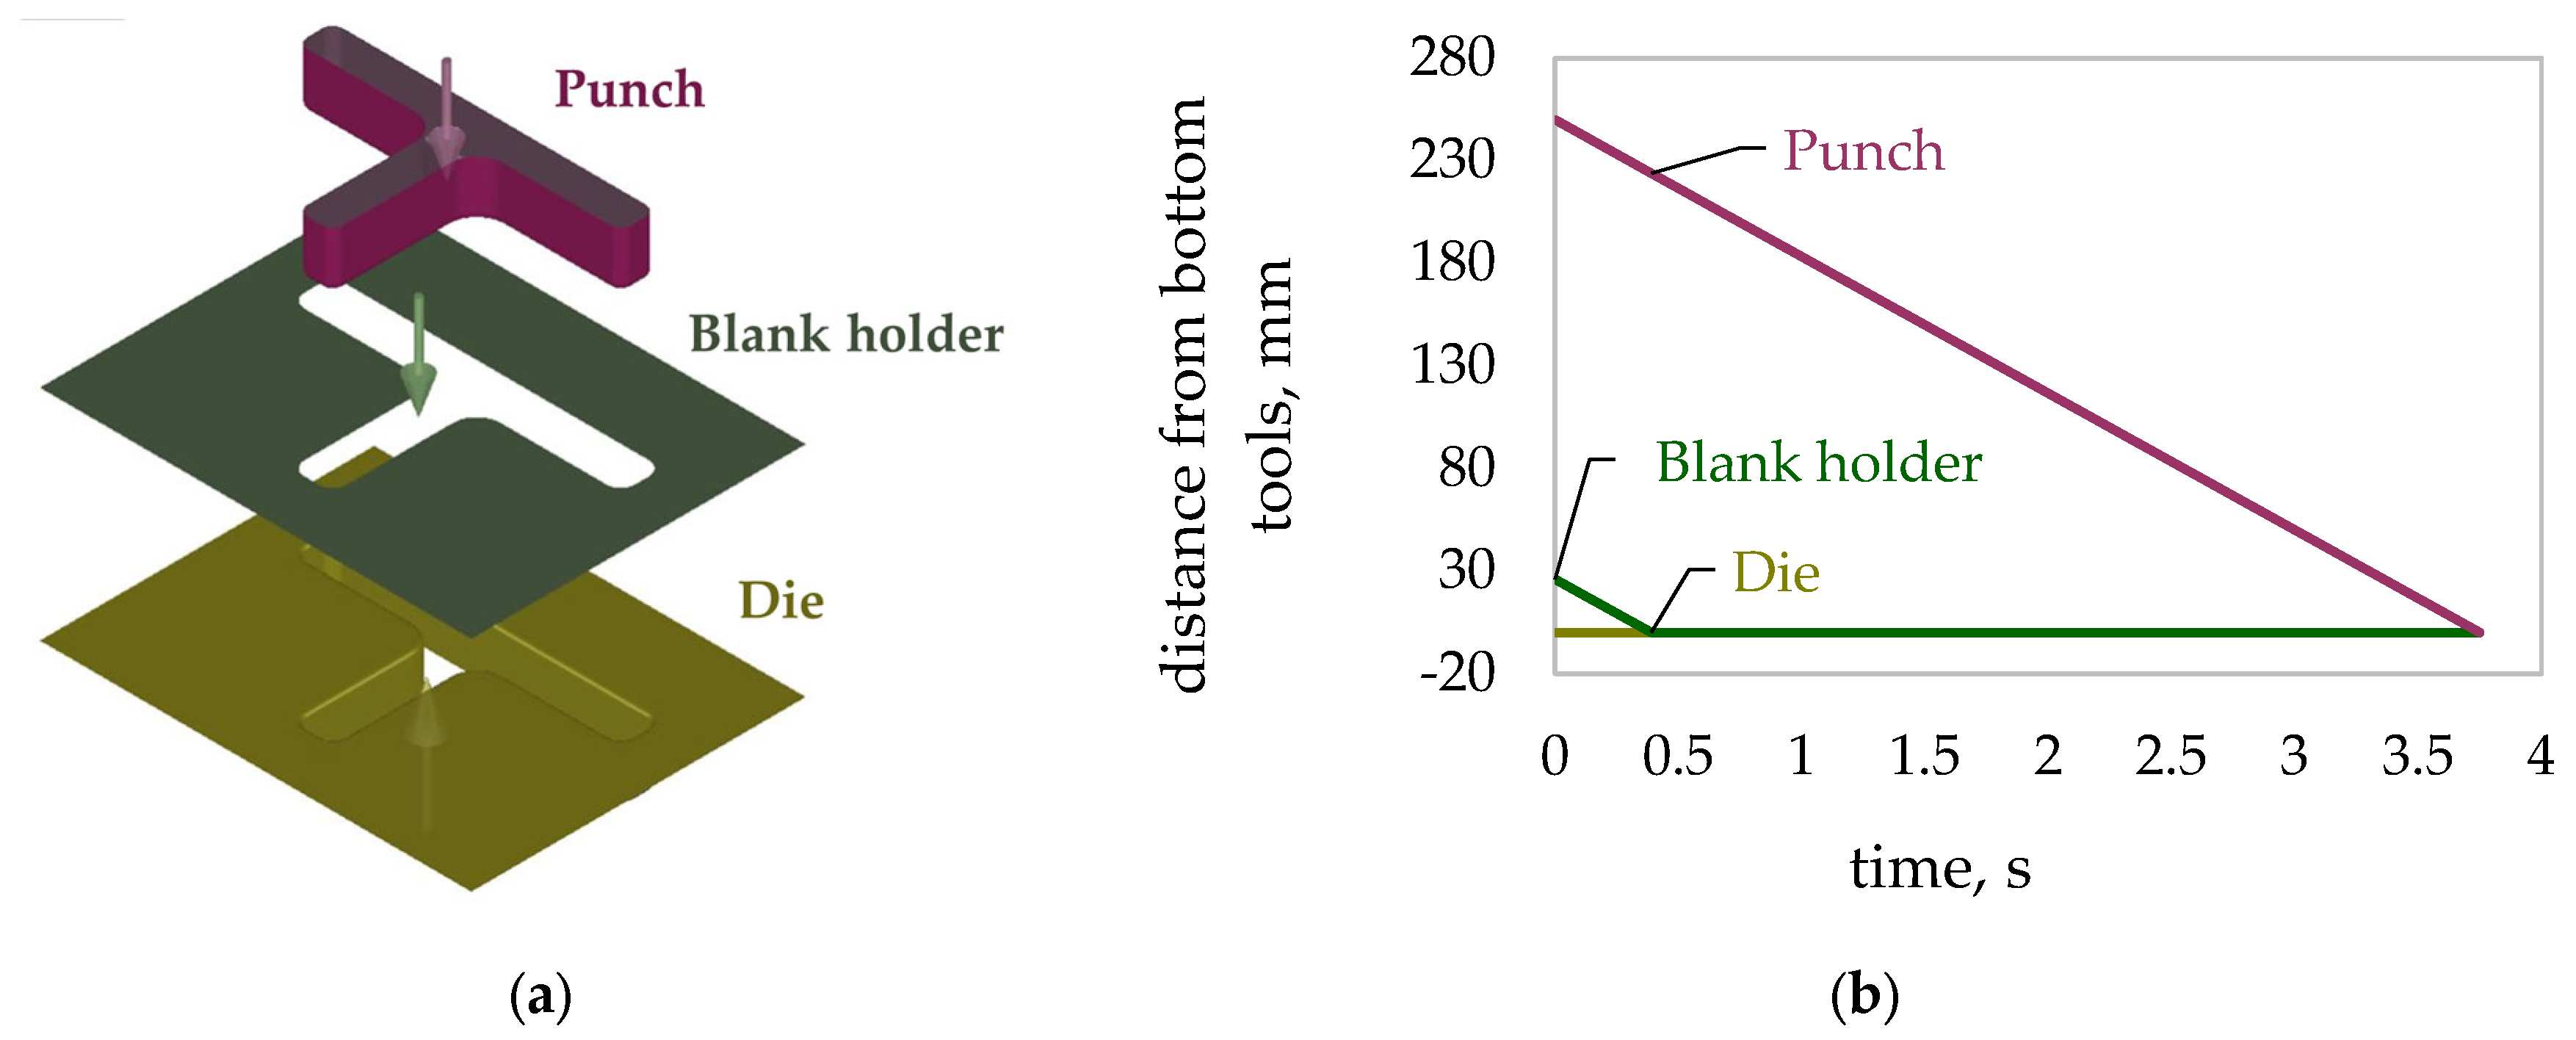
The surfaces of the tools (punch, die, and blank holder) were modelled in an external CAD (Computer-aided Design) and then imported into the FE software (https://www.autodesk.com.hk/solutions/finite-element-analysis, accessed on 6 October 2023). These tool surfaces are shown in Figure 4a. The punch (upper tool) and the die (lower tool) were defined as rigid bodies. Instead, the blank holder was set as a force-controlled tool. A uniform force distribution on the blank holder was assumed. Moreover, it was configured for the blank holder to make contact with the upper surface of the blank.
A schematic of the tooling kinematics is illustrated by the graph in Figure 4b. In particular, during the process, the die remains stationary, and the blank holder moves until it comes into contact with the blank, while the punch moves at a set velocity of 8 mm/s from the top at dead centre until it reaches the specified drawing depth on the component.
For the lubrication conditions, an enhanced Coulomb friction model, that includes stick slip modelling, was adopted. During sliding, a braking force is applied to the sheet nodes that is proportional to both the contact pressure and to the defined coefficient of friction. Should the sliding speed drop below a threshold value, sticking is assumed, and the braking force is reduced in such a manner that it does not cause a reverse displacement of the nodes.
The numerical simulations were carried out with the blank with a thickness of 0.75 mm. The blank thickness was modelled with 11 layers of elastic-plastic shell elements. The initial size of the element was set at 0.31 mm, while during the drawing process, six refinement levels guarantees an adaptative fine mesh in the most deformed areas of the blank.
For the simulations, the Autoform material card for DC05 steel was used [33], with the properties set as follows: Young’s modulus at 210 GPa, Poisson’s ratio at 0.3, yield strength at 145.9 MPa, and ultimate tensile strength at 285.5 MPa. Hill48 yield criteria was adopted for defining the yield surface. The plastic strain ratio with respect to 0°, 45°, and 90° of rolling direction were set, respectively, equal to 1.86, 1.47, and 2.46. Moreover, the combined Swift Hockett–Sherby hardening model was used.
To numerically implement the control logic, using the developed FE model, two numerical simulation plans were realised. In the first simulation plan, the blank holder force was set to the optimal value, and the friction coefficient was varied in the range of 0.05 to 0.15 with an increment of 0.02. The results of this set of simulations were analysed in terms of draw-in at points A, B, and C. These data are used to develop the surrogate model for the prediction of the friction coefficient.
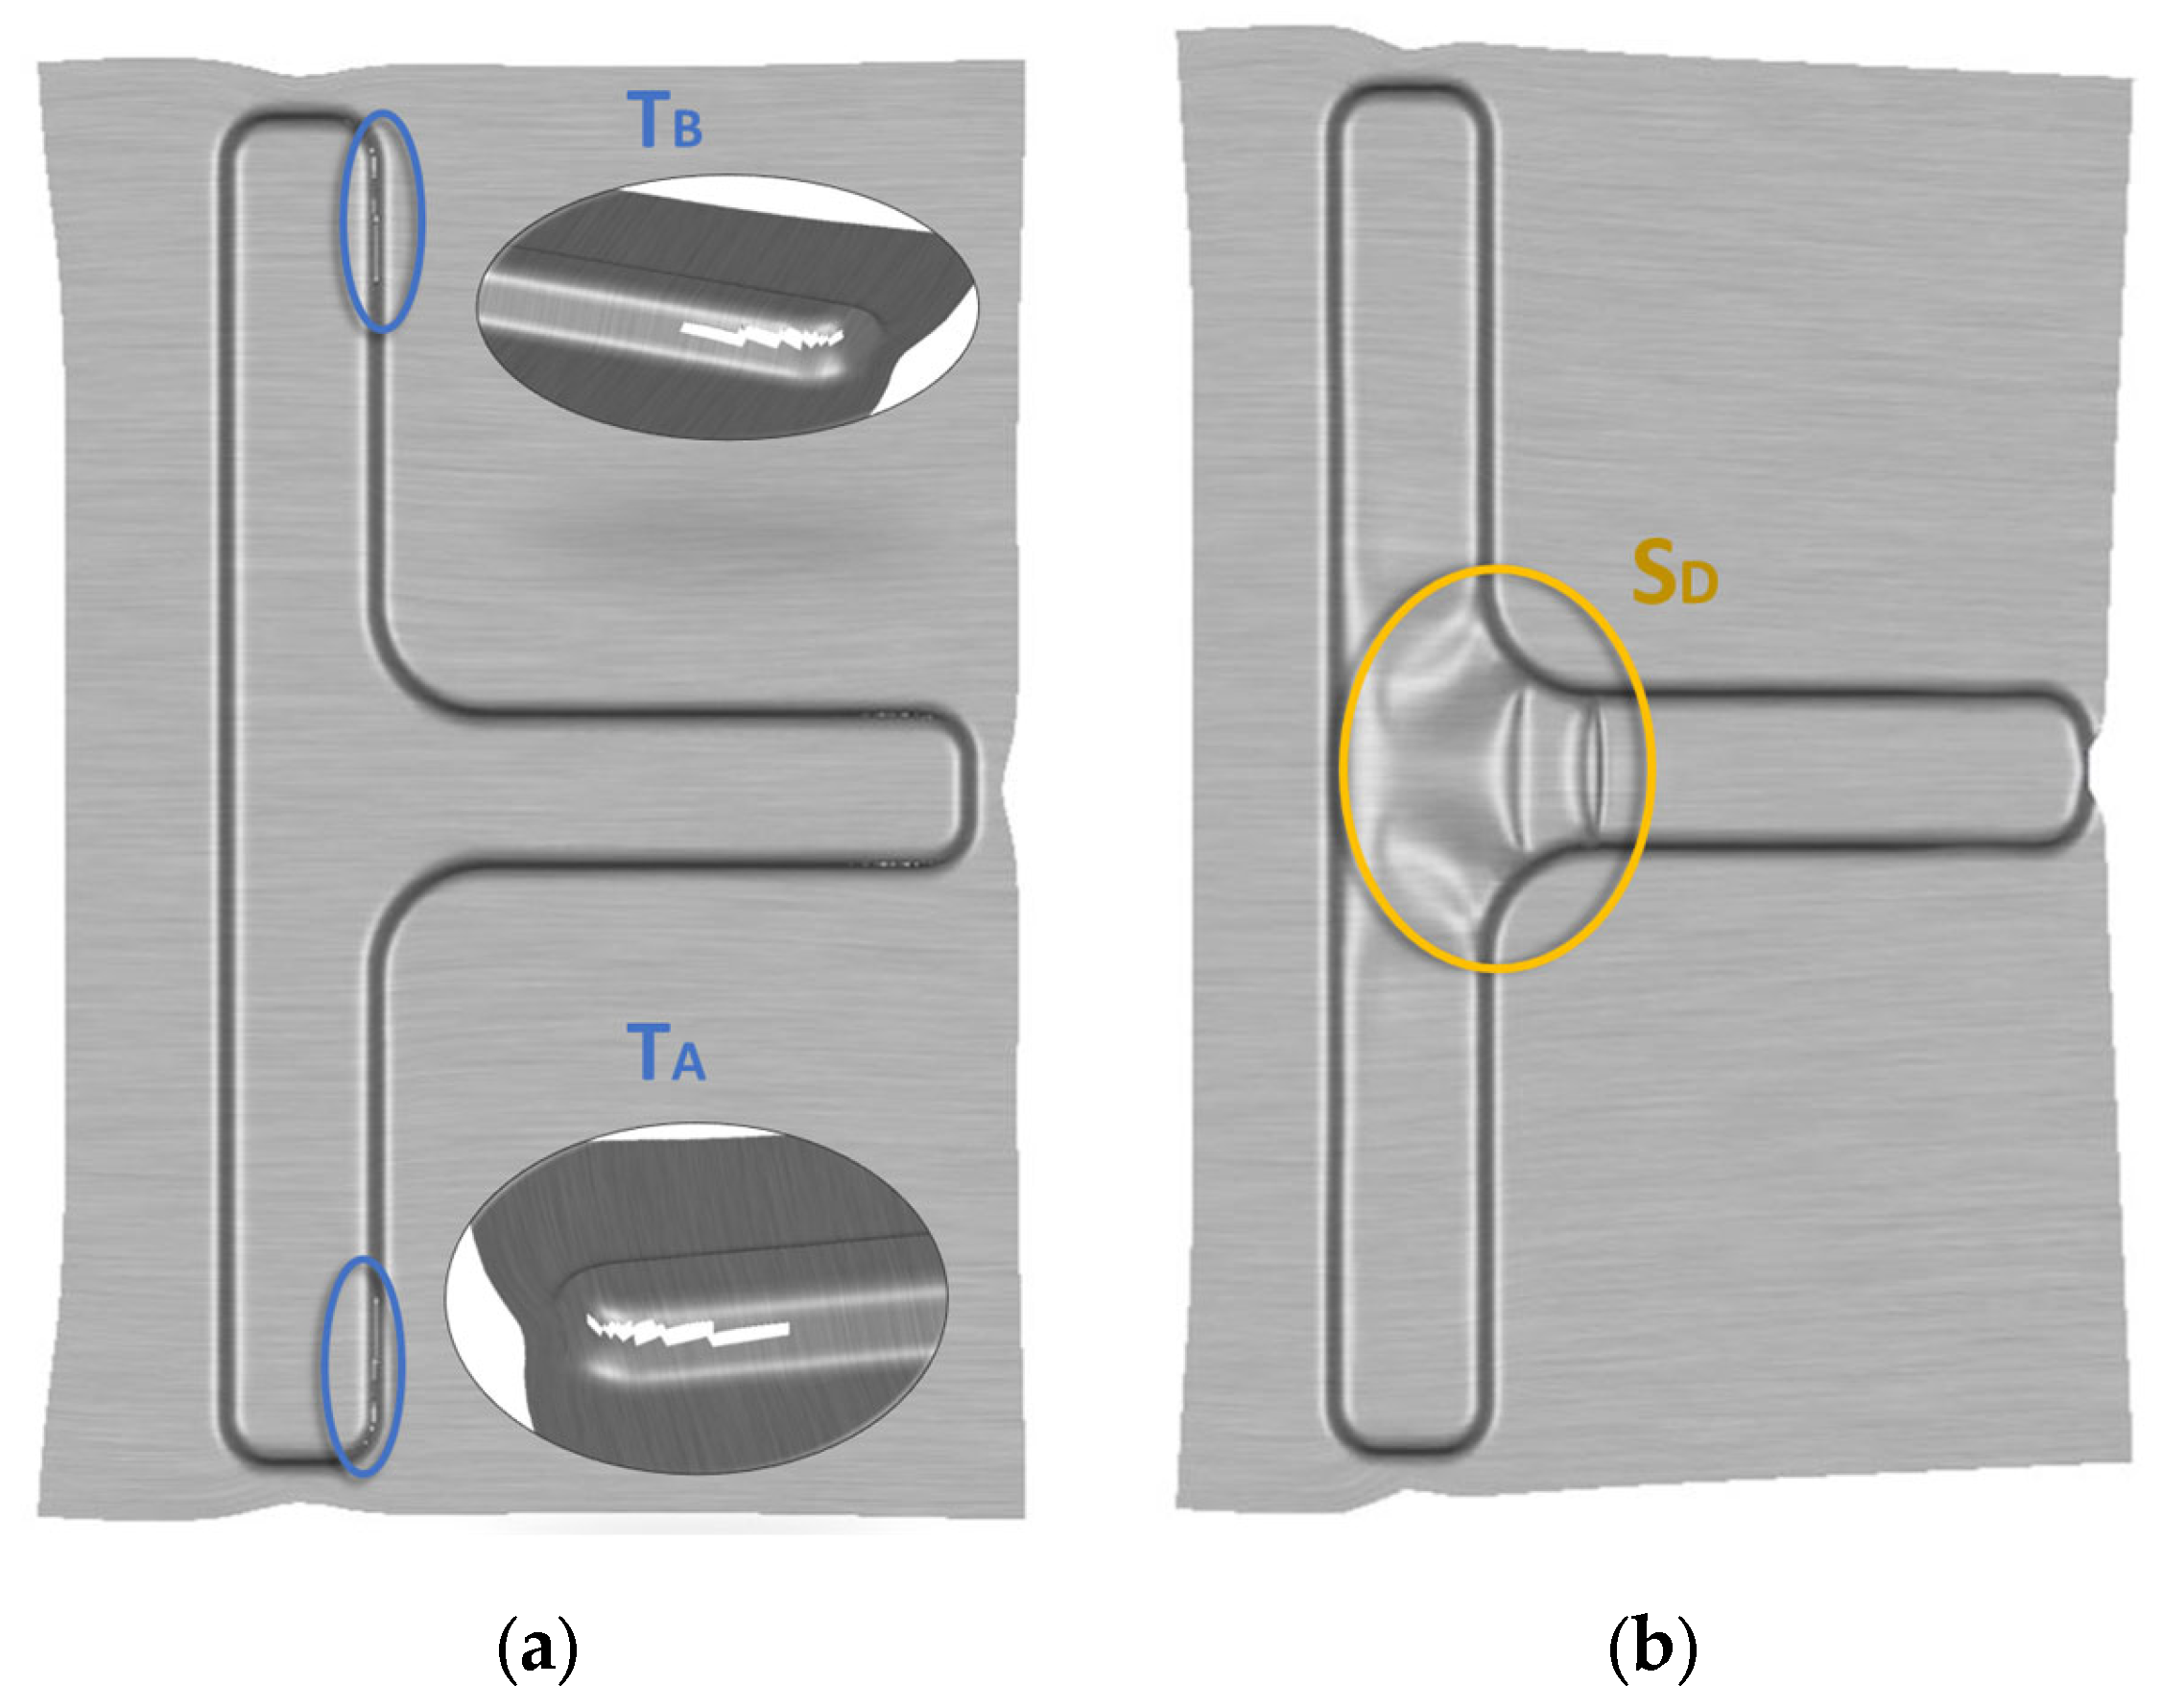
In the second simulation plan, for each friction coefficient, the blank holder force was varied. For each simulation, data on the thinning percentage in regions prone to formability issues (regions TA and TB in Figure 5a) and data on the maximum curvature of the component’s surface in the region with cosmetic defects (region SD in Figure 5b) were recorded. The objective of this simulation set is to estimate the optimal blank holder force that ensures a defect-free component. This force will be used when the process control estimates a friction coefficient different from that under optimal conditions, such as when a change in lubrication conditions has occurred.

2.3. Surrogate Models and Numerical Implementation of the Control Logic

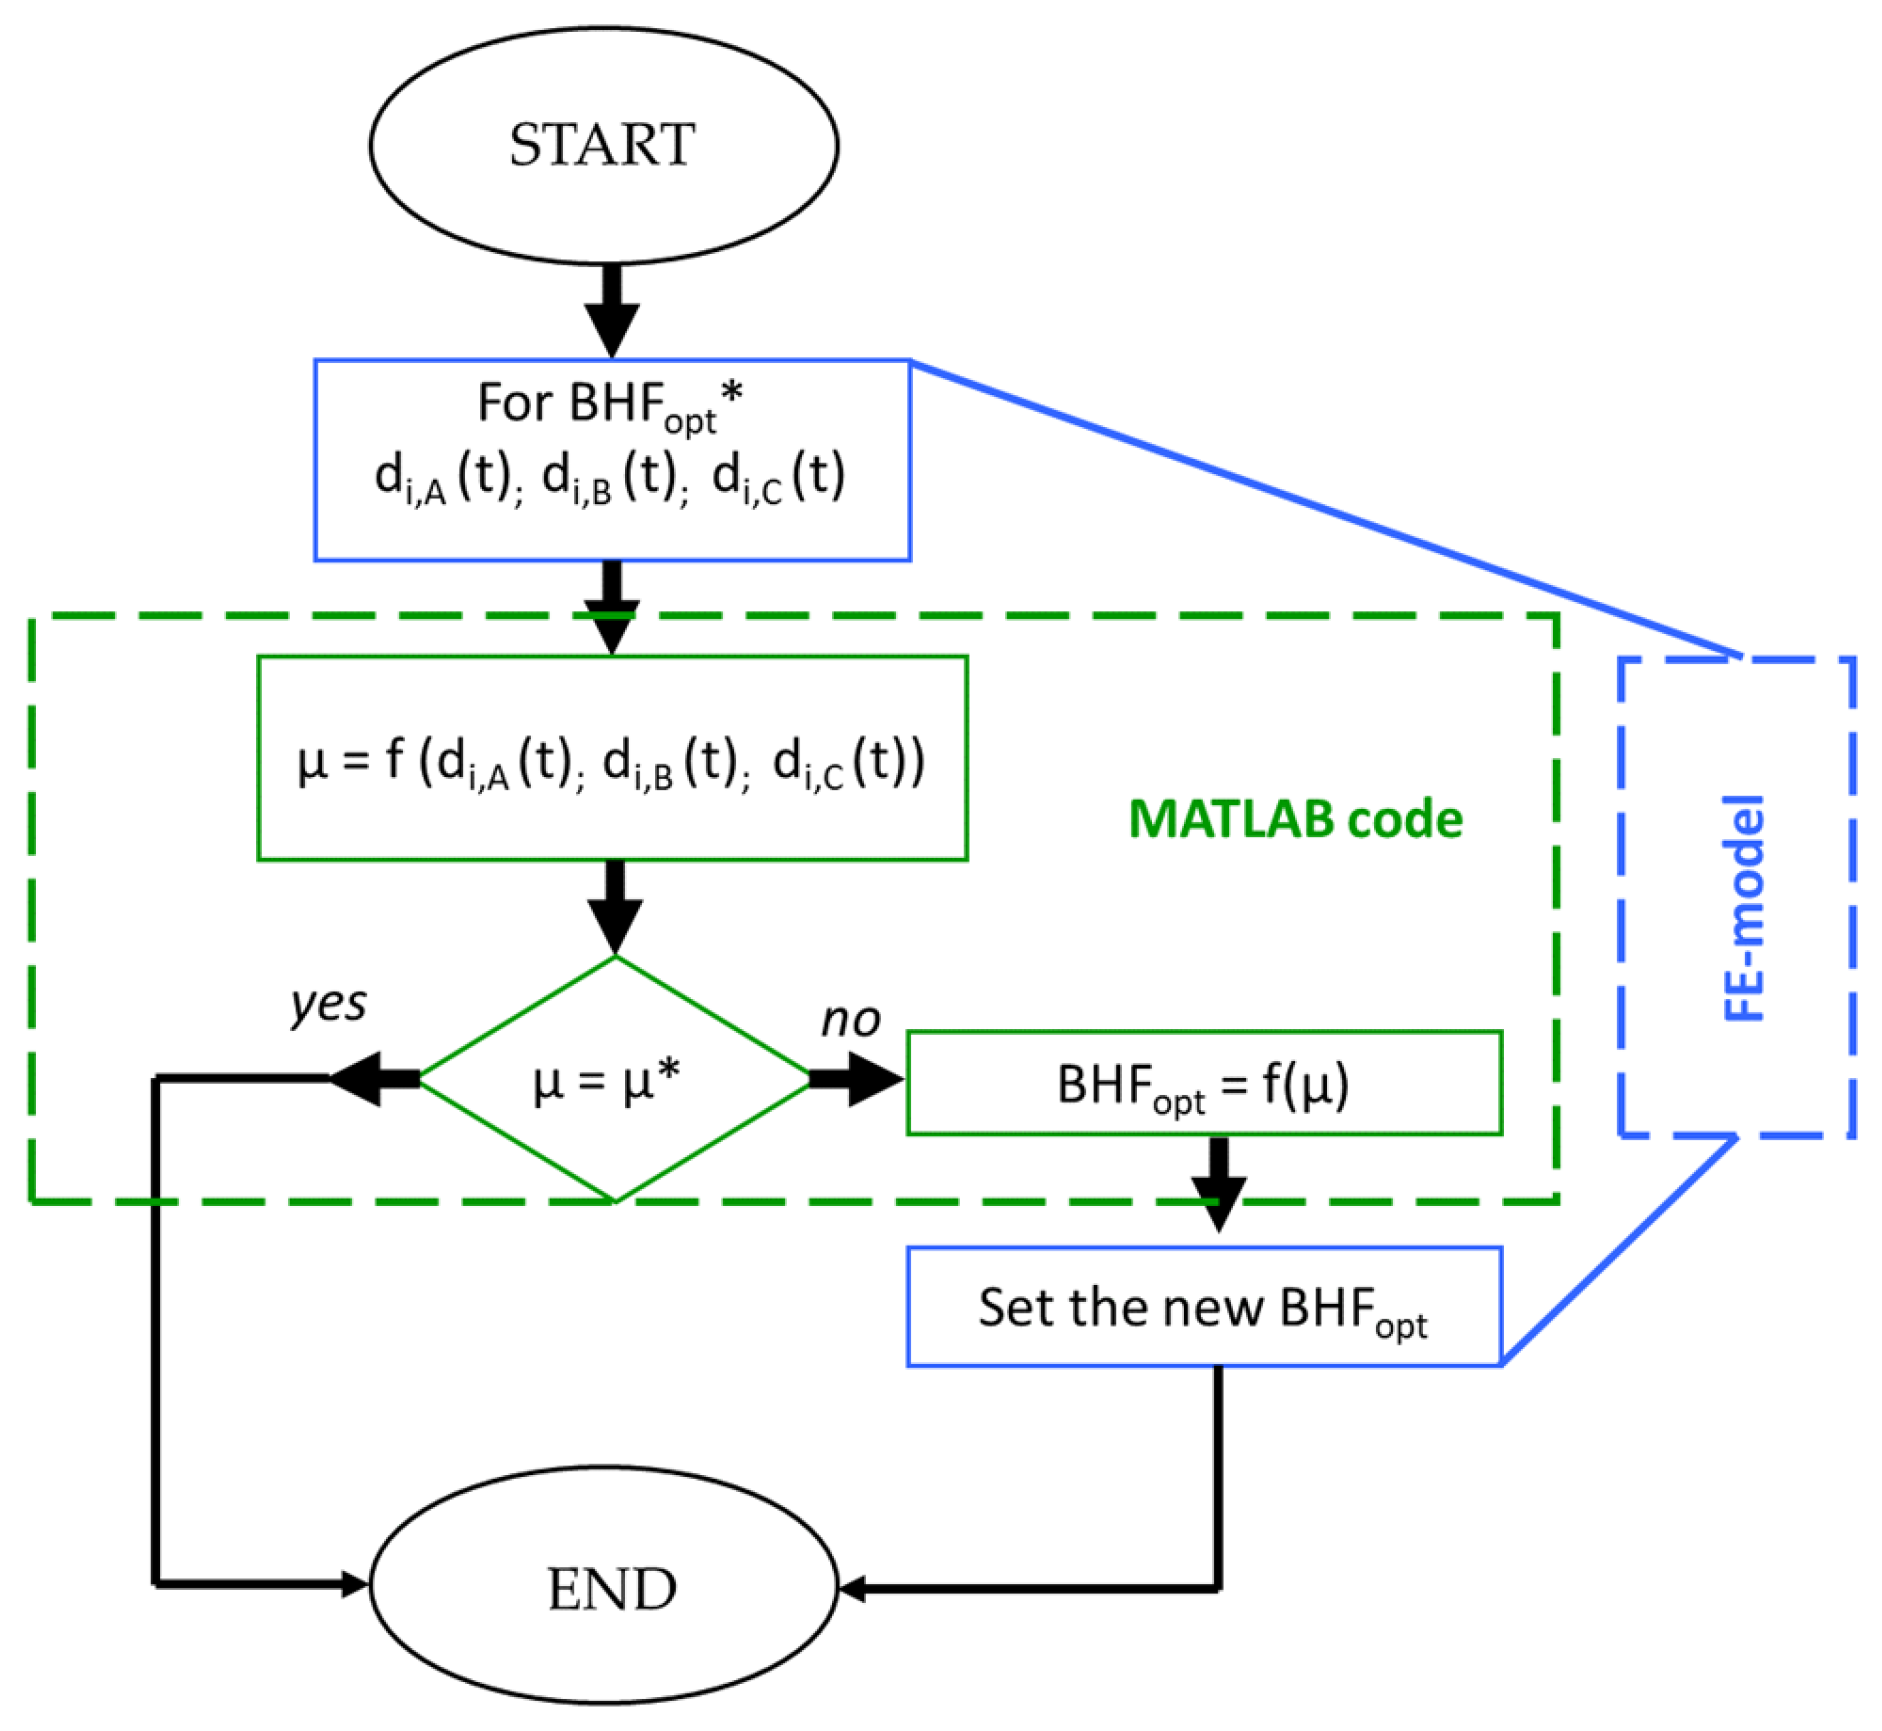
Using the kriging technique [34], the surrogate models were developed in MATLAB. These surrogate models are mathematical functions that correlates the friction coefficient with the blank sliding at the three points (µ = f(di,A, di,B, di,C)) and the blank holder force with the friction coefficient (BHFopt = f(µ)). This mathematical formulation allowed for implementing the control logic described in the flowchart in Figure 6.
Specifically, the sliding values of the blank in the three points are acquired. Using the meta-model that relates µ to draw-in values, the friction coefficient is estimated. When it matches the design value (µ*), the stamping operation proceeds with the designed blank holder force (BHFopt*). Otherwise, a new optimal blank holder force (BHFopt) is estimated and used to continue the deep drawing operation.
This control logic was numerically implemented by combining the capabilities of the developed FE model and the code written in MATLAB.

3. Results and Discussion

3.1. Experimental Results and Comparison with FE Results

During experimental tests, the blank holder force was varied between 350 kN and 650 kN, while the drawing depth was varied between 20 mm and 30 mm. The increments for the blank holder force and drawing depth were set at 25 kN and 5 mm, respectively. The upper limit of the blank holder force range was set at 650 kN based on findings from the authors’ previous research [29], which established that exceeding this threshold led to splits in the critical areas. During the tests, great care was taken to consistently position the blank at the same distance from the laser triangulation sensors and to uniformly lubricate the blank before each operation. This attention aimed to reduce result variability.
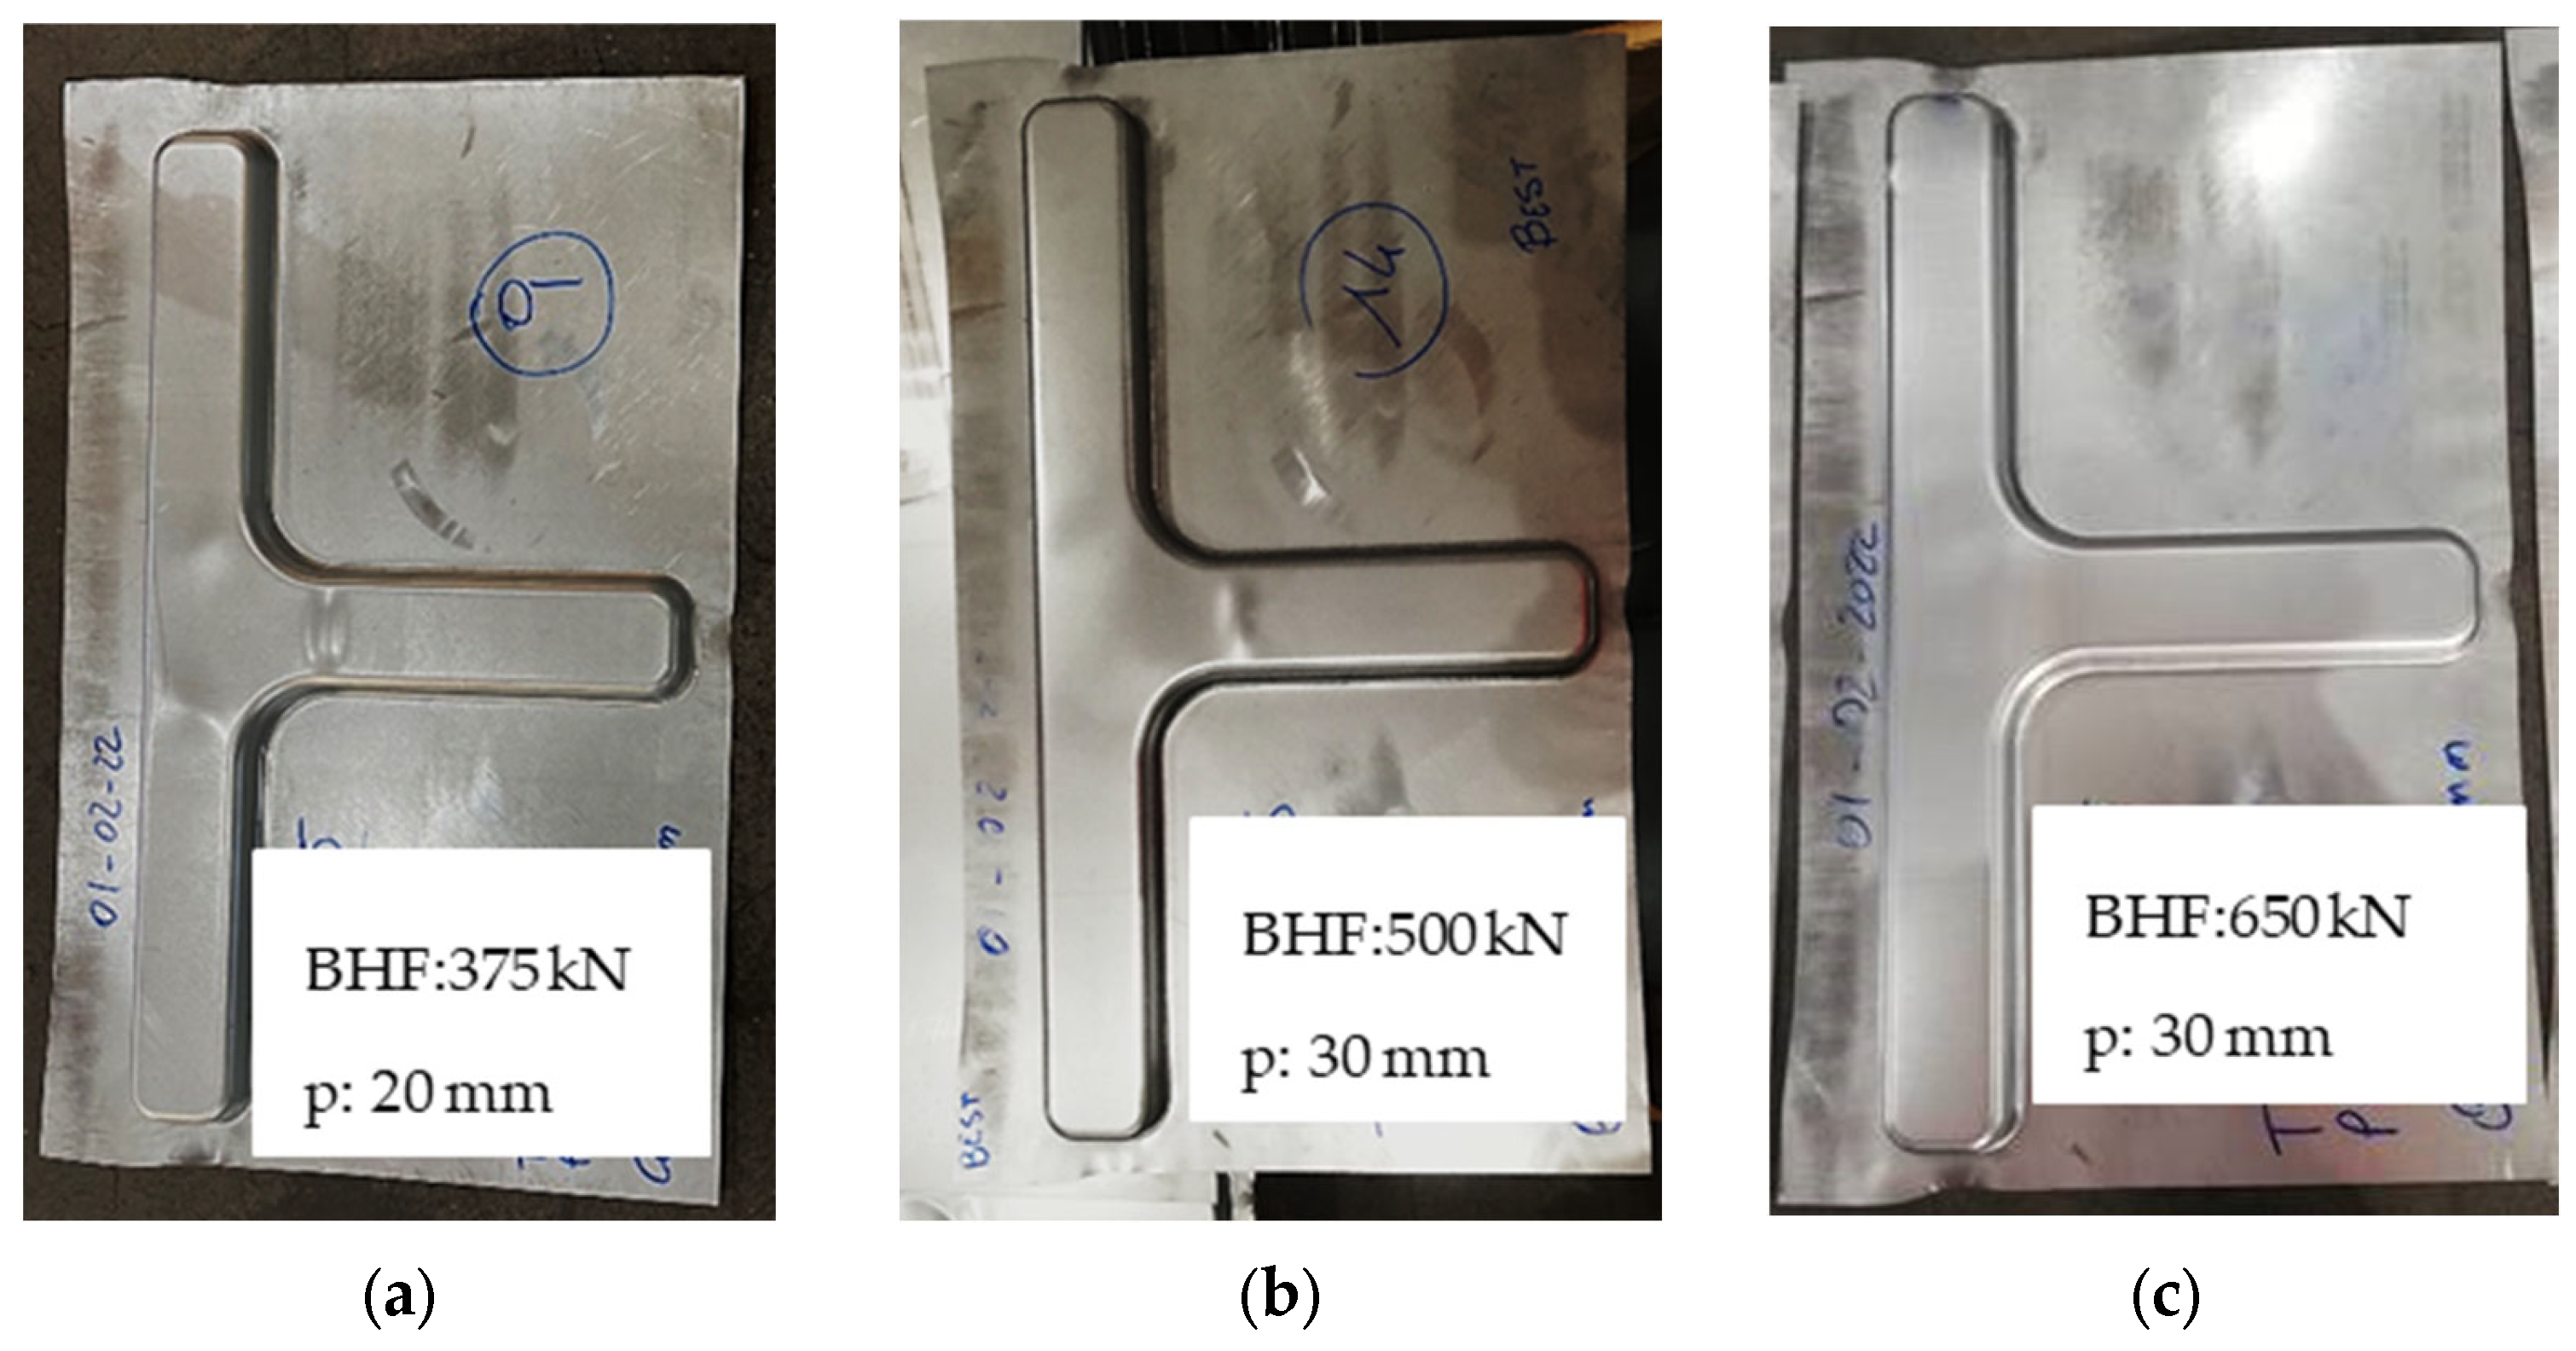
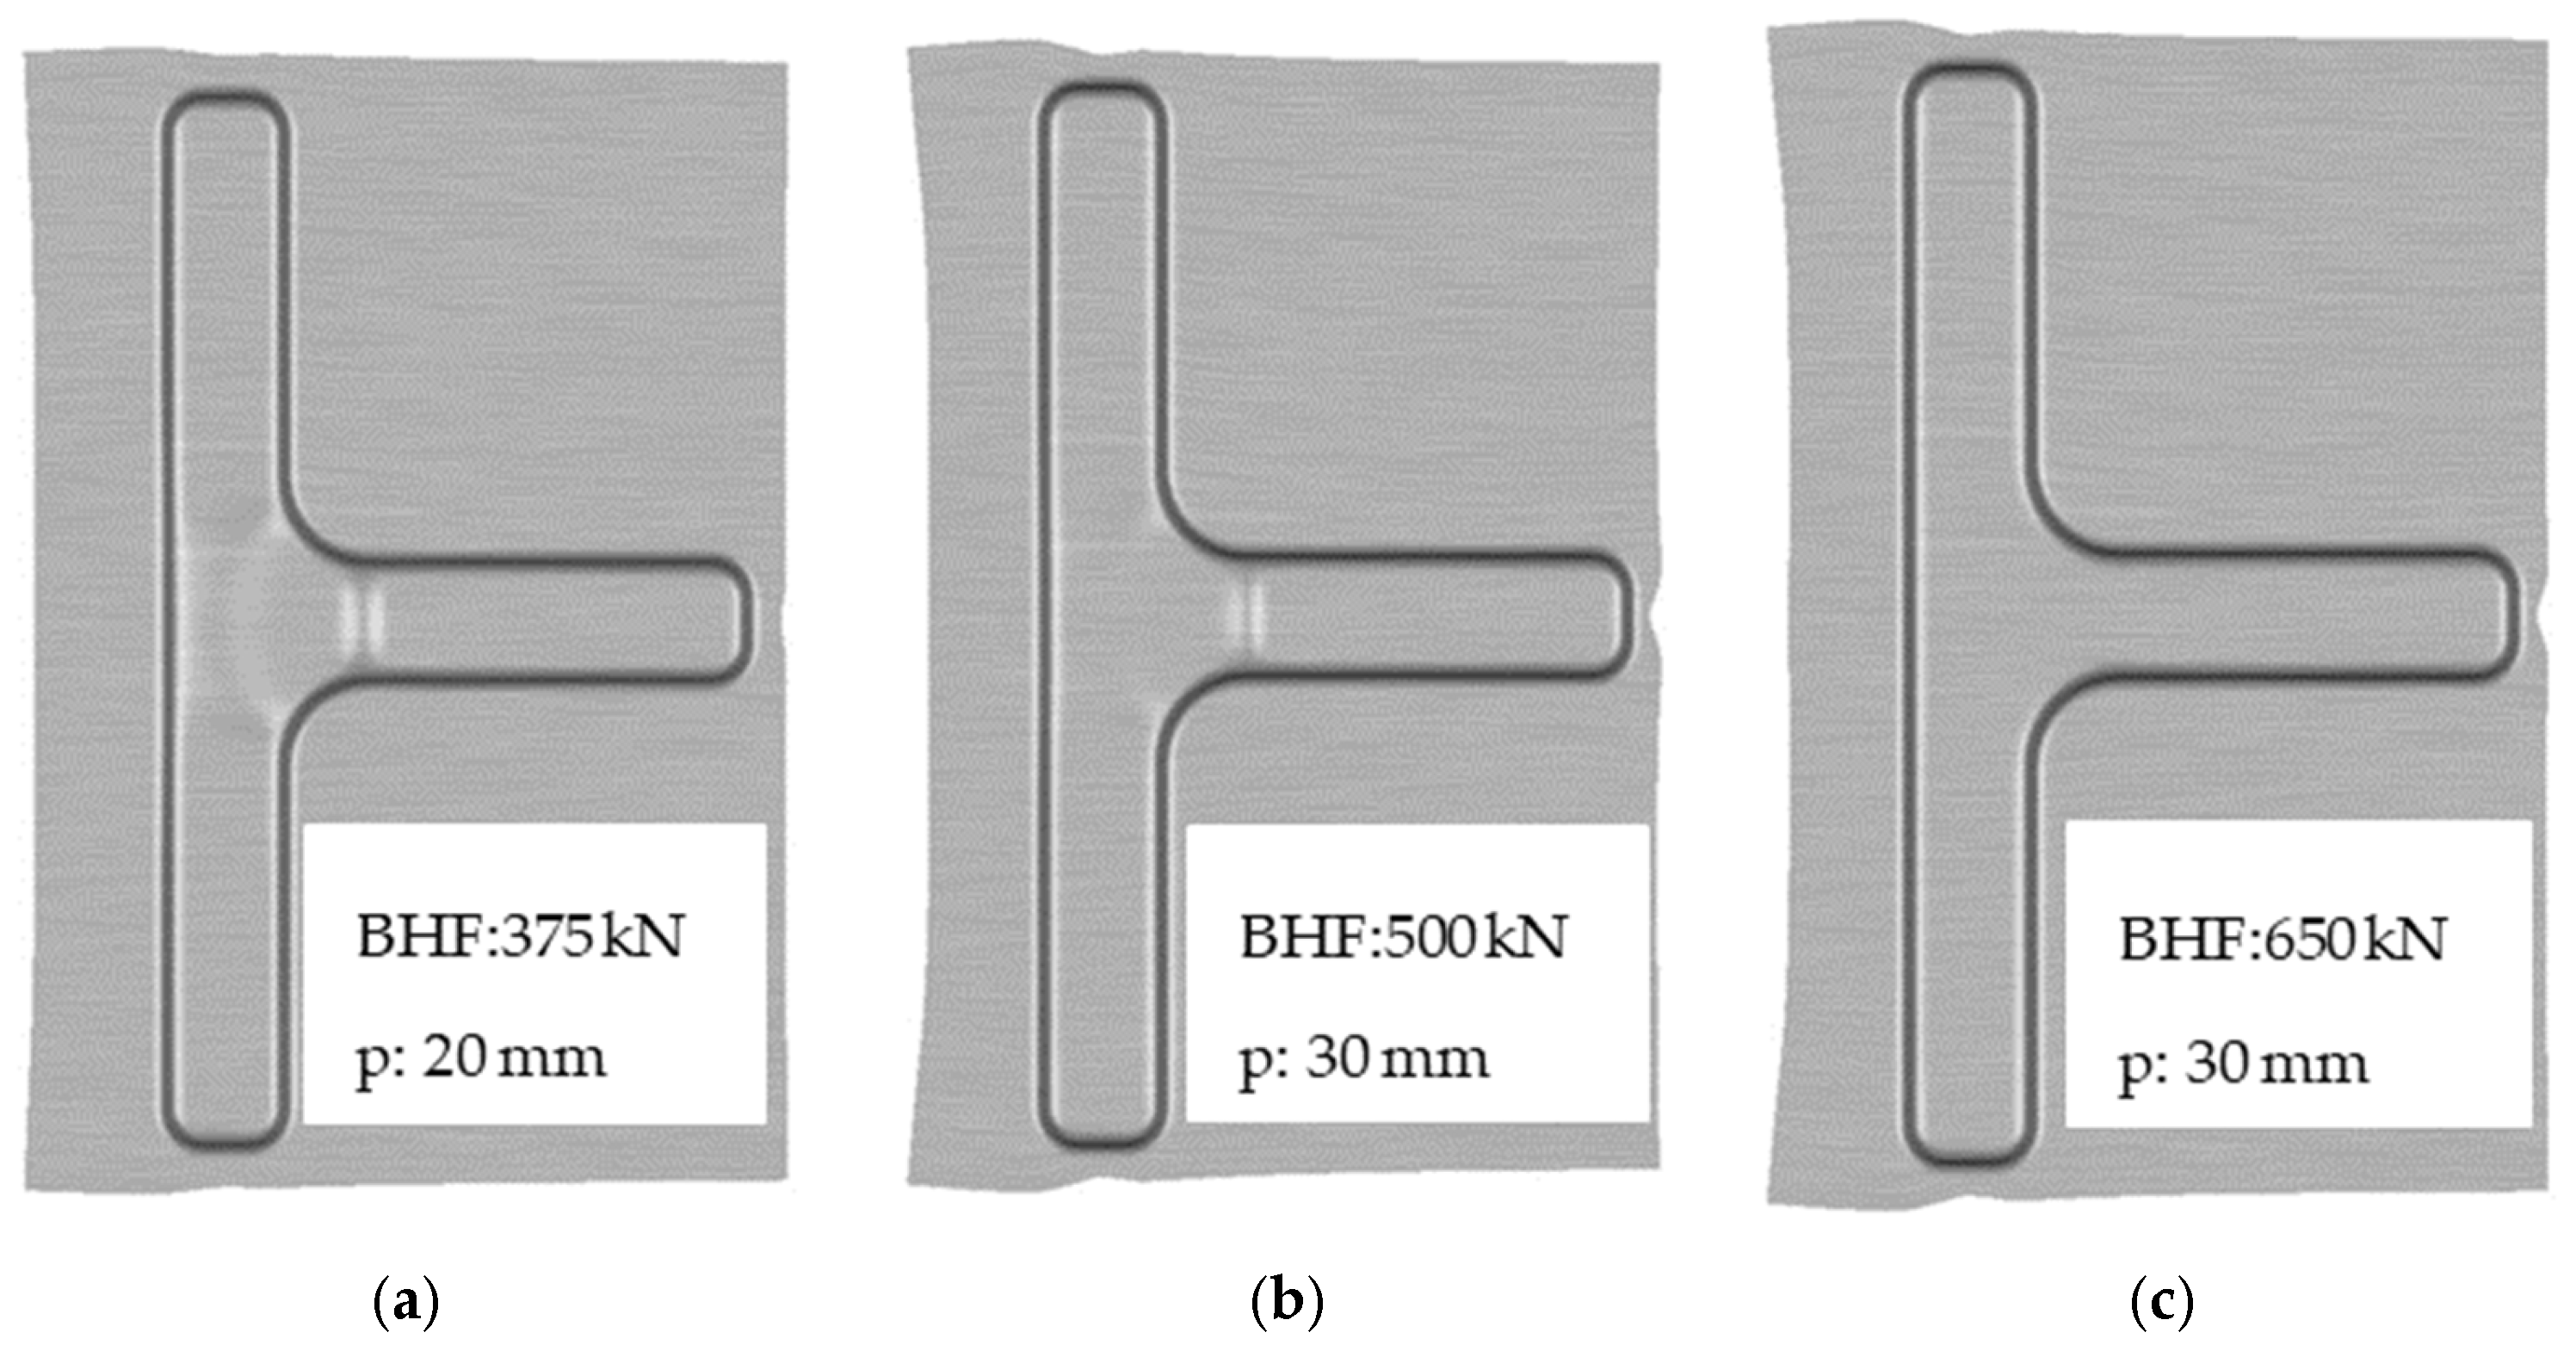
In Figure 7, it is possible to observe some examples of drawn components produced using different values of process parameters. Qualitatively, it is evident that the optimal condition is achieved with a blank holder force of 650 kN and a drawing depth of 30 mm. These results are consistent with numerical ones (Figure 8), which were obtained by applying a friction coefficient of 0.11, as determined in the calibration phase described in authors previous work [29].
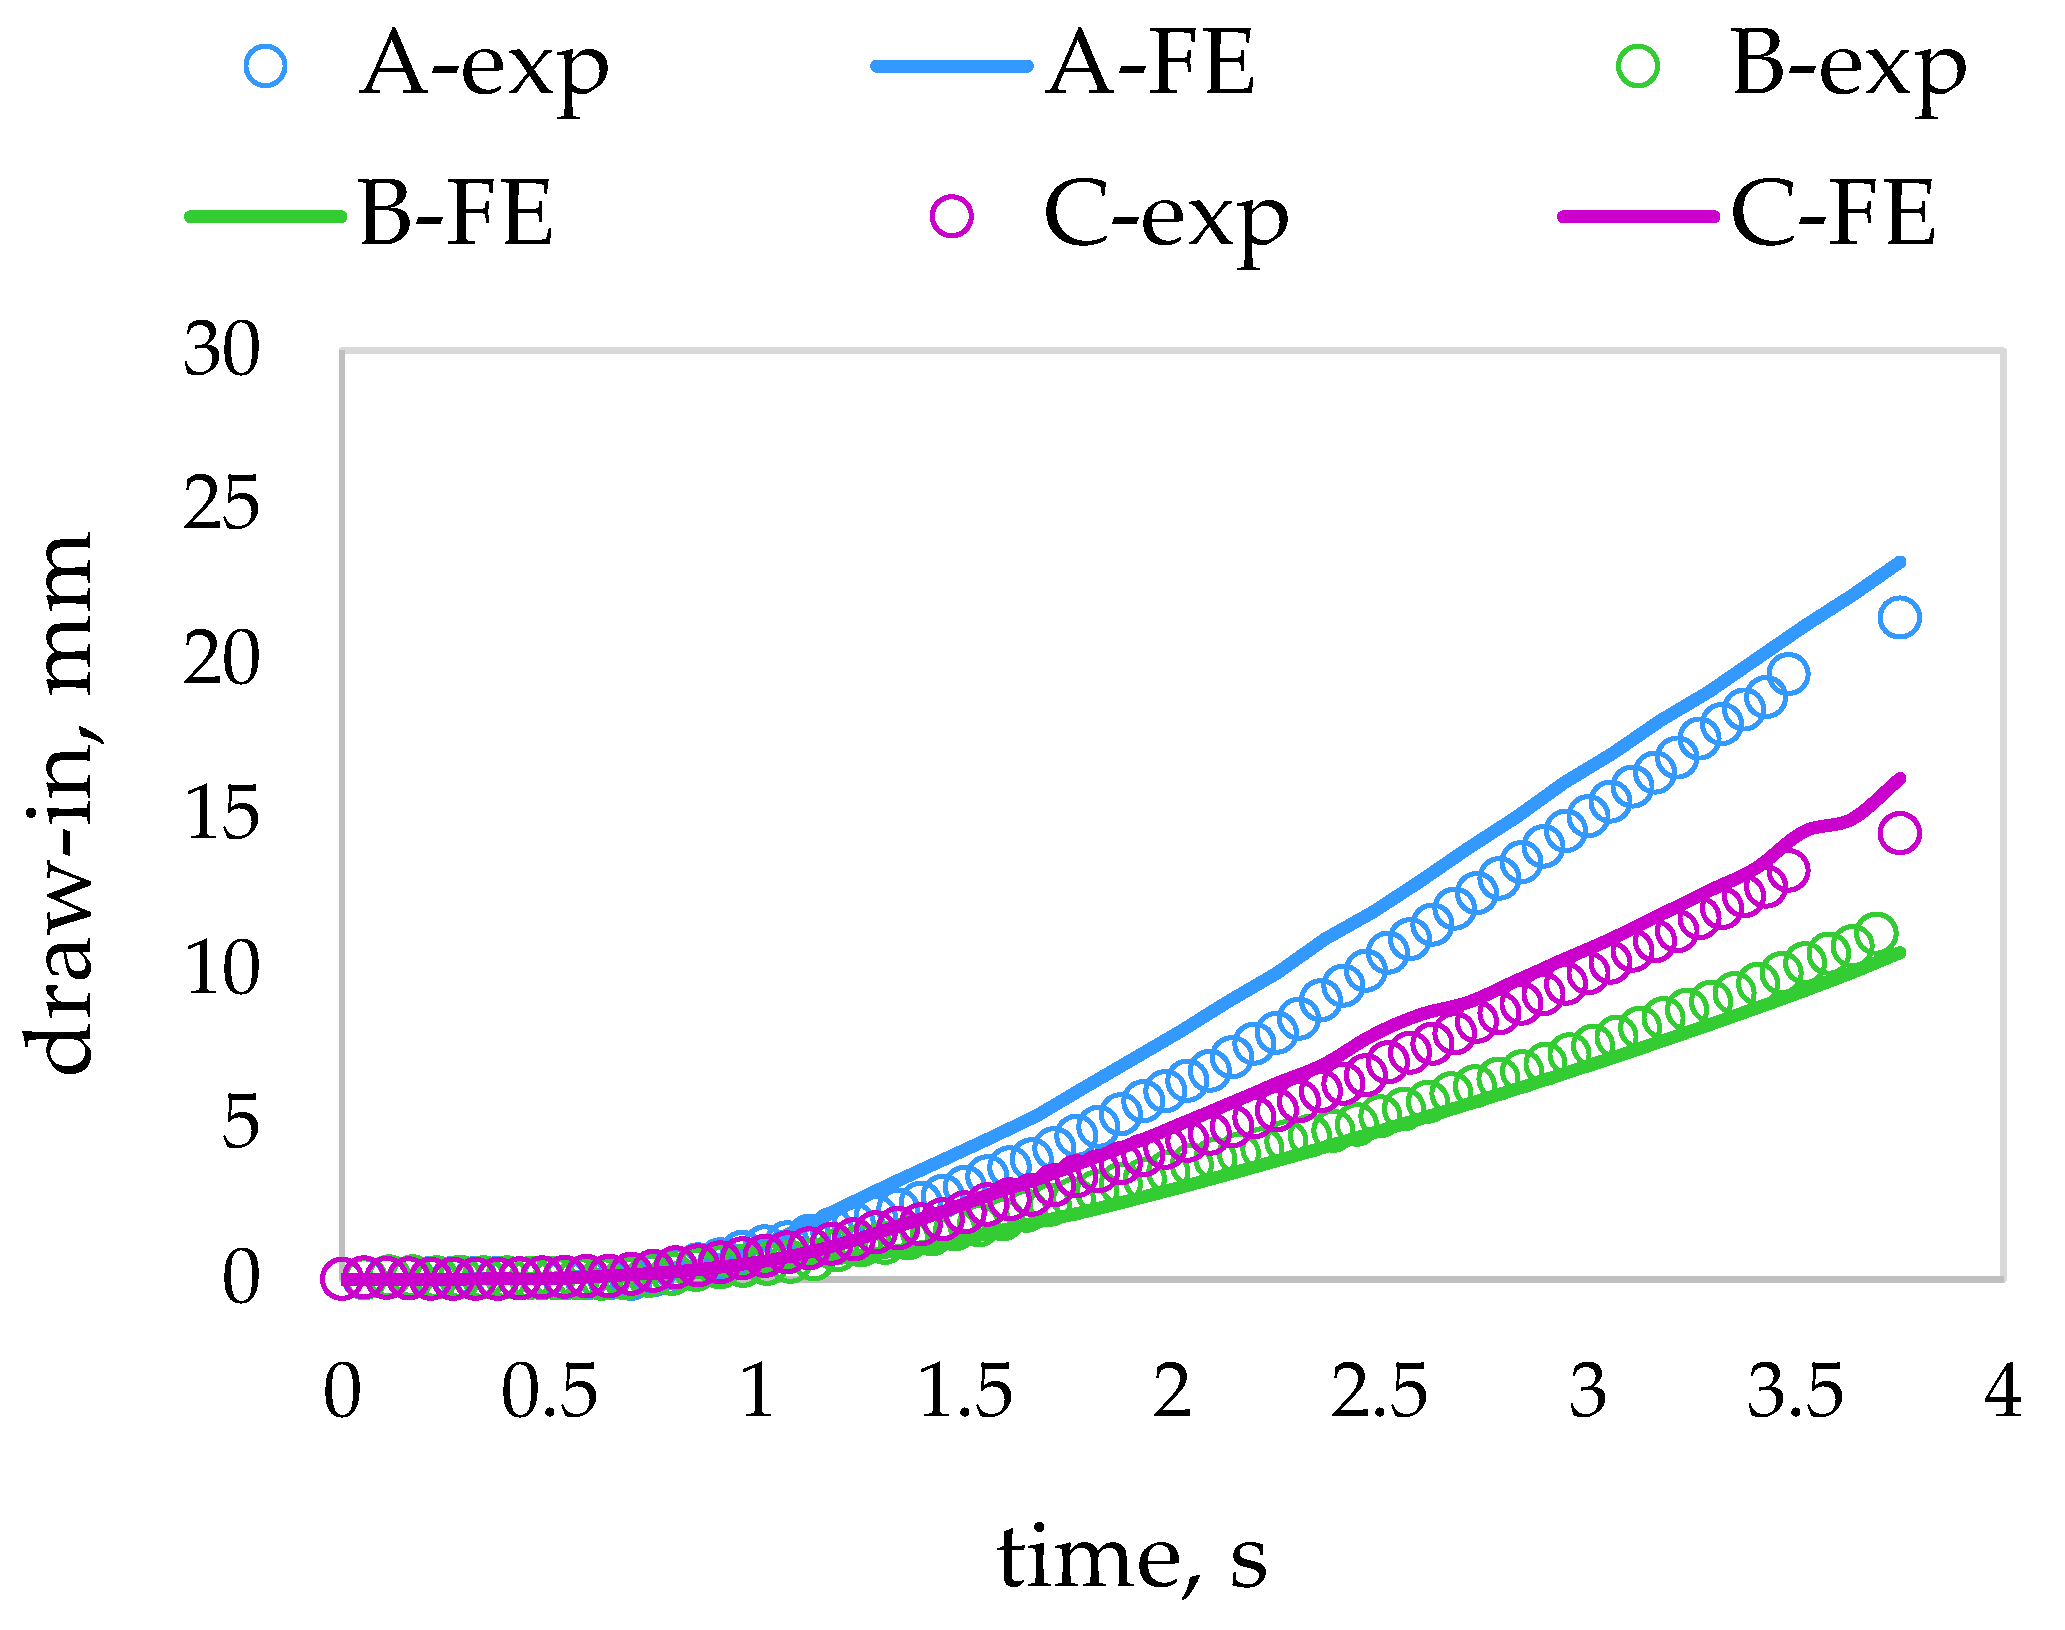
In the optimal conditions (BHFopt* = 650 kN and popt* = 30 mm), the blank draw-in at the three points follows the trends shown in Figure 9. The experimental results are represented by circular markers, while the numerical results are shown with a solid line. A good agreement between numerical and experimental results can be observed.
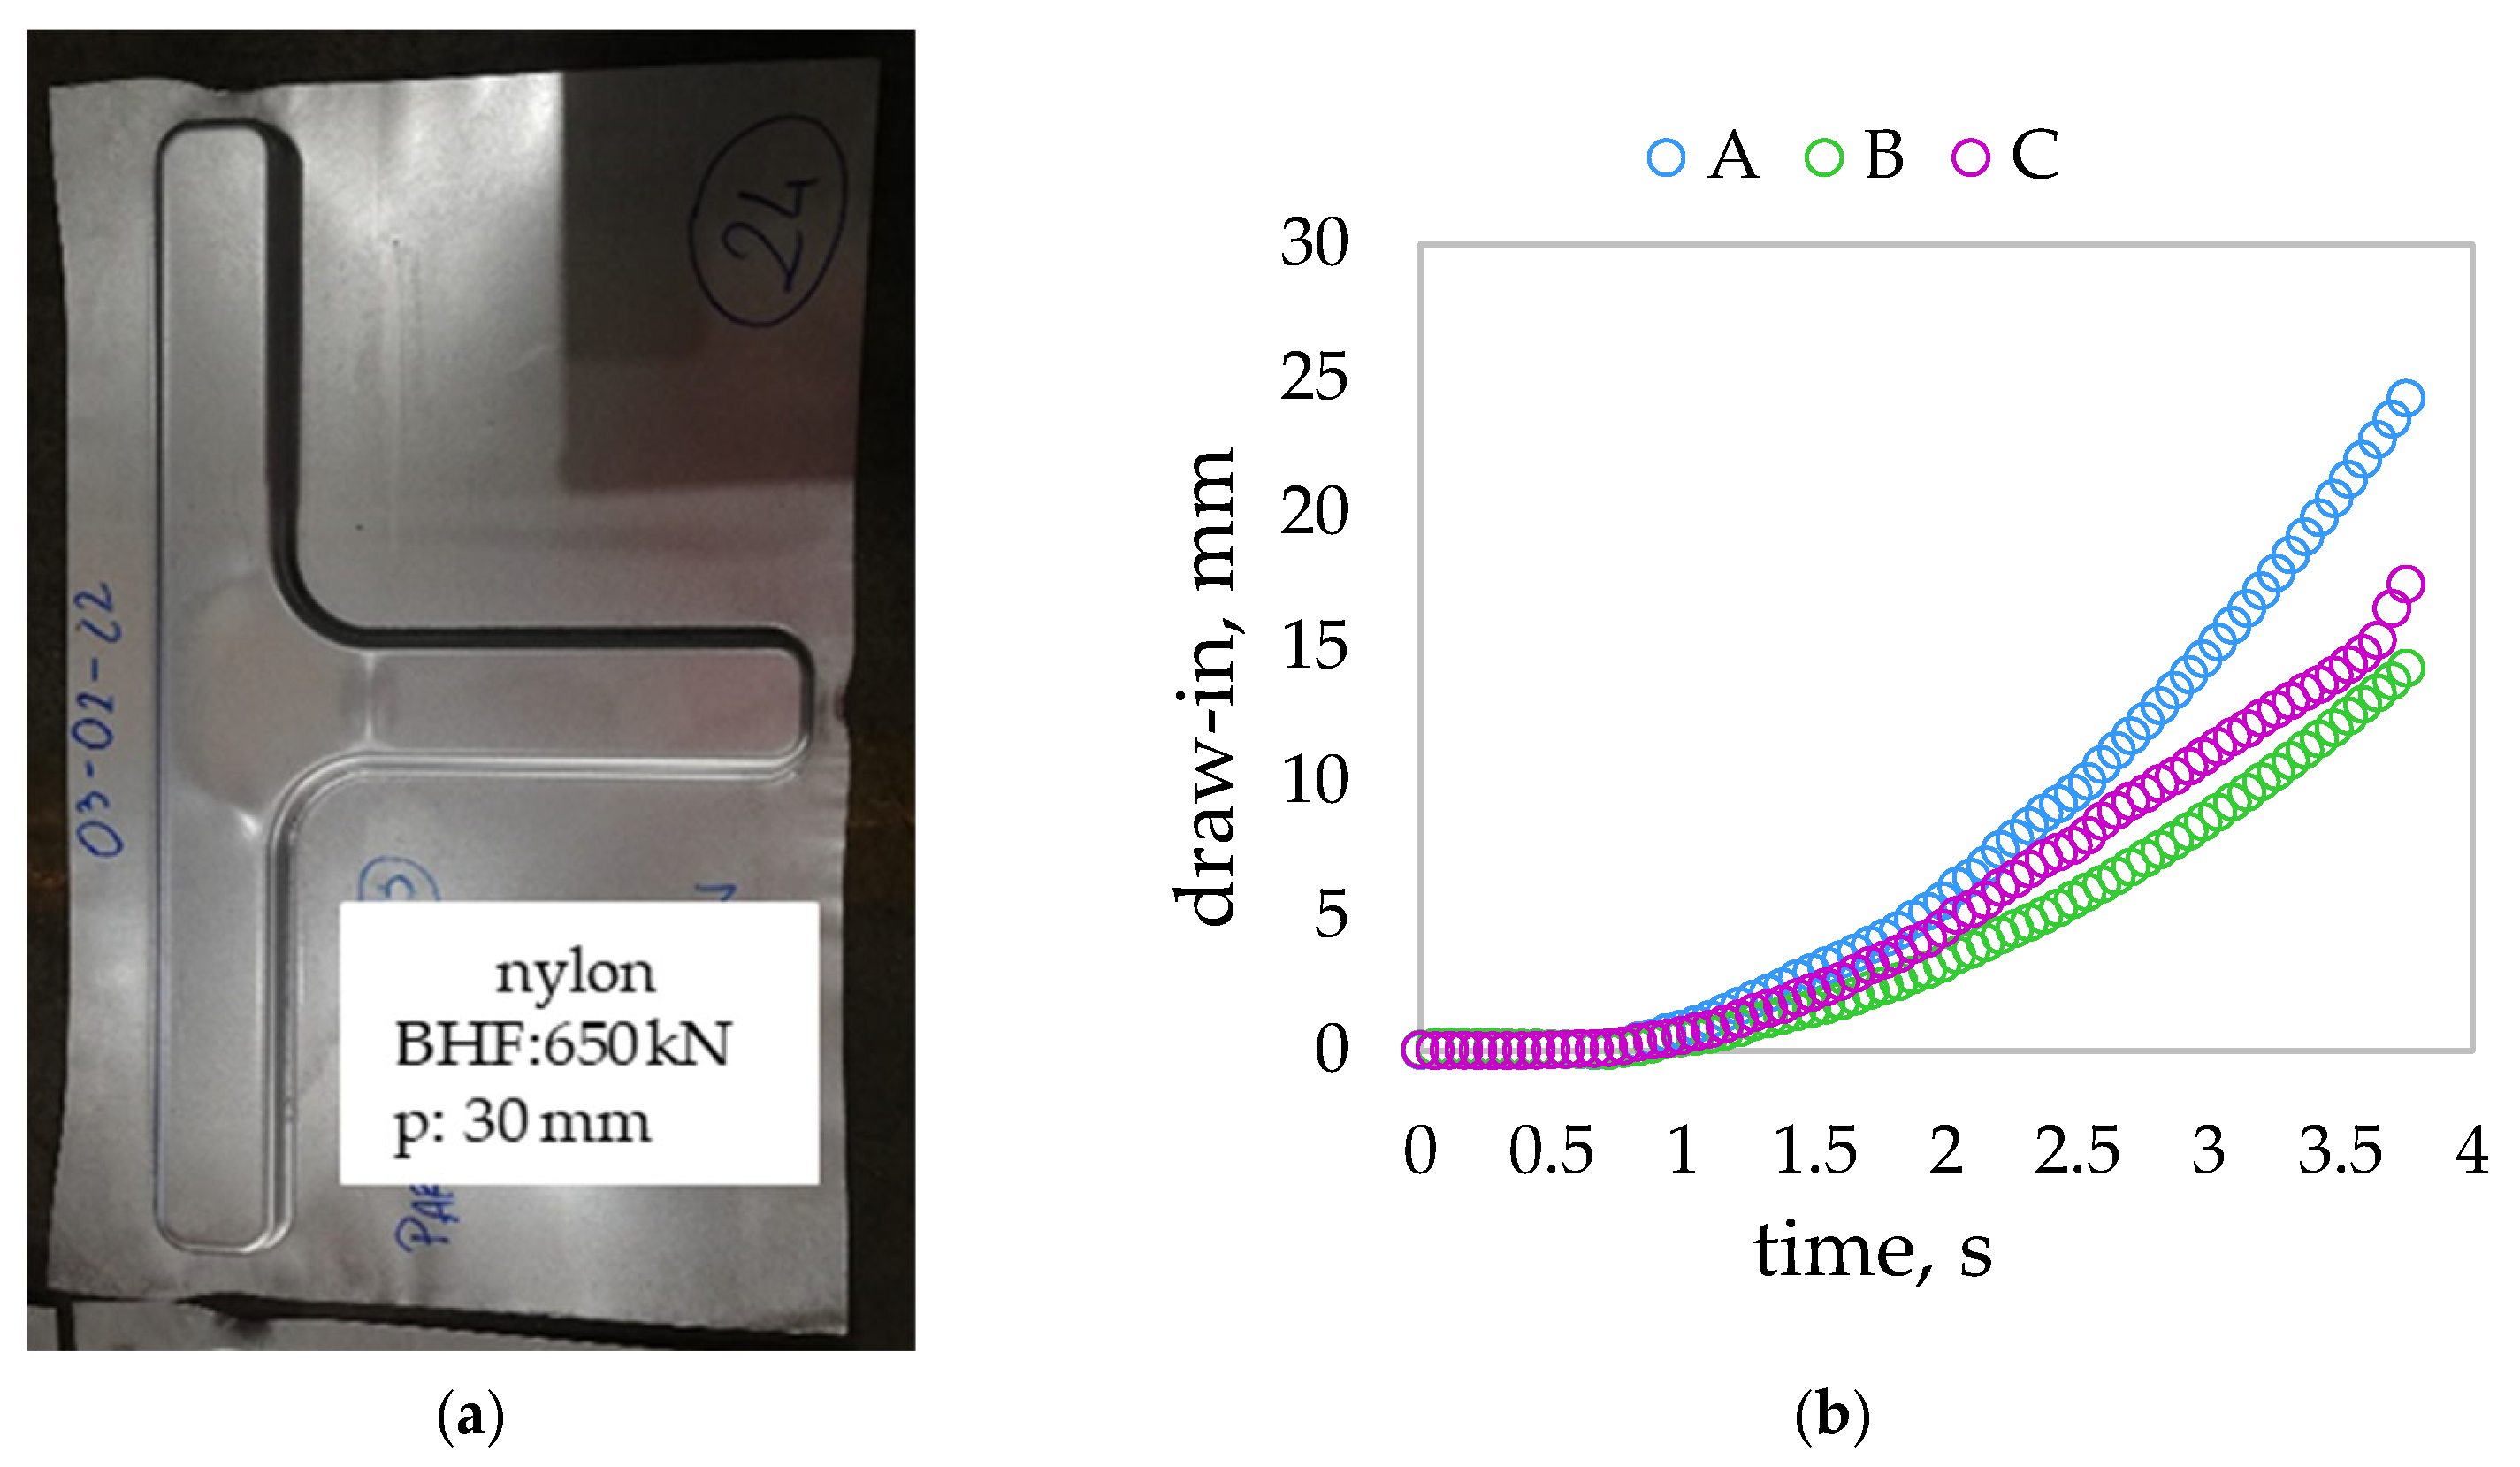
Once the optimal conditions were defined, the forming operation was performed with a layer of nylon interposed between the blank and the tools. As shown in Figure 10a, even though the process parameters were set to their optimal values, the quality of the formed component worsens. Specifically, the cosmetic defect in the central region is emphasised. The acquired experimental draw-in curves are illustrated in Figure 10b and show an increase in blank sliding compared to the optimal conditions of 13% at point A, 27% at point B, and 20% at point C.

3.2. FE Results for Establishing the Surrogate Models

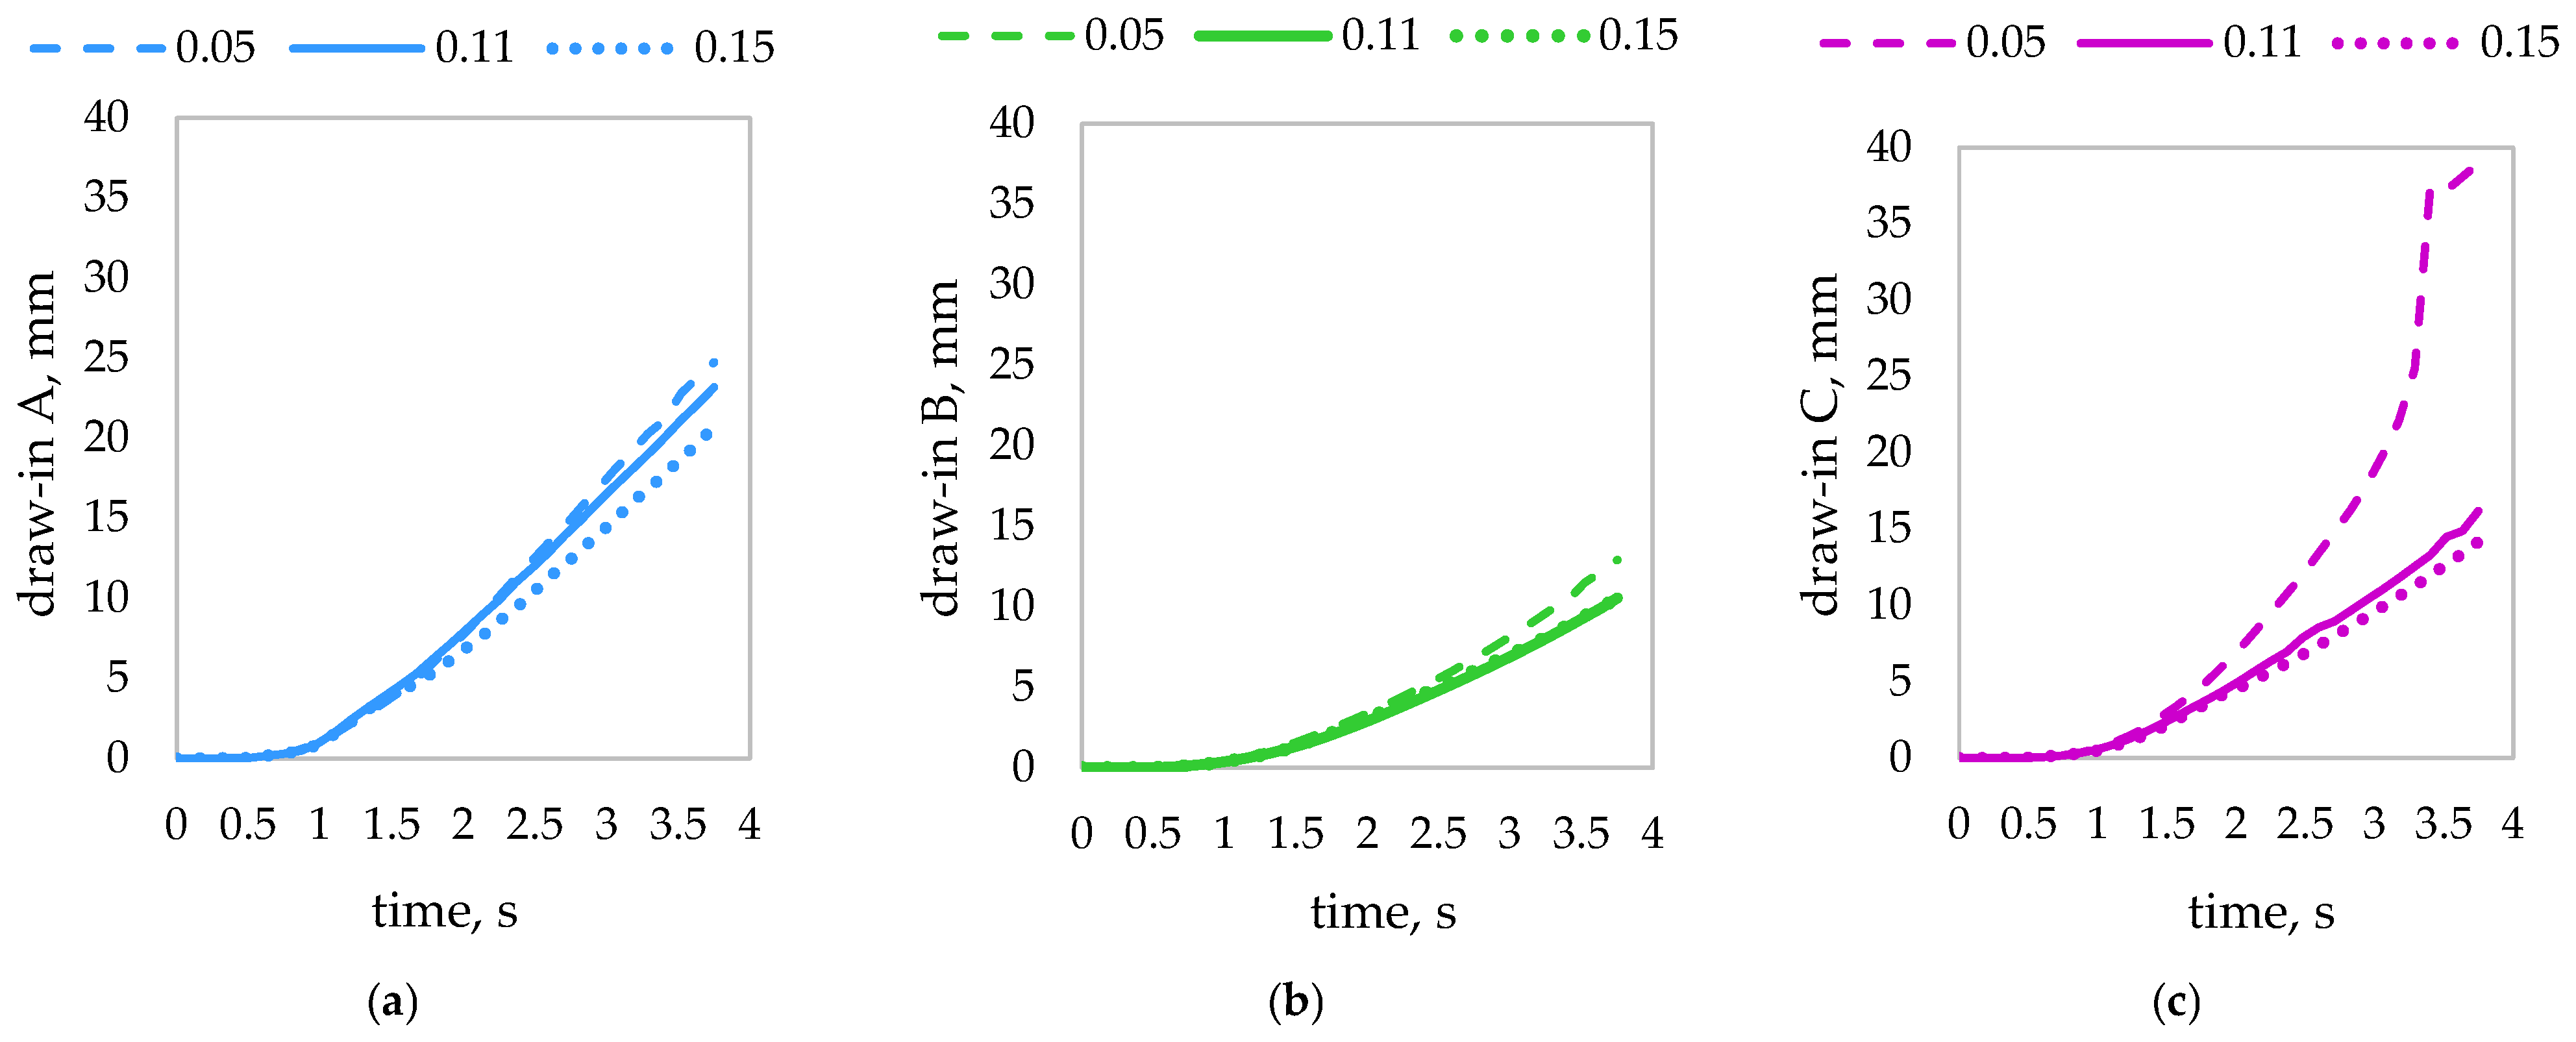
In the first set of numerical simulations, the blank holder force was held constant at the optimal value of 650 kN, while the friction coefficient was varied within the range of 0.05 to 0.15. For each condition, the evolution of draw-in over time was assessed. As an example, Figure 11 displays the draw-in curves for the design condition (µ = 0.11) and the two extreme cases: the minimum friction coefficient (µ = 0.05) and the maximum friction coefficient (µ = 0.15). The results are presented in Figure 11a for sensor A, Figure 11b for sensor B, and Figure 11c for sensor C.
As expected, a reduction in the friction coefficient results in greater blank sliding, which is more evident at sensor C. Furthermore, an increase in the friction coefficient leads to lower blank sliding, as observed more clearly at sensor A.
As explained in Section 2.3, the time-dependent draw-in data for each investigated friction coefficient were imported into the MATLAB environment, and a mathematical function correlating blank sliding to the friction coefficient was determined using the meta-model. This function enables the estimation of the friction coefficient when inputting the draw-in at three points: A, B, and C. However, it was demonstrated that for the function to provide an accurate estimation of the friction coefficient, it is necessary to wait for approximately 28% of the punch stroke (around 1 s). Indeed, as observed in Figure 11, during the initial moments, the draw-in curves overlap, regardless of the friction coefficient value. Therefore, to ensure a unique solution to the problem, it is essential to understand the effect of the friction coefficient on the draw-in curves. The time at which it becomes possible to estimate the friction coefficient is referred to as the control time, denoted by the symbol tc.
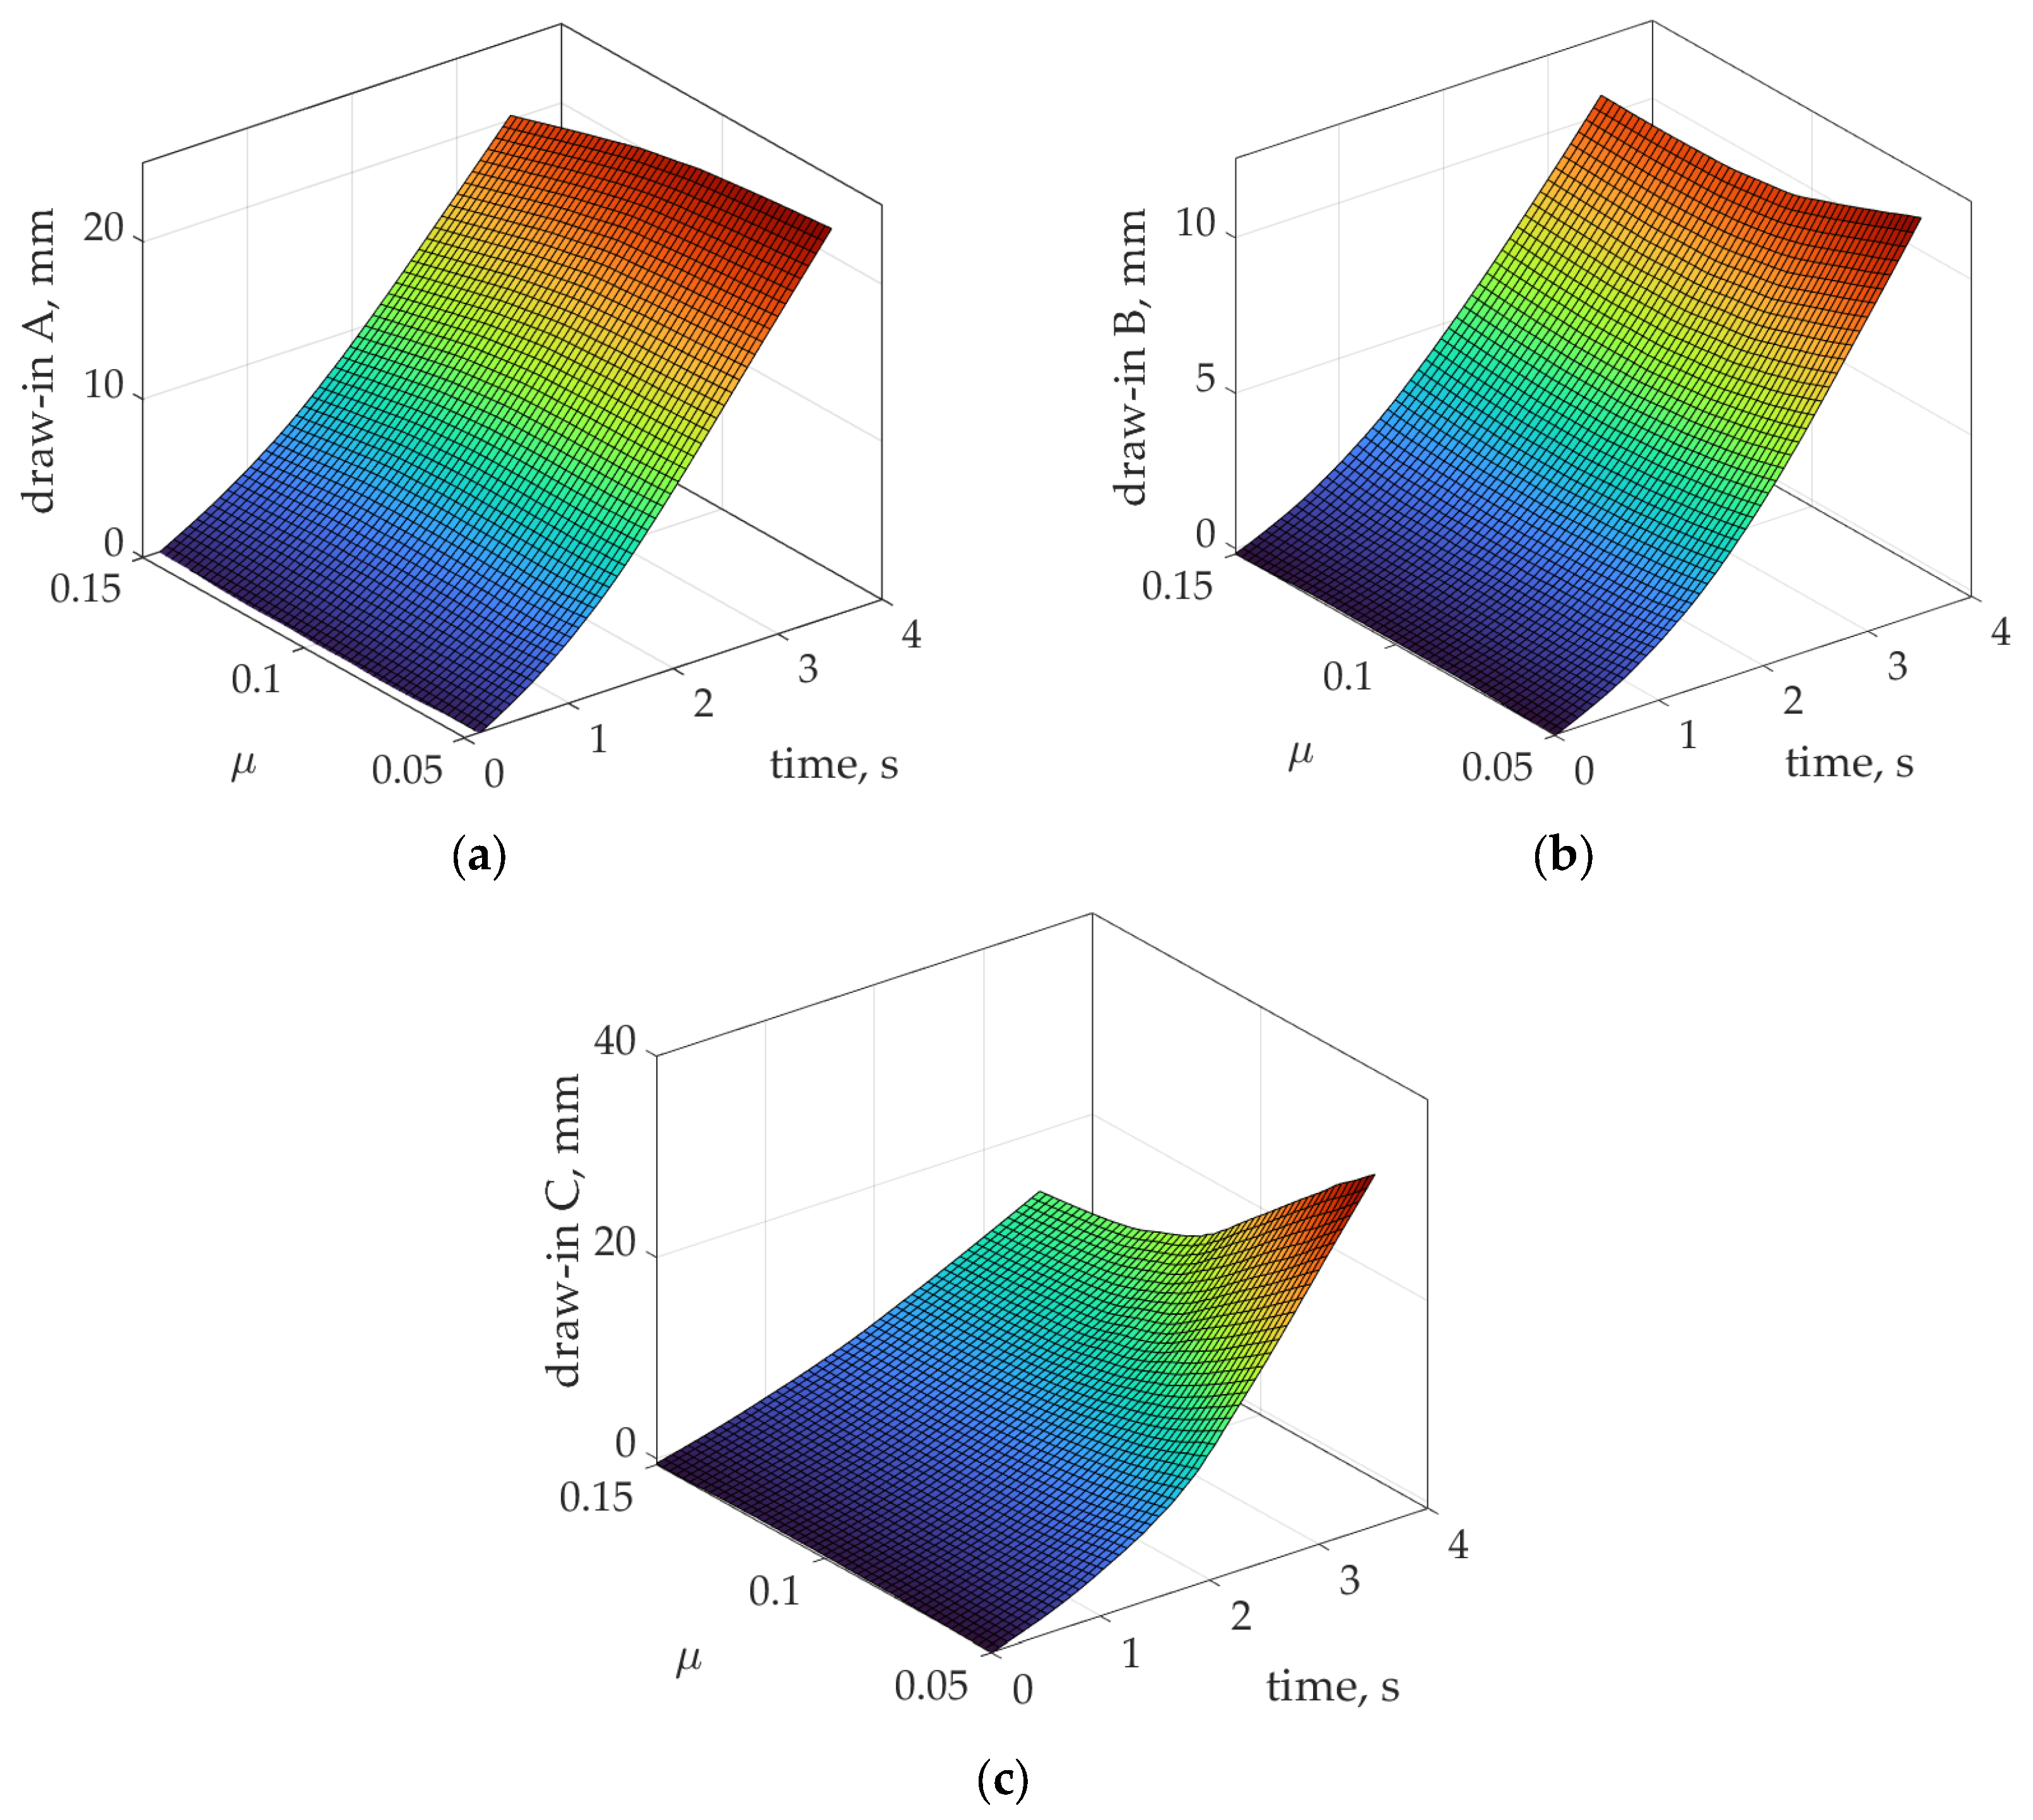
In Figure 12, the meta-models describing the relationship between the blank displacement over time and the friction coefficient are observed.
The estimation of the friction coefficient is performed based on the following system of equations:
t = t c d i , A t , μ = p 00 + p 10 × t + p 01 × μ + p 20 × t 2 + p 11 × t × μ + p 02 × μ 2 d i , B t , μ = p 00 + p 10 × t + p 01 × μ + p 20 × t 2 + p 11 × t × μ + p 02 × μ 2 d i , c t , μ = p 00 + p 10 × t + p 01 × μ + p 20 × t 2 + p 11 × t × μ + p 02 × μ 2
In Table 1, the coefficients of the polynomials in Equation (1) are listed.
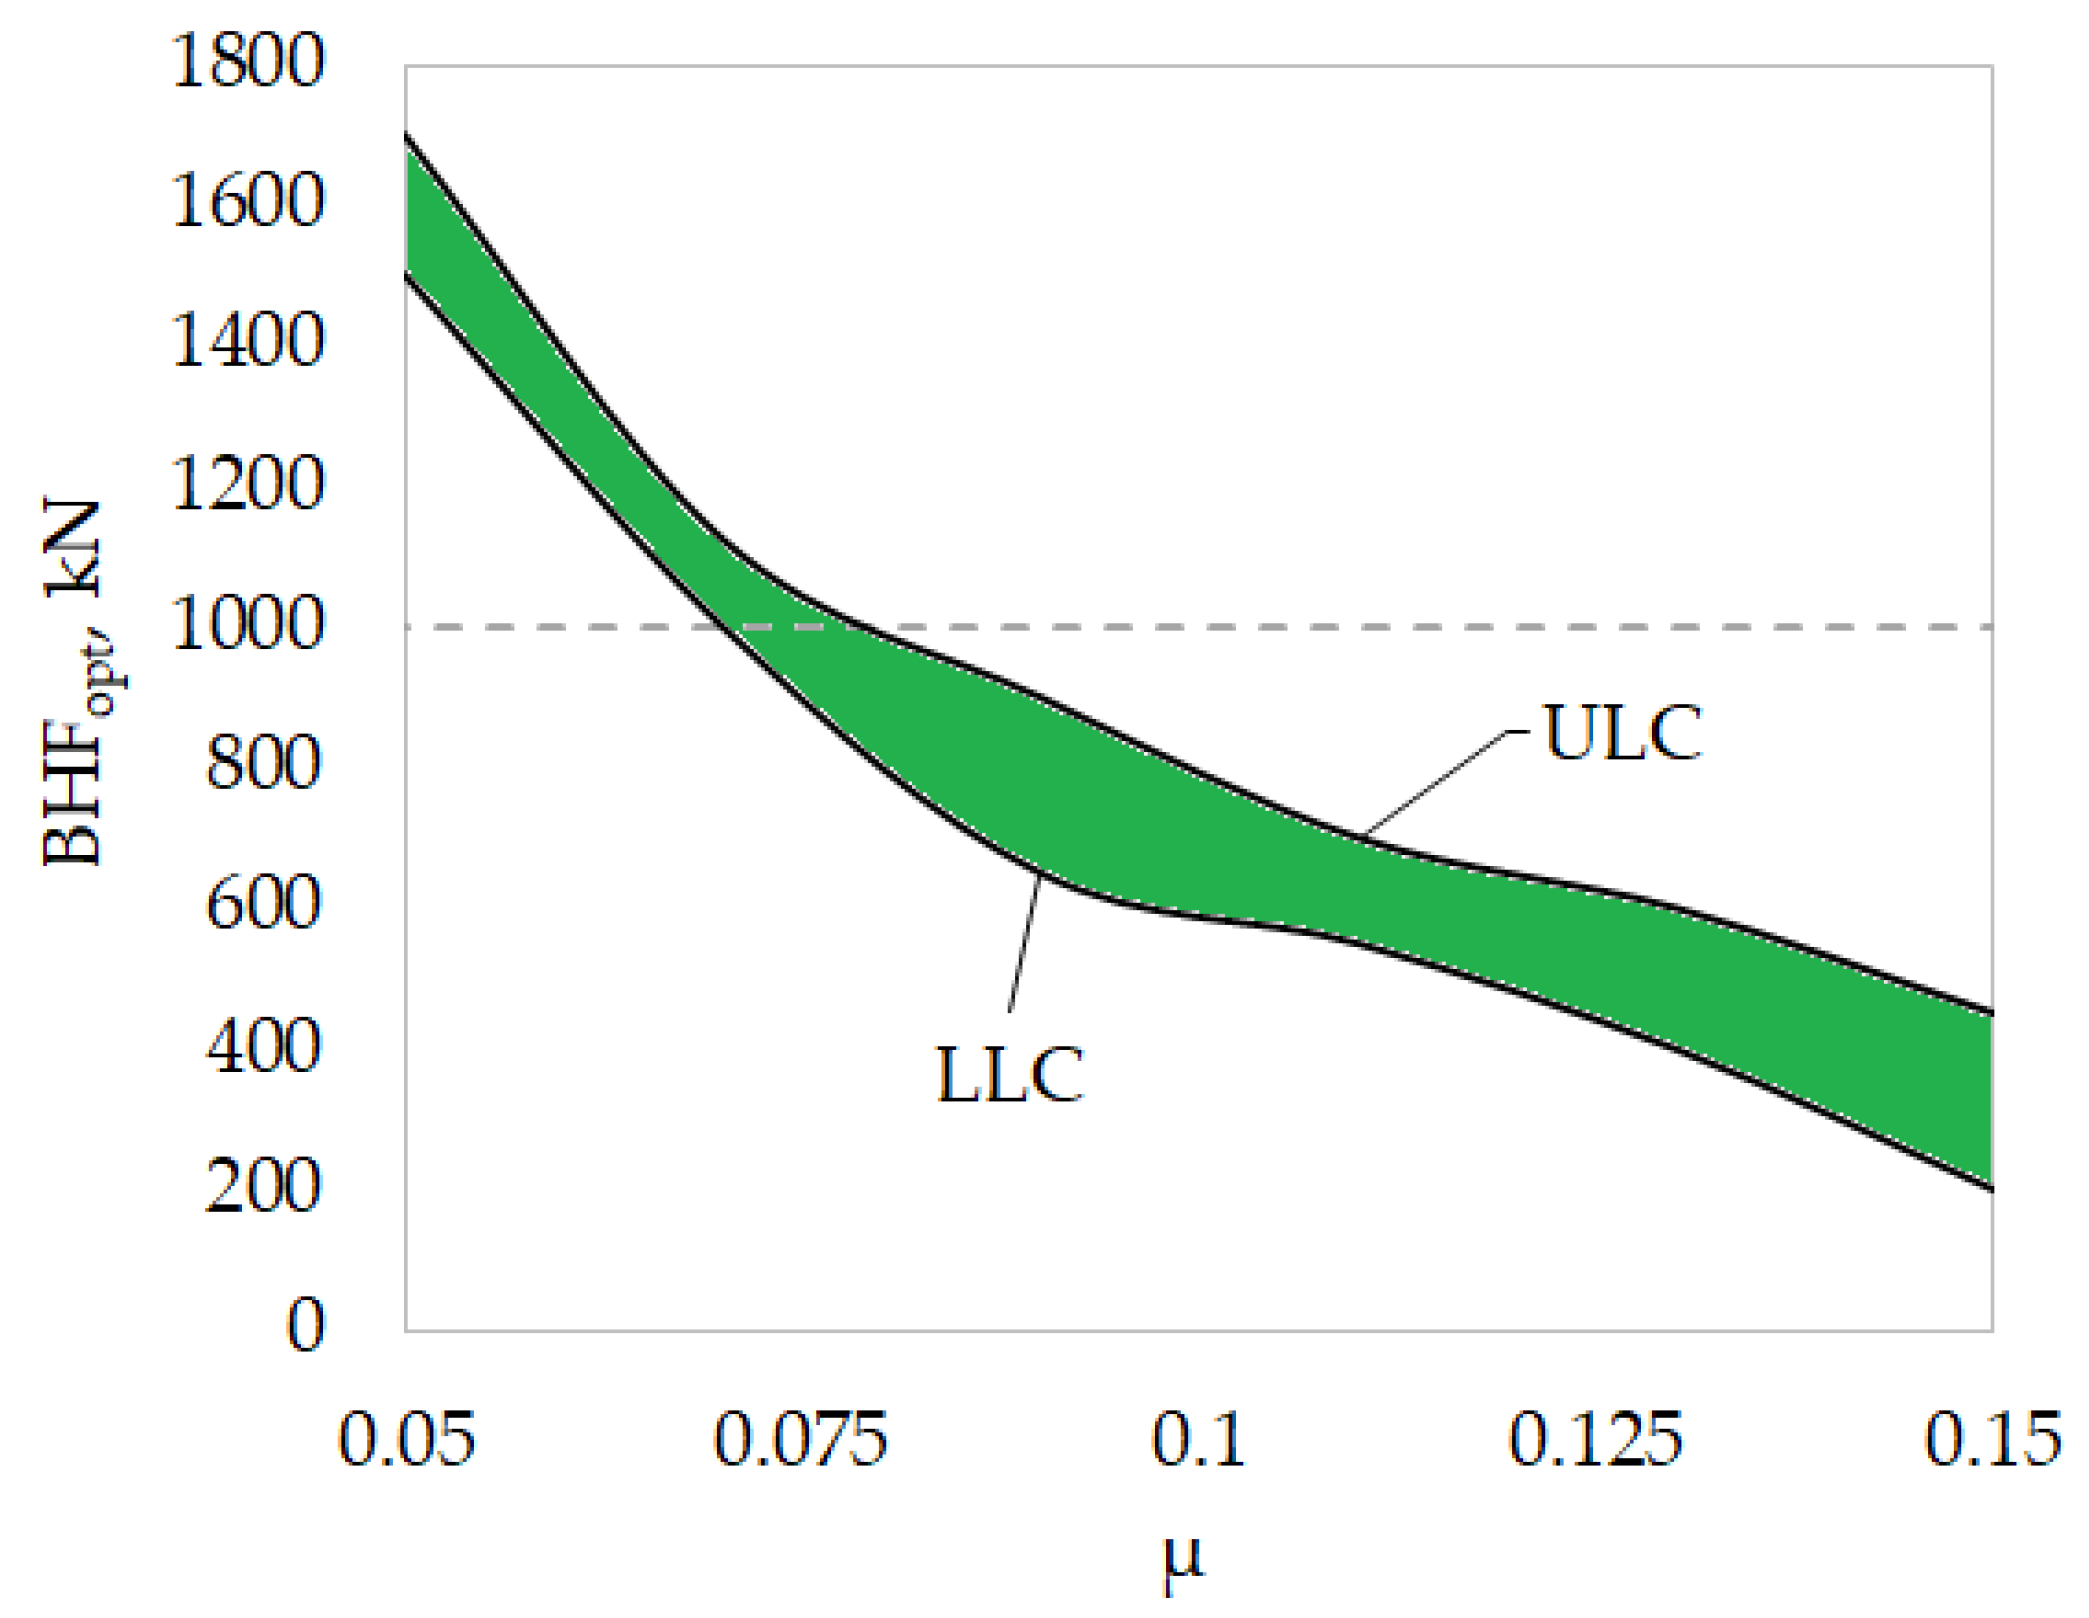
In the second set of numerical simulations, the blank holder force was varied between 200 kN and 2000 kN for each friction coefficient. The simulations were analysed in terms of thinning and curvature at critical regions highlighted in Figure 5. The threshold values set for thinning and curvature to achieve a defect-free component were 24% and 0.07 1/mm, respectively.
The graph in Figure 13 illustrates that for each friction coefficient, there exists a range of blank holder force values that successfully adhere to the prescribed limits for both thinning and curvature. Beyond the upper limit curve (ULC), excessive thinning issues arise, while falling below the lower limit curve (LLC) results in excessive curvature problems.
It can be observed that as the friction coefficient increases, the optimal BHF decreases. For the press used in the experimental tests, the maximum settable BHF is equal to 1000 kN (dashed line in Figure 13). These results demonstrate that when lubrication conditions at the blank–tool interface ensure a friction coefficient less than or equal to 0.07, the maximum allowable BHF of 1000 kN would not be sufficient to produce a defect-free component. Specifically, it would result in excessive curvature in the SD region.
B H F o p t ( μ ) = 5 × 10 6 μ 4 4 × 10 6 μ 3 + μ 2 110,105   μ + 5015.7
The mathematical function that relates the optimal blank holder force to the friction coefficient has been derived by taking the average of the optimal BHF obtained from the values on the upper limit curve and those from the lower limit curve. This mathematical function is represented by the fourth-order polynomial in Equation (2).

3.3. FE-Results by Adopting the Control Methodology

To simulate potential scenarios during a production line, where lubrication conditions change, numerical simulations were run with a blank holder force set at the design value of 650 kN, while varying the friction coefficient values. To assess the control code’s reliability, different friction coefficient values were used than those originally sampled. In this study, the results of the control strategy are presented for μ equal to 0.08 and μ equal to 0.14.
Starting from the acquisition of the draw-in values at the three points, the surrogate model was able to estimate the friction coefficient with an average error of 4%.
With these estimated friction coefficients, Equation (2) was able to determine the new optimal blank holder force. The BHFopt values are 415 kN for μ = 0.08 and 880 kN for μ = 0.14. When applying this new optimal blank holder force at time tc, the final components do not exhibit any critical issues in terms of curvature or thinning.
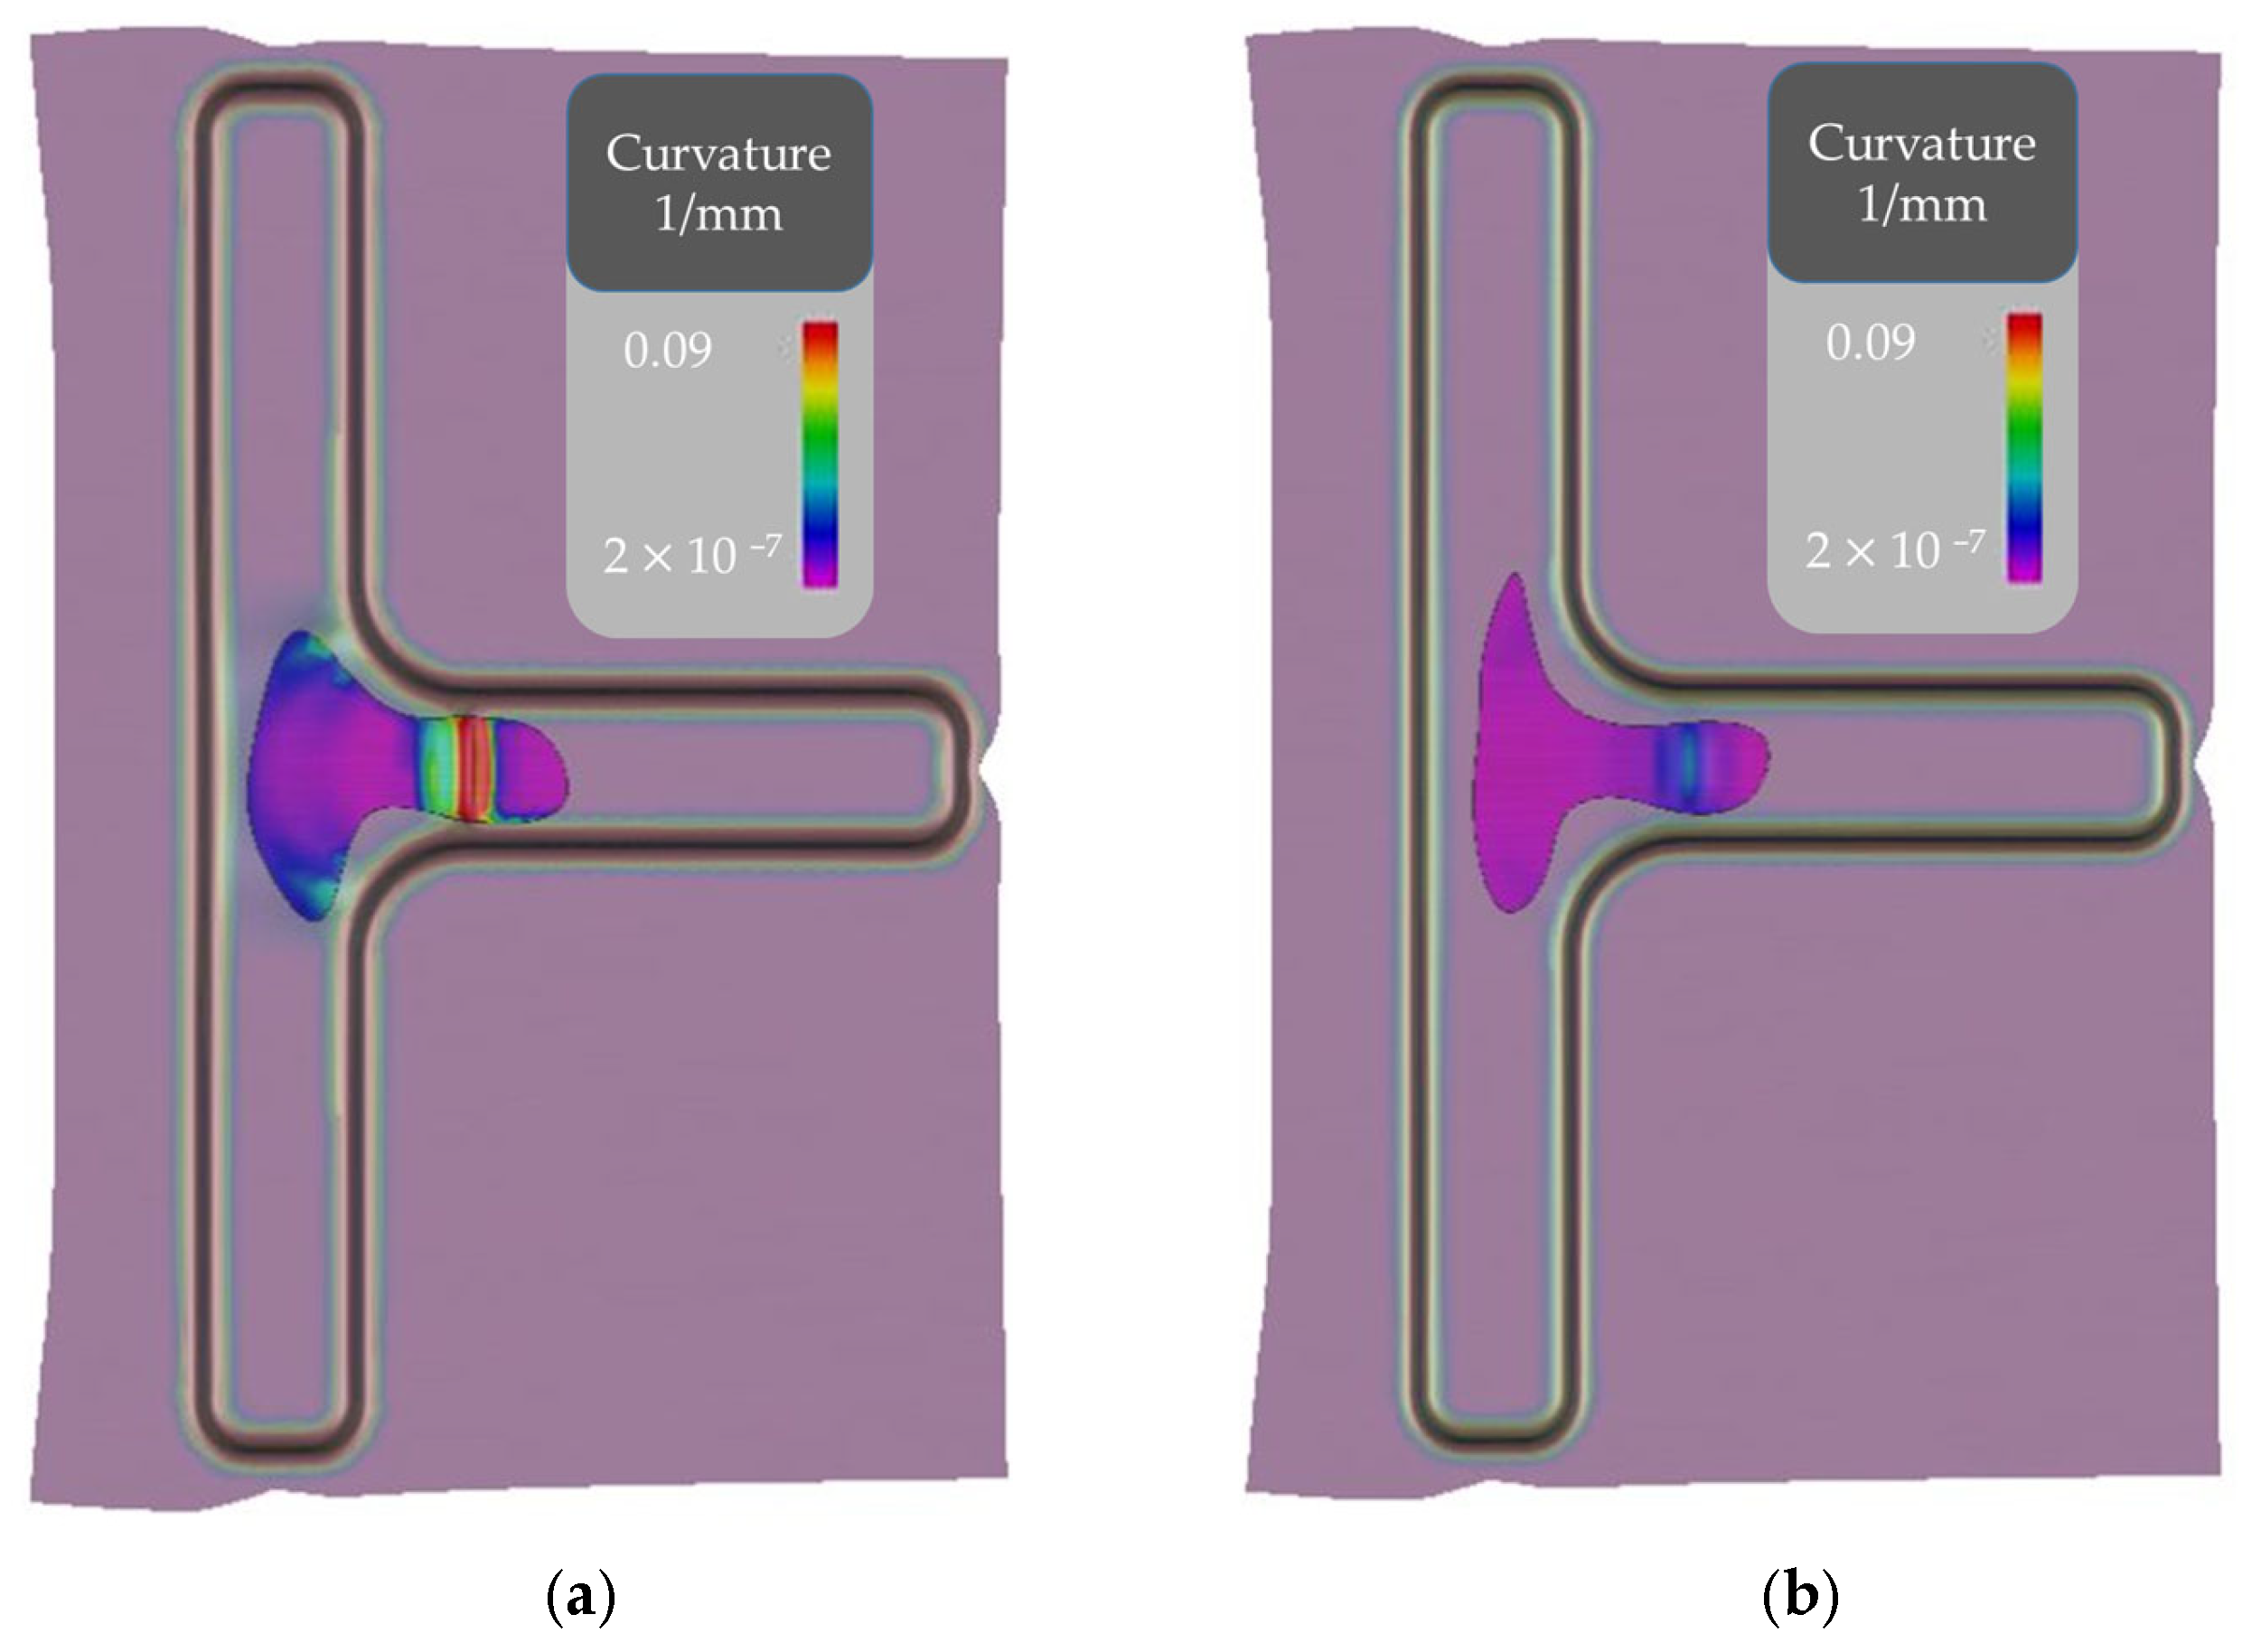
For the case where the friction coefficient is 0.08, Figure 14 shows two components: one without blank holder force adjustment (Figure 14a) and one with blank holder force adjustment (Figure 14b).
The figures highlight the SD region, which is critical when the friction coefficient is low. Without blank holder force adjustment, a curvature of 0.09 1/mm was estimated, exceeding the critical value. After adjustment, the curvature in this region decreased to 0.015 1/mm.
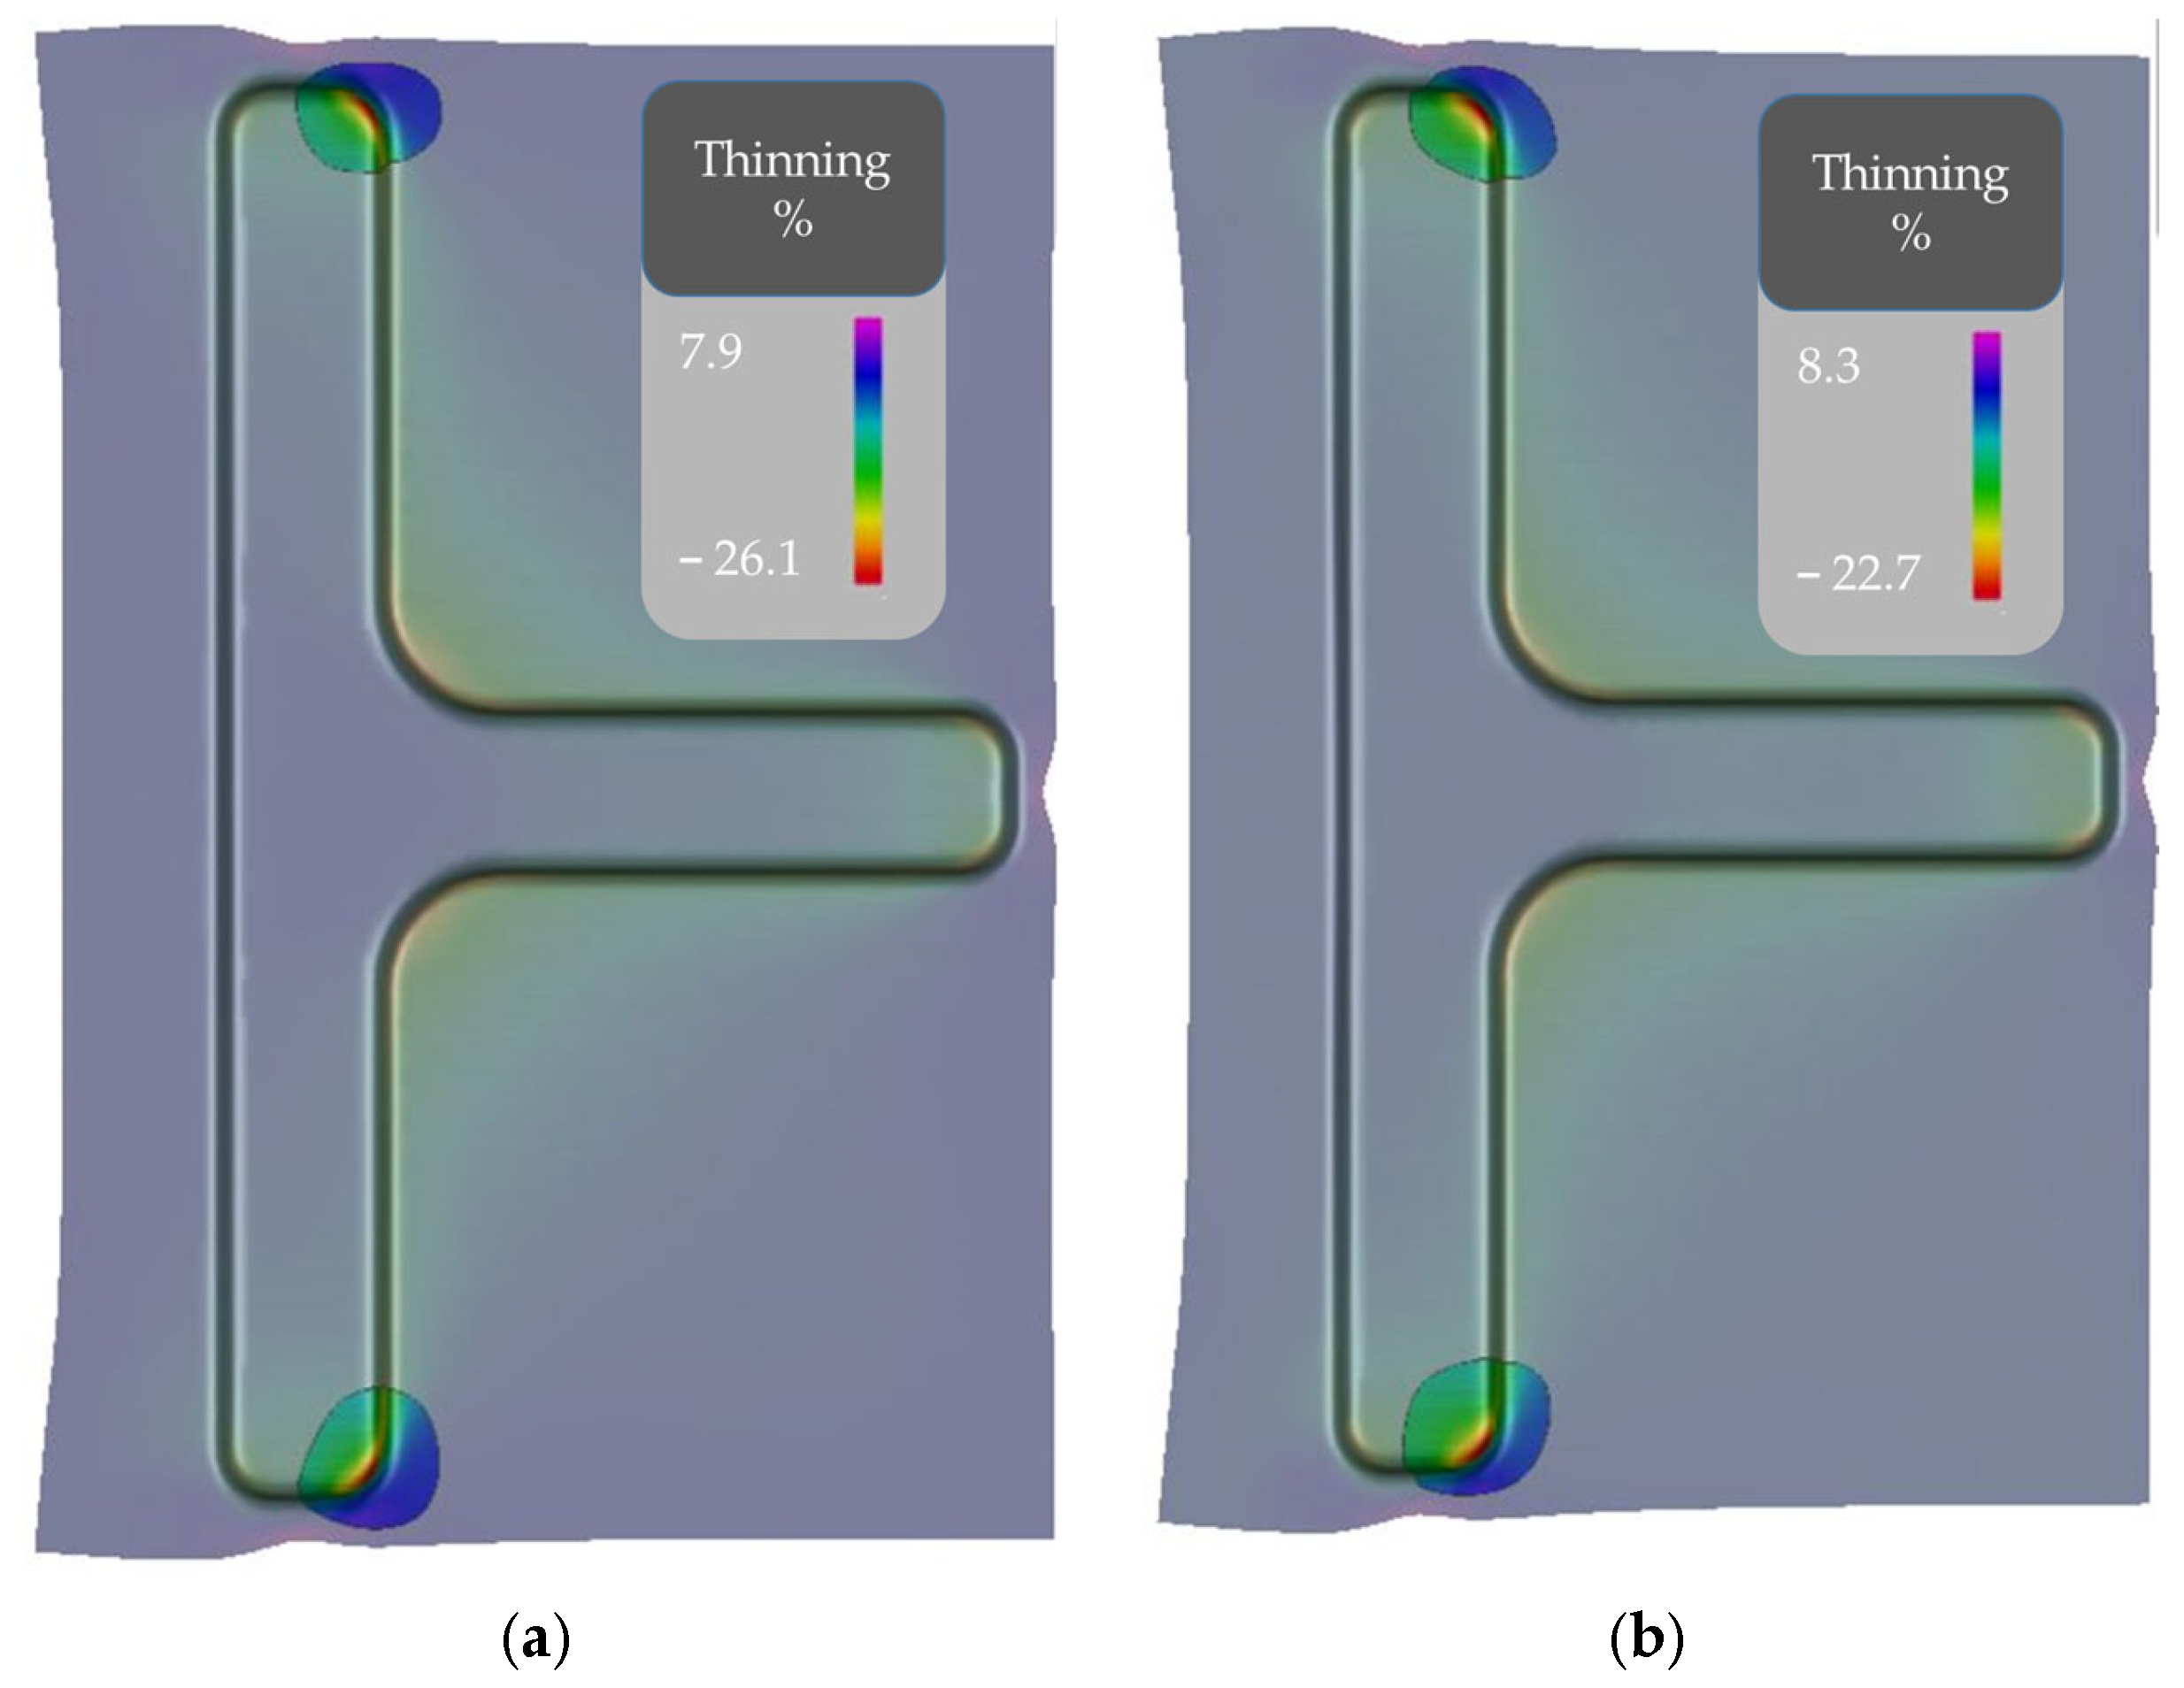
In the case of μ = 0.14 (Figure 15), critical issues are observed in regions Ta and Tb, where without blank holder force adjustment, there was an excessive thinning of approximately 26%. By adjusting the blank holder force, the thinning decreases to 22%, avoiding the risk of splits in those areas.
Draw-in curves for μ = 0.08 and μ = 0.14 are shown in Figure 16a,b, respectively. Solid lines represent curves without blank holder force adjustment, while lines with triangular markers represent draw-in curves with blank holder force adjustment (BHF adj). The graph also shows the variation in blank holder force during the process; without adjustment, the force remains constant at 650 kN.
It is observed that for μ = 0.08, adjusting the BHF leads to a reduction in blank sliding, particularly at point C. Conversely, for μ = 0.14, reducing the blank holder force promotes blank sliding, with a more significant increase occurring at sensor A.
In this study, it was assumed that the new optimal force is applied at the same time as the estimation of the friction coefficient (time tc). In the case of implementation on a physical press, the timing of applying the new blank holder force will depend on the actuation times required to increase or decrease the blank holder force. For the press considered in the experimental part of this study, this assumption holds reasonably true, as the actuation times are on the order of 200 ms.
Assuming that the meta-model is unable to immediately estimate the friction coefficient and the optimal blank holder force, and considering the low actuation times, the maximum time at which to apply the new optimal blank holder force while still ensuring a defect-free component was analysed. The results indicate that, for the minimum sampled friction value (0.05), the last moment to modify the blank holder force without creating defects on the component is approximately 2.4 s, equivalent to a punch stroke of 61%. Meanwhile, for the maximum friction value (0.15), the last moment to apply the new optimal blank holder force is 2.8 s, corresponding to about 74% of a punch stroke.
From the results obtained and described so far, it appears that a control strategy without feedback logic ensures a defect-free component. Simply adjusting the blank holder force once, setting it to the optimal value for the new working conditions, is enough to produce a zero-defect component.
This strategy differs from the one proposed in the authors’ previous work [29], where a closed-loop control is performed using a PID (Proportional–Integral–Derivative) controller. This PID modifies the blank holder force based on the difference between the measured in-line blank draw-in and the once under optimal conditions. This strategy requires more steps of blank holder force variation and, consequently, shorter actuation times.
The need for more steps of blank holder force variation is due to the fact that the new BHF value is not set directly to the optimal value. It is iteratively calculated based on the PID coefficients, which are determined by the difference between the measured draw-in and the optimal one.

4. Conclusions

This work proposed an in-line control type to achieve a defect-free component at the end of the deep drawing process. This control logic is a novel feedforward approach, in which, unlike classic feedforward control, the variability of noise factors is estimated during the process by acquiring the draw-in of the blank at critical points. Based on the estimation of the new working conditions, the optimal blank holder force that avoids critical issues on the component is calculated. In this work, the only noise parameter considered was the friction coefficient, and the estimation of the new value of the friction coefficient and the corresponding optimal blank holder force was possible through a surrogate model developed based on numerical simulations data.
The results confirmed the effectiveness of this type of control eliminating the need for multiple adjustments to the blank holder force. However, operational limits were identified. The control works if the adjustment of the blank holder force occurs within a certain timeframe, tc, which decreases with reduced friction coefficient. Delayed adjustments pose risks of irrecoverable blank sliding, leading to fractures or surface deflection.
Additionally, it was established that before implementing the control, a waiting period of approximately 1 s is necessary for the system to identify new lubrication conditions and estimate the friction coefficient at the blank–tool interface.
Future developments include:
  • Verifying the robustness of this type of control by introducing other fluctuations into the system, such as material properties;
  • Implementing the designed control on a physical press and developing a machine learning method for self-learning and self-updating. This means that the control system improves its efficiency by exploiting data acquired during each deep drawing operation, thereby expanding the initial database obtained from numerical simulations.

Author Contributions

Conceptualisation, L.T. and M.E.P.; methodology, L.T. and M.E.P.; software, M.E.P. and A.N.D.; validation, M.E.P.; formal analysis, M.E.P.; investigation, M.E.P.; resources, L.T.; data curation, M.E.P.; writing—original draft preparation, M.E.P.; writing—review and editing, M.E.P. and L.T.; visualisation, M.E.P.; supervision, L.T.; project administration, L.T.; funding acquisition, L.T. All authors have read and agreed to the published version of the manuscript.

Funding

This research was funded by the Italian Ministry of University and Research (MUR) under the MISE project “MANAGE 5.0”, grant number: F/310302/01-05/X56.

Data Availability Statement

Not applicable.

Acknowledgments

The authors are grateful to AutoForm Engineering GmbH for the support in FE model development and to partners of the PICO & PRO project.

Conflicts of Interest

The authors declare no conflict of interest.

References

  1. Chen, K.; Korkolis, Y.P. Industry 4.0 in stamping: A wrinkling indicator for reduced-order modeling of deep-drawing processes. Procedia Manuf. 2020, 51, 864–869. [Google Scholar] [CrossRef]
  2. Psarommatis, F.; Sousa, J.; Mendonça, J.P.; Kiritsis, D. Zero-defect manufacturing the approach for higher manufacturing sustainability in the era of industry 4.0: A position paper. Int. J. Prod. Res. 2022, 60, 73–91. [Google Scholar] [CrossRef]
  3. Awasthi, A.; Saxena, K.K.; Arun, V. Sustainable and smart metal forming manufacturing process. Mater. Today-Proc. 2021, 44, 2069–2079. [Google Scholar] [CrossRef]
  4. Muñiz, L.; Trinidad, J.; Garcia, E.; Peinado, I.; Montes, N.; Galdos, L. On the Use of Advanced Friction Models for the Simulation of an Industrial Stamping Process including the Analysis of Material and Lubricant Fluctuations. Lubricants 2023, 11, 193. [Google Scholar] [CrossRef]
  5. Fischer, P.; Heingärtner, J.; Duncan, S.; Hora, P. On part-to-part feedback optimal control in deep drawing. J. Manuf. Process 2020, 50, 403–411. [Google Scholar] [CrossRef]
  6. Wiebenga, J.; Atzema, E.; An, Y.; Vegter, H.; Boogaard, A.v.D. Effect of material scatter on the plastic behavior and stretchability in sheet metal forming. J. Mater. Process Technol. 2014, 214, 238–252. [Google Scholar] [CrossRef]
  7. Harsch, D.; Heingärtner, J.; Renkci, Y.; Hora, P. Influence of scattering material properties on the robustness of deep drawing processes. In 10th Forming Technology Forum. Model Based Control for Smart Forming Processes; University of Twente: Enschede, The Netherland, 2017. [Google Scholar]
  8. Fischer, P.; Harsch, D.; Heingärtner, J.; Renkci, Y.; Hora, P. Inline feedback control for deep drawing applications. IOP Conf. Ser. Mater. Sci. Eng. 2016, 159, 012006. [Google Scholar] [CrossRef]
  9. Grüebler, R.; Hora, P. Temperature dependent friction modeling for sheet metal forming. Int. J. Mater. Form. 2009, 2, 251–254. [Google Scholar] [CrossRef]
  10. Marretta, L.; Ingarao, G.; Di Lorenzo, R. Design of sheet stamping operations to control springback and thinning: A multi-objective stochastic optimization approach. Int. J. Mech. Sci. 2010, 52, 914–927. [Google Scholar] [CrossRef]
  11. Gao, X.; Hong, Z.; Feng, Y.; Wang, T.; Li, Y.; Tan, J. A 6-sigma robust optimization method for stamping forming of automobile covering parts based on residual error and radial basis interpolation. J. Mech. Sci. Technol. 2021, 35, 4627–4642. [Google Scholar] [CrossRef]
  12. Bici, M.; Campana, F.; Cimolin, F.; Rizzo, L. Robust die compensation in sheet metal design through the integration of dual response surface and shape function optimization. Math. Probl. Eng. 2019, 2019, 7357135. [Google Scholar] [CrossRef]
  13. Tang, X.; Wang, Z.; Deng, L.; Wang, X.; Long, J.; Jiang, X.; Jin, J.; Xia, J. A Review of the Intelligent Optimization and Decision in Plastic Forming. Materials 2022, 15, 7019. [Google Scholar] [CrossRef]
  14. Choudhari, C.S.; Khasbage, S.S. Experimental investigation of forming parameters for square cup deep drawing process. Mater. Today-Proc. 2021, 44, 4261–4267. [Google Scholar] [CrossRef]
  15. Feng, Y.; Hong, Z.; Gao, Y.; Lu, R.; Wang, Y.; Tan, J. Optimization of variable blank holder force in deep drawing based on support vector regression model and trust region. Int. J. Adv. Manuf. Tech. 2019, 105, 4265–4278. [Google Scholar] [CrossRef]
  16. Atul, S.T.; Babu, M.L. A review on effect of thinning, wrinkling and spring-back on deep drawing process. Proc. Inst. Mech. Eng. B-J. Eng. 2019, 233, 1011–1036. [Google Scholar] [CrossRef]
  17. Fischer, P.; Heingärtner, J.; Renkci, Y.; Hora, P. Experiences with inline feedback control and data acquisition in deep drawing. Procedia Manuf. 2018, 15, 949–954. [Google Scholar] [CrossRef]
  18. Fischer, P.; Harsch, D.; Heingärtner, J.; Renkci, Y.; Hora, P. Implementation of feedback control in kitchen sink production. IOP Conf. Ser. Mater. Sci. Eng. 2018, 418, 012110. [Google Scholar] [CrossRef]
  19. Fischer, P.; Harsch, D.; Heingärtner, J.; Renkci, Y.; Hora, P. A knowledge-based control system for the robust manufacturing of deep drawn parts. Procedia Eng. 2017, 207, 42–47. [Google Scholar] [CrossRef]
  20. Palmieri, M.E.; Lorusso, V.D.; Tricarico, L. Robust optimization and Kriging metamodeling of deep-drawing process to obtain a regulation curve of blank holder force. Metals 2021, 11, 319. [Google Scholar] [CrossRef]
  21. Endelt, B.; Tommerup, S.; Danckert, J. A novel feedback control system–Controlling the material flow in deep drawing using distributed blank-holder force. J. Mater. Process Tech. 2013, 213, 36–50. [Google Scholar] [CrossRef]
  22. Endelt, B.; Nielsen, K.B.; Danckert, J. New framework for on-line feedback control of a deep-drawing operation. J. Mater. Process Tech. 2006, 177, 426–429. [Google Scholar] [CrossRef]
  23. Brun, M.; Ghiotti, A.; Simonetto, E.; Bruschi, S.; Filippi, S. Variable blank holder pressure by magneto-rheological actuators in deep drawing. Proc. CIRP 2023, 119, 932–937. [Google Scholar] [CrossRef]
  24. Cavone, G.; Bozza, A.; Carli, R.; Dotoli, M. MPC-based process control of deep drawing: An industry 4.0 case study in automotive. IEEE Trans. Autom. Sci. Eng. 2022, 19, 1586–1598. [Google Scholar] [CrossRef]
  25. Siegert, K.; Ziegler, M.; Wagner, S. Closed loop control of the friction force. Deep drawing process. J. Mater. Process Tech. 1997, 71, 126–133. [Google Scholar] [CrossRef]
  26. Lo, S.W.; Yang, T.C. Closed-loop control of the blank holding force in sheet metal forming with a new embedded-type displacement sensor. Int. J. Adv. Manuf. Tech. 2004, 24, 553–559. [Google Scholar] [CrossRef]
  27. Hsu, C.W.; Ulsoy, A.G.; Demeri, M.Y. Development of process control in sheet metal forming. J. Mater. Process Tech. 2002, 127, 361–368. [Google Scholar] [CrossRef]
  28. Palmieri, M.E.; Tricarico, L. Control of draw-in in the deep-drawing process by regulating the force on the blank holder. IOP Conf. Ser. Mater. Sci. Eng. 2022, 1238, 012071. [Google Scholar] [CrossRef]
  29. Tricarico, L.; Palmieri, M.E. Robust Design of Deep Drawing Process through In-Line Feedback Control of the Draw-In. Appl. Sci. 2023, 13, 1717. [Google Scholar] [CrossRef]
  30. Chen, K.; Carter, A.J.; Korkolis, Y.P. Flange wrinkling in deep-drawing: Experiments, simulations and a reduced-order model. J. Manuf. Mater. Process 2022, 6, 76. [Google Scholar] [CrossRef]
  31. Available online: https://automotive.arcelormittal.com/products/flat/drawing_steels/drawing (accessed on 1 September 2023).
  32. Available online: https://www.esb-group.com/en/products-din-en/cold-rolled-steel/ (accessed on 1 September 2023).
  33. AutoForm, R10; AutoForm Engineering GmbH: Freienbach, Switzerland, 2019.
  34. Kleijnen, J.P.C. Kriging metamodeling in simulation: A review. Eur. J. Oper. Res. 2009, 192, 707–716. [Google Scholar] [CrossRef]
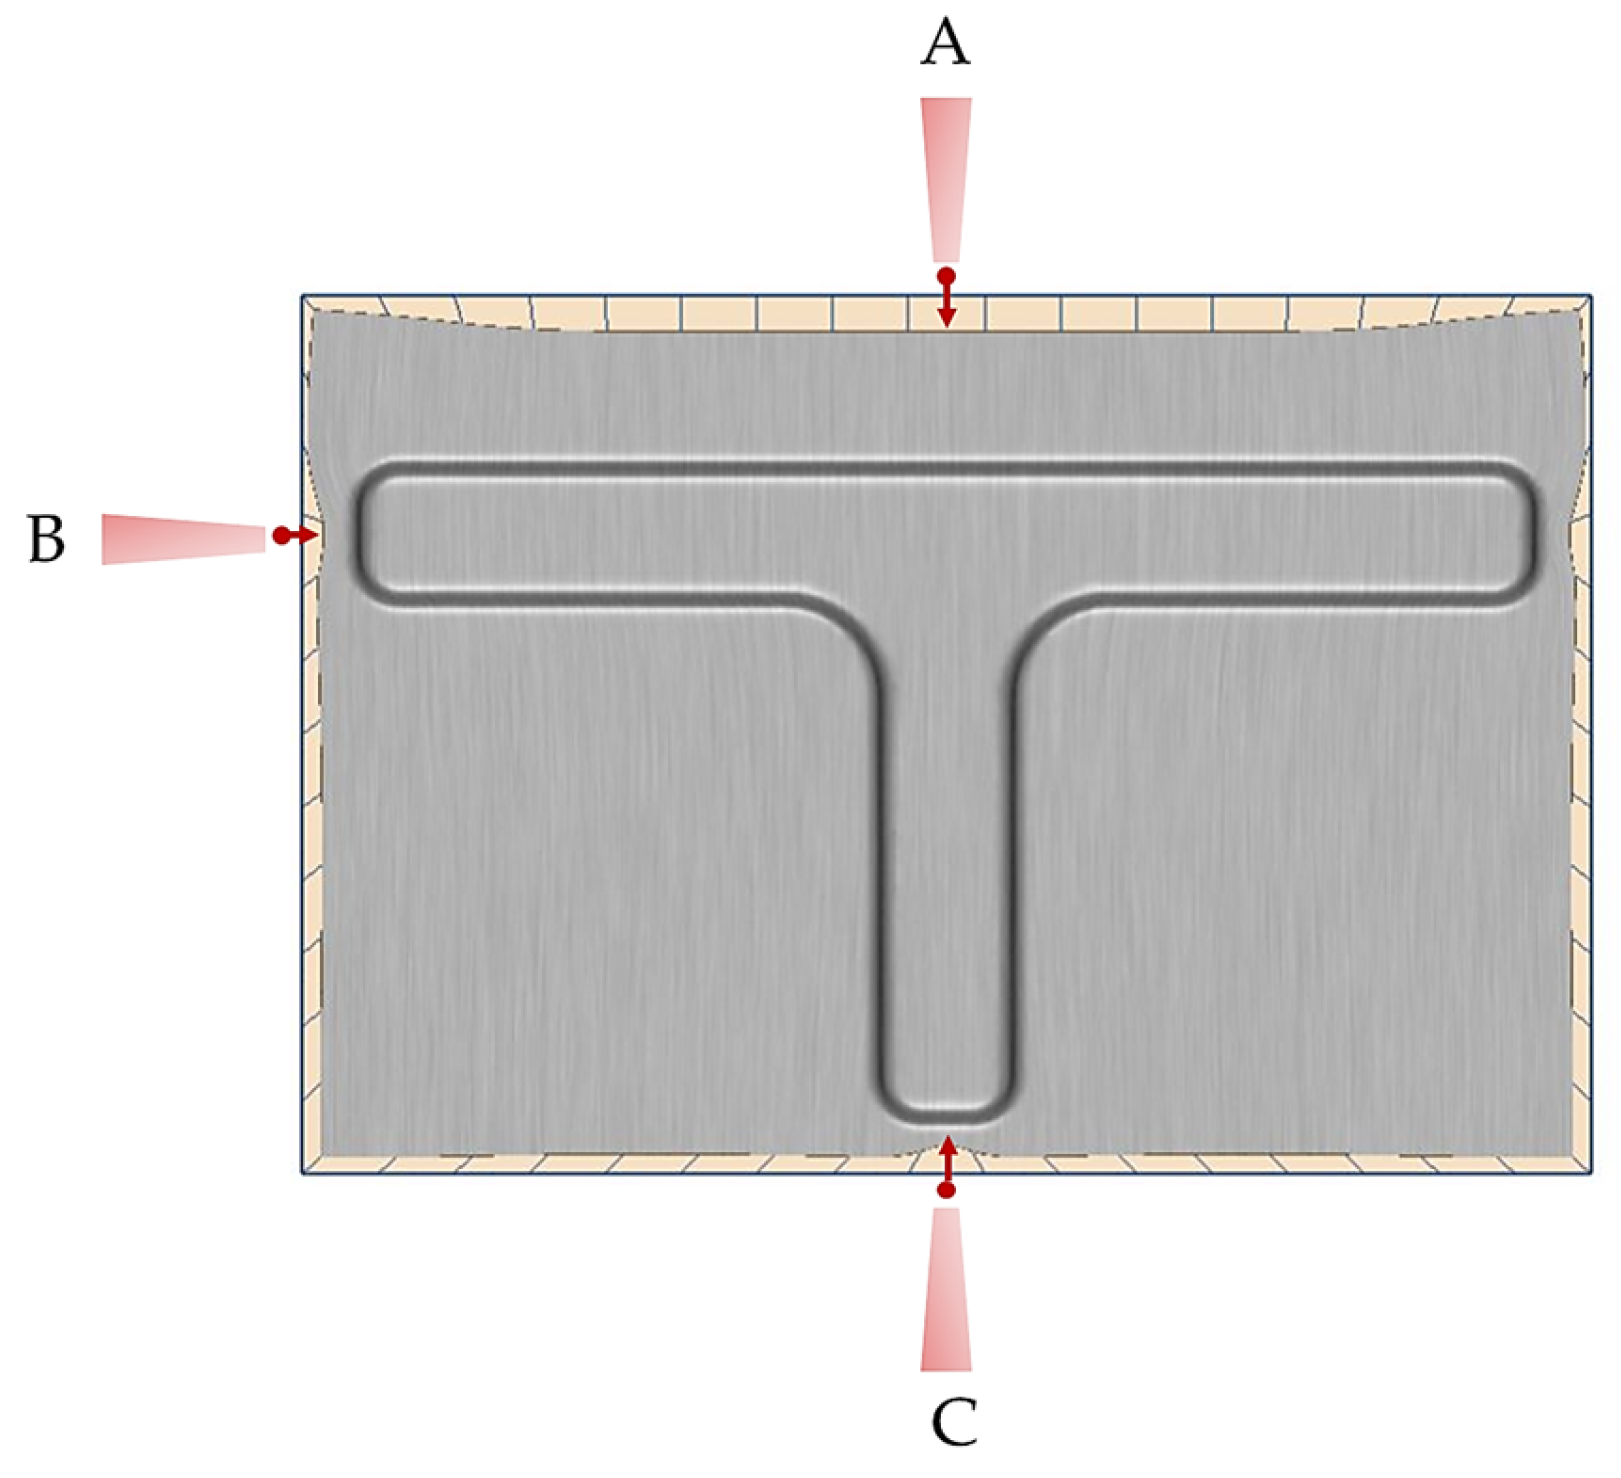
Figure 1. T-shaped component highlighting draw-in measurement points (A, B and C).
Jmmp 07 00190 g001
Figure 2. Scheme of the adopted methodology.
Jmmp 07 00190 g002
Figure 3. (a) Hydraulic press machine. (b) Tools mounted on the press, highlighting the laser triangulation sensors and the black nylon sheet on the blank.
Jmmp 07 00190 g003
Figure 4. (a) Geometry of the tools modelled in the FE environment. (b) Kinematic diagram of the tools during the deep drawing process.
Jmmp 07 00190 g004
Figure 5. (a) Areas of the component with formability defects (thinning in TA and TB). (b) Area of the component with cosmetic defects (surface deflections in SD).
Jmmp 07 00190 g005
Figure 6. Flowchart of the control logic.
Jmmp 07 00190 g006
Figure 7. Experimental results of deep drawn component with (a) BHF = 375 kN and p = 20 mm, (b) BHF = 500 kN and p = 30 mm, (c) BHF = 650 kN and p = 30 mm.
Jmmp 07 00190 g007
Figure 8. FE results of deep drawn component with (a) BHF = 375 kN and p = 20 mm, (b) BHF = 500 kN and p = 30 mm, (c) BHF = 650 kN and p = 30 mm.
Jmmp 07 00190 g008
Figure 9. Numerical and experimental behaviour of blank draw-in at points A, B, and C for BHFopt* = 650 kN and popt* = 30 mm.
Jmmp 07 00190 g009
Figure 10. (a) Component deep drawn with nylon sheet under optimal process parameters. (b) Experimental draw-in curves at points A, B, and C for this specific condition.
Jmmp 07 00190 g010
Figure 11. Draw-in over the time for μ = 0.11, μ = 0.05, and μ = 0.15 at (a) sensor A; (b) sensor B; (c) sensor C.
Jmmp 07 00190 g011
Figure 12. Meta-models depicting blank displacement as a function of time and friction coefficient at points (a) A, (b) B, (c) C.
Jmmp 07 00190 g012
Figure 13. Optimal BHF ranges as a function of the friction coefficient.
Jmmp 07 00190 g013
Figure 14. T-shaped component deep drawn assuming a friction coefficient of 0.08 (a) without BHF adjustment and (b) with BHF adjustment.
Jmmp 07 00190 g014
Figure 15. T-shaped component deep drawn assuming a friction coefficient of 0.14 (a) without BHF adjustment and (b) with BHF adjustment.
Jmmp 07 00190 g015
Figure 16. Time evolution of the blank draw-in and the blank holder force for (a) μ = 0.08 and (b) μ = 0.14.
Jmmp 07 00190 g016
Table 1. Polynomial coefficients in the equations describing the relationship between blank draw-in at the three points, time, and the friction coefficient.
di,Adi,Bdi,C
p00−3.550.853.43
p105.161.526.62
p0154.4−28.03−131.1
p200.890.651.63
p11−13.86−5.1−61.35
p02−239.3156.8869.2
Disclaimer/Publisher’s Note: The statements, opinions and data contained in all publications are solely those of the individual author(s) and contributor(s) and not of MDPI and/or the editor(s). MDPI and/or the editor(s) disclaim responsibility for any injury to people or property resulting from any ideas, methods, instructions or products referred to in the content.