1. Introduction
The research on methods for the continuous monitoring of sheet metal forming processes in general, especially the stamping process, has been continuously increasing in the last years, following the increased availability of enabling technologies such as sensors [
1], data mining software [
2], cloud and internet communication devices [
3], artificial intelligence (AI) methods [
4], and all the ingredients of the “Industry 4.0” revolution. Data-driven analysis strategies can help improve the monitoring methods of stamped part quality [
5], which generally requires the use of multivariate statistical methods [
6]. Greater attention has been devoted to maintenance strategies than quality. In deep drawing processes, part failure may occur independently of the health condition of the tools [
7]. Conversely, in progressive die stamping, a deterioration of the condition of the tools easily leads to a reduction in quality (or an increase in defects); therefore, an effective maintenance strategy also indirectly improves production quality. Predictive maintenance policies can address the mechanical and electrical components of the presses [
8] or, more frequently, aim to control and improve the life of tools (punches and dies). Predictive maintenance for tools can be focused on the monitoring of progressive wear [
9] phenomena and/or the detection/prevention of sudden failures or anomalies [
10].
Early Failure Detection and Condition Monitoring. The vast majority of smart and predictive maintenance approaches in the literature are aimed at early detection of such failures or anomalies in stamping or bending [
11,
12]. Several examples of algorithms for anomaly detection can be found. As an example, Shiu et al. [
13] developed a two-stage approach for progressive stamping using tonnage signals. The first stage uses a combined Haar transform and power spectrum analysis to map features extracted from aggregated signals to individual operations. The second stage develops a two-step control chart strategy for anomaly detection and identification. Since in progressive die stamping the tonnage comes from the combined effect of multiple simultaneously working tools, the force signal of a single stamping cycle must be segmented in smaller portions [
14,
15]. The problem of decomposing the force signals and identifying features inside the signals requires complex and sophisticated mathematical or artificial intelligence approaches, e.g., recurrence plots [
16], wavelets [
17], or machine learning approaches such as support vector machines (SVMs) [
18]. While the scientific literature on tool maintenance approaches in progressive die stamping centres on early failure detection, it is a strategy that presents some serious risks and drawbacks. In fact, progressive die stamping (especially for small metal parts) is a process with a very high throughput (tens of thousands of parts per shift), and a strategy based on early detection of failure might easily lead to the production of many defective parts and high costs. A more efficient architecture should, rather, be based on condition monitoring [
19] and preventive maintenance. In other words, rather than using in-process sensors to detect when the process has failed, condition-based maintenance [
20] helps by predicting the condition of tools in advance to make decisions that might either increase tool life or better schedule the maintenance tasks. Unfortunately, the complexity and the dimensionality of condition monitoring problems require a greater effort than those of early failure detection, and the literature that addresses this topic in progressive die stamping is very scarce.
The curse of dimensionality. Progressive die stamping is especially challenging because multiple tools and multiple signals are the cause of a cumbersome “curse of dimensionality” [
21] to any control or optimization process. To make things worse, when progressive die stamping involves tiny components, such as washers [
22], a single tooling setup can include more than 50 tools simultaneously operating and the stamping rate can be as high as several hundreds of strokes per minutes. In this case, not only are technologies required for the real-time handling of a very big amount of data [
23], but smart methods are needed for the filtering and compression of process signals [
24]. Modern presses are equipped with four force sensors, one for each of the press columns [
25], but four signals might not be enough to achieve effective decomposition and feature recognition. For this reason, multiple sensors are used to achieve a richer supply of data, such as acoustic sensors embedded in the tool holders [
26,
27,
28], thin film local load sensors [
29] or sensors to measure in-process the geometry [
30], the quality [
31] or the temperature [
32] of the stamped parts. Another problem connected to data-driven approaches is that in real industrial cases, signals may shift for reasons that are often unknown and lead to conditions that are “false positives”, i.e., conditions that apparently indicate an anomaly but that eventually correspond to regular production with good quality and no evidently worn or failed tools. Indeed, many sources of variability affect progressive die stamping, including material variations (thickness and properties), strip vibrations [
33], piloting imprecisions [
34] and many others. Another relevant issue connected with the progressive die stamping of small metal parts is the inherent difficulty of observing and measuring the progression of die wear in real industrial environments [
35].
The problem of managing the “big data” generated by multiple sensors over time calls for advanced techniques for data storage and simultaneous analysis of multiple data. Recently, the trend in the field of predictive maintenance obtained through the management of Big Data is to implement and use “data lakes” [
36] instead of more traditional and structured data bases. A data lake is a centralised repository that allows for the storage of structured, semi-structured and unstructured data at any scale. Its implementation in sheet metal forming problems is still in the beginning stage; the only example known to the authors is by prof. Klocke [
37]. When it comes to the problem of analysing the multiple data provided by multiple simultaneous sensors, so-called “sensor fusion” techniques are required (often applied to sheet metal forming, e.g., [
38]).
Barriers to industrial implementation. Several barriers limit the real industrial application of fully integrated, even semi-supervised, predictive maintenance plans based on in-process sensor acquisition [
39]. Due to the many practical issues listed above and the complexity of the problems, several approaches in the literature are either limited to lab-scale environments [
40] or are based on a very small sample of real industrial data. This is especially true for progressive die stamping of very small components, because tens of tools work simultaneously, the tonnage contribution of individual tools to the overall force profile is negligible and signal monitoring is extremely difficult. Even if it was technically and economically feasible to place an individual sensor per each tool, failure detection would still be difficult because of a poor signal-to-noise ratio [
41]. Conversely, the global tonnage signal is influenced and potentially shifted or altered by many phenomena and external interacting variables. Consequently, the effort required for training a robust AI is larger and longer than any industrial company can realistically bear. In conclusion, in this specific field, a simpler, process-specific approach is required to set up an effective and realistic procedure.
In this paper, a simple failure prevention approach is proposed that aims to simplify the inherent complexity of progressive die stamping of small parts and reduce the curse of dimensionality induced by it, circumventing the many problems described above. This method is based on a combination of global and local force sensors and uses upper bounds for the maximum values recorded by the sensors, above which unhealthy conditions may be triggered.
2. Description of the Test Cases
Two test cases were used to develop the proposed methodology. They are small washers made of C60S carbon steel, each produced in millions of parts per year. C60S is a low-alloyed medium carbon steel with 0.57–0.65% carbon content and 0.6–0.9% Mn. In
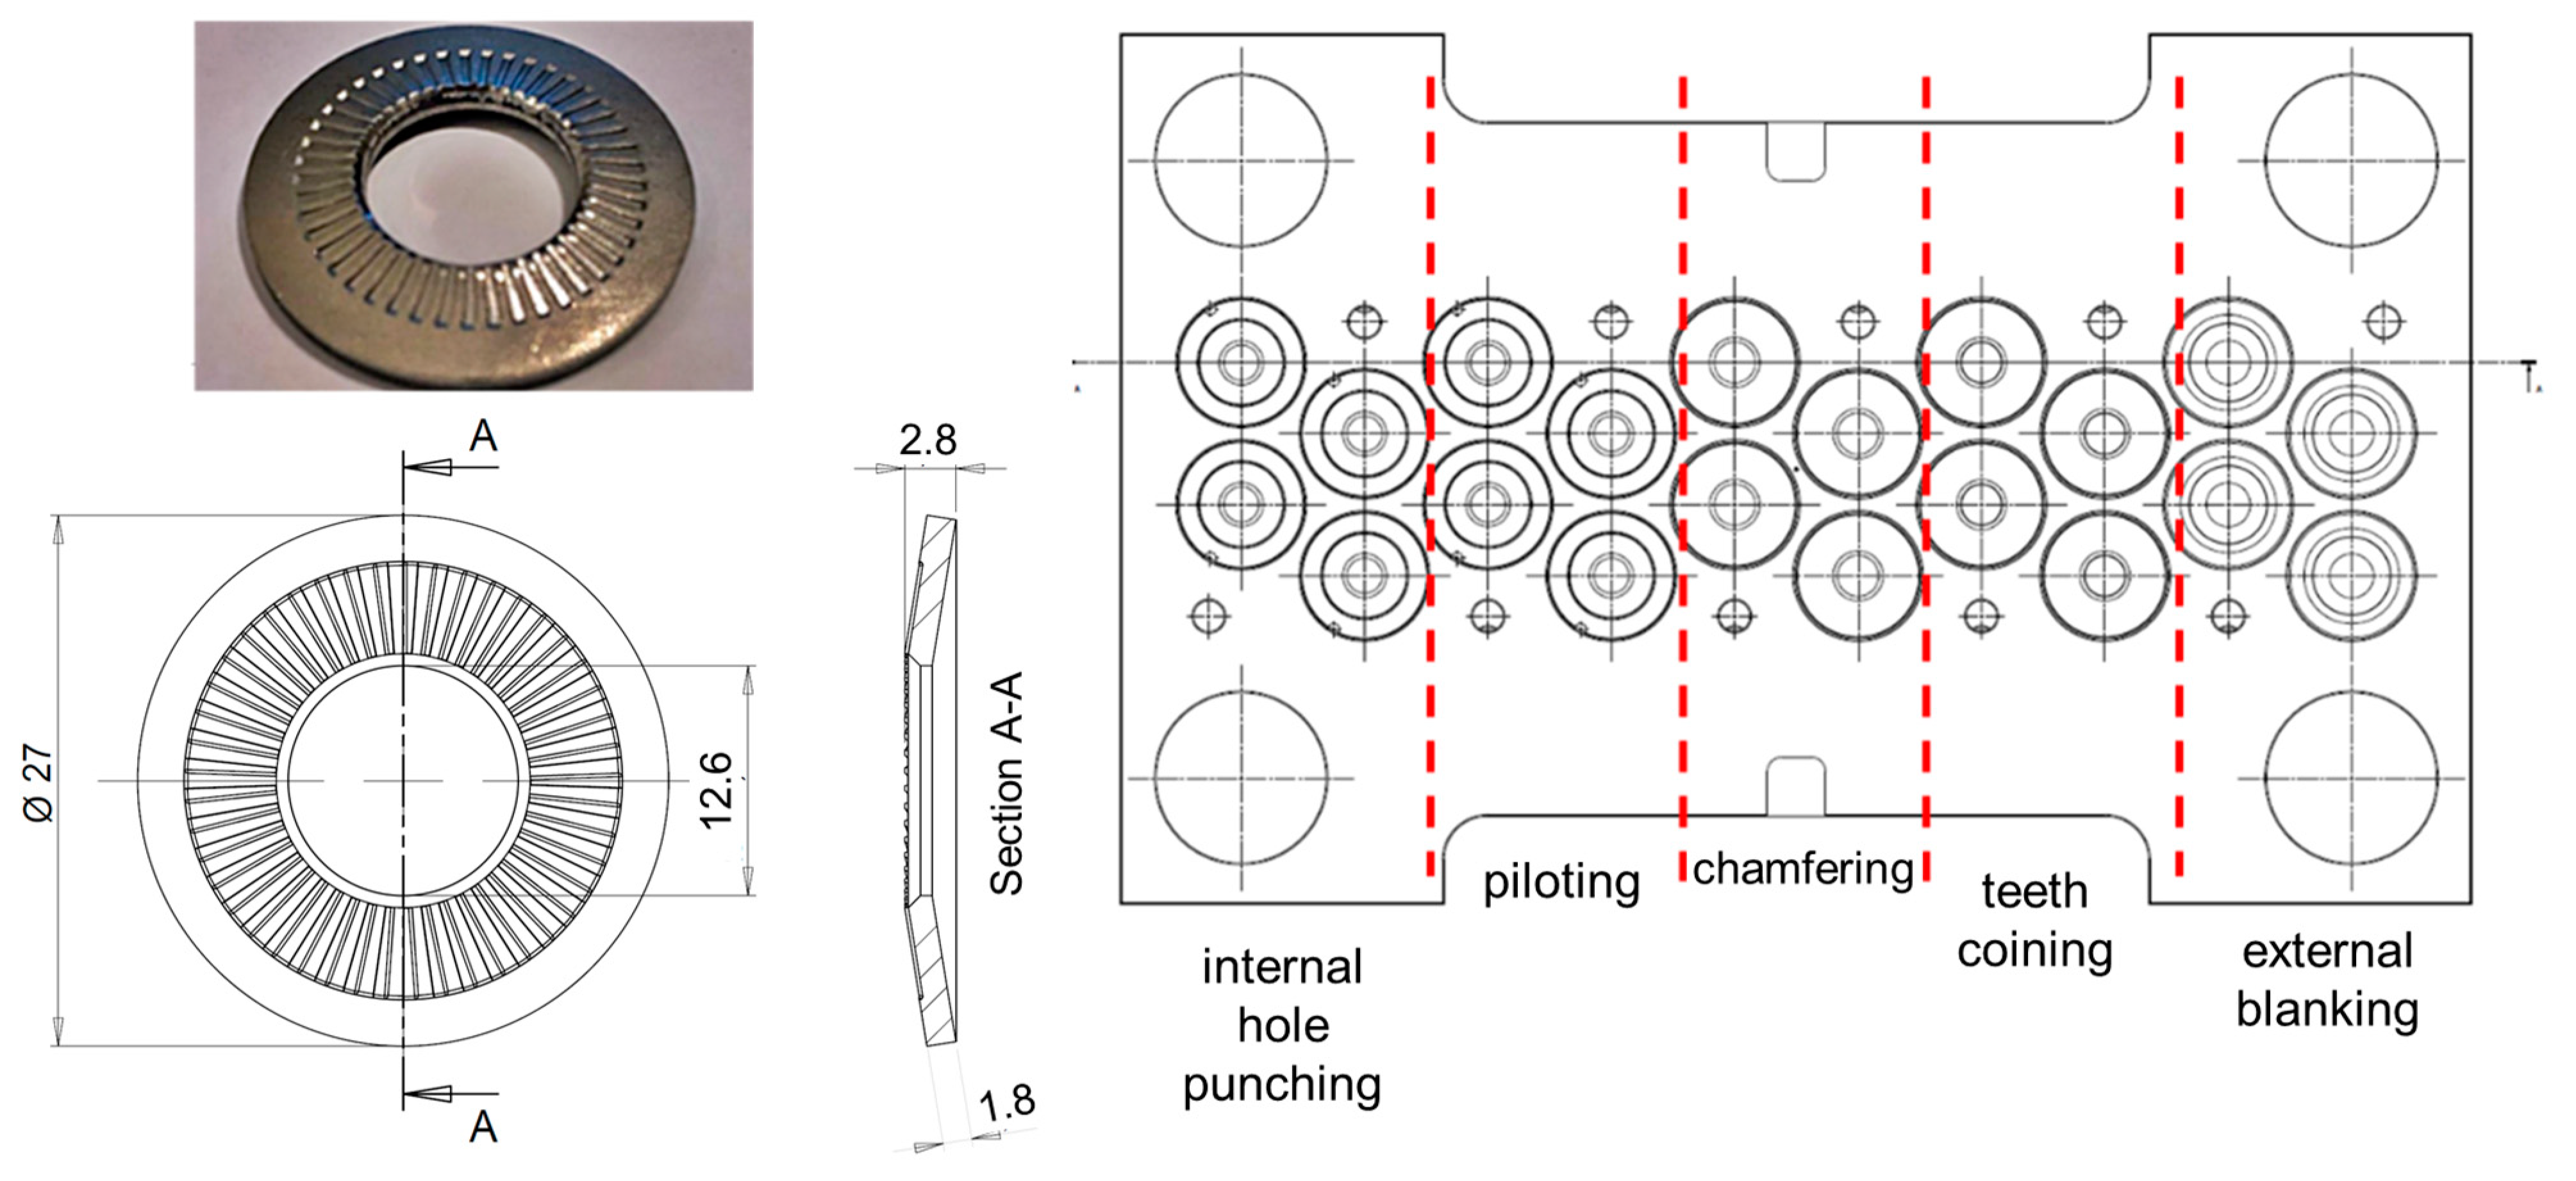
Figure 1, the drawings of the parts are shown and the tooling layout is presented. In
Table 1, the main features of the productions are listed.
In the first case (
Figure 1), the part is obtained with 5 stations (punching, piloting, chamfering, coining and blanking) and 4 parts are stamped at once. Therefore, a total of 40 tools (20 dies and 20 punches) operates in a single stroke of the progressive die stamping press. The press normally runs at 600 strokes per minute (SPM), with a potential production of 2400 washers per minute. In the second case (
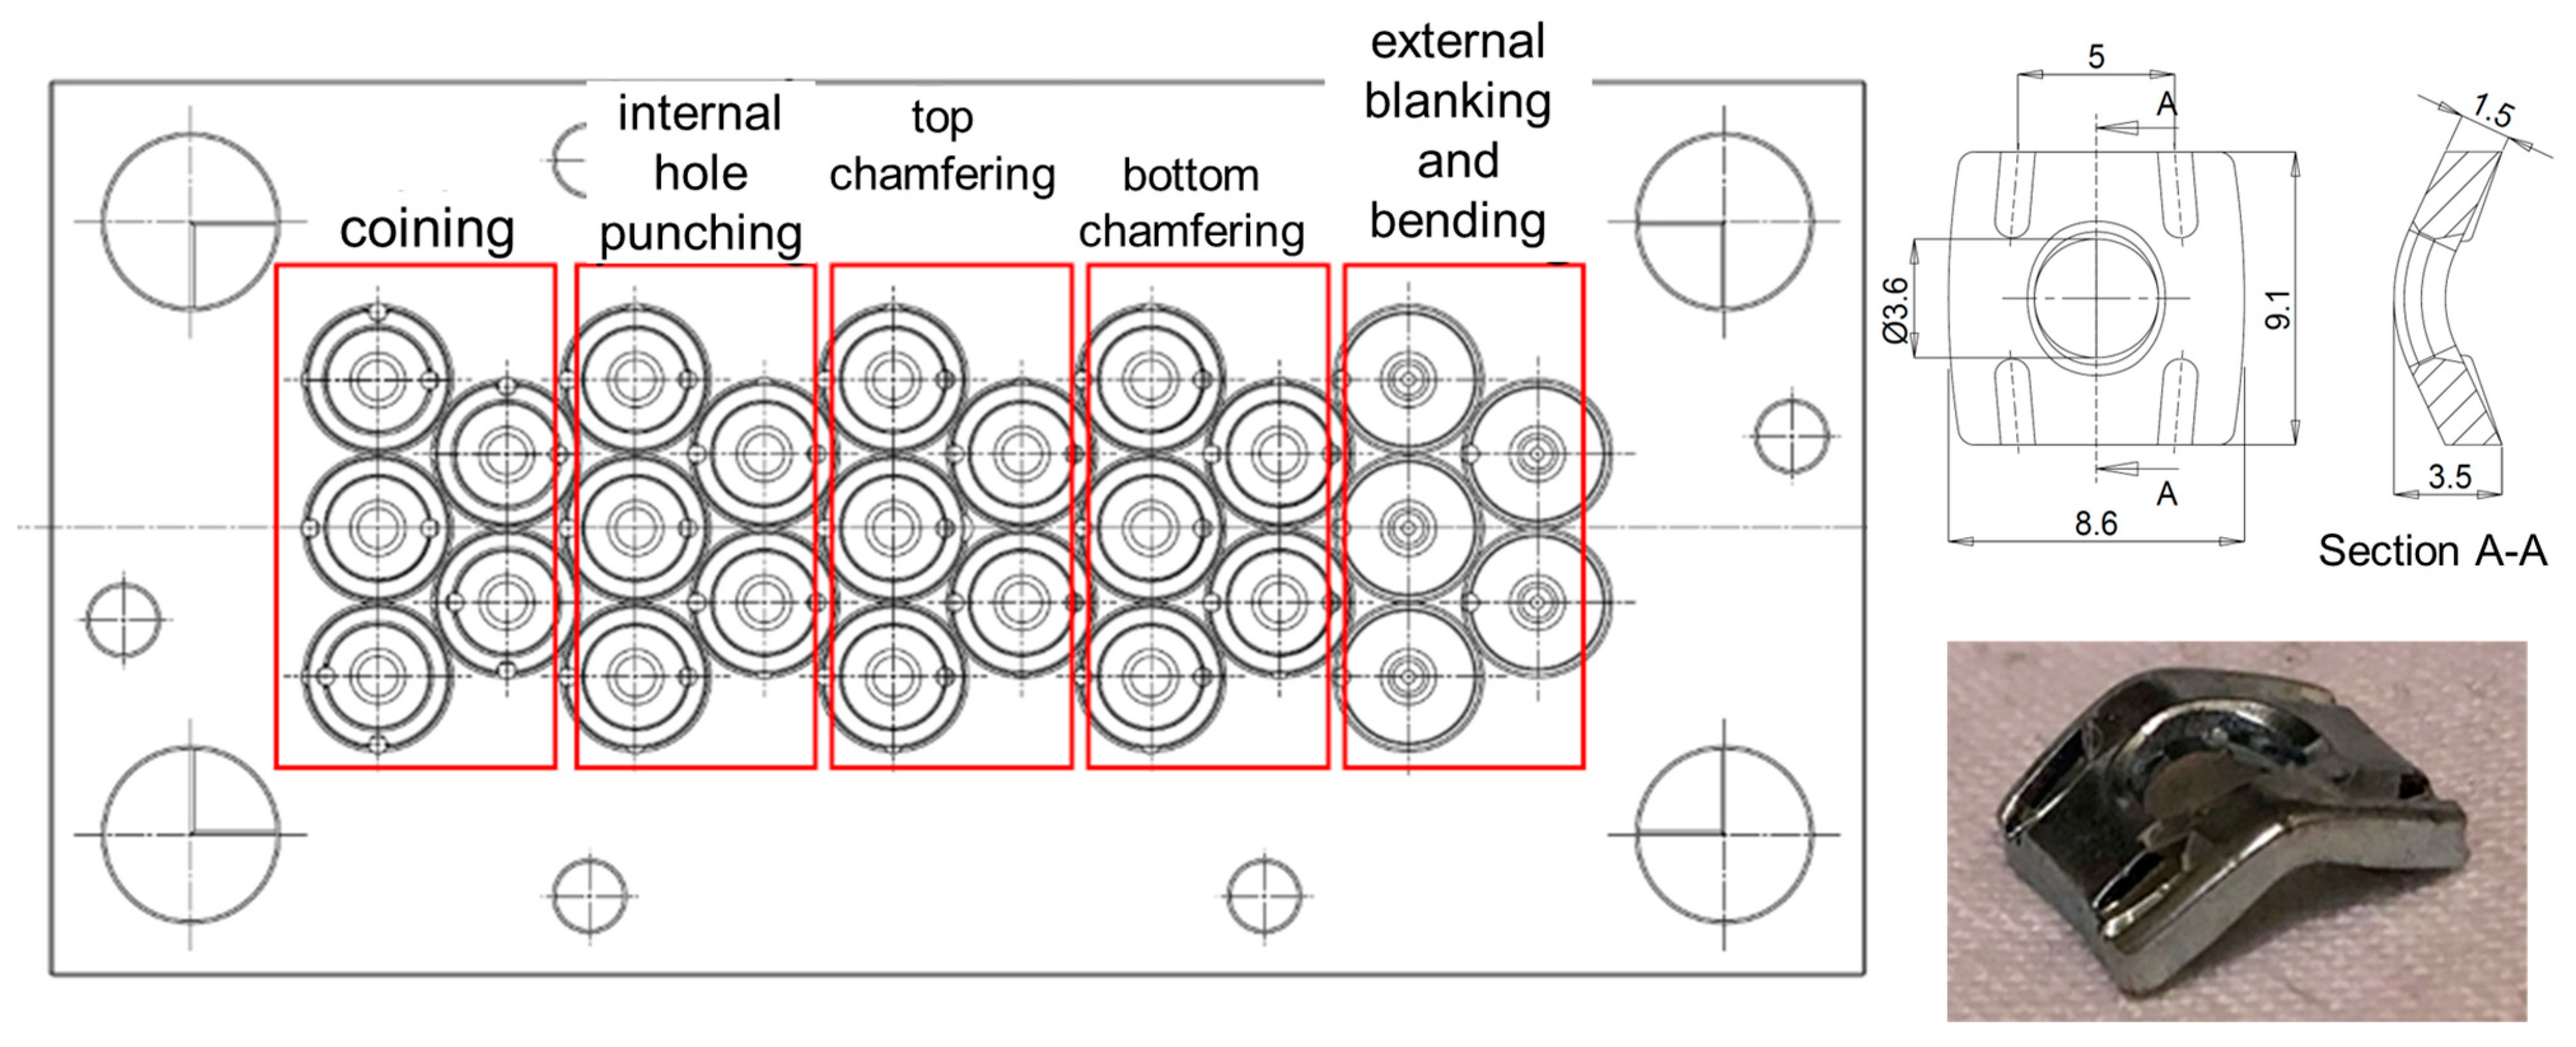
Figure 2), the part is obtained with 5 stations.
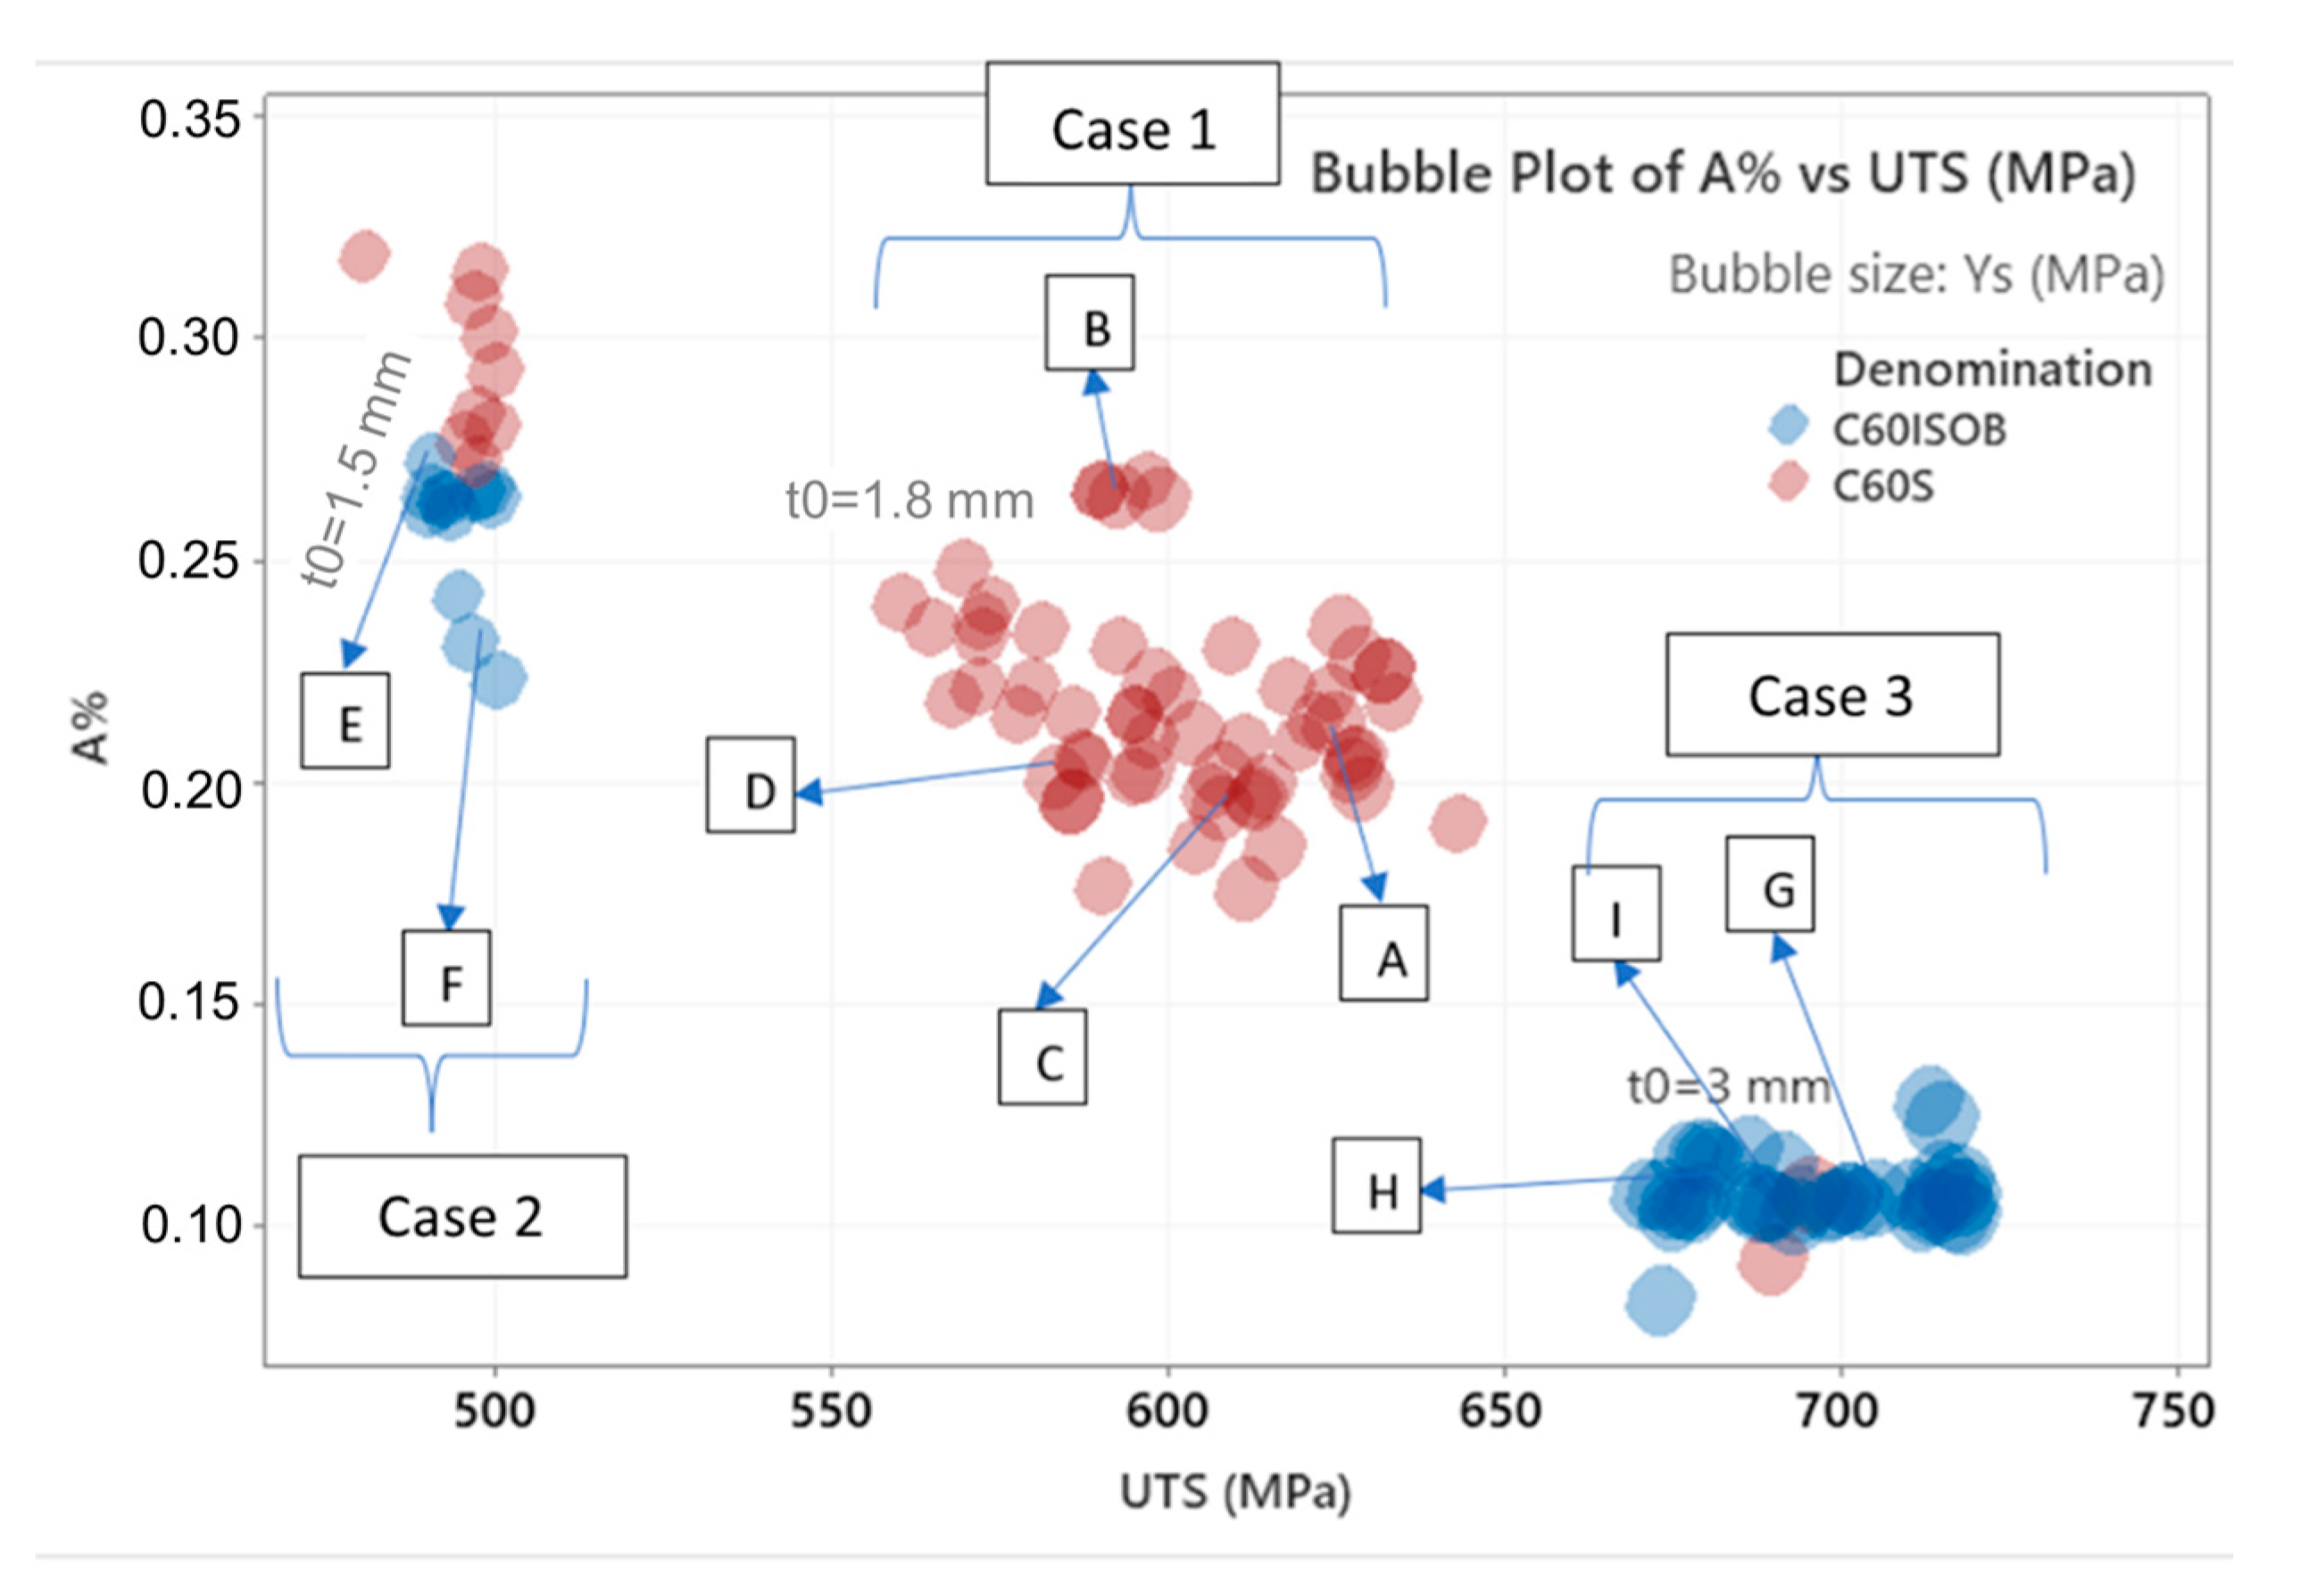
The material is nominally constant for all cases, but its actual material properties may vary from lot to lot as the coil is changed and to some extent even within a single coil. The material properties are also dependent on sheet thickness. The variability of the material properties was monitored over 20 months, with a summary reported in
Figure 3 in terms of ultimate tensile stress
UTS vs. elongation
A% and yield stress
Ys.
Although
Figure 3 shows large variability in the materials, the FEM simulations, which will be later described, evidence that the consequences of this variability on the stamping process are limited and may easily be confounded with other effects and sources of variation. C60ISOB is the same alloy of C60S but with a post-rolling thermal treatment to reduce its anisotropy. The initial thicknesses are
t0 = 1.8 ± 0.05 mm for case 1 and
t0 = 1.5 ± 0.05 mm for case 2.
3. FEM Simulations and Sensitivity Analysis
The test cases were simulated by means of the FEM software package Forge using Transvalor (a non-linear solver with implicit time integration). The main objective of the simulations was to model the sensitivity of process parameters and variations (material properties, sheet thickness, sheet alignment, tool geometry and precision, etc.) with respect to the following responses:
Numerical setup. FEA simulations were performed; for brevity, only a brief sample of the results is reported as follows. Only half of the tools were simulated, assuming a symmetry plane. The top die was simulated with the movement of a mechanical press operating at 500 rpm with a crank radius of 13 mm. Self-contact was enabled to prevent self-penetration of the material in case of folds.
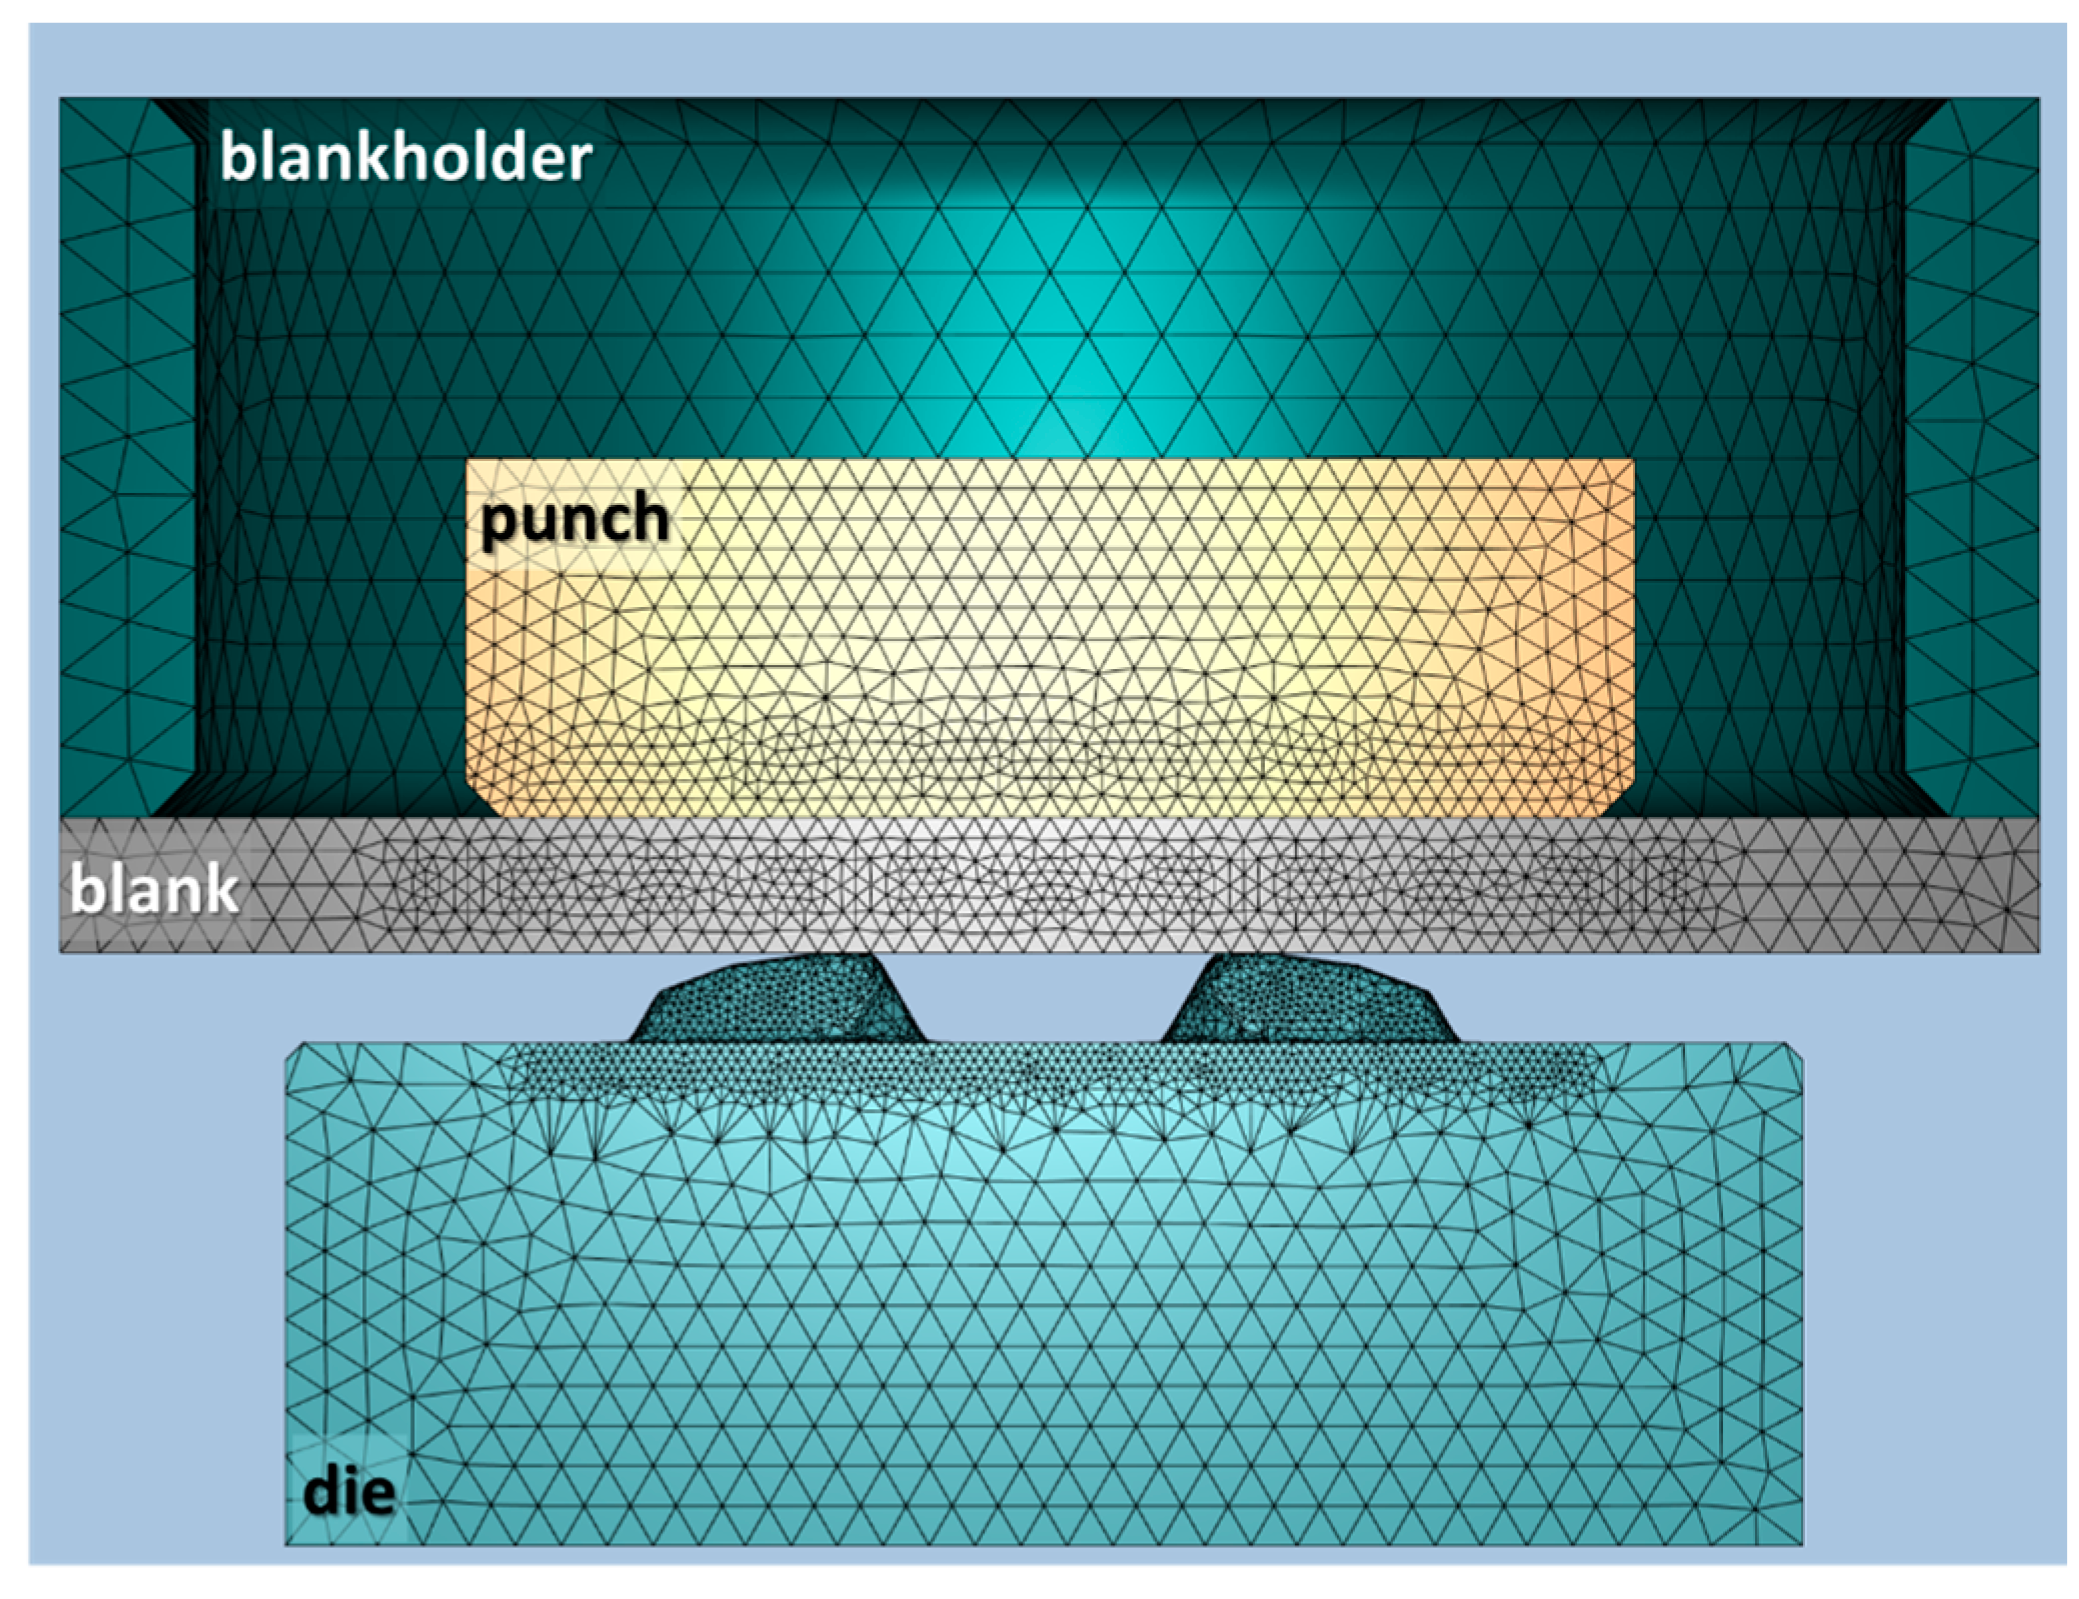
In the deformation and shearing zones, a fine mesh of tetrahedral elements with 0.2 mm size was built using mesh boxes, and the rest of the tools and the sheet were meshed with coarser mesh size. An example of initial meshing can be seen in
Figure 4 for the coining (embossing) station of case 2. Automatic remeshing on deformation was activated on the tetrahedral elements, with a strain threshold of 0.4.
The friction between the sheet and tools was modelled using a Coulomb-limited Tresca model, with the Coulomb coefficient μ assumed to be 0.1 and the Tresca friction factor equal to 0.2. The Latham and Cockcroft normalised damage model was activated for all simulations with an element deletion threshold of 0.4, activated for punching and blanking operation, to simulate shearing.
Simulations were run assuming rigid dies and then replicated with deformable purely elastic dies (Young’s modulus
E = 520 GPa for tungsten carbide tools and
E = 226.5 GPa for 1.3343 tool steel tools). For the calculation of wear indicators, a coating on the tools was assumed with 3000–3200 HV hardness. The reference sheet material was isotropic, with hardening modelled using the Hansel–Spittel equation. The C60 material suggested by the FORGE material database was used as a starting value to validate the simulations because it is well inside the cloud of possible materials shown in
Figure 3.
3.1. FEM Validation
A reference or base scenario was initially simulated for all cases. The simulations were validated with real data by comparing:
The real values of some relevant dimensions with simulated values;
The simulated and real maximum total pressing force values;
A simulated indicator of ductile damage FEAdamage with the statistical tool maintenance data related to tool failure by fracture;
A simulated indicator of progressive die wear FEAwear with the statistical tool maintenance data related to tool replacement or conditioning operations due to wear.
These comparisons were performed for all cases and they confirmed the reliability and accuracy of the FEM simulations. In
Table 2, comparisons are reported for some dimensions of the case 2 washer. As another example, in
Figure 5, the maximum simulated pressing force for 1/8 of the whole tool set is plotted for case 1 (the dented washer).
The total experimental force Fz must be divided by 8 to consider symmetry and to consider that 4 parts are formed simultaneously for case 1. The maximum simulated force amounts to nearly 14 tons, while the real values range between 12.4 and 14.4 tons.
Finally, the simulations were validated by comparing the simulated values of
FEAwear and
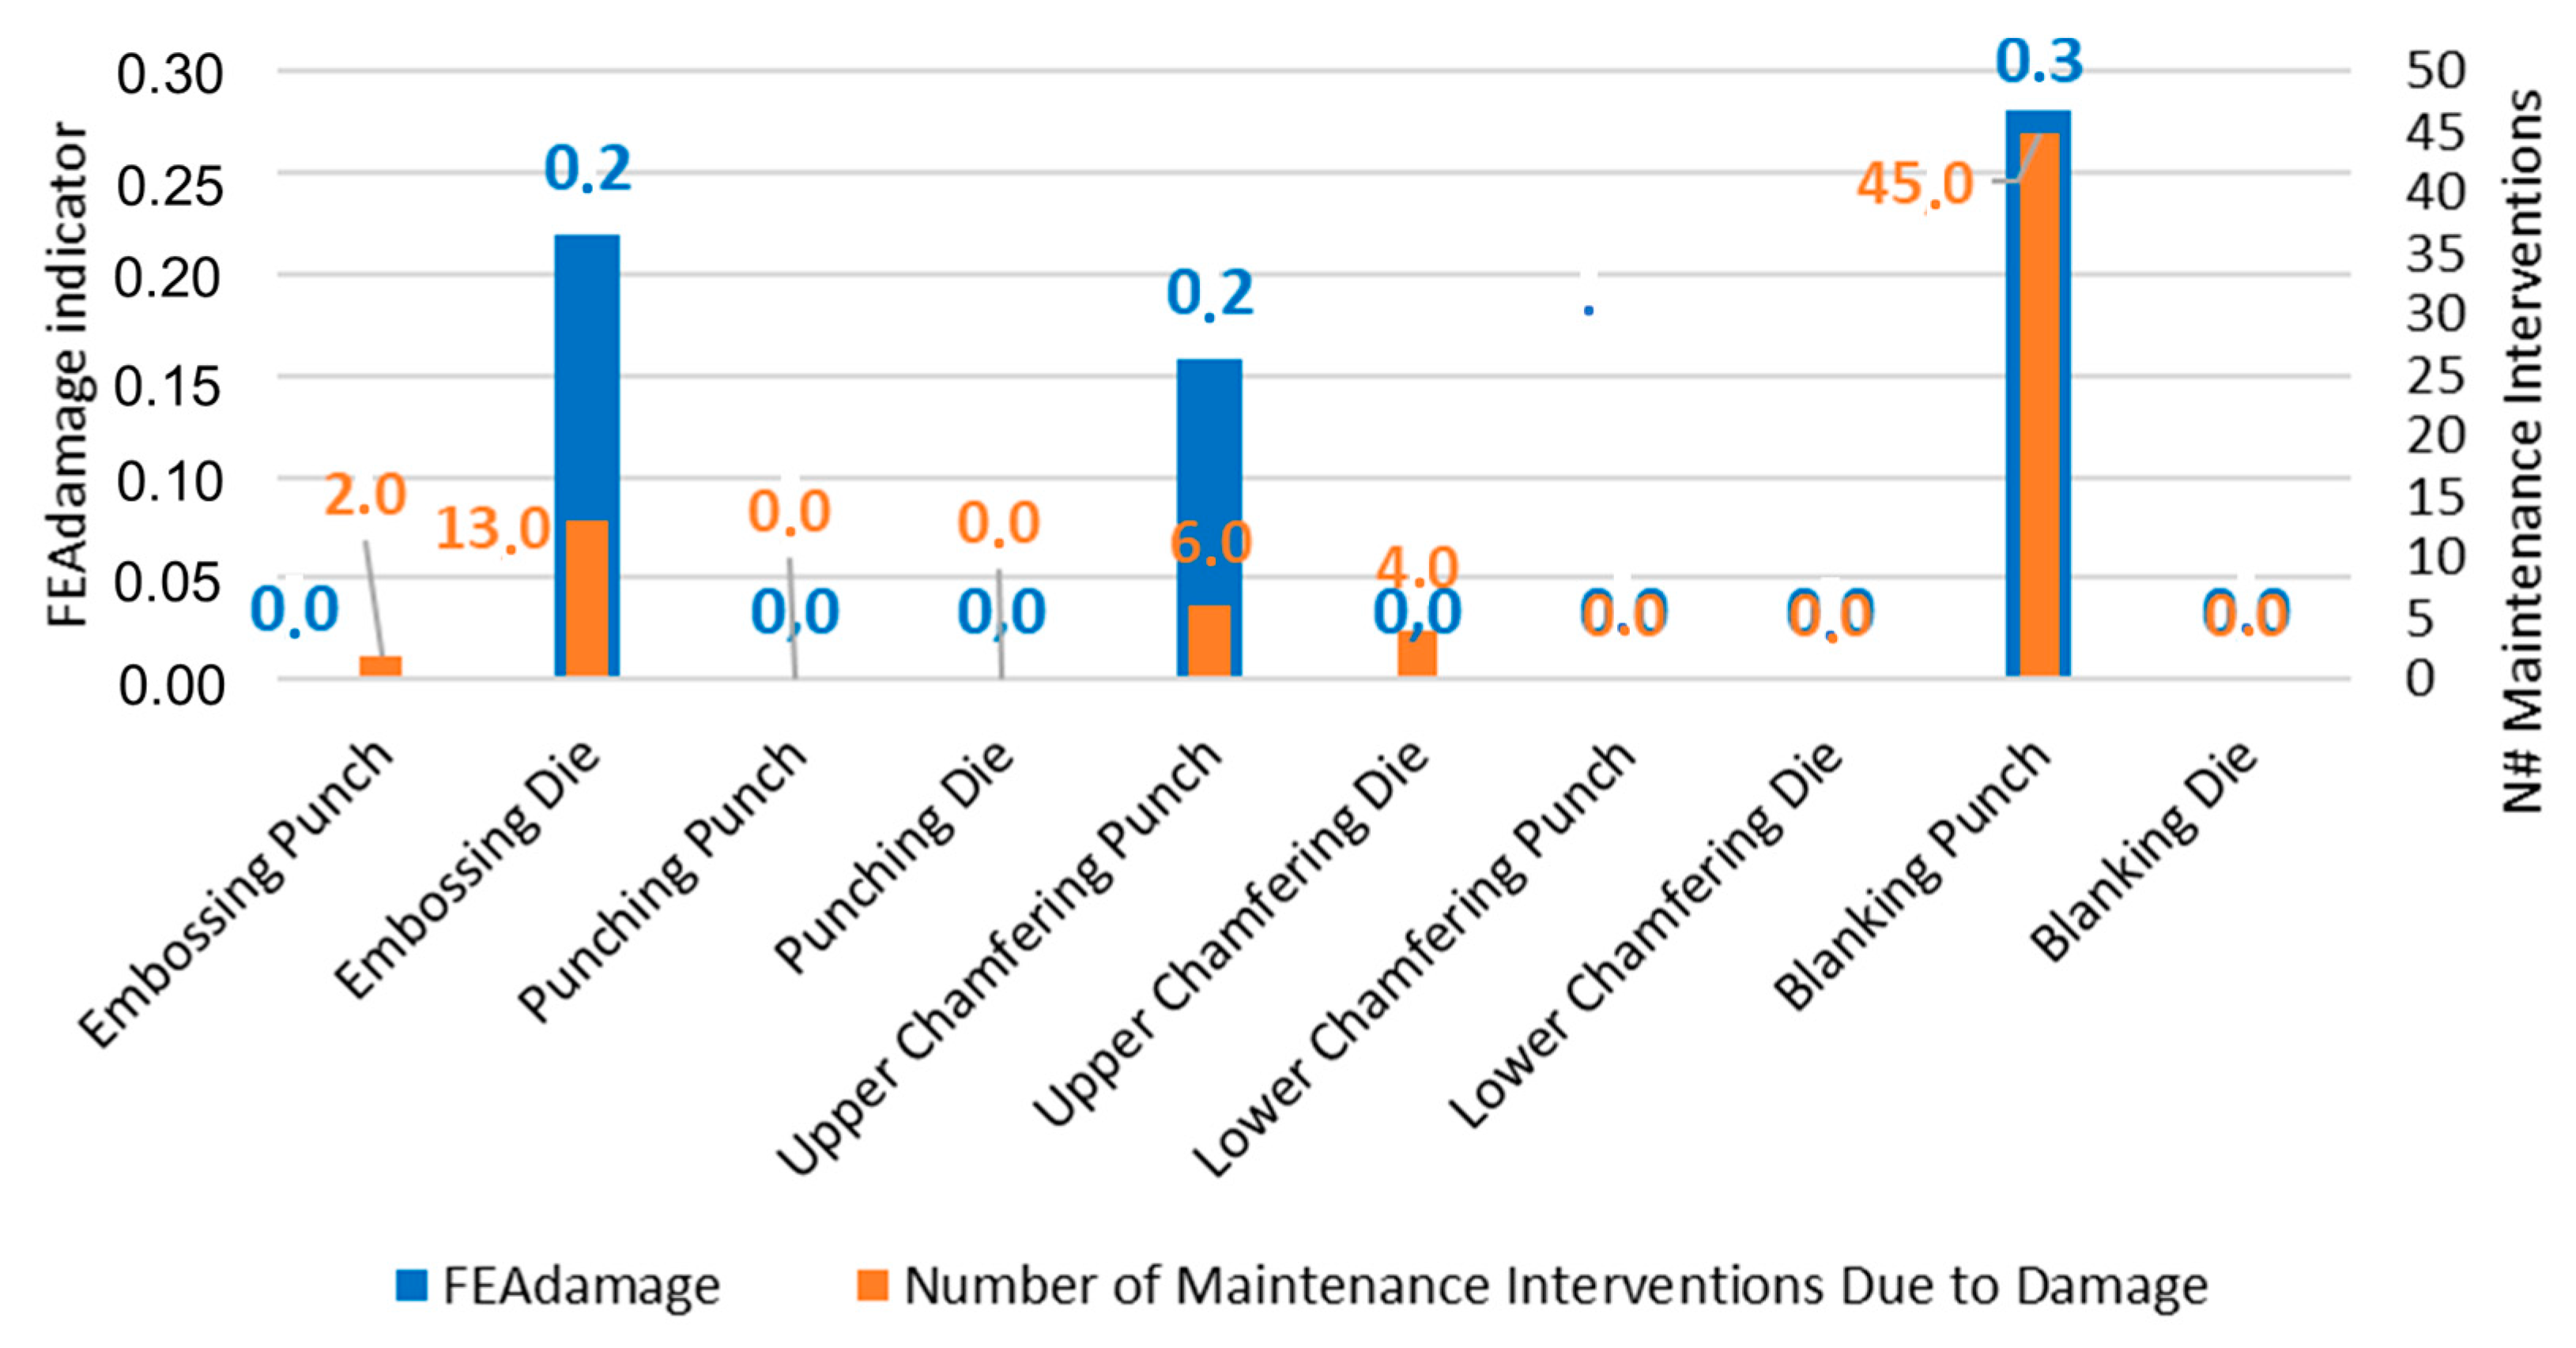
FEAdamage indicators to the actual maintenance data recorded over the last 4 years of production. An example is reported in
Figure 6 for case 2. The
FEAdamage indicator is built in order to provide a non-null value for tools at non-negligible risk of failure. In
Figure 6,
FEAdamage is larger than 0 only for the three tools (the embossing die, the upper chamfering punch and the blanking punch) that have the largest numbers of maintenance interventions. The figure shows, therefore, that the actual number of interventions correlates quite well with the proposed indicators. Similar considerations can be performed for
FEAwear, and the two indicators can be safely used in this type of sensitivity analysis.
3.2. Sensitivity to the Blank Material Properties and Thickness
The press force signal has very wide variations in real operations; it may increase or decrease depending on many factors. Different scenarios were simulated based on real situations to have a better understanding of the most critical factors affecting the press force. For brevity, they are here reported only for the most complex of the studied cases, i.e., case 1, the dented washer. For these sensitivity analyses, simulations were performed using rigid, non-deformable tools. The maximum press force was computed after reconstructing the signal, as already shown in
Figure 5. The sensitivity analyses described as follows were run:
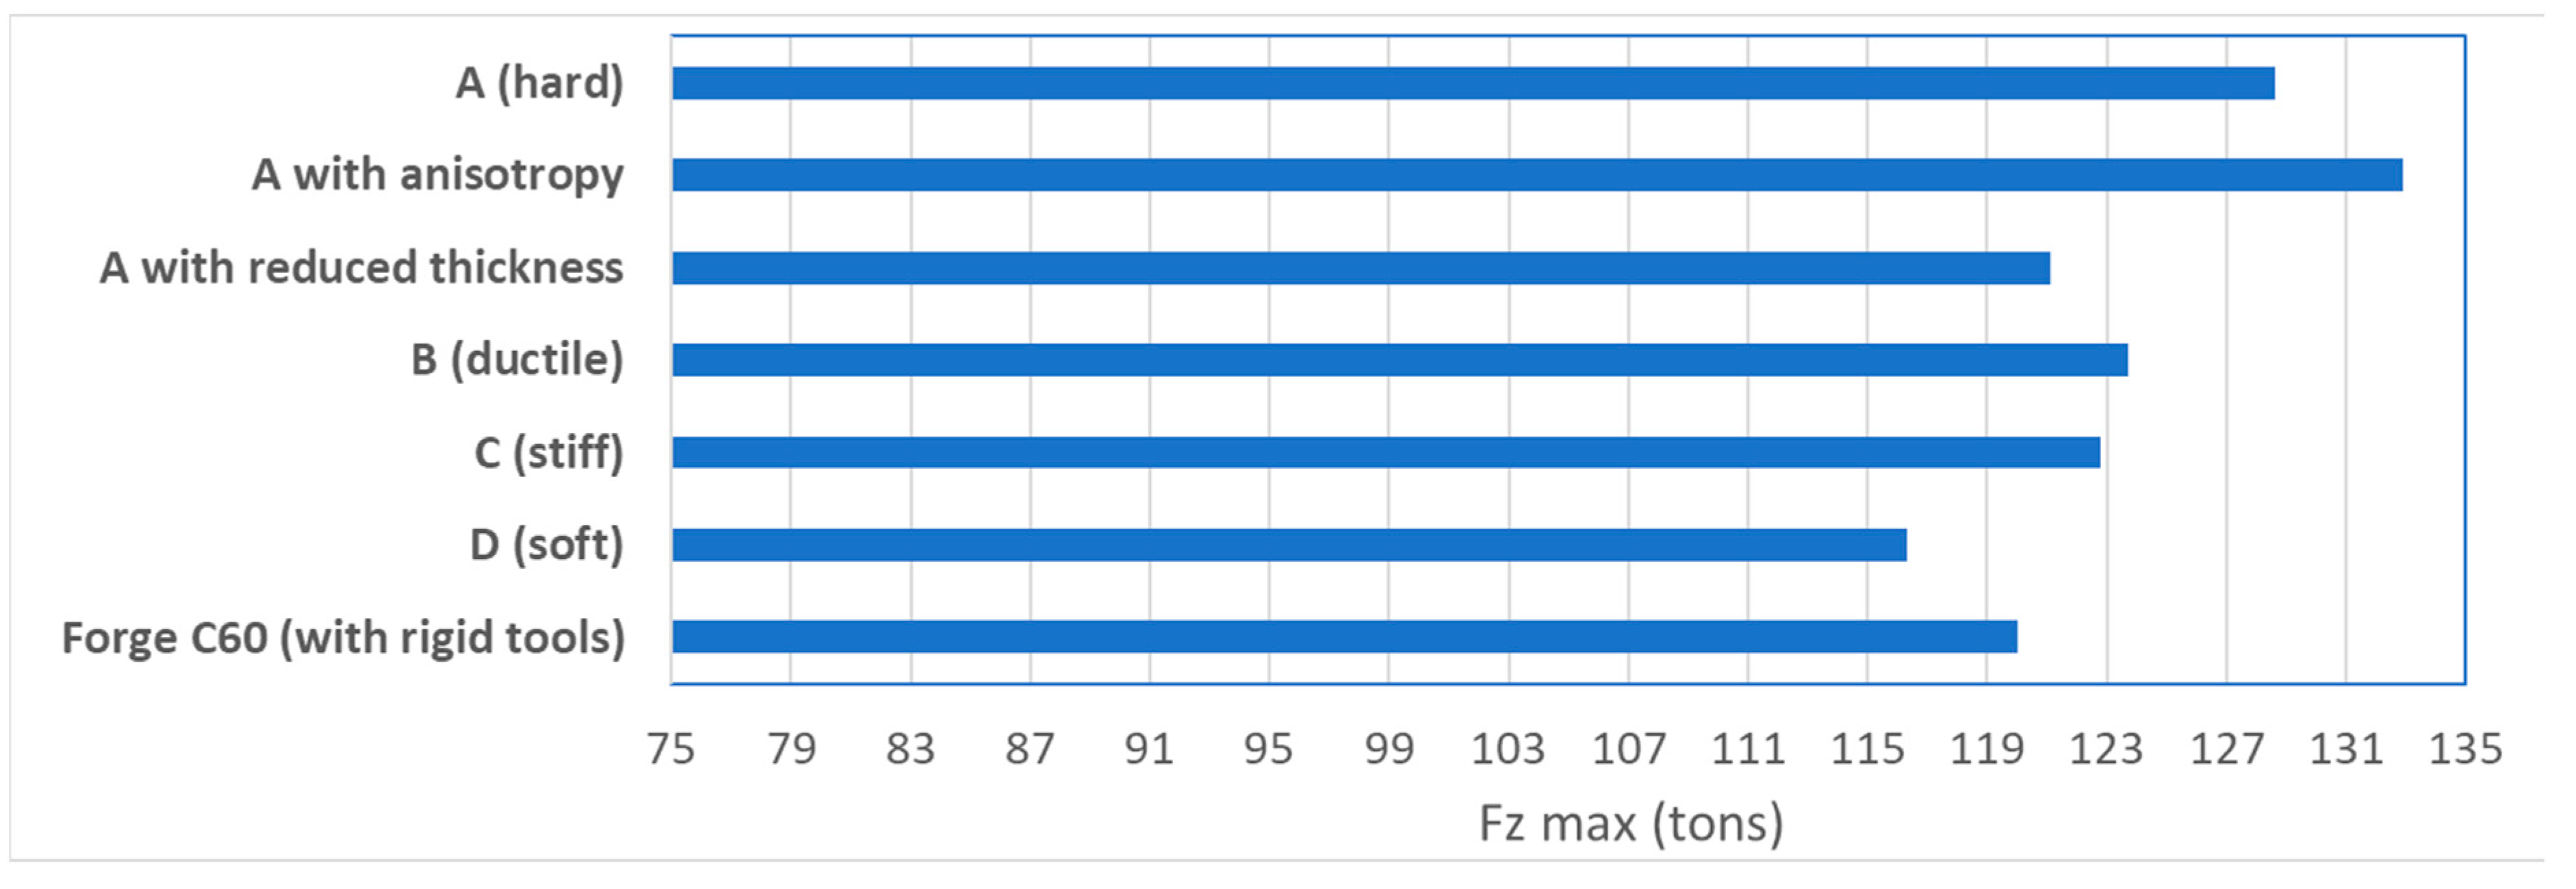
The material “A” shown in
Figure 3, with initial thickness
t0 = 1.85 mm and isotropic properties, was used as the baseline in the sensitivity analysis. It is particularly hard in terms of ultimate tensile strength (633 MPa). The 3 other materials labelled as B, C and D in
Figure 3 were also simulated, and the maximum
Fz was compared to the validated simulation and to the minimum and maximum values registered in the real process. Material B is particularly ductile (A% = 0.27), material C is stiffer than the others (yield stress is 482 MPa) and material D is softer (
UTS is 568 MPa). Materials A, B, C, D and the standard Forge material are assumed to be isotropic, but an additional simulation was run by modelling the material A as anisotropic, with realistic Lankford coefficients taken from the performed tensile tests (
r0 = 1.18,
r45 = 1.22. and
r90 = 1.2). Furthermore, while all simulations, including the reference case, were run with an initial blank thickness of 1.85 mm, material A was also simulated with a reduced thickness, 1.8 mm, which is the central value of the acceptable tolerance of the incoming sheet. The real measured total
Fz can be as low as 75 and as high as 135 tons. The result of the sensitivity analysis, given in
Figure 7, clearly shows how the variability, which can be attributed to the material property variations, is much smaller than the measured variability in the real process, since the max force in the many different simulated cases ranges from 112 to 133 tons, with a total variation of about ±9%. This is not surprising, because the actual force variability may come from many different sources, not only from material and thickness.
The same analysis was repeated on the other two cases, with similar results.
3.3. Sensitivity to Sabering
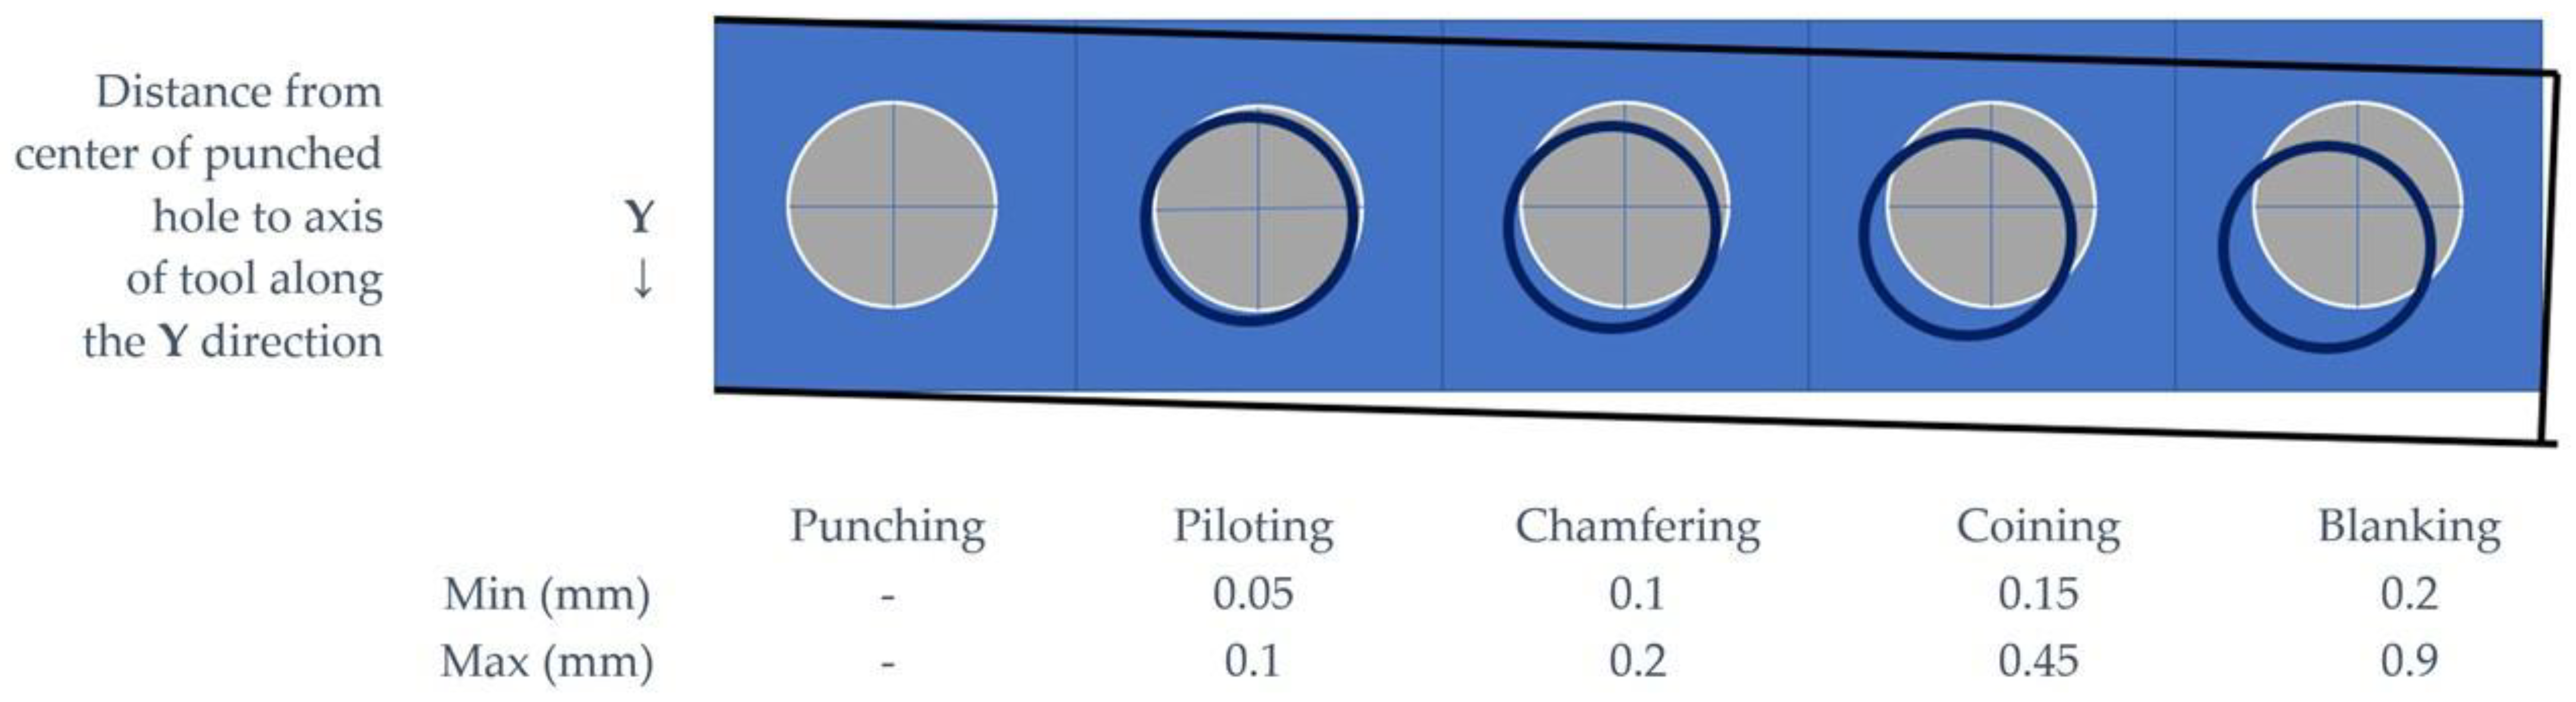
One of the main problems in this process is the potential misalignment of the coil, due to a sabering (or swording) defect of the incoming material, which means that the axis of the strip might not be perfectly straight [
42]. The role of sabering in progressive die stamping is substantially neglected by the scientific literature, but it has indeed a very large impact on the process. For investigating the sabering effect, the coil was given a rotation so that the centre of the initially punched circular hole was misaligned with the centre of each subsequent station. This is better explained in
Figure 8. The maximum displacement is given to the strip at the blanking station.
The total sabering was measured as the distance along the Y-direction (horizontal) between the centre of the initially punched hole and the axis of the tool.
The case with isotropic material “A” and nominal initial thickness 1.80 mm was taken as the baseline in this analysis. The baseline simulation was modified by setting the total sabering displacement at the last station (blanking) at two values: 0.2 mm and 0.9 mm; both values may occasionally occur during real-time operations. When the sabering amounts to 0.9 mm, the washer is defective, as it is out of tolerance.
The effect of sabering can be appreciated on the total maximum
Fz as a reduction in its value, because this force, as already shown in
Figure 5, is mainly influenced by the coining and chamfering operations, which see a decrease in the deformed cross section as a consequence of chamfering. In fact, with respect to the baseline simulation with material A and
t0 = 1.8 mm (where
Fz = 120 tons), the total
Fz decreases merely by 1.7% for a small 0.2 mm total displacement and decreases by 8.8% (109 tons) for a large 0.9 mm displacement.
While in all other sensitivity studies conducted, the
Fz and the
FEAwear and
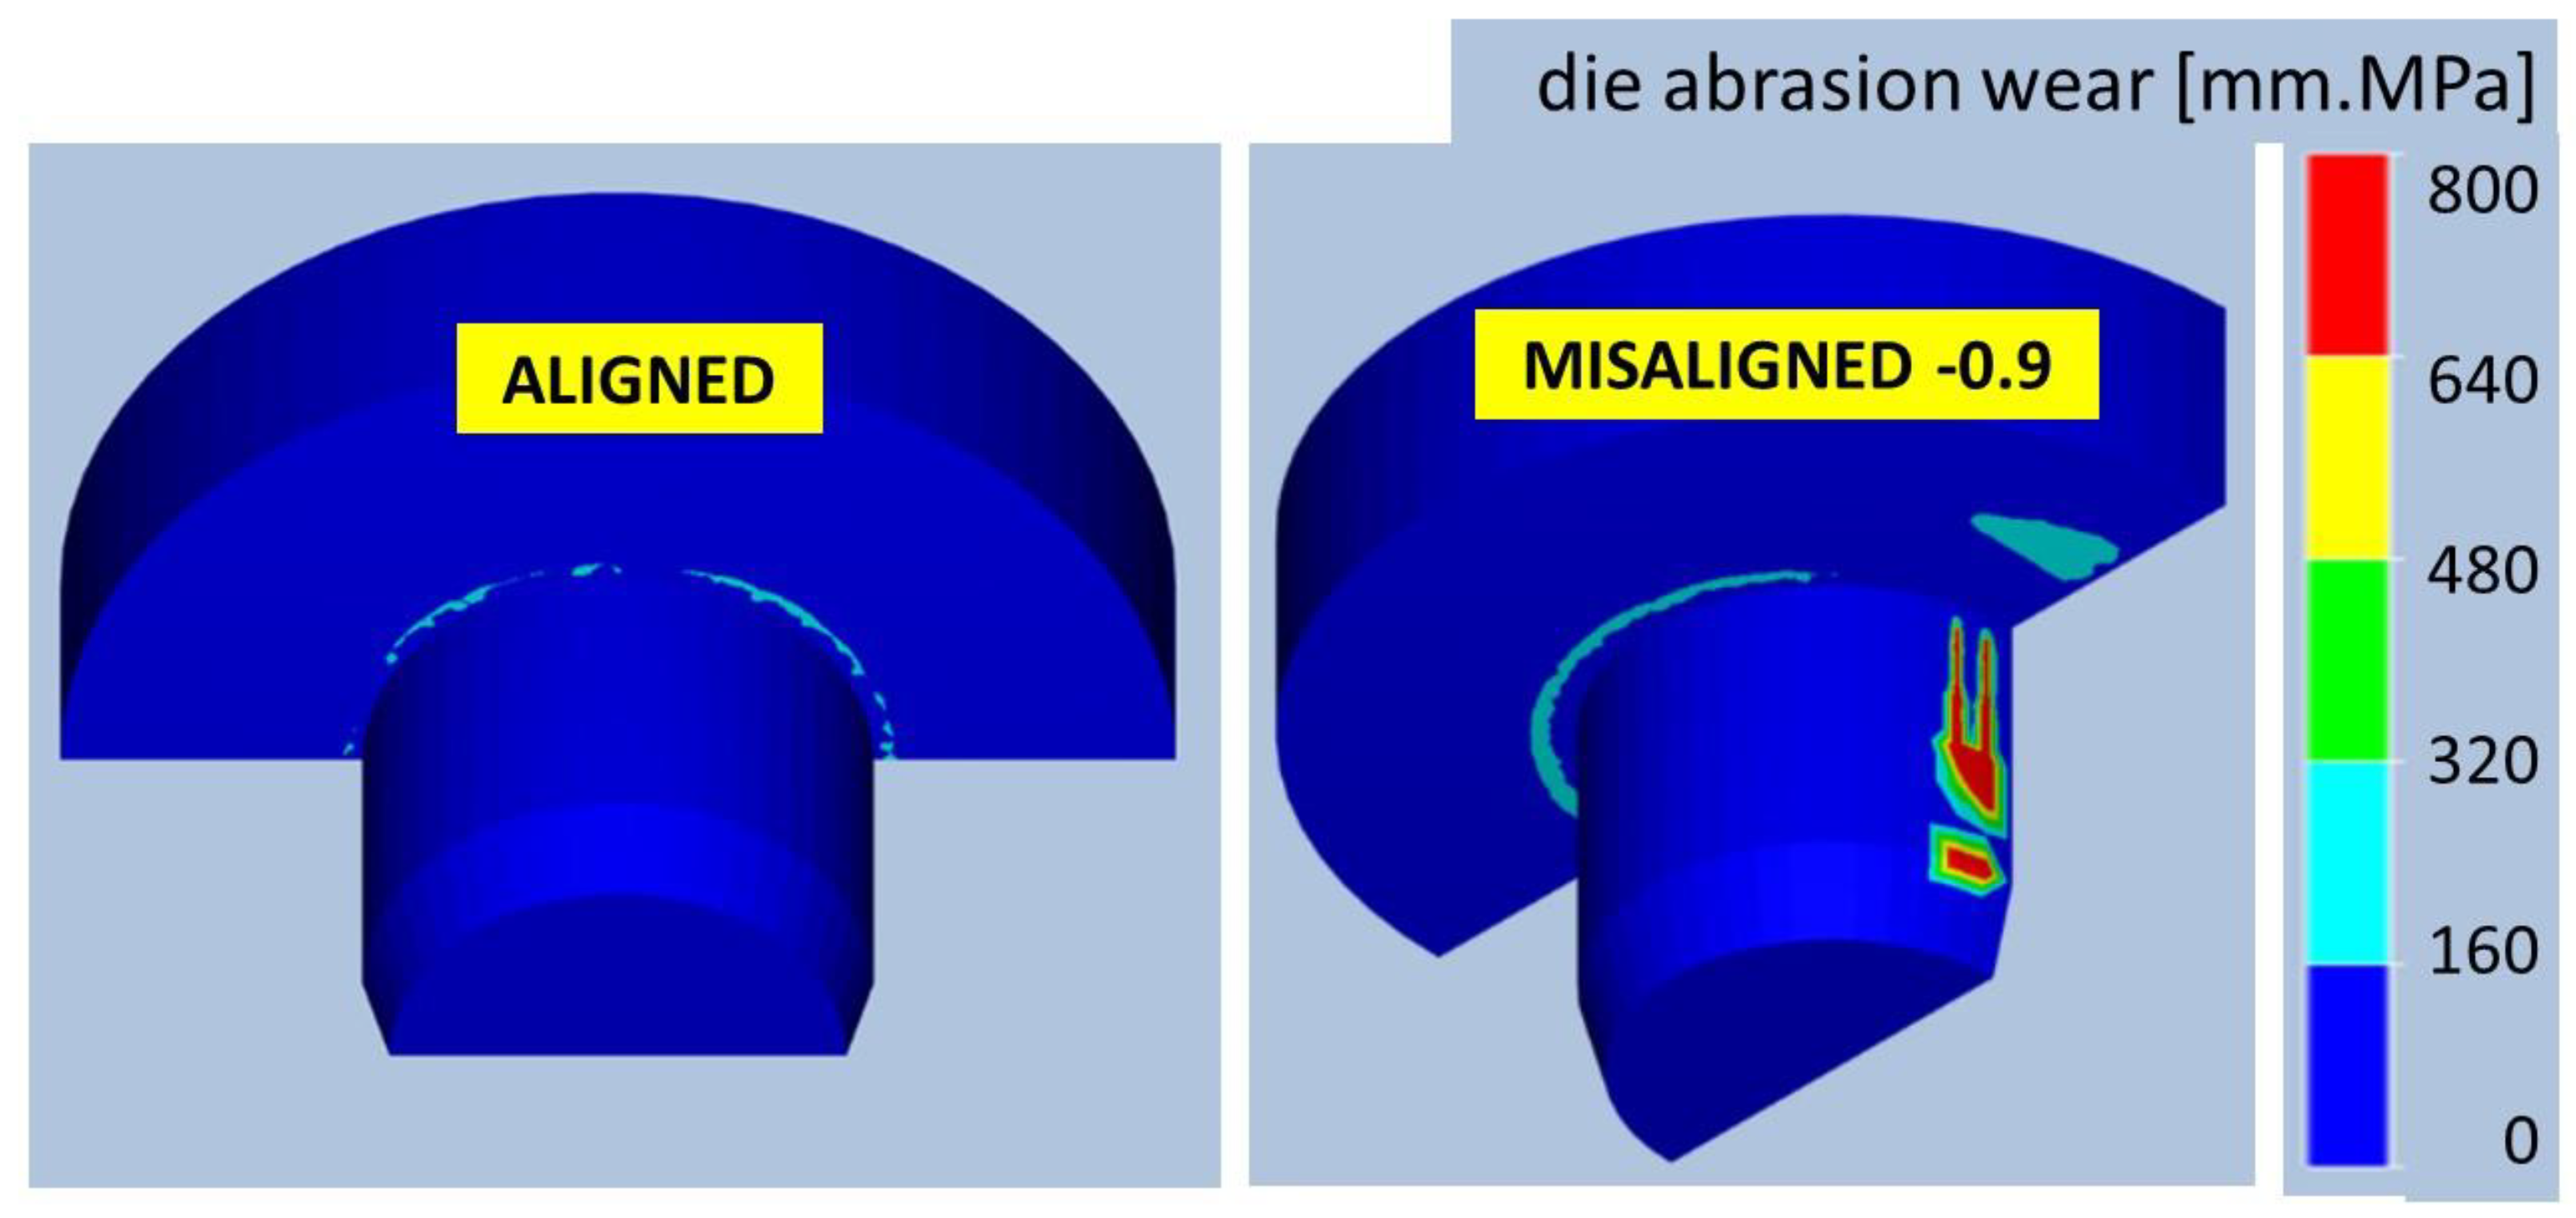
FEAdamage indicators are well correlated with each other, this is not the case when sabering occurs. Despite the maximum force decreasing, the risk of tool wear increases, especially for the blanking punch and for the piloting portion of the coining punches (i.e., the cylindrical portion in
Figure 9). This is the only case, indeed, where the pilots might suffer some relevant frictional wear.
3.4. Sensitivity to Tool Wear
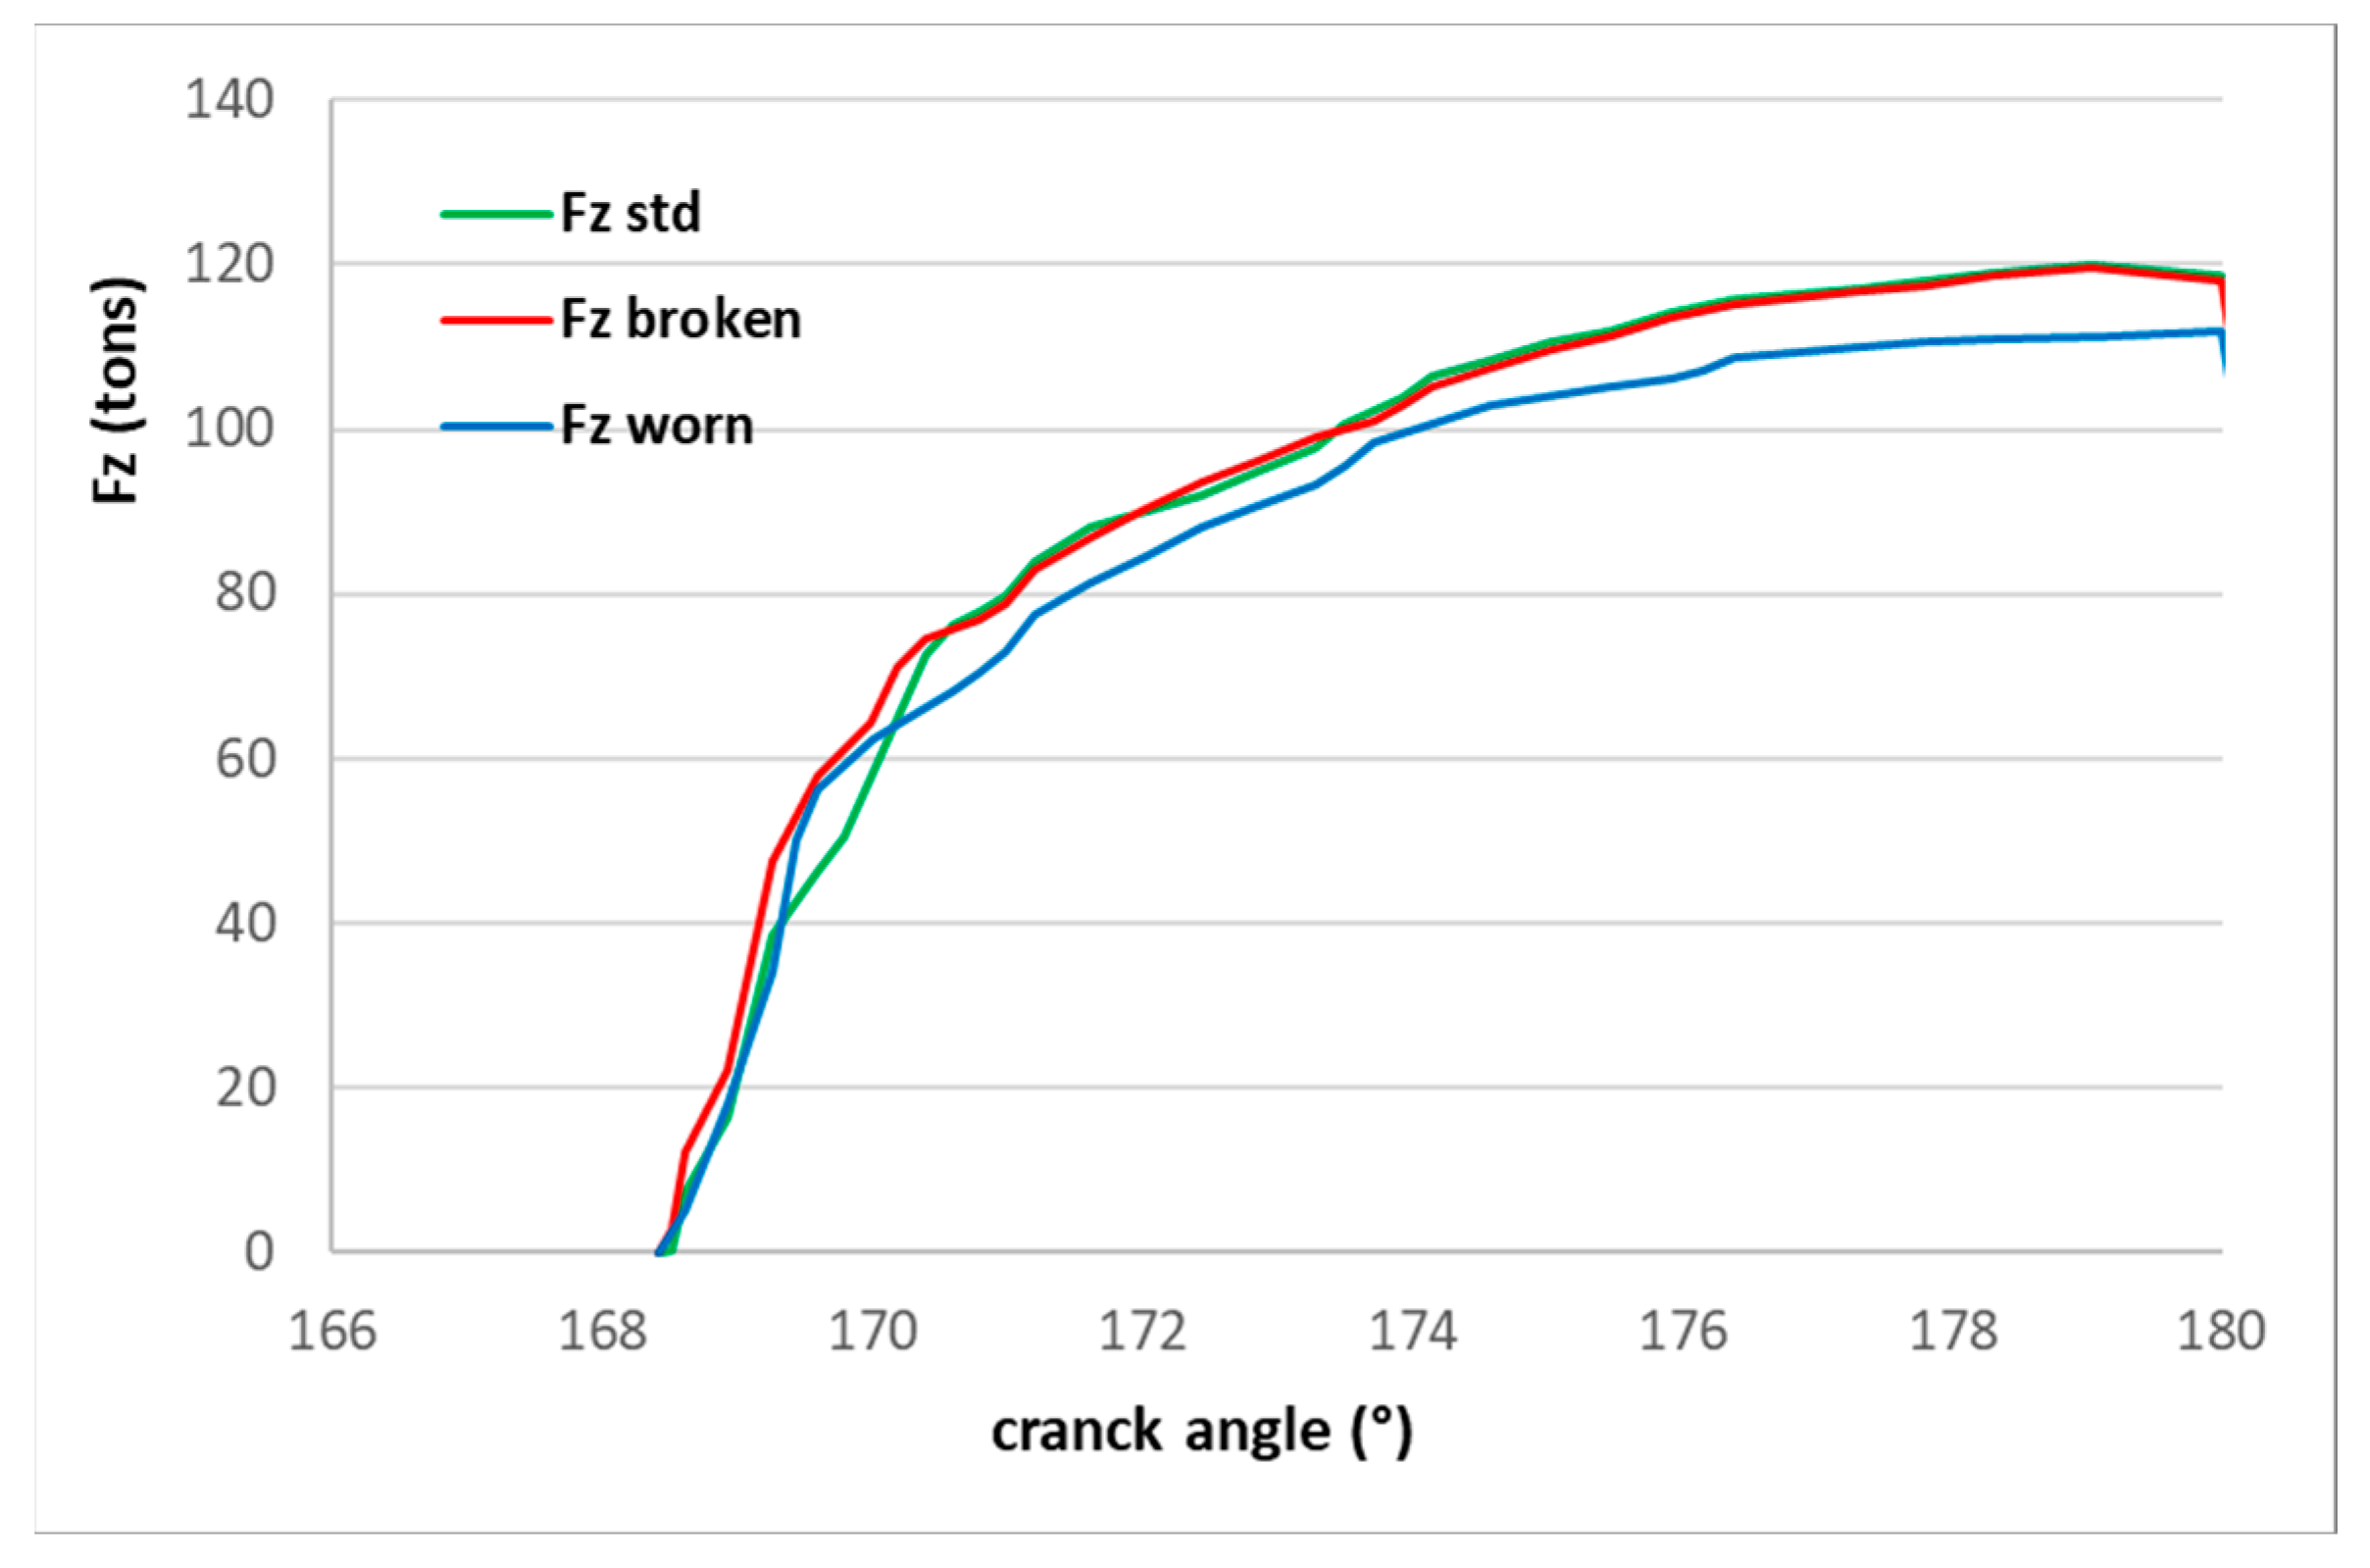
Sensitivity analyses were run on the three test cases, but here only the results of case 1 are reported, because the dented coining die is the single tool, among all the investigated ones, that received the largest number of maintenance interventions over the observed period of time. The reason is that the teeth of the die must bear a very high compressive and shear stress and might progressively wear out or even break dramatically, as shown in
Figure 10. To model how the pressing force is influenced by a tool failure or by a progressive die wear phenomenon, two scenarios were simulated:
The consequences on the max
Fz can be appreciated in
Figure 11, which clearly shows how the “broken teeth” profile is nearly overlapped with the standard force profile. Any early failure detection for the major event, which is the fragile fracture of a tooth, based on the online monitoring of some load signal is bound to fail, because the noise would be much larger than the signal shift due to a rupture. On the contrary, there is a little (−3%) but evident decrease in force as a consequence of the rounding of all teeth edges. However, the wear of the edges of the teeth is a progressive, relatively slow phenomenon. In the real press it would be very easily confounded with other drifts, e.g., thermal dilatation of the press columns, heating of the tools, and slow deviation in sheet thickness through the coil. It would be impossible to detect such a drift in a real situation.
3.5. Sensitivity to the Bottom Dead Centre Position
In all progressive die stamping operations where chamfering or coining are involved, a major and obvious source of variation, by far the most important, is the actual position of the bottom dead centre (BDC) of the coining or chamfering tools. In fact, a small variation in the final position of the coining punch at the end of its stroke may cause a very large variation in coining force. The actual position of the BDC may vary either within the same production run or between different runs. Within the same run, the instantaneous value of the BDC may change for several reasons: dynamic control errors of the servo-press, inertial effects in case the SPM is changed, thermal dilatation of the press columns and the tools, and tool wear [
43]. The BDC may also change between different runs because of small height adjustment errors during assembly or maintenance of tooling or because of adjustments performed by the press operator. Indeed, whenever the operator at the press detects an overall force that is out of the specified boundaries or whenever some quality issues arise in the workpiece, the first reaction is always to perform small adjustments to the press slide control, i.e., small adjustments of the BDC. The effect of changing the BDC is somehow similar to a variation in sheet thickness, but while the sheet thickness may vary only by a few cents of a millimetre (within-run and between-runs), the position of the BDC may vary significantly, even by tenths of a millimetre. In fact, in stamping operations at high rate (hundreds of SPM), thermal dilatations may occur in the tools, but especially in the four press columns, which are long. The four columns of a stamping servo-press might heat up because of changing environmental conditions or (more likely) because of their own elastic deformation work. As an example, a press with 3 m long columns that heat up by only 3 °C will elongate by 0.1 mm, and this will have a consequence on the measured maximum load.
Sensitivity FEM analyses were run on all test cases and major variations in total force took place even with small variations in height.
3.6. Discussion of the Results of the Sensitivity Analysis
In real operations, the range of variability of the maximum pressing force is very large. Fz can experience slow variations of ±8% within the same production run. When the production is stopped, e.g., because of maintenance or a change in material coil or simply a shift change for the workers, the maximum Fz can have sudden run-to-run variations of ±29%, according the collected historical data.
On the contrary, in FEM simulations, even drastic variations in single factors such as the material mechanical properties, the sheet thickness, the strip sabering or the failure of a coining tool do not induce large variations, with only one exception: the position of the BDC, which, as explained in
Section 3.5, may induce force variations in excess of ±100%.
In conclusion, the outcome of the FEM simulations is that the overall tonnage may vary for several interfering reasons, and many of them cannot be directly related to an anomaly in the process. Even the rupture of several simultaneous tools, in a progressive die stamping operation of small components, cannot be distinguished, if looking at the force profile, from other sources of variation. The same considerations hold even if, instead of calculating the maximum value of the overall pressing force, the single loads of each of the four columns of a press are monitored. The order of magnitude of variations and sensitivities does not change.
If an early failure detection monitoring device must be implemented, the only viable option would be to place small local load sensors within the holders of those tools that are at greater failure risk. However, this approach is cumbersome for a tooling setup where tens of different tools operate simultaneously.
As stated in the introduction, a wide range of the literature is based on techniques (e.g., wavelets [
44]) for monitoring the time profile of process signals and trying to predict pathological conditions by identifying some variation in the features of the profiles. These applications are always focused on problems with a limited number of relatively large tools, and they are not suited to stamping of small components with many tools, because the individual contribution of a single faulty tool would be lost inside the natural variability of the process signal. A different strategy is required.
4. Stamping Equipment, Sensors and Data Lake
The stamping process of the test cases was implemented in a 150-ton 4-column vertical mechanical press by Bruderer. The stamping rate could be varied from 100 up to a maximum of 760 strokes per minute (SPM).
A data lake was created that collects all relevant process data related to the mechanical press under investigation, connecting them with a time-stamp:
The sheet coil properties, i.e., the tensile test data, when available with direct measurements;
The log file of the press events and status, i.e., which operation is being conducted on the press at any time (9 types of events are coded, including stamping, setup, idle, etc.);
The maintenance reports (i.e., which tool is being replaced or reconditioned, which type of maintenance operation has been performed);
The statistical process control (SPC) data, i.e., the measured dimensions and quality of the washers;
The data coming from the in process-sensors.
The data lake was populated with the production files of the three parts over a time span of a few years: the material properties over nearly 2 years and the maintenance data, the log files and the SPC data over 4 years. The data coming from the process sensors were more recently implemented; though data are available only for the last year, they still refer to the production of millions of washers. As an example, the average production volume is about 2.2 million pieces per year for case 1; at an average stamping rate of 400 strokes per minute and 4 parts per stroke, this amounts to about 23 h of useful active stamping time per year.
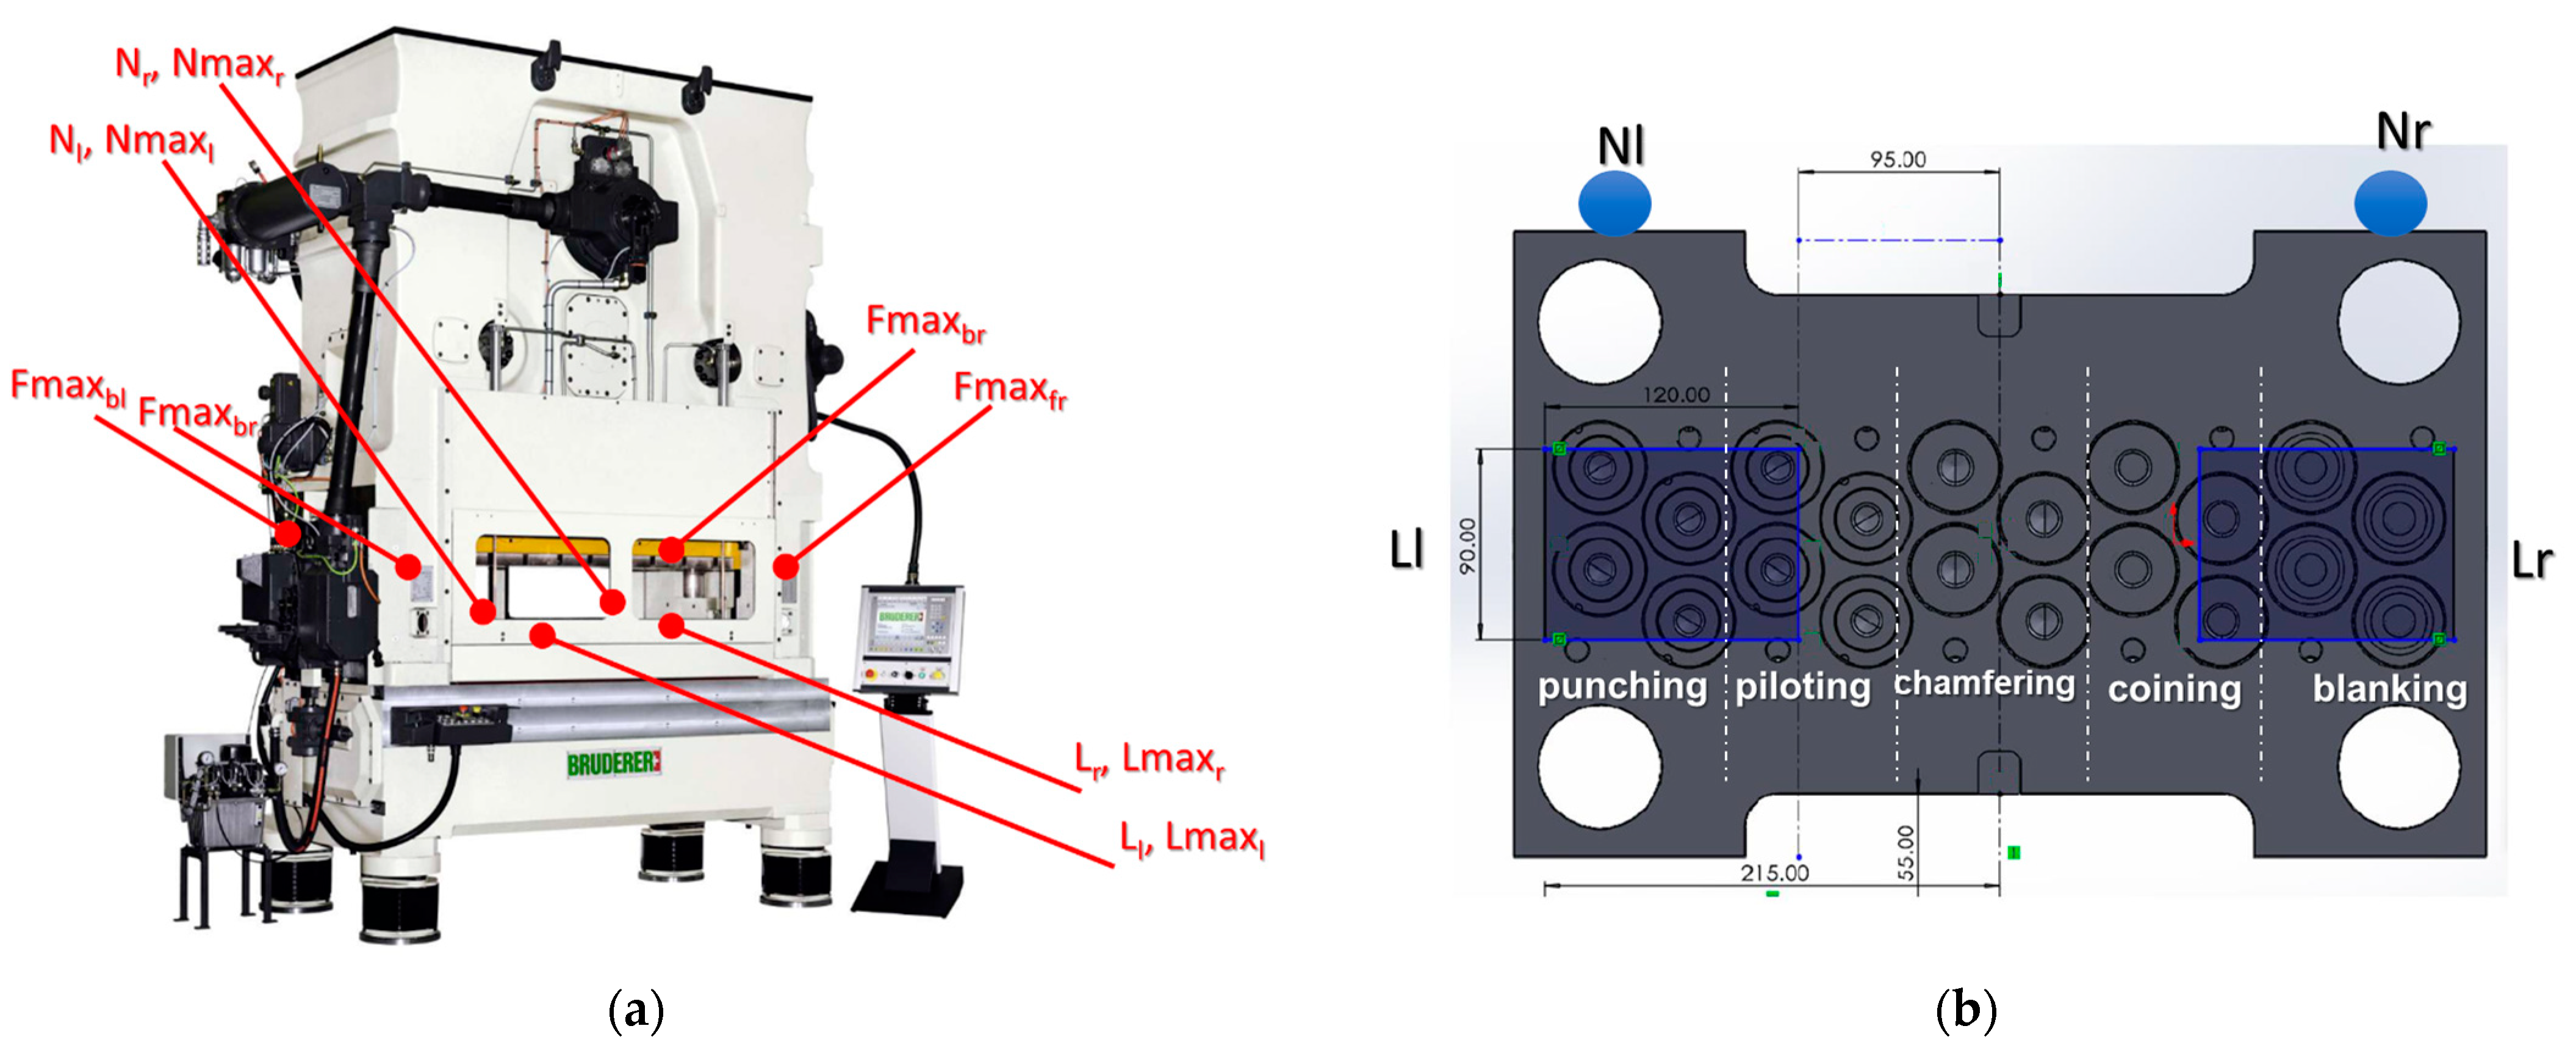
The press is equipped with 8 in-process sensors (see
Figure 12a for a schematical representation of their layout):
Four Baumer DSRT 23DF strain gauges are installed at each of the four columns, and the measured vertical strain is converted into a force signal. The maximum of the values of each column is registered at each cycle of the press and stored in the variables Fmax
fr, Fmax
br, Fmax
fl, Fmax
bl, where the suffix b stands for back, f for front, r for right and l for left. These four values can be summed to obtain the total maximum vertical force
Fz, which is the one simulated in
Figure 5 for case 1.
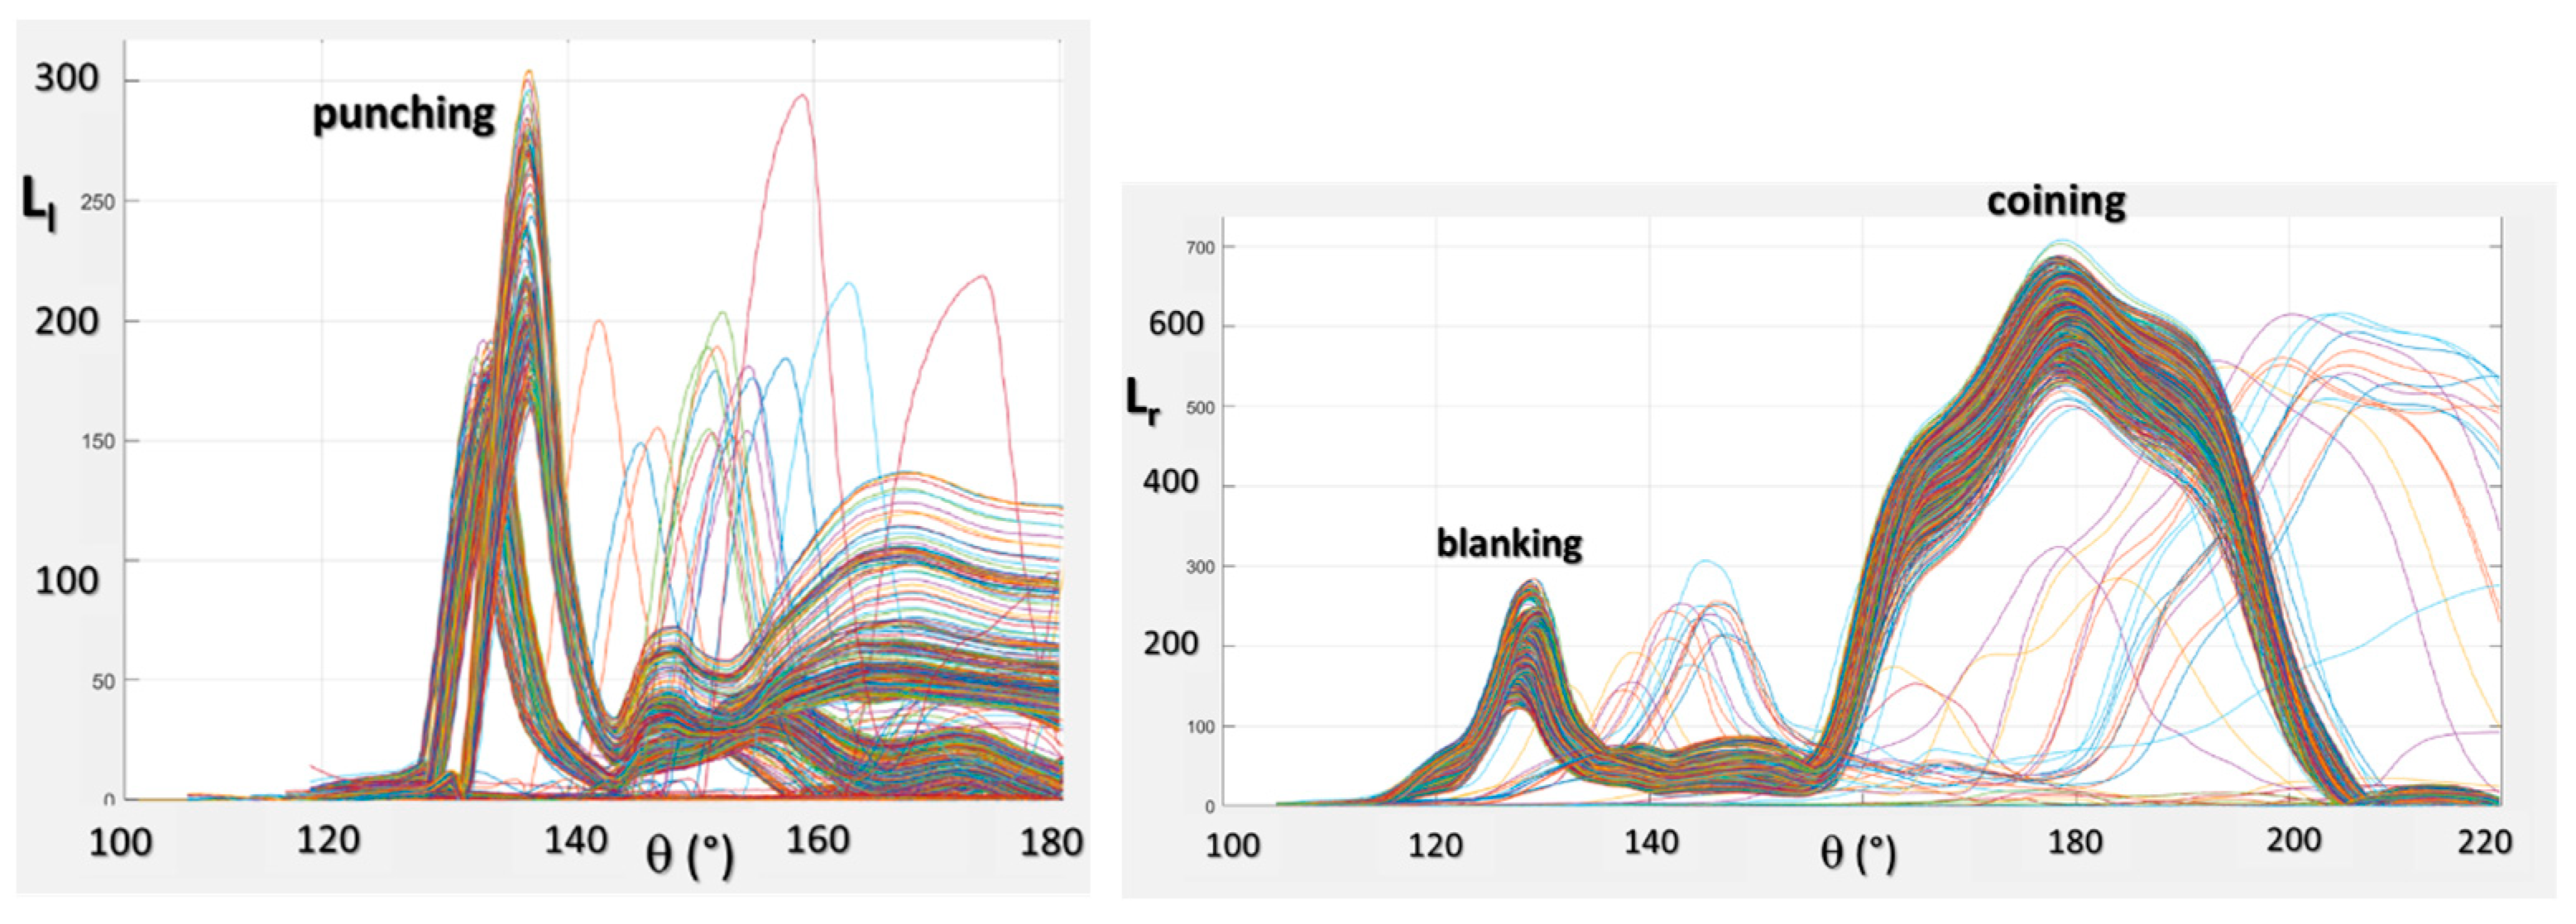
Two Brankamp Marposs thin foil force sensors are embedded in the bottom die-holder inside two rectangular 90 × 120 mm slots. When the die-holder is loaded at each cycle, it deflects elastically, causing a small deformation of the right and left foil sensors. Their output voltage signal is normalised to non-dimensional load indicators Lr(θ) and Ll(θ) (r for right, l for left) that range from 0 to 1000. The whole signal is monitored with a synchronization with the rotation θ of the press crankshaft so that one value is registered every 0.23° of rotation for a total of 115° around the bottom dead centre. A total of 500 values per stroke are acquired. The maximum values Lmaxl and Lmaxr of the two load signals are stored.
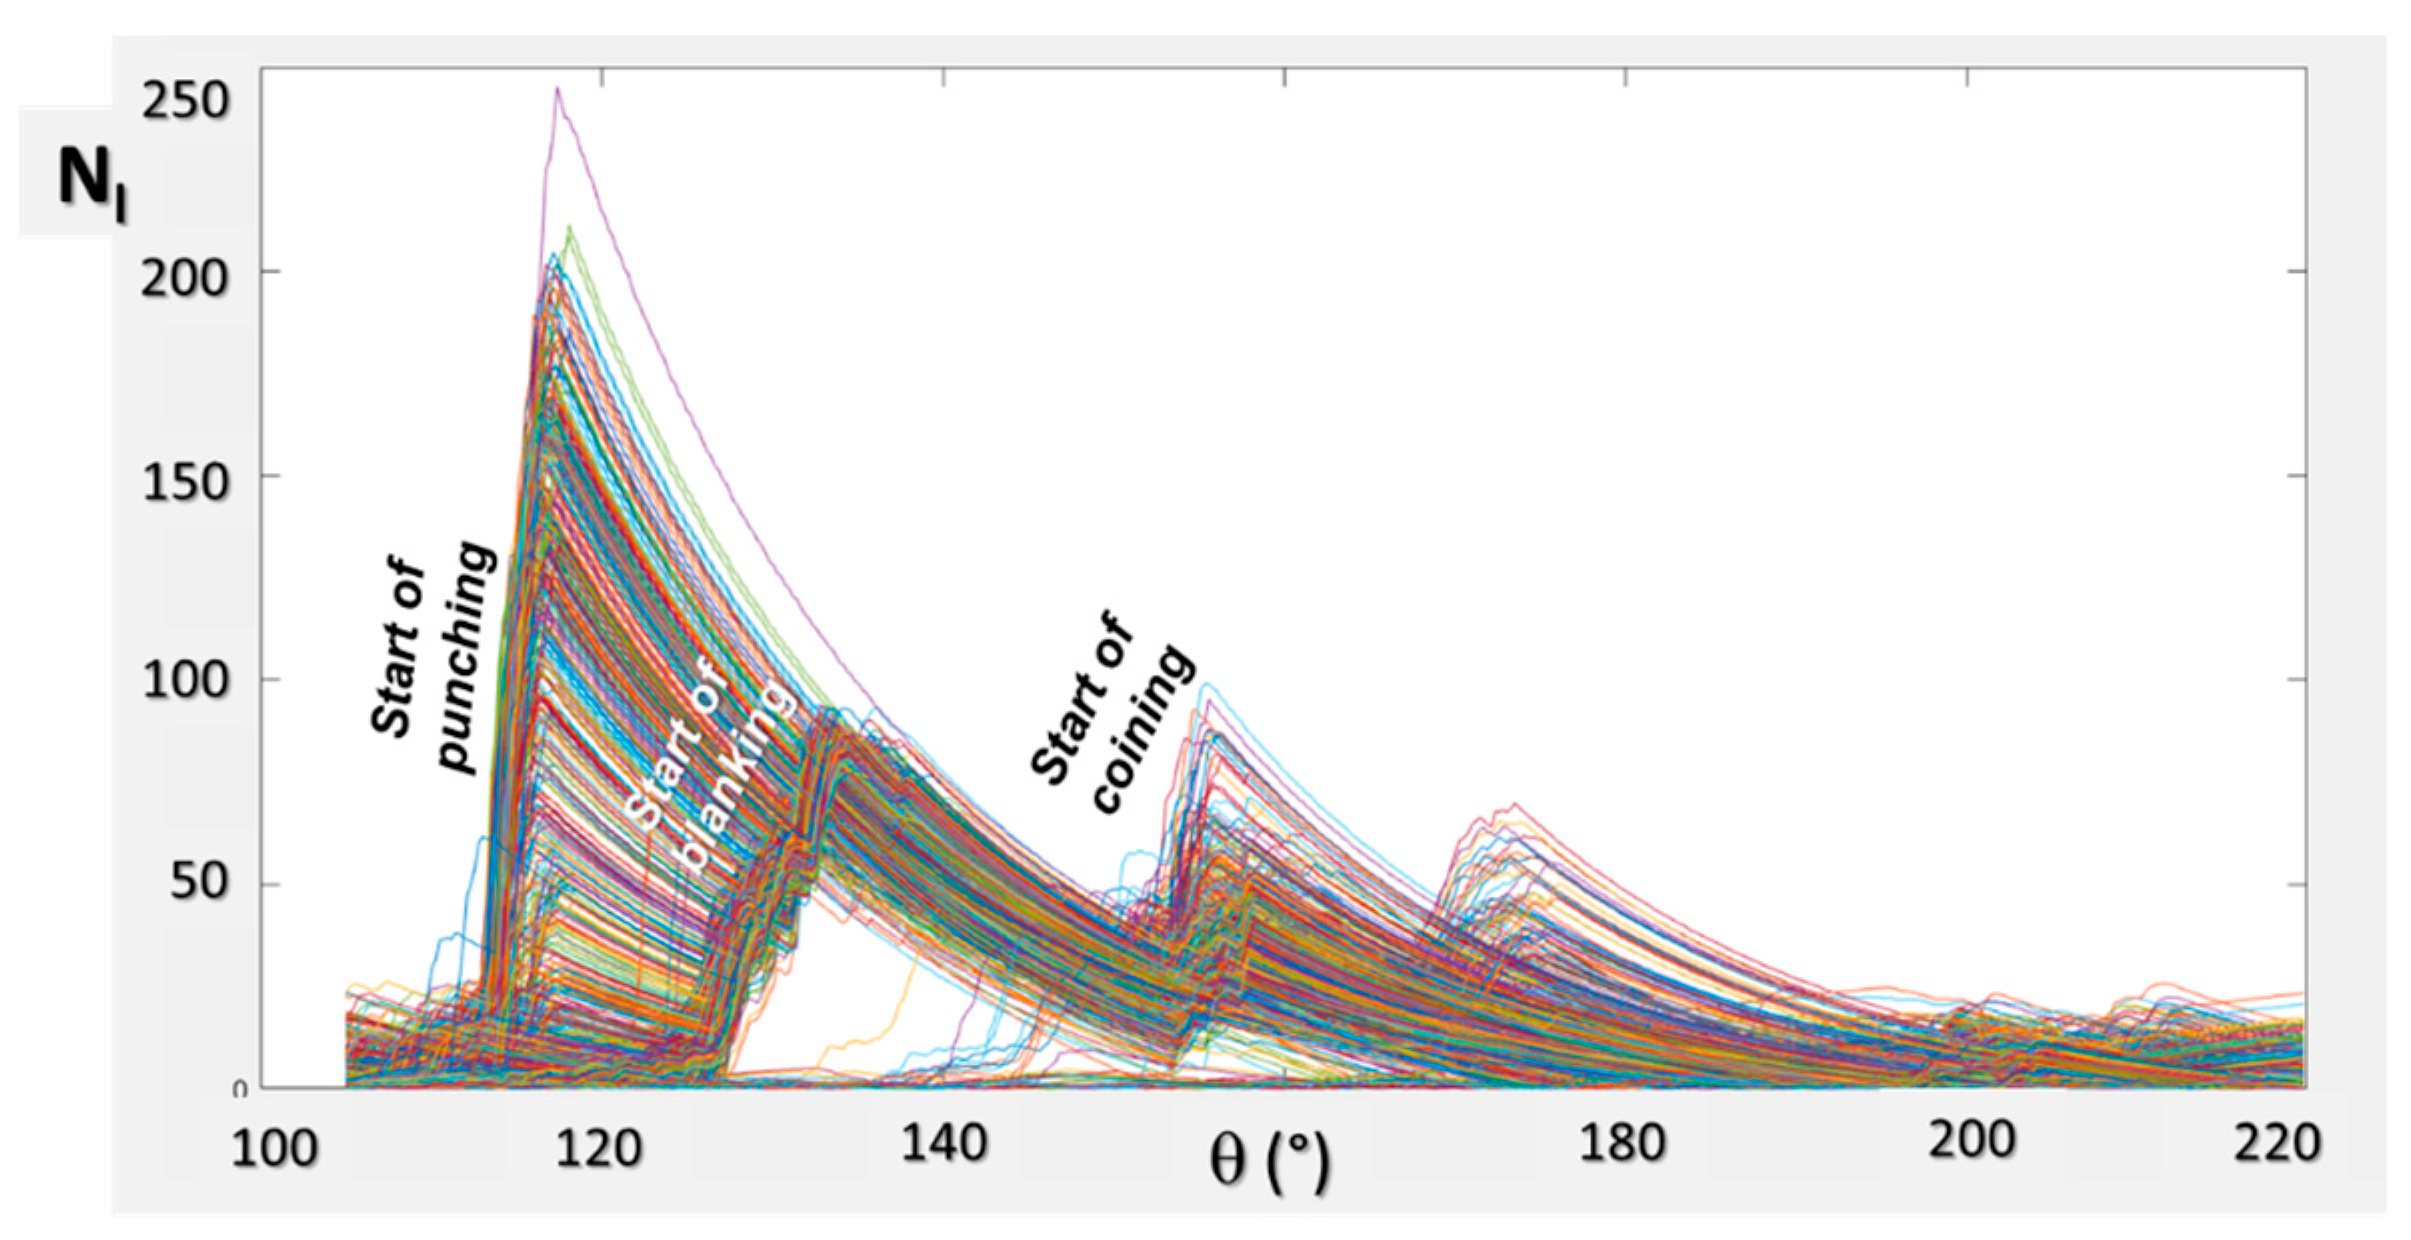
Two Brankamp Marposs acoustic sensors (microphones) are installed at the back side of the bottom die-holder, and their output voltage is also converted to non-dimensional noise indicators Nr(θ) and Nl(θ) ranging from 0 to 100, with the same sampling frequency as the Lc indicators.
Not all the above listed sensor variables are stored in the data lake. To reduce the dimensionality, only the maximum values of each stroke are stored: the 4 global force Fmax and the 2 local load
Lmax values. The maximum values of the noise indicators
N are not stored because the analysis of the data showed that they are clearly not correlated to maintenance events nor to part quality issues. Furthermore, the 4 local load L and noise
N time signals are not stored in the data lake, but they are used for real time detection of relevant anomalies and failures. When any of the four
Lr(
θ),
Ll(
θ),
Nr(
θ) and
Nl(
θ) signals exceeds given upper and lower control limits, the press issues a warning, as explained in
Section 5.1.
Figure 12b shows the locations of the local load and noise sensors with respect to the tooling of case 1. Their signal is mostly influenced, i.e., sense more, the operations that are closer to them. Sensors
Lr(
θ) and
Nr(
θ) are more influenced by the coining and the trimming operations for case 1; coining is, surely, the operation that requires the highest load. Sensors
Ll(
θ) and
Nl(
θ) are more influenced by the initial punching operation, while piloting generates a negligible noise and load (except when sabering occurs). In the case of
Figure 12b, using 20 smaller local load sensors (instead of only 2), each placed under every tool, would provide cleaner and more direct information for every single operation, but it would also have a tremendous impact on the cost and complexity of manufacturing.
A controller is connected to the four local sensors and its output is also shown on the GUI (graphical user interface) panel of the press. At the beginning of every new production run, the first 100 strokes (after a steady condition is reached) are used by the controller to compute the average expected temporal profile of each signal
,
. These variables are all functions of the crankshaft rotation
θ. Then, a control band is built between a lower control limit (LCL) and an upper control limit (UCL). The UCL is obtained by adding to the mean value of the signal a fraction
α of the mean signal itself. The LCL is determined by subtracting the same quantity. The value of
α is set arbitrarily by the press operator, according to their personal experience of the expected process variability, and it generally ranges between 10 and 20%. Therefore, the load indicator coming from the right load foil sensor must remain within the following limits:
If Lr(θ) exceeds these boundaries, a warning alarm is shown on the GUI of the press and the operator is advised to stop the stamping press and check whether any problem or failure has occurred (tool failure, quality problems of the parts, any anomaly in coil position or any other type of anomaly). The results of this check should be noted, if positive, i.e., if any anomaly has been detected, in the event log file. The most frequent correction is the micro-adjustment of the actual position of the bottom dead centre (BDC): if the UCL is exceeded, often the BDC is raised by some tens of microns. However, the BDC can be raised only if the measured thickness of the coined washer is within the lower half of its dimensional tolerance, otherwise raising the BDC would generate a risk of stamping defective parts (too thick). On the opposite case, if the LCL is crossed, the BDC might be lowered, but only if there is no risk of generating a part that is excessively coined. If no anomaly is detected by the operator and no adjustment is performed on the BDC, the press is started again without any intervention. In this case, the alarm is labelled as a “false positive”. The occurrence of false positives is indeed very frequent.
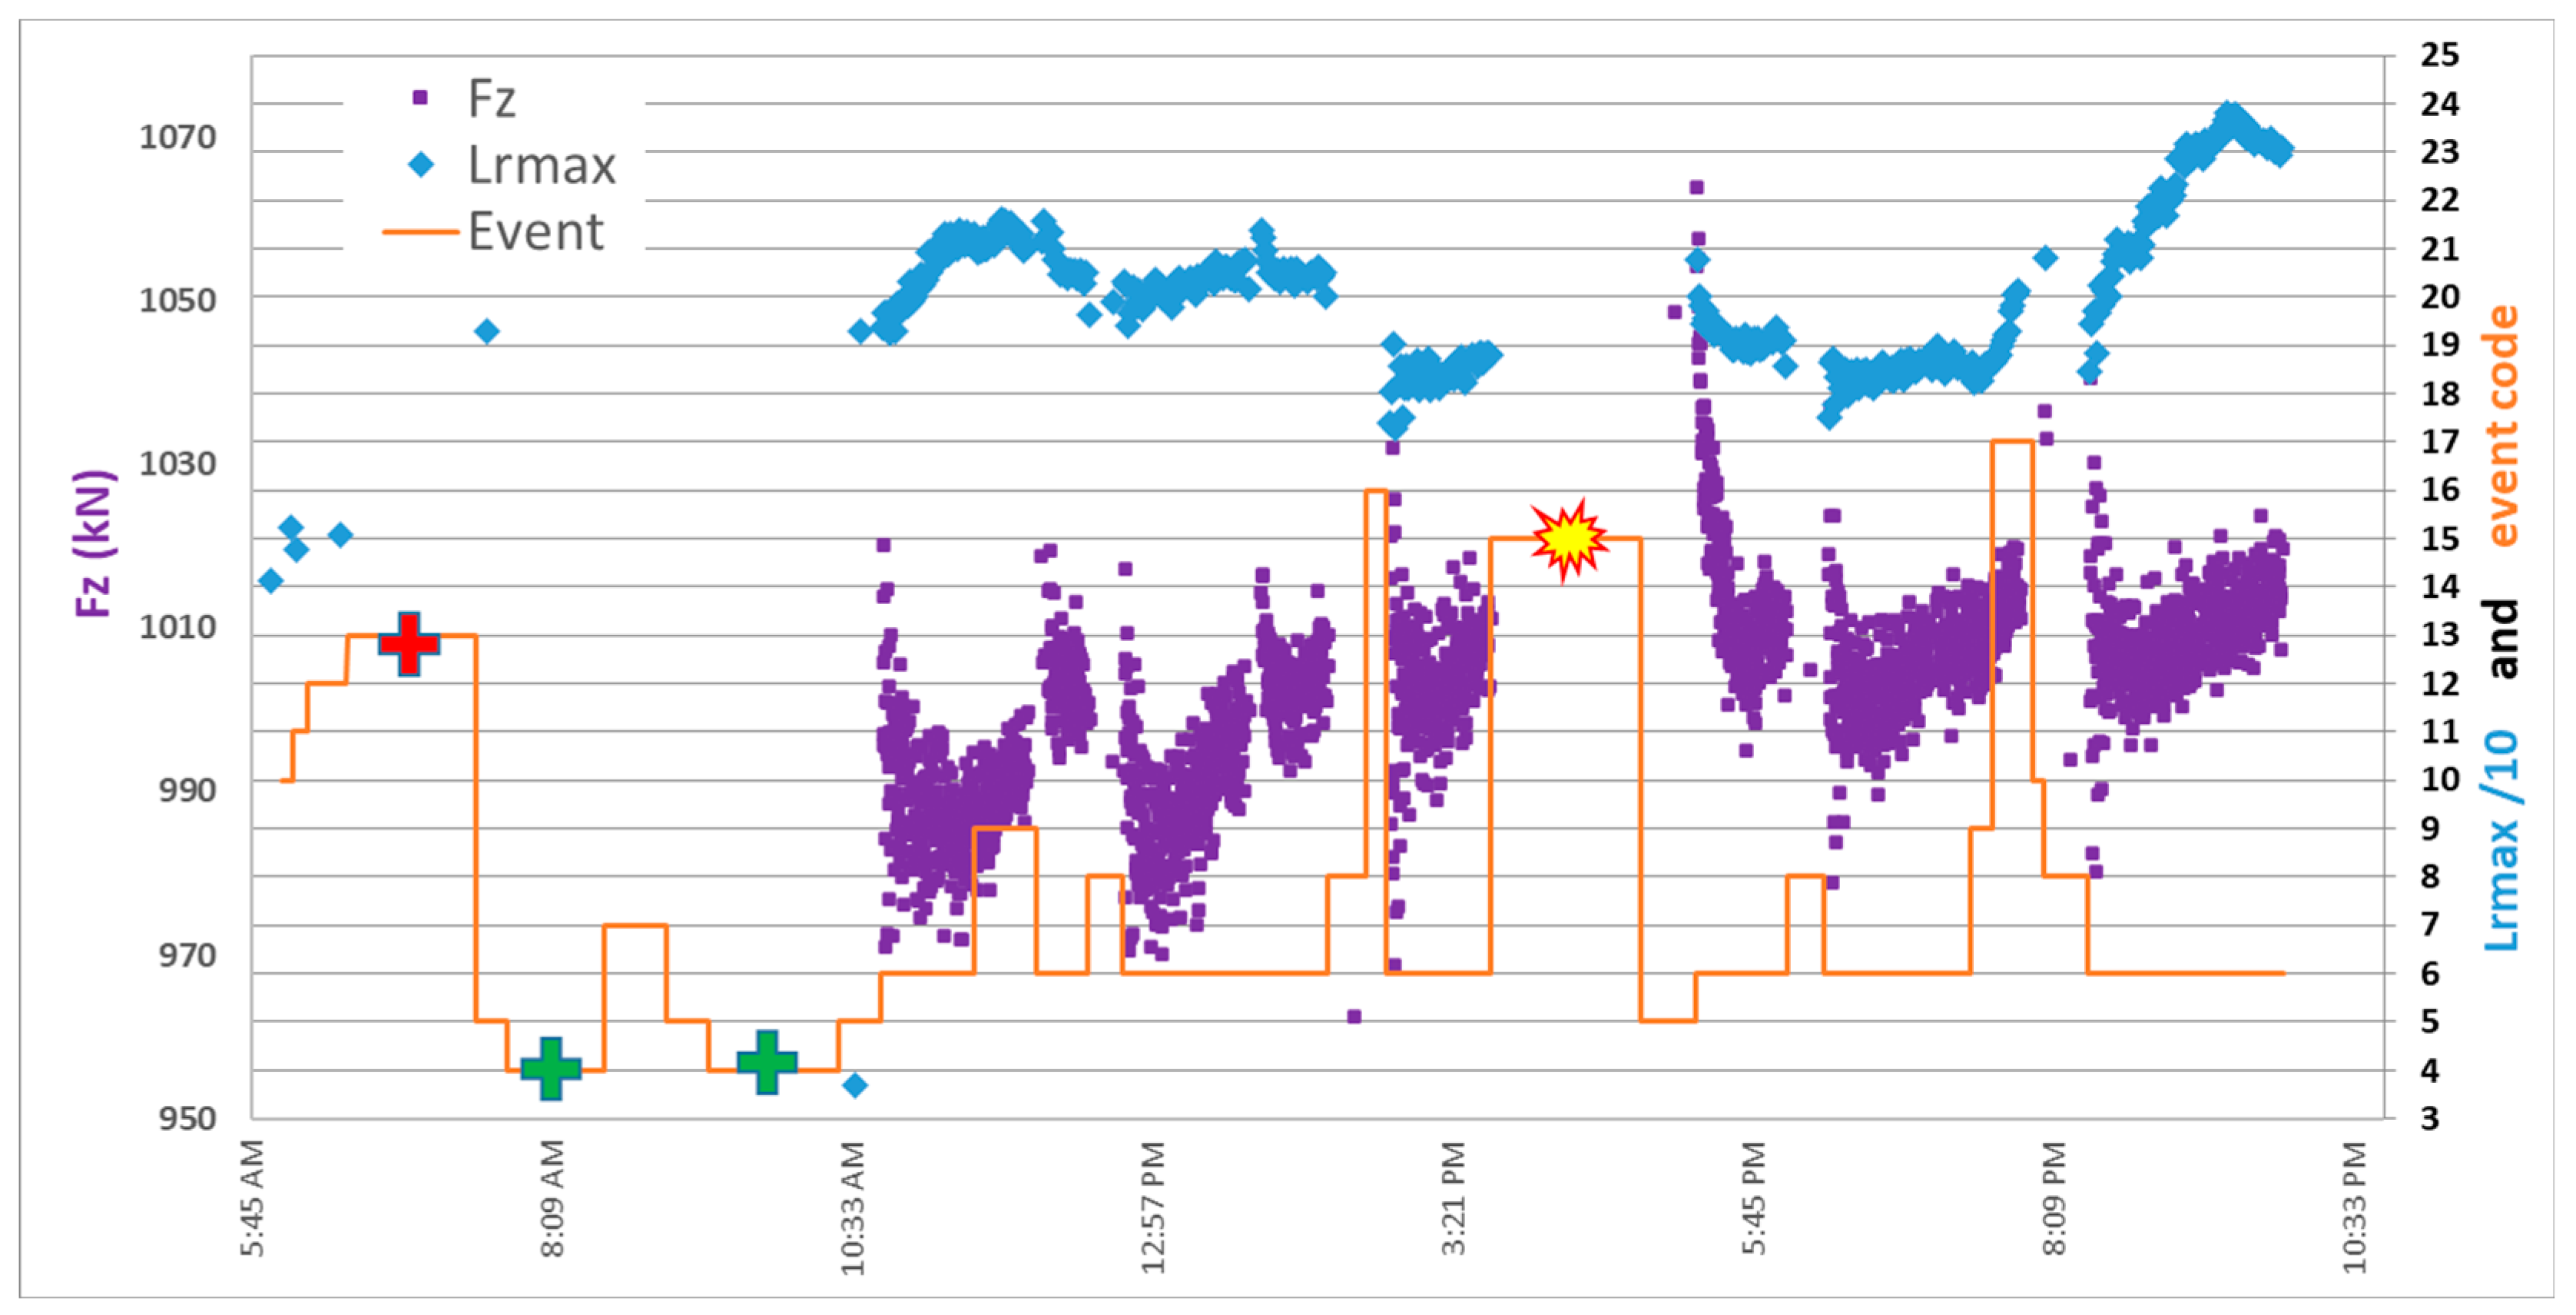
6. A New Tool Health Prevention Strategy
In the previous sections, we showed how difficult it is to detect failure in progressive die stamping of small parts. Additionally, for a process that produces thousands of defective parts in a minute, the early detection of a failure can never be rapid enough to prevent the accumulation of large amounts of scrap. Failure (by wear or fracture of the tools) cannot be avoided, but it might be predicted in advance, although only in statistical terms. As they are used now, the six load sensors installed at the press area are able to detect only major events, such as the lack of a metal strip of the missed ejection of a stamped part.
However, they become useful to build maintenance strategy aimed at avoiding unsafe stamping conditions. By observing the whole set of maintenance events, process variables and quality measurements stored in the data lake, some weak statistical observations emerge, especially looking at the maximum
Fz value and the
Lmax value of the load cell, which more closely reflect the tools that are at greater risk of failure (e.g., the right foil load sensor
Lrmax in case 1). The data show that upper thresholds may exist for
Fz and
Lrmax. If
Fz and
Lrmax simultaneously exceed these thresholds, the tooling is at a higher risk of failure and can, therefore, be considered as overloaded. This situation is summarised in
Table 3, which reports the percentage of recorded failures during the observed time span of the coining die of case 1 in different scenarios. The process is not interrupted immediately as failure occurs: it takes some time before the operator realises that failure has occurred and stops the press. After any major failure event of the coining die of case 1, the maximum values of
Fz and
Lrmax in the production run preceding the failure event are considered. When
Lrmax and
Fz are both below given thresholds (identified respectively in 570 and 1160 kN), no failure event is recorded. On the contrary, when both values have exceeded these thresholds, 50% of the failure events occurred. Thirty-eight percent of the coining die failure took place when
Fz exceeded 1160 kN but
Lrmax was below its threshold.
Obviously, the thresholds in
Table 3 cannot be generalised; every progressive stamping die will have its own. However, similar trends were also observed for test case no. 2, where thresholds seem to exist for
Fz and
Lrmax at 230 and 1030 kN, respectively, above which the probability of tool failure increases. When the sensors detect values that are above those thresholds, the mean time to failure of the riskiest tool (the chamfering/coining die, in this case) seems to be shortened.
We demonstrated in
Section 3 that peak loads may vary for several reasons, which are not, in many cases, pathological. However, it is a fact that when the maximum pressing force increases and the local load sensors value increase, there is an increased stress on the tool. This explains why the probability of failure seems to increase above given thresholds. An advisable prevention strategy is: when thresholds are exceeded, stop production and implement some force reduction action, such as raising the BD by 1 cent of a millimetre, if the part quality is controlled. If changing the BDC alters the part quality, then the solution is to decrease the SPM, which has a relevant effect on the stamping force. Reducing the SPM has a cost, but this is worthwhile if it delays tool failure. In fact, any tool failure dramatically reduces productivity because production is completely stopped for several hours when a failure event takes place.
7. Conclusions
In this paper, we investigated the stamping process of small metal components, such as washers, with multiple simultaneous tools. FEM analysis was run to understand the sensitivity of the process, especially the stamping force, with respect to different potential sources of variation. Our paper shows that, except for a variation in the BDC, which in turn may be influenced by thermal drifts of the press and tooling, no single source of variation can explain the large variability that can be measured in the real process. In this type of production, given the small dimensions and the large number of simultaneously operating tools under a unique press slide, tool maintenance policies based on early failure detection are bound to fail. However, our paper shows that a combination of local load sensors and the global tonnage indicator can be used to identify thresholds above which the probability of failure of the riskiest tools increases. During regular operations, care should be taken to avoid overcoming those thresholds to prolong tool life. In other words, while failure cannot be detected immediately after it has occurred and cannot be predicted with certainty, it is still possible to identify conditions that are dangerous, that is, conditions that can induce larger probability of failure; therefore, mitigation actions or countermeasures can be taken to delay tool failure (e.g., raising the BDC or reducing the SPM).
The research has shown that implementing a robust predictive maintenance plan exploiting the state-of-the-art technology in in-process sensor measurements is a very challenging, albeit not impossible task. A large amount of data are required to implement an effective predictive maintenance strategy. This can be obtained either by multiplying the number of local sensors or by using a “big data” approach that over a long period of time collects enough information to elaborate more advanced algorithms. The present paper can be seen as a first step towards this direction.


