
Investigating the Properties of ABS-Based Plastic Composites Manufactured by Composite Plastic Manufacturing


Abstract
1. Introduction
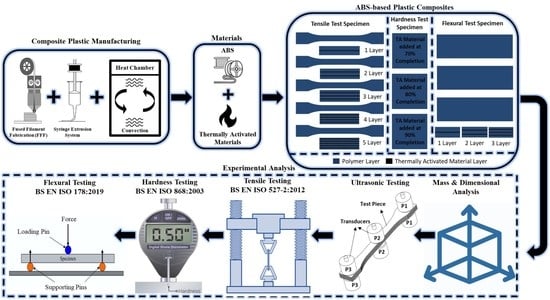
2. Methodology
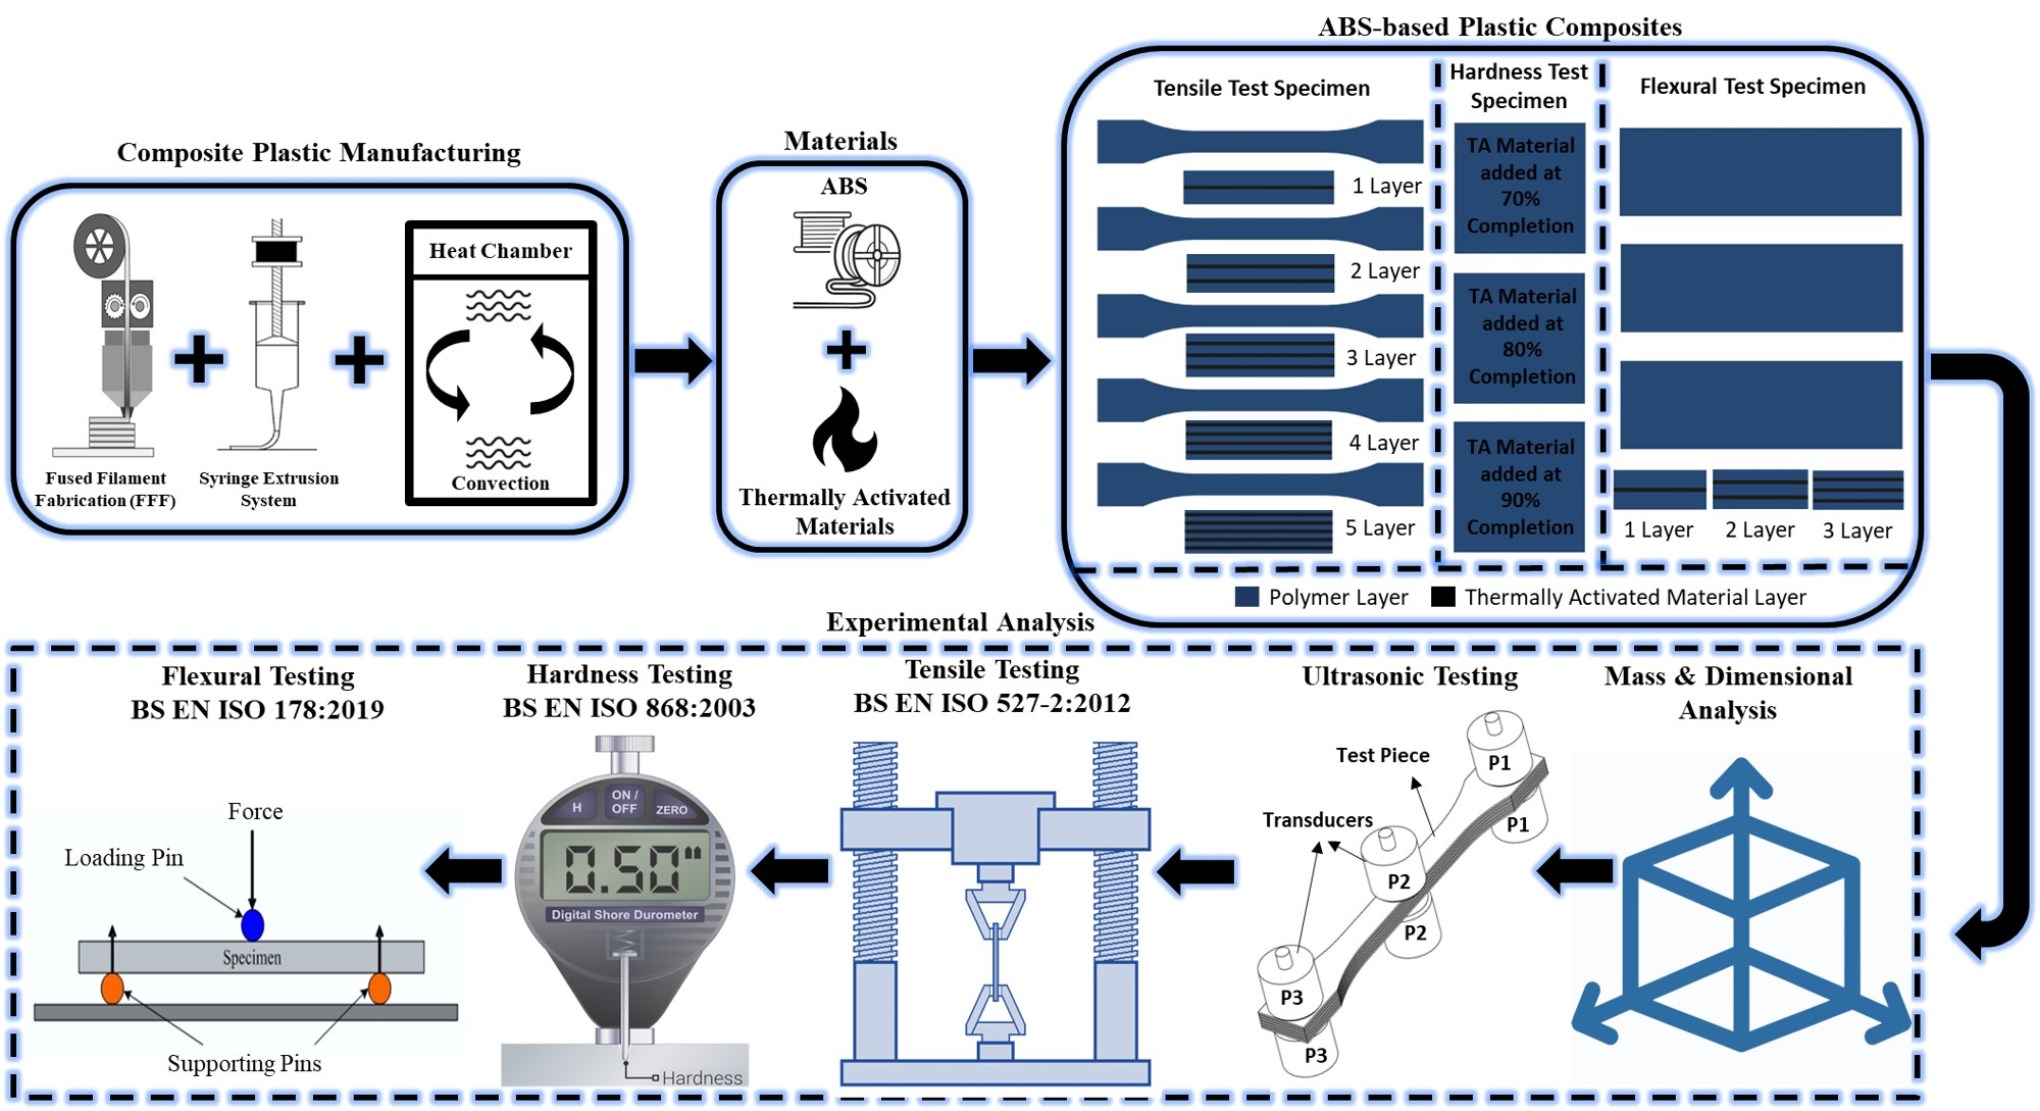
2.1. Materials and Manufacturing Process
2.2. Process Parameters and Configuration of Composites
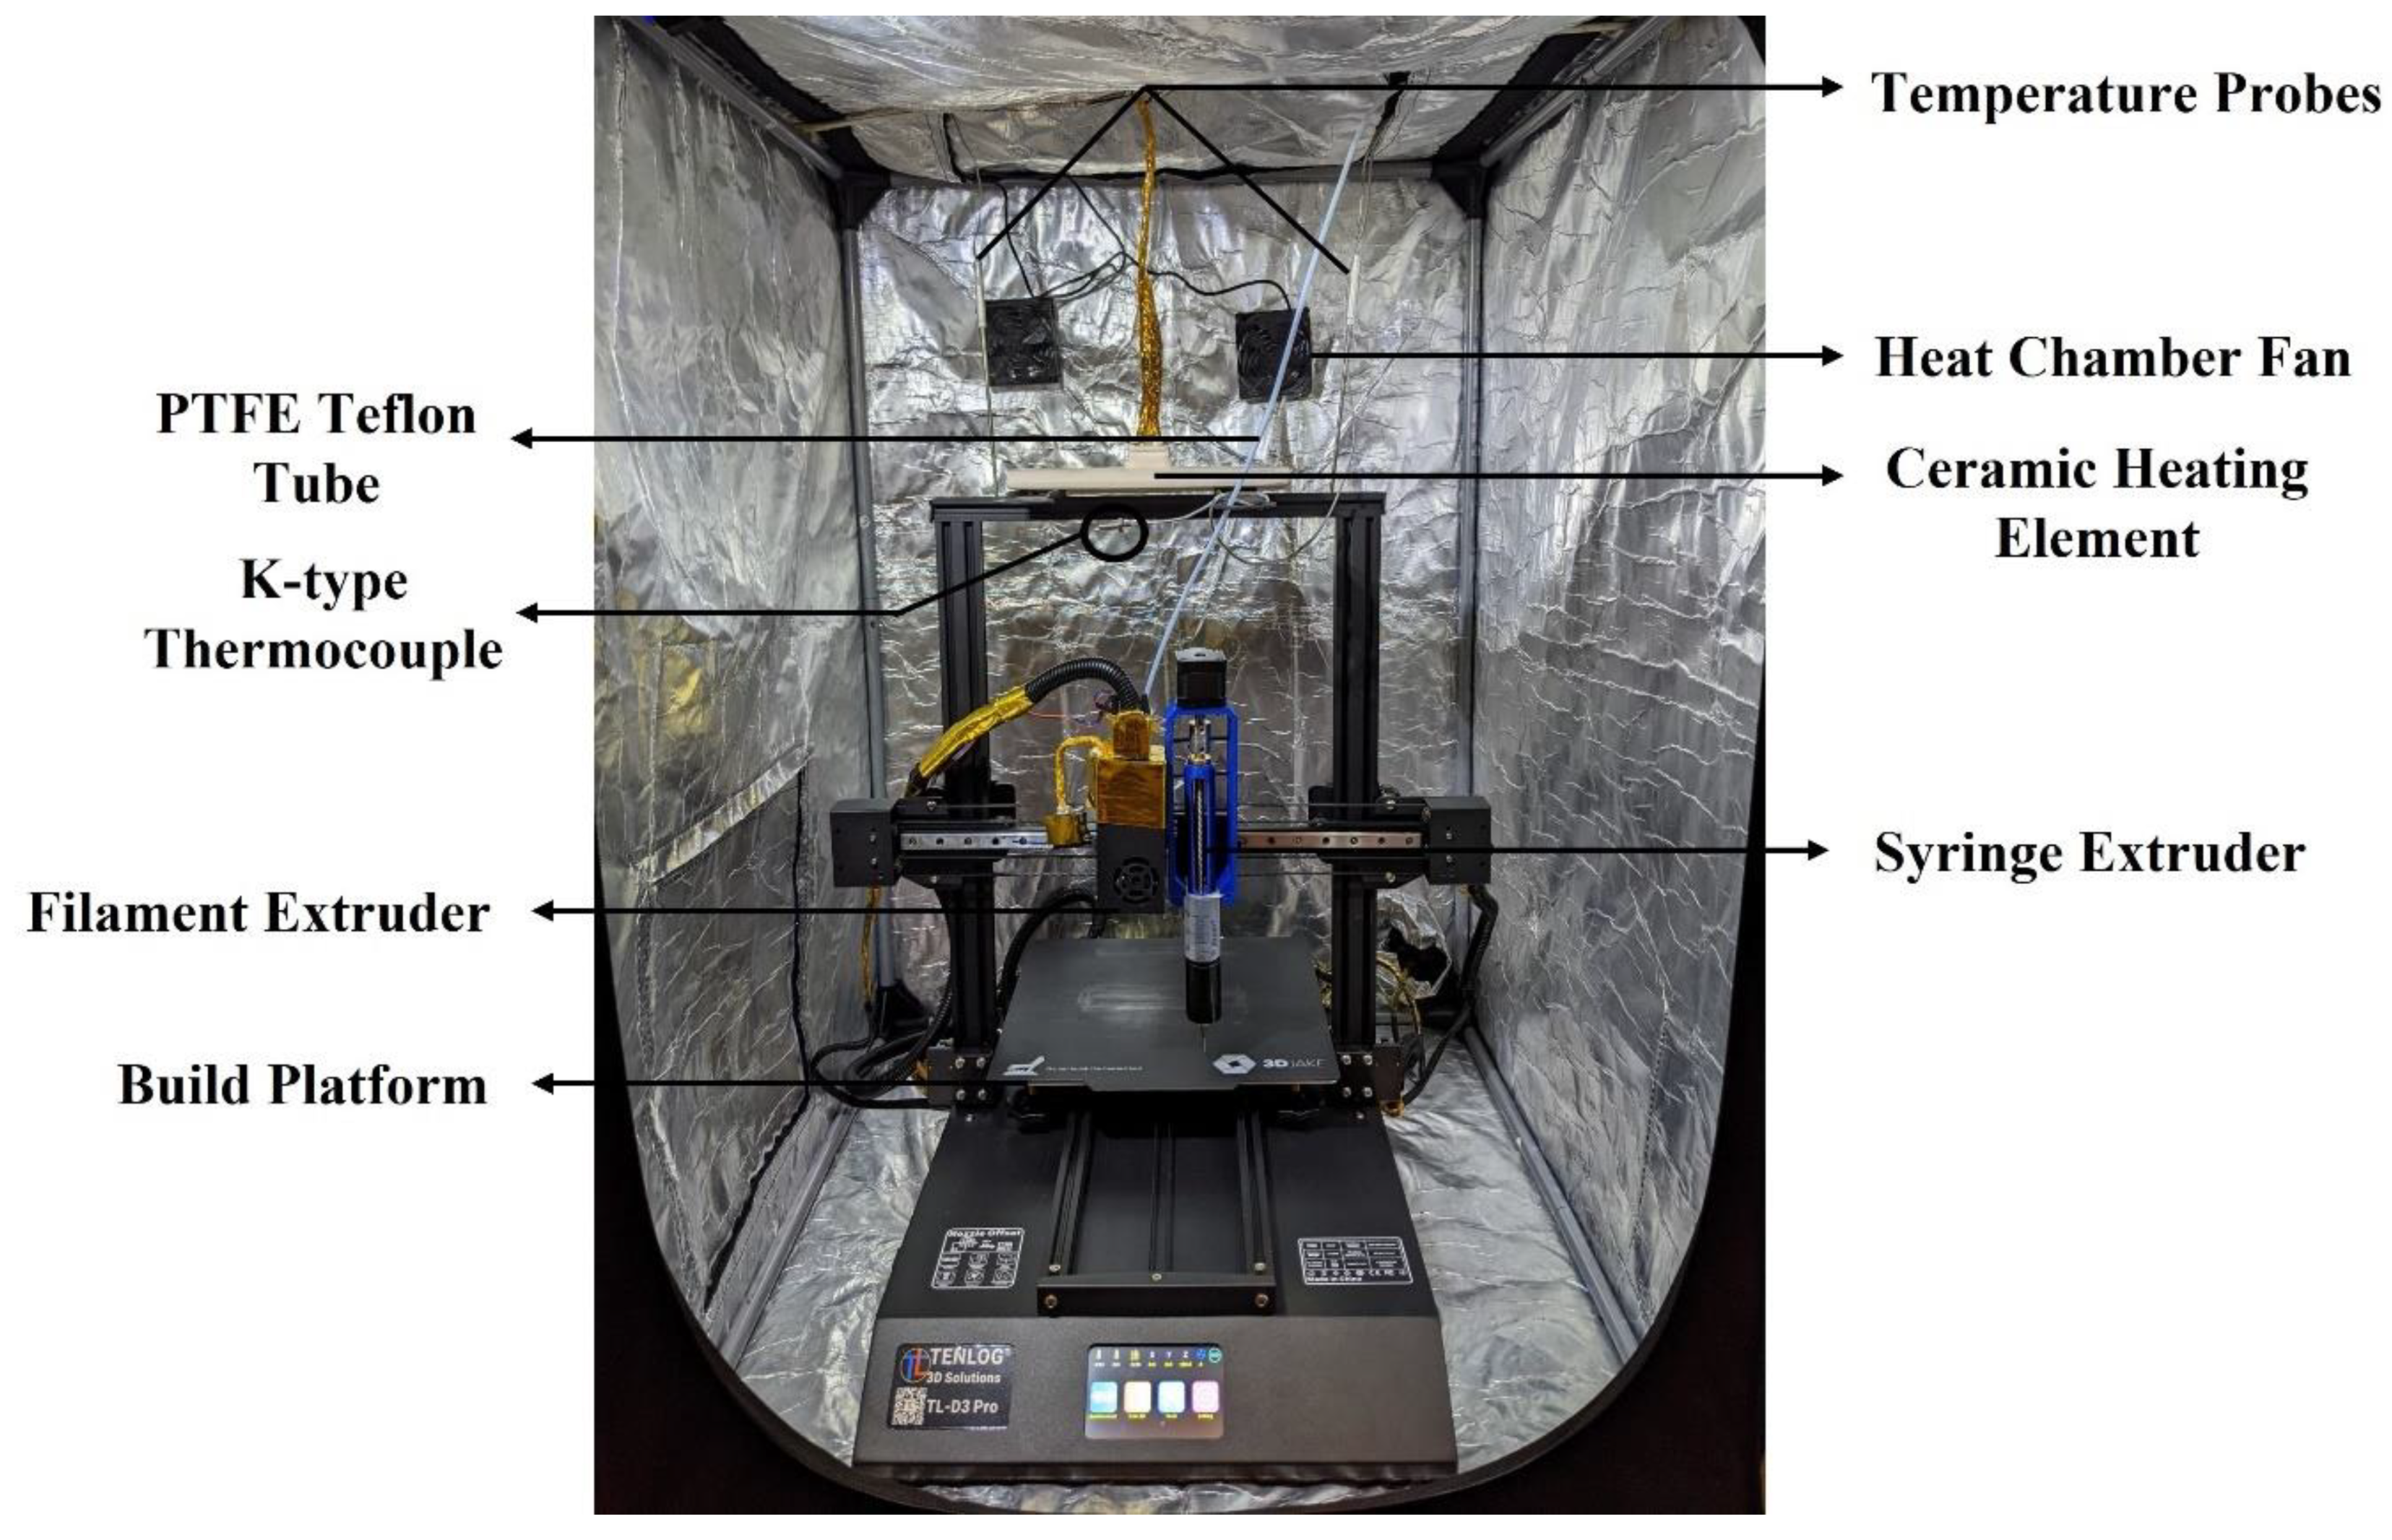
2.3. Measurements and Experimental Testing
3. Experimental Results and Discussion
3.1. Measurement of Mass
3.2. Dimensional Analysis
3.3. Ultrasonic Testing
3.4. Tensile Testing
3.5. Hardness Testing
3.6. Three-Point Flexural Testing
4. Conclusions
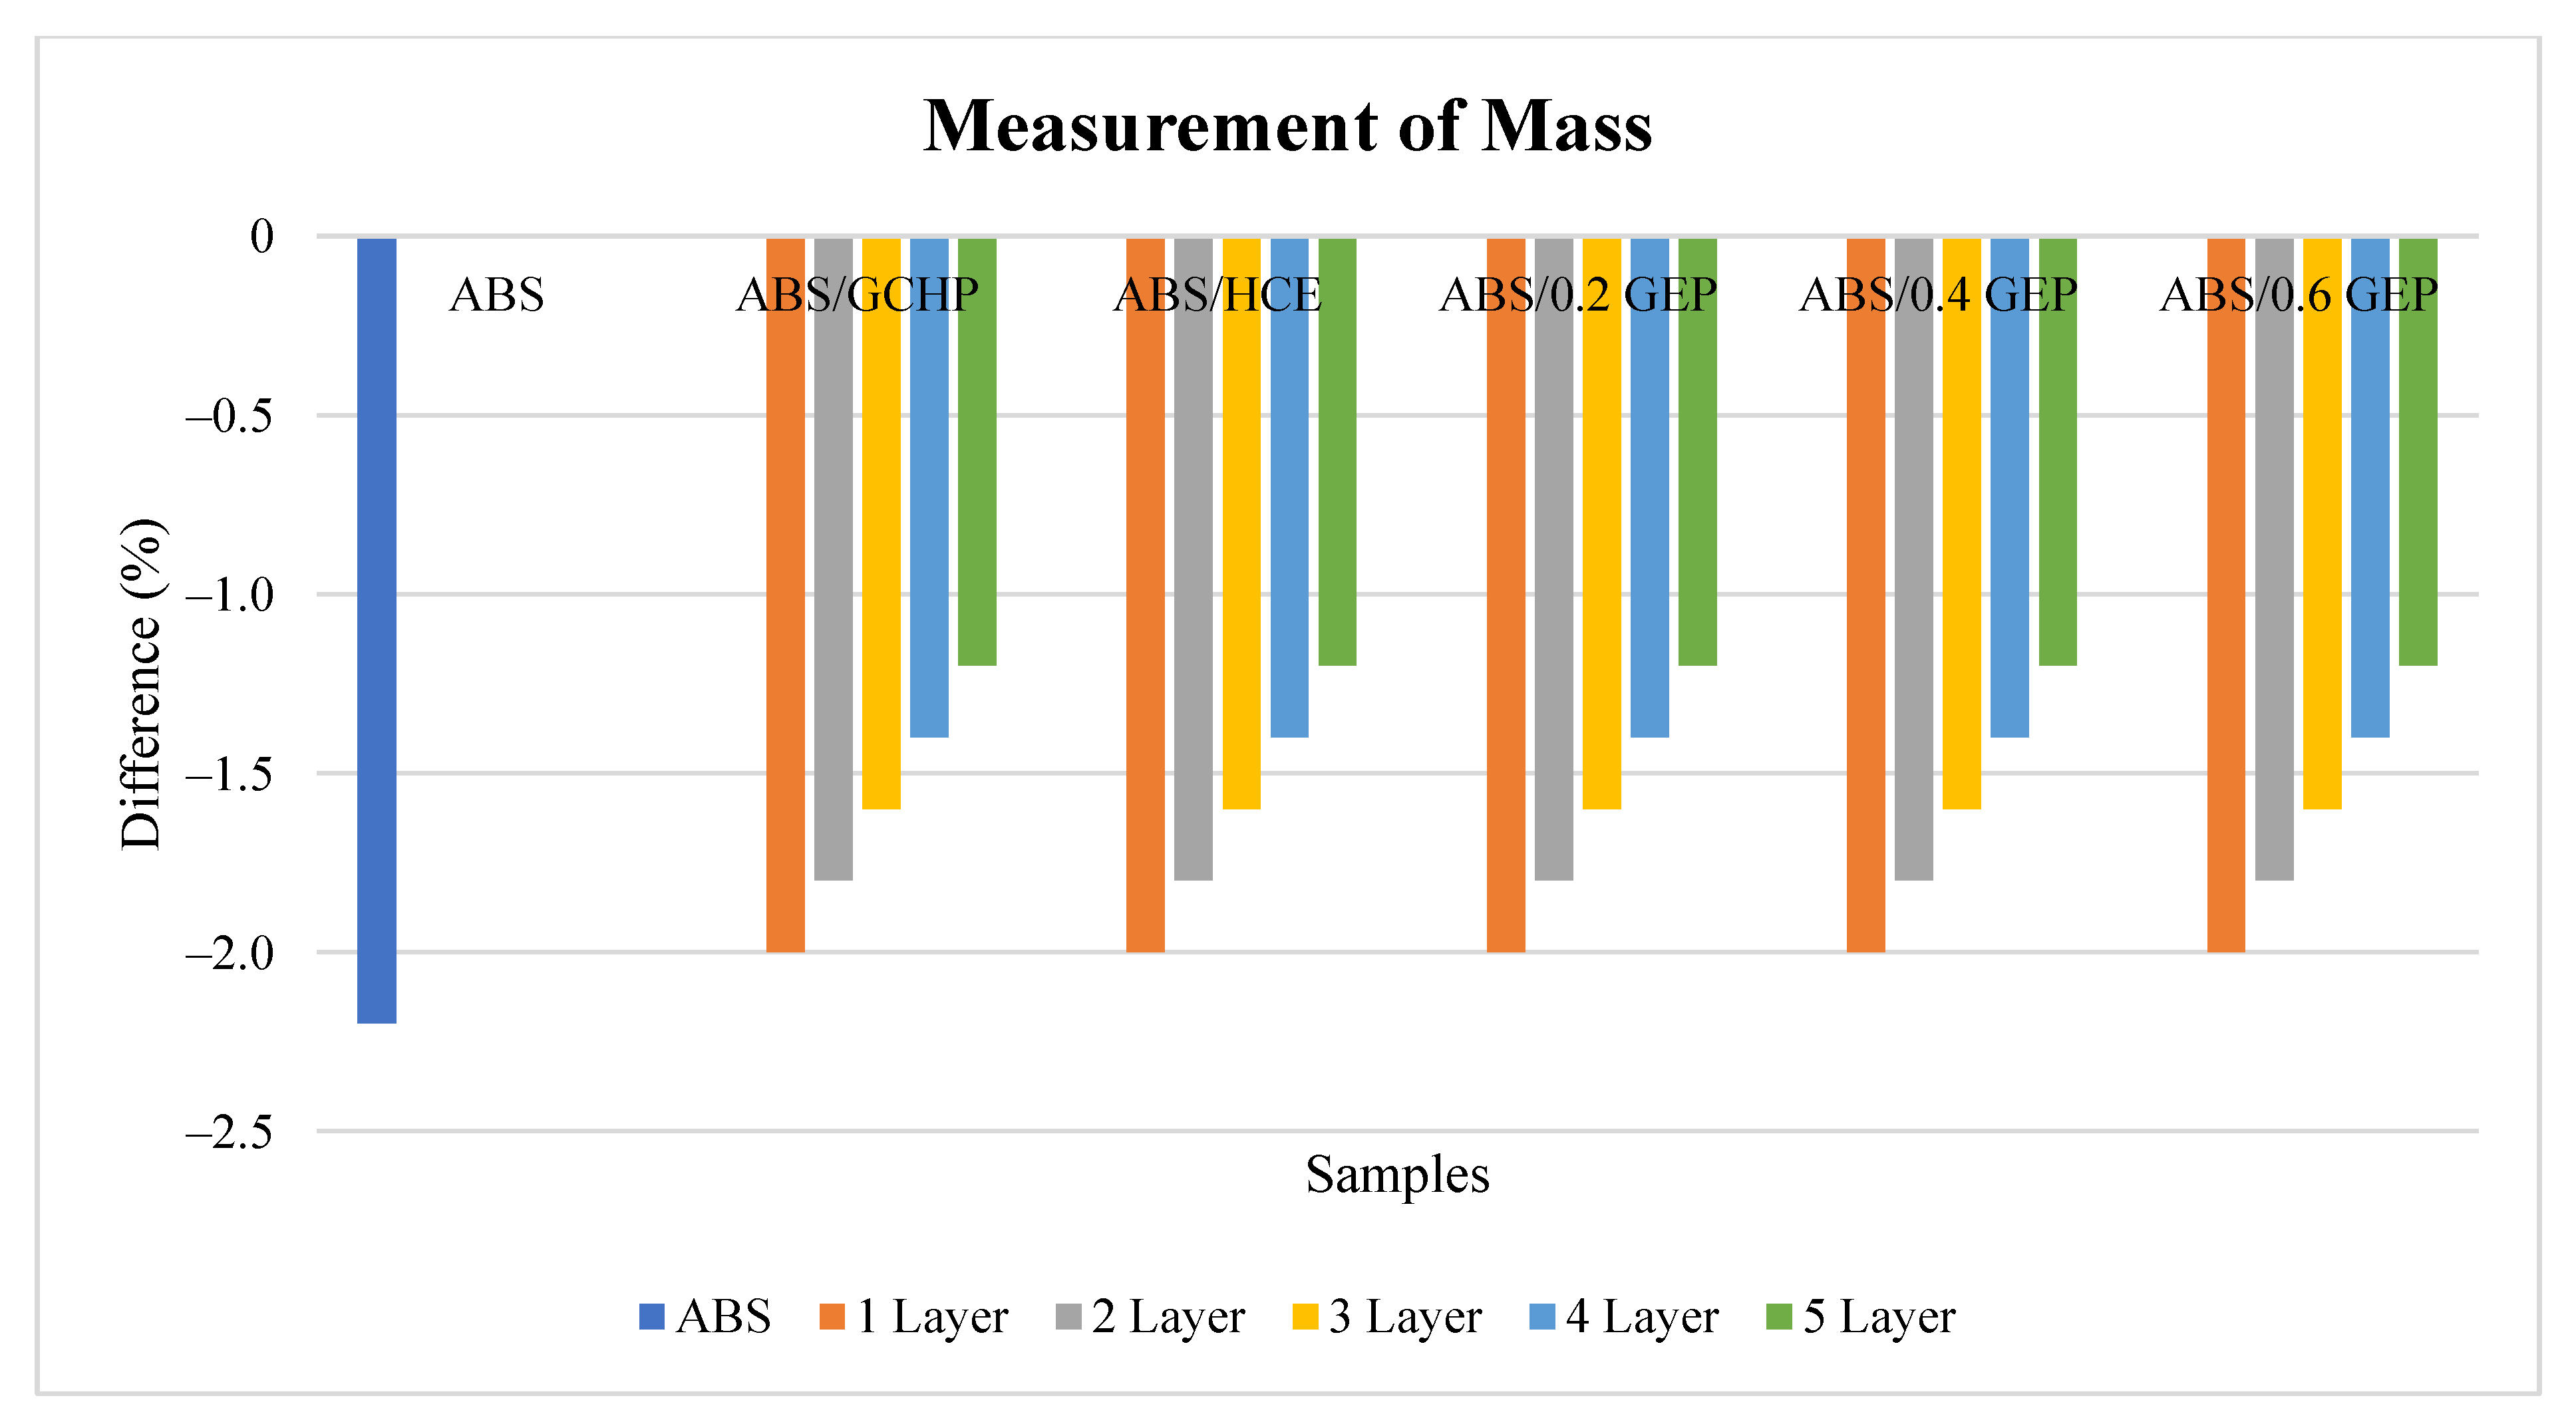
- The measurement of mass was carried out on the manufactured samples to investigate the effect of adding multiple layers of TA materials to 4 mm tensile samples. Commercially available ABS manufactured using the FFF process showed a mass of 9.78 g with a percentage difference of −2.2%. The composites manufactured using the CPM process showed consistent mass for all the samples. Furthermore, the composites showed a 0.2 g increase in their mass for every single layer addition of TA material. The highest mass value of 9.88 g was observed for five-layered composites with a percentage difference of −1.2%, which is within the tolerance of actual mass (10 g) generated in Ultimaker Cura software during slicing. It is evident from the results that the parts manufactured by CPM are not adversely affected by the addition of TA material to ABS and it enhanced the accuracy of the overall mass. The mass of the desired part can be adjusted based on the product requirements, thus making the process versatile to produce bespoke parts with customised properties.
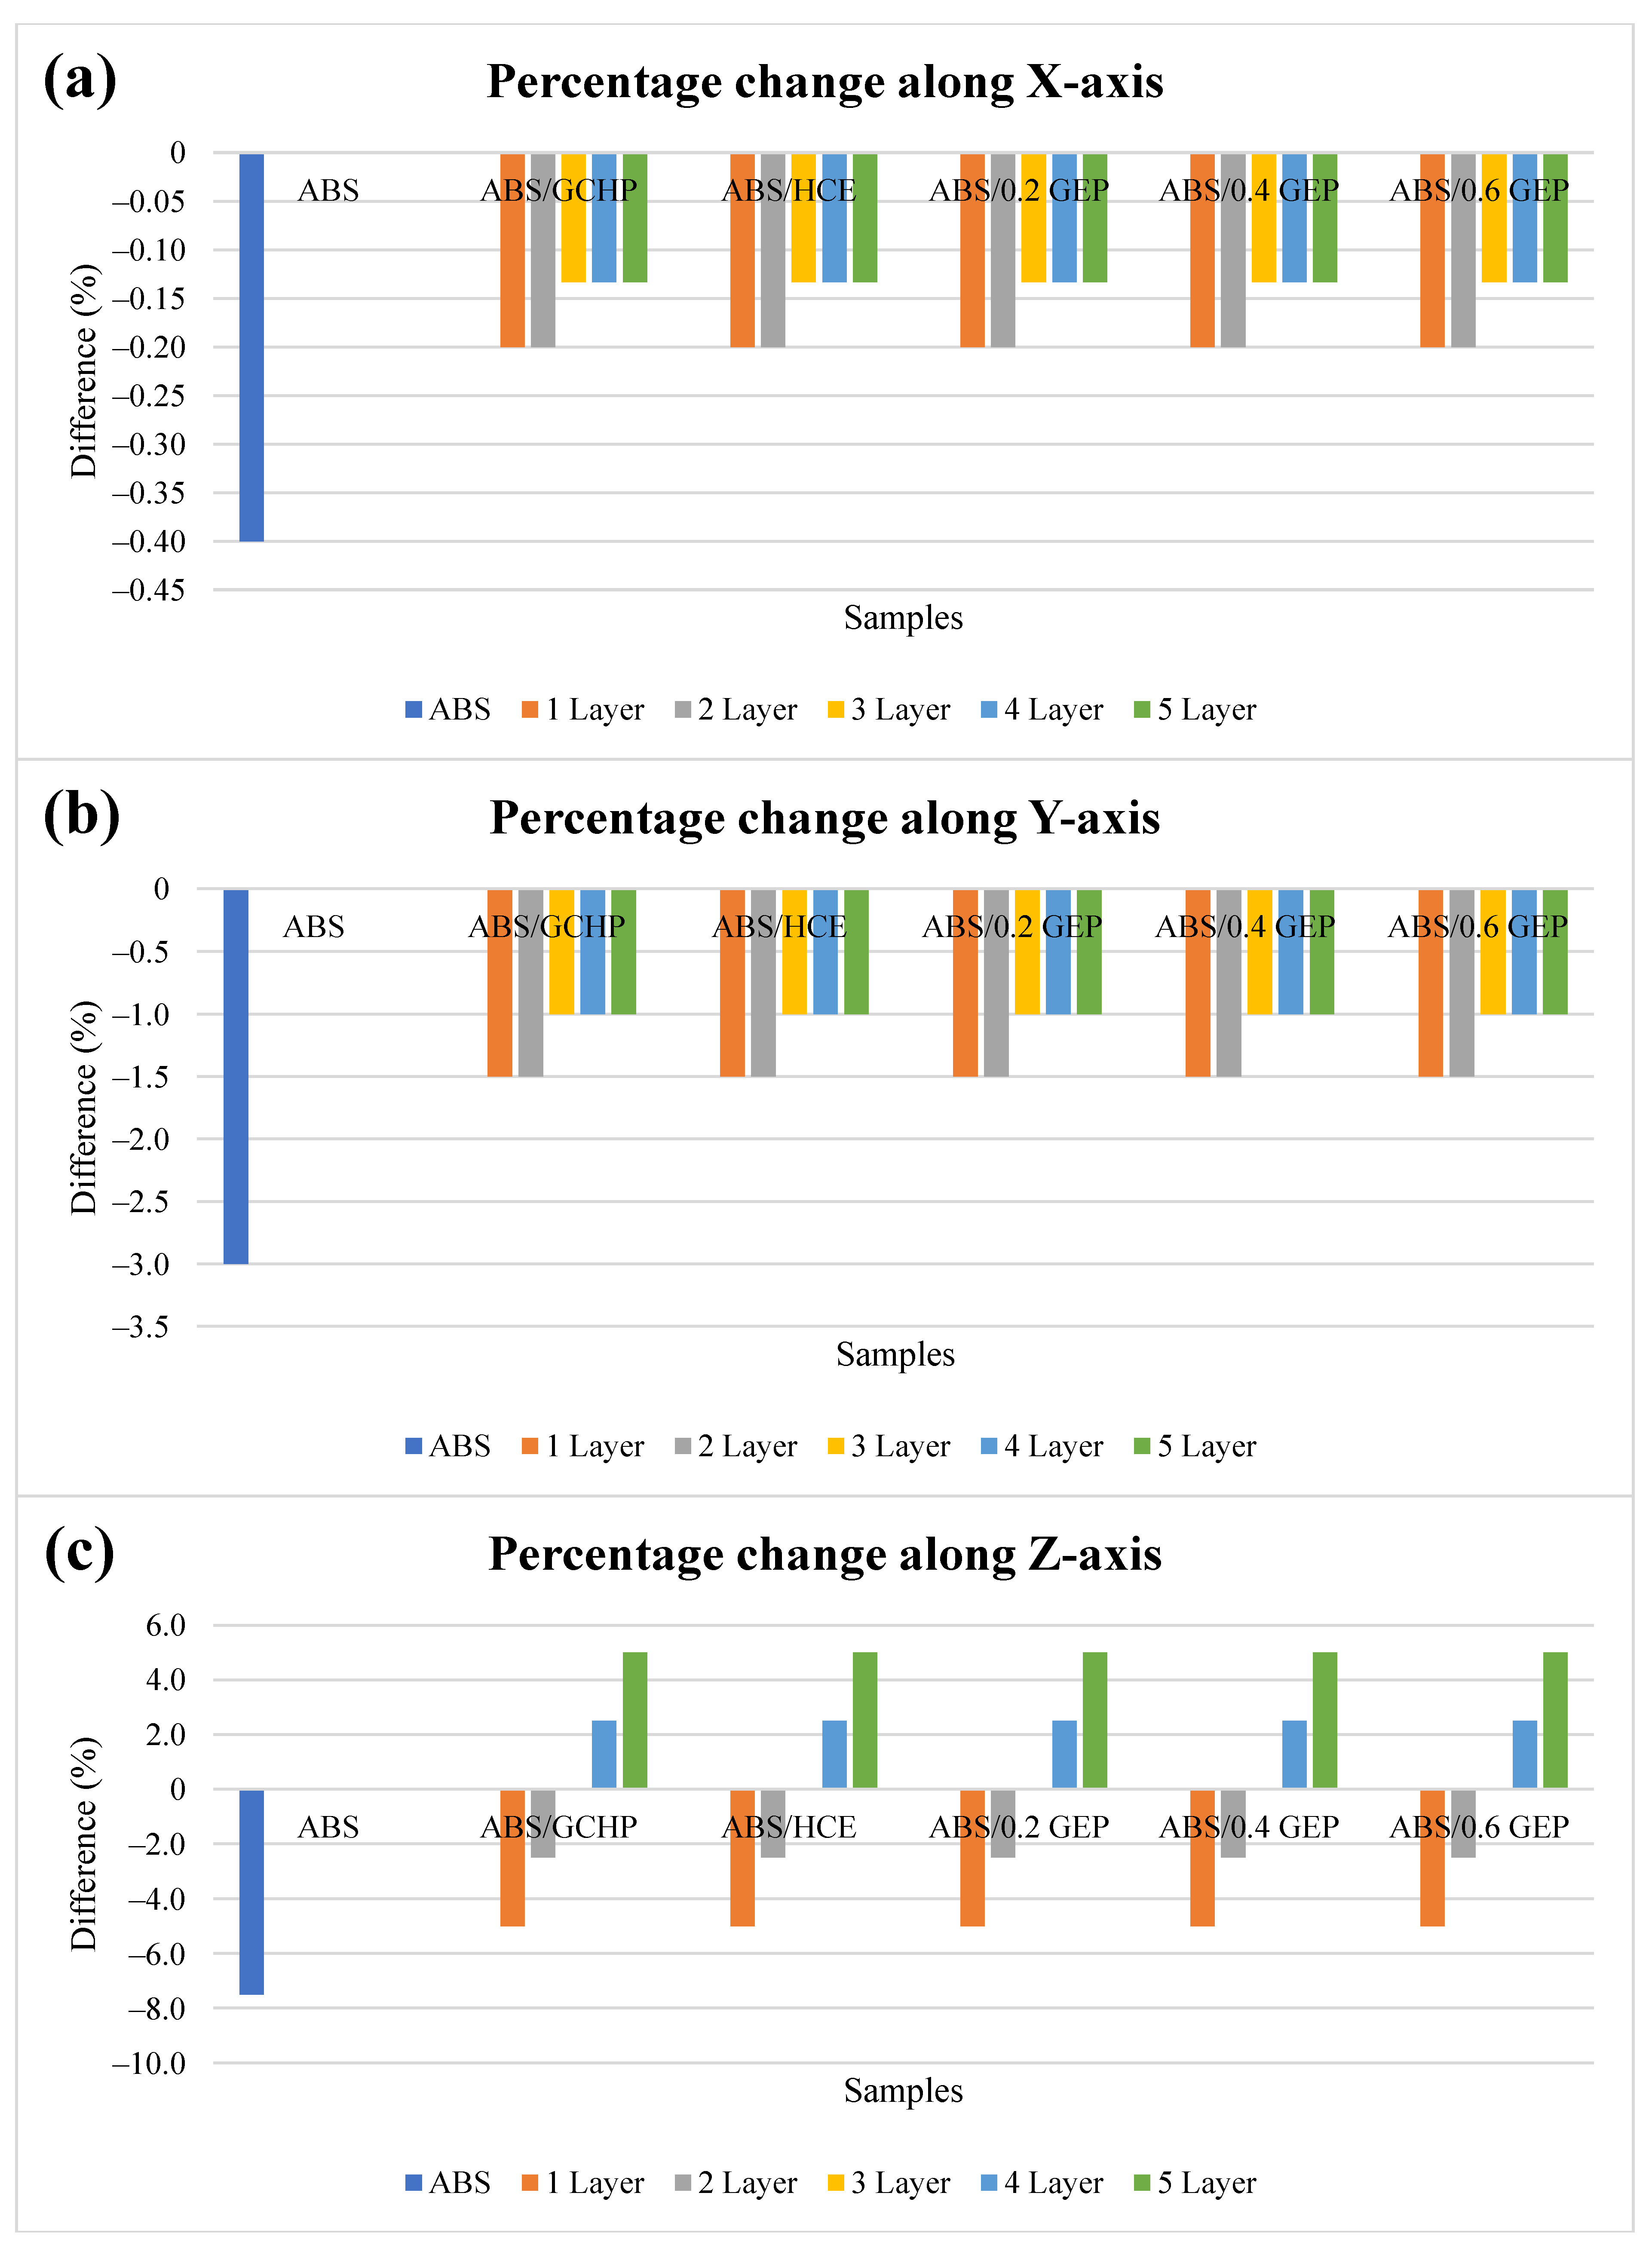
- Dimensional analysis showed that CPM is able to manufacture plastic composites in a consistent manner with minimal inaccuracies. An increase of 0.1 mm in total thickness (z-axis) was observed for every single layer addition of TA materials, and these tolerances can be taken into consideration by designers based on the product requirements. The consistent deposition of TA material improved the dimensional accuracy of the final product, thereby enhancing the mechanical properties, which cannot be achieved in FFF-manufactured parts.
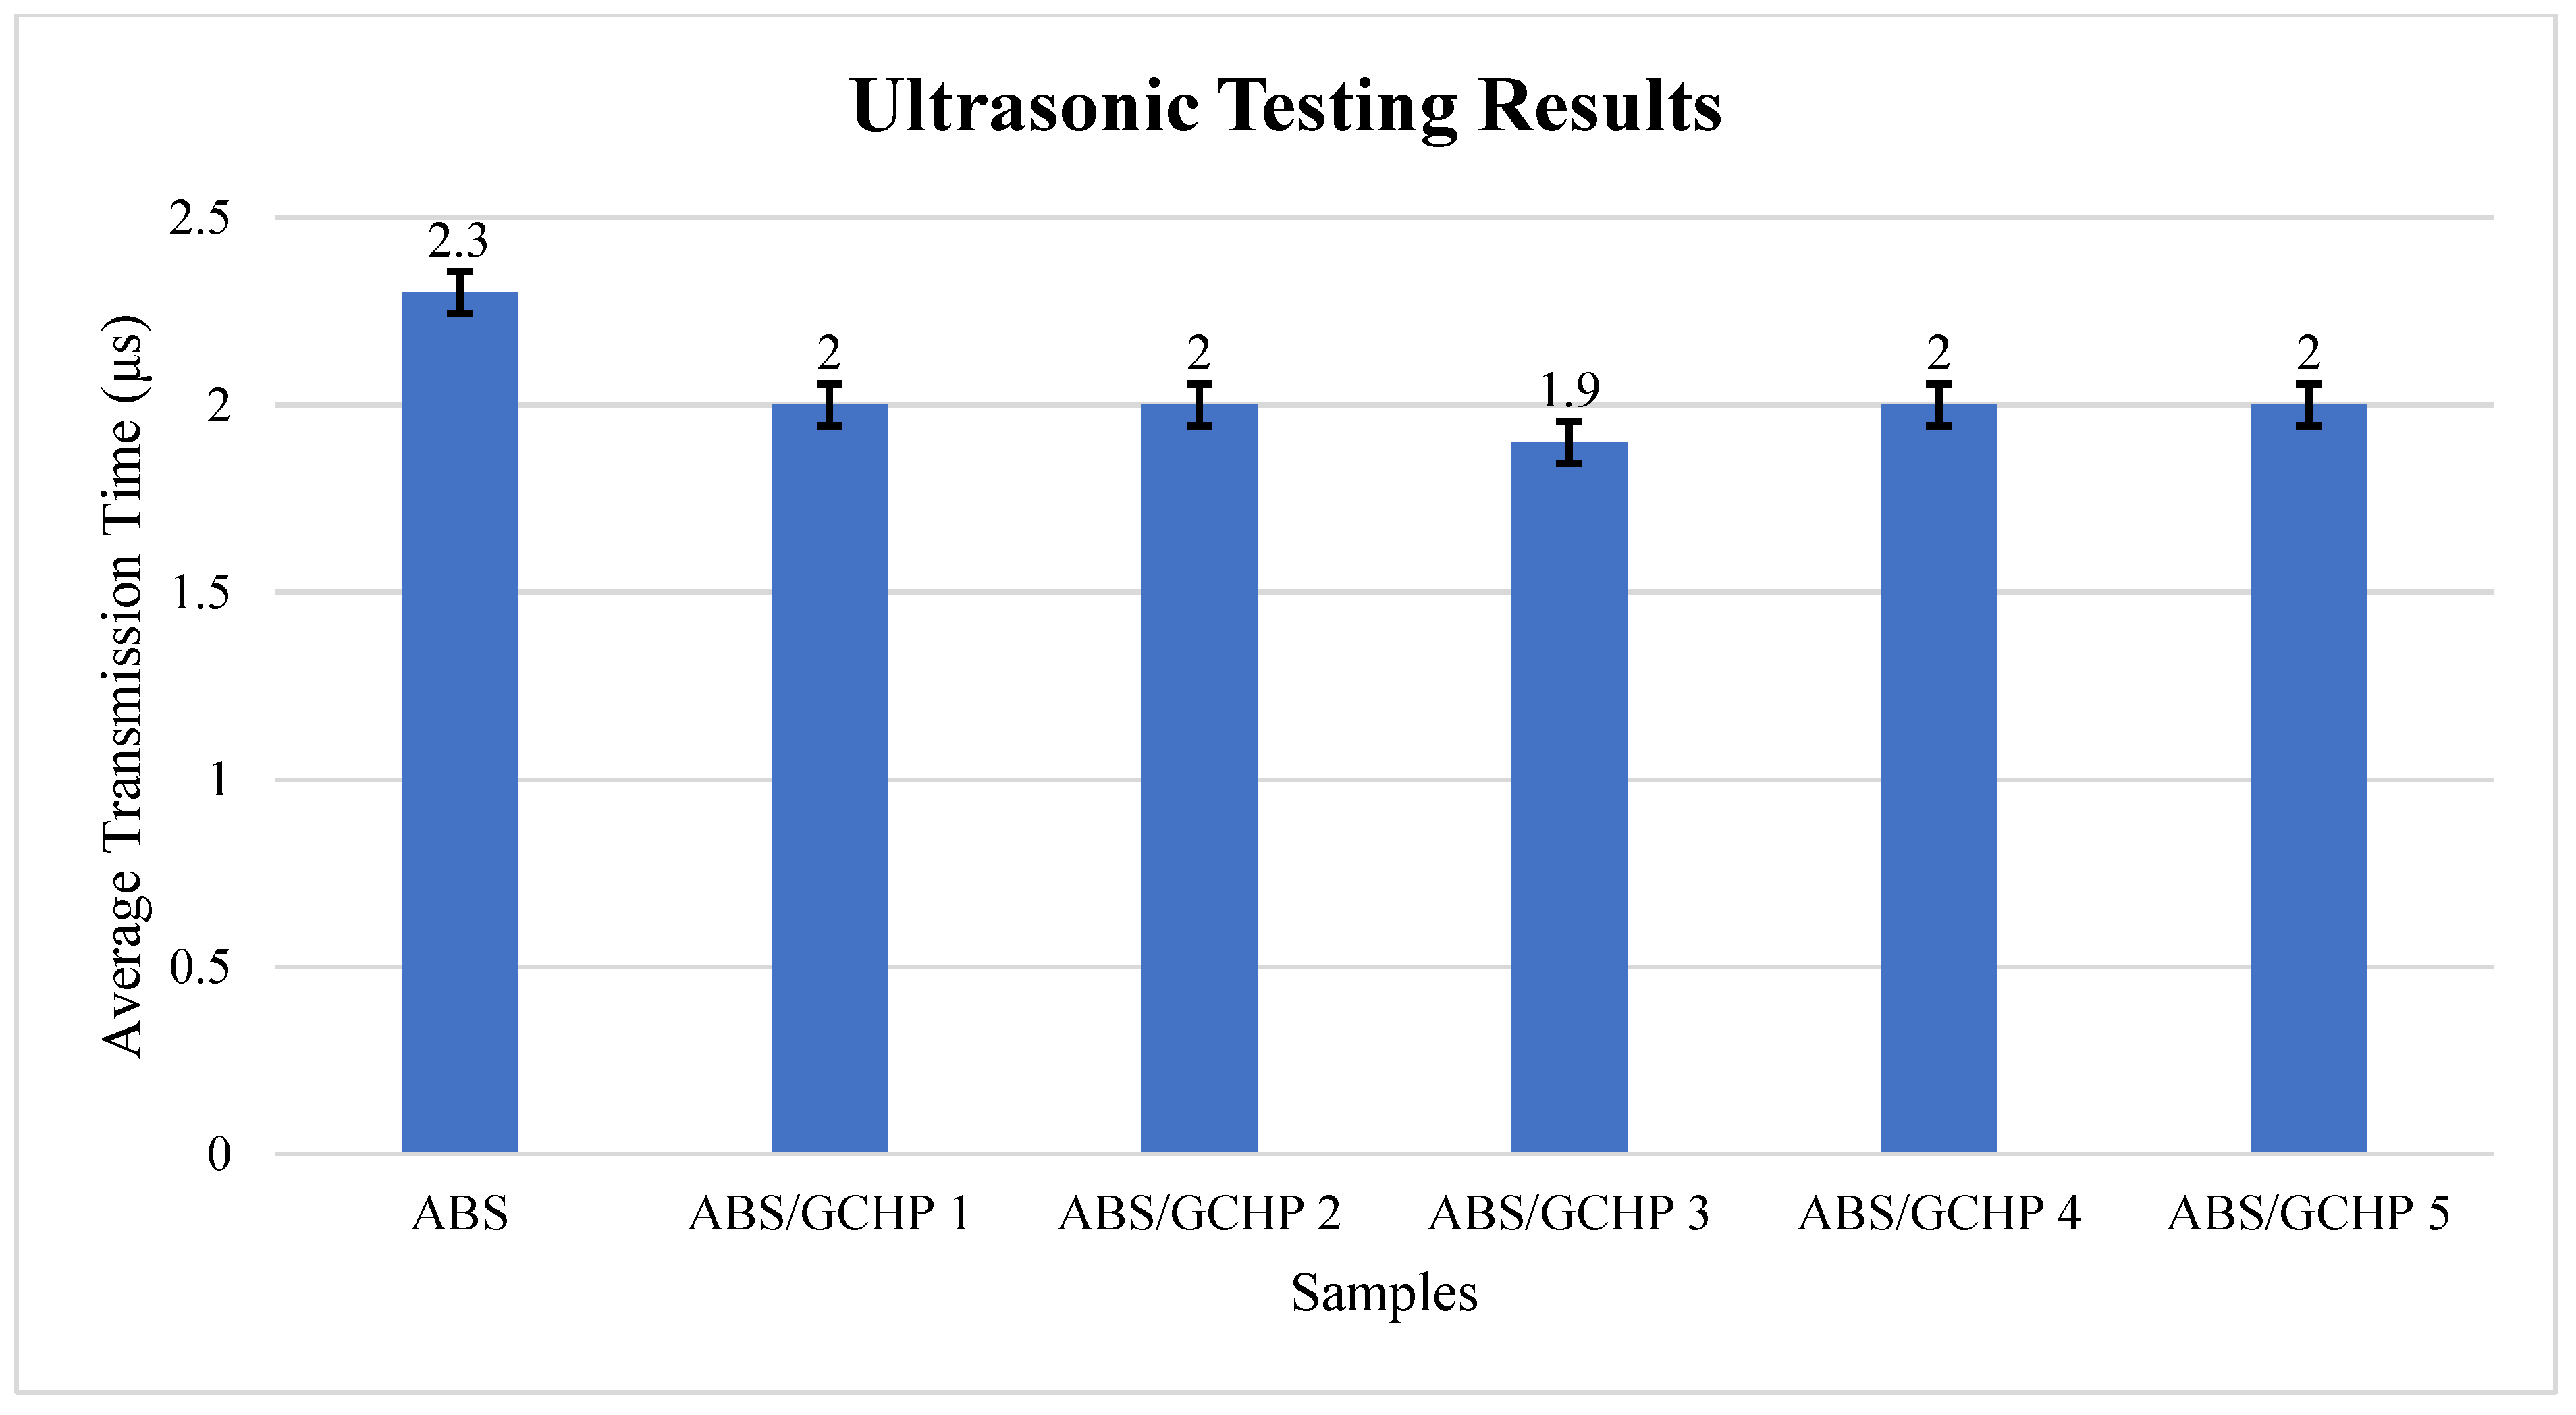
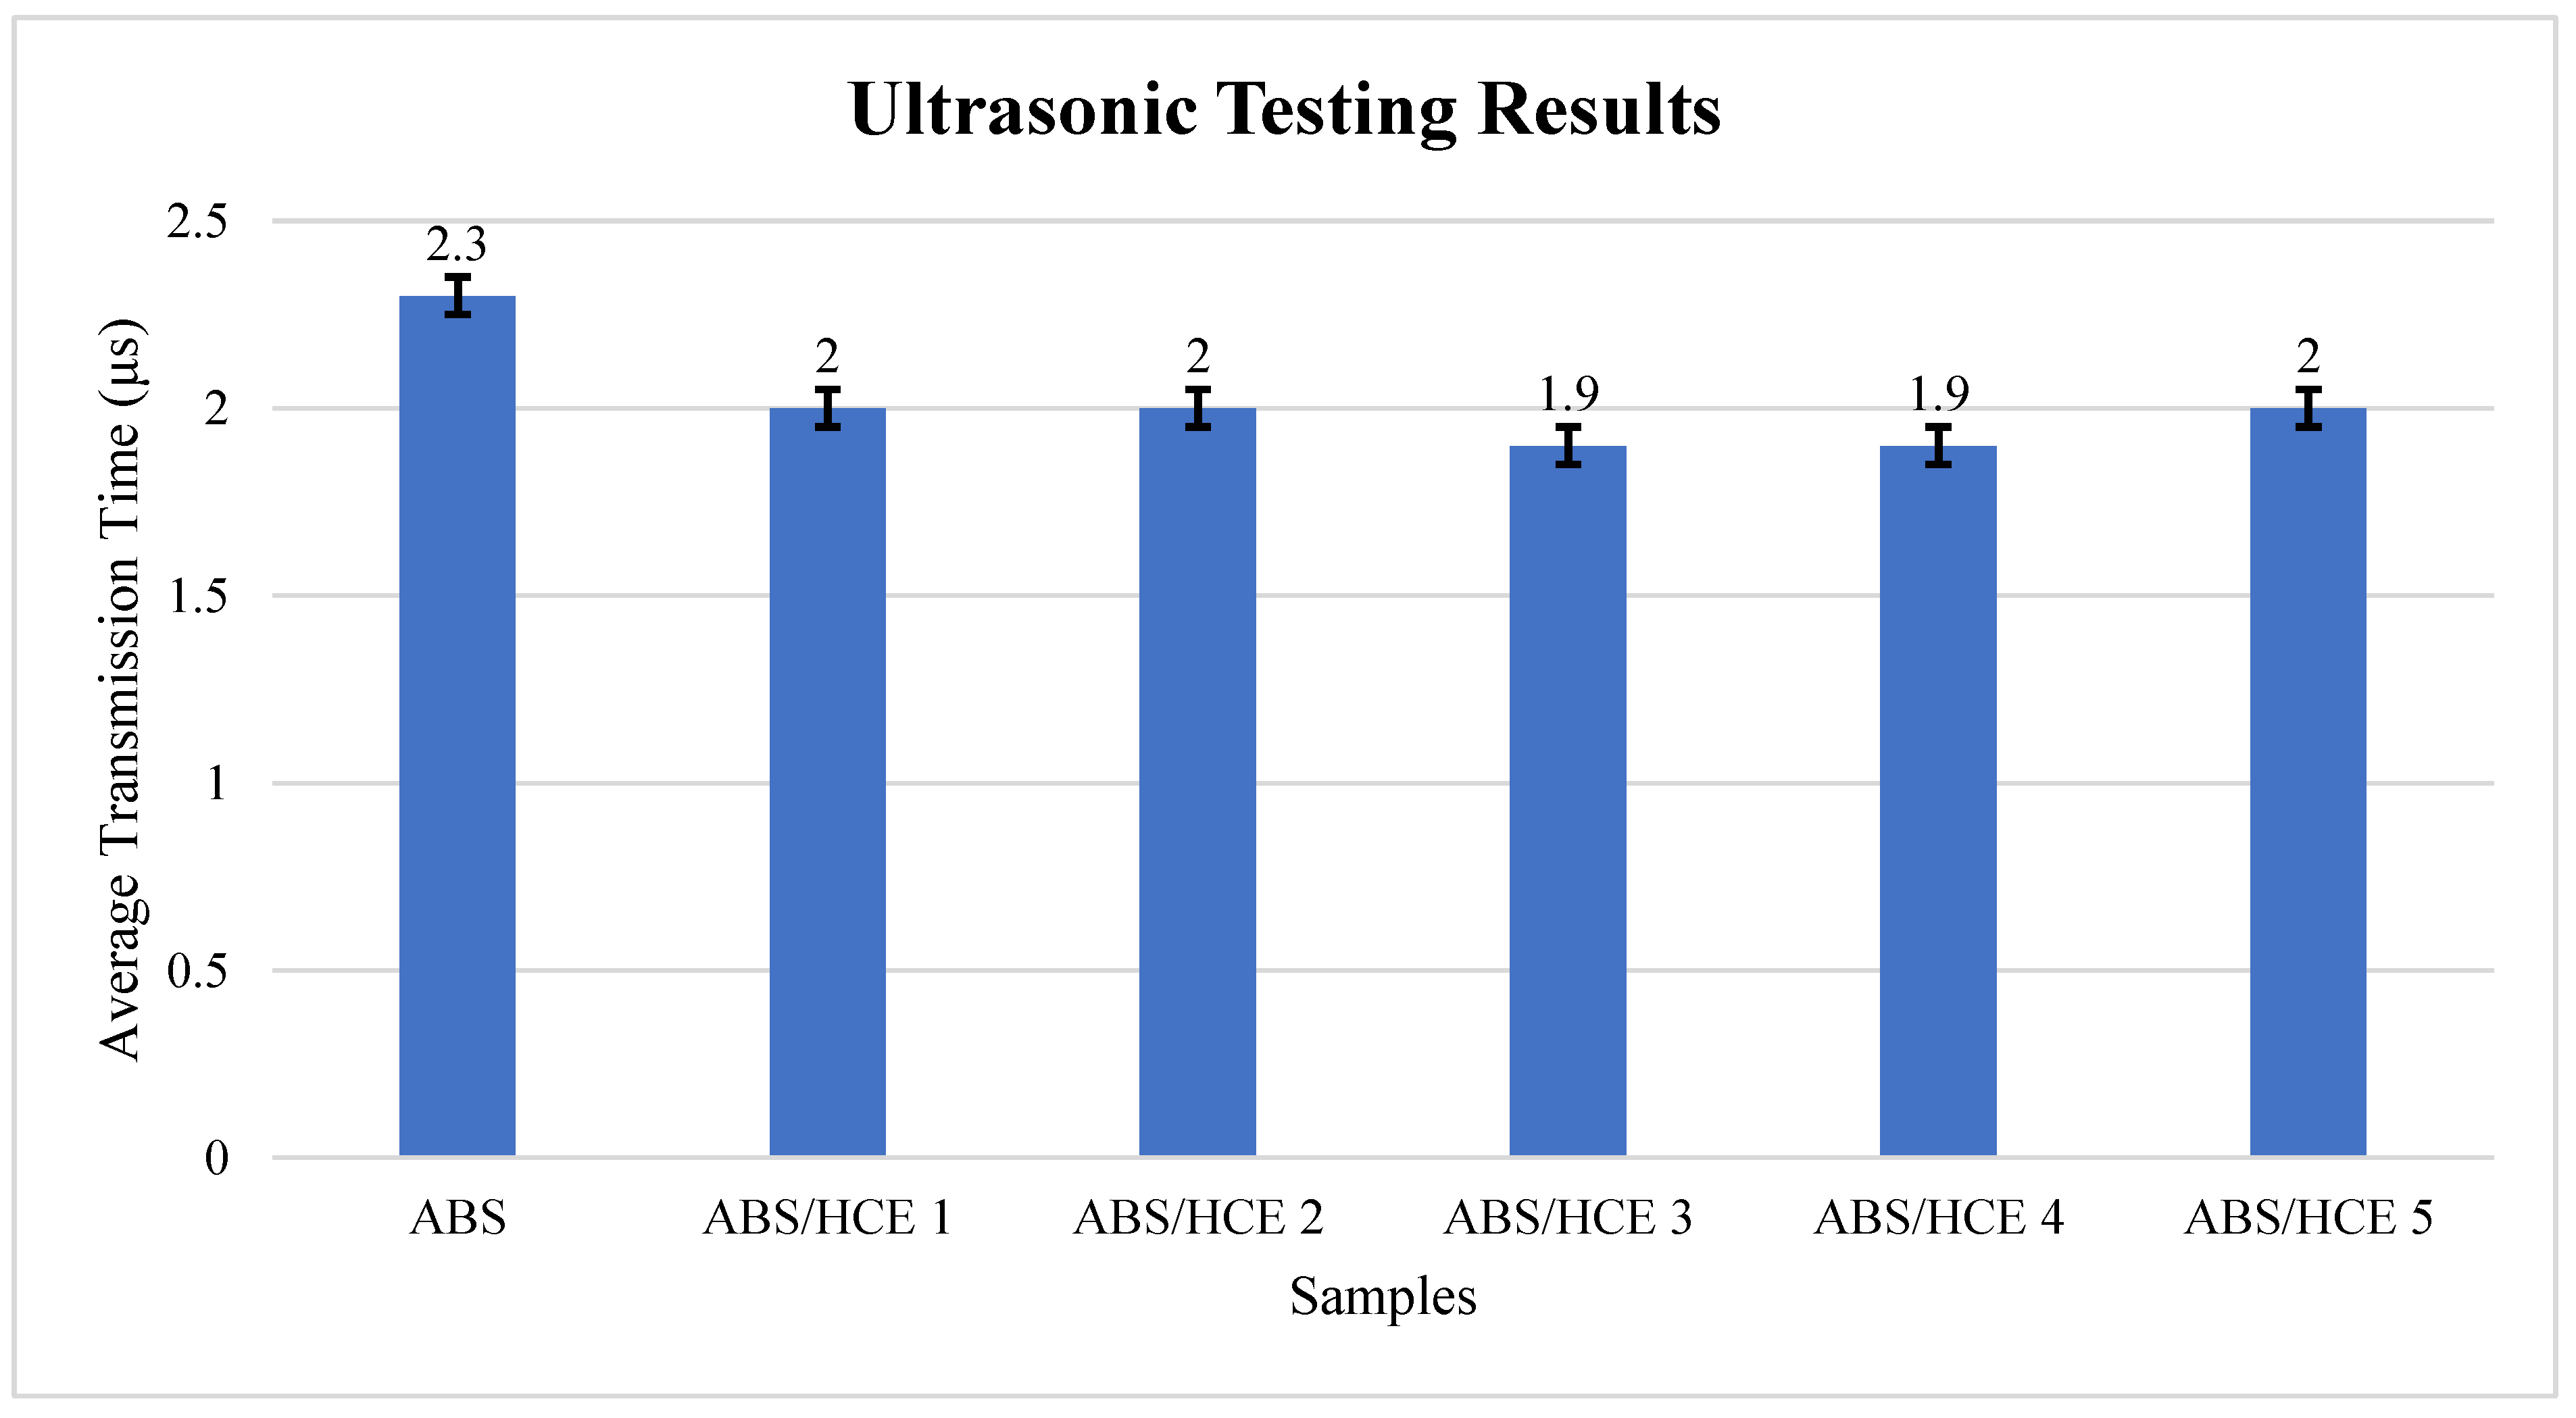
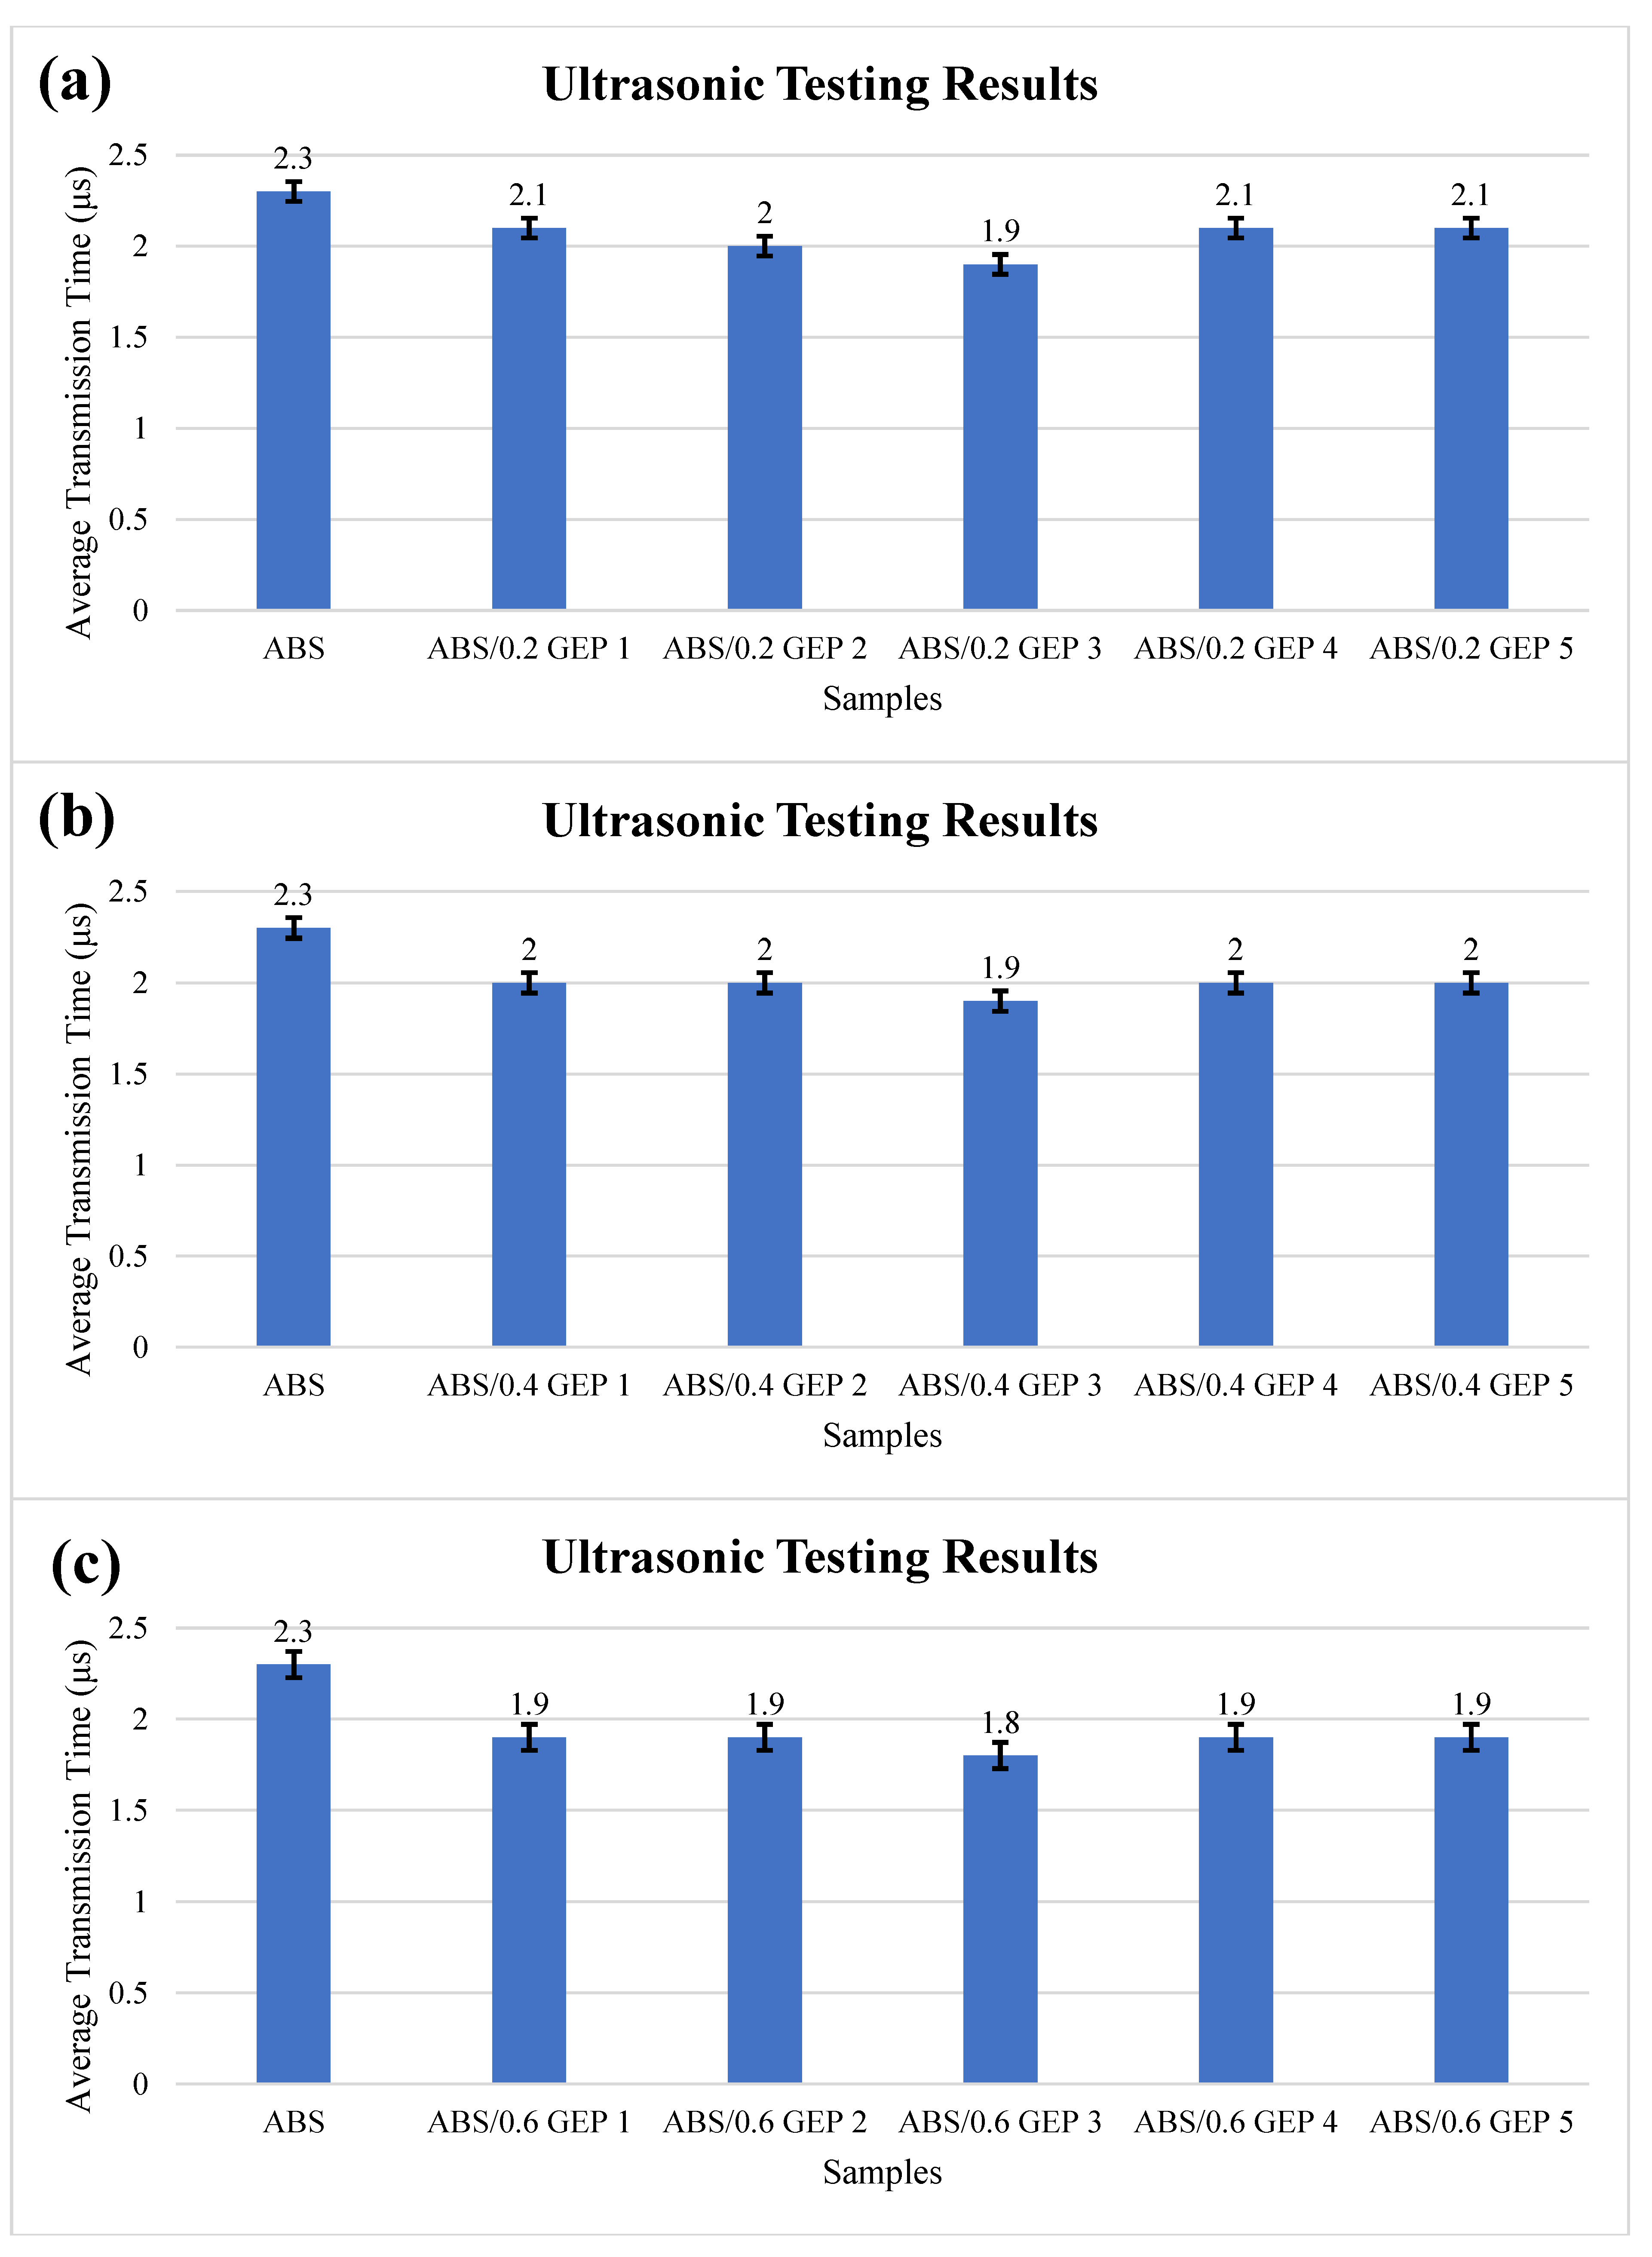
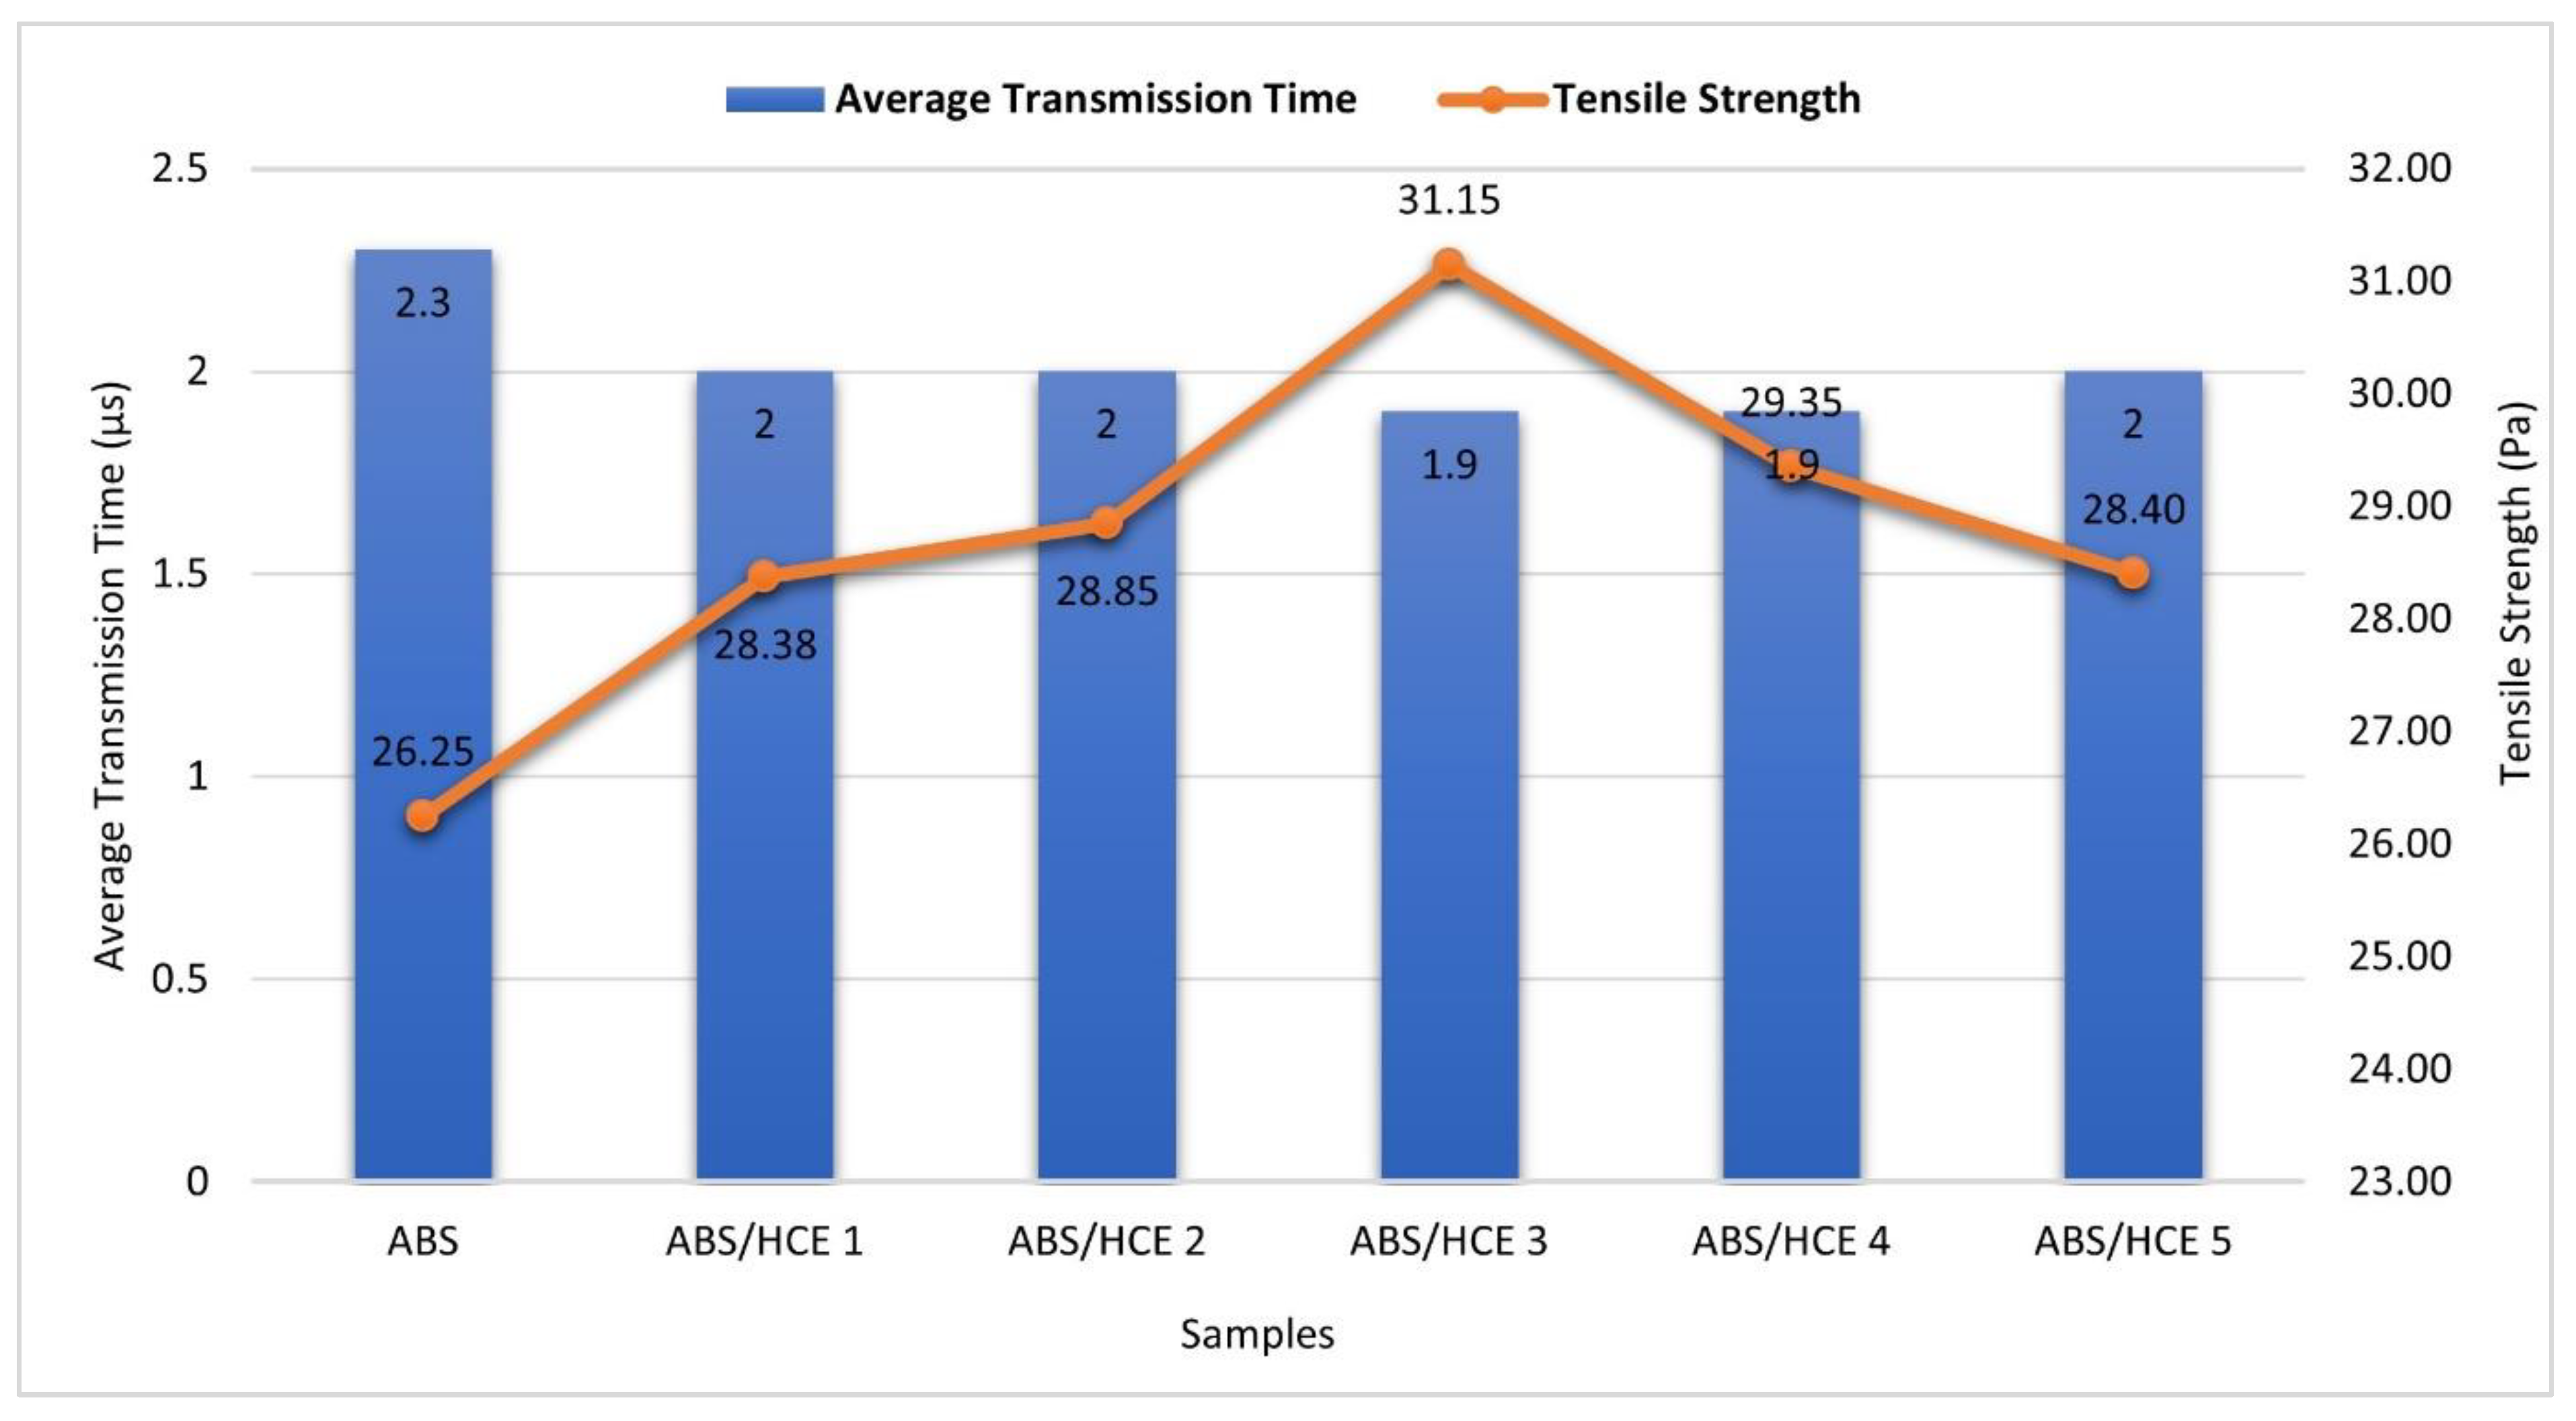
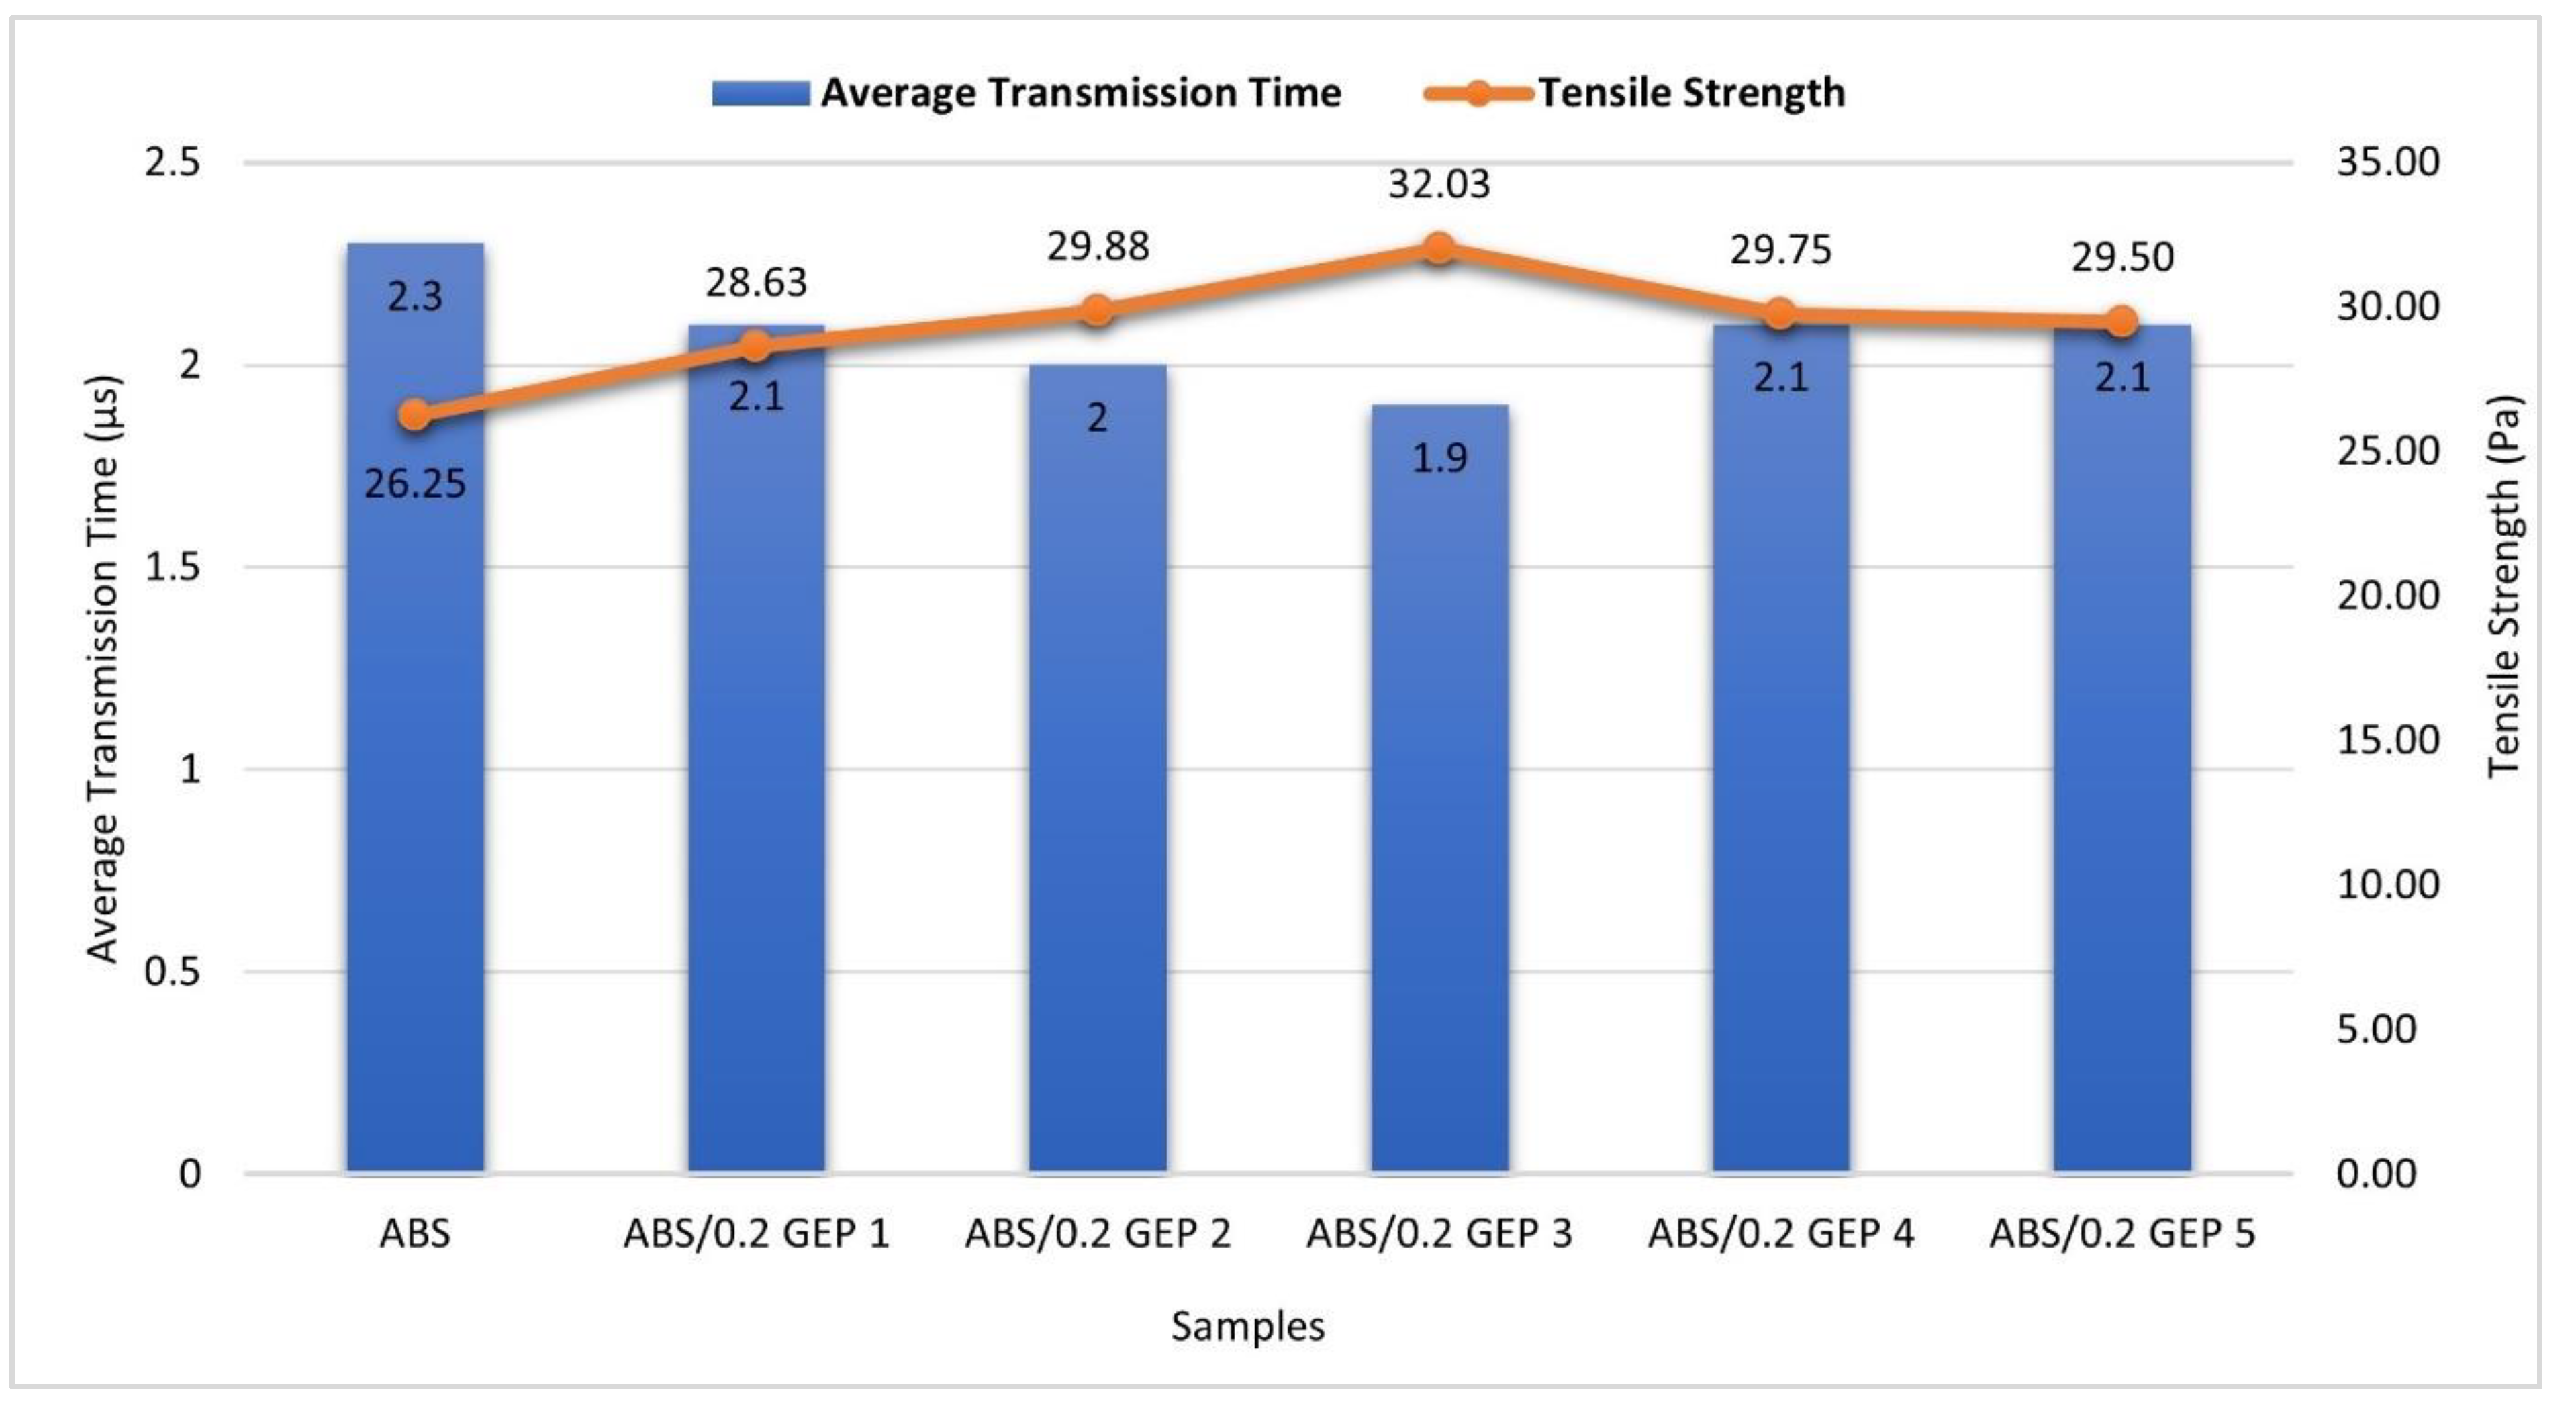
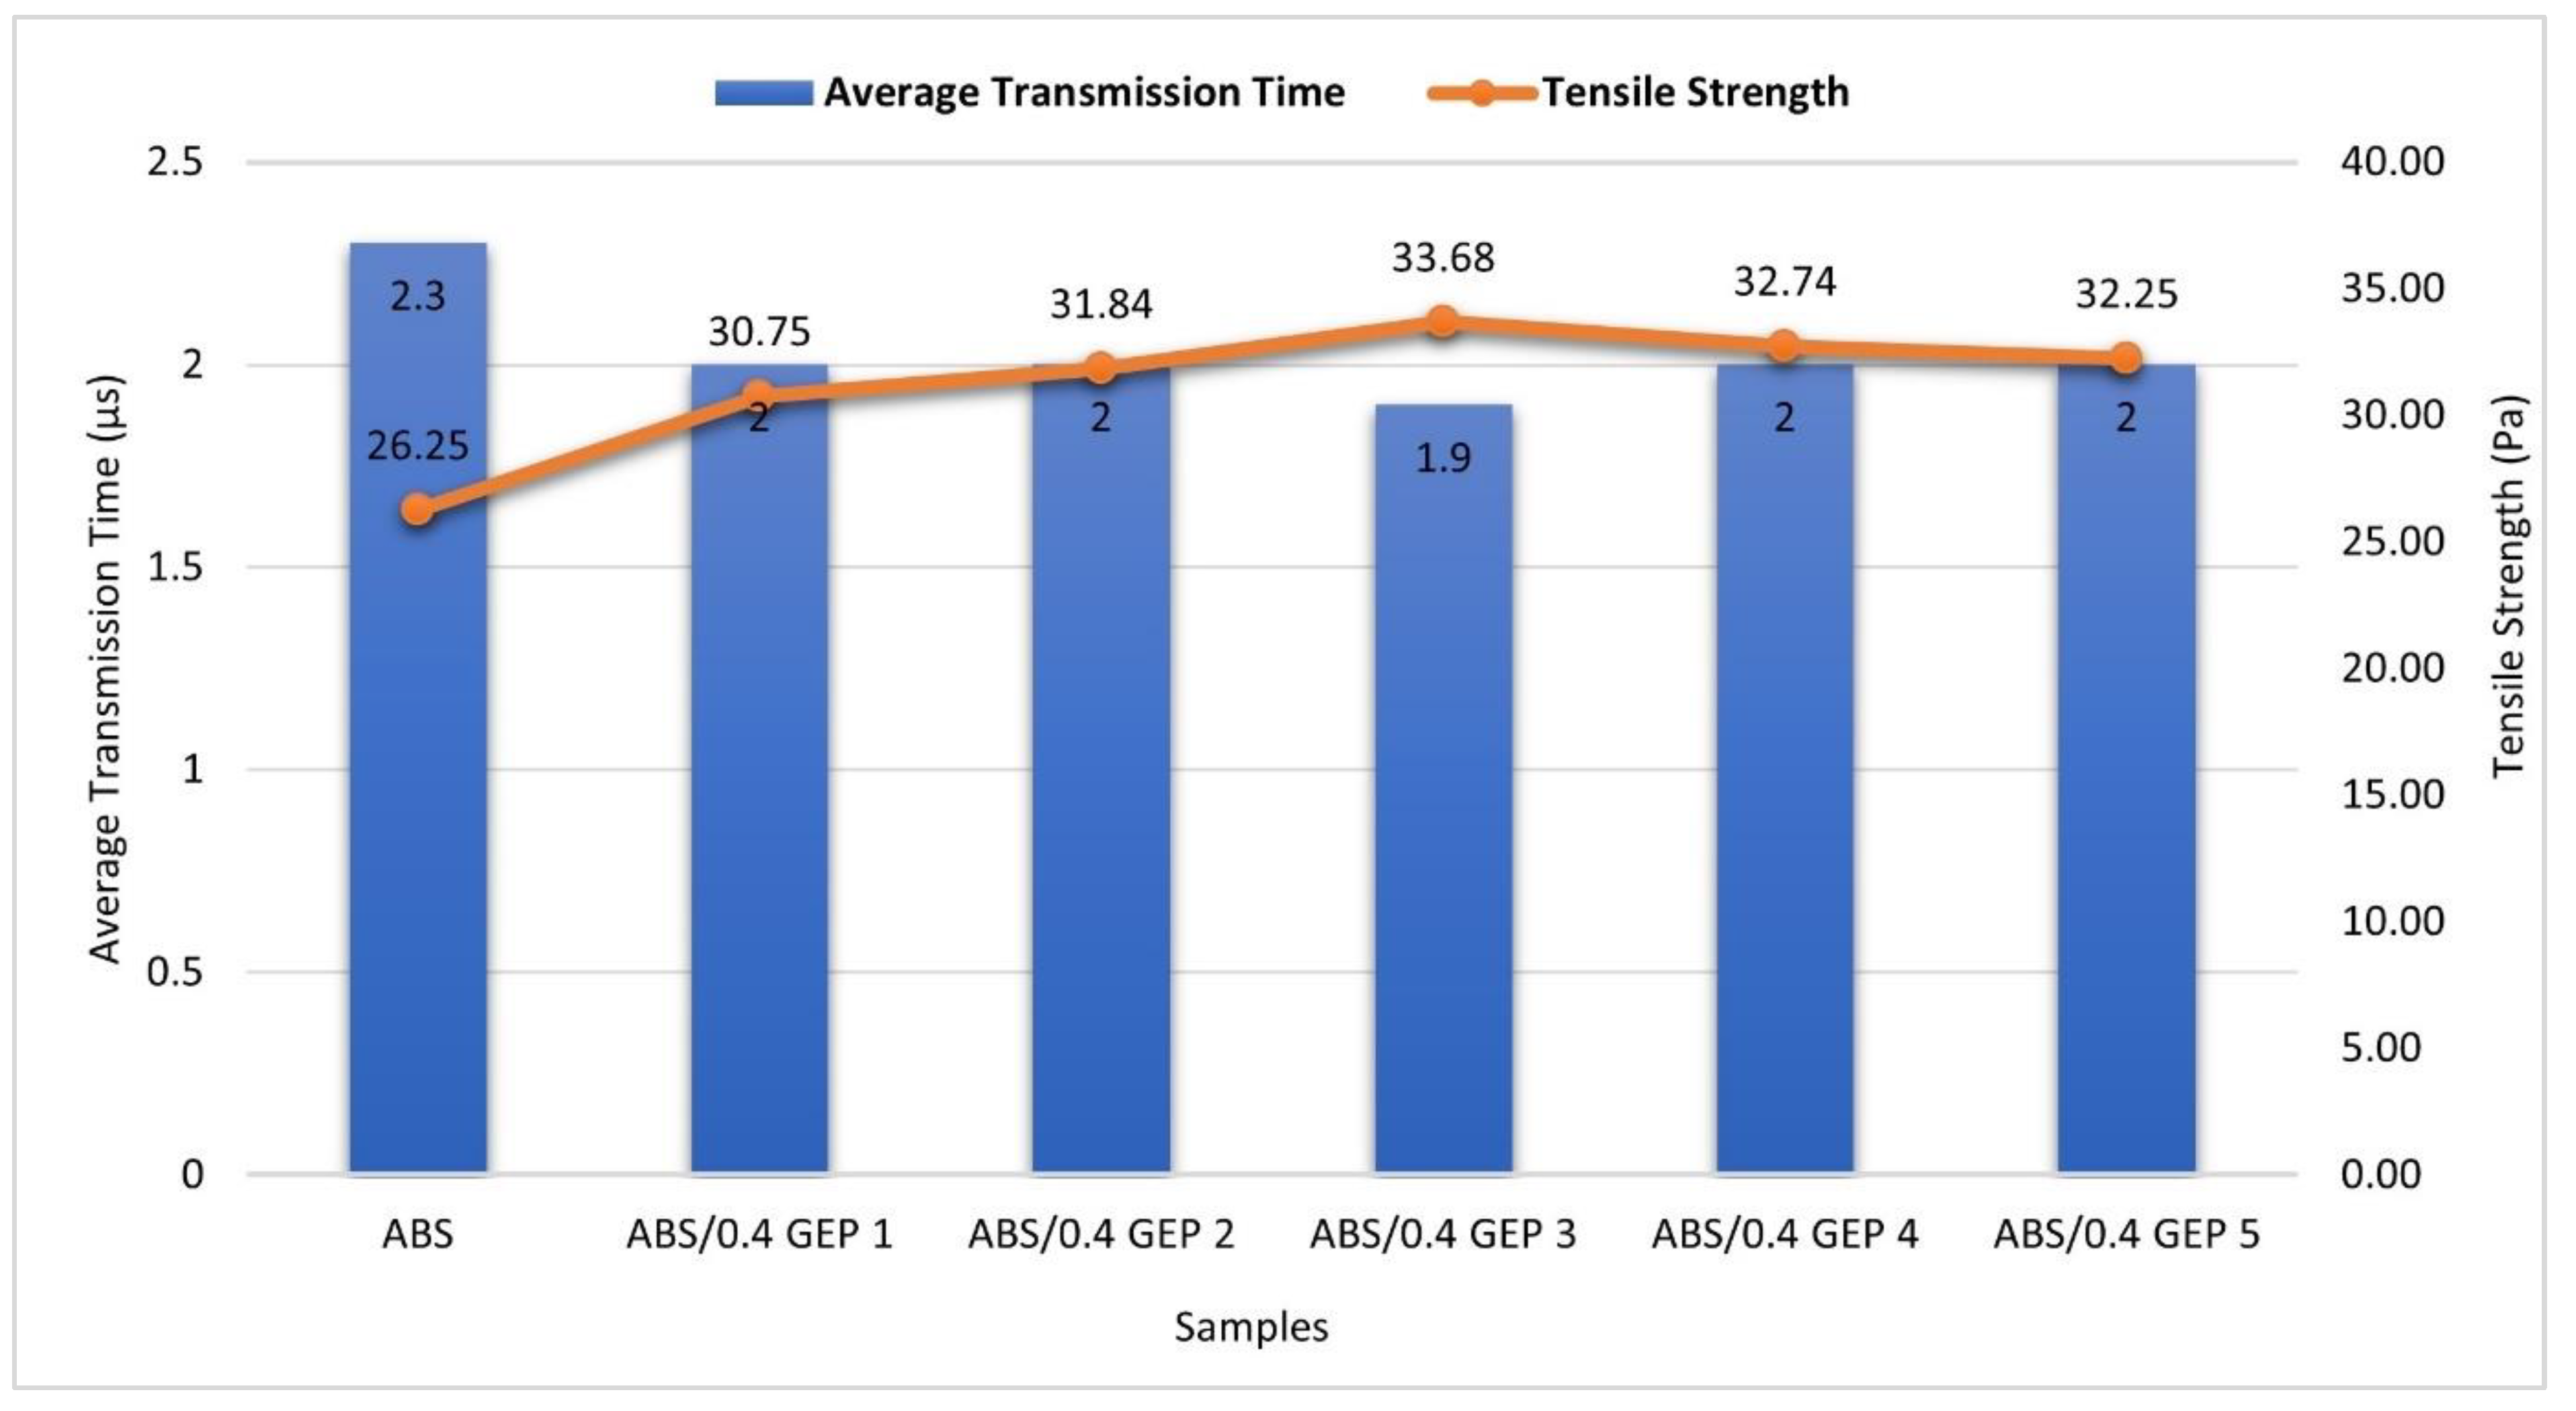
- Ultrasonic testing was conducted to assess whether the addition of TA material to ABS reduced the voids/porosity and air gaps common in FFF-manufactured parts. All the composites showed lower transmission times when compared to commercially available ABS. The presence of voids and air gaps was reduced for 1-, 2-, and 3-layered plastic composites, resulting in lower transmission times and strong layer bonding. The transmission times slightly increased for 4- and 5-layered composites, but they were lower than those of commercially available ABS. The results show that the addition of multiple layers of TA material to ABS did not adversely affect the deposited layers. Furthermore, the composites showed consistent transmission times for all the different TA materials. It was also evident that the voids, internal stresses, and air gaps were reduced due to the nature of CPM process, as parts were built under constant temperature for curing TA materials. This helped in minimizing these defects and achieved an upward trend of tensile strength as well.
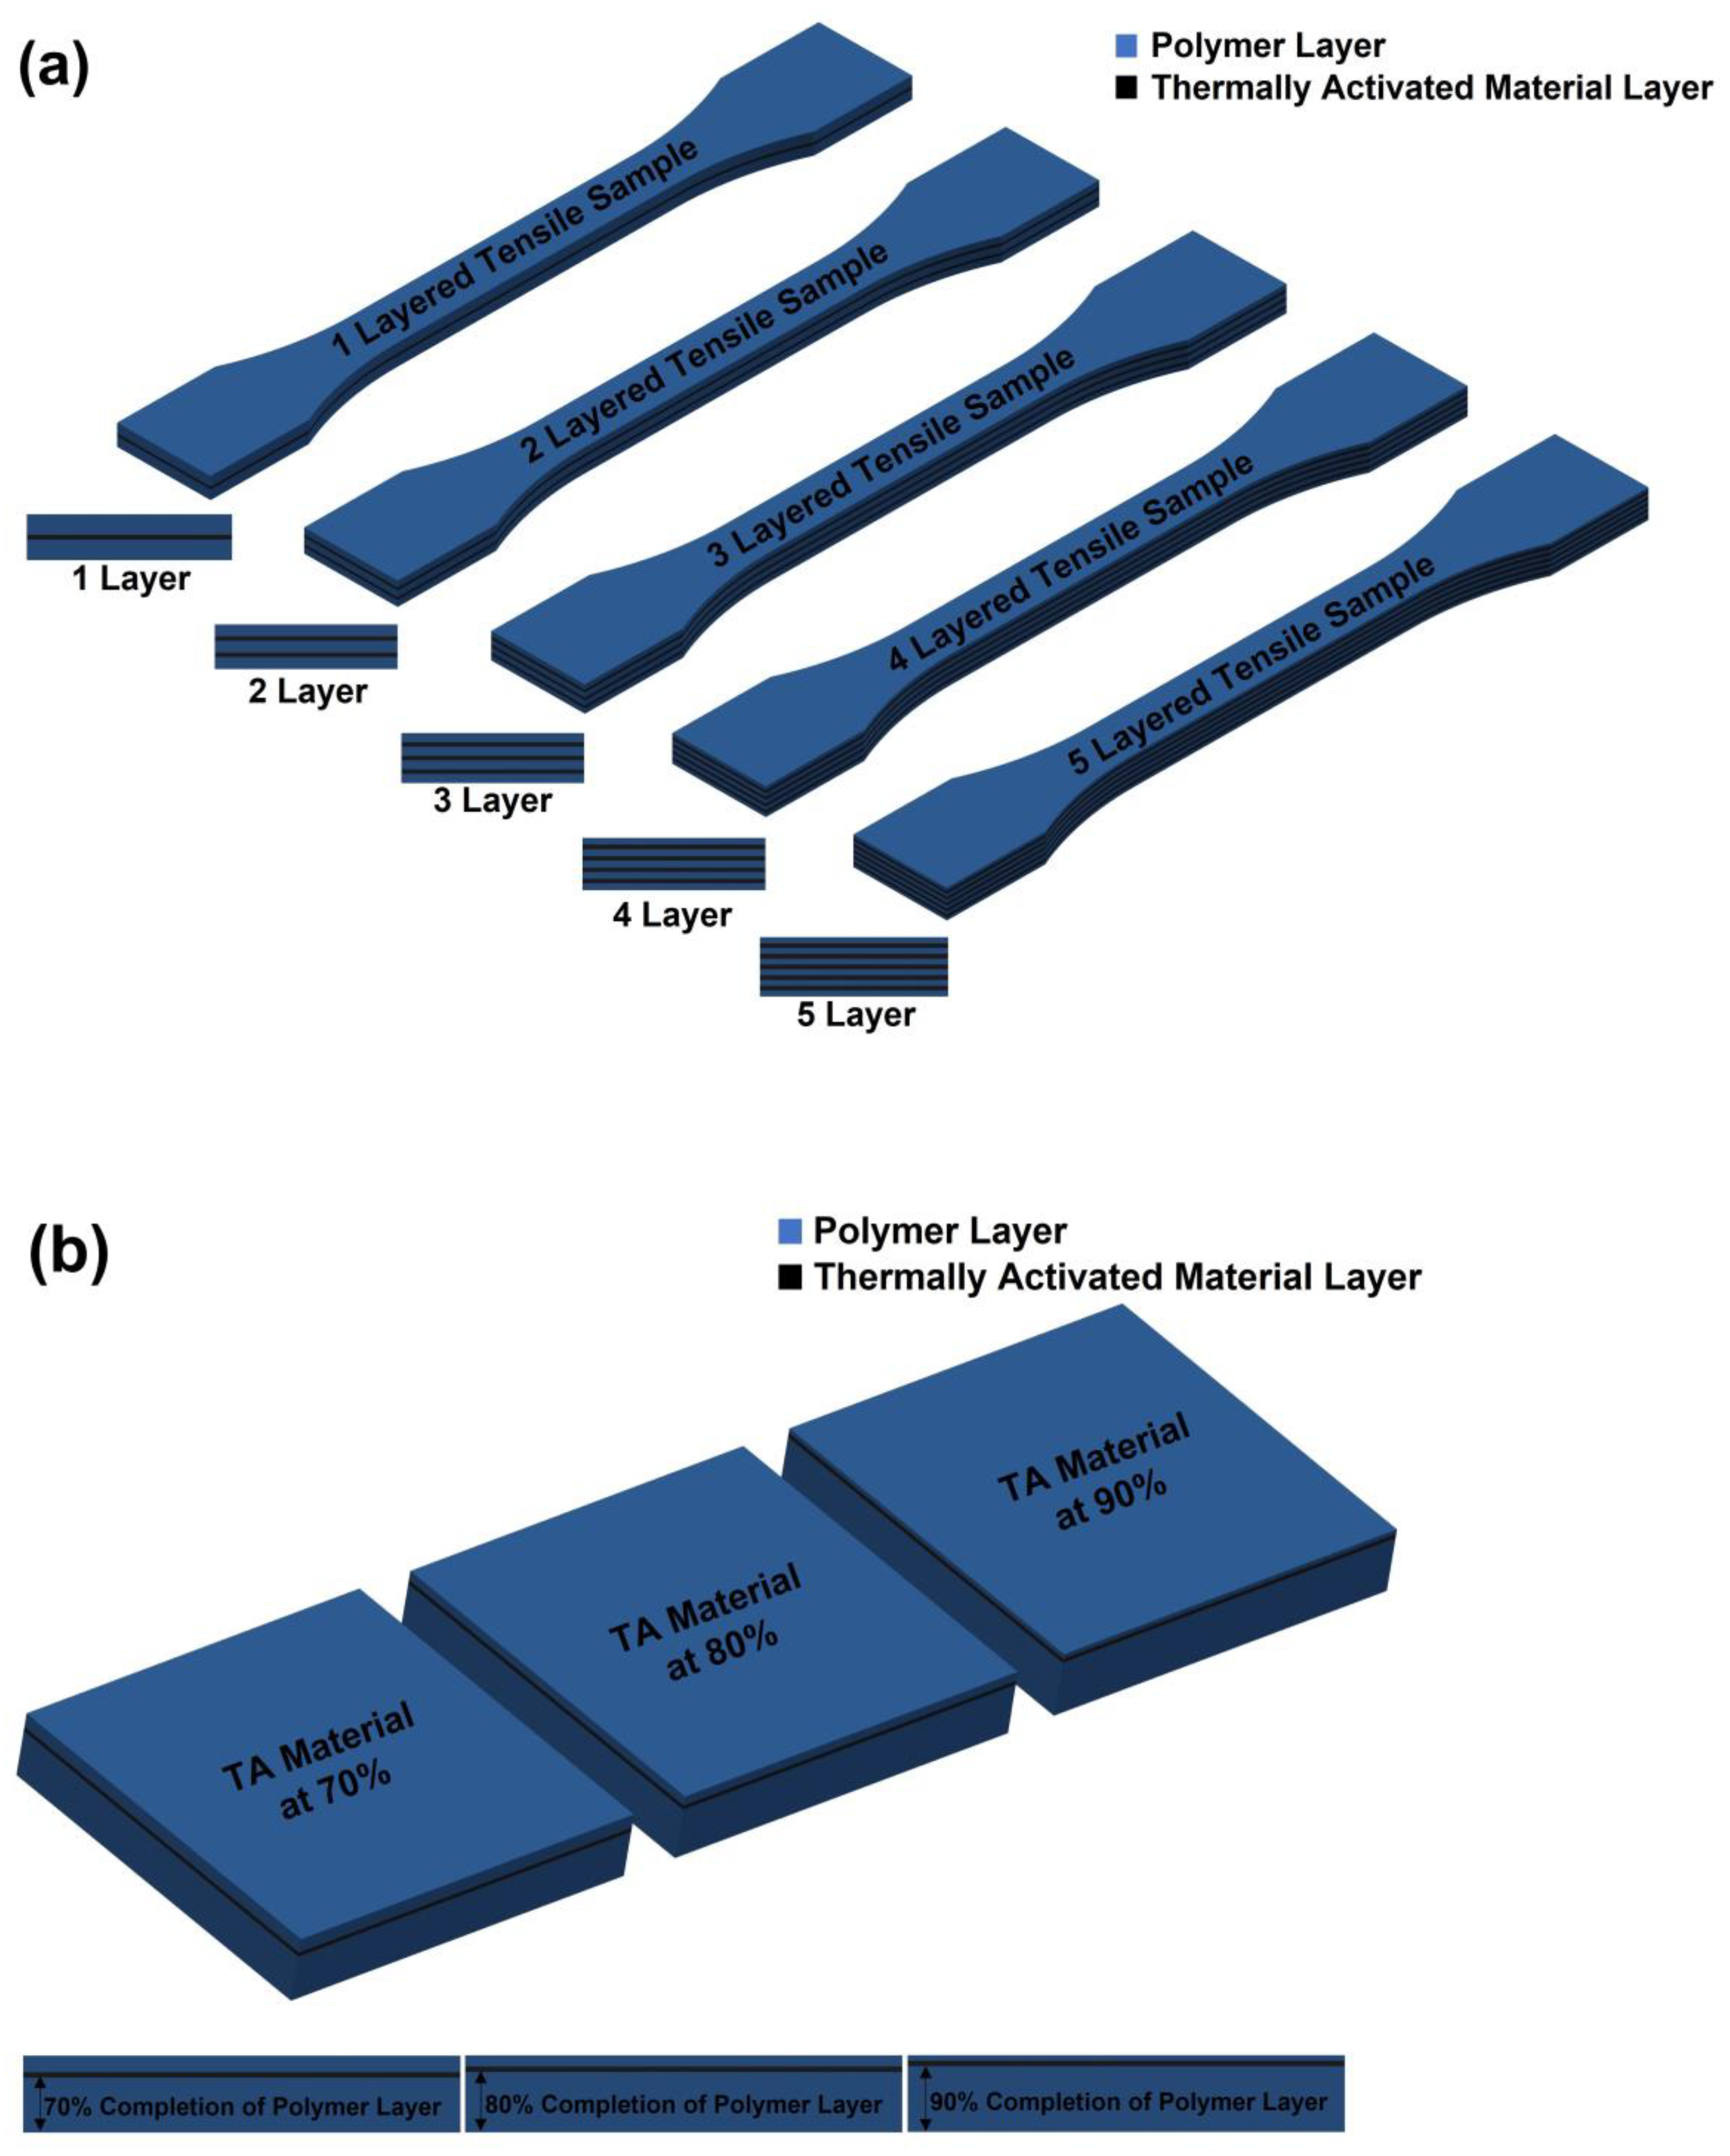
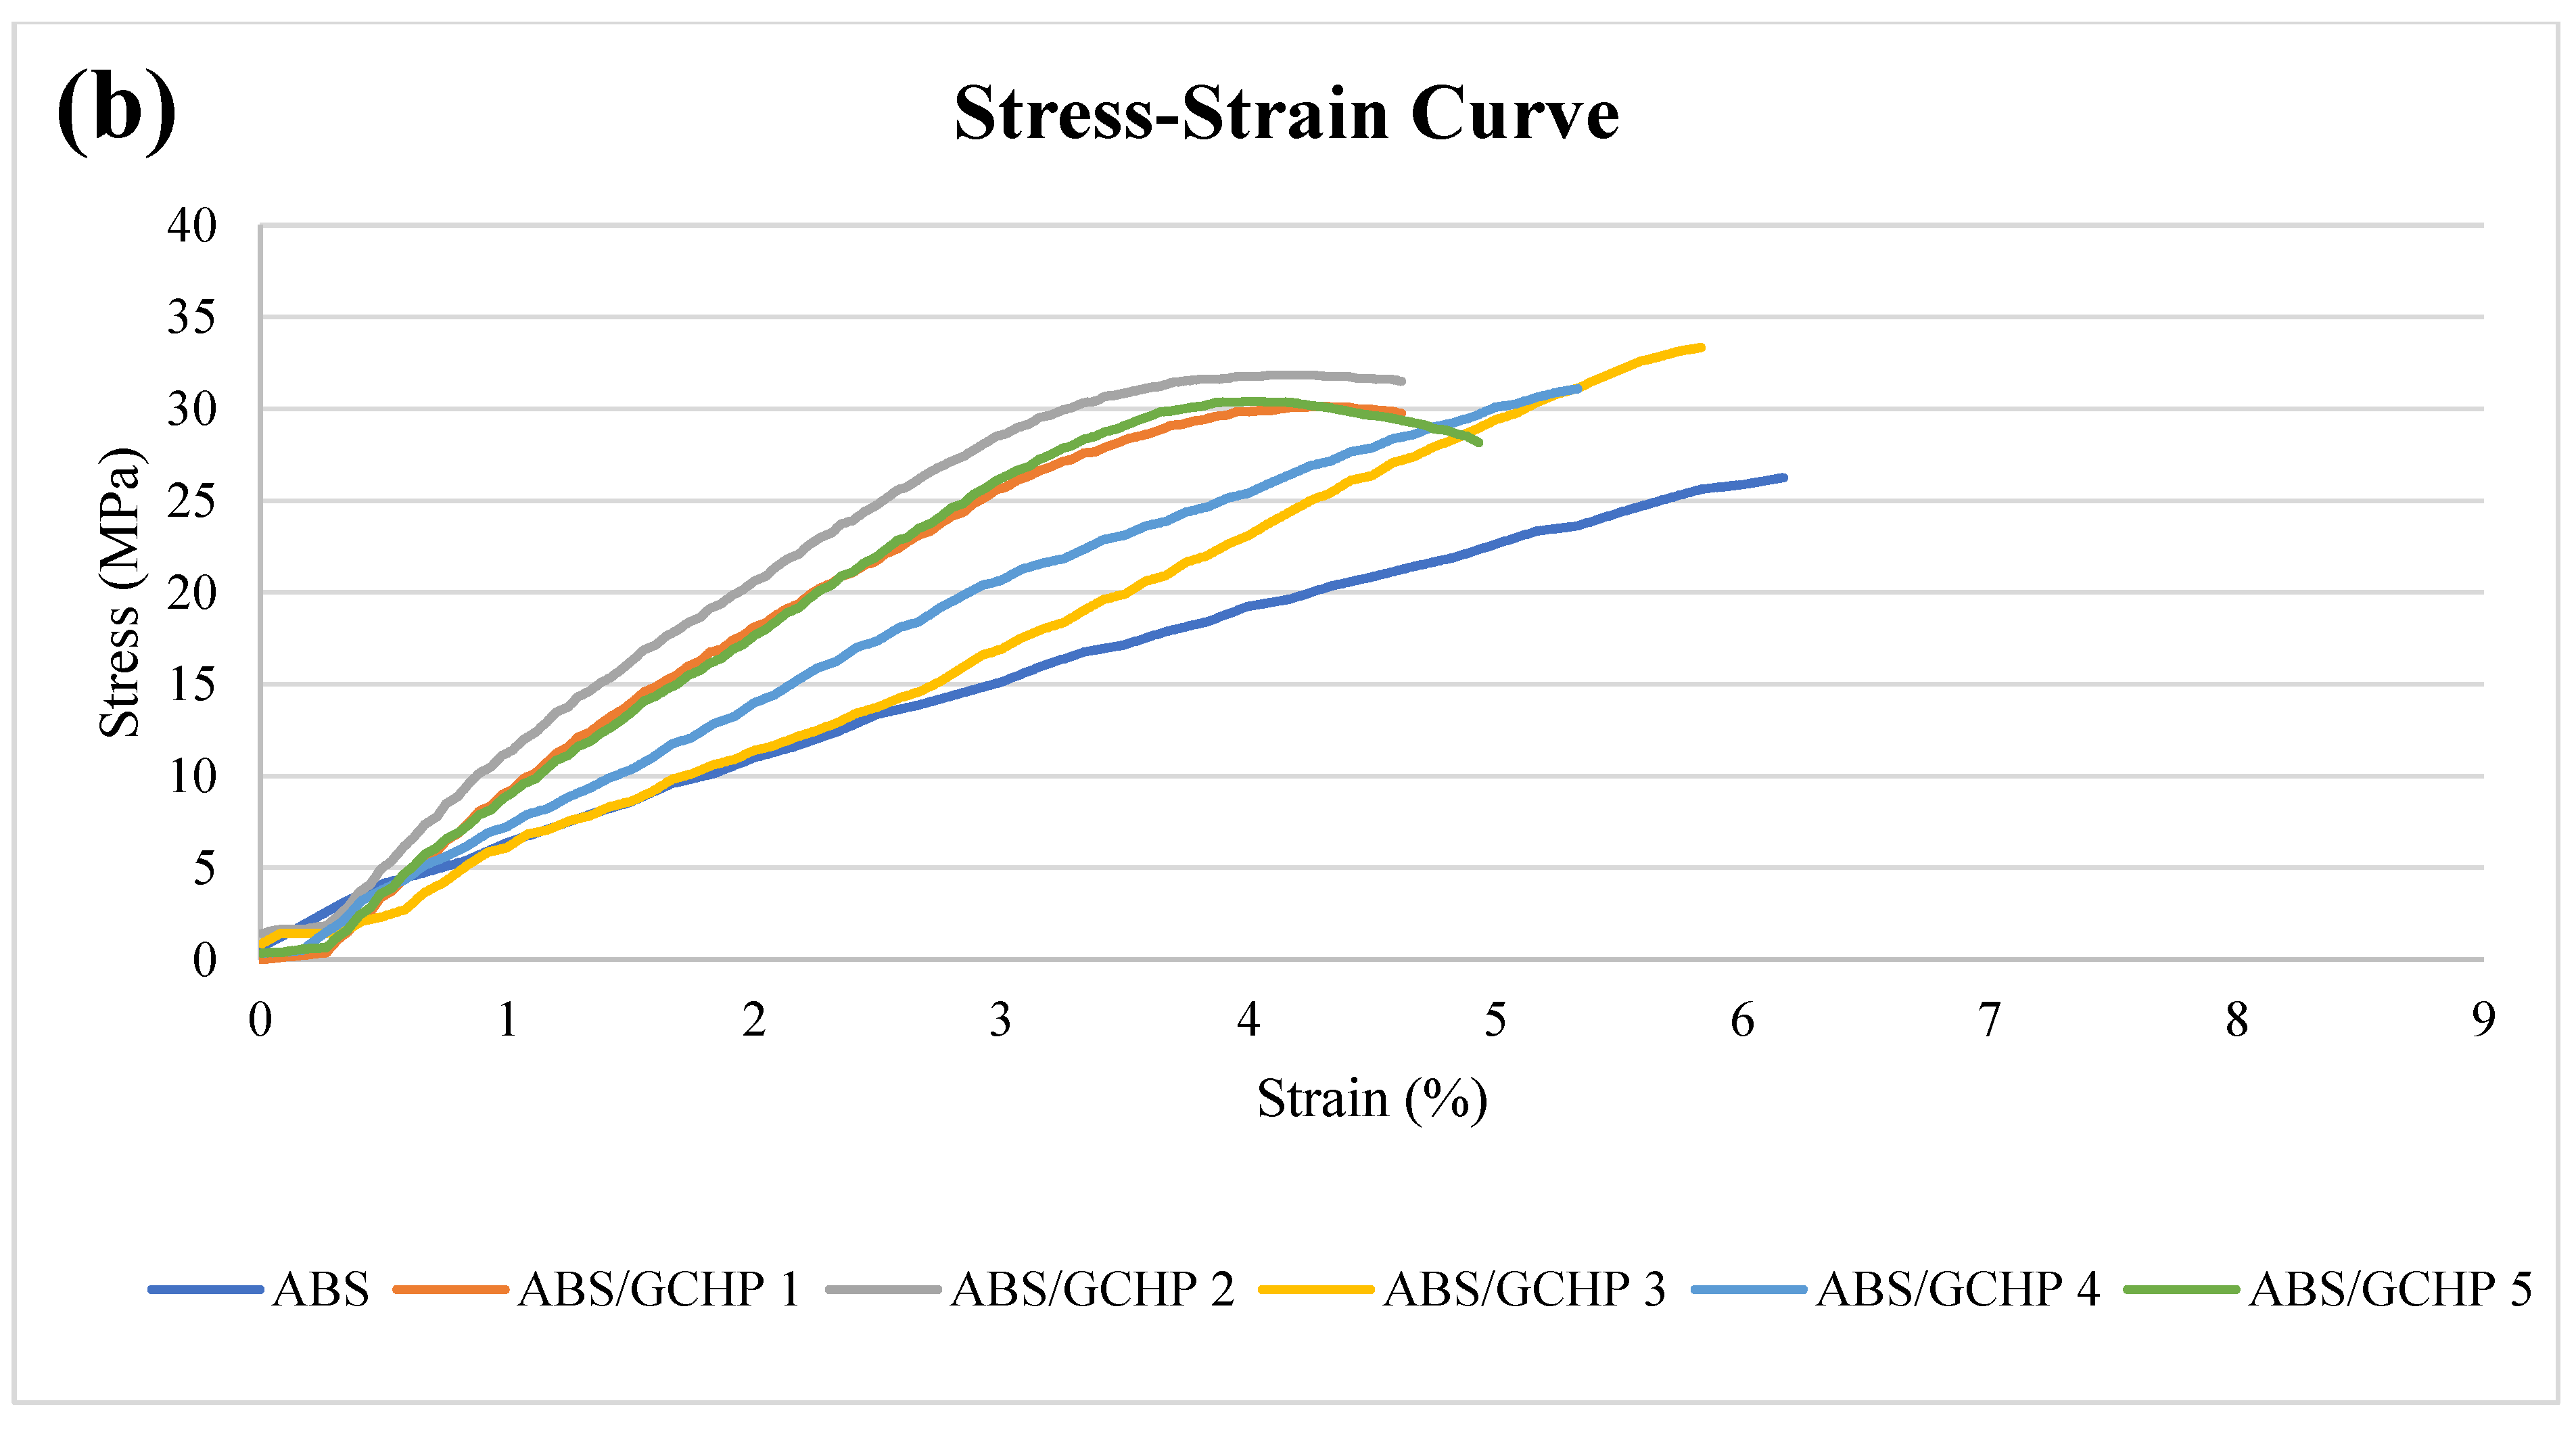
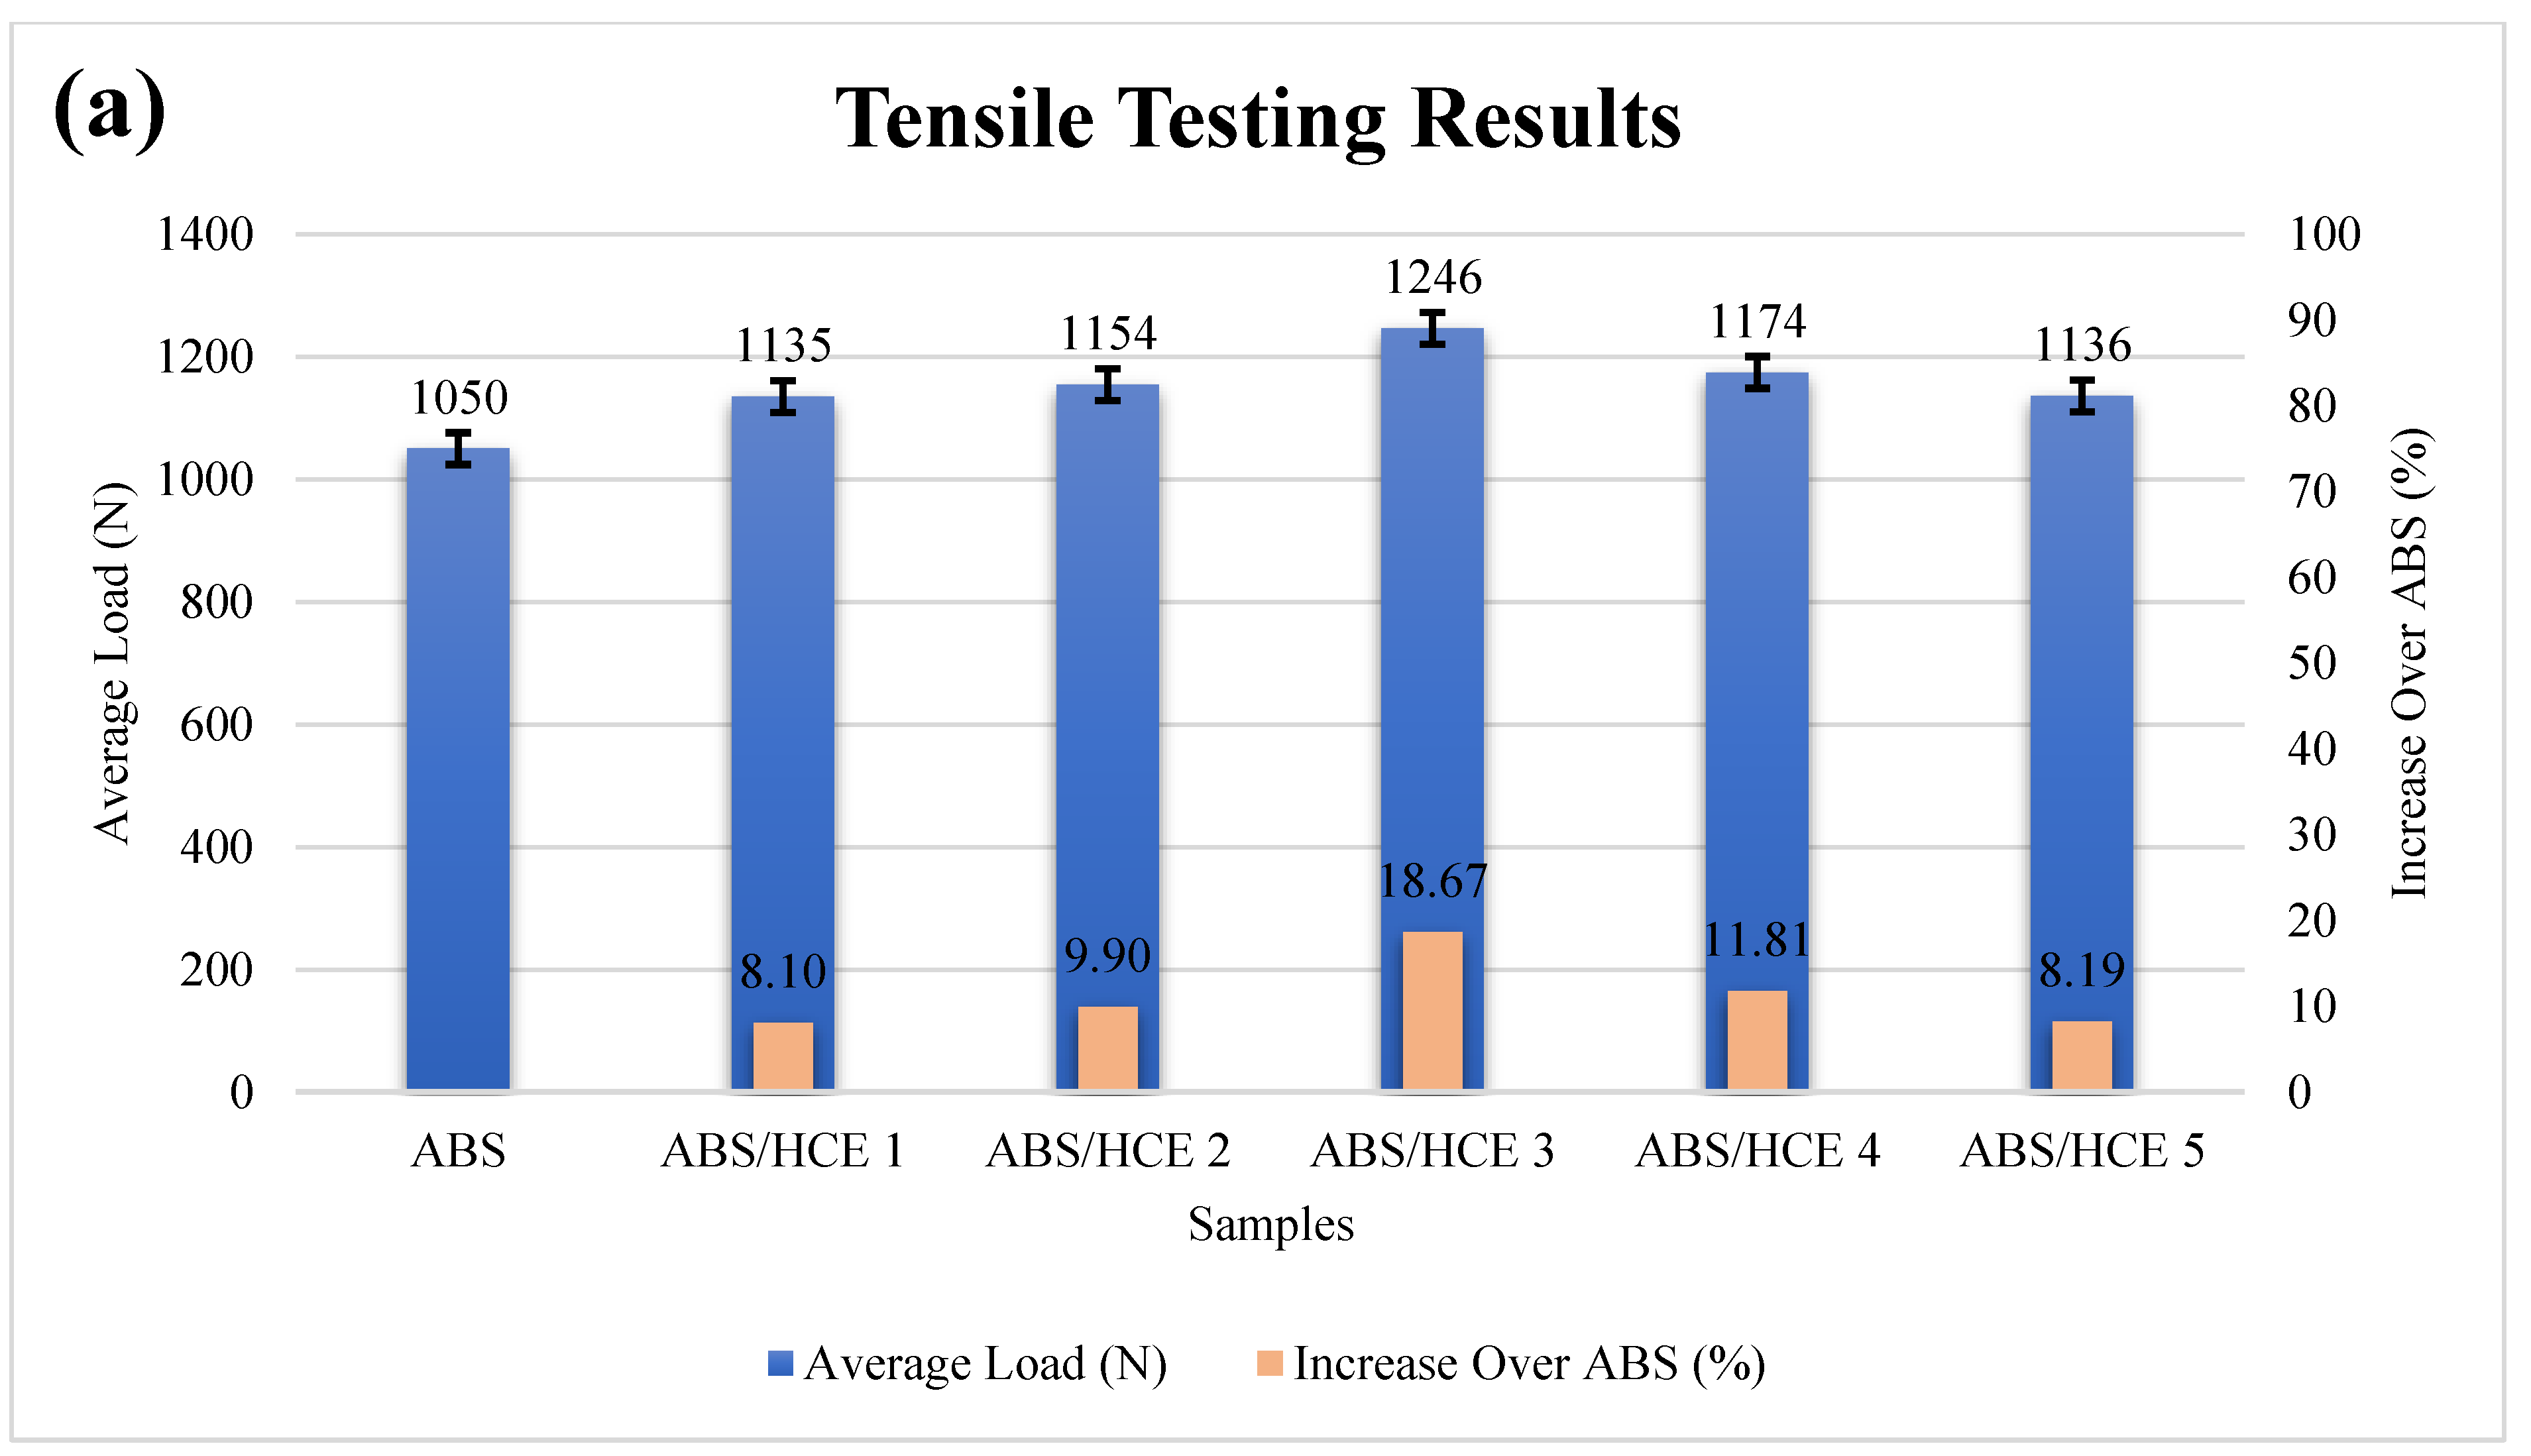
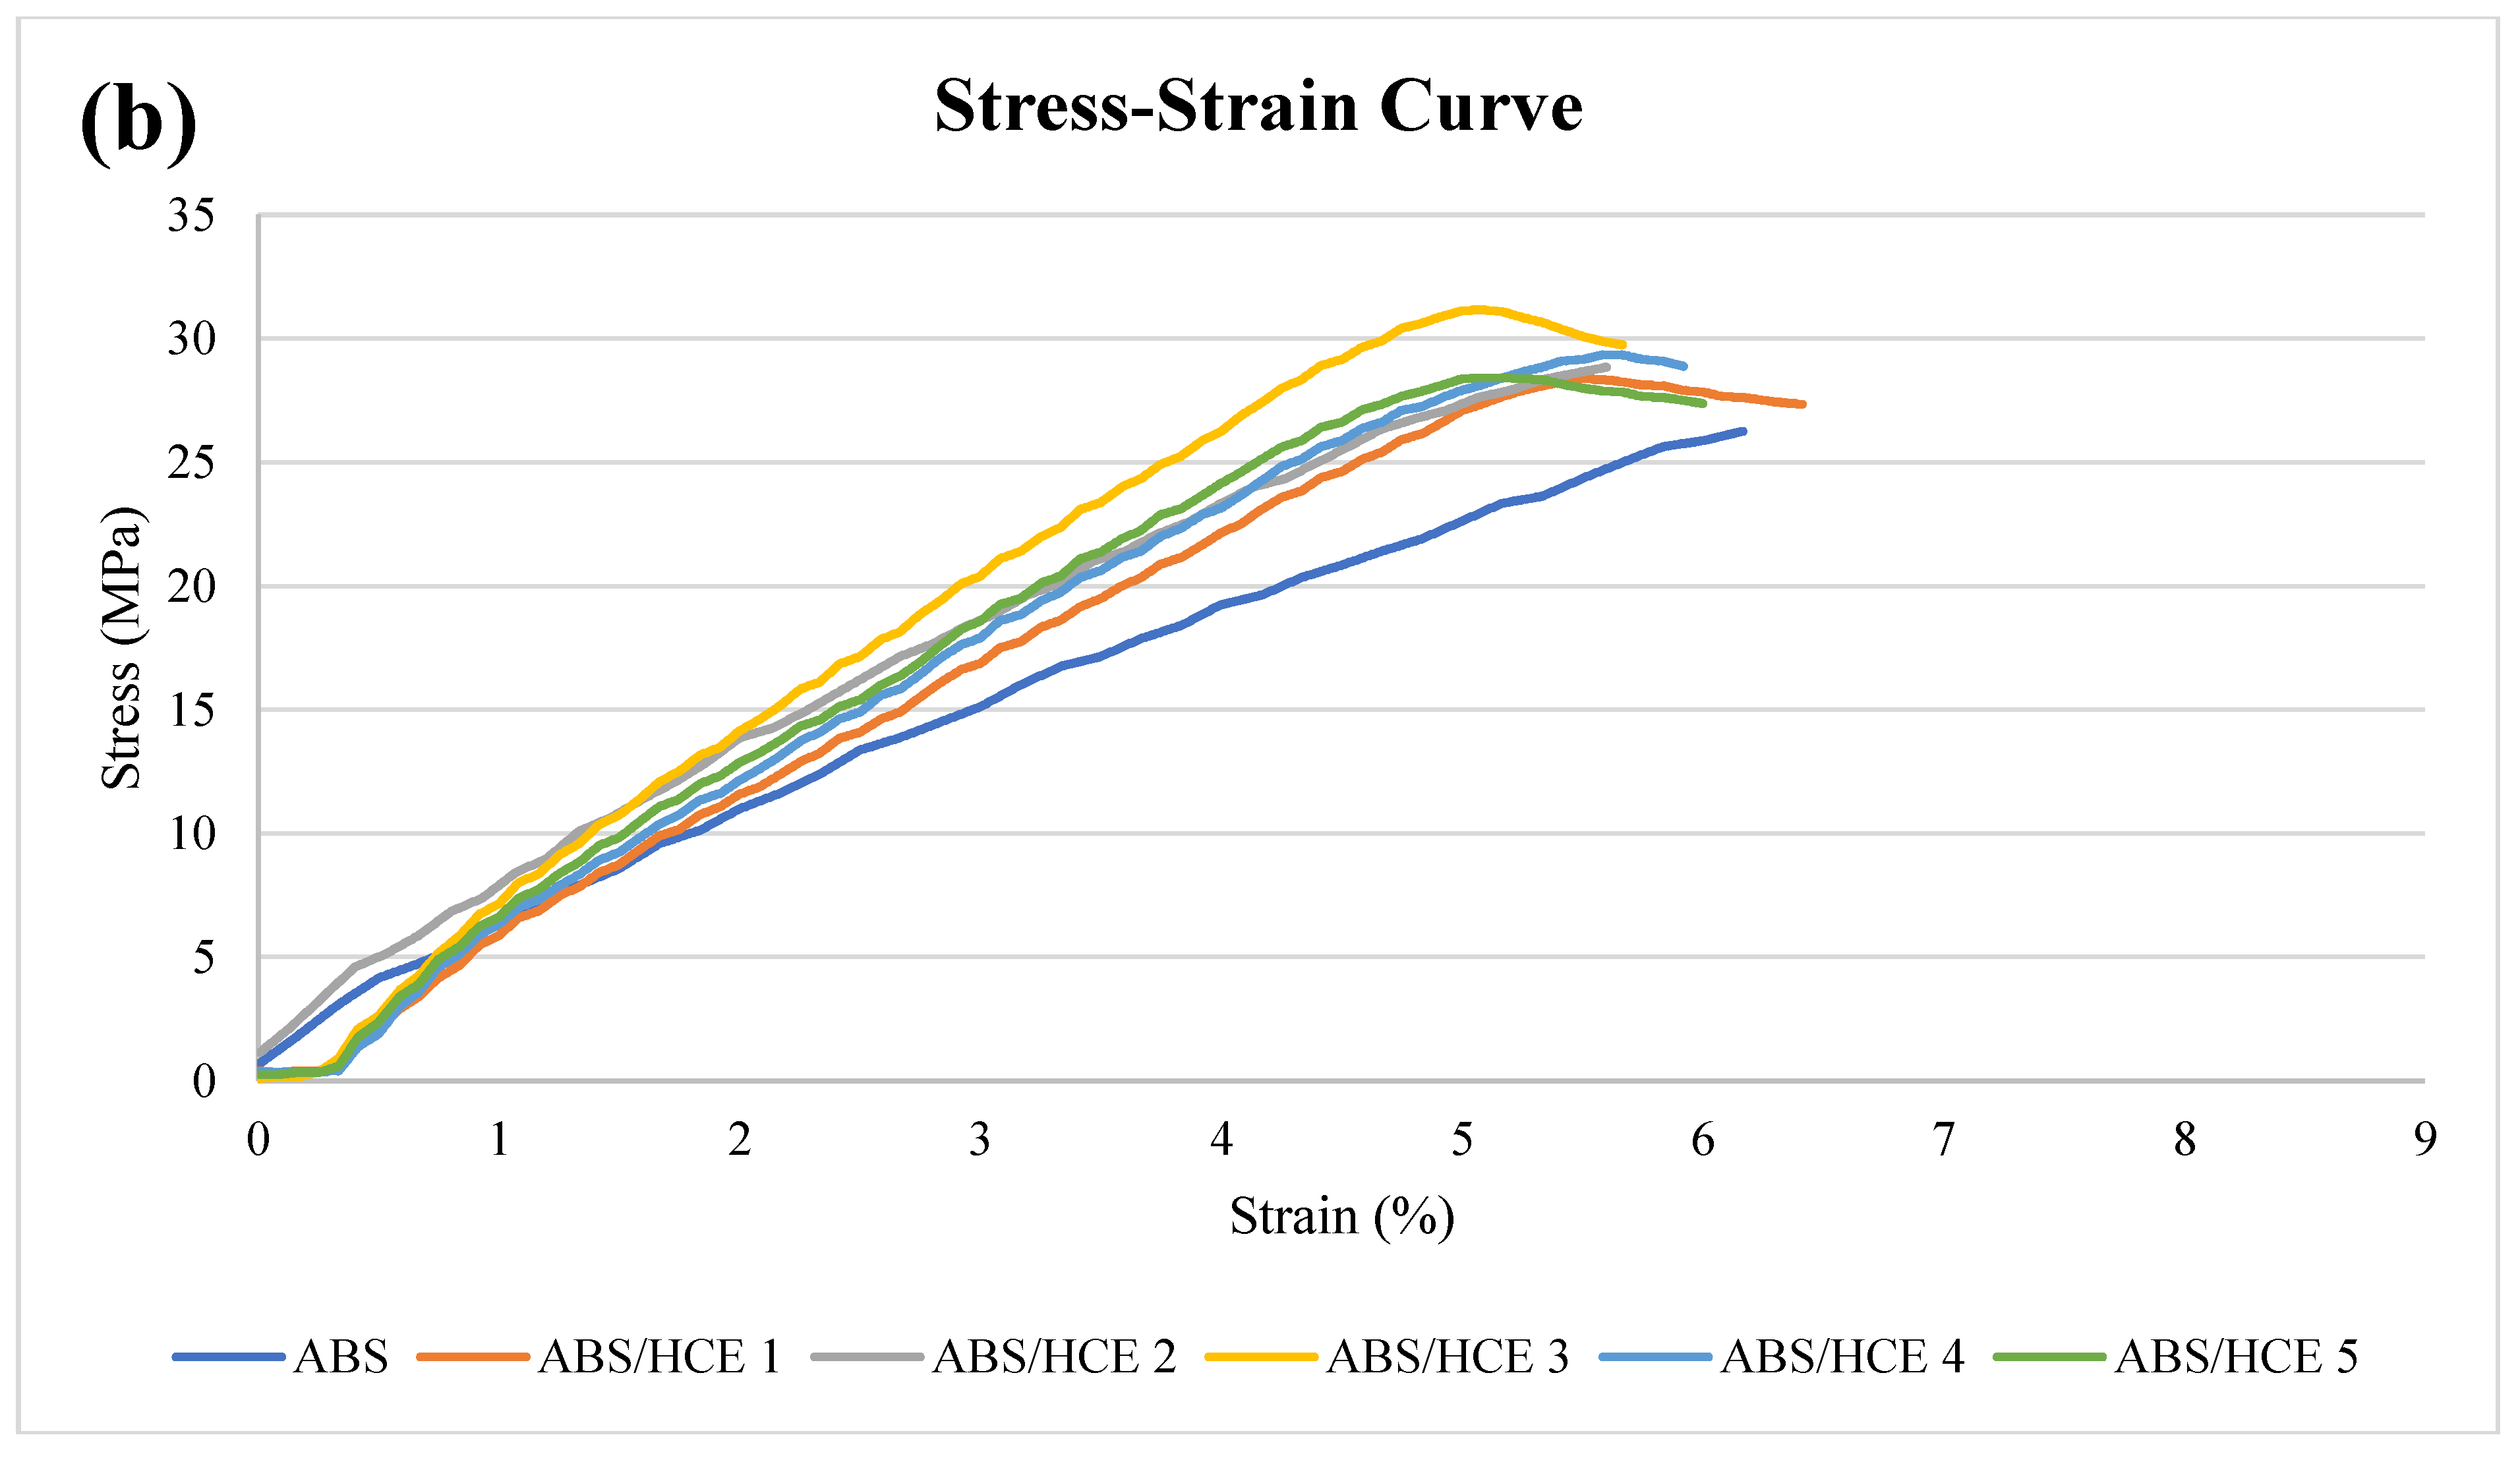
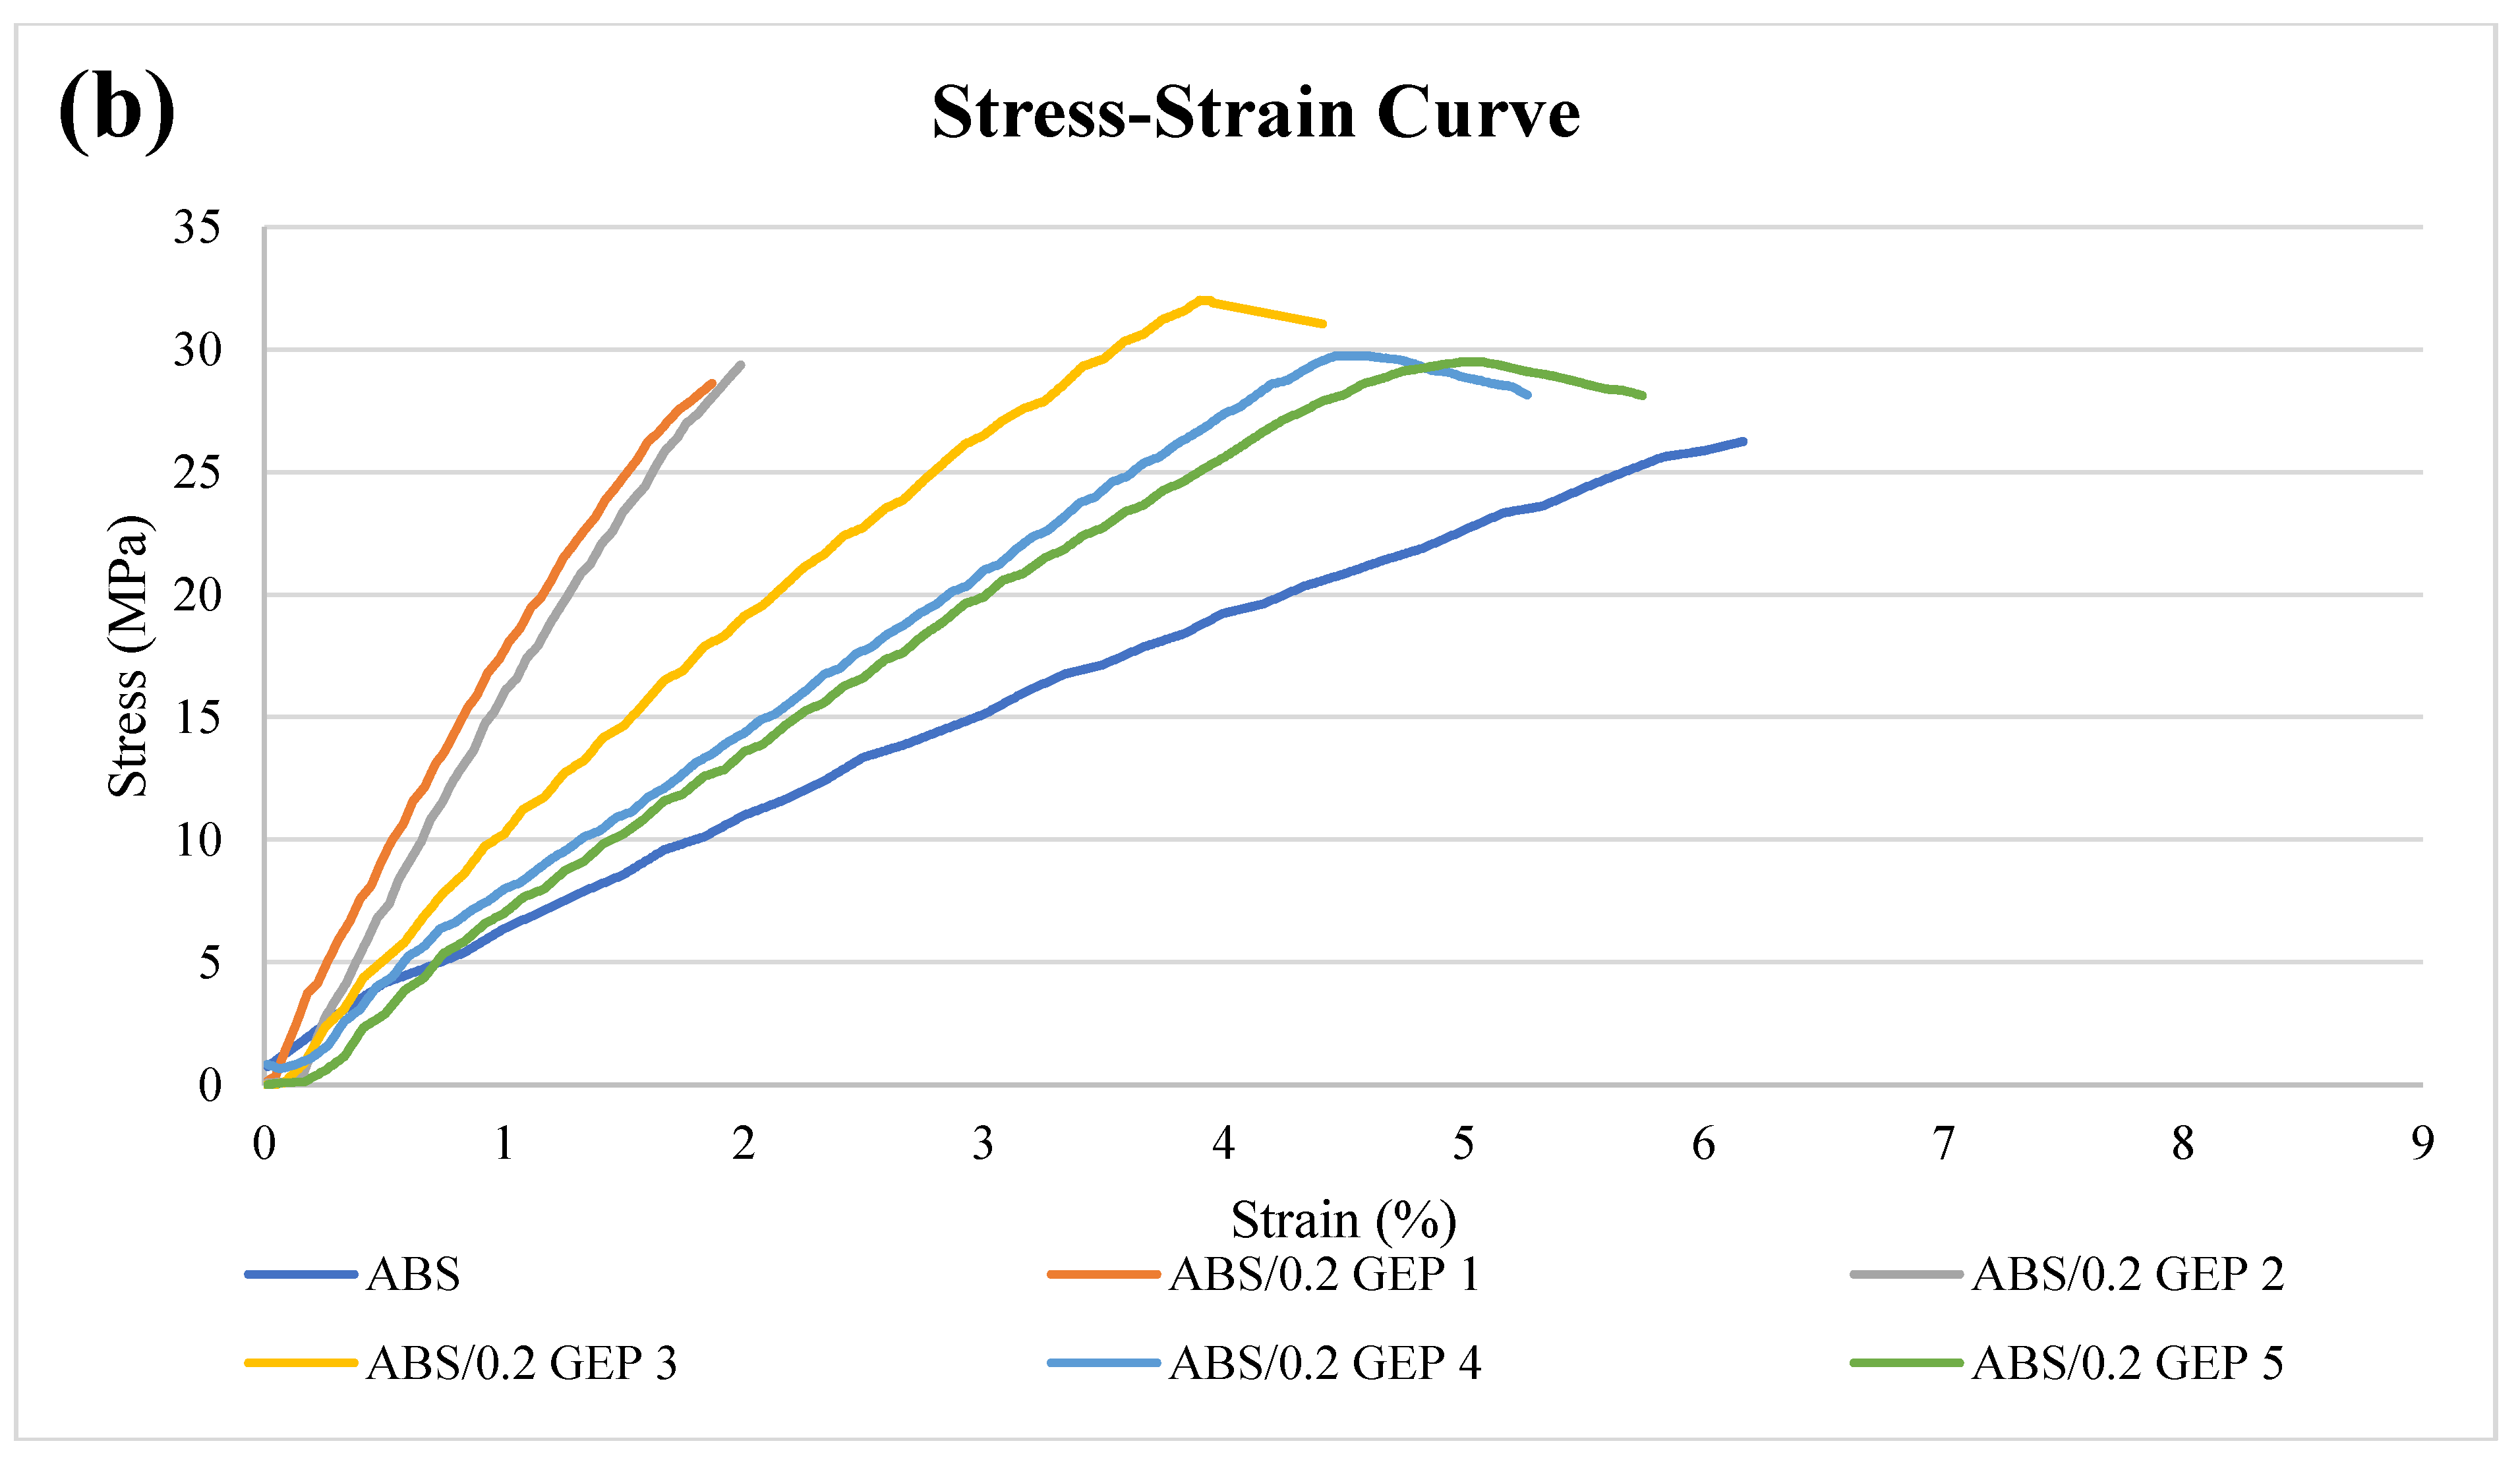
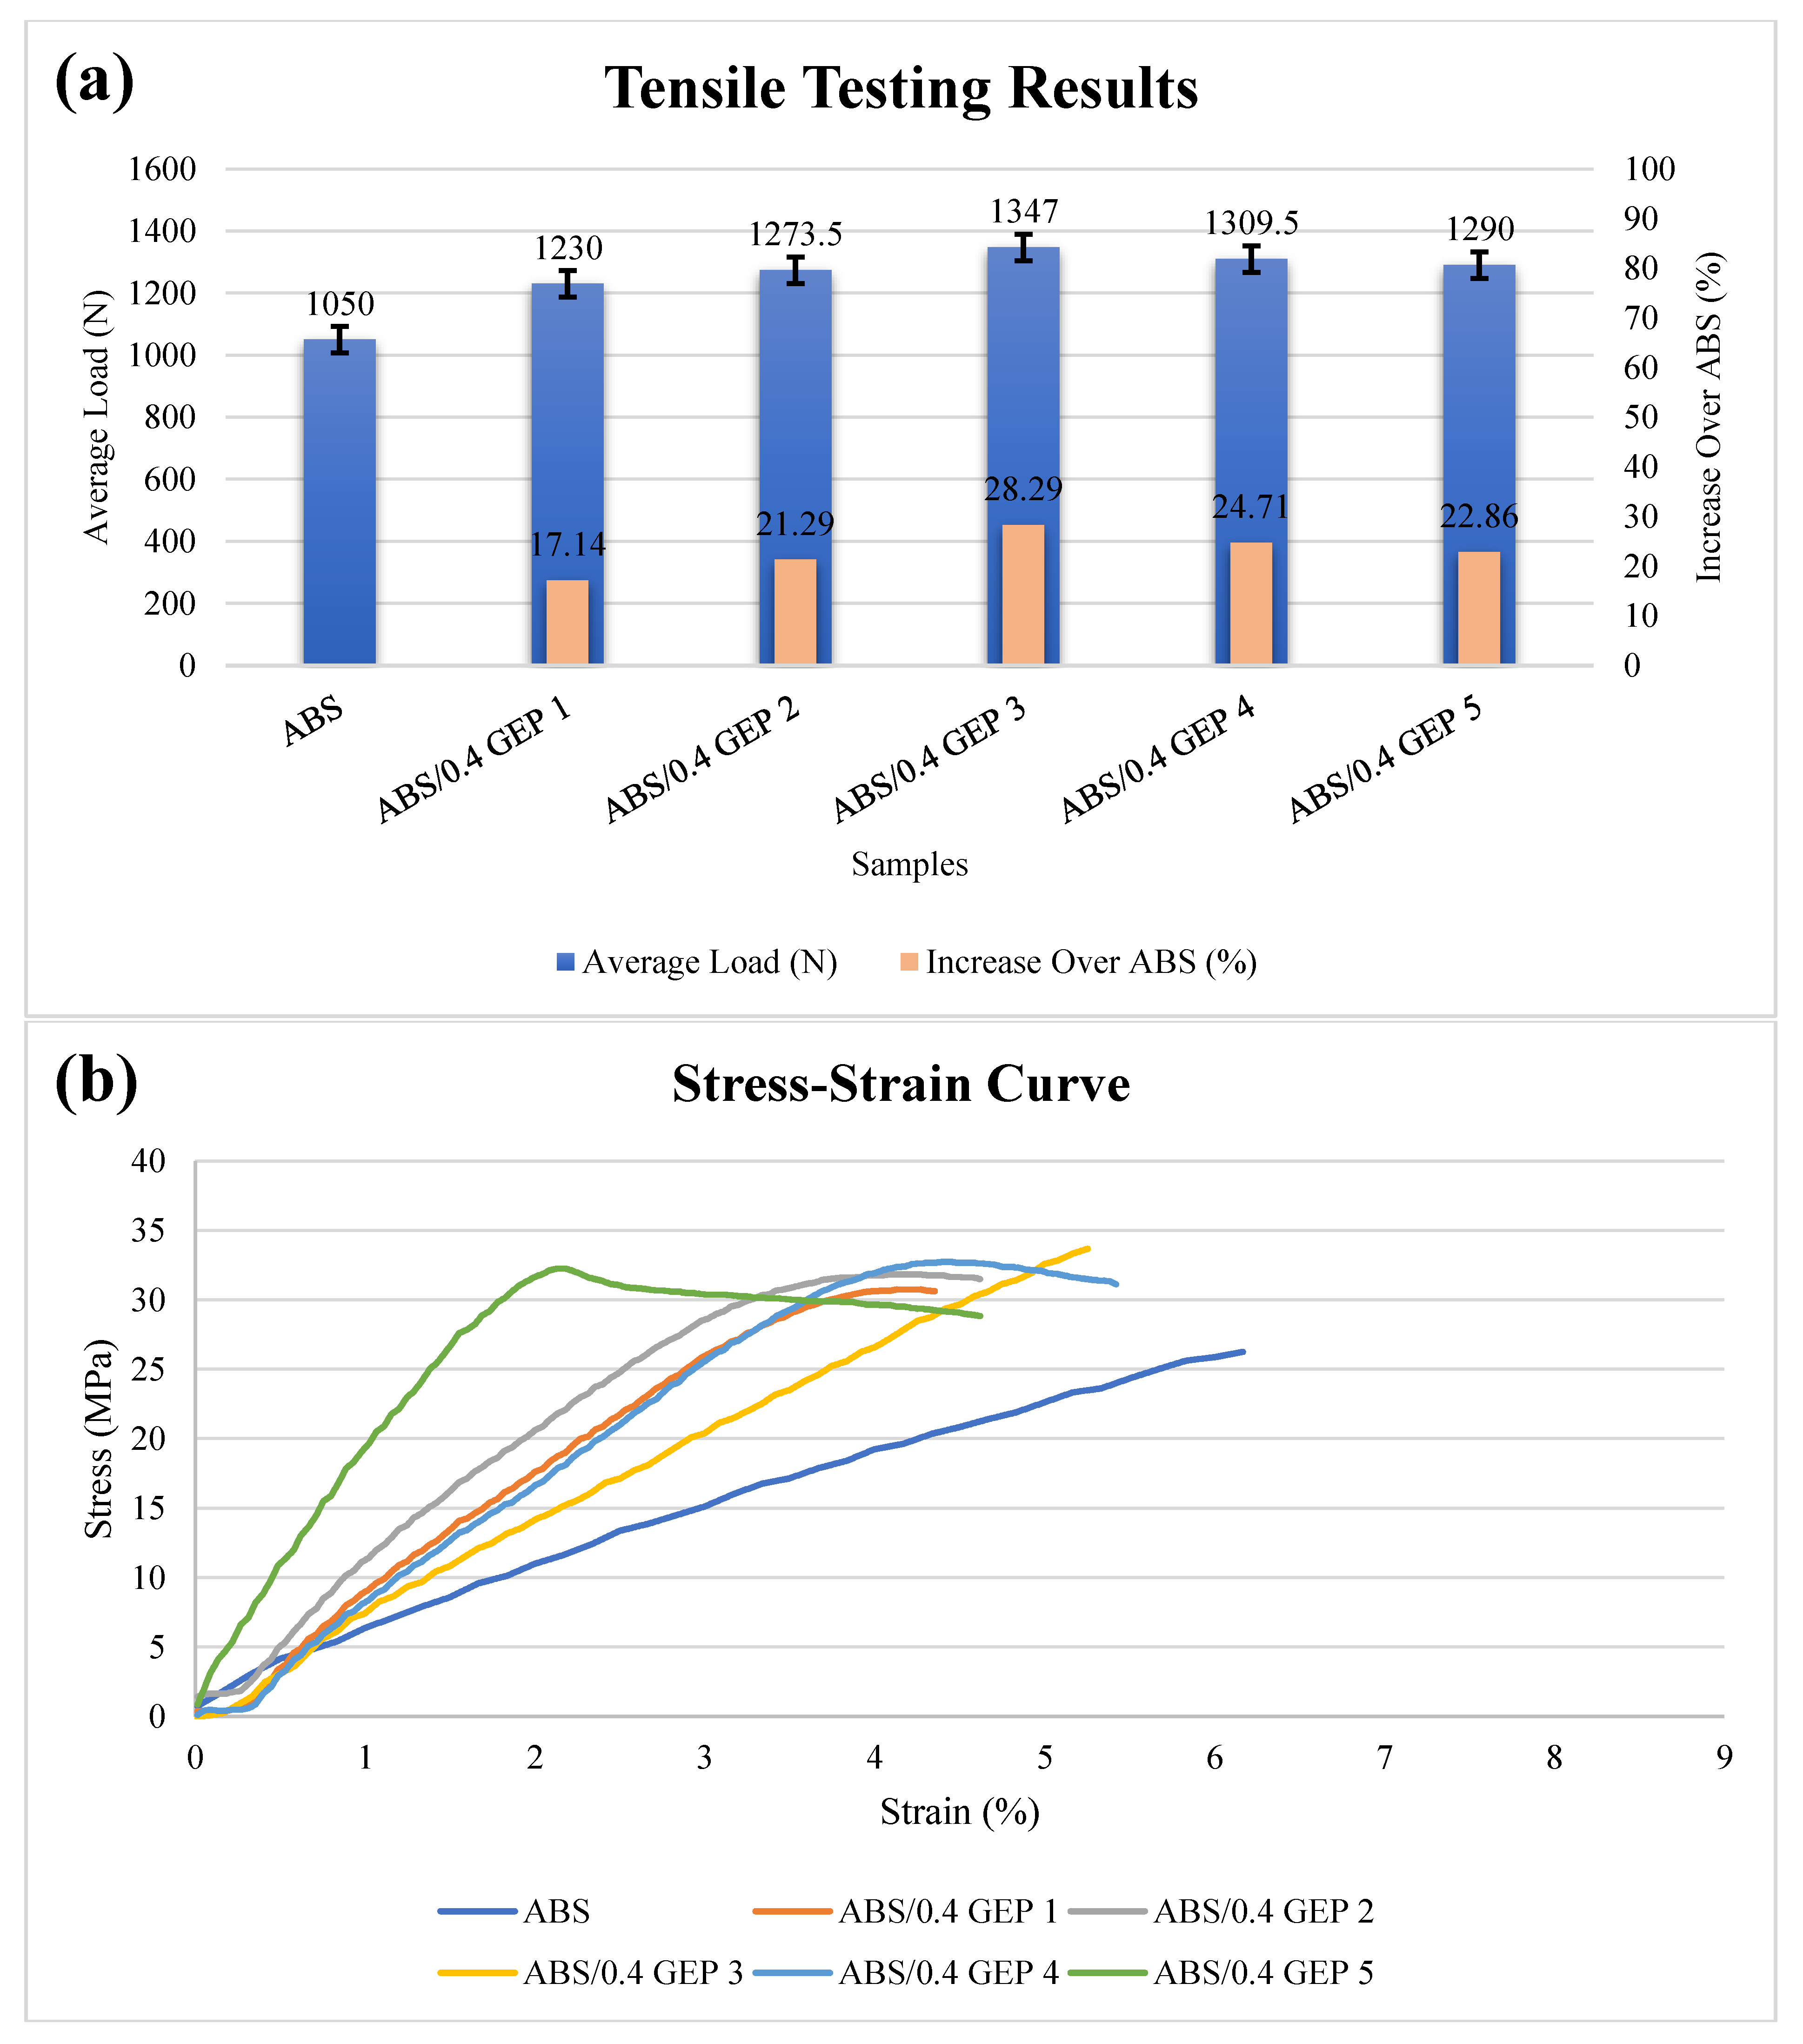
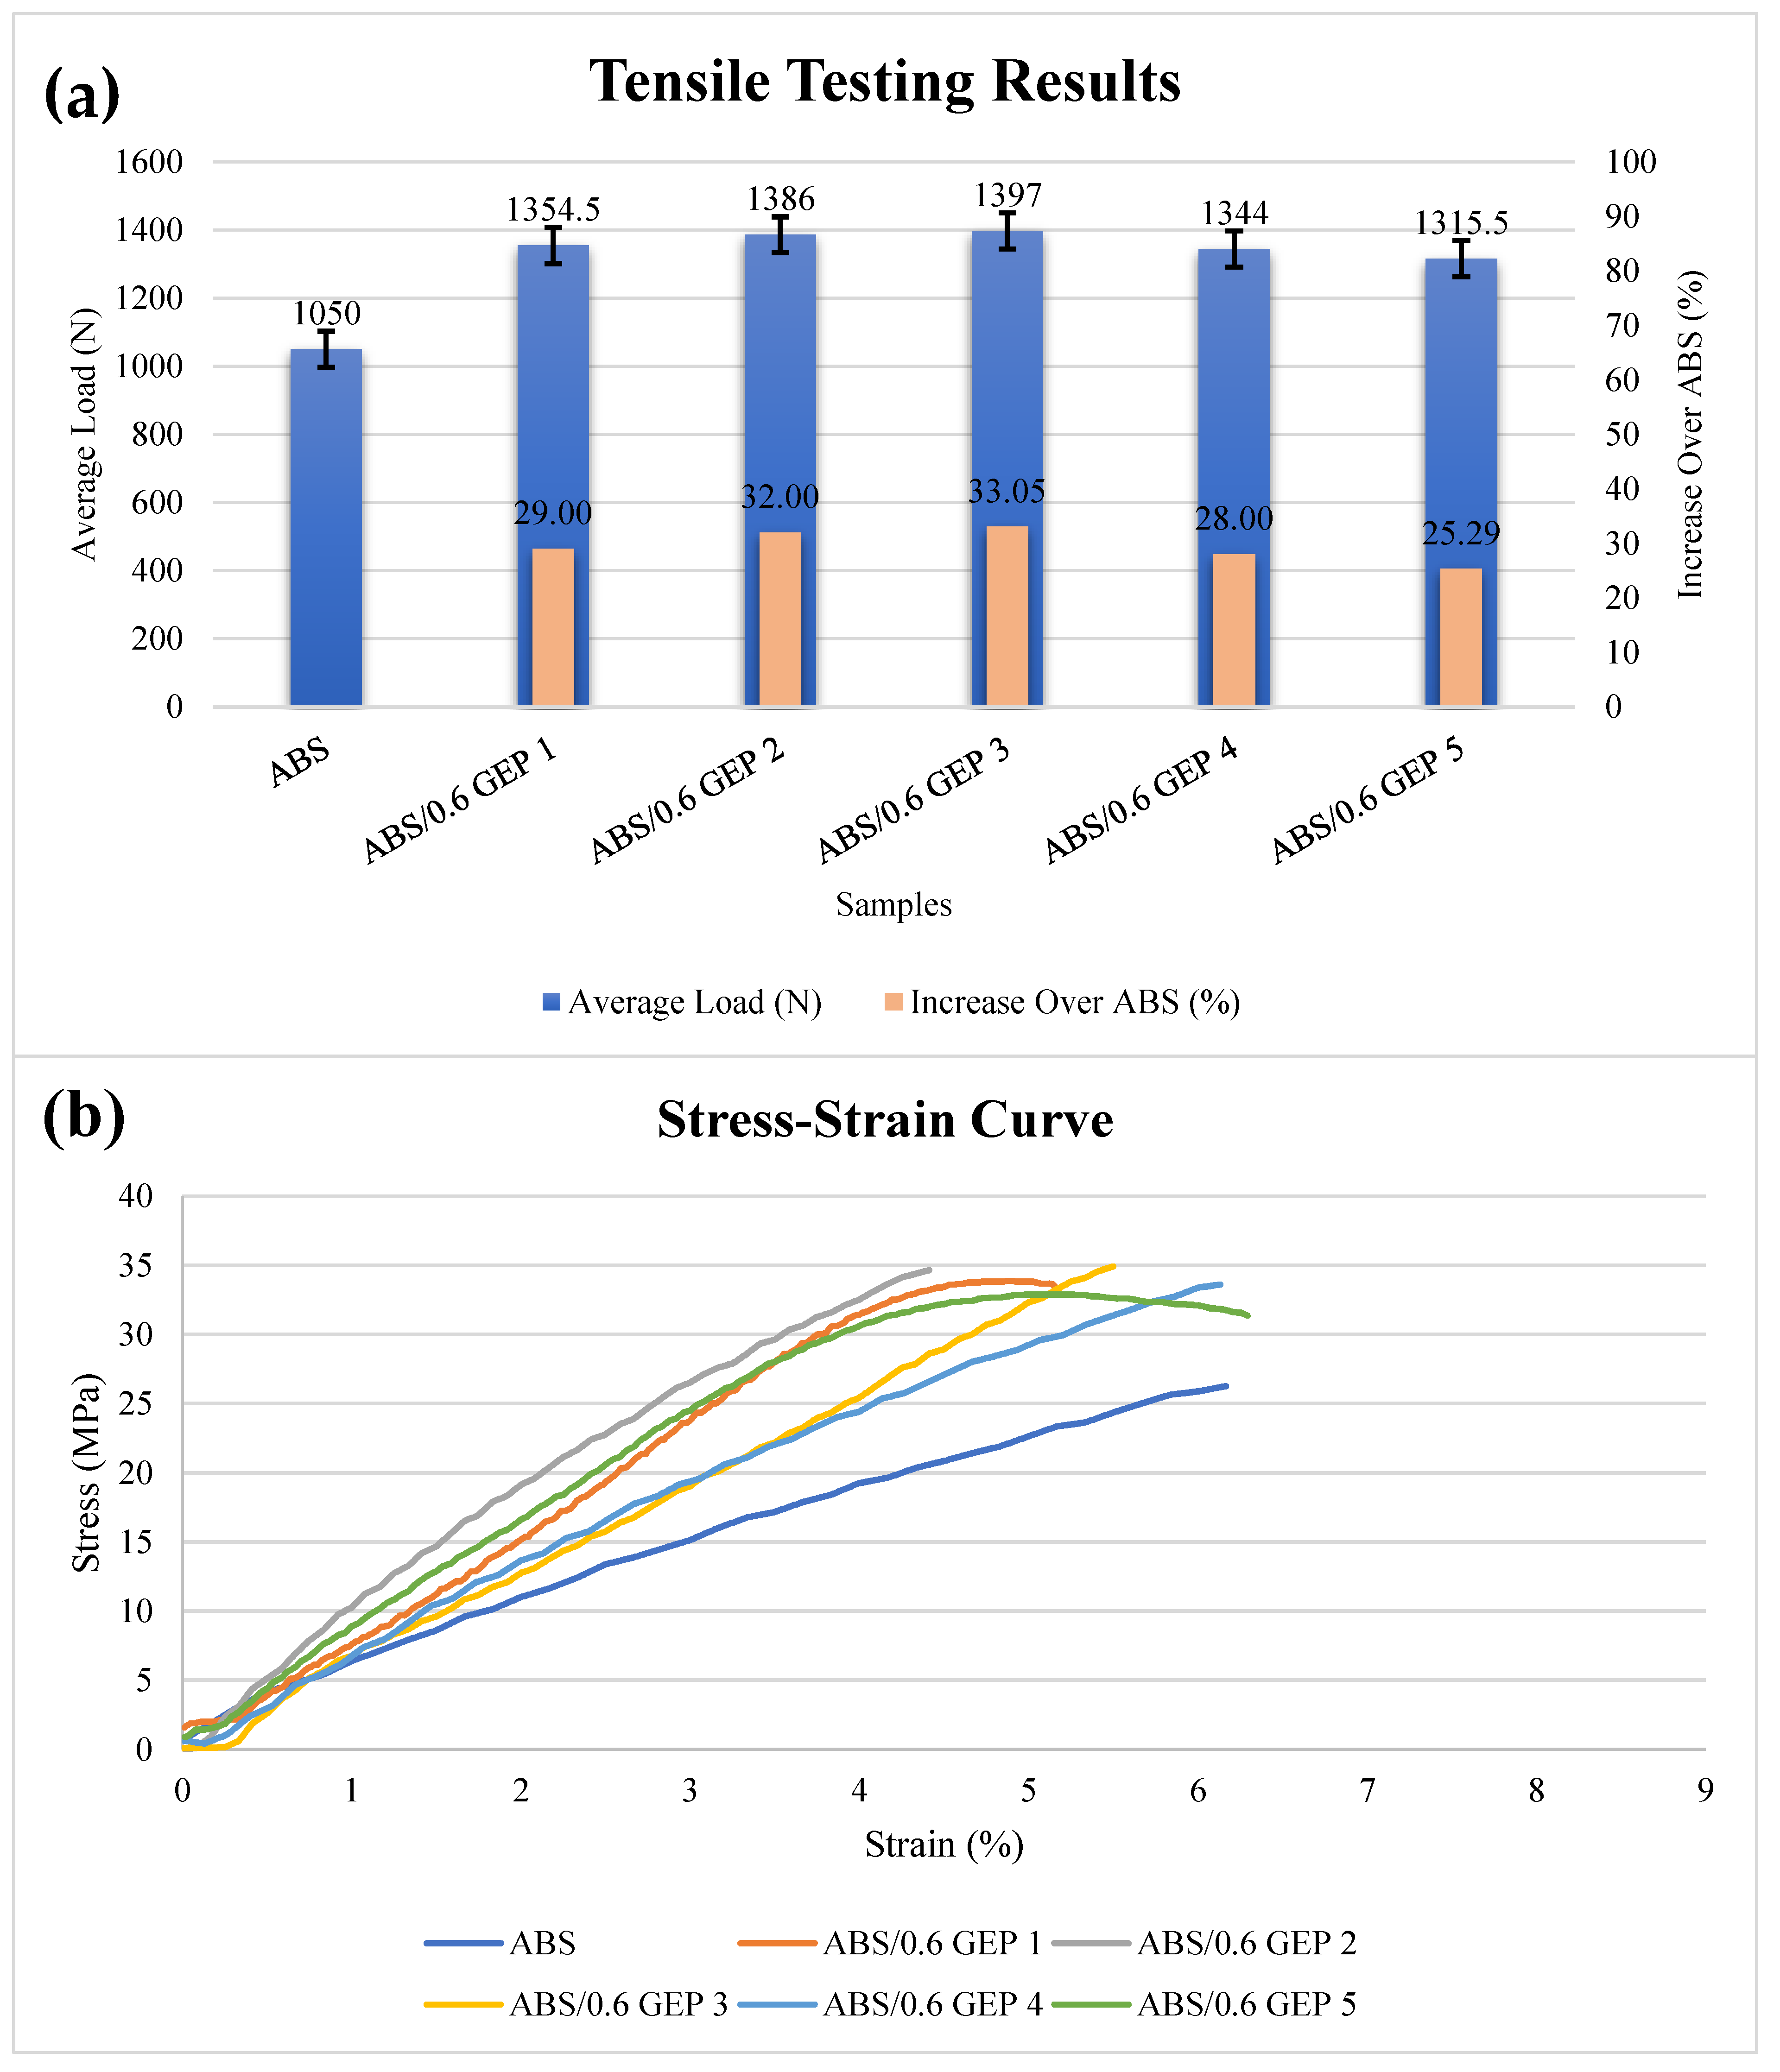
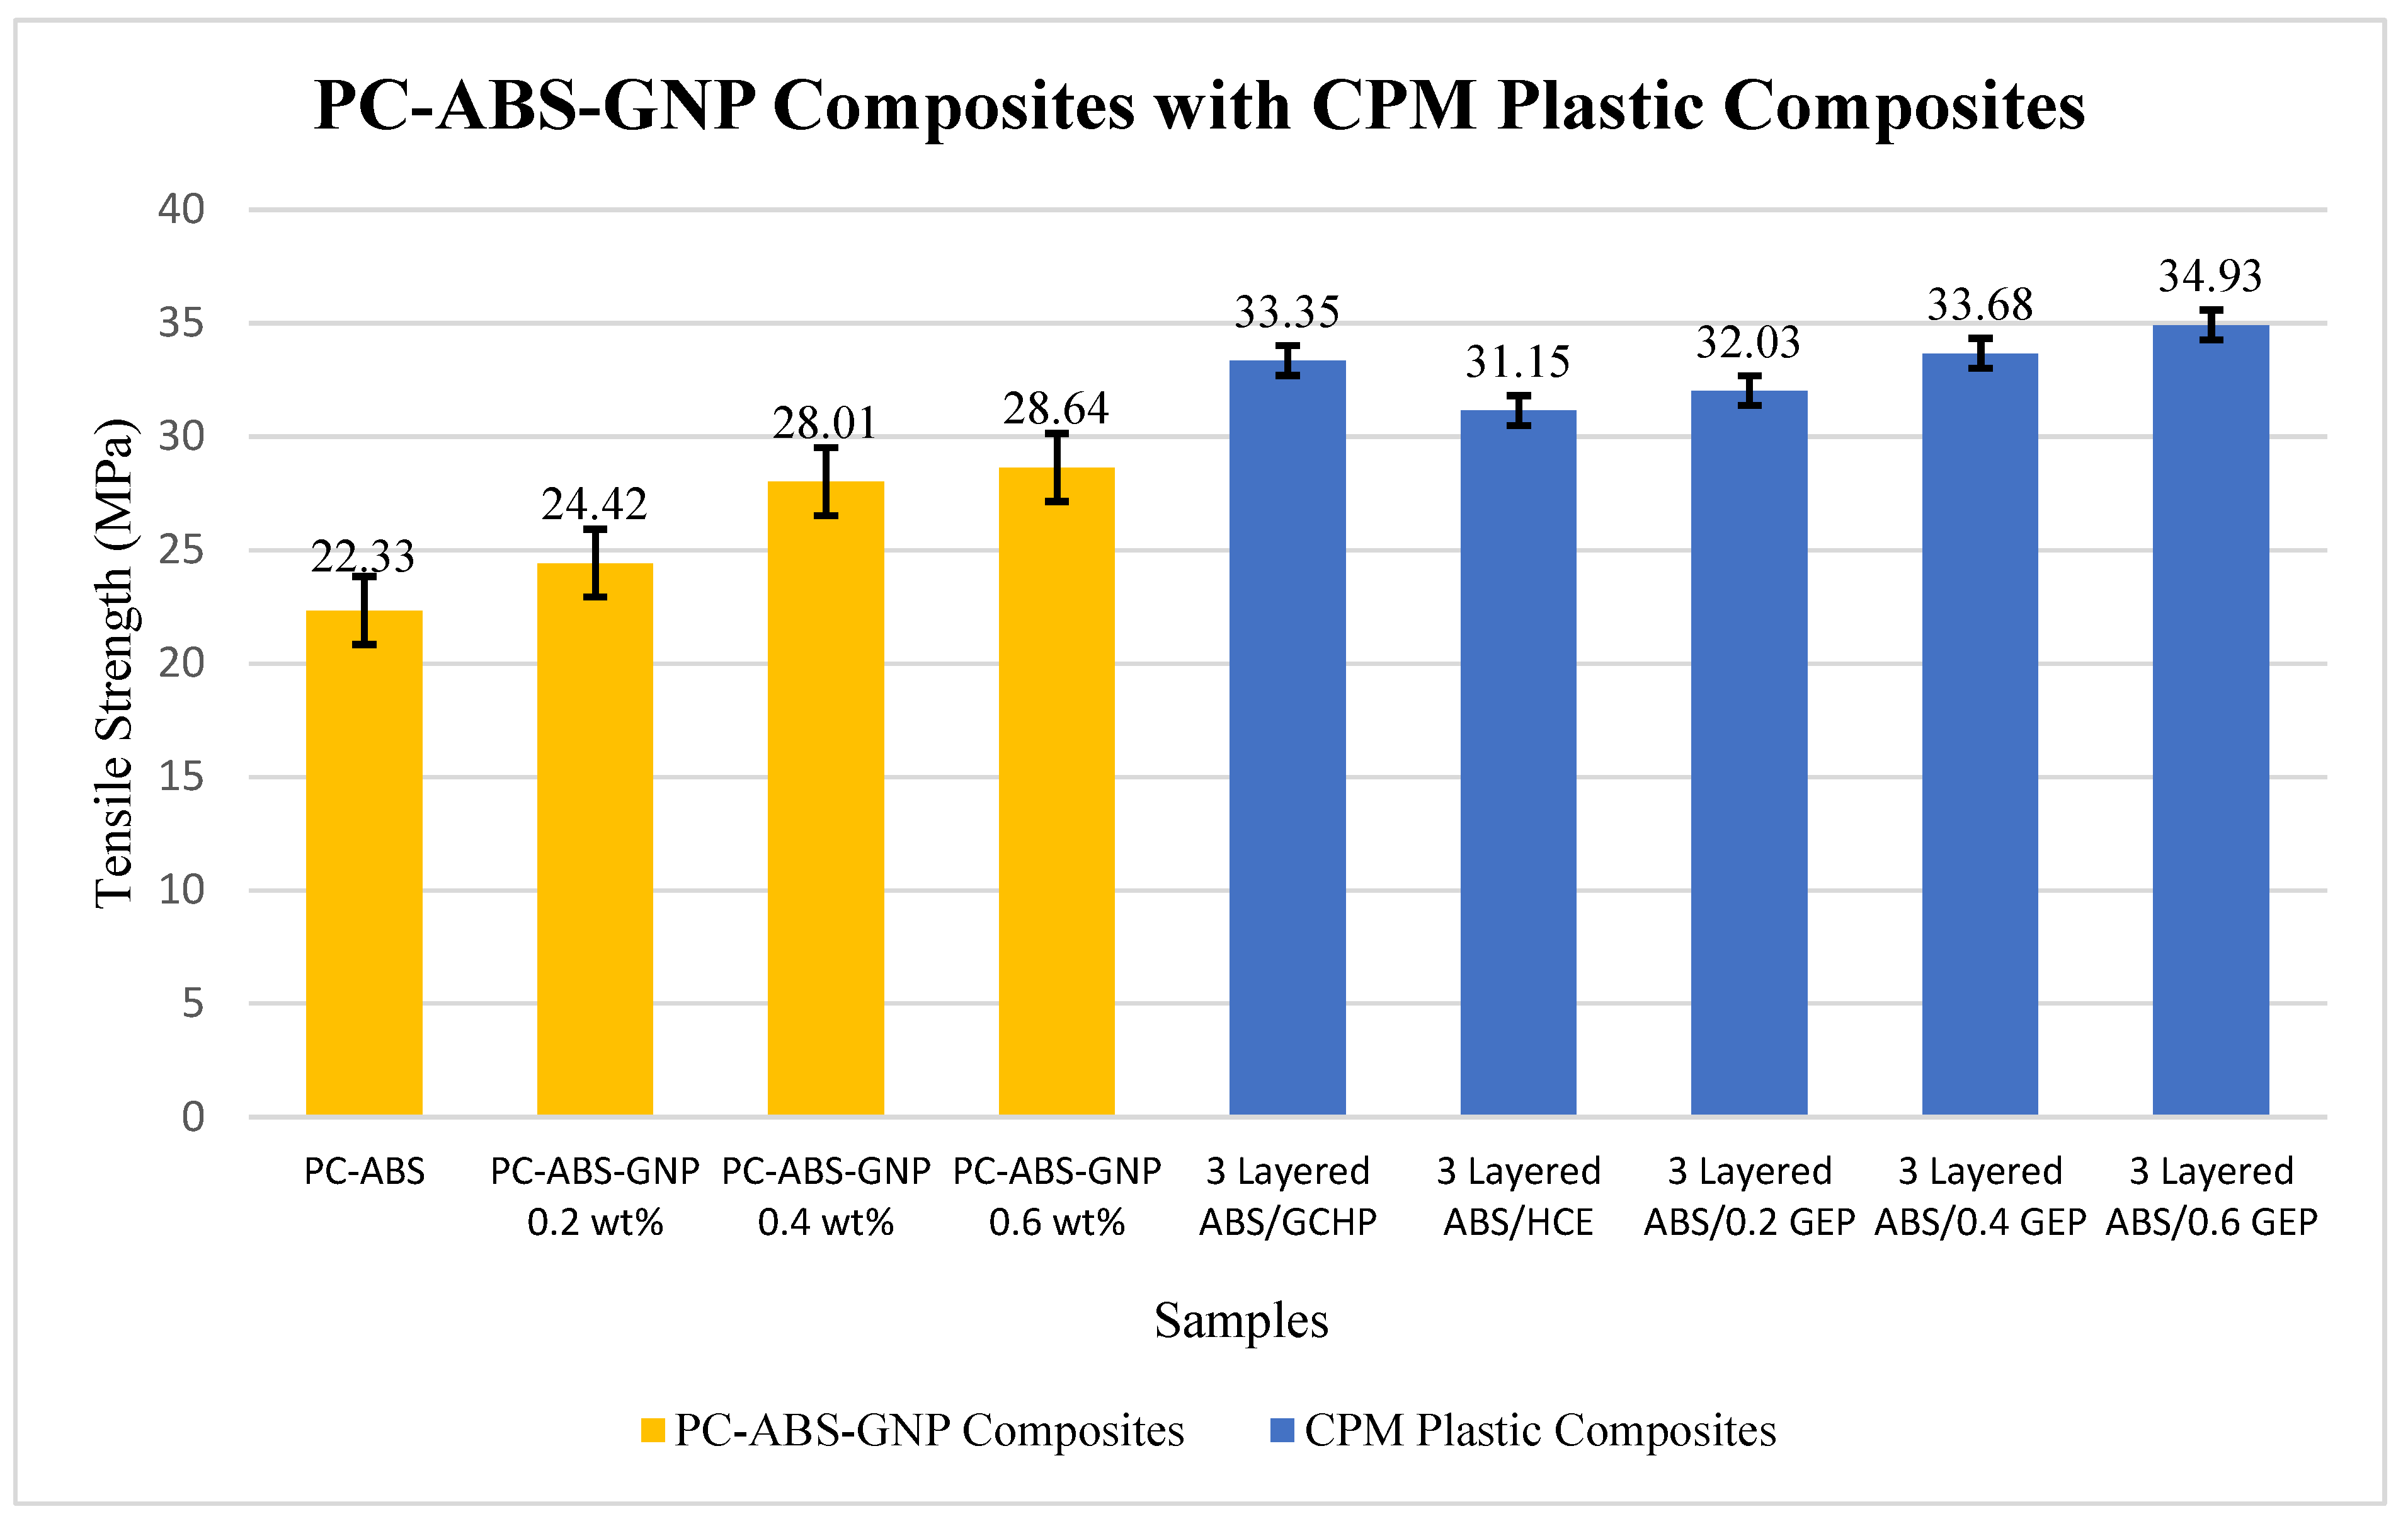
- Tensile testing showed consistent increase in fracture load values for all the samples. A total of five layers of three different TA materials were added to 4 mm tensile samples at different intervals. The tensile strength kept increasing for every single layer addition of TA materials. However, the increase was observed for up to 3 layers and then decreased for 4- and 5-layered composites. This phenomenon was observed for all the TA materials. The highest tensile strength of 34.9 MPa was observed for ABS/0.6 GEP three-layered composites and this was an increase of 33% over commercially available ABS. This shows that the addition of more layers deteriorates the properties, highlighting the optimal number of TA material layers that can be added to a product. All the 3-layered plastic composites showed increasing tensile strength until layer 3 and then a reduction for 4- and 5-layered composites. The addition of one TA material layer should be restricted to 1 mm (i.e., a 4 mm thickness should have only three layers of TA material). This indicates that the maximum number of TA material layers that can be added to a product is limited by the product’s overall thickness.
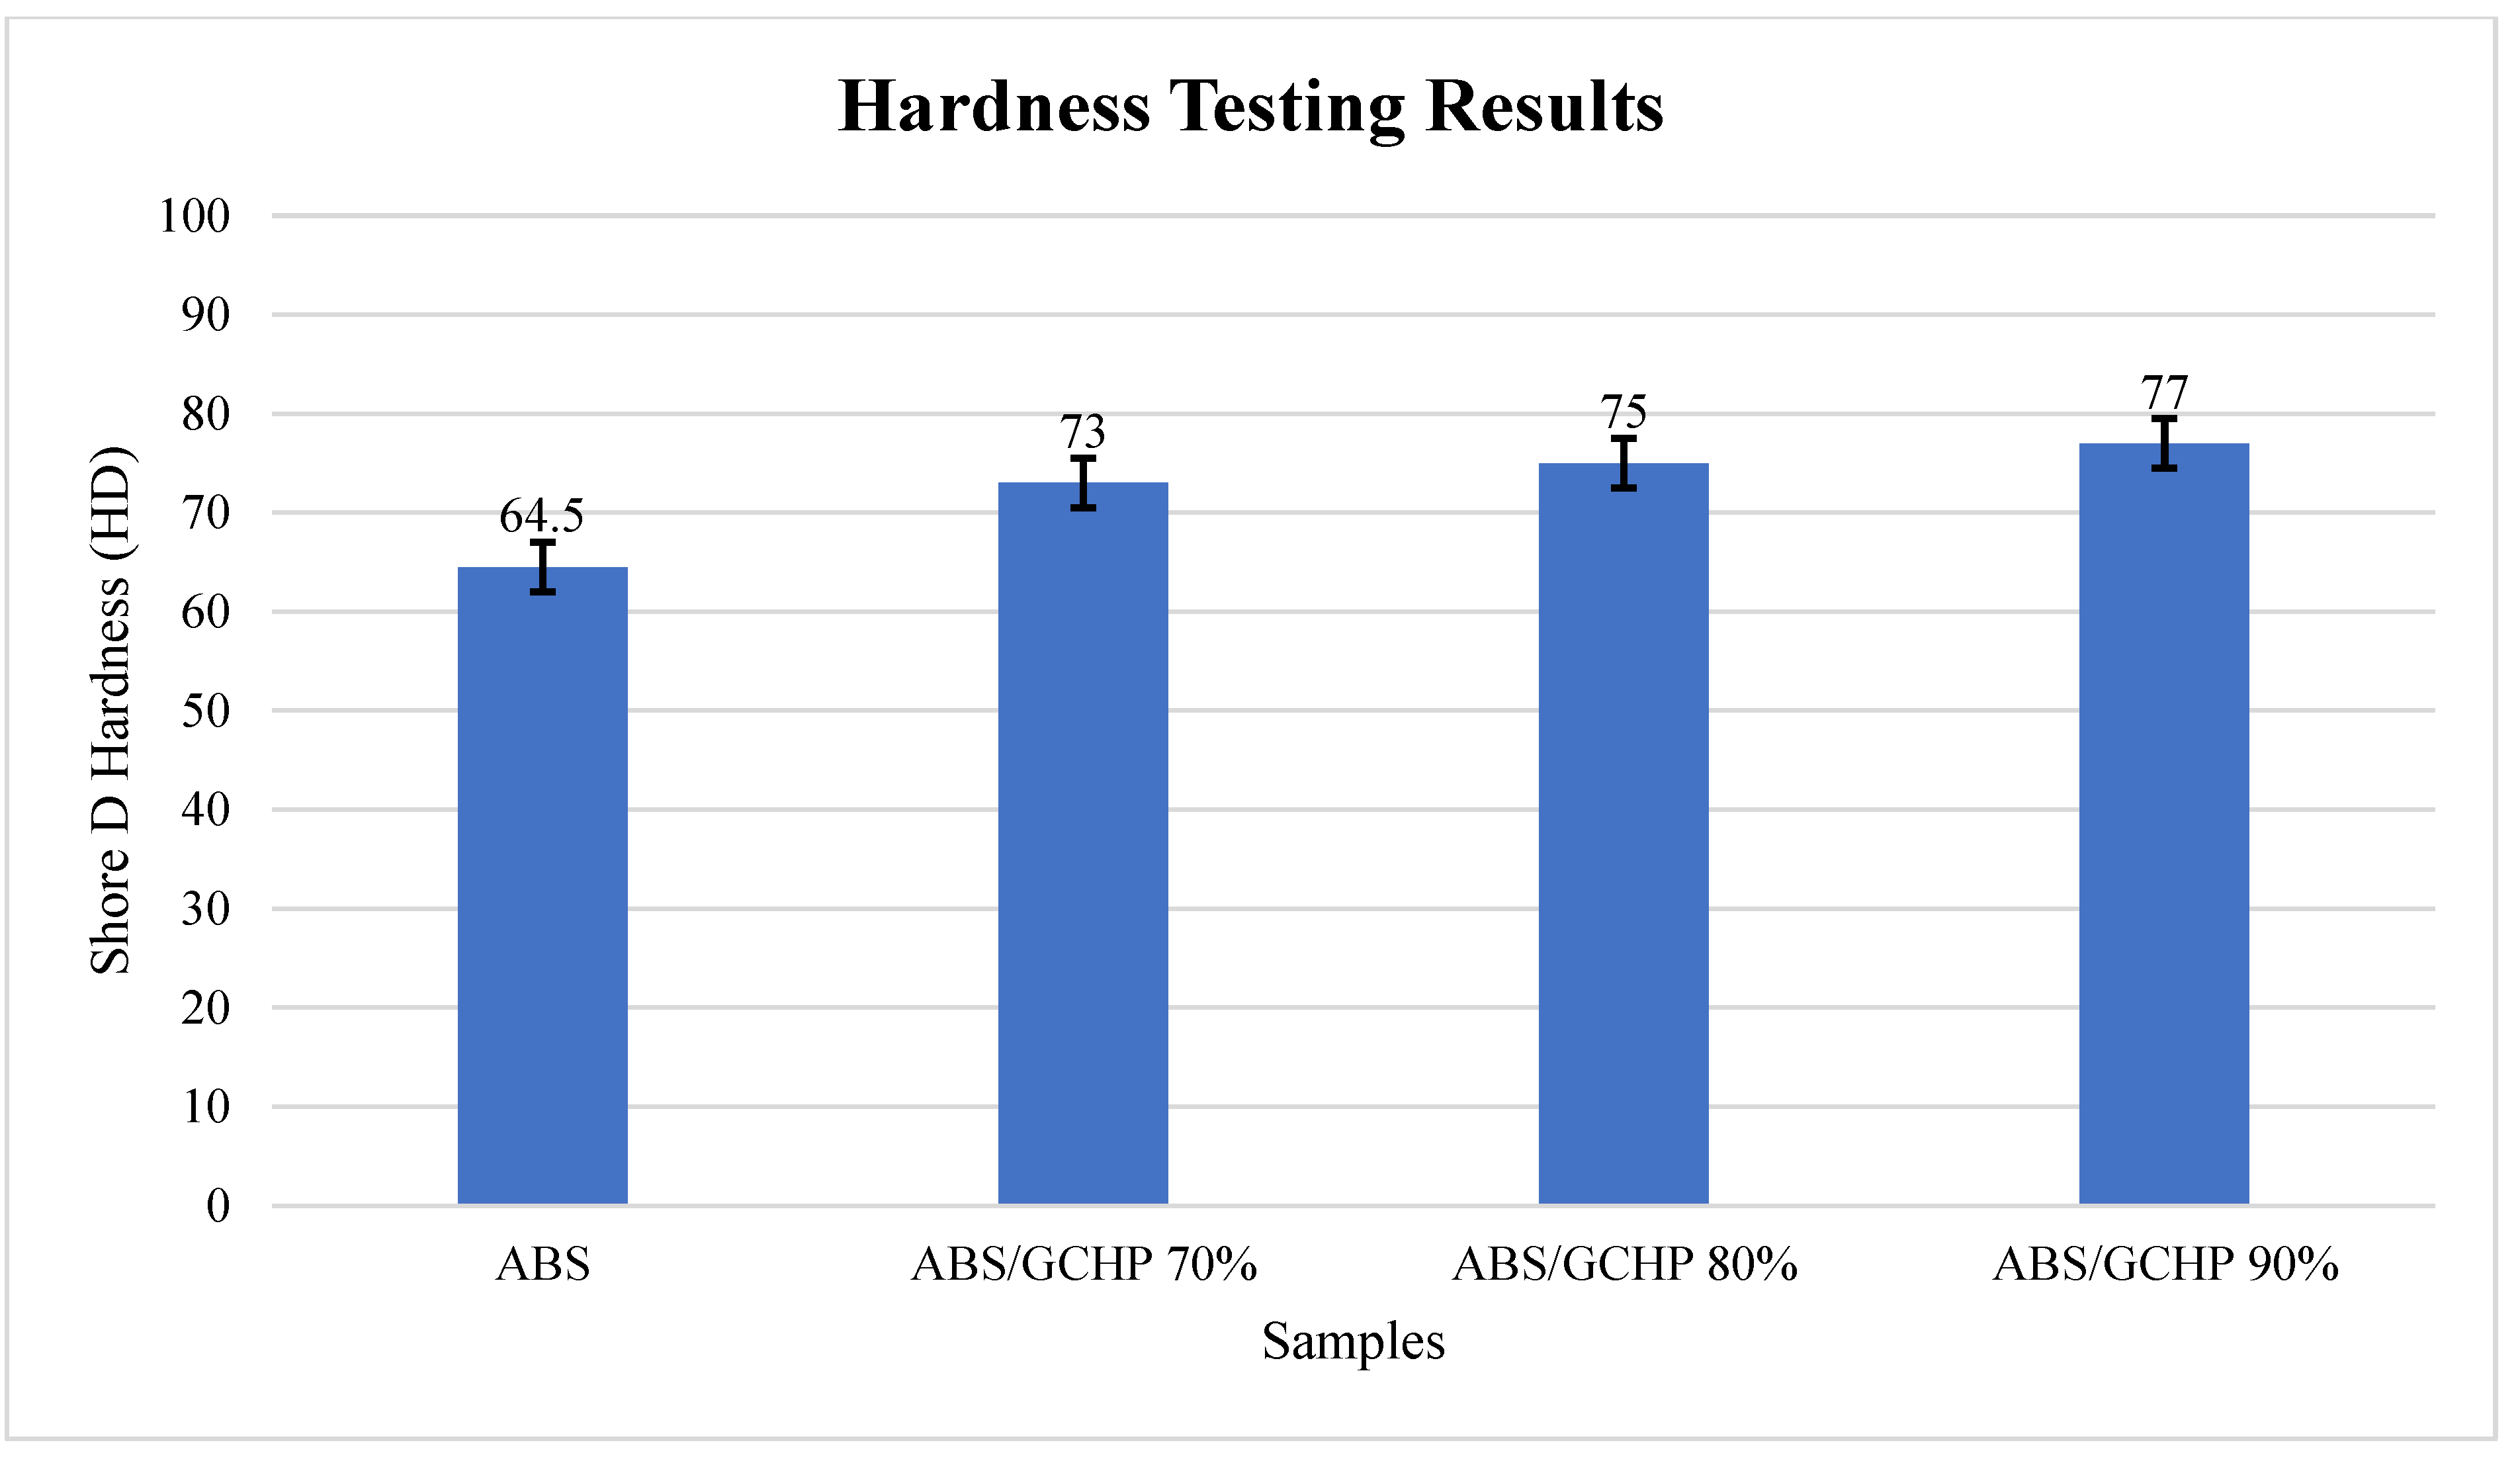
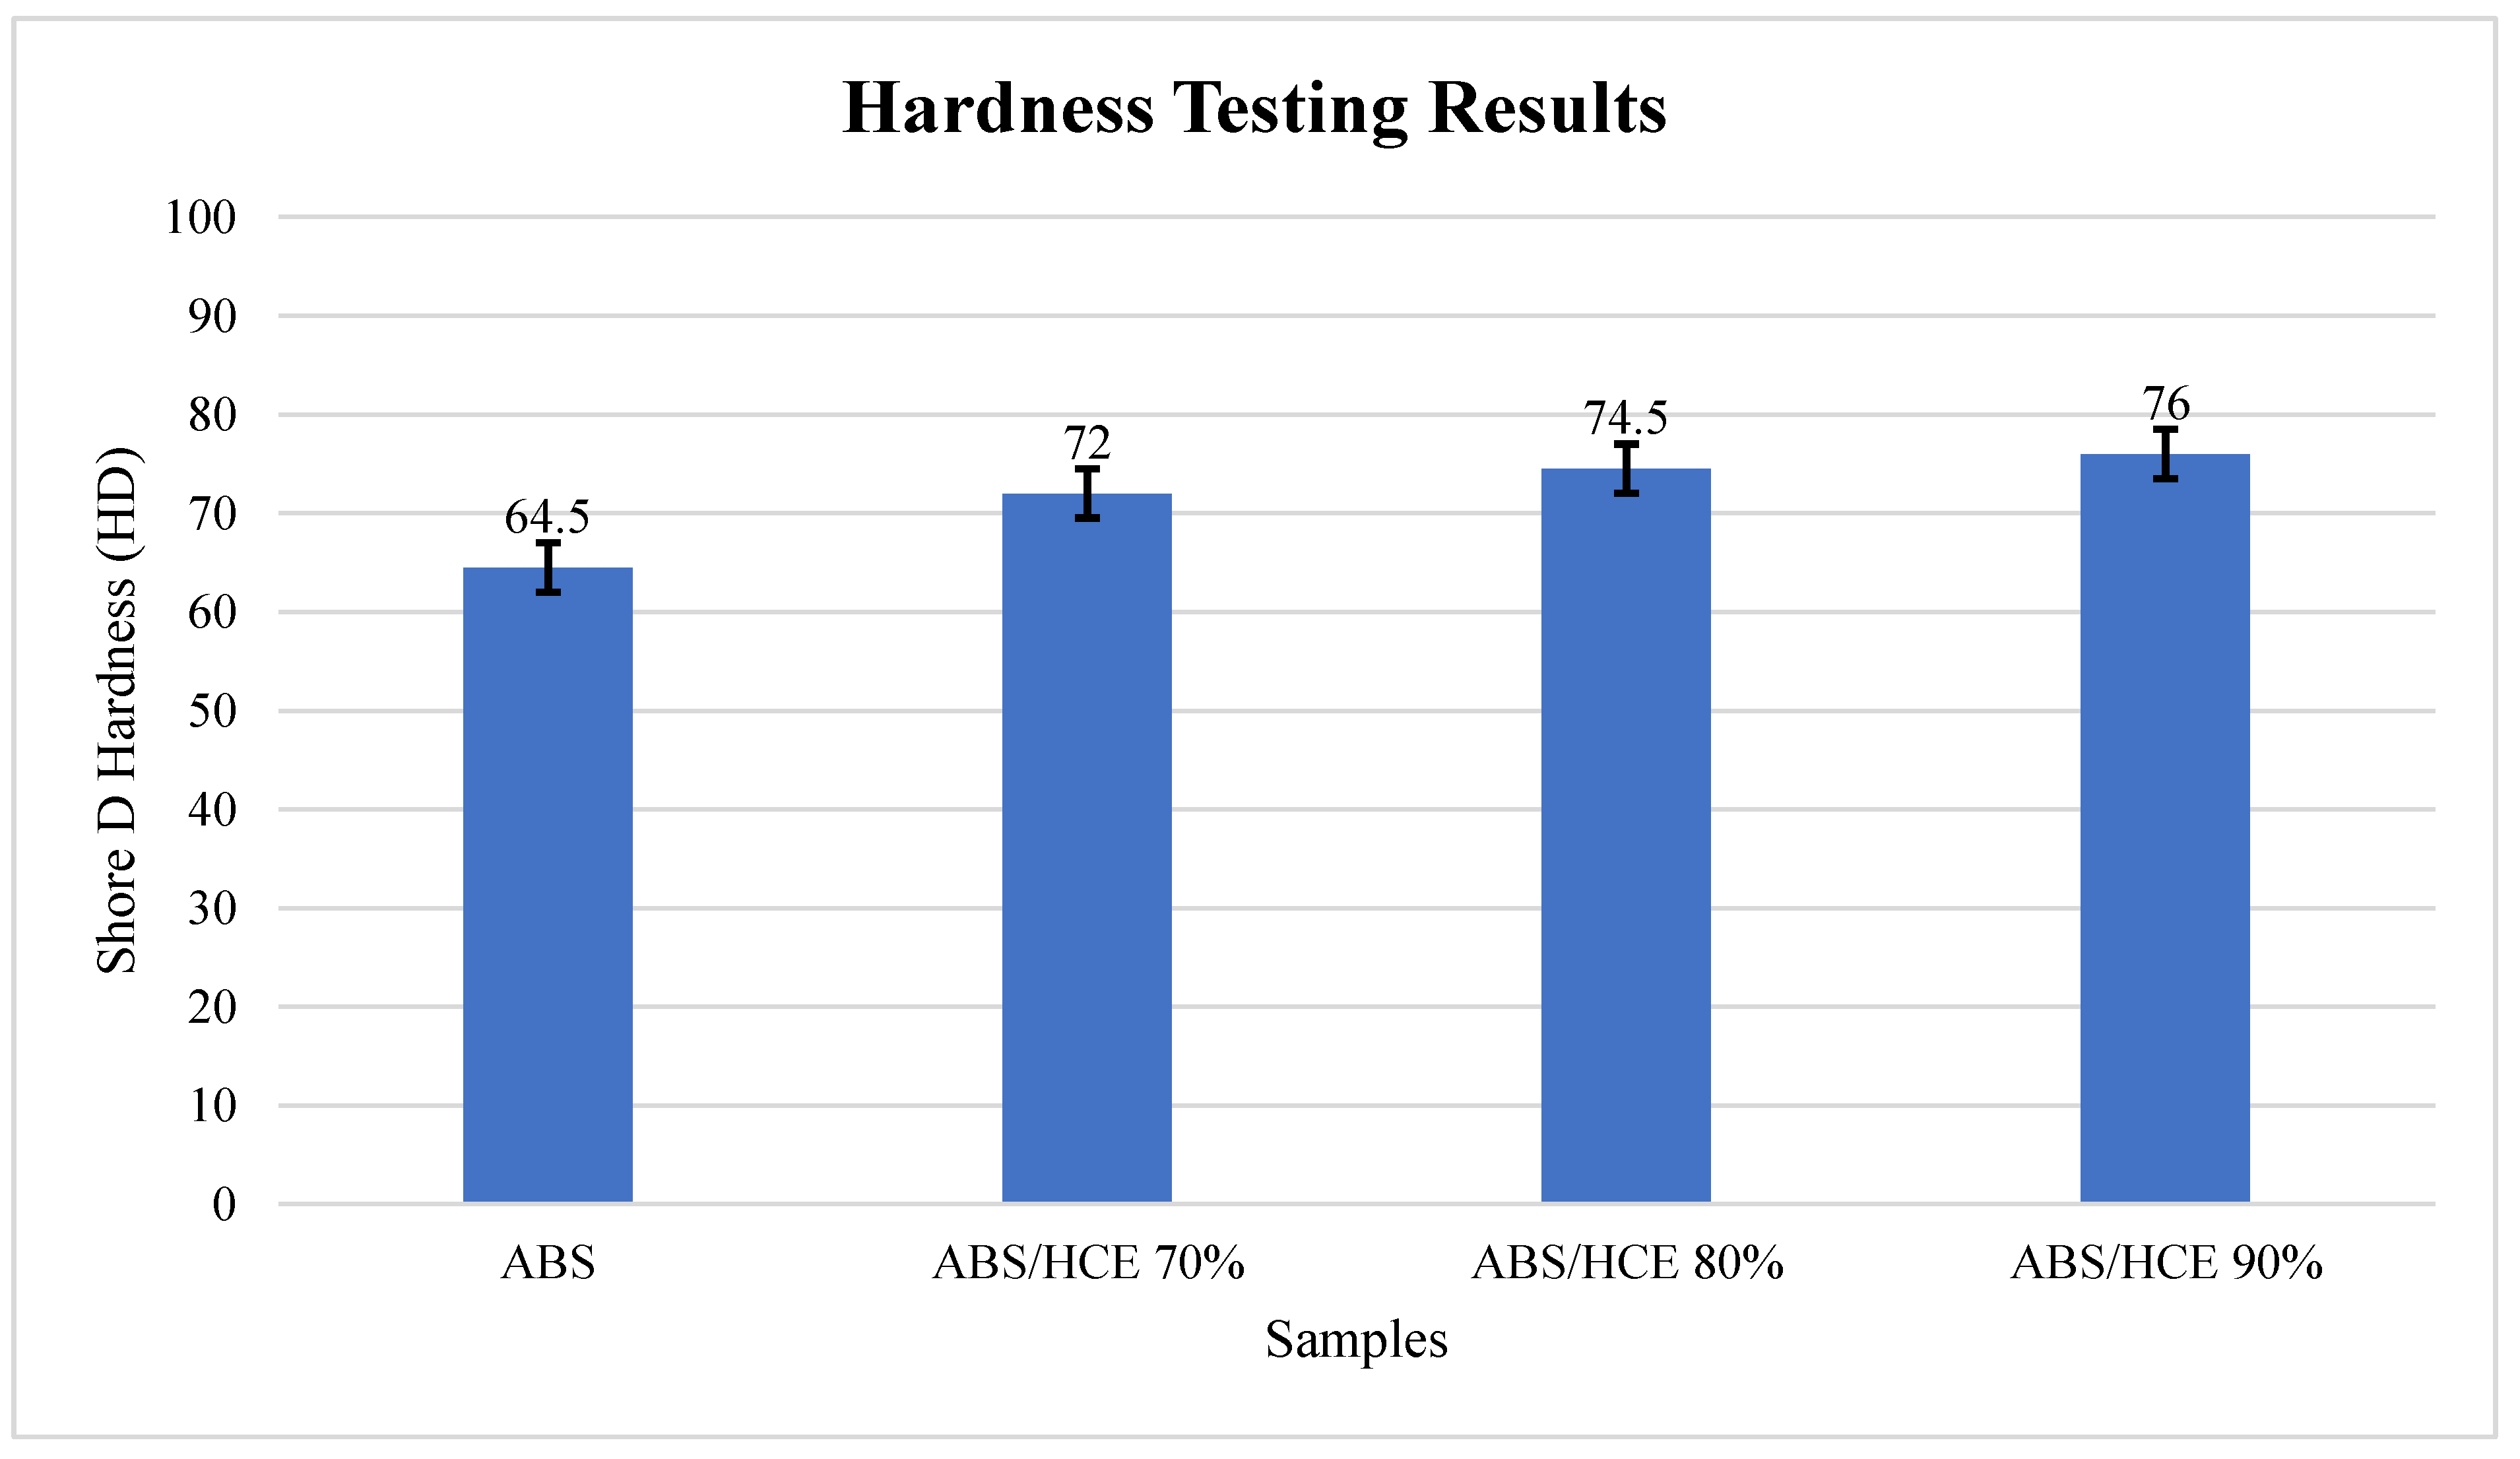
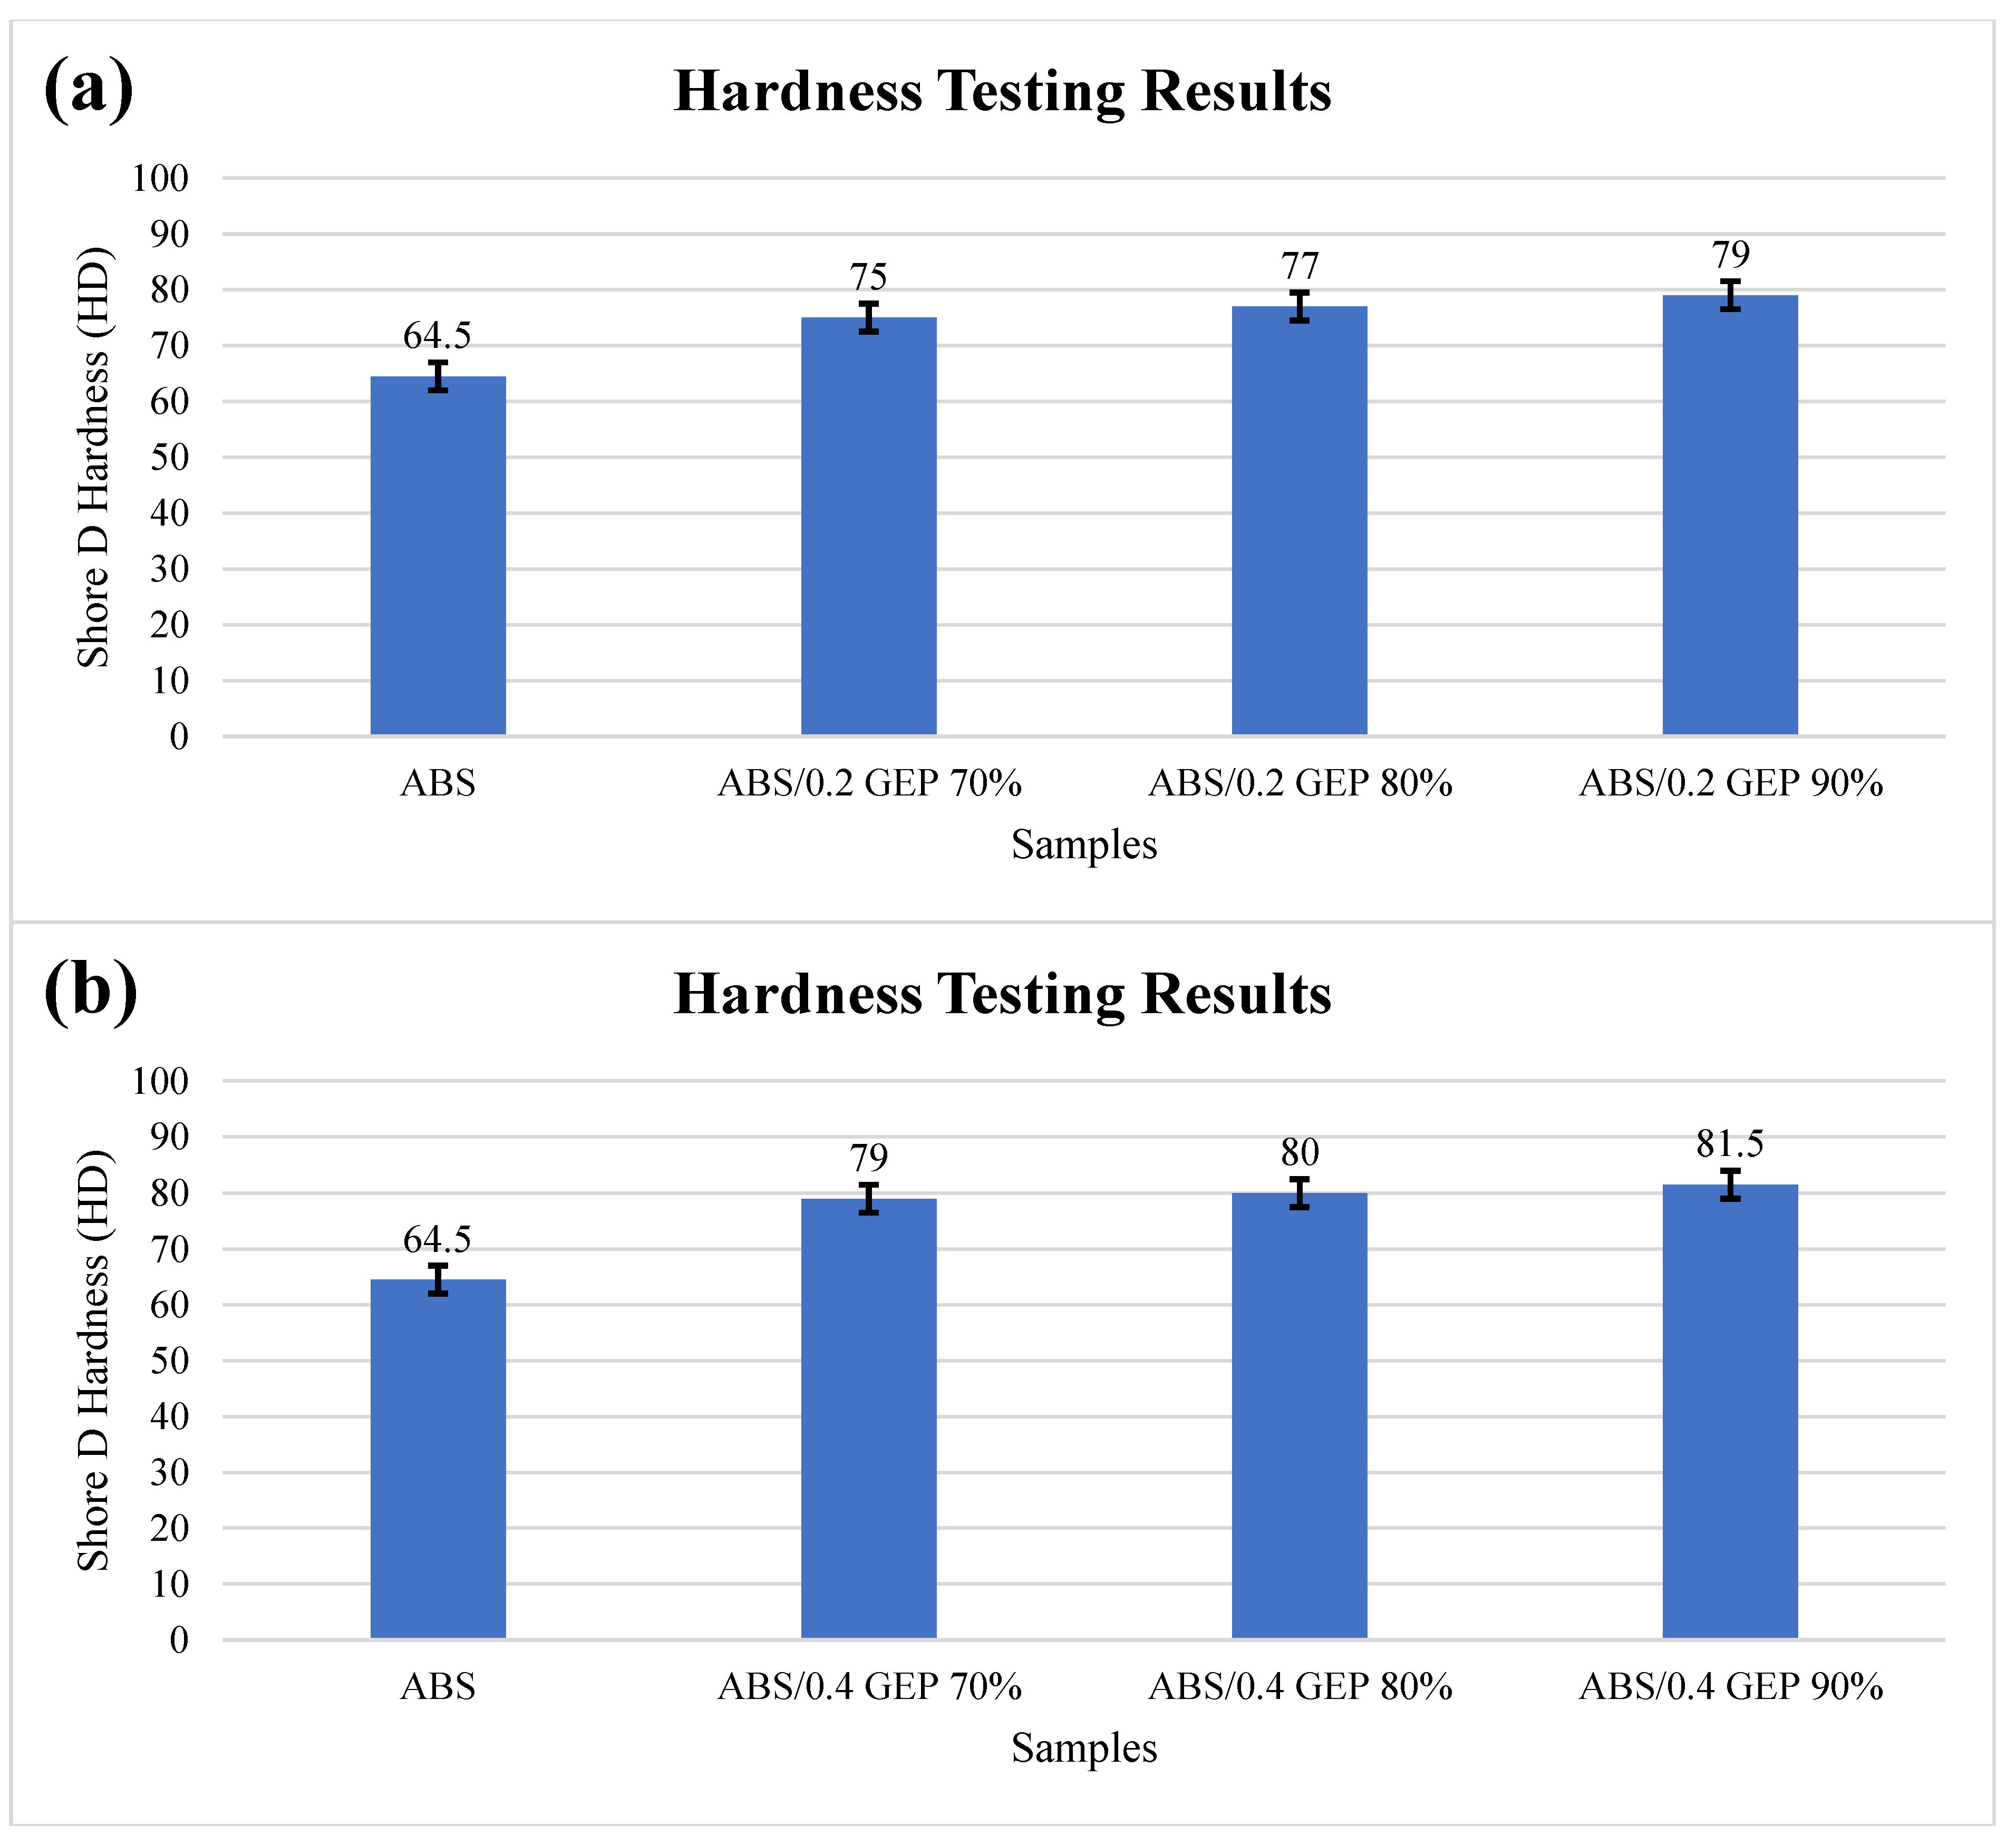
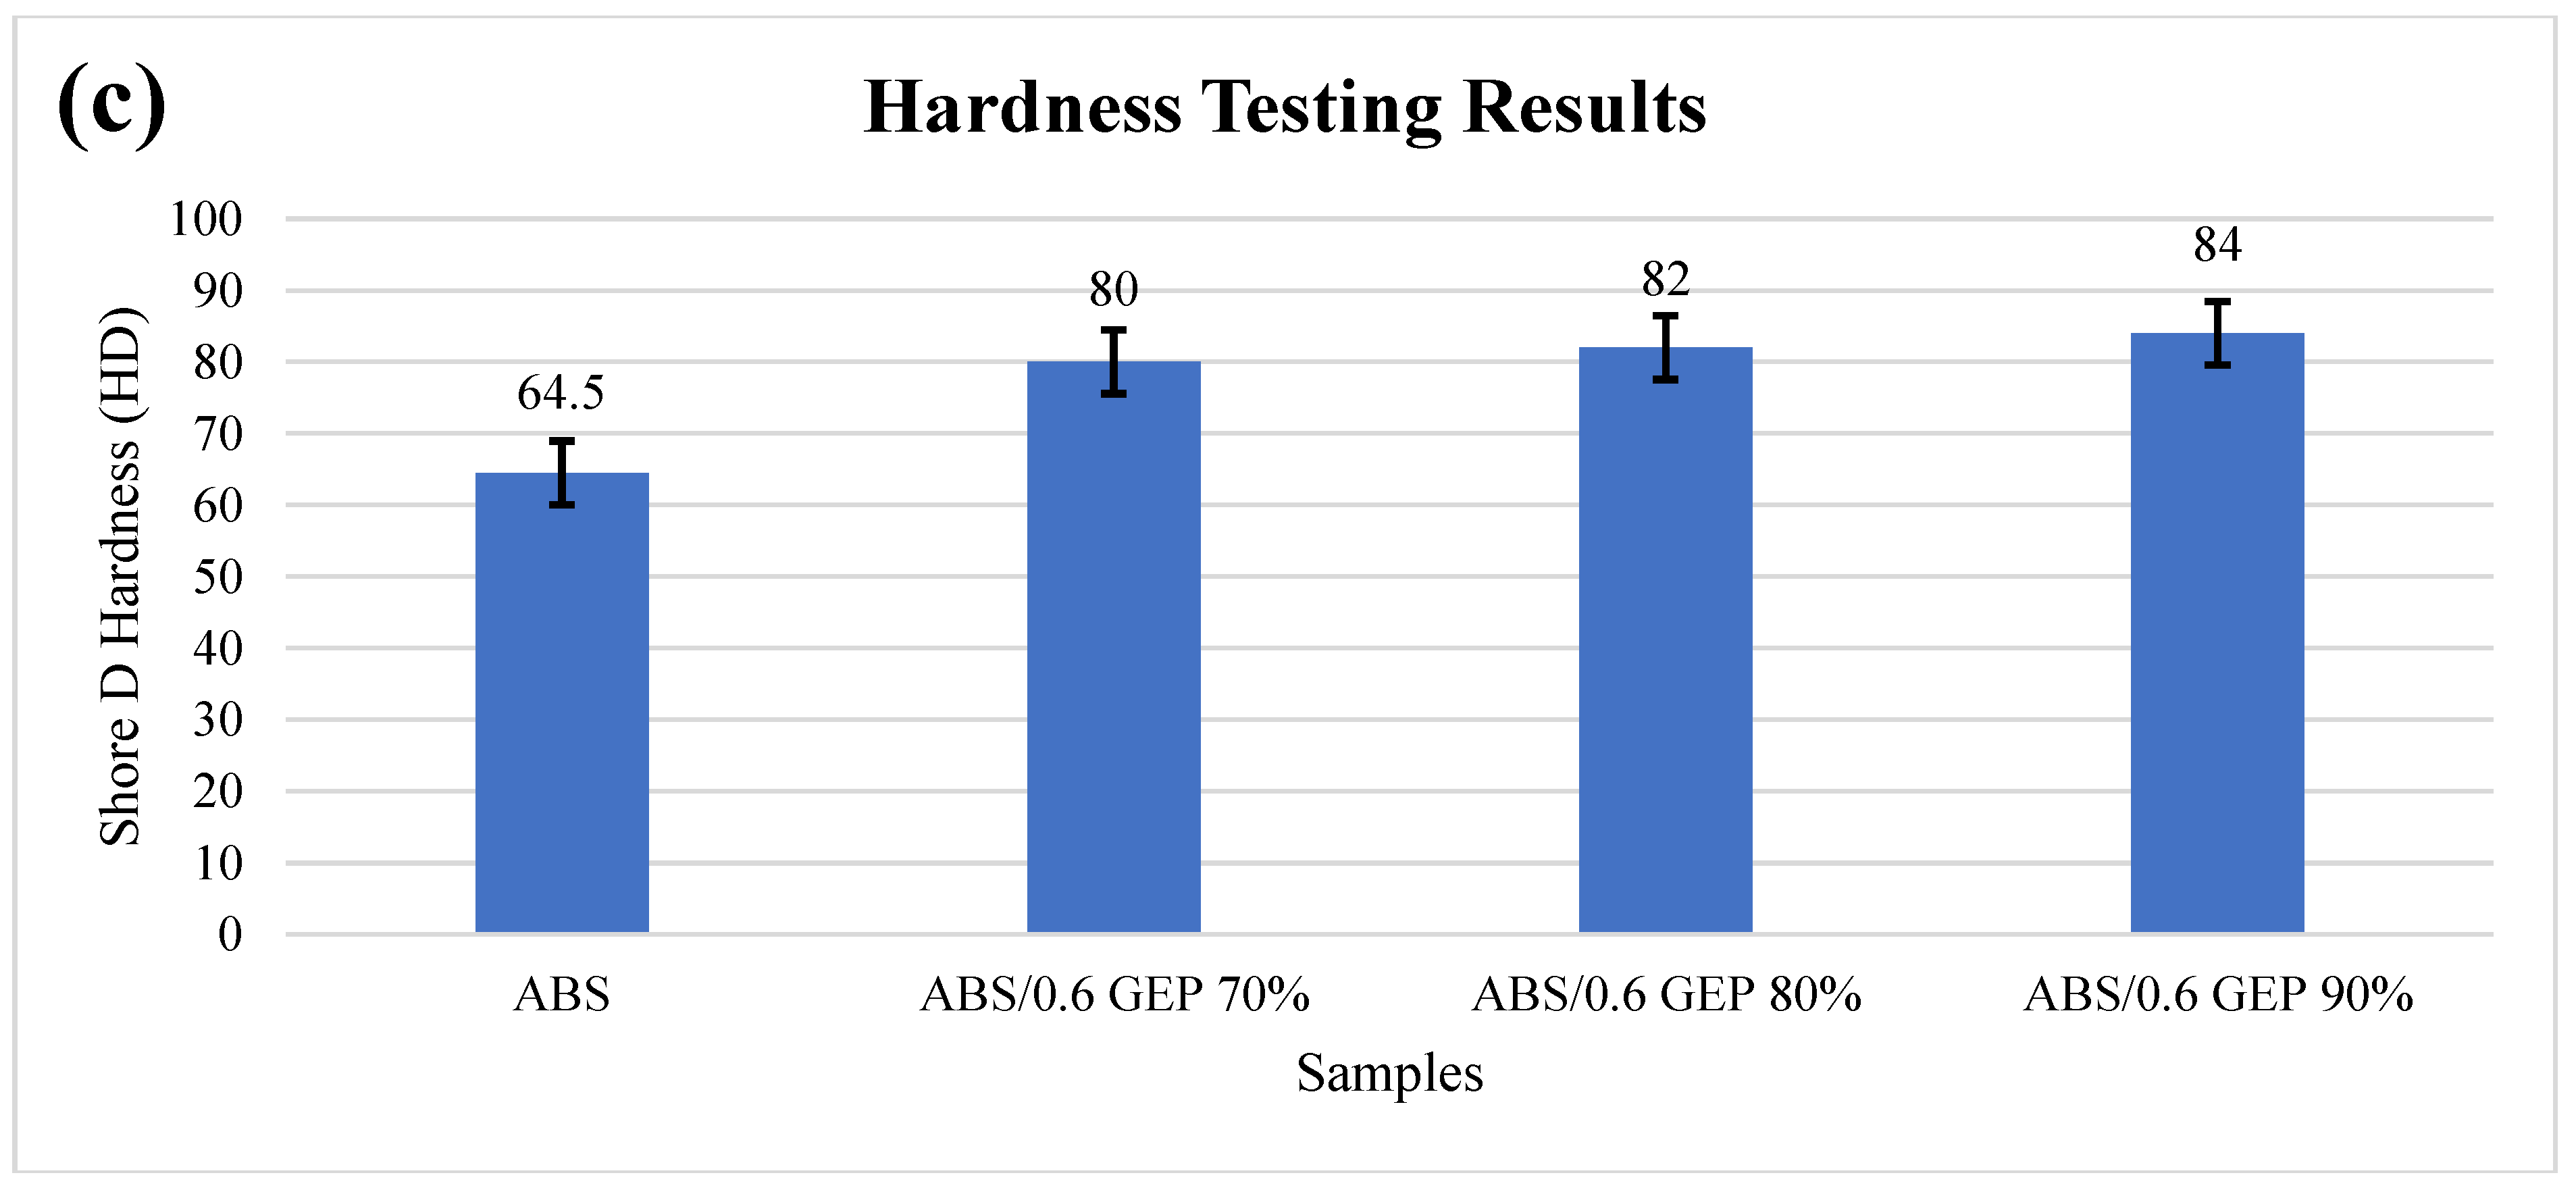
- Hardness testing showed positive results for all the plastic composites manufactured by CPM. A single layer of TA material was added at different intervals of build (70%, 80%, and 90%) to analyze it reaction force. The results showed increased hardness value when the TA material layer was added closer to the surface at 90% completion. The highest hardness value of 84 HD was observed for ABS/0.6 GEP with an increase of 30.2% over commercial ABS (64.5 HD).
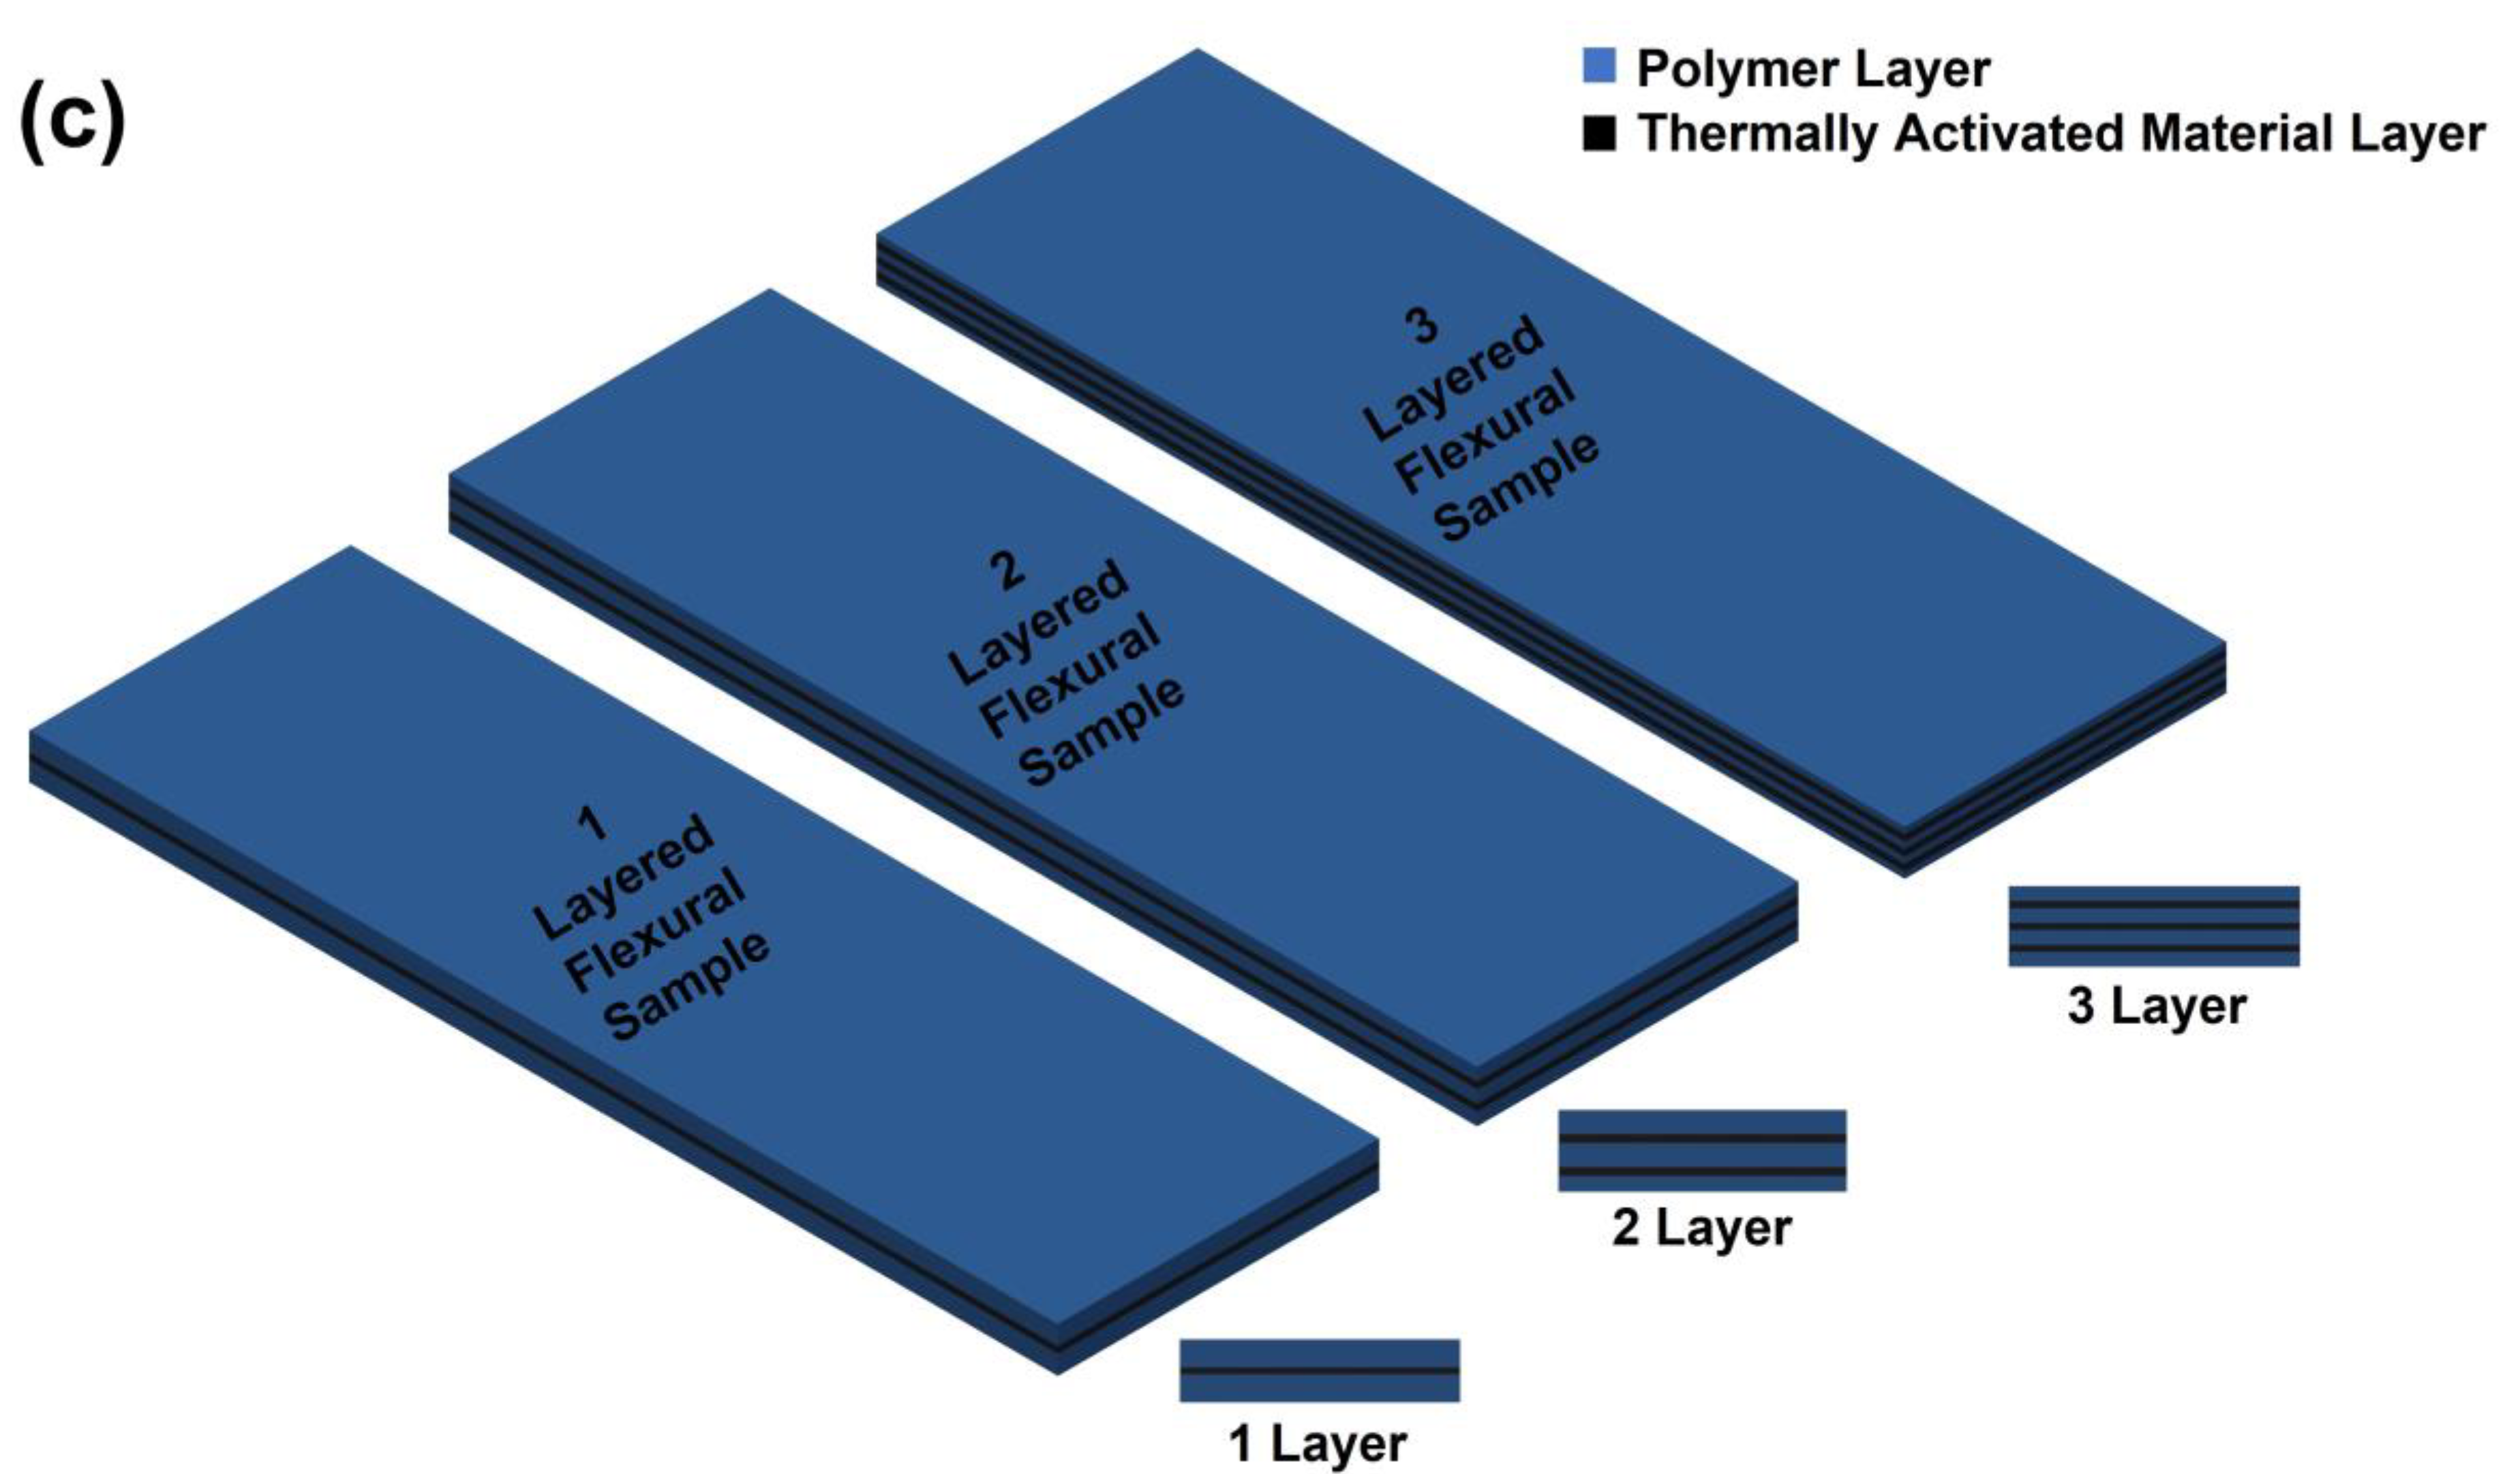
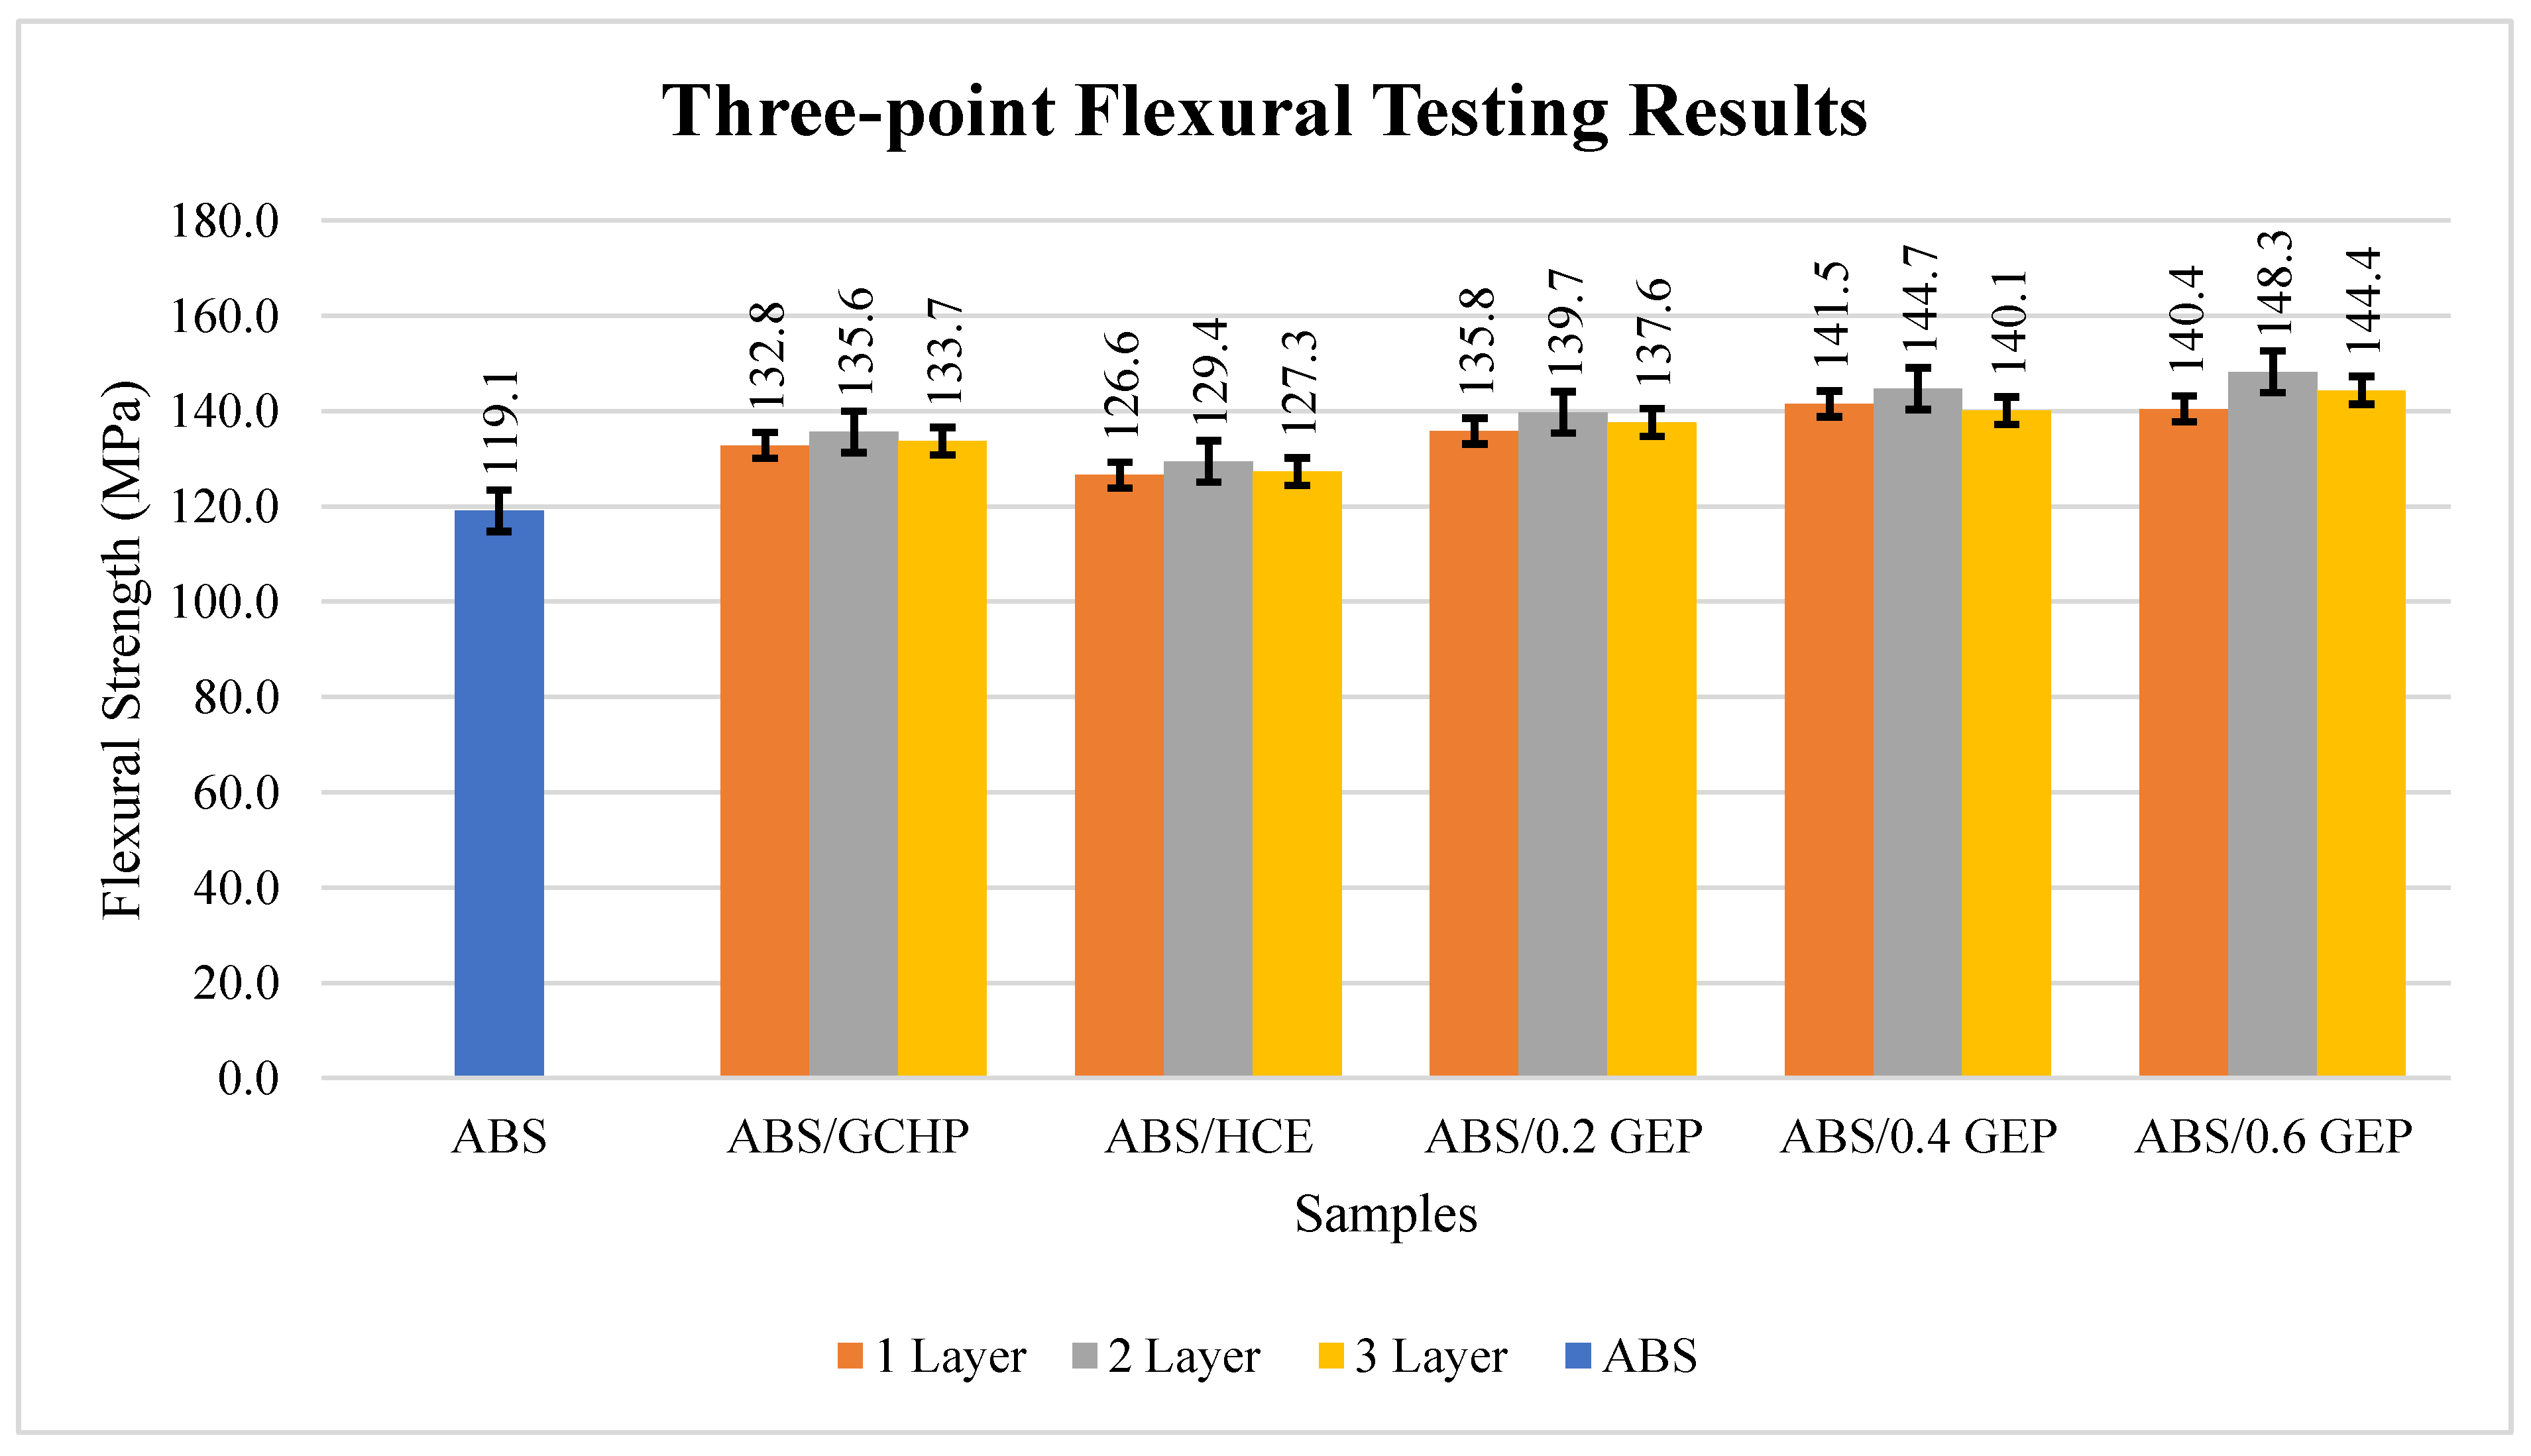
- Three-point flexural tests showed that the addition of TA material layers increased flexural strength, correlating with the tensile test results. A total of three layers of TA material were added to the flexural samples (3 mm thickness) at different intervals. The flexural strength kept increasing for every single layer addition of TA materials. However, the increase was observed for up to 2 layers and then decreased for 3-layered samples. This phenomenon was observed for all the TA materials. The highest flexural strength of 148.2 MPa was observed for ABS/0.6 GEP three-layered composites and this was an increase of 24.4% over commercially available ABS.
Author Contributions
Funding
Data Availability Statement
Conflicts of Interest
References
- Salifu, S.; Desai, D.; Ogunbiyi, O.; Mwale, K. Recent development in the additive manufacturing of polymer-based composites for automotive structures—A review. Int. J. Adv. Manuf. Technol. 2022, 119, 6877–6891. [Google Scholar] [CrossRef]
- Zhuo, P.; Li, S.; Ashcroft, I.A.; Jones, A.I. Material extrusion additive manufacturing of continuous fibre reinforced polymer matrix composites: A review and outlook. Compos. Part B Eng. 2021, 224, 109143. [Google Scholar] [CrossRef]
- Yuan, S.; Li, S.; Zhu, J.; Tang, Y. Additive manufacturing of polymeric composites from material processing to structural design. Compos. Part B Eng. 2021, 219, 108903. [Google Scholar] [CrossRef]
- Zagorski, M.; Sofronov, Y.; Ivanova, D.; Dimova, K. Investigation of different FDM/FFF 3D printing methods for improving the surface quality of 3D printed parts. AIP Conf. Proc. 2022, 2449, 060001. [Google Scholar] [CrossRef]
- Sola, A. Materials Requirements in Fused Filament Fabrication: A Framework for the Design of Next-Generation 3D Printable Thermoplastics and Composites. Macromol. Mater. Eng. 2022, 307, 2200197. [Google Scholar] [CrossRef]
- Valino, A.D.; Dizon, J.R.C.; Espera, A.H., Jr.; Chen, Q.; Messman, J.; Advincula, R.C. Advances in 3D printing of thermoplastic polymer composites and nanocomposites. Prog. Polym. Sci. 2019, 98, 101162. [Google Scholar] [CrossRef]
- Dickson, A.N.; Abourayana, H.M.; Dowling, D.P. 3D printing of fibre-reinforced thermoplastic composites using fused filament fabrication—A review. Polymers 2020, 12, 2188. [Google Scholar] [CrossRef]
- Roy, R.; Mukhopadhyay, A. Tribological studies of 3D printed ABS and PLA plastic parts. Mater. Today Proc. 2021, 41, 856–862. [Google Scholar] [CrossRef]
- Djokikj, J.; Tuteski, O.; Doncheva, E.; Hadjieva, B. Experimental investigation on mechanical properties of FFF parts using different materials. Procedia Struct. Integr. 2022, 41, 670–679. [Google Scholar] [CrossRef]
- Selvam, A.; Mayilswamy, S.; Whenish, R.; Naresh, K.; Shanmugam, V.; Das, O. Multi-objective optimization and prediction of surface roughness and printing time in FFF printed ABS polymer. Sci. Rep. 2022, 12, 16887. [Google Scholar] [CrossRef]
- Ninikas, K.; Kechagias, J.; Fountas, N.A.; Vaxevanidis, N.M. A study of Fused Filament Fabrication process efficiency: ABS vs PLA materials. IOP Conf. Ser. Mater. Sci. Eng. 2022, 1235, 012007. [Google Scholar] [CrossRef]
- La Gala, A.; Ceretti, D.V.; Fiorio, R.; Cardon, L.; D’hooge, D.R. Comparing pellet-and filament-based additive manufacturing with conventional processing for ABS and PLA parts. J. Appl. Polym. Sci. 2022, 139, e53089. [Google Scholar] [CrossRef]
- Shaik, Y.P.; Schuster, J.; Shaik, A. A Scientific Review on Various Pellet Extruders Used in 3D Printing FDM Processes. Open Access Libr. J. 2021, 8, 1–19. [Google Scholar] [CrossRef]
- Butt, J.; Mebrahtu, H.; Shirvani, H. Numerical and experimental analysis of product development by composite metal foil manufacturing. Int. J. Rapid Manuf. 2018, 7, 59–82. [Google Scholar] [CrossRef]
- Butt, J.; Bhaskar, R.; Mohaghegh, V. Investigating the effects of extrusion temperatures and material extrusion rates on FFF-printed thermoplastics. Int. J. Adv. Manuf. Technol. 2021, 117, 2679–2699. [Google Scholar] [CrossRef]
- Butt, J.; Bhaskar, R.; Mohaghegh, V. Investigating the Effects of Ironing Parameters on the Dimensional Accuracy, Surface Roughness, and Hardness of FFF-Printed Thermoplastics. J. Compos. Sci. 2022, 6, 121. [Google Scholar] [CrossRef]
- Butt, J.; Bhaskar, R.; Mohaghegh, V. Investigating the Influence of Material Extrusion Rates and Line Widths on FFF-Printed Graphene-Enhanced PLA. J. Manuf. Mater. Process. 2022, 6, 57. [Google Scholar] [CrossRef]
- Butt, J.; Bhaskar, R.; Mohaghegh, V. Analysing the effects of layer heights and line widths on FFF-printed thermoplastics. Int. J. Adv. Manuf. Technol. 2022, 121, 7383–7411. [Google Scholar] [CrossRef]
- Mohan, V.B.; Lau, K.T.; Hui, D.; Bhattacharyya, D. Graphene-based materials and their composites: A review on production, applications and product limitations. Compos. Part B Eng. 2018, 142, 200–220. [Google Scholar] [CrossRef]
- Gao, J. Production of multiple material parts using a desktop 3D printer. In Advances in Manufacturing Technology XXXI, Proceedings of the 15th International Conference on Manufacturing Research, Incorporating the 32nd National Conference on Manufacturing Research, London, UK, 5–7 September 2017; IOS Press: Amsterdam, The Netherlands, 2017; p. 148. [Google Scholar] [CrossRef]
- Kottasamy, A.; Samykano, M.; Kadirgama, K.; Rahman, M.; Noor, M.M. Experimental investigation and prediction model for mechanical properties of copper-reinforced polylactic acid composites (Cu-PLA) using FDM-based 3D printing technique. Int. J. Adv. Manuf. Technol. 2022, 119, 5211–5232. [Google Scholar] [CrossRef]
- Lebedev, S.M.; Gefle, O.S.; Amitov, E.T.; Zhuravlev, D.V.; Berchuk, D.Y.; Mikutskiy, E.A. Mechanical properties of PLA-based composites for fused deposition modeling technology. Int. J. Adv. Manuf. Technol. 2018, 97, 511–518. [Google Scholar] [CrossRef]
- Hwang, S.; Reyes, E.I.; Moon, K.S.; Rumpf, R.C.; Kim, N.S. Thermo-mechanical characterization of metal/polymer composite filaments and printing parameter study for fused deposition modeling in the 3D printing process. J. Electron. Mater. 2015, 44, 771–777. [Google Scholar] [CrossRef]
- Heidari-Rarani, M.; Rafiee-Afarani, M.; Zahedi, A.M. Mechanical characterization of FDM 3D printing of continuous carbon fiber reinforced PLA composites. Compos. Part B Eng. 2019, 175, 107147. [Google Scholar] [CrossRef]
- Butt, J.; Shirvani, H. Experimental analysis of metal/plastic composites made by a new hybrid method. Addit. Manuf. 2018, 22, 216–222. [Google Scholar] [CrossRef]
- Butt, J.; Hewavidana, Y.; Mohaghegh, V.; Sadeghi-Esfahlani, S.; Shirvani, H. Hybrid manufacturing and experimental testing of glass fiber enhanced thermoplastic composites. J. Manuf. Mater. Process. 2019, 3, 96. [Google Scholar] [CrossRef]
- Butt, J.; Oxford, P.; Sadeghi-Esfahlani, S.; Ghorabian, M.; Shirvani, H. Hybrid manufacturing and mechanical characterization of Cu/PLA composites. Arab. J. Sci. Eng. 2020, 45, 9339–9356. [Google Scholar] [CrossRef]
- Tambrallimath, V.; Keshavamurthy, R.; Bavan, S.D.; Patil, A.Y.; Yunus Khan, T.M.; Badruddin, I.A.; Kamangar, S. Mechanical properties of PC-ABS-based graphene-reinforced polymer nanocomposites fabricated by FDM process. Polymers 2021, 13, 2951. [Google Scholar] [CrossRef]
- Dul, S.; Fambri, L.; Pegoretti, A. Fused deposition modelling with ABS–graphene nanocomposites. Compos. Part A Appl. Sci. Manuf. 2016, 85, 181–191. [Google Scholar] [CrossRef]
- Vidakis, N.; Maniadi, A.; Petousis, M.; Vamvakaki, M.; Kenanakis, G.; Koudoumas, E. Mechanical and electrical properties investigation of 3D-printed acrylonitrile–butadiene–styrene graphene and carbon nanocomposites. J. Mater. Eng. Perform. 2020, 29, 1909–1918. [Google Scholar] [CrossRef]
- Aumnate, C.; Pongwisuthiruchte, A.; Pattananuwat, P.; Potiyaraj, P. Fabrication of ABS/graphene oxide composite filament for fused filament fabrication (FFF) 3D printing. Adv. Mater. Sci. Eng. 2018, 2018, 2830437. [Google Scholar] [CrossRef]
- Sun, J.; Ji, J.; Chen, Z.; Liu, S.; Zhao, J. Epoxy resin composites with commercially available graphene: Toward high toughness and rigidity. RSC Adv. 2019, 9, 33147–33154. [Google Scholar] [CrossRef] [PubMed]
- Hmeidat, N.S.; Kemp, J.W.; Compton, B.G. High-strength epoxy nanocomposites for 3D printing. Compos. Sci. Technol. 2018, 160, 9–20. [Google Scholar] [CrossRef]
- Compton, B.G.; Lewis, J.A. 3D-printing of lightweight cellular composites. Adv. Mater. 2014, 26, 5930–5935. [Google Scholar] [CrossRef] [PubMed]
- Bustillos, J.; Montero, D.; Nautiyal, P.; Loganathan, A.; Boesl, B.; Agarwal, A. Integration of graphene in poly (lactic) acid by 3D printing to develop creep and wear-resistant hierarchical nanocomposites. Polym. Compos. 2018, 39, 3877–3888. [Google Scholar] [CrossRef]
- Dorigato, A.; Moretti, V.; Dul, S.; Unterberger, S.H.; Pegoretti, A. Electrically conductive nanocomposites for fused deposition modelling. Synth. Met. 2017, 226, 7–14. [Google Scholar] [CrossRef]
- Jyoti, J.; Kumar, A.; Dhakate, S.R.; Singh, B.P. Dielectric and impedance properties of three dimension graphene oxide-carbon nanotube acrylonitrile butadiene styrene hybrid composites. Polym. Test. 2018, 68, 456–466. [Google Scholar] [CrossRef]
- Sezer, H.K.; Eren, O. FDM 3D printing of MWCNT re-inforced ABS nano-composite parts with enhanced mechanical and electrical properties. J. Manuf. Processes 2019, 37, 339–347. [Google Scholar] [CrossRef]
- Ning, F.; Cong, W.; Qiu, J.; Wei, J.; Wang, S. Additive manufacturing of carbon fiber reinforced thermoplastic composites using fused deposition modeling. Compos. Part B Eng. 2015, 80, 369–378. [Google Scholar] [CrossRef]
- Castro-Casado, D. Chemical treatments to enhance surface quality of FFF manufactured parts: A systematic review. Prog. Addit. Manuf. 2021, 6, 307–319. [Google Scholar] [CrossRef]
- de Bruijn, A.C.; Gómez-Gras, G.; Pérez, M.A. On the effect upon the surface finish and mechanical performance of ball burnishing process on fused filament fabricated parts. Addit. Manuf. 2021, 46, 102133. [Google Scholar] [CrossRef]
- Rane, R.; Kulkarni, A.; Prajapati, H.; Taylor, R.; Jain, A.; Chen, V. Post-process effects of isothermal annealing and initially applied static uniaxial loading on the ultimate tensile strength of fused filament fabrication parts. Materials 2020, 13, 352. [Google Scholar] [CrossRef] [PubMed]
- Arjun, P.; Bidhun, V.K.; Lenin, U.K.; Amritha, V.P.; Pazhamannil, R.V.; Govindan, P. Effects of process parameters and annealing on the tensile strength of 3D printed carbon fiber reinforced polylactic acid. Mater. Today Proc. 2022, 62, 7379–7384. [Google Scholar] [CrossRef]
- Valvez, S.; Silva, A.P.; Reis, P.N.B.; Berto, F. Annealing effect on mechanical properties of 3D printed composites. Procedia Struct. Integr. 2022, 37, 738–745. [Google Scholar] [CrossRef]
- Butt, J.; Bhaskar, R. Investigating the effects of annealing on the mechanical properties of FFF-printed thermoplastics. J. Manuf. Mater. Process. 2020, 4, 38. [Google Scholar] [CrossRef]
- Bhaskar, R.; Butt, J.; Shirvani, H. Experimental Analysis of Plastic-Based Composites Made by Composite Plastic Manufacturing. J. Compos. Sci. 2022, 6, 127. [Google Scholar] [CrossRef]
- 3D FilaPrint. Available online: https://shop.3dfilaprint.com/abs-extrafill-sky-blue-175mm-3d-printer-filament-8226-p.asp (accessed on 27 October 2022).
- Dycotec Materials: DM-GRA-9100S. Available online: https://www.dycotecmaterials.com/product/dm-gra-9100s/ (accessed on 27 October 2022).
- Permabond Engineering Adhesives: Permabond ES566 Heat Cure Epoxy 320 mL Cartridge. Available online: https://www.permabond.co.uk/product-page/es566-heat-cure-epoxy-1-x-320ml-cartridge (accessed on 27 October 2022).
- Nanografi: Graphene Nanoplatelet. Available online: https://nanografi.com/graphene/graphene-nanoplatelets/ (accessed on 27 October 2022).
- BS EN ISO 527-2:2012; Plastics—Determination of Tensile Properties–Part 2: Test Conditions for Moulding and Extrusion Plastics. British, European and International Standard: London, UK, 2012.
- BS EN ISO 868:2003; Plastics and Ebonite–Determination of Indentation Hardness by Means of a Durometer (Shore Hardness). British, European and International Standard: London, UK, 2018.
- BS EN ISO 178:2019; Plastics—Determination of Flexural Properties. British, European and International Standard: London, UK, 2011.
- Ultimaker Cura: Advanced 3D Printing Software, Made Accessible. Available online: https://ultimaker.com/software/ultimaker-cura (accessed on 27 October 2022).
- Vevor: Ultrasonic Homogenizer Sonicator Cell Disruptor Mixer 80w 500 uL-50 mL Capacity. Available online: https://www.vevor.co.uk/s/ultrasonic-homogenizer-sonicator-cell-disruptor-mixer-80w-500ul-50ml-capacity (accessed on 27 October 2022).
- Seretis, G.V.; Theodorakopoulos, I.D.; Manolakos, D.E.; Provatidis, C.G. Effect of sonication on the mechanical response of graphene nanoplatelets/glass fabric/epoxy laminated nanocomposites. Compos. Part B Eng. 2018, 147, 33–41. [Google Scholar] [CrossRef]
- Yu, H.; Hermann, S.; Schulz, S.E.; Gessner, T.; Dong, Z.; Li, W.J. Optimizing sonication parameters for dispersion of single-walled carbon nanotubes. Chem. Phys. 2012, 408, 11–16. [Google Scholar] [CrossRef]
- Baig, Z.; Mamat, O.; Mustapha, M.; Mumtaz, A.; Munir, K.S.; Sarfraz, M. Investigation of tip sonication effects on structural quality of graphene nanoplatelets (GNPs) for superior solvent dispersion. Ultrason. Sonochem. 2018, 45, 133–149. [Google Scholar] [CrossRef]
- Mwema, F.M.; Akinlabi, E.T.; Fatoba, O.S. Visual assessment of 3D printed elements: A practical quality assessment for home-made FDM products. Mater. Today Proc. 2020, 26, 1520–1525. [Google Scholar] [CrossRef]
- Lu, Q.Y.; Wong, C.H. Applications of non-destructive testing techniques for post-process control of additively manufactured parts. Virtual Phys. Prototyp. 2017, 12, 301–321. [Google Scholar] [CrossRef]
- Butt, J.; Bhaskar, R.; Mohaghegh, V. Non-Destructive and Destructive Testing to Analyse the Effects of Processing Parameters on the Tensile and Flexural Properties of FFF-Printed Graphene-Enhanced PLA. J. Compos. Sci. 2022, 6, 148. [Google Scholar] [CrossRef]
- Proceq PUNDIT® PL-200. Available online: https://www.screeningeagle.com/en/products/pundit-200 (accessed on 27 October 2022).
- Teckoplus HTTK-37D Digital Shore D Hardness Tester Durometer 0~100 HD. Available online: https://www.tekcoplus.com/products/httk-37d (accessed on 27 October 2022).


| Samples | Extruder Temperature (°C) | Bed Temperature (°C) | Heat Chamber Temperature (°C) | Print Speed (mm/s) | Layer Thickness (mm) | |||
|---|---|---|---|---|---|---|---|---|
| Filament | Syringe | ABS | TA Material | ABS | TA Material | |||
| ABS 1 | 240 | N/A | 80 | 0 | 60 | N/A | 0.2 | N/A |
| ABS/GCHP 2 | 240 | 0 | 80 | 100 | 60 | 30 | 0.2 | 0.1 |
| ABS/HCE 2 | 240 | 0 | 80 | 100 | 60 | 30 | 0.2 | 0.1 |
| ABS/0.2 GEP 2 | 240 | 0 | 80 | 100 | 60 | 30 | 0.2 | 0.1 |
| ABS/0.4 GEP 2 | 240 | 0 | 80 | 100 | 60 | 30 | 0.2 | 0.1 |
| ABS/0.6 GEP 2 | 240 | 0 | 80 | 100 | 60 | 30 | 0.2 | 0.1 |
| Number of TA Material | Manufacturing Completion | Relevant Layer Number |
|---|---|---|
| 1 | 50% | 10 |
| 2 | 35%, 65% | 7, 13 |
| 3 | 25%, 50% 75% | 5, 10, 15 |
| 4 | 20%, 40%, 60%, 80% | 4, 8, 12, 16 |
| Number of TA Material | Manufacturing Completion | Relevant Layer Number |
|---|---|---|
| 1 | 70% | 21 |
| 1 | 80% | 24 |
| 1 | 90% | 27 |
| Number of TA Material | Manufacturing Completion | Relevant Layer Number |
|---|---|---|
| 1 | 50% | 7 |
| 2 | 40%, 80% | 5, 10 |
| 3 | 25%, 50%, 75% | 4, 7, 11 |
Publisher’s Note: MDPI stays neutral with regard to jurisdictional claims in published maps and institutional affiliations. |
© 2022 by the authors. Licensee MDPI, Basel, Switzerland. This article is an open access article distributed under the terms and conditions of the Creative Commons Attribution (CC BY) license (https://creativecommons.org/licenses/by/4.0/).
Share and Cite
Bhaskar, R.; Butt, J.; Shirvani, H. Investigating the Properties of ABS-Based Plastic Composites Manufactured by Composite Plastic Manufacturing. J. Manuf. Mater. Process. 2022, 6, 163. https://doi.org/10.3390/jmmp6060163
Bhaskar R, Butt J, Shirvani H. Investigating the Properties of ABS-Based Plastic Composites Manufactured by Composite Plastic Manufacturing. Journal of Manufacturing and Materials Processing. 2022; 6(6):163. https://doi.org/10.3390/jmmp6060163
Chicago/Turabian StyleBhaskar, Raghunath, Javaid Butt, and Hassan Shirvani. 2022. "Investigating the Properties of ABS-Based Plastic Composites Manufactured by Composite Plastic Manufacturing" Journal of Manufacturing and Materials Processing 6, no. 6: 163. https://doi.org/10.3390/jmmp6060163
APA StyleBhaskar, R., Butt, J., & Shirvani, H. (2022). Investigating the Properties of ABS-Based Plastic Composites Manufactured by Composite Plastic Manufacturing. Journal of Manufacturing and Materials Processing, 6(6), 163. https://doi.org/10.3390/jmmp6060163