Article

Characterisation of Fibre Bundle Deformation Behaviour—Test Rig, Results and Conclusions

Institute of Lightweight Engineering and Polymer Technology, Technische Universität Dresden, Holbeinstraße 3, 01307 Dresden, Germany
*
Author to whom correspondence should be addressed.
J. Manuf. Mater. Process. 2022, 6(6), 146; https://doi.org/10.3390/jmmp6060146
Submission received: 29 September 2022 / Revised: 11 November 2022 / Accepted: 15 November 2022 / Published: 17 November 2022
(This article belongs to the Special Issue Advances in Material Forming)

Abstract

:
Deformation of continuous fibre reinforced plastics during thermally-assisted forming or joining processes leads to a change of the initial material structure. The load behaviour of composite parts strongly depends on the resultant material structure. The prediction of this material structure is a challenging task and requires a deep knowledge of the material behaviour above melting temperature and the occurring complex forming phenomena. Through this knowledge, the optimisation of manufacturing parameters for a more efficient and reproducible process can be enabled and are in the focus of many investigations. In the present paper, a simplified pultrusion test rig is developed and presented to investigate the deformation behaviour of a thermoplastic semi-finished fiber product in a forming element. Therefore, different process parameters, like forming element temperature, pulling velocity as well as the forming element geometry, are varied. The deformation behaviour in the forming zone of the thermoplastic preimpregnated continuous glass fibre-reinforced material is investigated by computed tomography and the resultant pulling forces are measured. The results clearly show the correlation between the forming element temperature and the resulting forces due to a change in the viscosity of the thermoplastic matrix and the resulting fiber matrix interaction. In addition, the evaluation of the measurement data shows which forming forces are required to change the shape of the thermoplastic unidirectional material with a rectangular cross-section to a round one.

1. Introduction

The limitation of resources and energy demands for resource efficient lightweight constructions and energy reduced productions [1]. Therefore, metal components are substituted with continuous fibre-reinforced plastics (FRP). In particular, thermoplastic matrix systems are brought into focus due to their ductile material behaviour achieving higher impact resistance in comparison to conventional technologies. Braided crash tubes made of glass fibre (GF) and polypropylene (PP) achieving a specific energy absorption of 36 kJ/kg where metallic tubes achieving 12.5 kJ/kg to 38 kJ/kg [2]. Furthermore, the recycleability, an easier processability and tunability of the viscosity are advantages during component production. With their high specific material properties of stiffness and strength, novel components can be developed by integrative constructions and functional integration. Due to the anisotropic behaviour of the single layers of FRP, an application for load introduction areas with three-dimensional (3D) stress states is not appropriate. Therefore, joining technologies for metal and continuous fibre-reinforced thermoplastic composites (TPC) are required. Mechanical joining for metal TPC joints like clinching [3], pinning [4] or further non-adhesive joints [5] are in the focus of ongoing work. In addition, for thermal-assisted joining technologies, the initial material structure is changed due to the tool motion [6]. For pinning processes ([4]), yarns with their initial cross section are displaced and deformed (Figure 1). The resultant and deformed material structure influences the load bearing behaviour depending on load cases [7]. The assessment of the load capacity in terms of stiffness and strength can be conducted by experimental investigations. To reduce the experimental effort and optimize the development process, the prediction of resultant material structure via numerical scale-specific process simulation is required [8,9].
For advanced process simulations of complex local forming processes like mechanical joining, the deformation behaviour of yarns and fibre bundles has to be investigated and modelled in detail. Hence, both a phenomenological description and a quantitative characterisation of fibre bundle deformation are necessary. The characterisation of fibre bundle deformation during forming processes often focuses on deformation by bending. Therefore, cantilever beam bending test [10] or advanced test rig setups based on parallel-plate rheometer (PPR) [11] for unidirectional (UD) TPC are carried out. For more complex textile architectures like fabrics, picture frame tests are conducted to investigate the in-plane shear behaviour [12] and predict wrinkles. The material behaviour in transverse direction for UD fibre bundles under process conditions for compaction are investigated by [13]. A simplified PPR setup in an in situ CT is used for compaction tests of fibre bundles. Within the CT, the compaction phenomena like squeeze flow, fibre reorientation and fibre–fibre interaction (FFI) can be seen in detail. Due to investigations of the forming phenomena of in- and out-of-plane deformation, matrix flow (percolation) and FFI during joining demand more complex test setups. The test setups should achieve a defined degree of forming within a complex forming process and measurement system to assess the resultant forming forces or strains and displacements for validation of forming simulations. Therefore, common pultrusion technology with the defined process conditions and defined degrees of formation are appropriate.
The pultrusion process enables a production of high quality parts within short cycle times due to a continuous production and novel manufacturing processes [14] also for thick layups [15]. Thermosetting matrix systems have been established, but, in the recent years, thermoplastic matrices are also a focus [16]. Investigations of pultrusion processes with fibre reinforced thermoplastics are carried out with complex pultrusion test setups including a heating and a cooling die [17,18,19,20,21,22] and also for advanced injection pultrusion processes developed in [23]. Within the papers, profiles are formed and focused on process optimization of the dies [17], novel material combinations [22], modelling [18,24,25,26] and simulation strategies [27]. The resultant fibre volume content (FVC) can achieve approx. 50% for carbon fibre (CF)/PP and 52% GF/PP in [17] or 44% in [21] with GF/Polybutylenterephthalate (PBT). Process quality is often assessed on the basis of the resulting mechanical properties; in particular, the shear strength is investigated [17,20,22,28]. However, forming and deformation behaviour in the tapered forming element is not evaluated, despite the development of the modelling strategy of a pultrusion process in [27]. For fibre bundle deformations, the pulling force is a necessary factor to assess modeling strategies and required joining forces.
The occurring forming phenomena of thermoplastic prepregs are driven by the temperature dependent material behaviour of the thermoplastic matrix. By increasing the temperature, the viscosity and therefore the viscous force against deformation decreases. In [29], the viscosity η of the PP with approx. 400 Pa · s to 600 Pa · s for low shear rates at different temperature levels is given. In comparison with thermosetting matrix system (e.g., RTM6 [30]), the viscosity can be approx. up to 1000× higher under process conditions. The pulling force depending on several mechanisms as stated in [28] such as viscous resistance and compaction resistance.
An investigation of the pultrusion of GF/PBT bundles up to a pulling speed of 1.2 m/min is conducted by [21]. Despite the continuous measurement of the pulling force, the maximum force at a speed of 0.7 m/min is just given with “below 500 N even at high pulling speeds of 0.7 m/min” for a pultruted beam profiles of 3.5 × 10 mm 2 . In contrast, in [19], a pulling speed of 10 mm/s for CF/Polyetheretherketone (PEEK) and 8 mm/s for GF/PP could be achieved. Two different rectangular forming element configurations were used. The pulling force for CF/PEEK was determined for a slightly over-filled forming element with less squeezed back material by around 1 kN for pulling speeds between 1 mm/s to 10 mm/s, whereas a highly over-filled forming element with a high squeezed back material flow shows a wide force range between approx. 2.5 kN to 4 kN by a velocity range of 2 mm/s to 4 mm/s. It can be concluded that the pulling force is less influenced by the velocity when using a slight over-filled forming element. In addition, the temperature influence to the pulling force is investigated. For increasing temperature, an exponential drop of the pulling force can be seen. For GF/Polyamide 66 (PA66), an oscillating motion of the mandrel is used to decrease the pulling force by [31]. Due to the pultruted hollow profile and the applied textile architecture by using braiding, the forces differ between approx. 3 kN for oscillating setup and force range of approx. 4.5 kN to 6.5 kN for the non-oscillating mandrel.
Compacting and forming processes of thermoplastic prepreg material based on pultrusion were carried out by [32]. The CF/PA12 material is used to generate a 3D lattice construction by heating up to 230 °C by a velocity of 100 mm/min. The pultrudate is assessed in terms of voids with 4% by micrographs without taking the pulling force into account.
The pultrusion in [33] of rods with a diameter of 5 mm with hybrid fibres and commercially commingled yarns GF/Polycarbonate (PC) by varying temperature and pulling speed are assessed by determination of void content and resultant pulling force. It could be shown that the filling degree m of the die with 50 N ( m = 95%) up to 270 N ( m = 105%) and the pultrusion speed with 80 N ( v = 50 mm/min) up to 230 N ( v = 100 mm/min) show the most influence on the pulling force.
The investigation of pulling forces with respect to the cooling temperature in the die are carried out by [34]. With commingled yarn of CF/Polyetherimide (PEI) and CF/PEEK and different cooling temperatures, the process is assessed among other things by the resultant void content evaluated by microscopic analysis and the measured pulling forces. The resultant die diameter of 4.76 mm leading to pulling forces of approx. 100 N to 300 N for PEI and 40 N to 170 N for PEEK. The pulling forces are driven by adhesion and crystallisation effects caused by cooling strategy.
The experimental results show the influence of viscous and also friction induced drag through cooling. The assessment of the resultant material structure of the rod is well done but does not take the forming process of the used material into account.
However, the knowledge of fibre failure and forming behaviour of semi-finished prepreg material as a fibre bundle plays a key role in achieving high deformation grades, assessing the mechanical material behaviour and developing a modelling strategy for mechanical joining process on micro and meso scale. Therefore, in the present paper, a simplified pultrusion process setup is introduced. The setup enables the investigation of the dependency of tensile forces, forming element temperature, pultrusion speed, the achieved degree of forming and the inner material structure in the forming zone of the preimpregnated continuous fibre-reinforced unidirectional semi-finished thermoplastic material. The material structure is investigated in terms of a micrograph and CT analysis. The investigations gain a deeper knowledge of the forming phenomena in the forming element and the deformation induced fibre failures.

2. Materials and Methods

2.1. Material Specification

The continuous fibre reinforced thermoplastic prepreg is composed of PP matrix material and glass fibre. The thermoplastic unidirectional GF/PP prepreg, which was purchased from the company BÜFA Thermoplastic Composites GmbH & Co. KG (Oldenburg, Germany), has the characteristics shown in Table 1.
For a detailed analysis of the forming process, the thermoplastic matrix PP BJ100 HP from Borealis [36], which is used in the prepreg material, is characterised.

2.2. Evaluation Methods

A metallographic specimen of the initial prepreg material was prepared using a Struers Rotopol grinding and polishing machine. Grinding took place using first 500 and then 1200 grid paper. Then, the sample surfaces were polished with a diamond suspension with a grain size of 9, 3 and 1 μ m , respectively. Between each polishing step, the sample was cleaned in a isopropanol bath using an ultrasonic cleaner. The micrograph of the used GF-PP prepreg can be seen in Figure 6.
For the analysis of the inner material structure, CT analysis is used. In contrast to the micrograph, the analysis is not limited to one fixed section plane. Instead, the resultant 3D model allows the investigation of the whole specimen. This enables a holistic interpretation of the phenomena occurring in the forming zone. The evaluation of each scan is carried out with the software VGSTUDIO MAX 3.4. The specifications of the measurements are shown in Table 2 and Table 3.

3. Experimental Setup

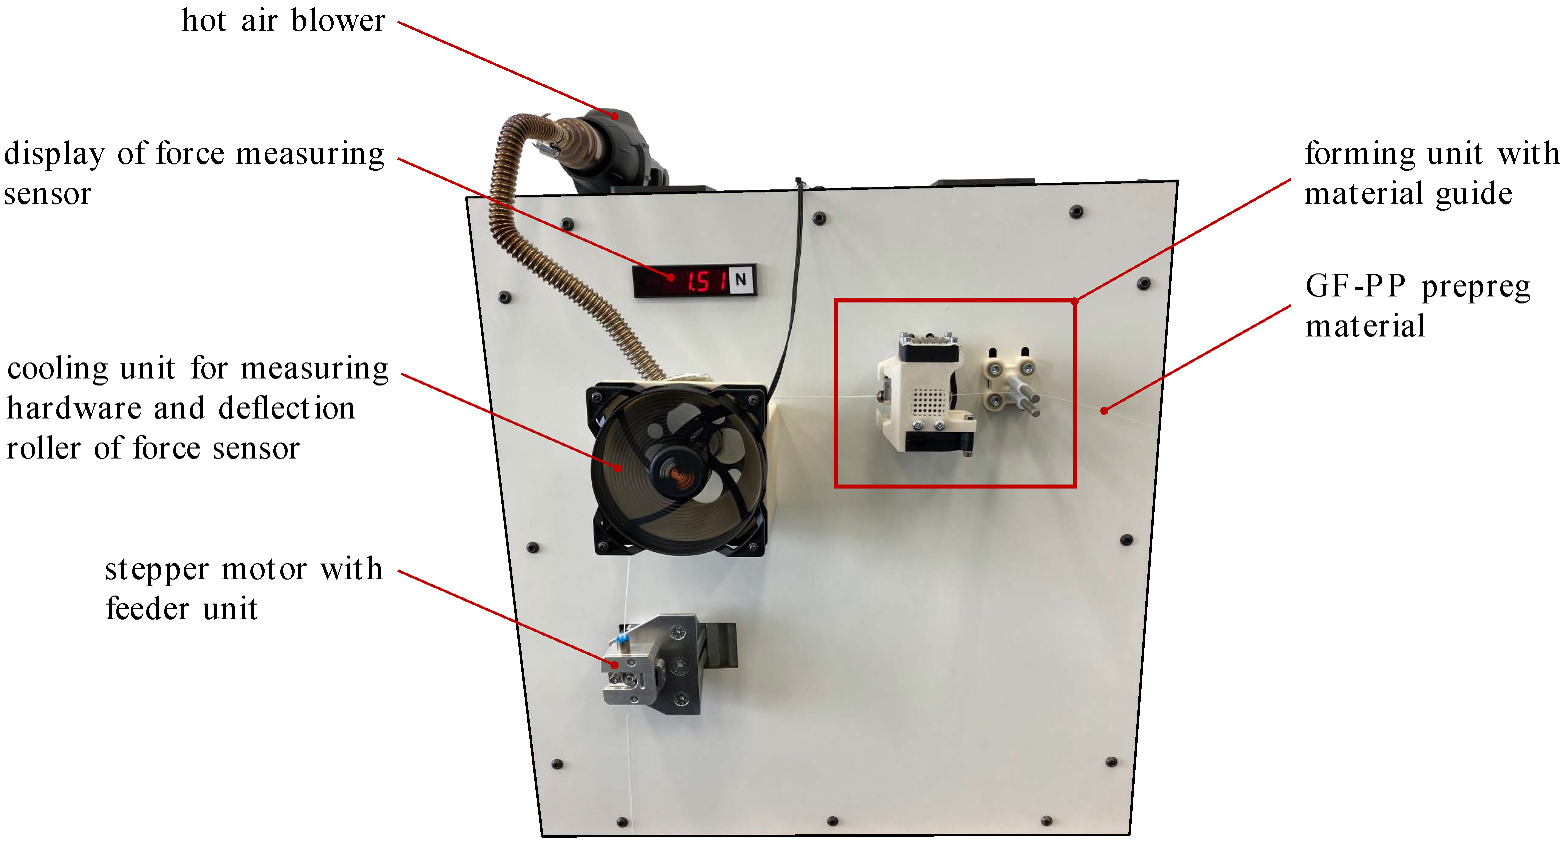
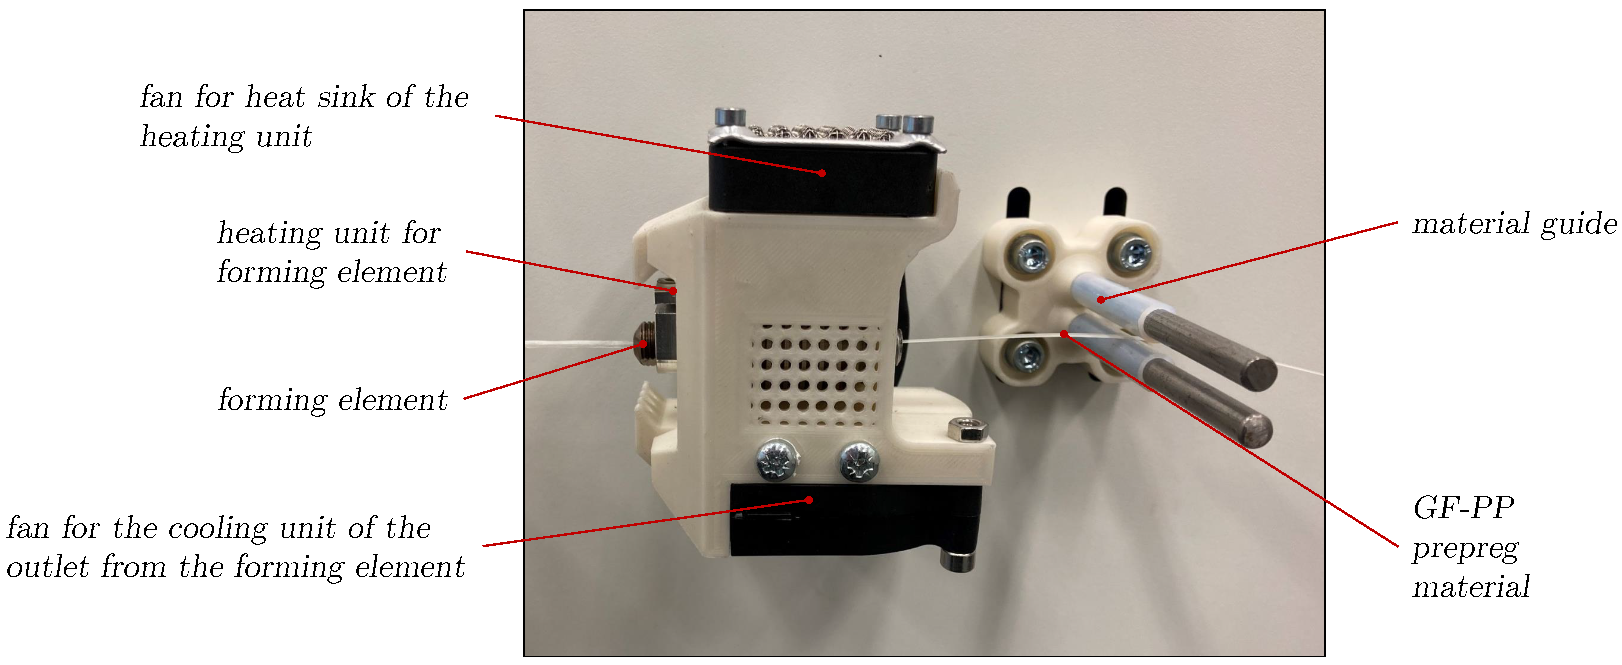
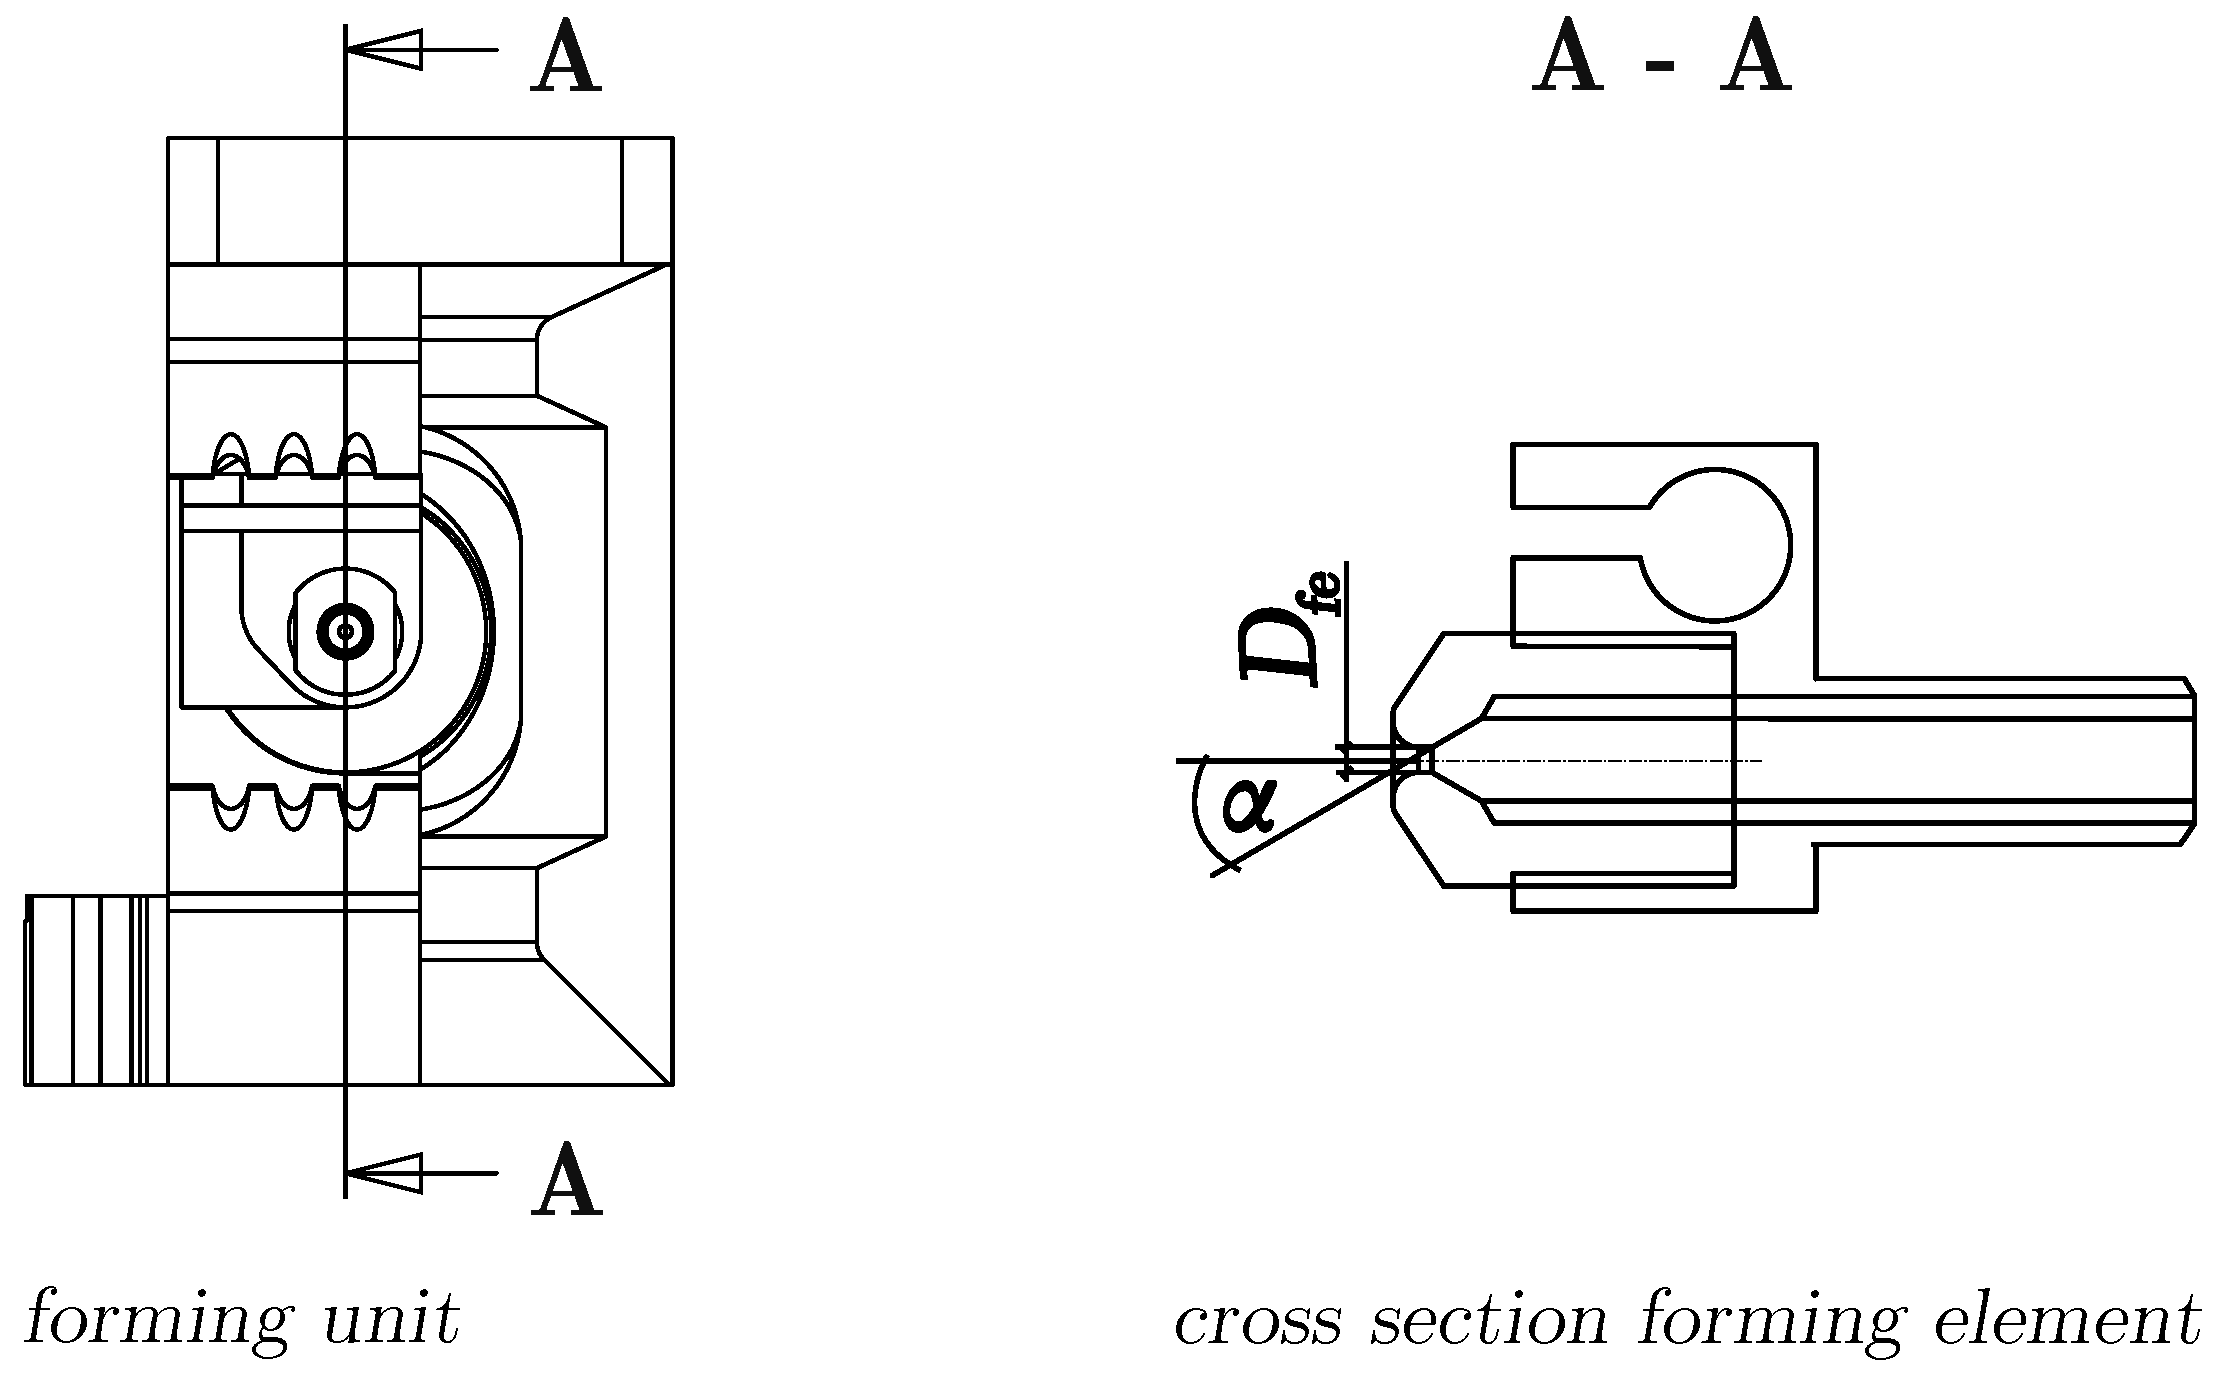
3.1. Equipment for Fibre Bundle Deformation Studies

A pultrusion test rig has been developed for determining prevailing forming forces of prepregs in a pultrusion process. These forming forces occur when the material is drawn through the heated forming element. Essentially, the speed and temperature as well as the degree of forming of the material are decisive for high or low forming forces. The test rig allows the temperature of the forming unit to be regulated or the pull-off speed to be adjusted by means of a stepper motor with a travel counter system. In addition, the forming element outlet can be cooled and the deflection point of the force measurement unit is heated by a hot air system so that the measurement accuracy is not affected by any buckling of a solidified profile. The high wrap angle of the continuous fibre material and the deflection roller of the force sensor make it possible to measure very low forces.
Figure 2 shows the deformation test rig with all associated modules. The stepper motor with feeder unit, which realizes the take-off movement of the material to be formed by a predetermined speed and a clamping device for the continuous thermoplastic prepreg. The cooling unit for the measurement hardware which prevents the force sensor from overheating due to the hot air blower. A display on the test rig which makes it possible to see the currently acting deformation forces during the process and the forming unit, which is shown in detail in Figure 3.
The most important component of this deformation unit is the forming element. Here, the initial cross-section of the prepreg material is converted into a round or annular cross-section. The forming element diameter in relation to the cross-sectional area of the initial material defines the degree of deformation and the resulting cross-section. Figure 4 shows a top view of the forming unit and a sectional line running through the forming element. In the sectional view, the forming element is shown in detail. This element essentially depends on the diameter of the forming element D f e and the forming angle α ; while the diameter varies, the forming angle is constant at 30°.

3.2. Experimental Investigations

In order to evaluate the forming forces during pultrusion, five different test series were planned and realised. The parameters used for the deformation studies are shown in Table 4. Due to the variation of different temperatures for mechanical joining processes, the range between 200 °C to 220 °C is chosen. For example, embedding inserts [3] are carried out at 200 °C and thermoclinching at 210 °C [37] for GF/PP. In addition, the pulling speed is in the same order of magnitude as these joining processes [3,38].
The first series represents the forming force of the prepreg material at room temperature (23 °C). Due to the solidified state of the matrix, kinking is the dominant phenomena while forming. As a consequence of the forming element diameter D f e of 1.2 mm, the achieved deformation ratio is small. Deformation ratio means, in the present paper, the ratio of the initial cross-section of the prepreg material to the final cross-section of the pultrudate. If the ratio is small, this means that the initial material is subjected to a moderate forming force, as a certain oversize of the exit cross-section of the forming element is ensured. The second series of tests was carried out at a forming element temperature of 200 °C, a forming element diameter of 1.2 mm and staggered pull-off speeds as shown in Table 4. In the following test series, the temperature of the forming element is increased by 10 °C per series up to 220 °C and then the diameter of the forming element is reduced to 0.9 mm so that the degree of forming increases. Due to the cross-section area of the forming unit ( 0.64 mm2) and the prepreg ( 0.75 mm2), the thermoplastic melt must be stripped in the forming element so that a compacted pultrudate can be discharged.

4. Results

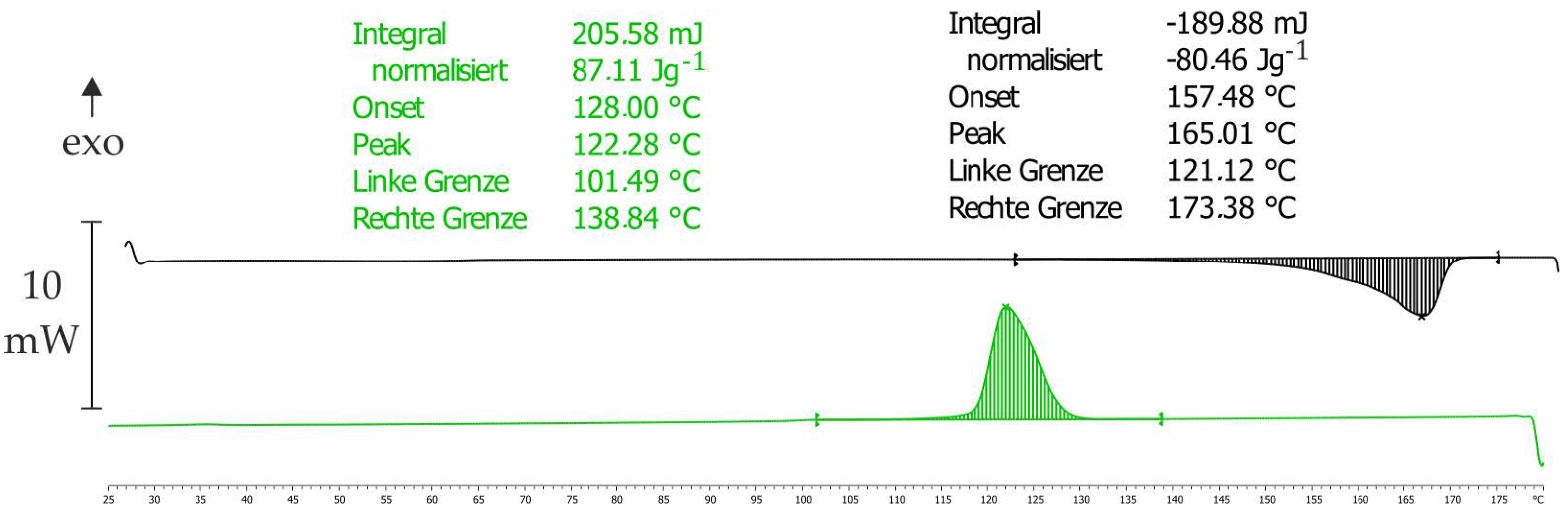
4.1. Characterization of the Thermoplastic PP Matrix

For the identification of process temperature parameters, a differential scanning calorimeter (DSC) measurement is carried out with the PP BJ100-HP from Borealis [36], which is also used in the prepreg.
The experimental results can be seen in Figure 5. The specimen of the pure matrix is heated up with a heating rate of 10 K/min (black curve) from room temperature to 180 °C and cooling rate of 10 K/min (green curve). The melting temperature (black curve) is around 165 °C, and the PP is fully melted at 173 °C. The DSC is conducted with the METTLER Toledo TGA/DASC 3+. Due to the determined material parameters of the matrix and given material parameters of the prepreg [35], it can be assumed that the BJ100-HP PP is similar to the applied matrix in the prepreg.
The temperature dependent zero dynamic viscosity η 0 is given in Table 5. The dynamic viscosity determines the viscous force against shear load. In conclusion, with decreasing viscosity, the forming forces decrease and the deformation behaviour changes.
The viscosity is measured by an oscillating approach with a shear deformation γ ˙ of 1% at the given temperature levels and an angular velocity ω of 0.0188 rad/s. The experiments are carried out with the Anton Paar MCR-502S parallel-plate rheometer.

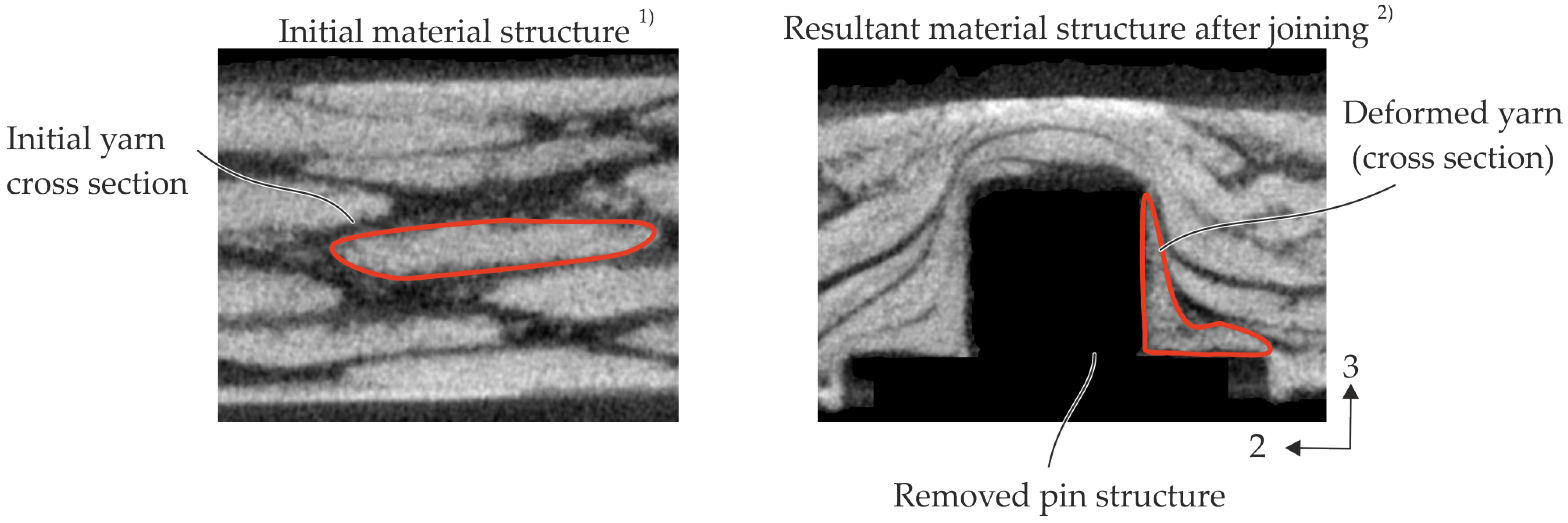
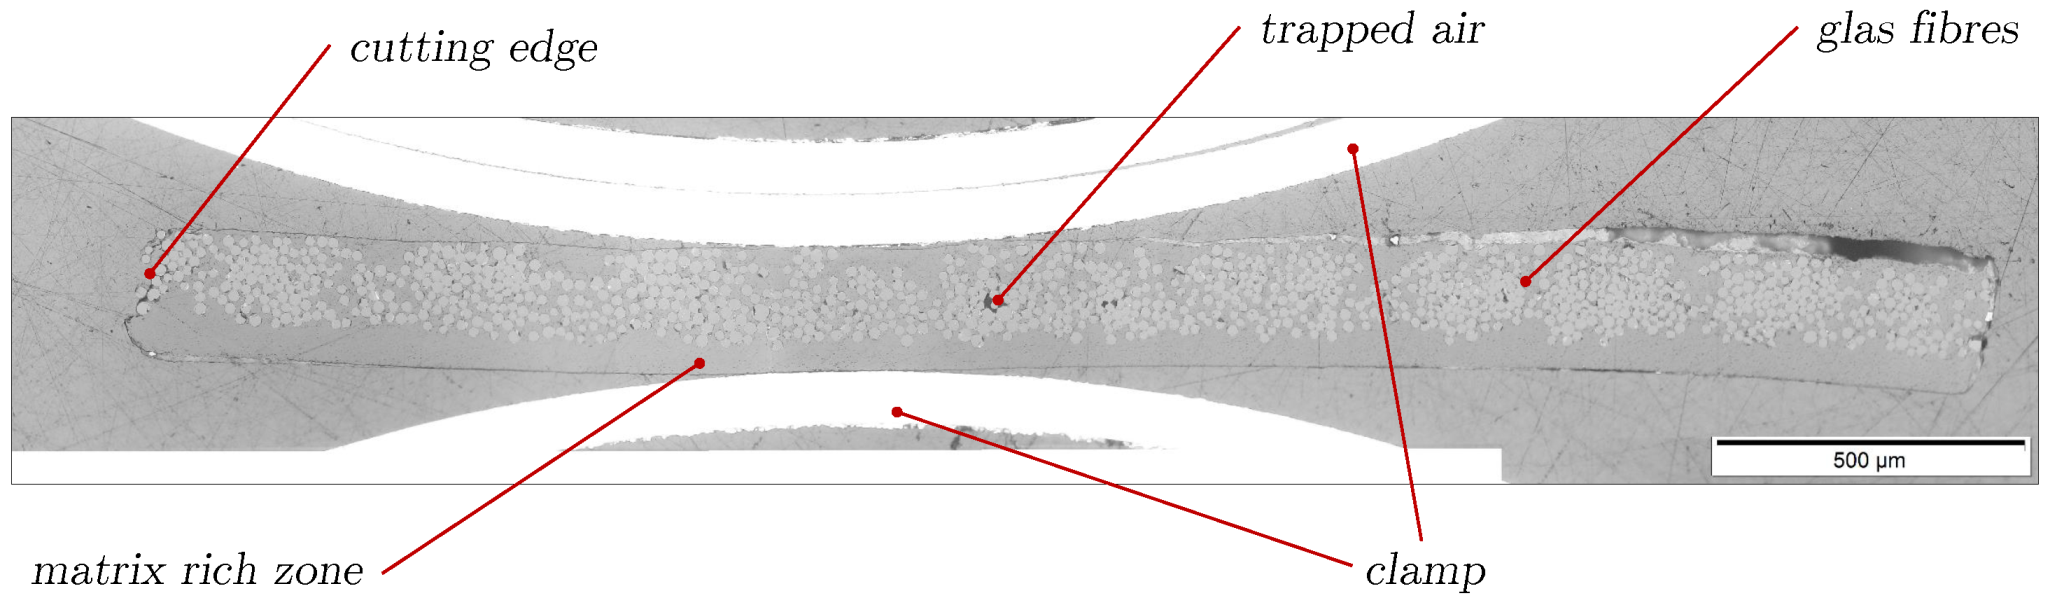
4.2. Evaluation of the Microscopy Image and CT Reconstruction Data of the Input Material

The initial cross-section of the GF-PP prepreg was examined by a micrograph analysis to asses the quality of the semi-finished material; see Figure 6. A homogeneous distribution of the fibres at the top side can be detected, whereas, at the lower side of the prepreg, a matrix rich zone with constant thickness is evident. The dimensions of the prepreg are 0.25 mm in thickness and 3 mm in width. The cross-sectional area A p r e p r e g results to 0.75 mm2. The filament diameter of the GF is assumed to be 15.6   μ m (N = 33) with standard deviation of 1.31   μ m determined by measurements of a detailed micrograph of the cross section (magnification of objective 50×).
The initial material structure from the CT reconstruction data shows a matrix rich zone on the upper side of the prepreg and an inhomogeneous distribution of the fibres in the cross-sectional area (Figure 7). In addition, some voids are detectable in the middle of the cross sections, which agrees very well with the micrograph analysis.

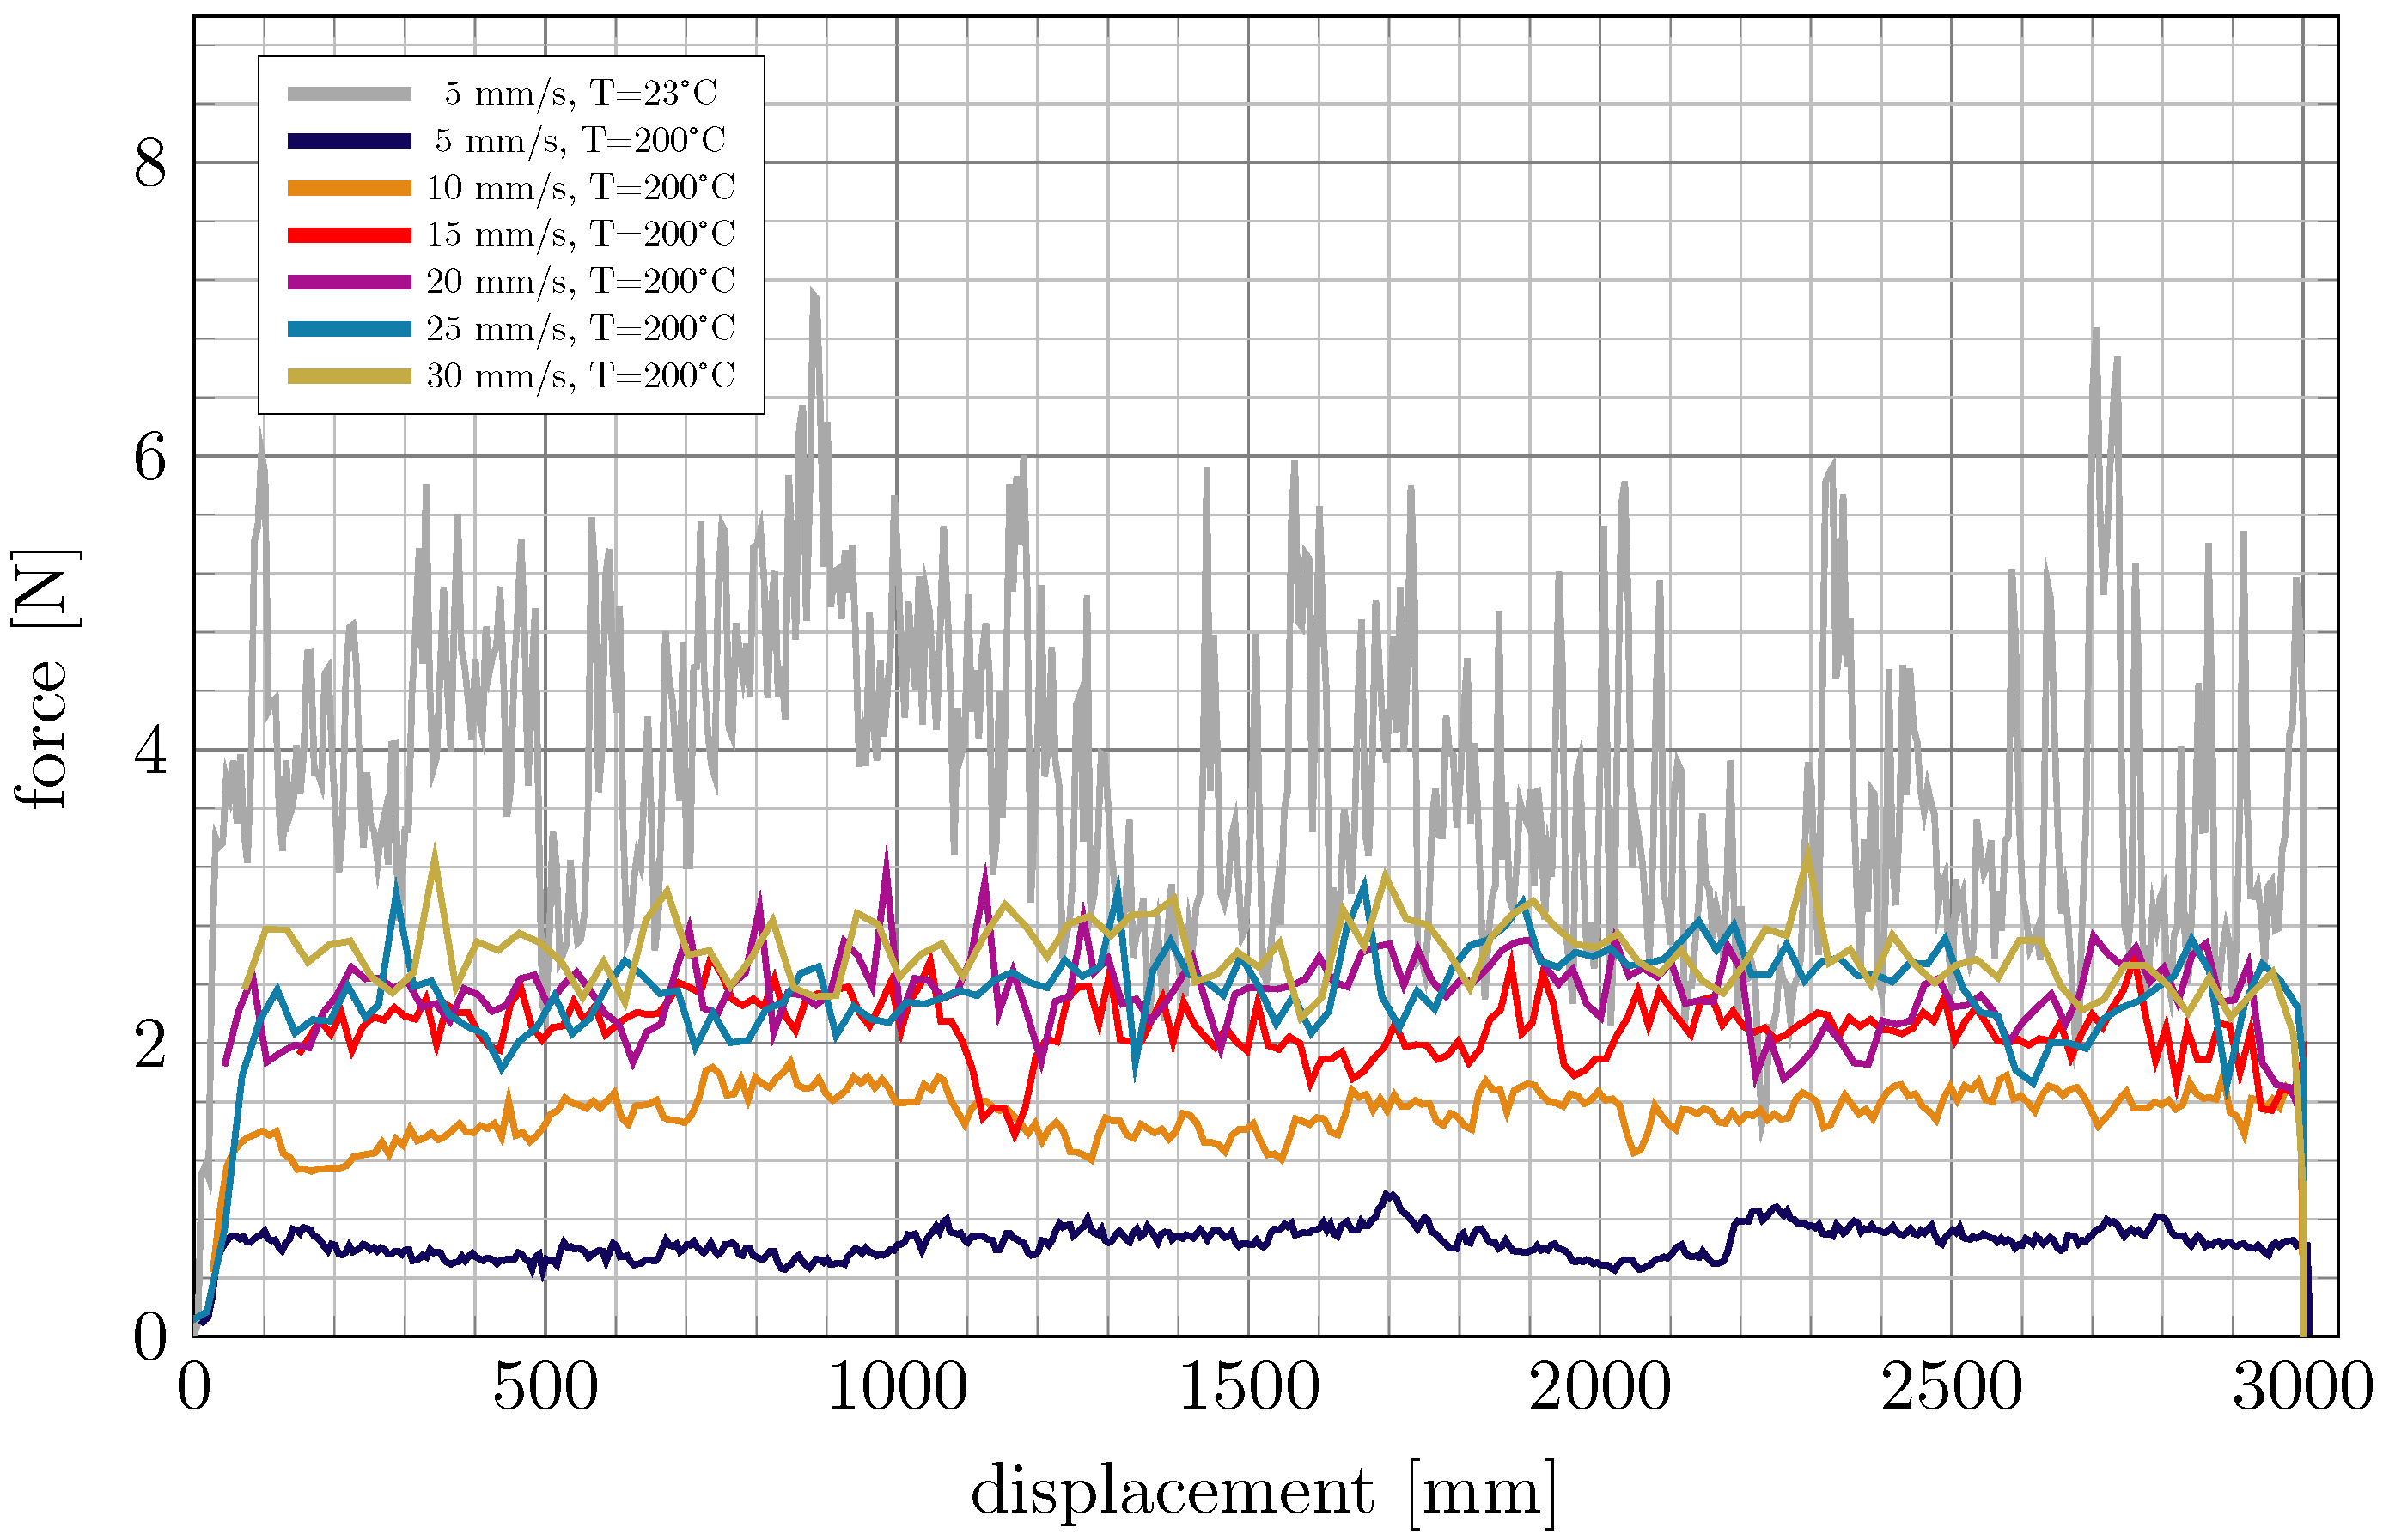
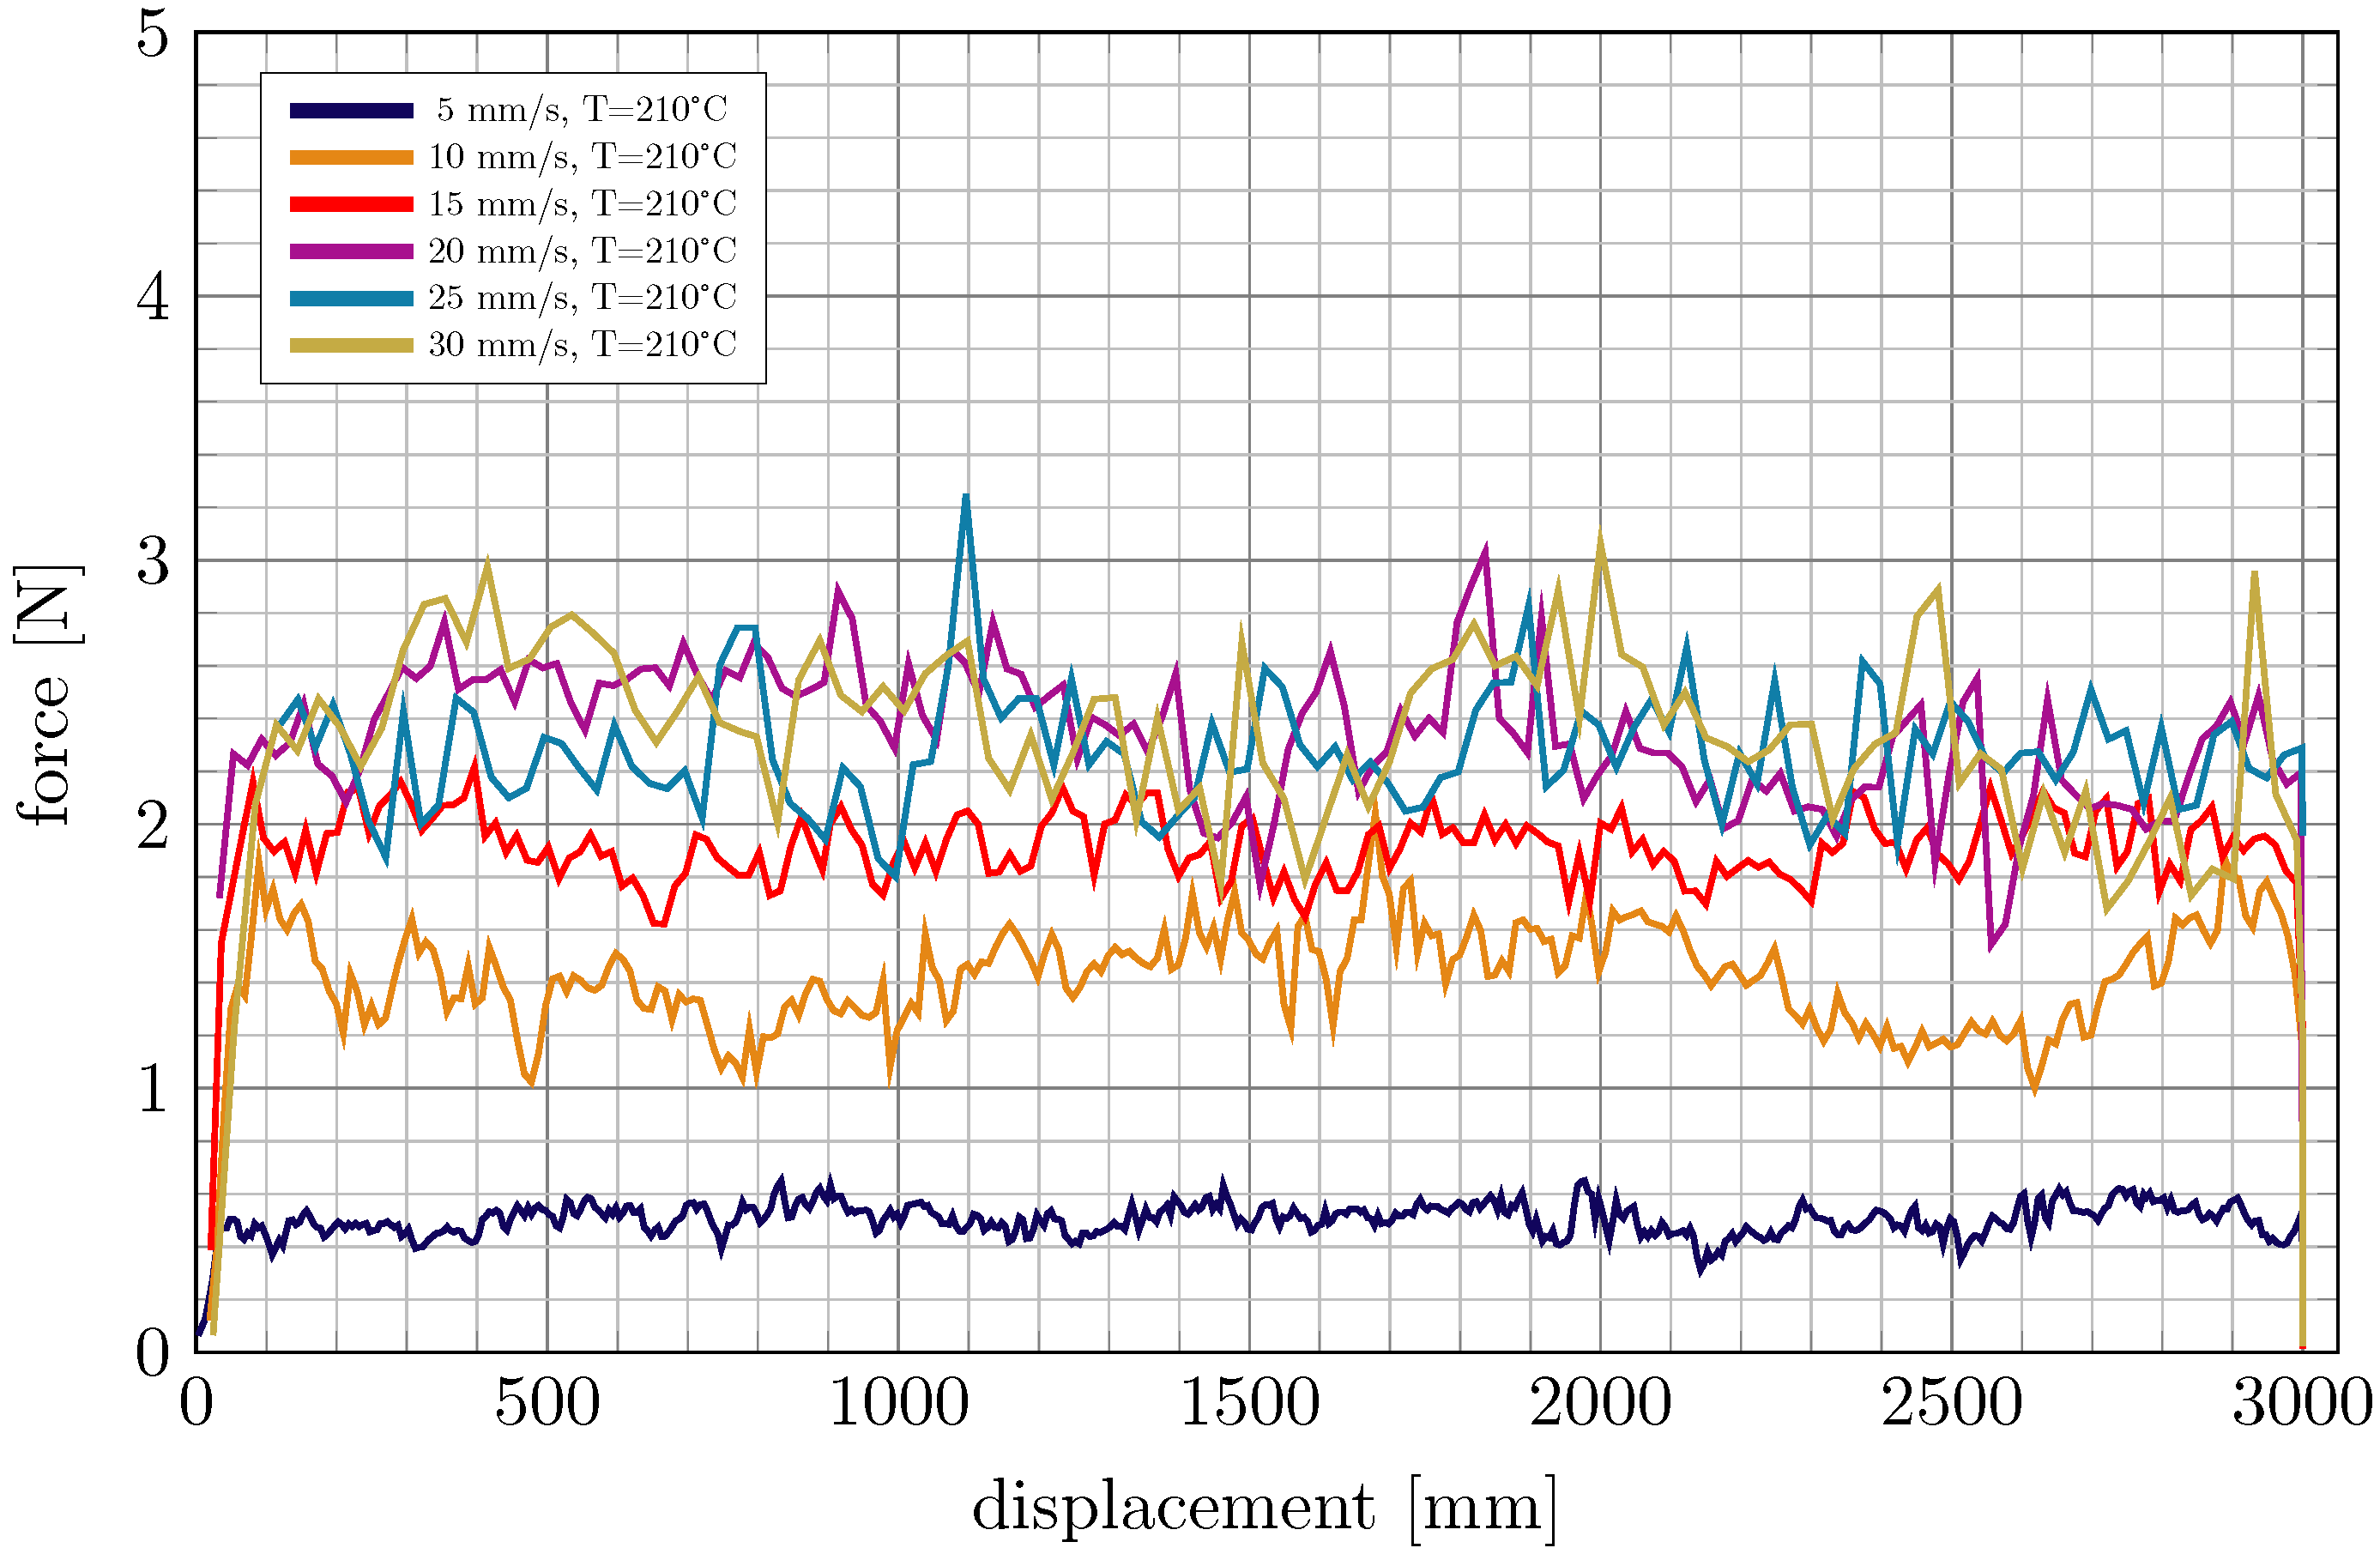
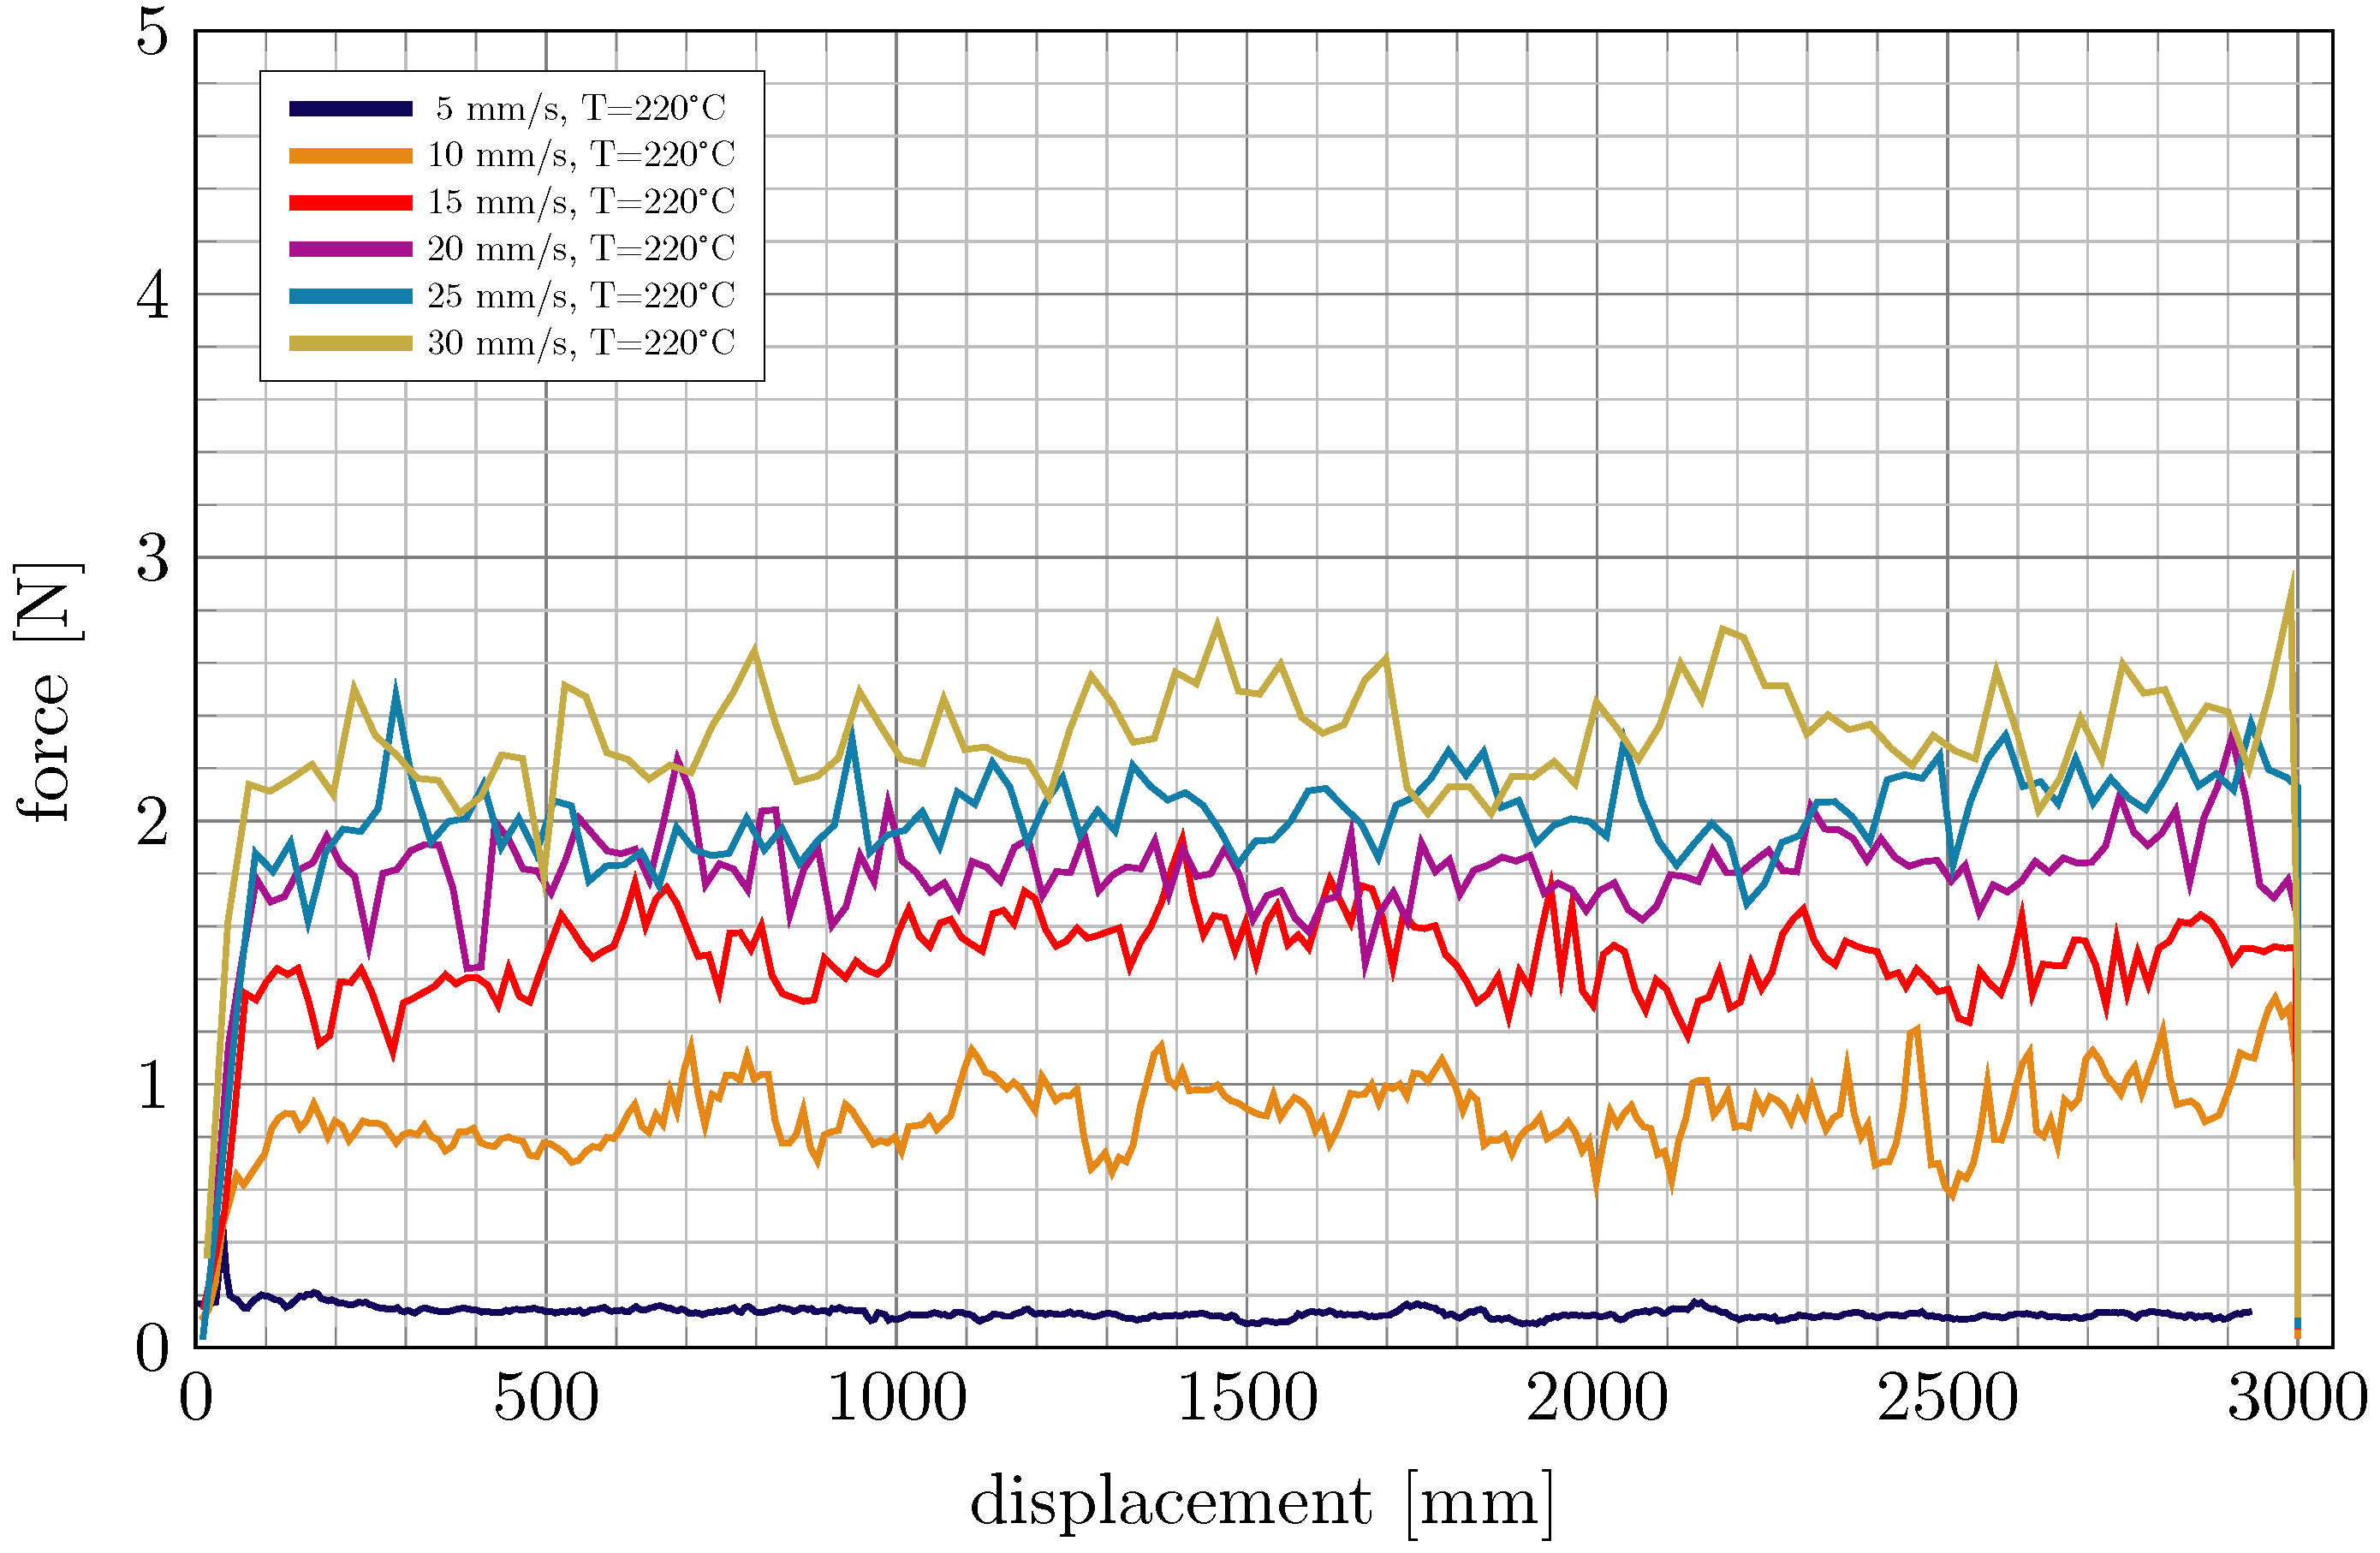
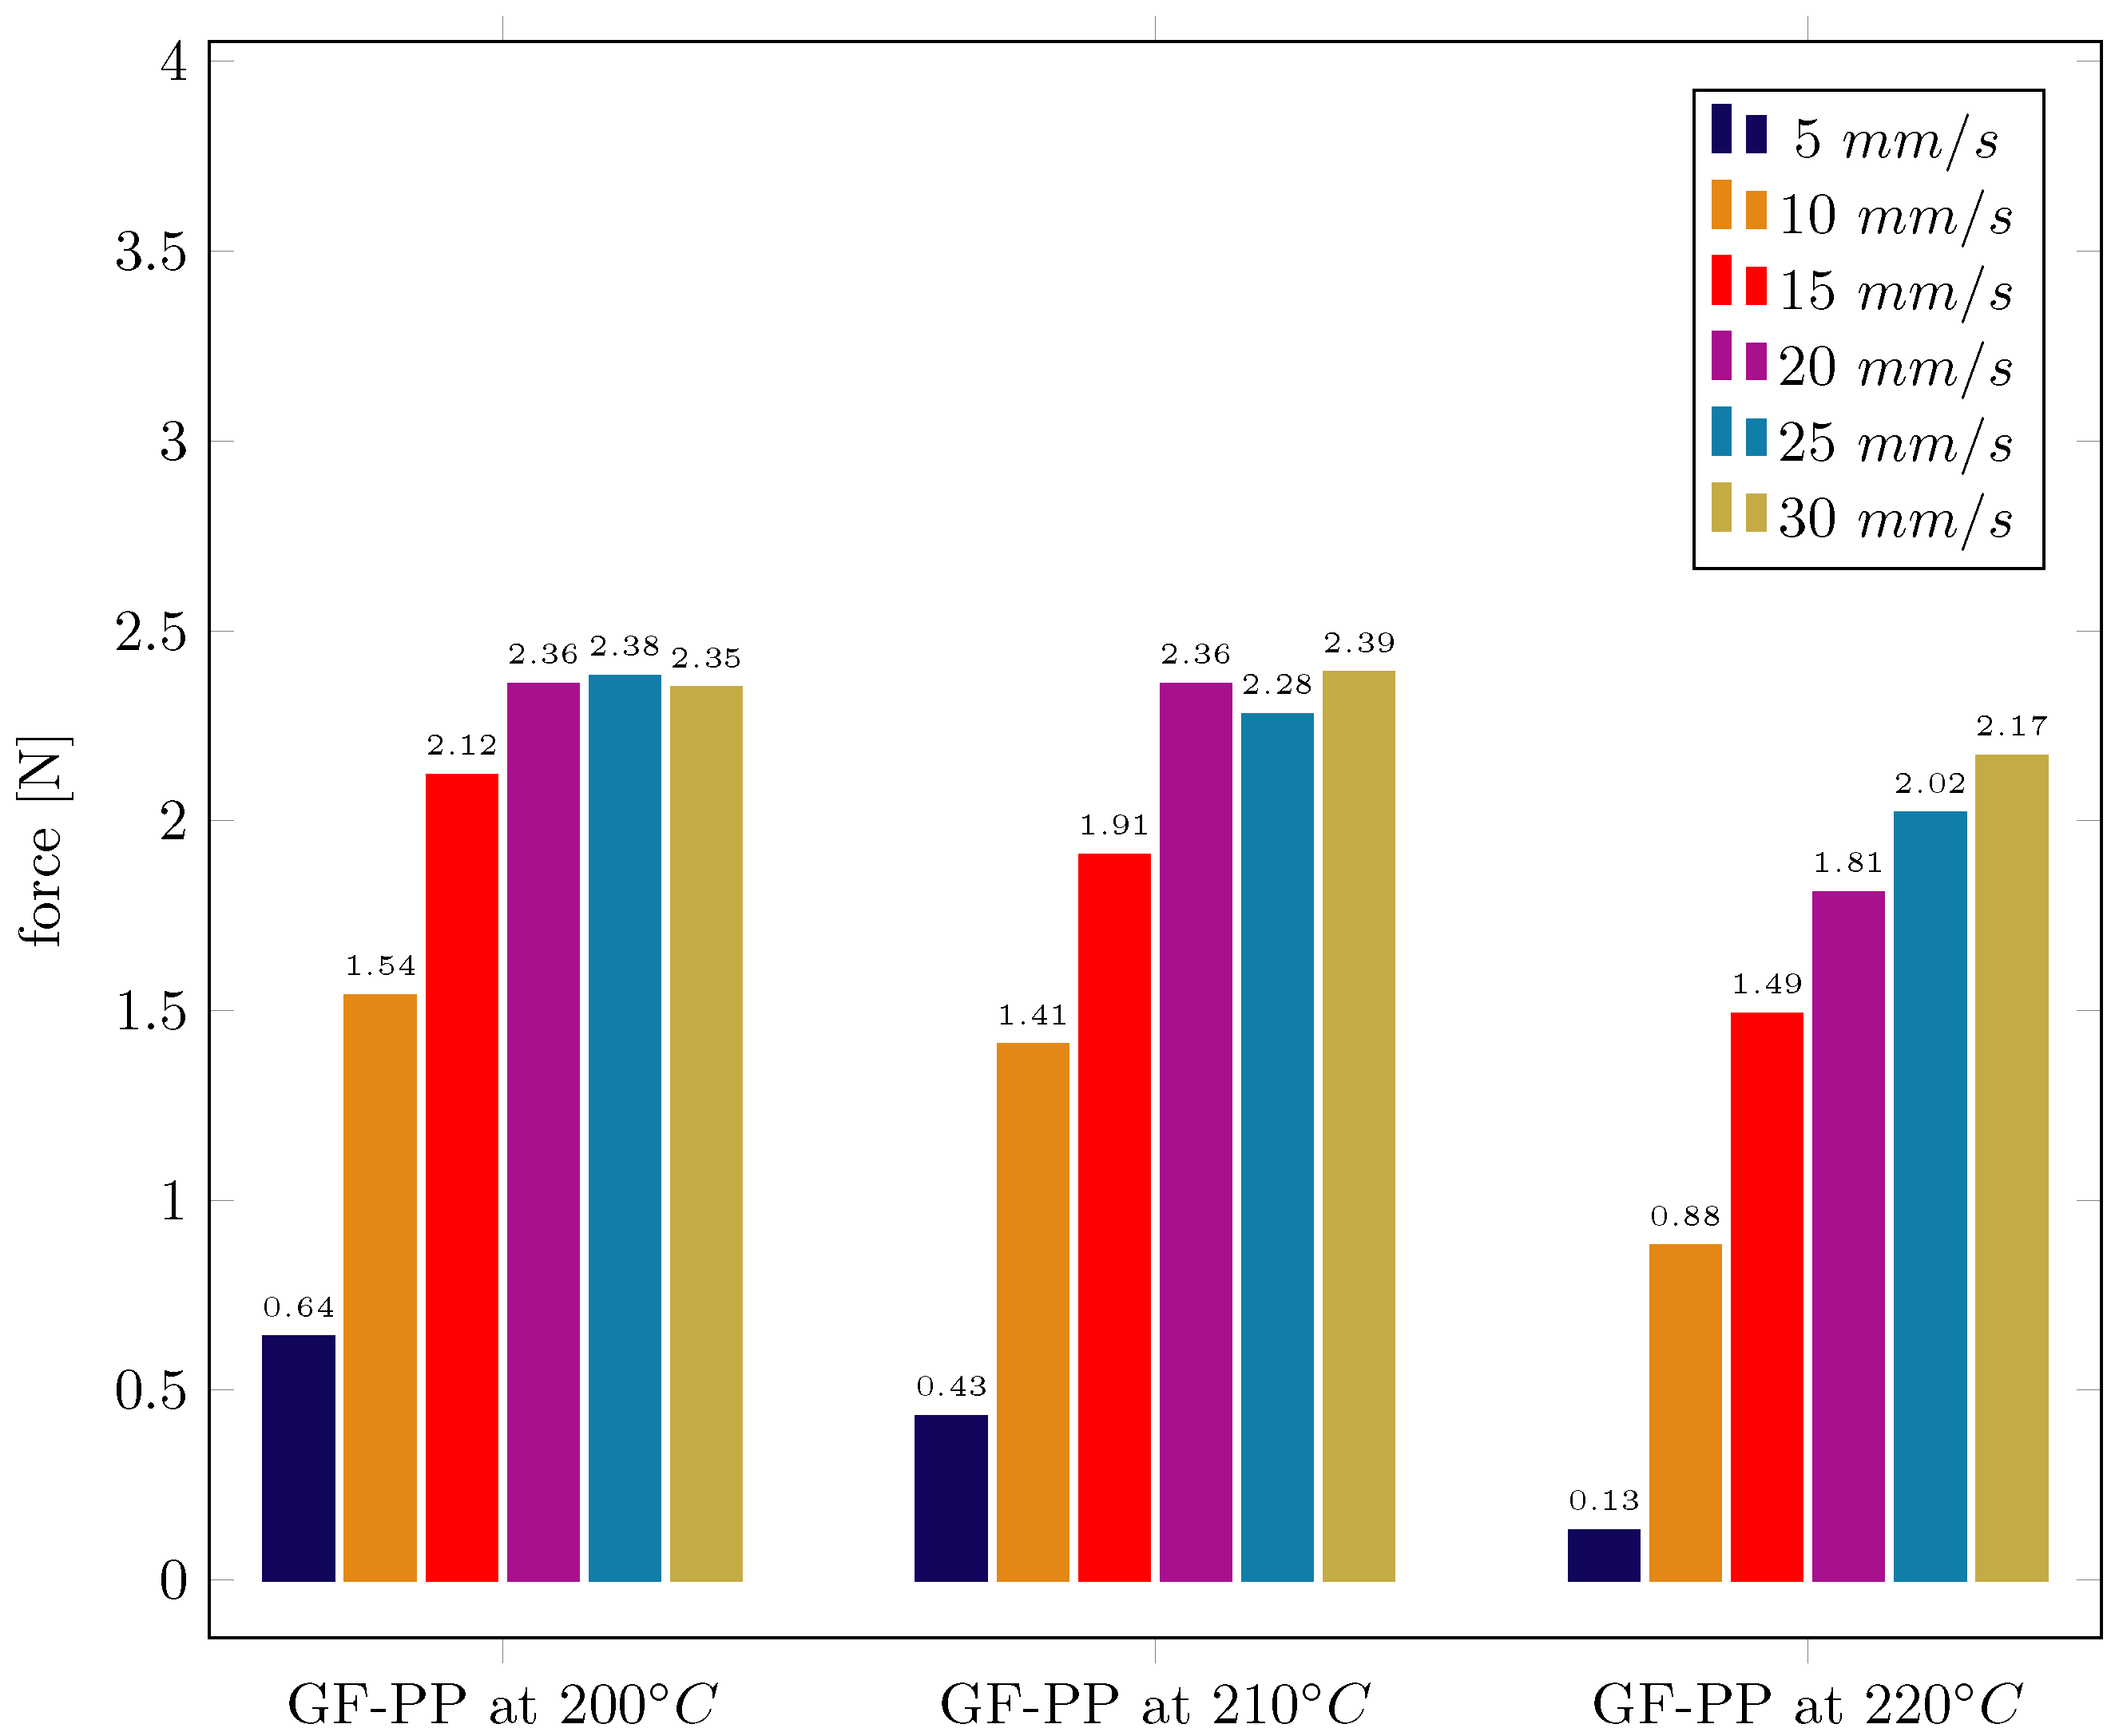
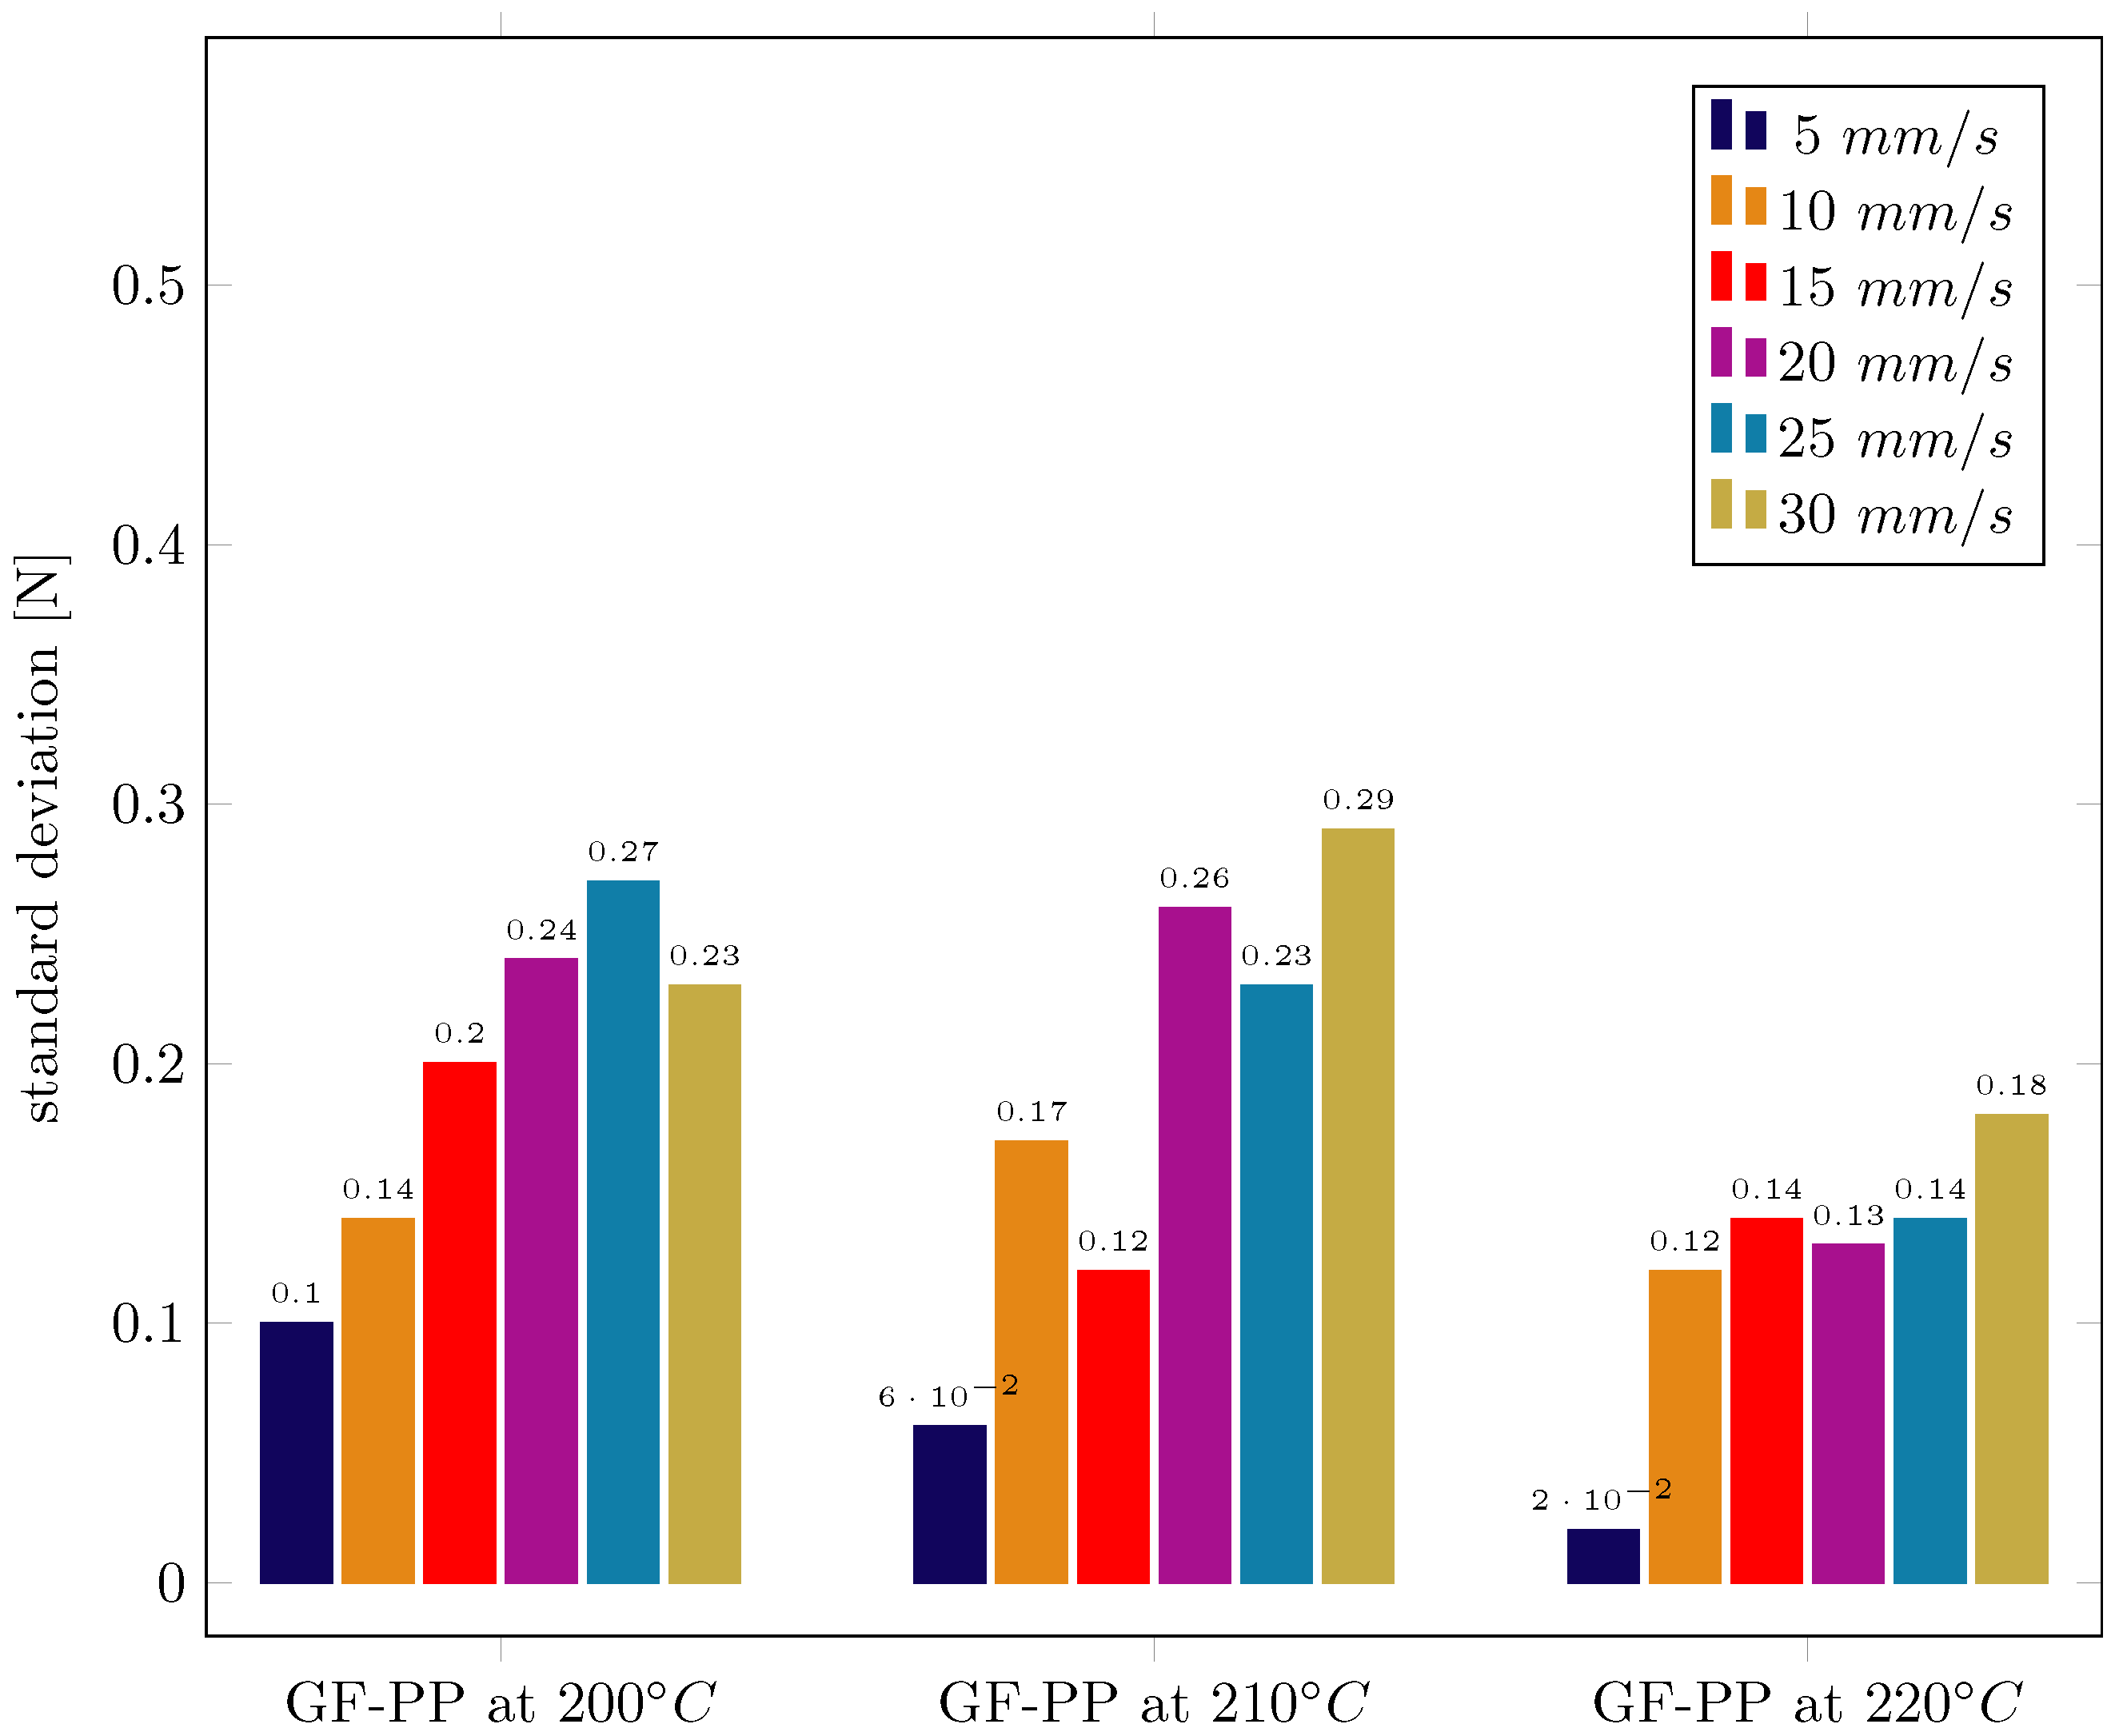
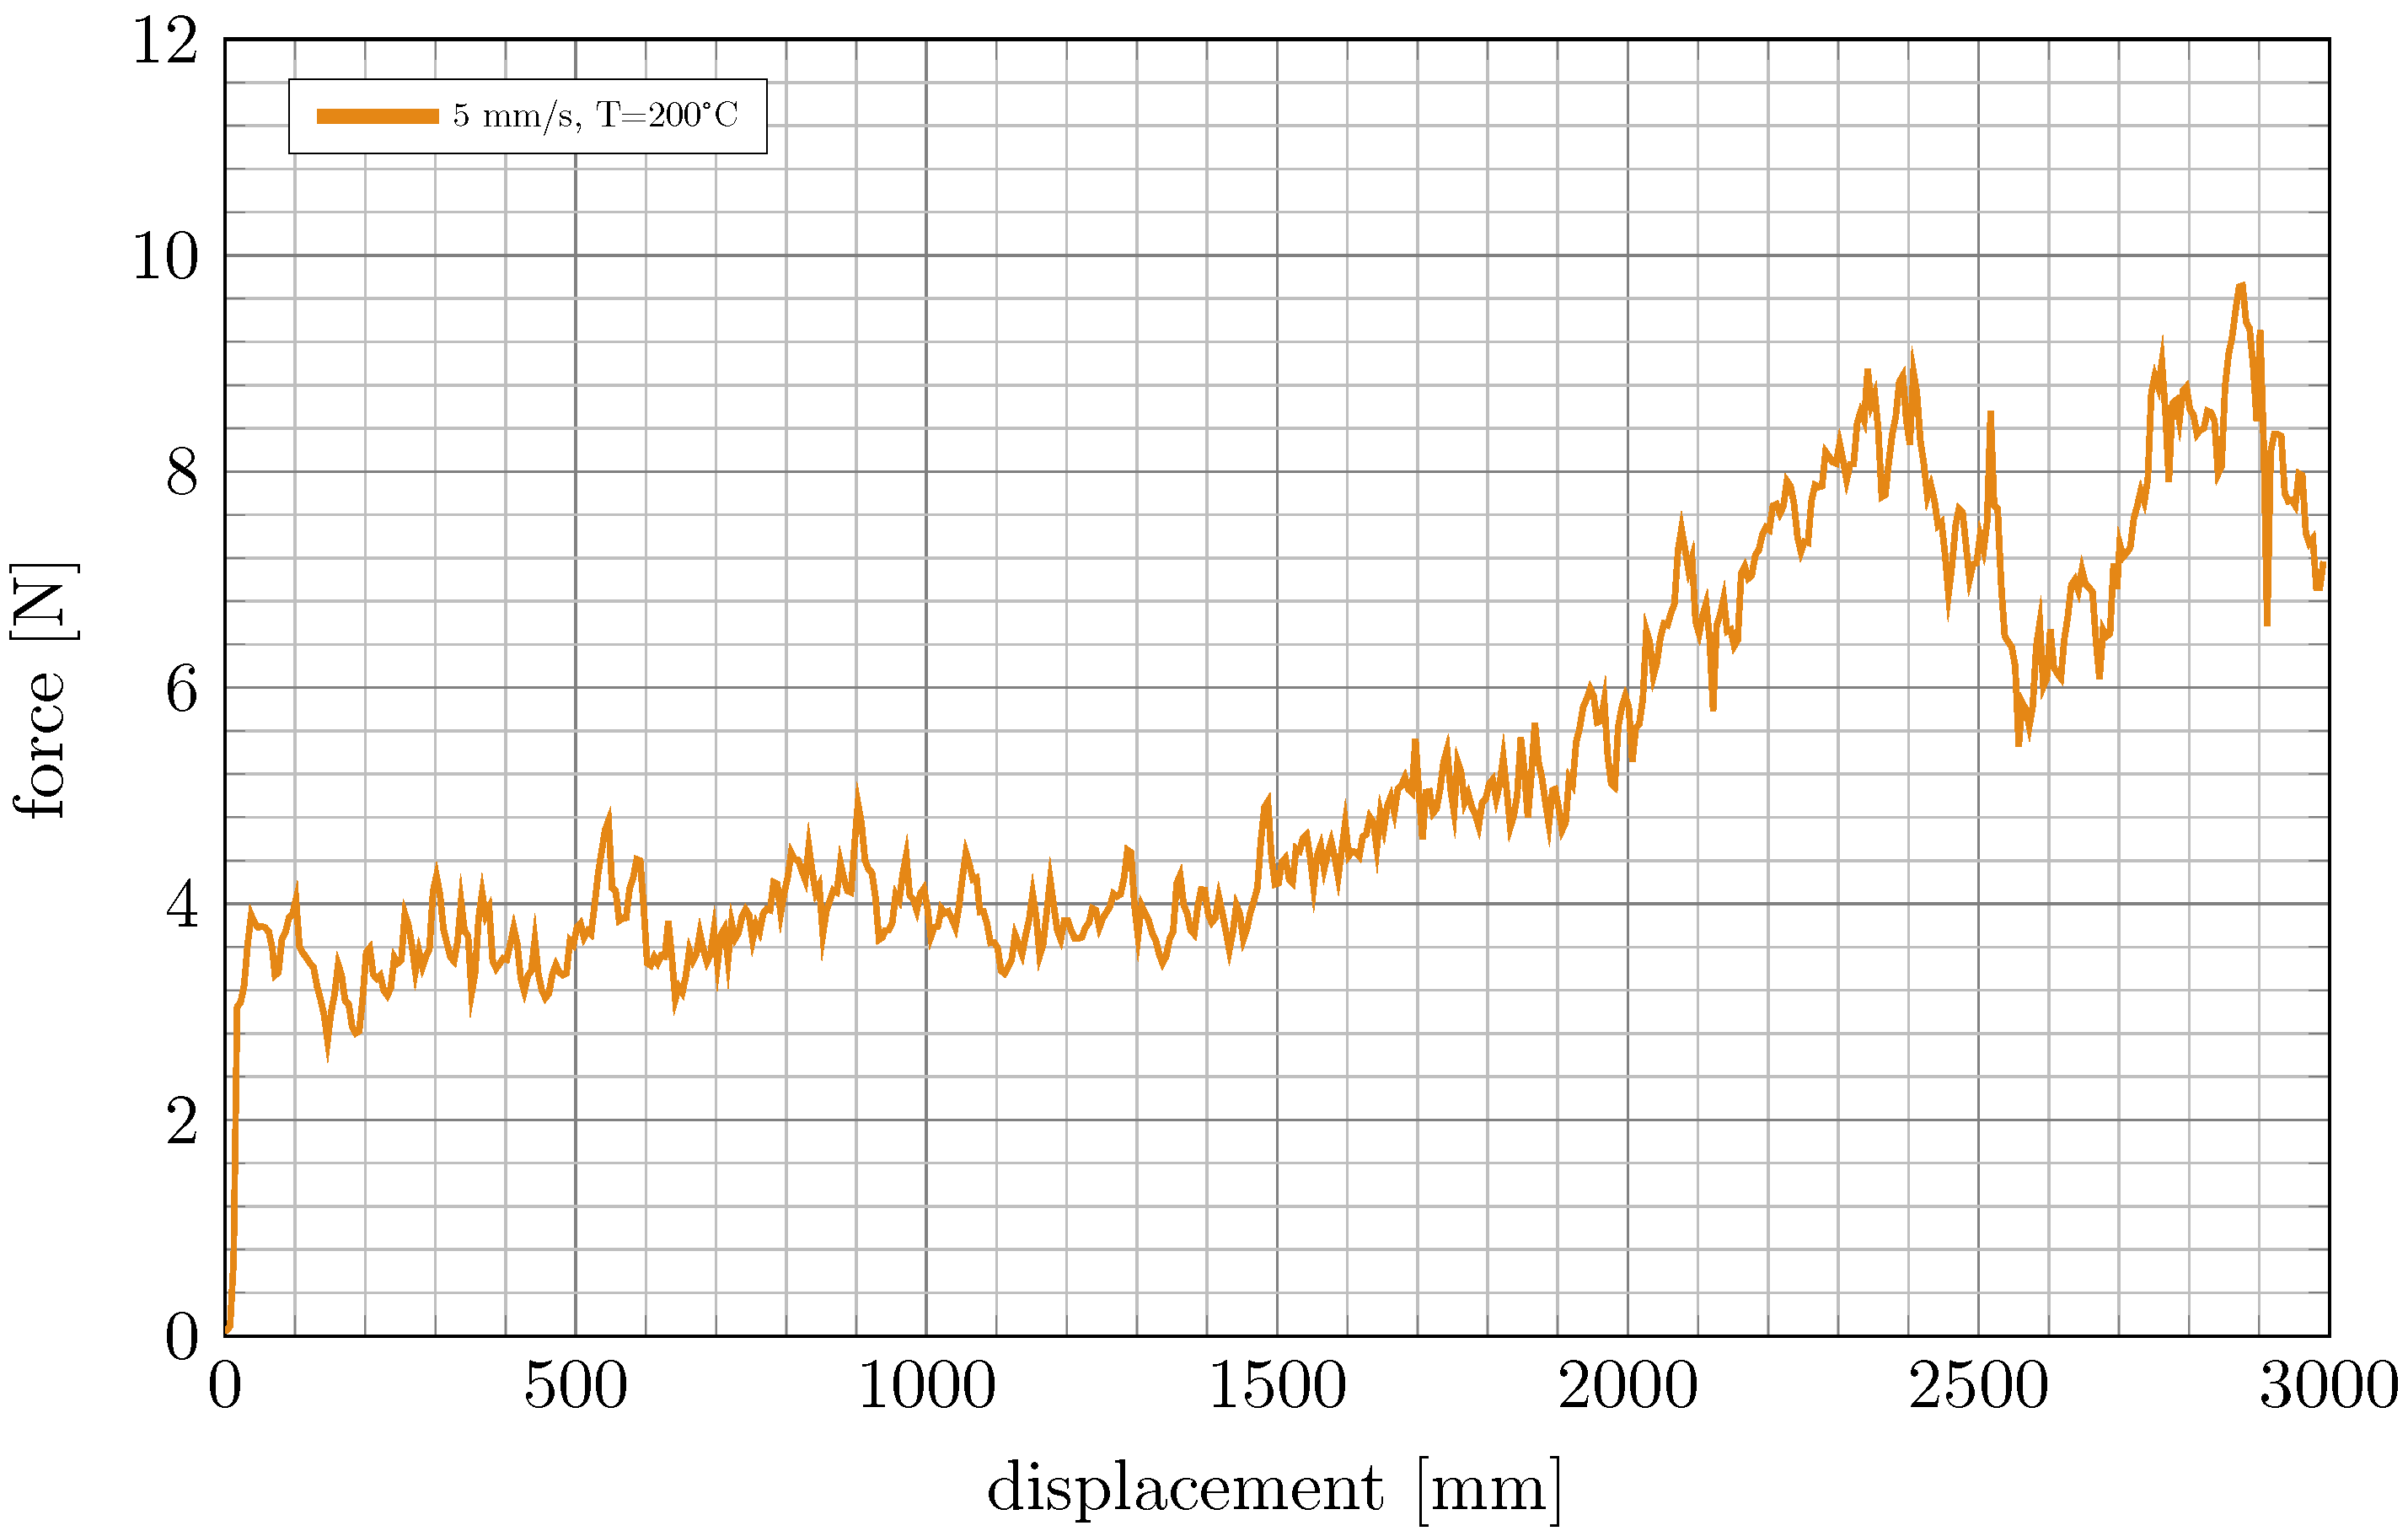
4.3. Results of the Forming Behaviour Using the Forming Element with Diameter 1.2 mm

The experimental results are carried out with the given process parameters while the pulling force is measured. For each parameter set, 3 m of prepreg is pulled along the forming unit. The force is plotted against pulling displacement and the calculated average and deviation values are based on the measured forces between 250 mm to 2750 mm displacement. At first, a pultrusion at room temperature of 23 °C is carried out (Figure 8 grey). It can be seen that the force increases strongly at the beginning of the process. Afterwards, the force oscillate around 4 N and deviate from approx. 1.3 N up to 7.2 N. In these process conditions, it is clear that no steady state of the forming process could be realised. Based on the pultrusion at 23 °C, the forming process via pultrusion at 200 °C shows lower pulling forces and less deviation at all pulling speeds. The pulling speed between 15 mm/s to 30 mm/s shows only slight differences for both the force level and the deviations. However, the curves for 5 and 10 mm/s in Figure 8 have a small force deviation with an average value in the steady state of 1.54 N for 10 mm/s and 0.64 N for the lowest pulling speed. In addition, the curve of the lowest pulling speed looks homogeneous. This can be explained by the different deformation behaviour in the forming unit due to the heat input in comparison to the higher velocities. A low pulling speed means that the prepreg product can remain longer in the forming element and thus the viscosity of the thermoplastic matrix drops to its minimum value due to the longer heat exposure in the forming area, so that ultimately lower deformation forces occur.
The force–displacement curves of the 210 °C in Figure 9 have similar values for the average pulling force at the velocities of 20 mm/s to 30 mm/s. In comparison to the 200 °C curves, the pulling speeds from 5 mm/s to 15 mm/s show more influence on the forming forces. Due to the higher temperature, the heat flux to the prepreg material increases, which leads to more ductile matrix behaviour with decreasing viscosity (cf. Table 5) and therefore a change in resultant forming behaviour of the prepreg. The homogeneity of the process also increases for this temperature range. With a focus on the lowest speed, the force decreases significantly.
The force–displacement curves at 220 °C differ for every pulling speed (Figure 10). This is in contrast to the other temperature sets presented before. Every process configuration shows another force level but still a high deviation of the force and, therefore, a low level of homogeneity. It can be concluded that the heating up to 220 °C also leads at high pulling velocities to a change of the forming behaviour due to the more fluid-like matrix. It is also evident that, at 5 mm /s, the forming force is homogeneous for the whole process and in comparison to the other setups the most reduced.
For a better comparison of the different process settings, the average force is illustrated in Figure 11 and can be considered as the necessary force level to pull the prepreg through the forming element. In Figure 12, the deviation is shown to assess the homogeneity of the forming process. The influence of the velocity for each temperature can be seen. For the temperature set of 200 °C and 210 °C at a pulling speed of 20 mm/s to 30 mm/s, the forces are similar. In addition, the deviations differ insignificantly. With decreasing pulling speed, the forming force decreases and, in almost all cases, also the deviation. This tendency can be observed for all temperature sets. In particular, at 220 °C, for decreasing velocity, the force level decreases for every velocity. The forming forces for 25 mm/s to 30 mm/s just slightly decrease over all temperatures. It can be concluded that the forming process for these velocities leads to similar phenomena. The forming phenomena and resultant material structure can only be evaluated with CT analysis. By comparing the influence of the temperatures, it becomes evident that the forming processes becomes more uniform in general with increasing temperature and also the force level is reduced. The reduction of deformation force for temperatures from 200 °C to 210 °C ( 33 % ) and 220 °C ( 80 % ) for 5 mm/s shows significant stress reduction in the fibres. When focusing on the homogeneity, pulling velocities of 10 mm/s to 30 mm/s around the deviation of the force are achieving a threshold around 0.14 N.

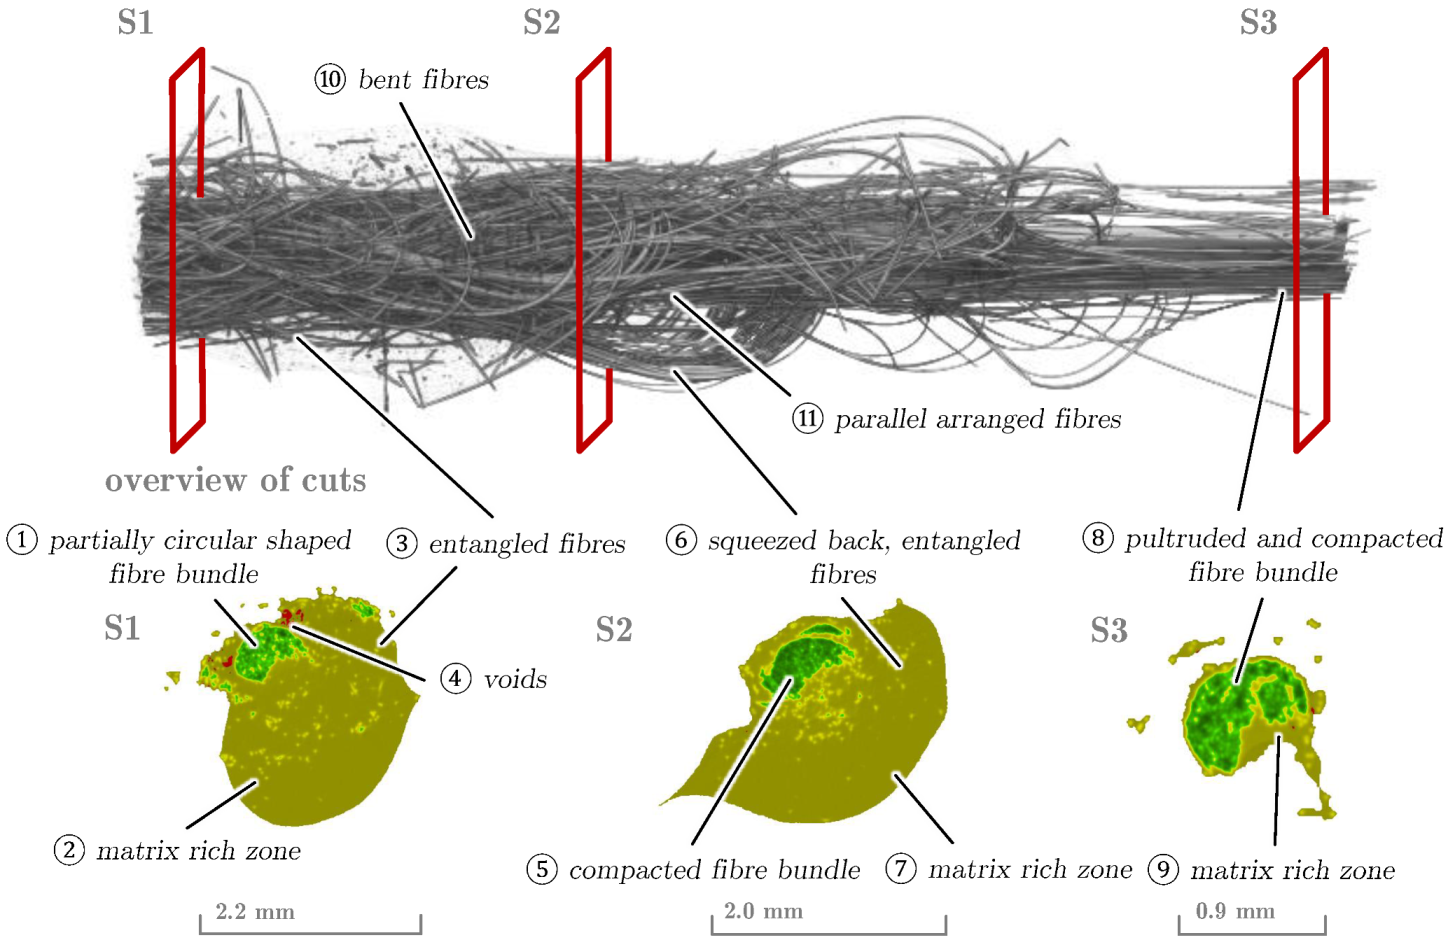
4.4. Results of the Forming Behaviour Using the Forming Element with Diameter 0.9 mm

For the second forming element configuration, just one experimental setup is carried out (Figure 13). Due to the cross section area of the forming element of A =   0.64 mm2, the prepreg became stuck. Due to the smaller cross section area, fibres and matrix are stripped off and, after a critical amount, the required deformation forces exceed the maximum force of the clamping mechanism in the feeder unit. The pregreg remains stuck until the stripped fibres are rearranged. The measured deformation force decreases meanwhile, until the required force is below the clamping mechanism force. Afterwards, the pultrusion process continues since the prepreg became stuck again. It has to be mentioned that the stepper motor also counts the displacement during the stuck state.

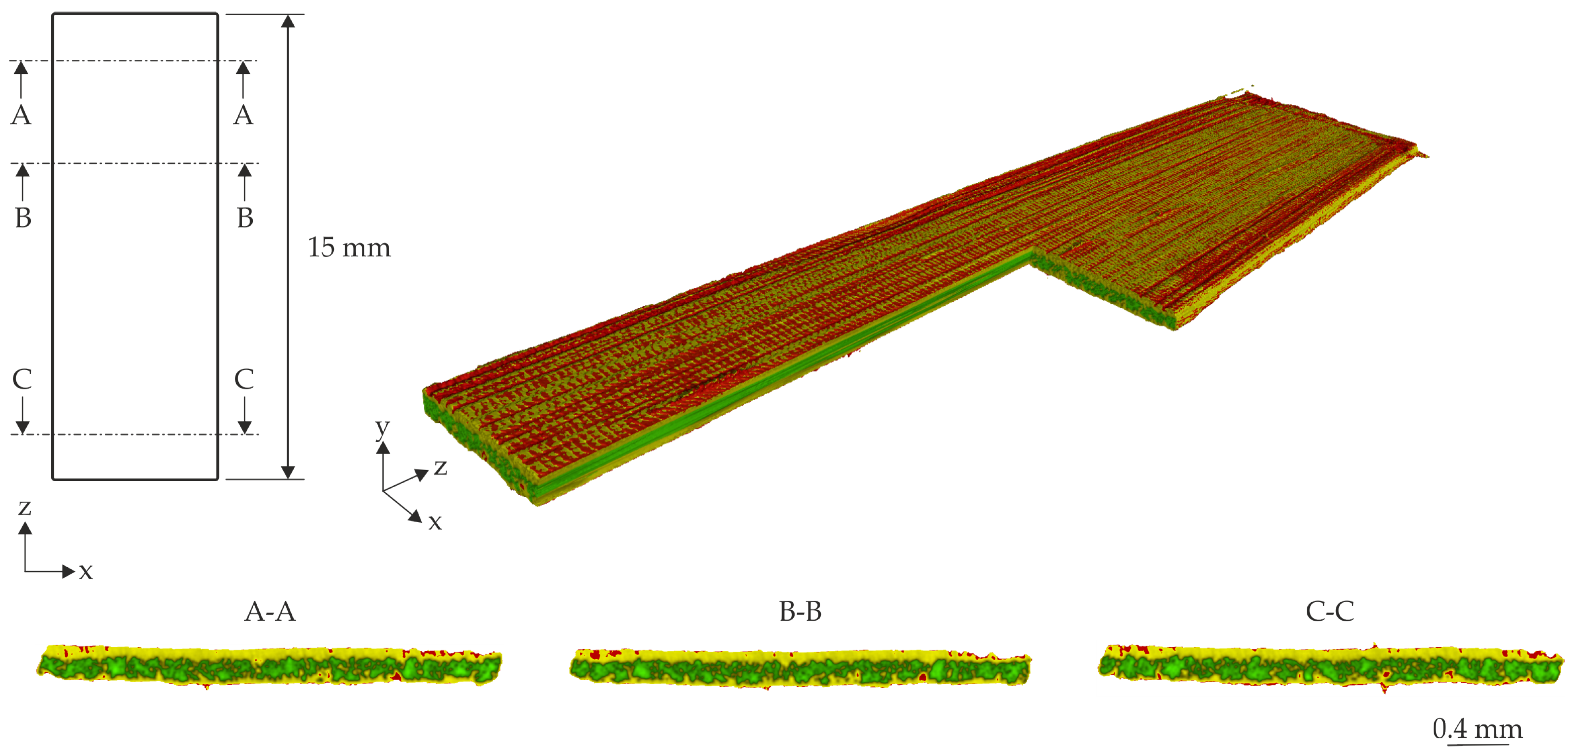
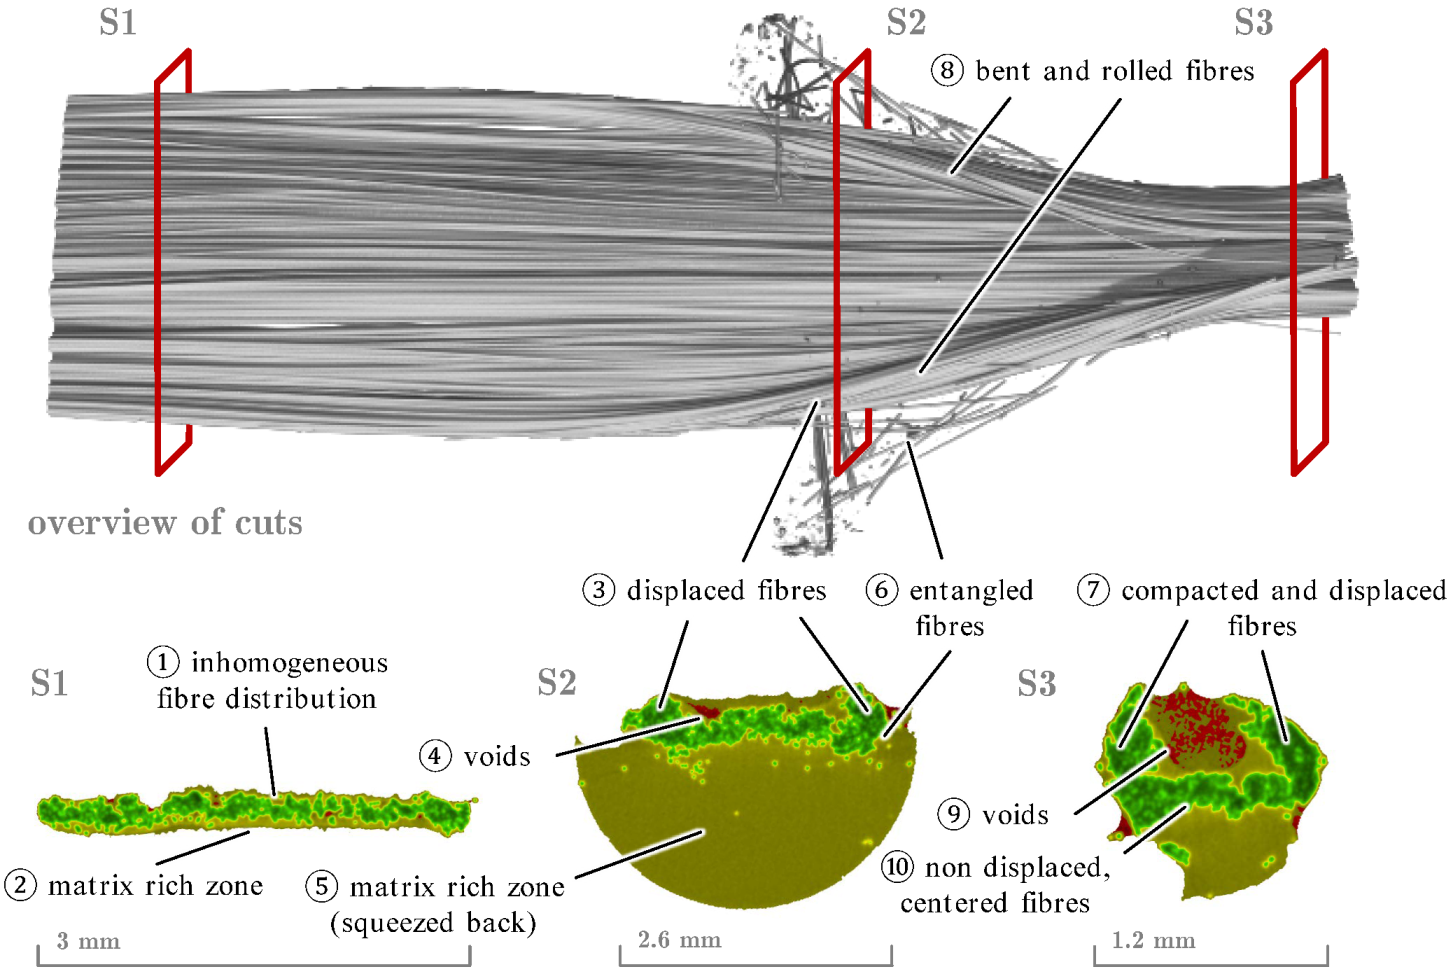
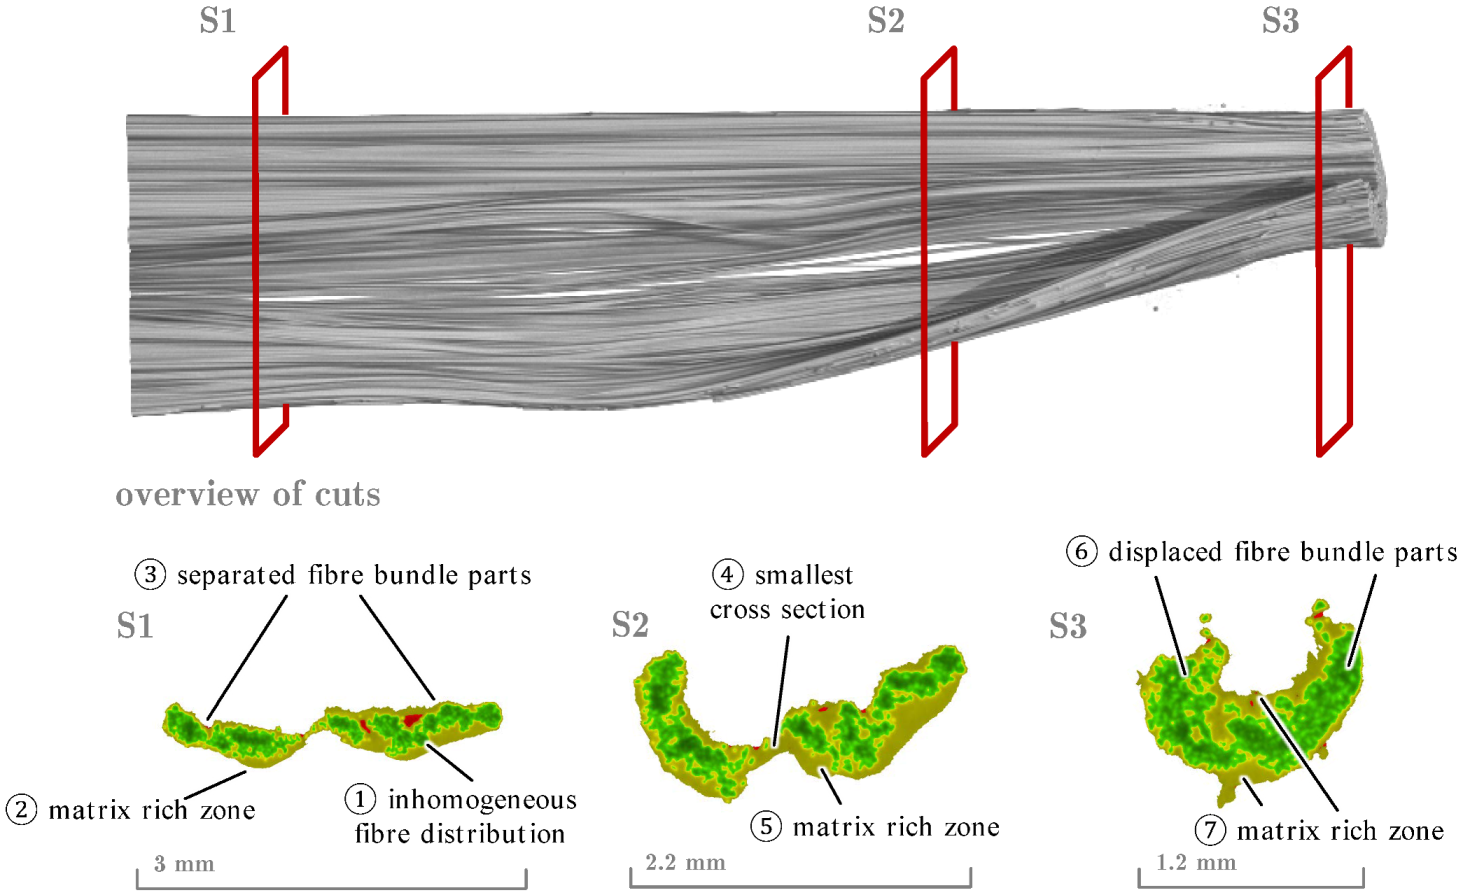
4.5. Material Structure Analysis with Computed Tomography

In order to investigate the fibre bundle deformation inside the forming unit, specific cooled pultrudates of the forming zone were analysed. Additionally, three different cross sections (S1 up to S3) are used for better evaluation of the forming process. To reduce the analysis effort by CT, only three pultrudates are investigated. Due to the low forming forces for D f e =   1.2 mm at 5 mm/s for each temperature level, the configuration of 200 °C is chosen. The average force of the 30 mm/s is the same amount of magnitude for all temperatures. Therefore, the 200 °C is analysed. The investigations show all relevant occurring forming phenomena. The behaviour of the other configurations is assumed to be within this range. In addition, the specimen of D f e =   0.9 mm is investigated. For prepreg materials, where the fibre volume ratio of fibre to matrix is already predefined, this ratio determines the fibre–matrix interaction.
In Figure 14(S1), the continuous forming processes of the initially rectangular cross-section into a round or circular cross-section are clearly shown. It can be seen that the fibre distribution within the cross-section S1 does not appear very homogeneous (1), and the initial matrix rich zone is on the bottom side of the prepreg in accordance with the initial material structure (2) (cf. Figure 6). The fibres on the left and right side are displaced in center direction and in out-of plane direction (3). It can be assumed that the matrix in the forming element is heated and moves accordingly with the fibres in the center direction caused by the forming element shape (S2). Thereby, voids around the forming area occur (4). Furthermore, a matrix rich zone below the fibres can be seen (5). The matrix rich zone occurs from the squeezed back material of S3. In addition, entangled fibres in the back squeezed material are evident (6). It can be assumed that these detached fragments originate from the cut edges of the fibre matrix semi-finished product. This results from the manufacturing process of the semi-finished products because the narrow prepregs are slit out of wide unidirectional webs in a cutting process. Due to the cutting process, individual fibres are severed at the edge, so that a stripping of the discontinuous fibres occurs. By using a continuous semi-finished product without cut edges, it seems possible to eliminate detached fragments. Due to the gravity force, the matrix rich zone occurs at the bottom of the forming element. Cross-section S3 essentially shows the output cross-section of the material while cross-section S2 represents a deformation transition between sections S1 and S3 (Figure 14). In accordance with the displacement of the fibres in center direction in S2 and tapered forming element (3), the forming process in the S3 area of the forming element leads to a displacement in out-of-plane direction and a bending of the whole fibres (7). Therefore, both sides of the prepreg are rolled in the S2 direction (8). The transverse bending by rolling leads to a void between the two bent sides (9), which over-fills the forming element and generates a backwards flow of the matrix. It is obvious that the fibres in the center of the forming element are neither displaced nor bent (10). This continuous forming process of the whole prepreg leads to a homogeneous force deviation (cf. Figure 8).
In contrast to the symmetrical homogeneous forming process, Figure 15 illustrates the material deformation at a pull-off speed of 30 mm/s and 200 °C. The deformation of the specimen at the front, between cross-section S2 and S3, is characterised by a non-uniform change in cross-section. As can be seen in Figure 11 and Figure 12, the non-uniform forming behaviour leads to a difference in mean force of 1.71 N and a difference of 0.13 N in the standard deviation. The inhomogeneous fibre distribution (1) and the matrix rich zone at the bottom side can be seen (2). A deformation of cross section in two separated parts is also evident and has caused the deformation in S3 (3). In S2, these two parts are displaced in the out-of-plane direction around the smallest Section (4). In comparison to Figure 14, a slight matrix rich zone on the bottom side occurs (5), and no squeezed back material can be seen. The final cross section and also the final deformation are achieved in S3. The parts of S1 (3) are displaced in the center direction and pushed together (6). The rearrangement of the fibres by displacement is observed, whereby no increasing compaction can be detected. Therefore, just a small matrix rich zone occurs in the middle of Section (7). Furthermore, the cross section is not fulfilled due the pushing of the two parts. The assumption is that the dwell time of the fibre semi-finished product within the melting zone is too short due to an increased pull-off speed and low heat flow. The 3D reconstruction also shows that the flat cross-section of the glass fibre semi-finished product briefly begins to split in the middle. A bulge of the still stiff semi-finished product appears in the area of the cross-section S1, and this deformation of the still stable prepreg indicates buckling due to shear force stress.
In Figure 16, the CT reconstruction and section cuts of the test series with the 0.9 mm diameter of the forming element are shown. As mentioned above, the area of the output cross-section is smaller than that of the input material, which means that the forming element is over-filled with the matrix and fibre material and therefore the matrix must be stripped and fibres additionally compacted. To analyse the entanglement, the plug of the clogged forming element was very carefully withdrawn from the forming area. Here, it can be clearly assumed that the discontinuous fibres are responsible for the clogging of the forming element. Cross-section S1 shows a partial reshaping of the input material and next to it chaotic areas of entangled single fibres. The cross section of the concentrated fibres (1) shows a partially circular shape similar to S3. Due to the squeezed back material up to S1, matrix rich zone (2), entangled fibres (3), and voids (4) can be seen. The cross-section of area S2 shows a more homogeneously compacted and formed fibre bundle (5) without voids where the tangles of the squeezed back fibres (6) and matrix rich zone are also present (7). The cross-section S3 shows essentially a completely deformed pultrudate in a filled forming element, where the fibres have been compacted to a maximum on the top side (8) and a matrix rich zone one the right (9). In comparison to the configuration of D f e =   1.2 mm, the forming zone and area of squeezed back material against motion direction increase due to the higher degree of deformation. It can also be seen that just the unidirectional fibres pulled through the forming element are rearranged in S1 and S2 by the force direction. The retracted fibres are bent (10) and arranged parallel to the core of the pultrudate (11).

5. Discussion

In this paper, a test setup for fibre bundle deformation is developed and presented. The test rig based on a simplified pultrusion setup consists of a forming unit, pulling power unit and a measurement equipment to quantify the required pulling force. Experimental investigations were carried out to study the forming behaviour of preimpregnated continuous fibre semi-finished products using a combination of GF and PP matrix. Process parameters in terms of temperature and velocity and also the forming geometry were varied while the pull-off forces were determined by a force measuring unit.
The processed measurement data impressively show the influences of the respective changed parameter in the force–displacement curves. The mean values of the steady state forming processes show a clear tendency to higher forces with lower temperature and higher speed changes. The material structure analysis using CT shows the entire transformation of a rectangular to a round or circular cross-section. Through the CT analysis, the occurring forming behaviour could be investigated. Due to the temperature and strain rate dependent material behaviour of the PP matrix, the pulling velocity determines the heat flux in the forming element and therefore the resultant viscosity. When using slow pulling velocities, a continuous forming process with squeezing back phenomena occurs. The forming process includes all fibres of the prepreg and leads to percolation, complex fibre reorientation phenomena (bending in out-of-plane direction and radial displacement) and compaction. When using higher velocities, the forming behaviour is not homogeneous and just leads to a torsion of fibre bundles in the outer areas. The distorted cross section parts are displaced in the radial direction leading to a non filled cross section. Due to the absence of cracks, it also can be concluded that the matrix in the cases of the forming process takes place by plastic deformation and that flow phenomena require time in accordance with the viscosity. The resultant forming forces are also caused by the viscous forces of the matrix [28]. In general, deformation in thickness direction of the continuous fibre reinforced thermoplastic material under an axial tension leads to complex stress state of tension, shear stress and hydro static pressure. With respect to the temperature dependent material behaviour of the thermoplastic matrix, the forming force at high velocities (30 mm/s) can be seen as constant (pulling force 2.17 N to 2.39 N), but the forming process is more homogeneous (deviation 0.18 N to 0.29 N). Furthermore, a low pulling speed leads to a softening of the matrix and results in low deformation forces and deviations. It can be assumed that a stationary process state favourable for homogeneous forming can only be achieved if the heat flow in the contact zone is sufficient to bring the material into a molten state that allows flow processes within the heterogeneous mixture on fibre and matrix.

6. Conclusions

The experimental results in terms of force–displacement curves and CT analysis show that forming behaviour and resultant forces are influenced by temperature and velocity. Due to the experimental results, a reduction of the joining and forming forces can be achieved by reducing the velocity rather than increasing the temperature. Despite the strain rate dependency of the thermoplastic matrix, this strategy allows an homogeneous forming behaviour of the TPC and flow behaviour with reduced viscous forces of the thermoplastic matrix. By increasing the velocity, the forming behaviour and phenomena changed significantly, leading to homogeneous fibre distribution and less compaction. Furthermore, the fibre matrix distribution within the semi-finished products cross-section has a massive influence on the fibre matrix interaction. In the present work, the uneven distribution led to the thermoplastic matrix accumulating in certain areas and forming an inhomogeneous pultrudate. It can be assumed that a more homogeneous fibre matrix distribution could be realised by a longer melting zone and longer flow processes of the thermoplastic matrix. In further work, heat transfer during pultrusion and tool-TPC-interaction should be investigated in detail with final contour (non-slitted) prepregs. In addition, a wide temperature range has to be investigated to determine the fibre bundle behaviour next to melting temperature.

Author Contributions

Conceptualization, A.B., B.G. and M.G.; methodology, A.B., B.G. and M.G.; software, A.B. and M.G.; validation, A.B., B.G. and M.G.; formal analysis, A.B., B.G. and M.G.; investigation, A.B. and B.G.; resources, M.G.; data curation, A.B., B.G., R.F. and M.G.; writing—original draft preparation, A.B. and B.G.; writing—review and editing, A.B., B.G., R.F. and M.G.; visualization, A.B. and R.F.; supervision, M.G.; project administration, M.G.; funding acquisition, B.G. and M.G. All authors have read and agreed to the published version of the manuscript.

Funding

This research was funded by the Deutsche Forschungsgemeinschaft (DFG, German Research Foundation)—TRR 285—Project-ID 418701707 sub-project A03.

Data Availability Statement

Not applicable.

Conflicts of Interest

The authors declare no conflict of interest.

Abbreviations

The following abbreviations are used in this manuscript:
PREPREGPreimpregnated continuous fibre-reinforced material
FRPFibre-reinforced plastics
GFGlass fibre
PPPolypropylene
3DThree-dimensional
TPCThermoplastic composite
CTComputed tomography
PPRParallel-plate rheometer
UDUnidirectional
FFIFibre–fibre interaction
CFCarbon fibre
PBTPolybutylenterephthalate
PEEKPolyetheretherketone
PAPolyamide
PCPolycarbonate
PEIPolyetherimide
FVCFibre volume content
DSCDifferential scanning calorimetry

References

  1. Van Oers, S.; Pfister, P.; Pichler, A.; Russell, L.; Spini, H.; Tanikawa, E.; van der Voet, H.; Weisz, J.; West, A.; Wiijkman, B.; et al. Assessing Global Resource Use: A Systems Approach to Resource Efficiency and Pollution Reduction; Technical Report; United Nations Environment Programme: Nairobi, Kenya, 2017. [Google Scholar]
  2. Priem, C.; Othman, R.; Rozycki, P.; Guillon, D. Experimental investigation of the crash energy absorption of 2.5D-braided thermoplastic composite tubes. Compos. Struct. 2014, 116, 814–826. [Google Scholar] [CrossRef] [Green Version]
  3. Gröger, B.; Troschitz, J.; Vorderbrüggen, J.; Vogel, C.; Kupfer, R.; Meschut, G.; Gude, M. Clinching of Thermoplastic Composites and Metals—A Comparison of Three Novel Joining Technologies. Materials 2021, 14, 2286. [Google Scholar] [CrossRef] [PubMed]
  4. Popp, J.; Kleffel, T.; Römisch, D.; Papke, T.; Merklein, M.; Drummer, D. Fiber Orientation Mechanism of Continuous Fiber Reinforced Thermoplastics Hybrid Parts Joined with Metallic Pins. Appl. Compos. Mater. 2021, 28, 951–972. [Google Scholar] [CrossRef]
  5. Galińska, A.; Galiński, C. Mechanical Joining of Fibre Reinforced Polymer Composites to Metals—A Review. Part II: Riveting, Clinching, Non-Adhesive Form-Locked Joints, Pin and Loop Joining. Polymers 2020, 12, 1681. [Google Scholar] [CrossRef] [PubMed]
  6. Troschitz, J.; Gröger, B.; Würfel, V.; Kupfer, R.; Gude, M. Joining Processes for Fibre-Reinforced Thermoplastics: Phenomena and Characterisation. Materials 2022, 15, 5454. [Google Scholar] [CrossRef]
  7. Troschitz, J.; Füßel, R.; Kupfer, R.; Gude, M. Damage Analysis of Thermoplastic Composites with Embedded Metal Inserts Using In Situ Computed Tomography. J. Compos. Sci. 2022, 6, 287. [Google Scholar] [CrossRef]
  8. Bussetta, P.; Correia, N. Numerical forming of continuous fibre reinforced composite material: A review. Compos. Part A Appl. Sci. Manuf. 2018, 113, 12–31. [Google Scholar] [CrossRef]
  9. Gröger, B.; Hornig, A.; Hoog, A.; Gude, M. Modelling of thermally supported clinching of fibre-reinforced thermoplastics: Approaches on mesoscale considering large deformations and fibre failure. In Proceedings of the ESAFORM 2021—24th International Conference on Material Forming, Liège, Belgium, 14–16 April 2021. [Google Scholar] [CrossRef]
  10. Liang, B.; Hamila, N.; Peillon, M.; Boisse, P. Analysis of thermoplastic prepreg bending stiffness during manufacturing and of its influence on wrinkling simulations. Compos. Part A Appl. Sci. Manuf. 2014, 67, 111–122. [Google Scholar] [CrossRef]
  11. Ropers, S.; Kardos, M.; Osswald, T.A. A thermo-viscoelastic approach for the characterization and modeling of the bending behavior of thermoplastic composites. Compos. Part A Appl. Sci. Manuf. 2016, 90, 22–32. [Google Scholar] [CrossRef]
  12. Launay, J.; Hivet, G.; Duong, A.V.; Boisse, P. Experimental analysis of the influence of tensions on in plane shear behaviour of woven composite reinforcements. Compos. Sci. Technol. 2008, 68, 506–515. [Google Scholar] [CrossRef] [Green Version]
  13. Latil, P.; Orgéas, L.; Geindreau, C.; Dumont, P.; du Roscoat, S.R. Towards the 3D in situ characterisation of deformation micro-mechanisms within a compressed bundle of fibres. Compos. Sci. Technol. 2011, 71, 480–488. [Google Scholar] [CrossRef] [Green Version]
  14. Volk, M.; Yuksel, O.; Baran, I.; Hattel, J.H.; Spangenberg, J.; Sandberg, M. Cost-efficient, automated, and sustainable composite profile manufacture: A review of the state of the art, innovations, and future of pultrusion technologies. Compos. Part B Eng. 2022, 246, 110135. [Google Scholar] [CrossRef]
  15. Volk, M.; Wong, J.; Arreguin, S.; Ermanni, P. Pultrusion of large thermoplastic composite profiles up to ∅ 40 mm from glass-fibre/PET commingled yarns. Compos. Part B Eng. 2021, 227, 109339. [Google Scholar] [CrossRef]
  16. Minchenkov, K.; Vedernikov, A.; Safonov, A.; Akhatov, I. Thermoplastic Pultrusion: A Review. Polymers 2021, 13, 180. [Google Scholar] [CrossRef]
  17. Novo, P.; Silva, J.; Nunes, J.; Marques, A. Pultrusion of fibre reinforced thermoplastic pre-impregnated materials. Compos. Part B Eng. 2016, 89, 328–339. [Google Scholar] [CrossRef] [Green Version]
  18. Bechtold, G.; Wiedmer, S.; Friedrich, K. Pultrusion of Thermoplastic Composites - New Developments and Modelling Studies. J. Thermoplast. Compos. Mater. 2002, 15, 443–465. [Google Scholar] [CrossRef]
  19. Åström, B. Development and application of a process model for thermoplastic pultrusion. Compos. Manuf. 1992, 3, 189–197. [Google Scholar] [CrossRef]
  20. Carlsson, A.; Åström, B.T. Experimental investigation of pultrusion of glass fibre reinforced polypropylene composites. Compos. Part A Appl. Sci. Manuf. 1998, 29, 585–593. [Google Scholar] [CrossRef]
  21. Kerbiriou, V.; Friedrich, K. Pultrusion of Thermoplastic Composites-Process Optimization and Mathematical Modeling. J. Thermoplast. Compos. Mater. 1999, 12, 96–120. [Google Scholar] [CrossRef]
  22. Evstatiev, M.; Angelov, I.; Friedrich, K. Structure and properties of microfibrillar-reinforced composites based on thermoplastic PET/LDPE blends after manufacturing by means of pultrusion. Polym. Eng. Sci. 2009, 50, 402–410. [Google Scholar] [CrossRef]
  23. Chen, K.; Jia, M.; Sun, H.; Xue, P. Thermoplastic Reaction Injection Pultrusion for Continuous Glass Fiber-Reinforced Polyamide-6 Composites. Materials 2019, 12, 463. [Google Scholar] [CrossRef] [PubMed] [Green Version]
  24. Åström, B.T.; Pipes, R.B. A modeling approach to thermoplastic pultrusion. II: Verification of models. Polym. Compos. 1993, 14, 184–194. [Google Scholar] [CrossRef]
  25. Safonov, A.A.; Carlone, P.; Akhatov, I. Mathematical simulation of pultrusion processes: A review. Compos. Struct. 2018, 184, 153–177. [Google Scholar] [CrossRef]
  26. Koubaa, S.; Corre, S.L.; Burtin, C. Thermoplastic pultrusion process: Modeling and optimal conditions for fibers impregnation. J. Reinf. Plast. Compos. 2013, 32, 1285–1294. [Google Scholar] [CrossRef]
  27. Duhovic, M.; Aswale, P.; Schommer, D.; Hausmann, J. Development of a process simulation model of a pultrusion line. In Proceedings of the 12th European LS-DYNA Users Conference, Koblenz, Germany, 14–16 May 2019. [Google Scholar]
  28. Wiedmer, S.; Manolesos, M. An Experimental Study of the Pultrusion of Carbon Fiber-Polyamide 12 Yarn. J. Thermoplast. Compos. Mater. 2006, 19, 97–112. [Google Scholar] [CrossRef] [Green Version]
  29. Gennaro, R.; Christmann, M.; Greco, A.; Rieber, G.; Mitschang, P.; Maffezzoli, A. Experimental measurement of transversal micro- and macro permeability during compression molding of PP/Glass composites. Polym. Compos. 2013, 35, 105–112. [Google Scholar] [CrossRef]
  30. Hexcel Corporation. HexFlow RTM6–Data Sheet; Hexcel Corporation: Stamford, CT, USA, 2018. [Google Scholar]
  31. Nakai, A.; Morino, K. Olding condition for shortening molding time during pultrusion molding of thermoplastic composites. In Proceedings of the ICCM International Conferences on Composite Materials, Xi’an, China, 20–25 August 2017. [Google Scholar]
  32. Eichenhofer, M.; Wong, J.C.; Ermanni, P. Continuous lattice fabrication of ultra-lightweight composite structures. Addit. Manuf. 2017, 18, 48–57. [Google Scholar] [CrossRef]
  33. Aegerter, N.; Volk, M.; Maio, C.; Schneeberger, C.; Ermanni, P. Pultrusion of hybrid bicomponent fibers for 3D printing of continuous fiber reinforced thermoplastics. Adv. Ind. Eng. Polym. Res. 2021, 4, 224–234. [Google Scholar] [CrossRef]
  34. Alsinani, N.; Ghaedsharaf, M.; Lebel, L.L. Effect of cooling temperature on deconsolidation and pulling forces in a thermoplastic pultrusion process. Compos. Part B Eng. 2021, 219, 108889. [Google Scholar] [CrossRef]
  35. BÜFA Thermoplastic Composites GmbH & Co. KG. Thermoplastic Unidirectional Tape PP GF 60. 2020. Available online: https://thermoplasticcomposites.de/de/wp-content/uploads/sites/2/2020/11/Preliminary-Dataheet_UD-Tape_GF-PP-natural_250%C2%B5m.pdf (accessed on 26 October 2022).
  36. Borealis AG. Polypropylene BJ100HP Polypropylene Copolymer; Borealis AG: Vienna, Austria, 2021. [Google Scholar]
  37. Gude, M.; Vogel, C.; Gröger, B. Simulation-aided development of a robust thermoclinching joining process for hybrid structures with textile reinforced thermoplastic composites and metallic components. Mater. Und Werkst. 2019, 50, 1027–1038. [Google Scholar] [CrossRef]
  38. Brown, N.; Worrall, C.; Ogin, S.; Smith, P. Investigation into the mechanical properties of thermoplastic composites containing holes machined by a thermally-assisted piercing (TAP) process. Adv. Manuf. Polym. Compos. Sci. 2015, 1, 199–209. [Google Scholar] [CrossRef]
Figure 1. Computed tomography (CT) analysis of initial 1 ) and resultant material structure 2 ) of the pinning process of [4]. 1 ) —Different specimen area as resultant material structure; 2 ) —Pin structure is eliminated for more accurate CT scans.
Jmmp 06 00146 g001
Figure 2. Test rig for the evaluation of deformation forces.
Jmmp 06 00146 g002
Figure 3. Forming unit to deform continuous fibre reinforced prepreg materials.
Jmmp 06 00146 g003
Figure 4. Forming unit and cross sectional view of the forming element.
Jmmp 06 00146 g004
Figure 5. Experimental results of the DSC to identify the process temperature parameters.
Jmmp 06 00146 g005
Figure 6. Micrograph of the transversal section of used PP GF 60 prepreg material (magnification of objective 20×).
Jmmp 06 00146 g006
Figure 7. CT reconstruction of used PP GF 60 prepreg material; green—fibres, yellow—thermoplastic matrix, red—void.
Jmmp 06 00146 g007
Figure 8. Deforming forces of GF-PP at room temperature (23 °C), 200 °C and D f e = 1.2 mm.
Jmmp 06 00146 g008
Figure 9. Deforming forces of GF-PP at 210 °C and D f e = 1.2 mm.
Jmmp 06 00146 g009
Figure 10. Deforming forces of GF-PP at 220 °C and D f e = 1.2 mm.
Jmmp 06 00146 g010
Figure 11. Comparison of the mean values in the steady state process condition.
Jmmp 06 00146 g011
Figure 12. Comparison of standard deviations of mean values in the steady state process condition.
Jmmp 06 00146 g012
Figure 13. Deforming forces of GF-PP at 200 °C and D f e = 0.9 mm.
Jmmp 06 00146 g013
Figure 14. CT reconstruction data and section cuts of deformed GF-PP 5 mm/s and 200 °C, D f e = 1.2 mm.
Jmmp 06 00146 g014
Figure 15. CT reconstruction data and section cuts of deformed GF-PP 30 mm/s and 200 °C, D f e = 1.2 mm.
Jmmp 06 00146 g015
Figure 16. CT reconstruction data and section cuts of deformed GF-PP, D f e = 0.9 mm.
Jmmp 06 00146 g016
Table 1. Unidirectional PP GF 60 prepreg from BÜFA Thermoplastic Composites GmbH & Co. KG [35].
PropertyUnitAbbreviationValue
tensile modulus 0 GPa E 0 28
flexural modulus 0 GPa E f 21
tensile strength 0 MPa σ 0 720
flexural strength 0° MPa σ f 436
thicknessmmt0.25
widthmmw3
fibre volume content% φ 35
melting temperature°C T m 165
processing temperature°C T p 180–220
Table 2. Test specification for CT analysis of initial prepreg material.
ParameterUnitValue
acceleration voltage kV 60
tube current μ A 100
exposure time ms 2000
X-ray projections 1440 (4 per 1°)
source object distance m m 30
source image distance m m 200
voxel size μ m 7.5
Table 3. Test specification for CT analysis of deformation specimens.
ParameterUnitValue
acceleration voltage kV 50
tube current μ A 180
exposure time ms 1500
X-ray projections 1440 (4 per 1°)
source object distance m m 30
source image distance m m 200
voxel size μ m 7.5
Table 4. Test rig parameters of fibre bundle deformation studies.
SeriesVelocity mm/sTemperature °CDiameter D f e   mm
15231.2
25, 10, 15, 20, 25, 302001.2
35, 10, 15, 20, 25, 302101.2
45, 10, 15, 20, 25, 302201.2
552000.9
Table 5. Dynamic viscosity η 0 of PP for the three different temperature levels.
Temperature °CDynamic Viscosity η 0 in Pa · s
200328
210257
220225
Publisher’s Note: MDPI stays neutral with regard to jurisdictional claims in published maps and institutional affiliations.

