Article

Towards an Ideal Energy Absorber: Relating Failure Mechanisms and Energy Absorption Metrics in Additively Manufactured AlSi10Mg Cellular Structures under Quasistatic Compression

1
3DX Research Group, Arizona State University, Mesa, AZ 85212, USA
2
BAE Systems Inc., Phoenix, AZ 85044, USA
*
Author to whom correspondence should be addressed.
J. Manuf. Mater. Process. 2022, 6(6), 140; https://doi.org/10.3390/jmmp6060140
Submission received: 26 September 2022 / Revised: 28 October 2022 / Accepted: 9 November 2022 / Published: 13 November 2022

Abstract

:
A designer of metallic energy absorption structures using additively manufactured cellular materials must address the question of which of a multitude of cell shapes to select from, the majority of which are classified as either honeycomb, beam-lattice, or Triply Periodic Minimal Surface (TPMS) structures. Furthermore, there is more than one criterion that needs to be assessed to make this selection. In this work, six cellular structures (hexagonal honeycomb, auxetic and Voronoi lattice, and diamond, gyroid, and Schwarz-P TPMS) spanning all three types were studied under quasistatic compression and compared to each other in the context of the energy absorption metrics of most relevance to a designer. These shapes were also separately studied with tubes enclosing them. All of the structures were fabricated out of AlSi10Mg with the laser powder bed fusion (PBF-LB. or LPBF) process. Experimental results were assessed in the context of four criteria: the relationship between the specific energy absorption (SEA) and maximum transmitted stress, the undulation of the stress plateau, the densification efficiency, and the design tunability of the shapes tested—the latter two are proposed here for the first time. Failure mechanisms were studied in depth to relate them to the observed mechanical response. The results reveal that auxetic and Voronoi lattice structures have low SEA relative to maximum transmitted stresses, and low densification efficiencies, but are highly tunable. TPMS structures on the other hand, in particular the diamond and gyroid shapes, had the best overall performance, with the honeycomb structures between the two groups. Enclosing cellular structures in tubes increased peak stress while also increasing plateau stress undulations.

1. Introduction

Prior to the maturation of metal additive manufacturing (AM) technologies, honeycombs [1,2,3,4,5], metal foams [6,7,8], and hollow tubes [9,10,11,12,13] were commonly used for energy absorption applications beyond the reach of polymers due to large impact energies and velocities, such as in automotive crumple zones and aerospace crash protection [14,15]. With the additional design freedom enabled by additive manufacturing comes the opportunity to exploit cellular shapes beyond periodic honeycombs and stochastic foams to further optimize energy absorption properties and/or reduce the mass of the structure needed to meet design requirements. With this increased freedom to select a shape from a large library of possibilities [16] comes the need to understand why certain shapes perform better than others. This is made somewhat challenging by the fact that unlike maximizing cellular material stiffness or strength, energy absorption behavior spans a range of different metrics such as peak load, plateau slope and uniformity, energy absorption efficiency, densification strain, and specific energy absorption. A cellular structure may excel in controlling for peak load, for example, but may have poor energy absorption efficiency.
Another challenge with optimizing cellular material geometry for energy absorption is that some of the important metrics used for this purpose are interdependent—this is most evident in the calculation of specific energy absorption, which depends on the location on the stress–strain curve where the onset strain of densification is defined, which in turn depends on how the designer defines the end of the energy absorption event.
Metal AM cellular structures tend to find use in applications that require energy to be absorbed within fractions of seconds, due to events such as impact, shock or blast, and projectile penetration. It is more commonplace however to commence studies at quasi-static strain rates, select promising candidates, and then examine them at higher strain rates—details on the behavior of traditional cellular materials at both quasi-static and impact strain rates can be found in [6]. Table 1 lists a compilation of energy absorption studies conducted on AM cellular materials at quasi-static strain rates in compression—these studies represent a subset of the larger set of experimental studies that have involved compression of cellular materials but are called out here due to their emphasis on extracting energy absorption-related information.
In the quasi-static strain rate regime, energy absorption behavior is primarily influenced by the properties of the base material, the relative density of the structure, and the geometry of the cells that comprise it. An examination of Table 1 indicates that the laser powder bed fusion (PBF-LB) process is most commonly used to fabricate AM cellular structures for energy absorption studies, and most studies either focus on beam-based lattices such as the body centered cubic (BCC) shape or triply periodic minimal surfaces (TPMS) shapes. The relative densities studied range from 3.5% to 37%, with most studies including specimens in the 10–25% range. Effective strain rates in most studies are 10−3 s−1, with crosshead speeds typically around 0.5–1 mm/min. Stainless steel 316L is the most commonly tested material, followed by AlSi10Mg.
It is important to introduce and clarify the different metrics used by the authors of these studies due to the challenges identified previously with the quantification of energy absorption behavior. A typical (effective) stress–strain response for a metallic cellular material under low strain rate compression is shown in Figure 1 showing a large plateau region, sandwiched by rises in load on either end—the former is a result of the elastic response of the structure, the latter is on account of densification.
Several metrics can be extracted from the graph in Figure 1a, these are discussed in turn below, with the findings from the literature in Table 1 specific to a metric woven into the discussion in the appropriate place.
First maximum/peak stress: the first maximum stress is the highest stress achieved before a drop in stress levels, as shown in Figure 1a. The specific value of this stress depends on the composition, cell geometry, and relative density [14].
Plateau Stress: the plateau is defined as the region between the first peak stress and the onset of densification. The average stress in the plateau region is defined here as the plateau stress. Generally speaking, the plateau stress value is lower than the peak stress.
Plateau slope: the slope of the stress plateau indicates whether the cellular structure hardens or softens under compressive loading. Generally speaking, the higher the relative density, the harder the plateau compressive response will be, which can result in the plateau stress exceeding the first maximum stress, which is not ideal from a design standpoint where the goal is often to ensure the maximum transmitted stresses are maintained below a specific value. A cellular material with a flat plateau, across a range of relative densities, is a preferred material for energy absorption. The plateau slope of the P-type TPMS geometry has been shown to be less dependent on relative density in comparison to other shapes [28,29]. It has also been shown that two distinct plateaus may be arrived at [22].
Plateau undulation: undulation, or waviness in the plateau is another metric that is of interest and is indicative of the nature of localized failures during the compression event. A non-dimensional indicator called undulation of the load-carrying capacity (ULC) has been proposed as [12]:
ULC = 0 S EF F s F m ds 0 S EF F s ds
where F and s represent force and displacement, while SEF and Fm are the effective stroke and the maximum force experienced in the plateau, not including the first maximum stress, respectively. ULC tends to correlate inversely with energy efficiency, with an ideal energy absorber having a ULC value of 0. A drop in plateau load is typically indicative of a localized failure event, occasionally resulting in failure bands and barreling of the cellular structure. Load increases correspond to transfer of load bearing to another set of members. Higher relative density structures generally have larger undulations on account of thicker beams or walls that tend to experience higher shear stresses. Material properties, including heat treatment which induced changes in microstructure, also influence plateau undulation [25].
Onset strain of densification: The onset strain of densification ( ε D ) , which is often less correctly termed simply as the densification strain [32], is vital for the computation of energy absorption. At least four different approaches have been proposed and used to define ε D : (a) the energy efficiency method, where the strain at the maximum energy efficiency point defines ε D , as shown in Figure 1b [27,29,30]; (b) a predefined strain value at which all values are specified, typically 40% [28] or 50% [33] strain; (c) the use of the first maximum stress as a threshold— ε D is defined when stress exceeds this threshold [23,24]; and (d) the intersection of the slopes of the plateau and the densification region can be used to define ε D [15,22].
Specific energy absorption (SEA): SEA is a normalized (by mass) measure of energy absorbed and is calculated from the stress–strain graph in Figure 1a, as:
SEA = 0 ε D σ d ε ρ
The numerator is the area under the stress–strain curve integrated up to the densification strain ε D , and ρ represents the density of the lattice structure. This measure can also be obtained by dividing the area under the force–displacement curve by the measured mass of the lattice structure under compression. The volumetric counterpart of SEA is called energy absorption capacity (Wv), with units of J/cm3. Both these metrics depend on the definition of ε D , and comparisons across the literature must be carefully drawn. Furthermore, both values also typically increase with increasing relative density along with higher transmitted stress, and a comparison across the shapes is only relevant in the context of relative density and/or maximum transmitted stress.
Energy absorption efficiency: a related metric of interest is the energy absorption efficiency η , which enables a comparison of the energy absorption of the cellular material of interest to an ideal energy absorber, for a given maximum transmitted stress σ peak , and is estimated as:
η = 0 ε D σ d ε σ peak 100 %
The majority of published literature reports the first maximum/peak stress and computes SEA. Other metrics such as plateau stress and energy absorbed per unit volume are also reported. This work attempts to dive deeper into correlating cellular material geometry to the above energy absorption metrics, understand why they have the relationships they do, and propose design strategies for approaching the ideal energy absorber. Instead of focusing on one class of cellular material, this work seeks to compare the behaviors of beam-based lattices and TPMS geometries against baseline honeycombs, all manufactured to similar scales and relative densities using the identical material composition (AlSi10Mg), processing equipment (PBF-LB), and post-process heat treatments.
An ideal energy absorber for the purposes of this discussion is a cellular material that has certain characteristics: (a) a predictable peak stress-relative density relationship, (b) a flat plateau that keeps the stress below the peak stress that will damage the object being protected at a wide relative density range, and (c) the ability for the material to absorb all the energy needed prior to reaching densification. Maximizing SEA and energy absorption efficiency while important, is not sufficient.
Following this introduction, the design rationale, materials, and manufacturing process used are discussed, followed by a discussion of the characterization and test methods used in the study. Results are presented, first for each of the shapes studied, and then in aggregate to draw comparisons. The implications of the results are then discussed, and conclusions are articulated. This work is limited in scope to quasistatic compression of PBF-LB manufactured AlSi10Mg cellular materials, including a set of specimens that were enclosed in tubes.

2. Design and Manufacturing

2.1. Rationale for Unit Cell Selection

The primary aim of this work was to compare energy absorption in cellular materials spanning three categories: honeycombs, beam-based lattices, and TPMS structures. A total of six different cell shapes were selected, as shown in Figure 2a: hexagonal honeycomb, auxetic and Voronoi lattices, and diamond, gyroid, and Schwarz-P TPMS geometries. All six of these shapes were fabricated at three different relative densities, by varying beam or wall thickness, as shown in Table 2, within a bounding box envelope of 40 mm × 40 mm × 40 mm. To resolve the auxetic beam specimens sufficiently, the bounding box envelope for this specific cellular structure had to be increased to 44 mm × 44 mm × 44 mm. This difference in dimensions is normalized by the computation of effective stresses and strains in the analysis step. The lowest relative density from each shape was additionally replicated with an enclosing tube as shown in Figure 2b. End-plates of 2 mm thickness were created on the top and bottom of all the cellular material specimens, except the hexagonal honeycomb. No end-plates were used on the specimens with tubes. A minimum of 10 unit cells in all three directions was used to mitigate against cell size effects [33,34]. All the designs were created using the nTopology Platform software (V2.16.5, nTopology, Inc., New York, NY, USA) [35].
The selection of hexagonal honeycombs was to provide a baseline cellular material of the same composition and fabrication process and also due to its known benefits as an energy absorber in out-of-plane compression. While BCC lattices have received the most interest in the literature due to their bending-dominated behavior, the auxetic lattice shape was selected due to its promise as an energy absorbing material [36] and limited prior work on energy absorption for metallic auxetics. Auxetic structures are well known for having a negative Poisson’s ratio, i.e., if a compressive load is applied from the x-direction, these structures undergo a reduction in length in the y and z direction as well. The Voronoi lattice shape was also selected due to its stochastic nature similar to metallic foams, which has the potential for the reduced likelihood of failure band formation and smoother plateaus, as well as for reduced anisotropy. TPMS structures in the literature have shown a lot of promise for smoother stress–strain responses and relatively low sensitivity of the plateau slope to changes in relative density [29], and as a result were selected here. Finally, the end application with cellular materials often involves enclosing them in tubes [15], and a result one iteration of each design in tubes, as shown in Figure 1b, was also created.
Table 2 shows all the shapes and their relative density variations used for the study. For all the surface-based structures, wall thicknesses of 0.4 mm, 0.6 mm, and 0.8 mm were used and for beam-based structures, beam diameters of 0.5 mm, 0.75 mm, and 1 mm were used to keep the relative density below 0.3. To study the effect of adding a tube enclosure, the lowest relative density for each cellular material was selected and enclosed with a 0.5 mm tube to see the change in the collapse pattern as well as the change in energy absorption characteristics due to the addition of the tube. Table 2 also shows the difference between the measured relative densities, estimated after weighing the structures and subtracting the design mass associated with the end-plates, which were estimated to be at worst within 0.03 from the nominal design. As a result, nominal values have been used in the subsequent discussion.

2.2. Manufacturing

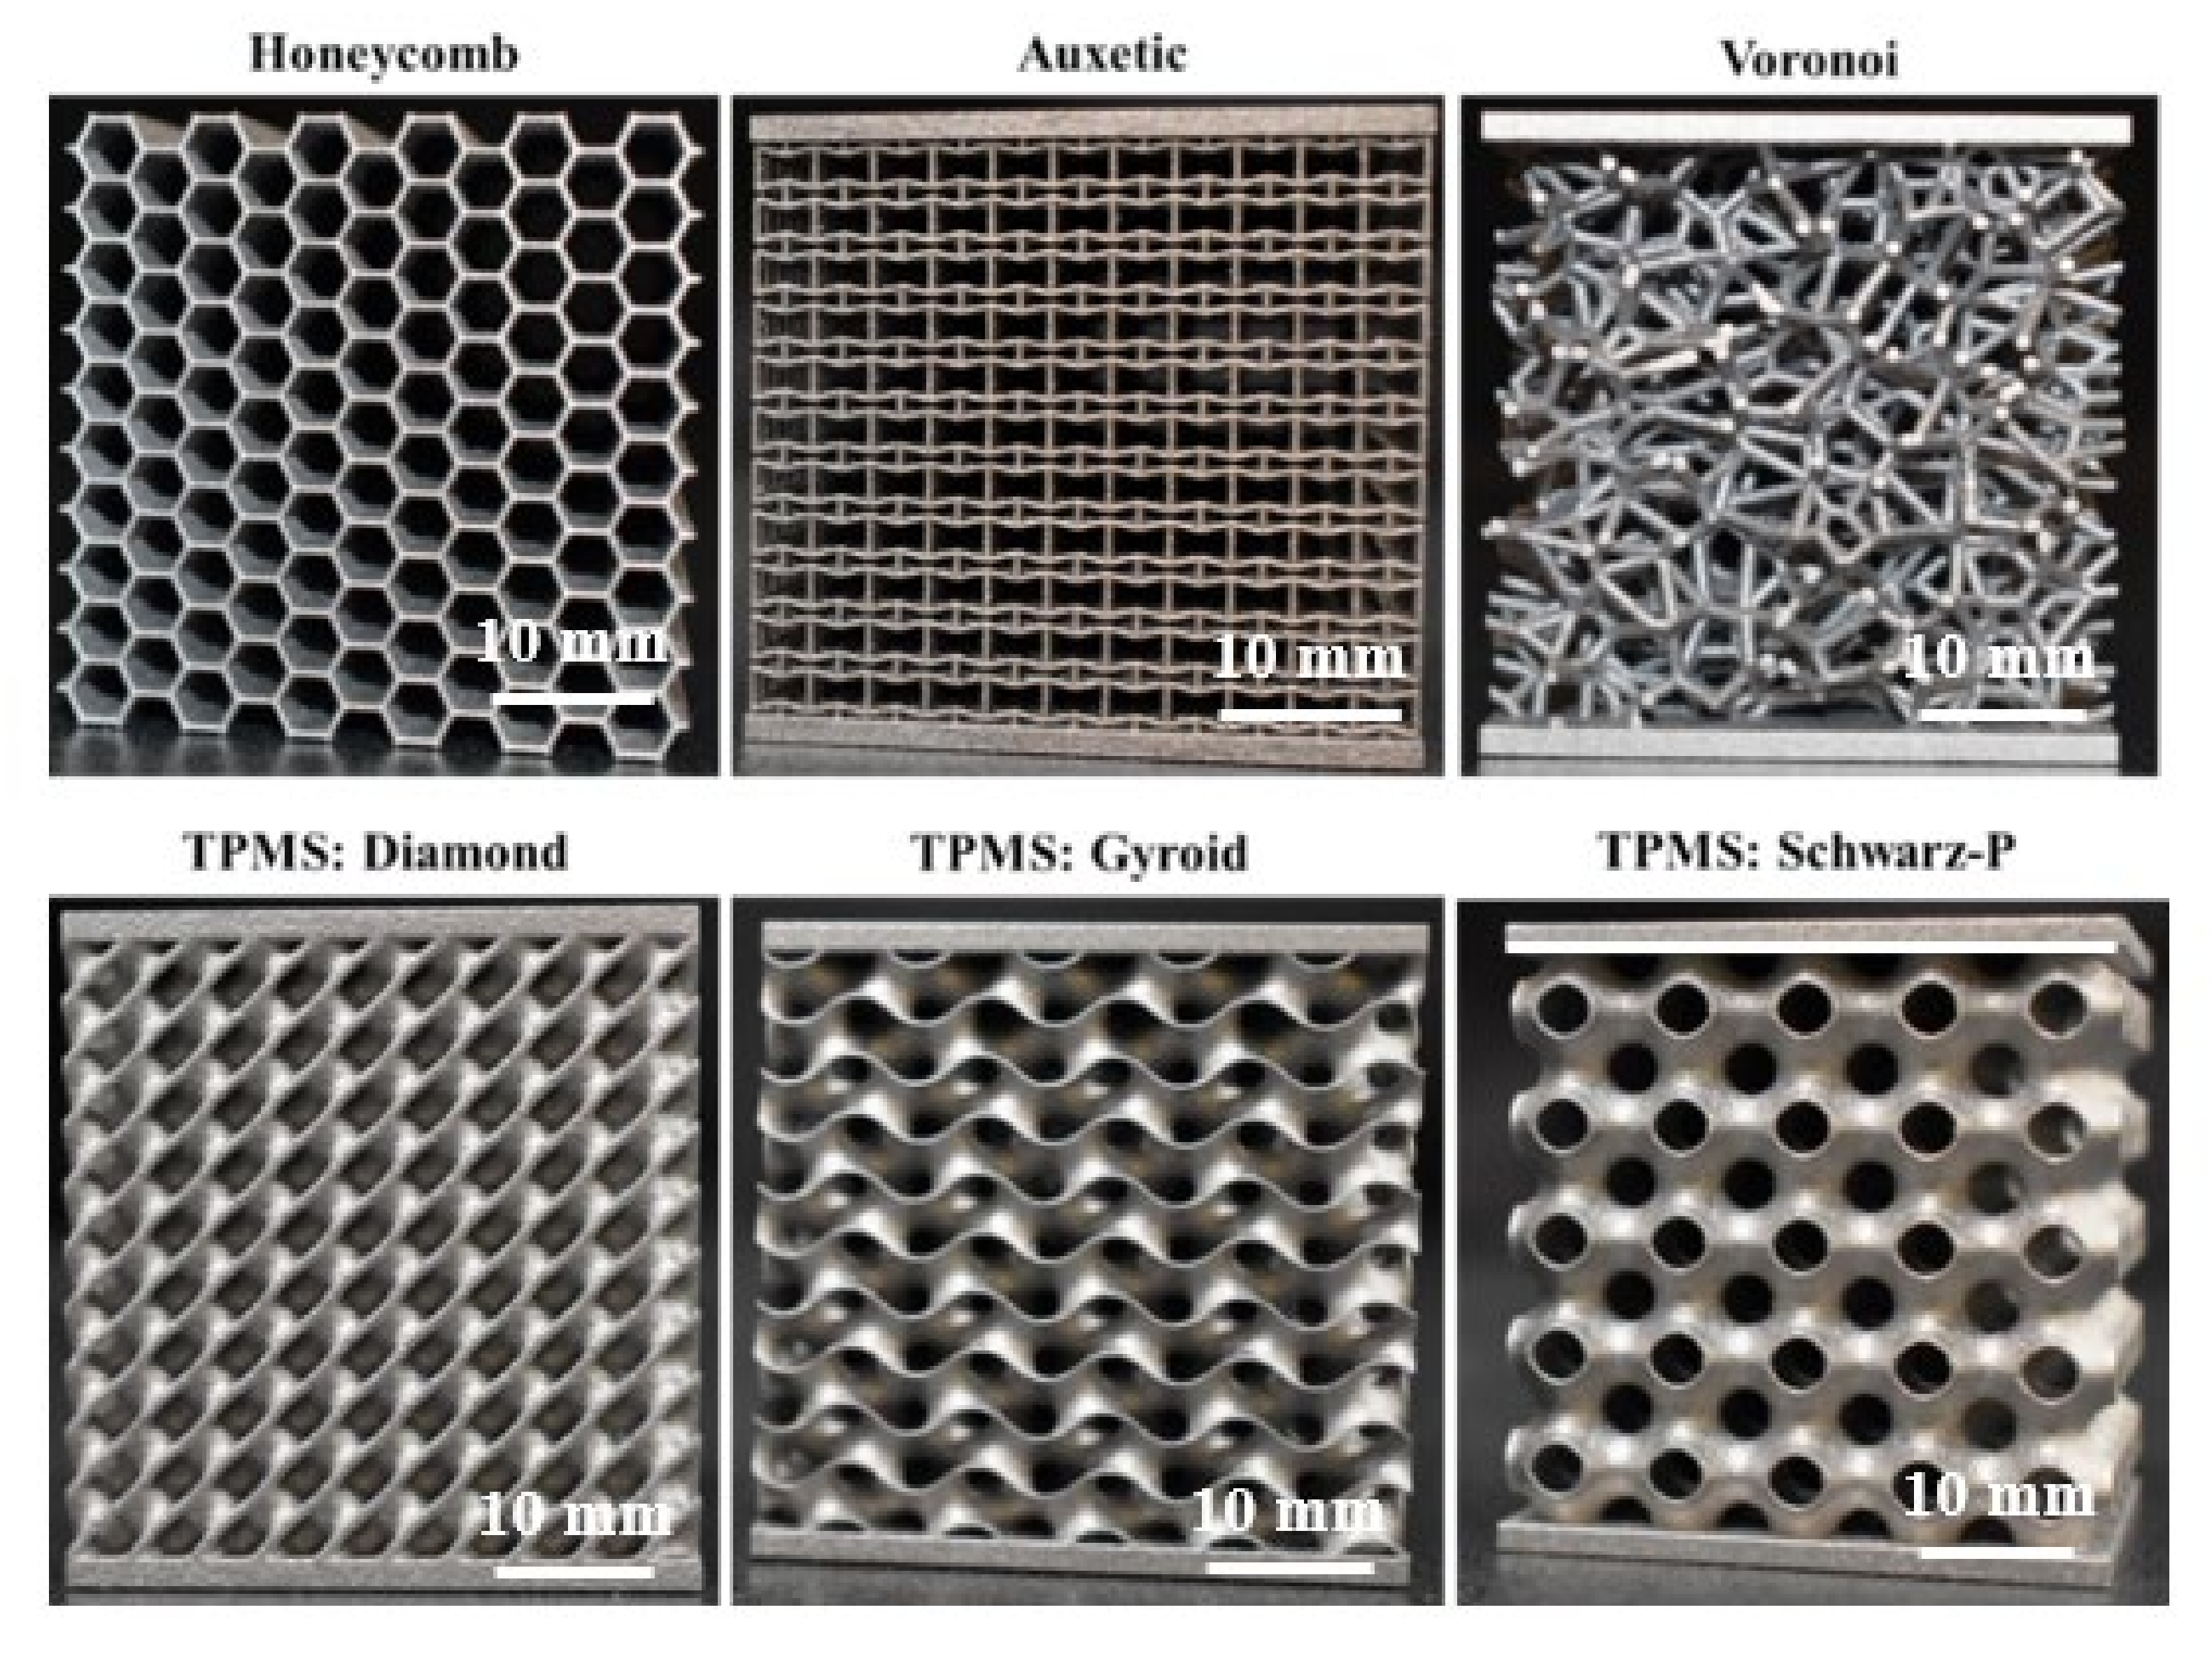
All specimens used in this study were manufactured at an established external manufacturing company on a Concept Laser MLab Cusing R machine (GE additive, Cincinnati, OH, USA) equipped with a single 100 W ytterbium fiber laser source. The wavelength and spot size of the laser beam were 1070 nm and 50 um, respectively, with a continuous scan strategy consisting of a single contour and internal raster. A layer thickness of 15 um was employed for all specimens. The internal raster had a laser power of 95 W, a scan speed of 550 mm/s and a hatch spacing of 0.105 mm, resulting in a volumetric energy density of 110 J/mm3. The contour had a laser power of 95 W and scan speed of 2000 mm/s. These parameters were developed by the supplier for AlSi10Mg on this particular machine and were shown to meet the ASTM F3318 standard [37] property requirements for laser powder bed fusion of AlSi10Mg. Commercial AlSi10Mg powder was used that conforms with the chemical composition stipulated in ASTM F3318 [37]. All parts were stress-relieved following ASTM F3318 (in turn following the AMS2771 standard [38], only with the temperature set at 285 °C for 120 min, followed by air-cooling). All specimens with top and bottom end-plates were oriented as shown in Figure 3a, whereas specimens enclosed in tubes were oriented as shown in Figure 3b. Honeycombs were similarly fabricated with vertical walls. Examples of the specimens post-fabrication and heat treatment are shown in Figure 4.
Prior to mechanical compression, all of the specimens were weighed on an HR-250A analytical balance manufactured by A&D (Tokyo, Japan) with a 0.0001 g resolution, and the mass results are shown in Table 2. These mass measurements were compared to the estimated mass in the nTopology software by assuming a density of AlSi10Mg as 2.68 g/cm3, and the differences were estimated as an approximate measure of how closely the manufactured cellular structures conformed to the designed geometries. Most mass errors were within 10%, with the exception of the auxetic lattices which were 10–17% heavier than nominal design predictions. Measured relative density values reported in Table 2 were estimated with the assumption that all mass variations accrue to the cellular members alone, as opposed to the end-plates, or in the case of specimens enclosed in tubes, to the tube walls.
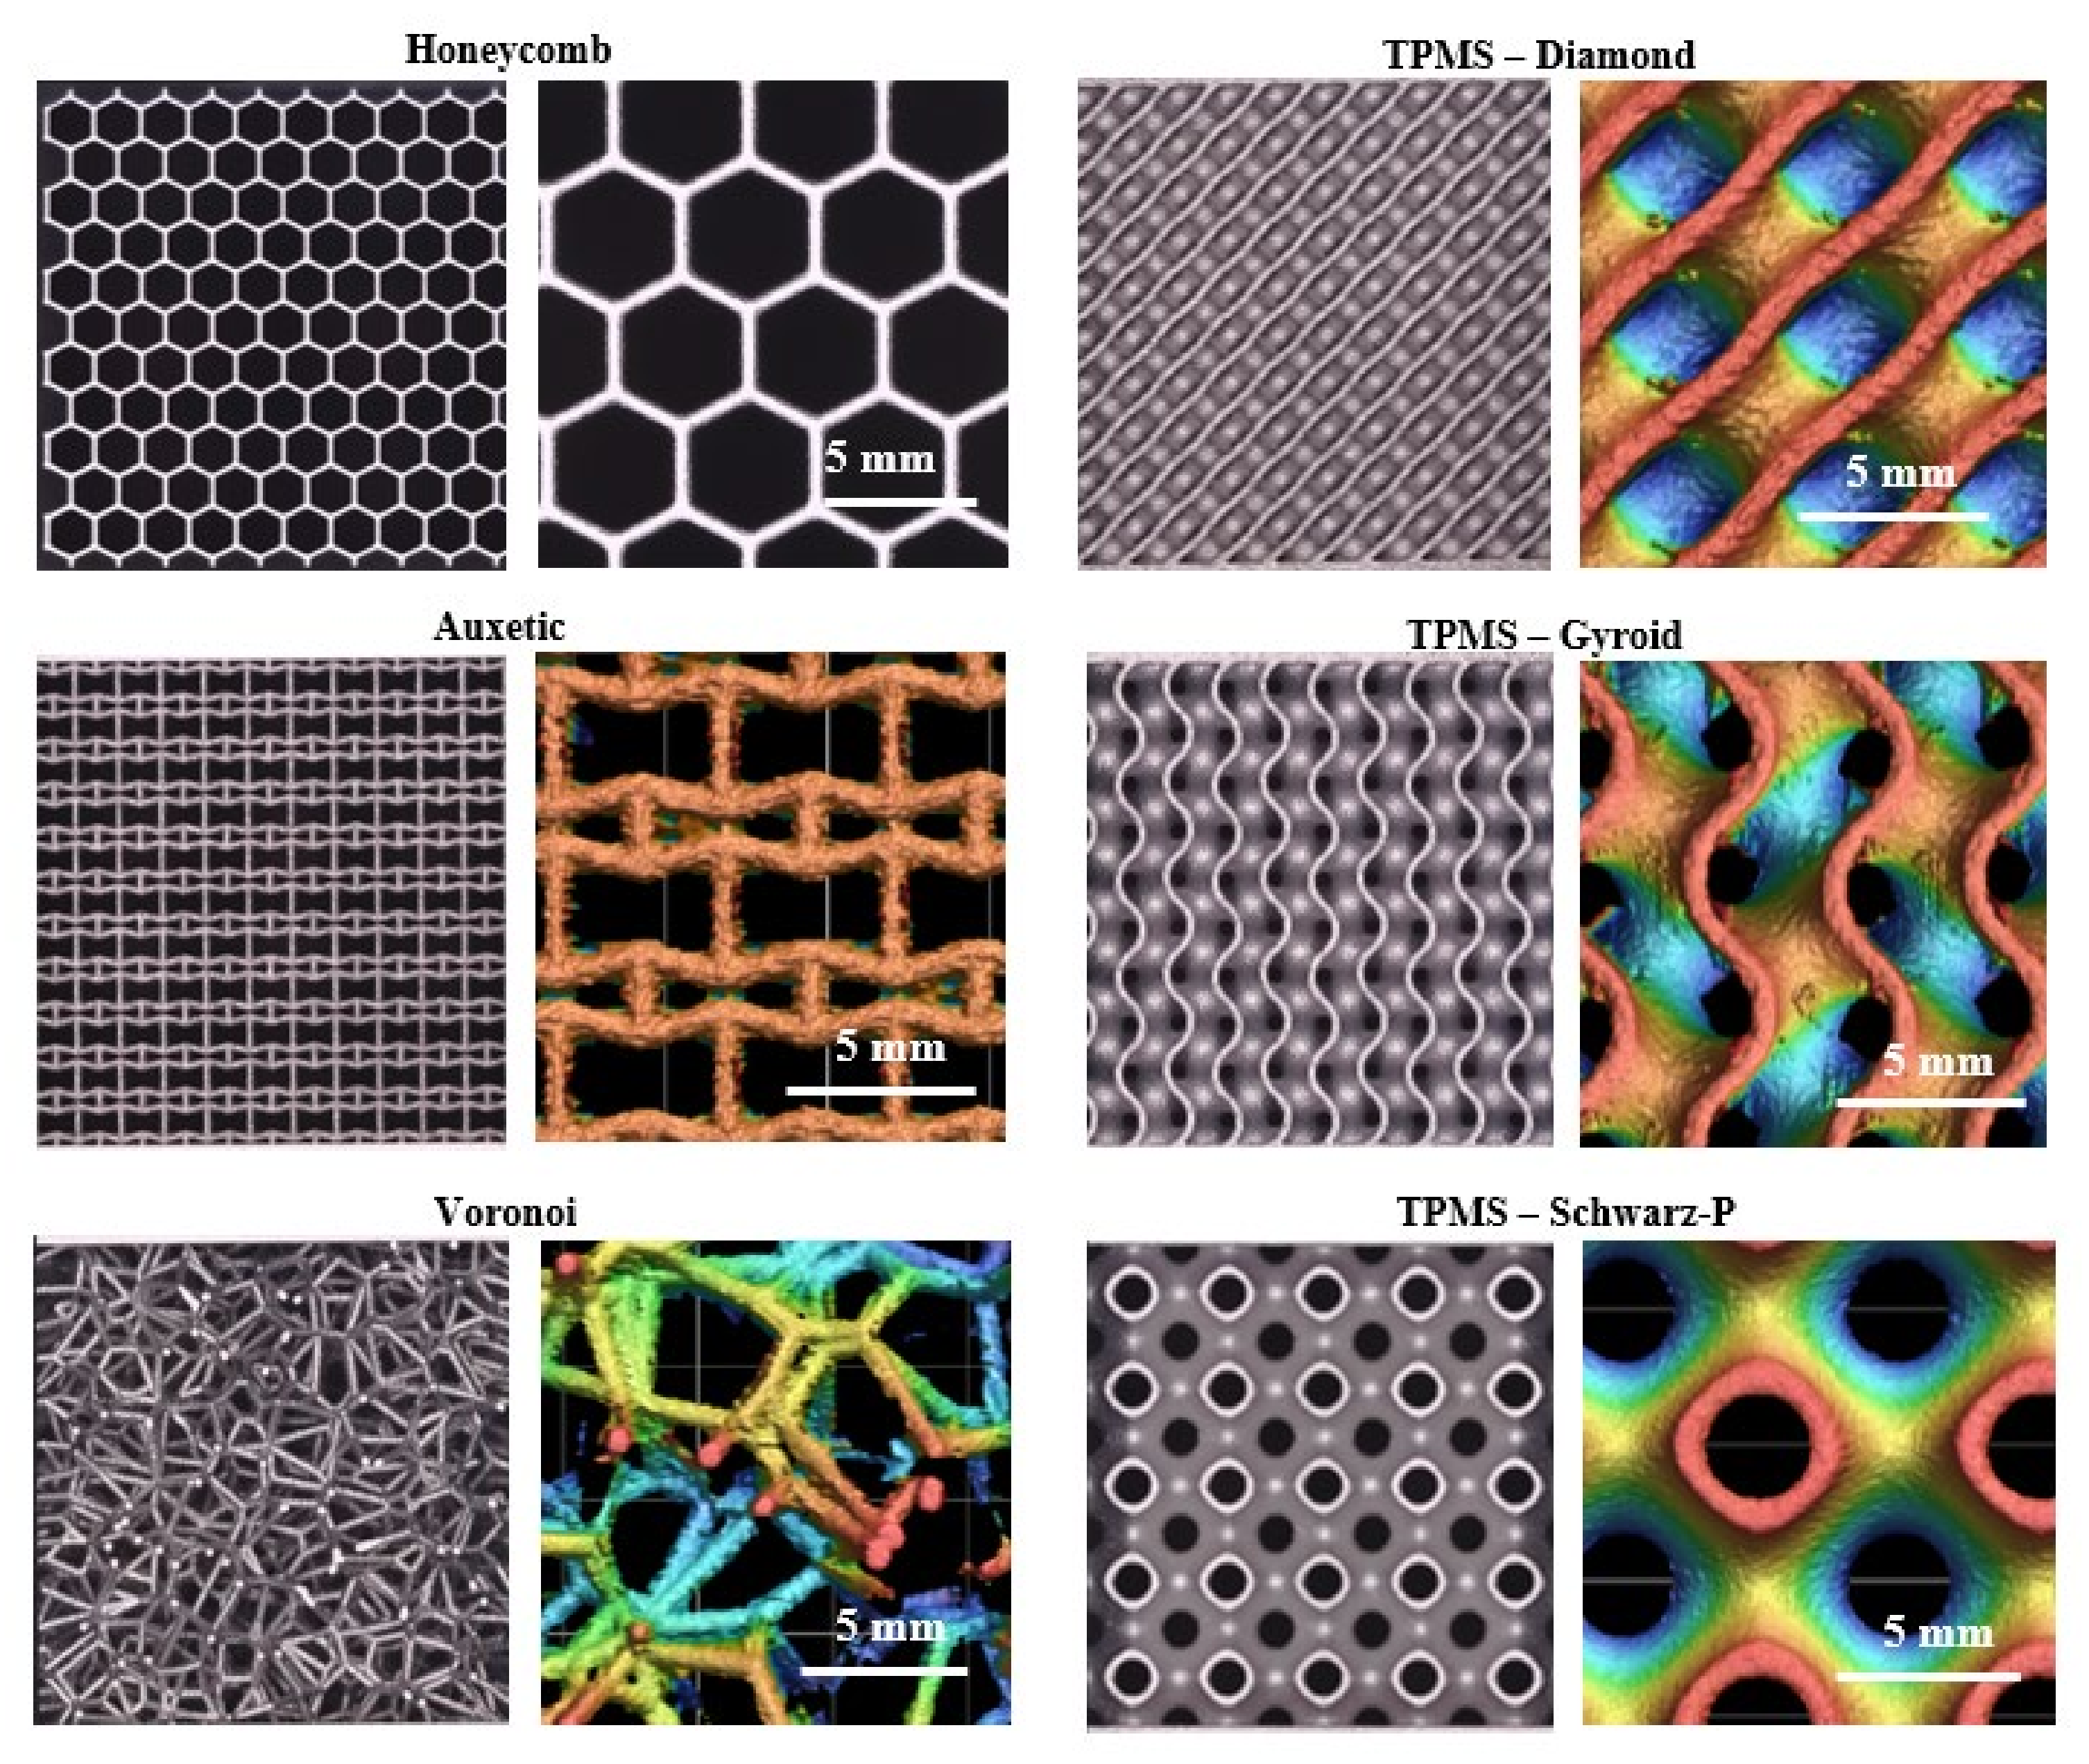
To ascertain the causes for deviation in mass calculations, the specimens were all examined under a Keyence VR-3200 3D measurement macroscope and VR 3000 G2 series software (V2.5, Keyence corporation, Osaka, Japan). Optical and height data from the microscope for each of the six shapes in this study are shown in Figure 5. Inspection of the auxetic specimens clearly shows significant roughness on the beams, the majority of which are low-angle overhanging beams. The additional mass may be attributed to this surface morphology, which is also borne out by the Voronoi, which has a more variable distribution of beam orientation but does also show higher mass values than designed, particularly at higher relative densities. All subsequent discussions of relative density thus leverage experimental values instead of nominal values.

2.3. Compression Test Setup

Quasi-static compression testing was carried out on all cellular materials using an Instron 5985 universal testing machine load frame with a load capacity of 250 kN at a constant displacement rate selected to effectively generate a strain rate of 10−3 s−1. The loading direction was perpendicular to the end-plates and along the direction of the walls of the tubes. Honeycombs were compressed out-of-plane. Stress and strain calculations were made based on area and specimen height estimates from the bounding box volumes, with the thicknesses of the end-plates subtracted for height calculations. A 50 N preload was applied on each specimen prior to application of the specified displacement rate. The deformation patterns of the cellular structures were recorded via two Nikon D3500 digital SLR video cameras (Nikon corporation, Tokyo, Japan) with 18–55 mm lens at an image capture frequency of 1 Hz. The cameras were set at right angles to each other. Rectangular stainless steel platens were used on the compression machine with no lubrication between the platens and the specimen surface.
A typical force–displacement curve obtained for a compression test is shown in Figure 1a. In addition, for the metrics described in Section 1 that are commonly used in the literature, this work introduces two more parameters that help characterize the variability in the plateau region:
First dip: the first dip is defined as the difference between the first maxima and the first minima on the force–displacement curve.
Plateau range: the difference in the maximum and minimum force in the plateau region is denoted as the plateau range. In most cases, the first minima occur right after the peak force and the maxima occurs at the onset strain of densification, but this is not always the case, as shall be seen in the next section.
An objective for designing the ideal energy absorber is to minimize the variance of load in the plateau—flatter plateaus are less likely to exceed the maximum allowable transmitted stress while also maximizing energy absorption.

3. Results

The results are presented in this section in three parts: Section 3.1 reports findings from the compression tests for each unit cell shape, emphasizing the role of geometry in influencing the observed behavior and identifying key questions that are discussed in Section 4. Section 3.2 examines how the tube affects the behavior of the cellular materials. Section 4 enables a comparison between the cellular shapes in the context of the metrics introduced previously.

3.1. Effect of Unit Cell Shape

3.1.1. Hexagonal Honeycomb

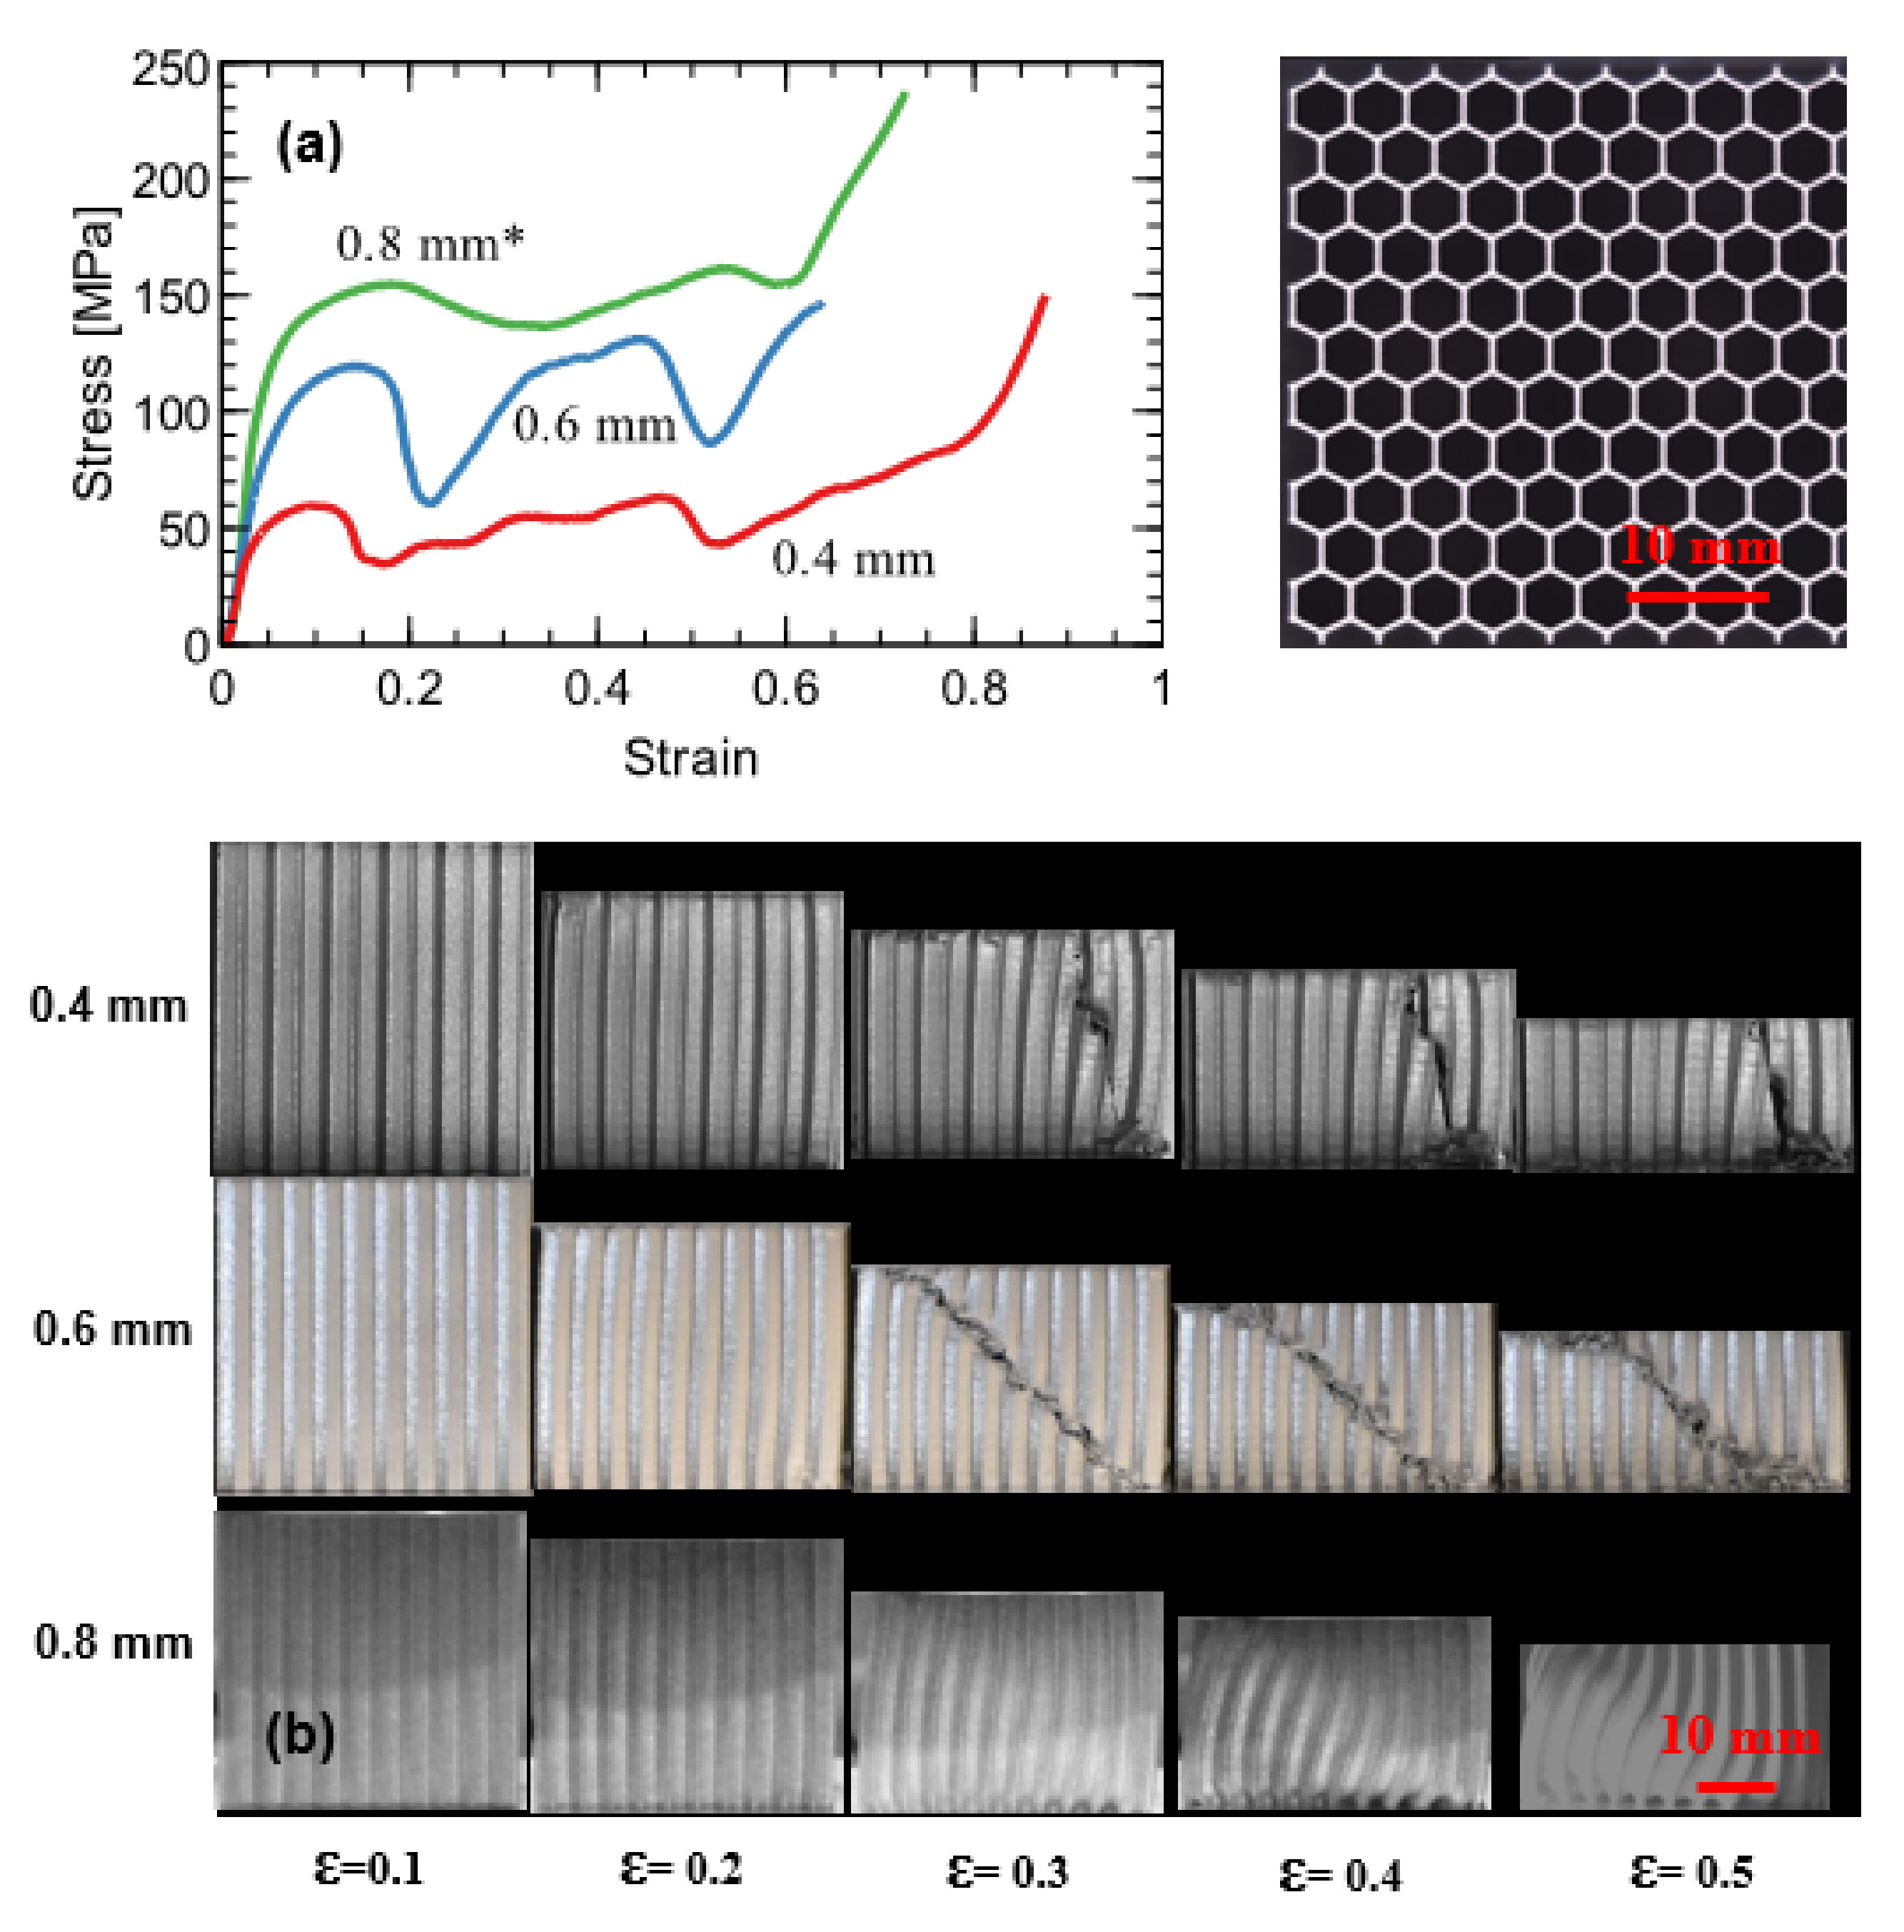
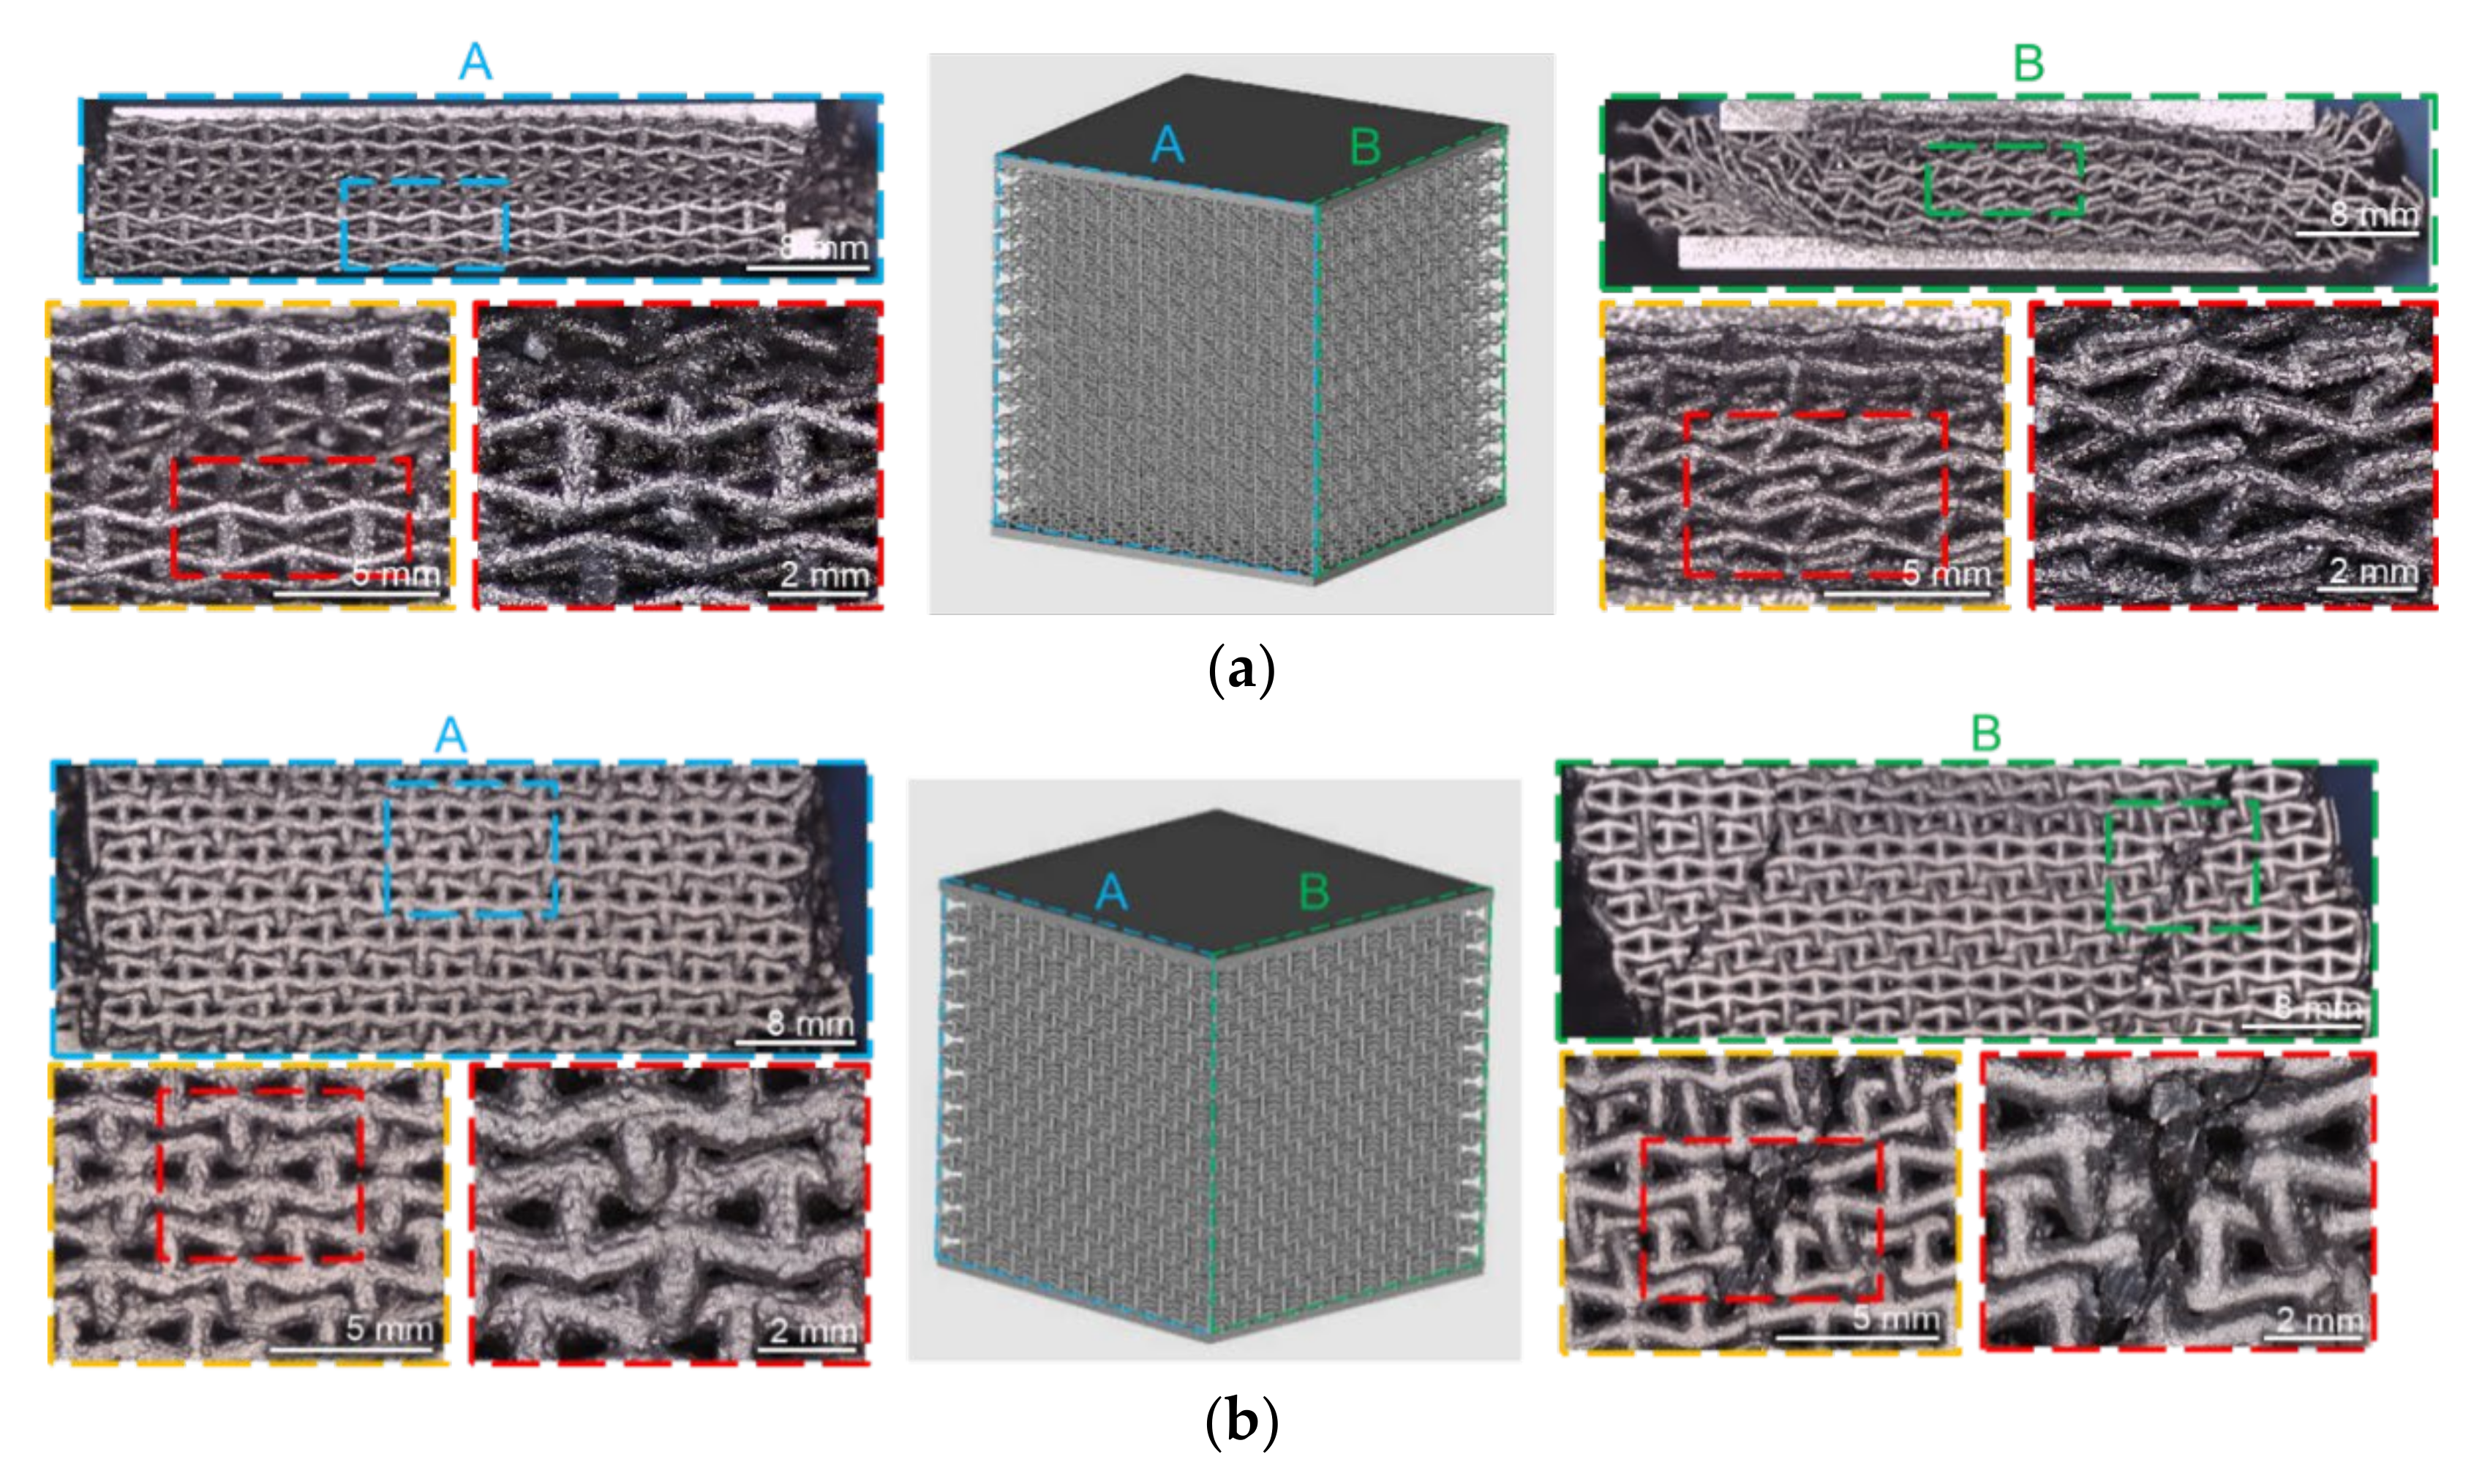
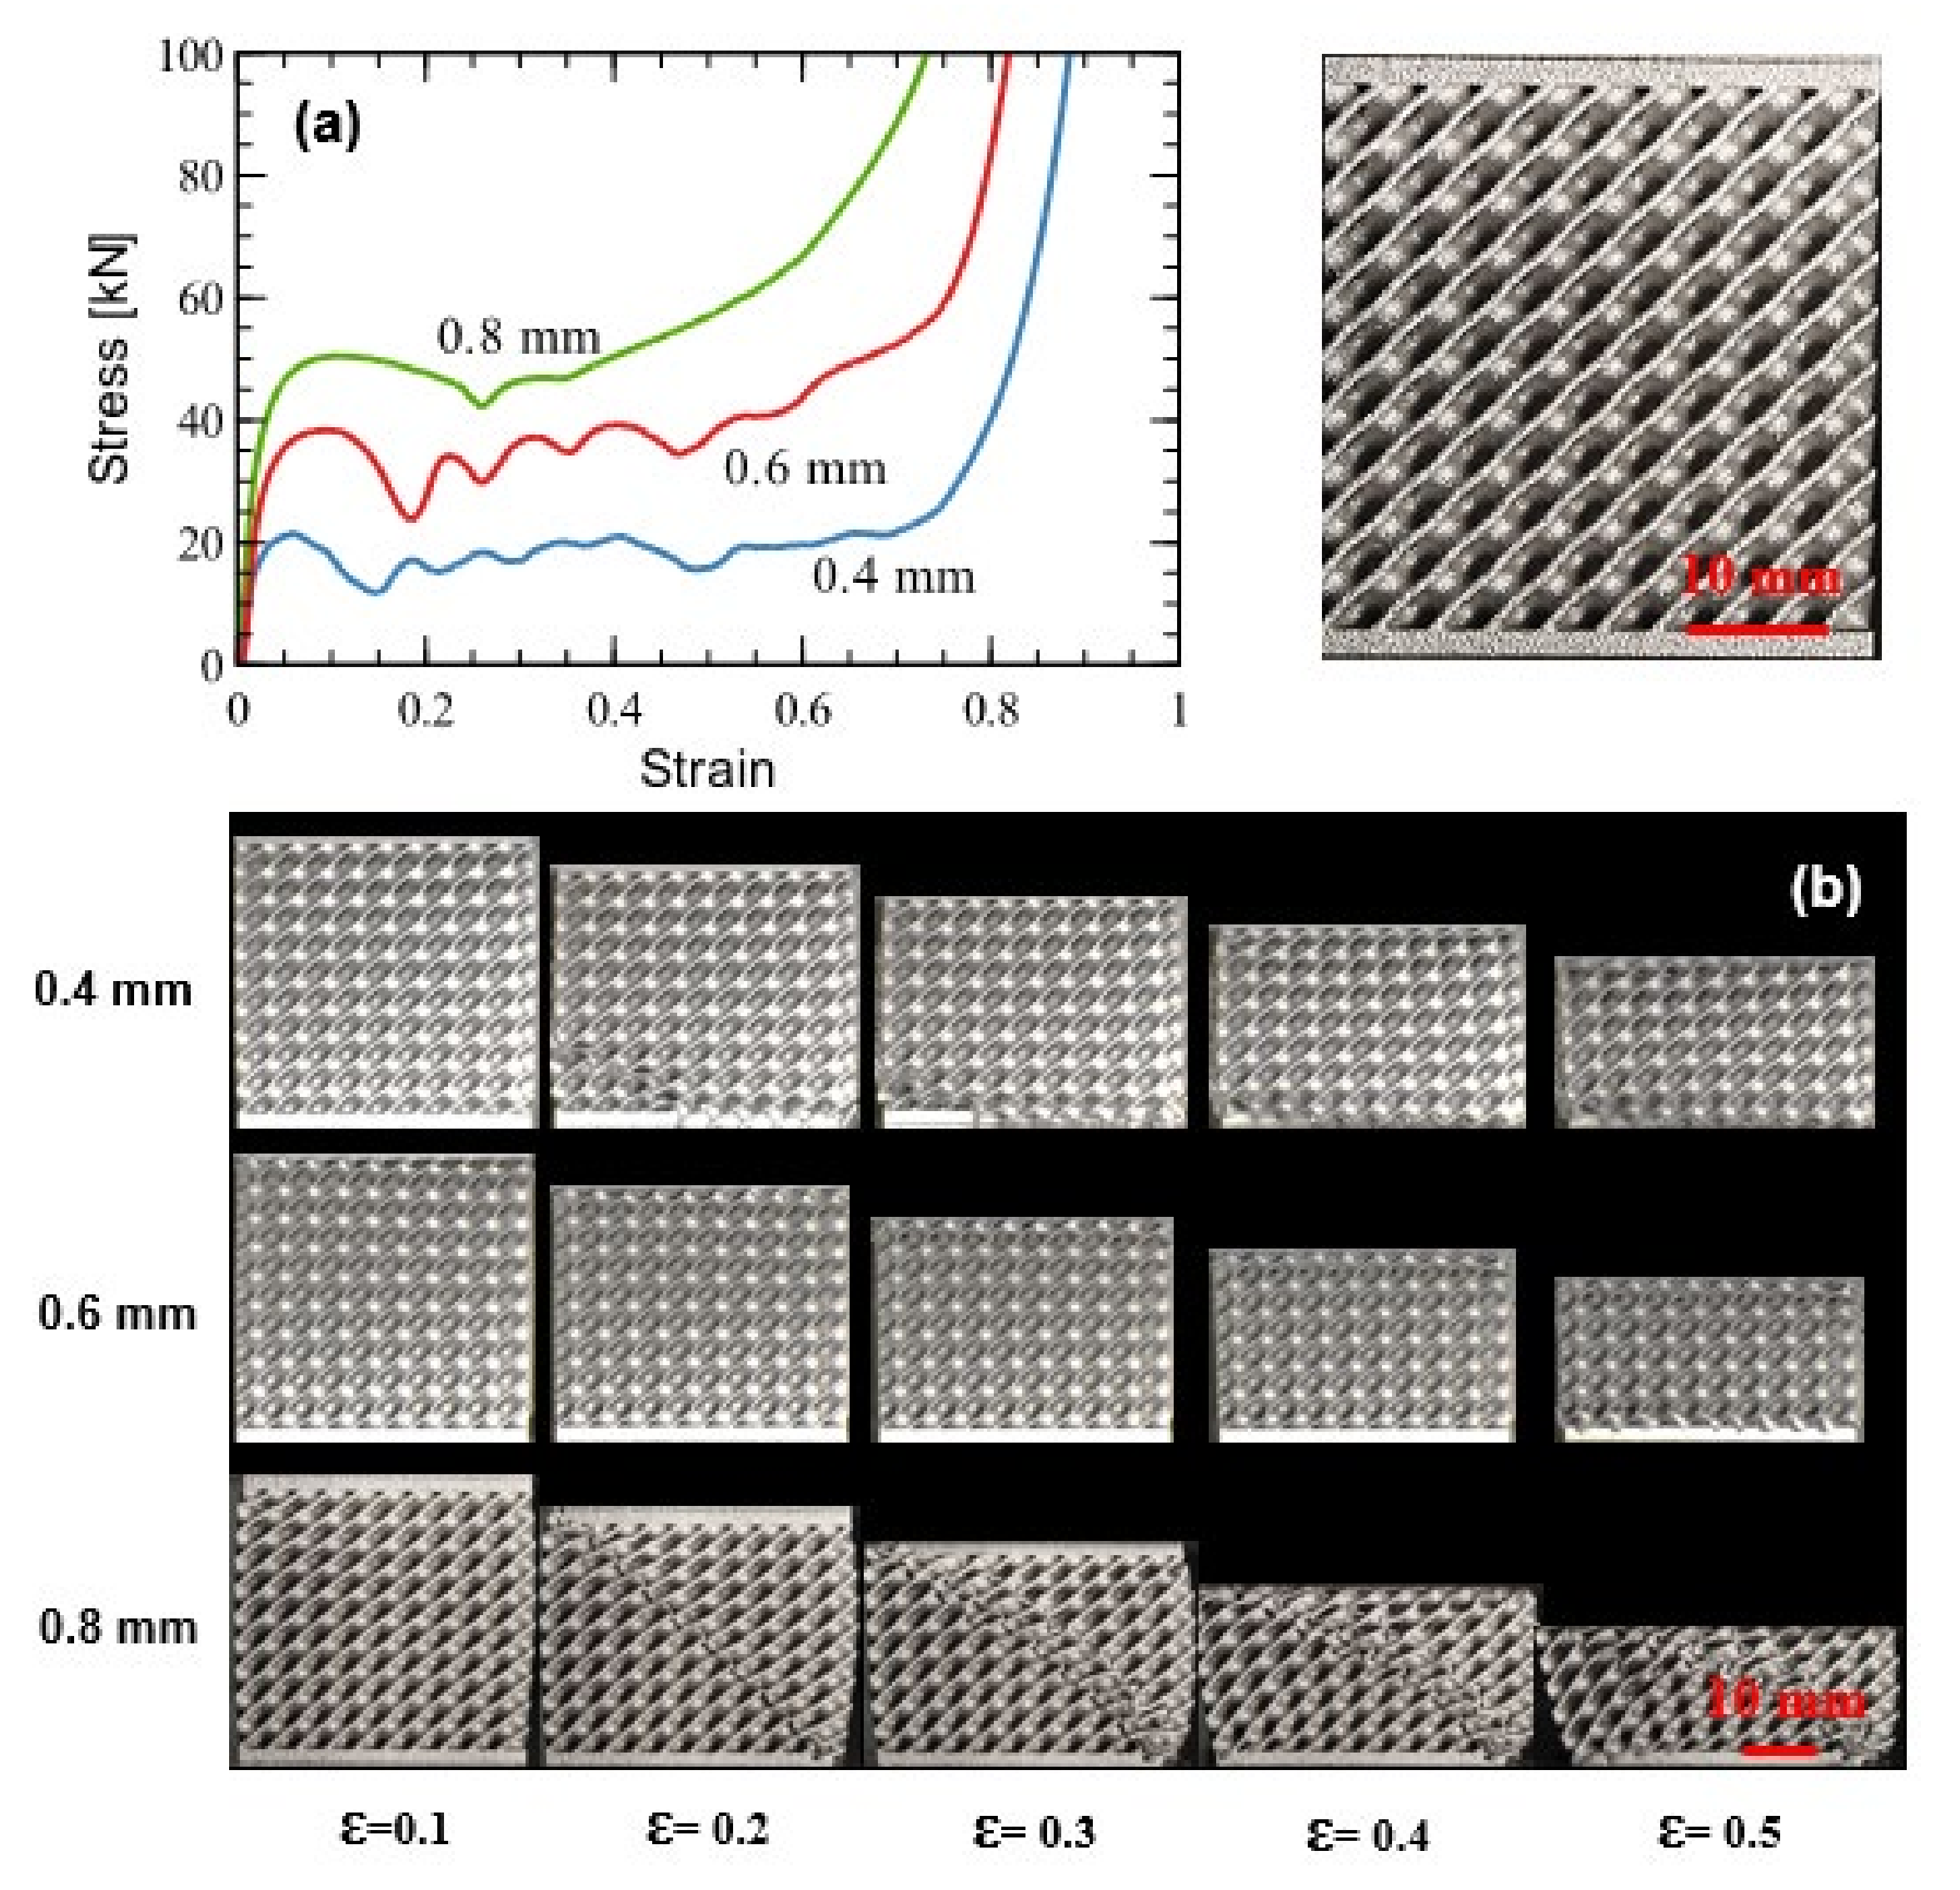
As shown in Figure 6a, out-of-plane compression of the hexagonal honeycombs with three different wall thicknesses (and associated relative densities) all show an evident peak stress, followed by a plateau region. The 0.8 mm thickness specimen was tested on a 500 kN load frame since it was calculated to exceed the 250 kN load capacity for the machine used for testing all the other specimens. An examination of the stress–strain response reveals that the stress reaches a first maximum for all three shapes between an effective strain of 0.1–0.2. This is primarily the result of top and bottom surface crimping, as visible in Figure 6b for a strain of 0.2. The 0.6 mm wall thickness specimen shows a significant drop in the peak stress with a large first dip, which is associated with the formation of an inclined failure band in the structure, after which point the stress drops rapidly. In contrast to the other specimens studied in this work, the honeycomb is a prismatic structure and frequent stress rises and drops are not visible, with failure bands not materializing layer by layer, and instead forced to form along inclined planes. As shown in Figure 7, for the 0.8 mm-thick honeycomb, the failure bands result in fracture, and, furthermore, they are not visible on every surface. With the exception of the 0.6 mm wall thickness specimen, the honeycombs show reasonably good behavior, consistent with their well-described properties as energy absorbers: they demonstrate a clear first peak and a plateau, and at low relative densities in particular, they seem to have delayed onset strain of densification. The honeycomb specimens also establish a baseline for comparison to the lattice- and TPMS-based geometries.

3.1.2. Auxetic Lattice

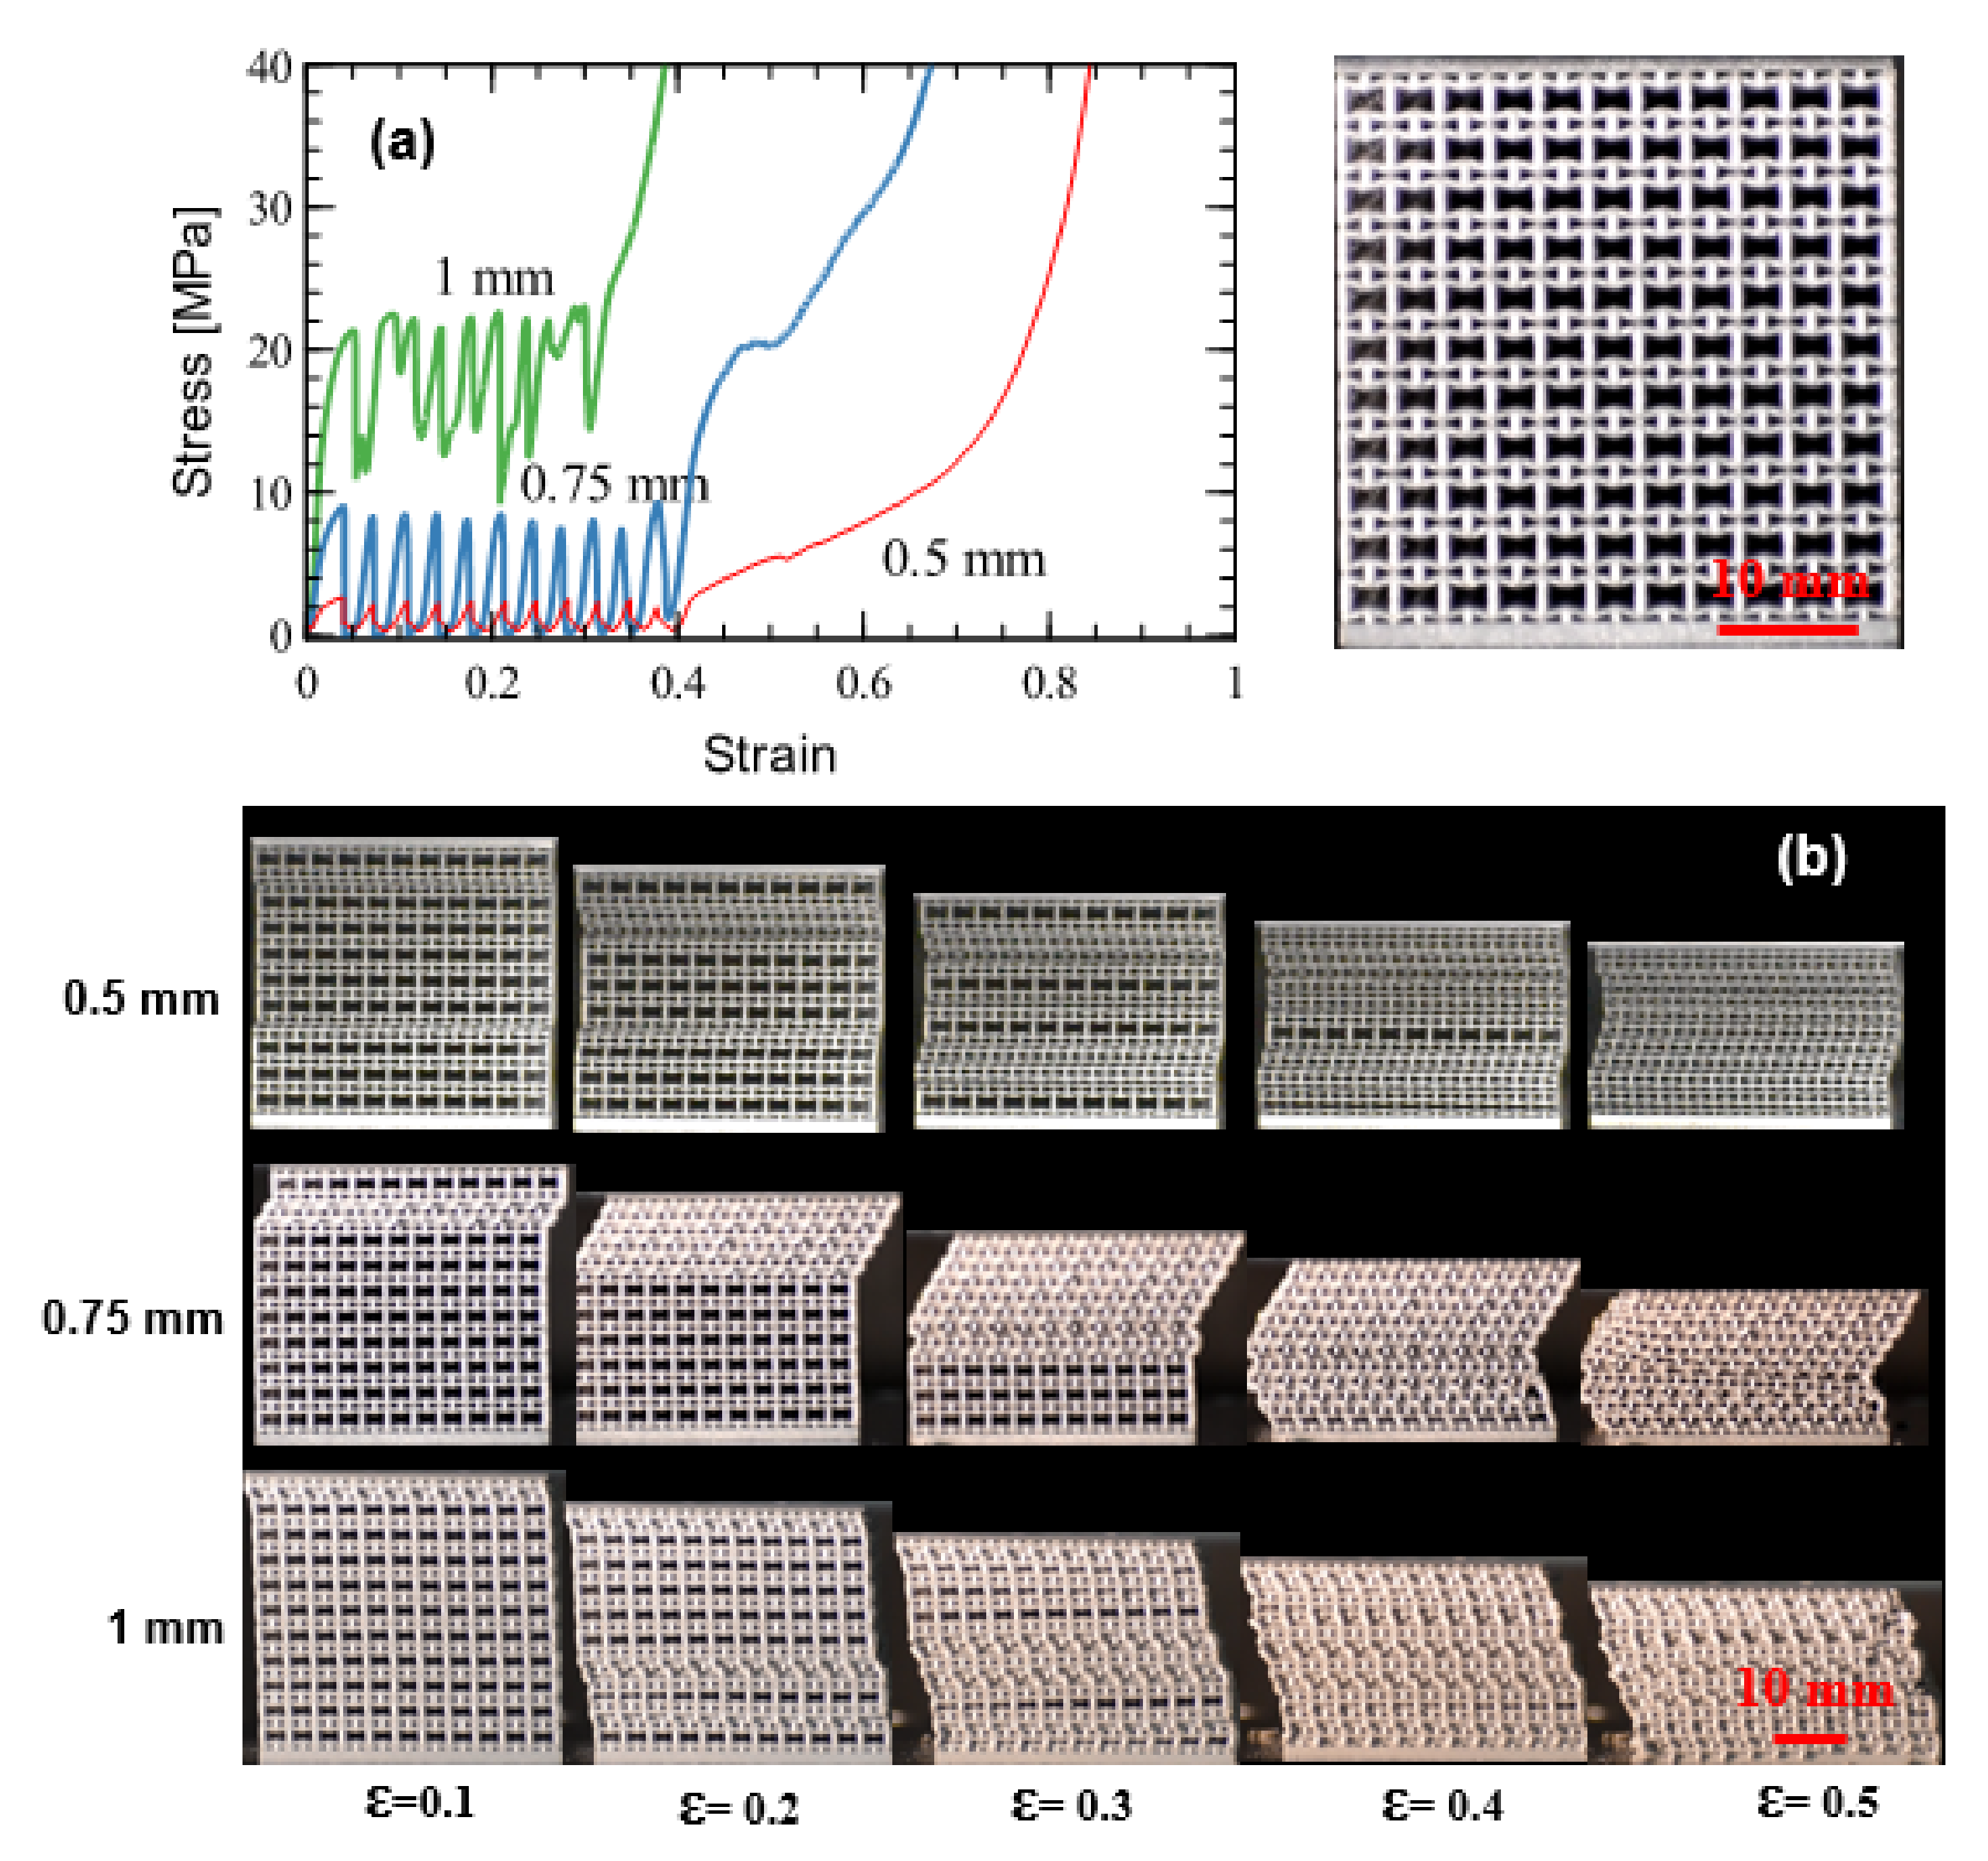
The auxetic lattice, of all the structures in this study, showed the highest undulation, with each load drop coinciding with a collapse of an entire row of beams, as shown in Figure 8a,b (Supplementary Video S1). A visual comparison of the auxetic lattice and the prior honeycomb stress–strain response immediately suggests that the auxetic shape is a poor candidate for an energy absorber. The auxetic shape has parallel beams in the direction of loading which resist the load until it exceeds the critical buckling load. The entire row, on collapse, then effectively shears sideways. As seen in Figure 9 for the densest auxetic lattice in this study, in addition to row-by-row densification, inclined failure bands also form, which were not visible for the lower density specimens. Finally, the onset strain of densification for all three relative density specimens is at or under 0.4, suggesting poor overall energy efficiency for the auxetic lattices.

3.1.3. Voronoi (Stochastic) Lattice

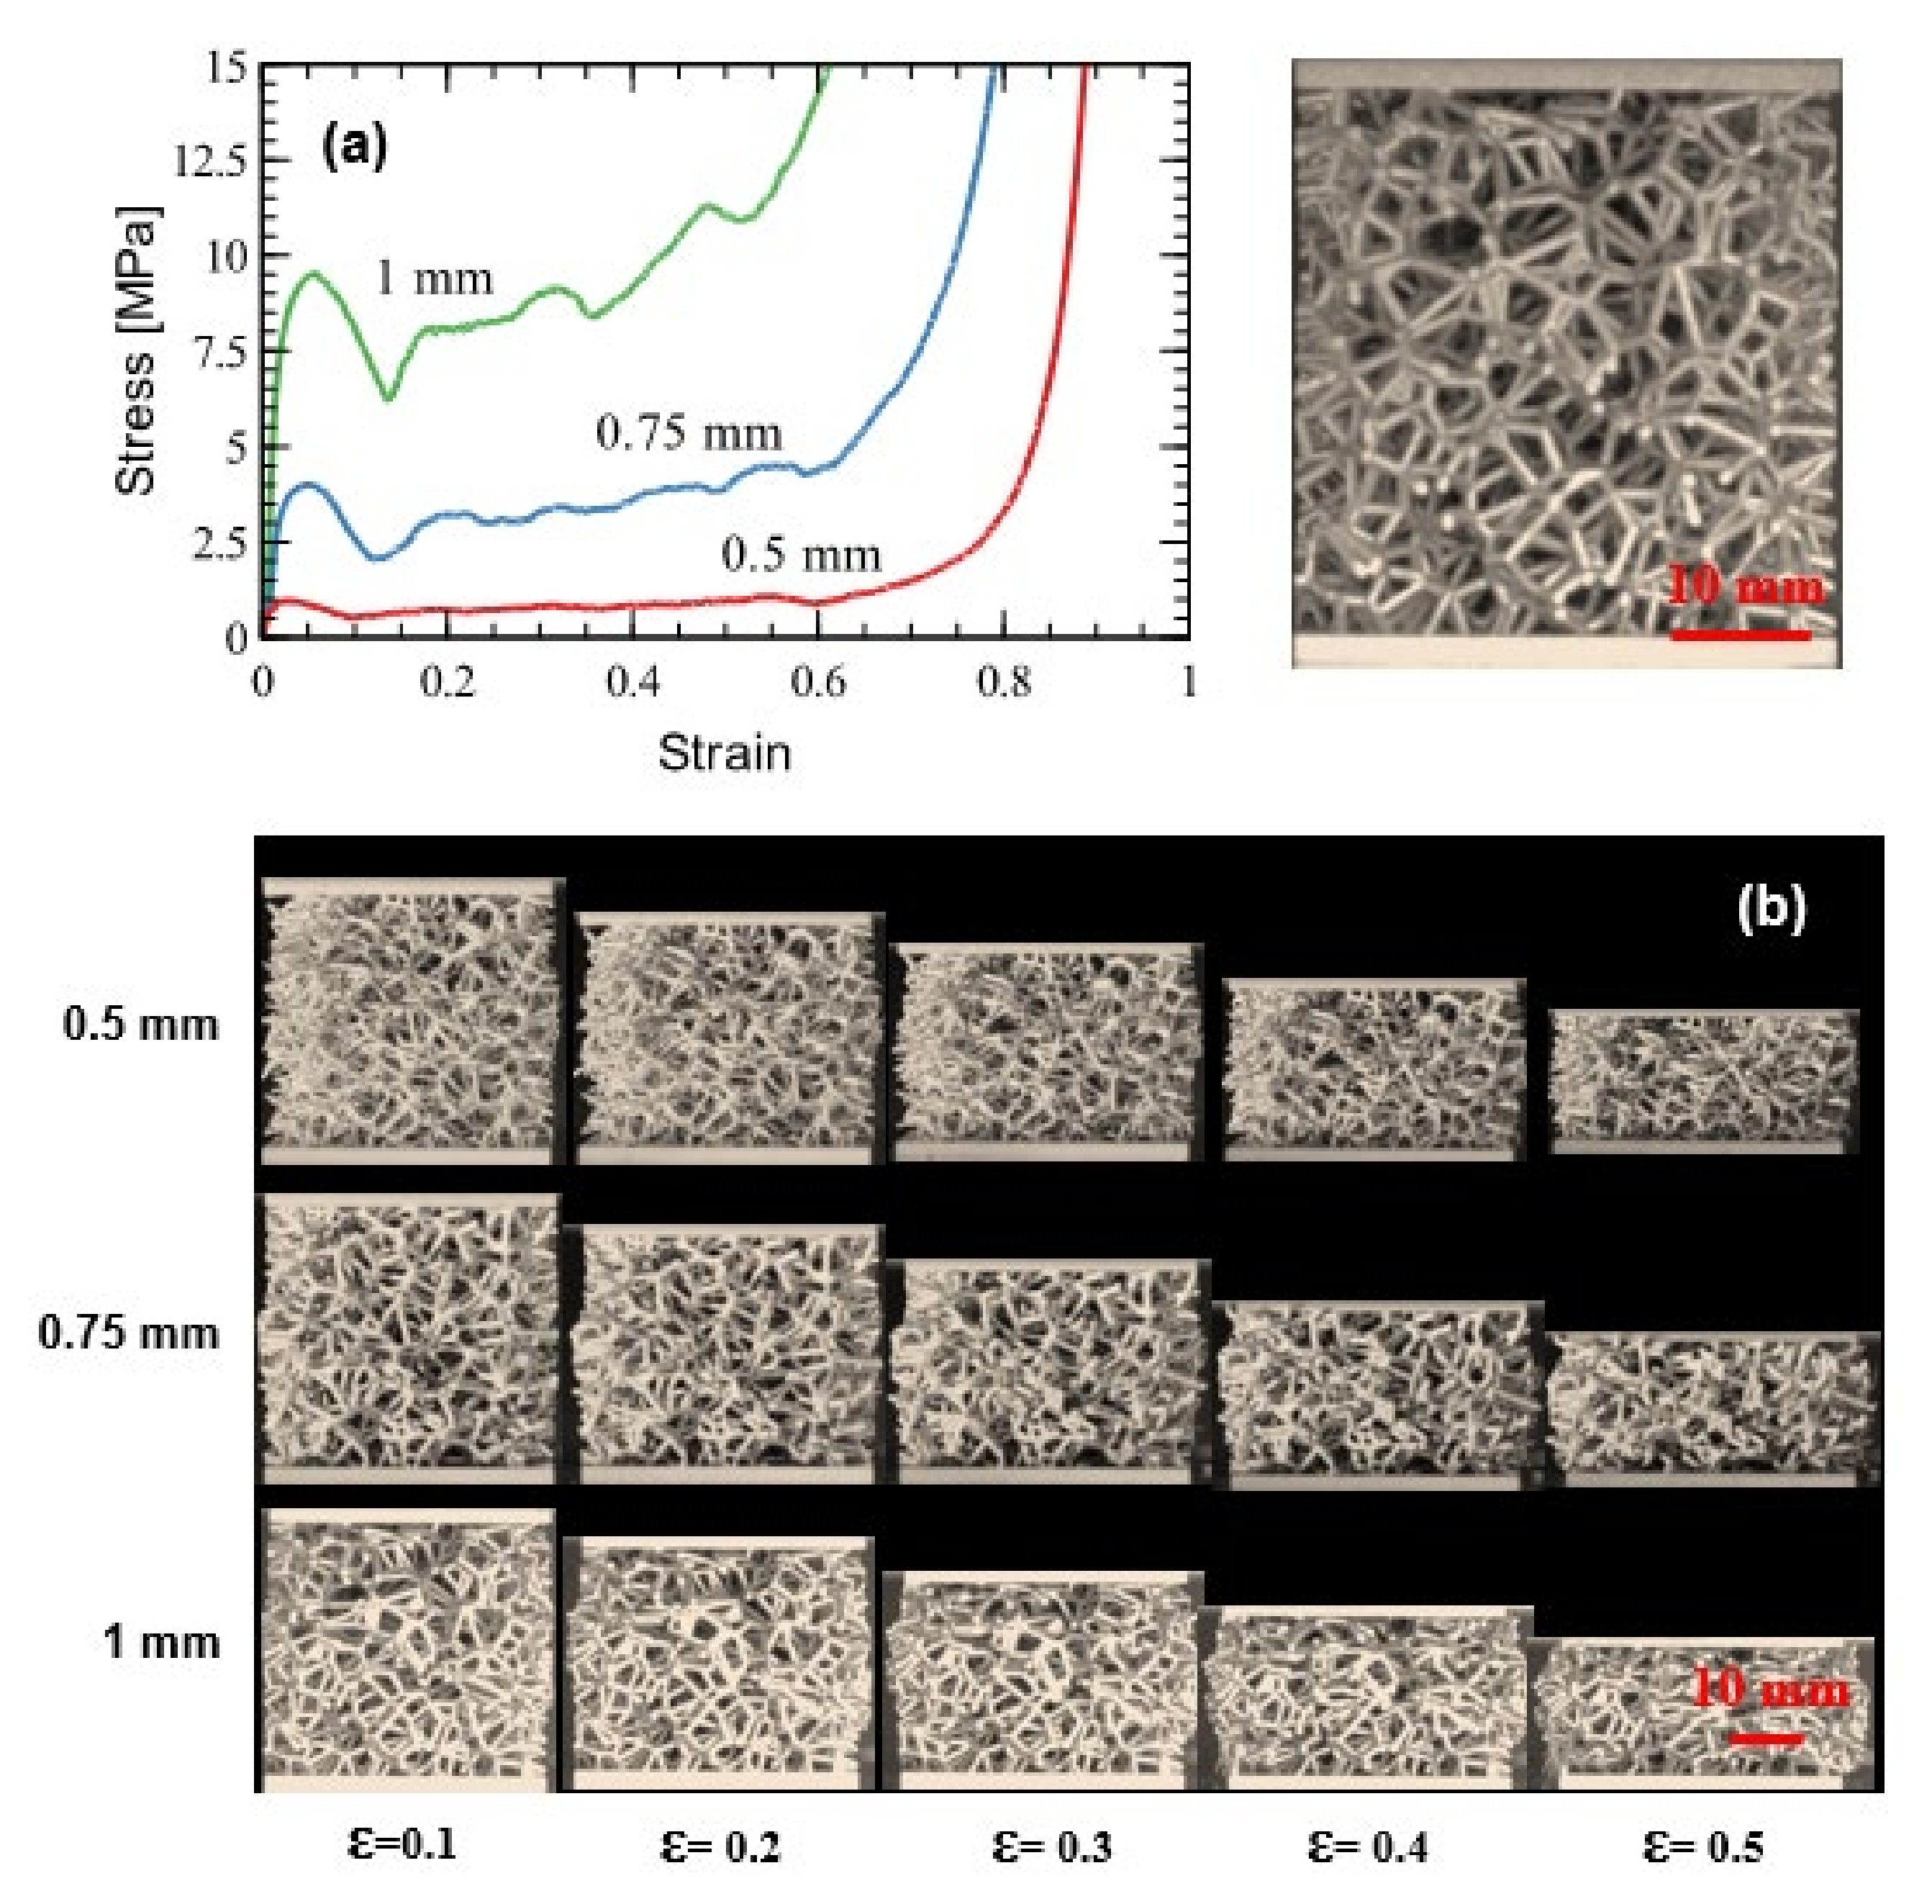
In contrast to the auxetic lattice, the Voronoi, or stochastic, lattice shows a much smoother stress–strain response, as seen in Figure 10a. The Voronoi structure has struts oriented in multiple directions with cell centroids randomly positioned so as to not emerge in the same plane (Figure 10b), in contrast to the auxetic lattices. Compared to the auxetic lattices, the Voronoi lattices have a higher onset strain of densification. For example, Figure 11 shows a post-compression Voronoi lattice with a relative density of 0.07, which is slightly lower than that of the auxetic lattice shown in Figure 9a (relative density of 0.08) yet it has an onset strain of densification that is almost 50% higher than that of the auxetic structure. The Voronoi lattice does however demonstrate a hardening tendency as relative density increases, and a significant first dip for all but the least dense of the specimens studied. The introduction of aperiodicity into lattice structures is thus helpful in preventing localization of failure bands and the resulting undulations in the stress plateau, but at the same time it does not assure a flat plateau that is required to ensure energy is absorbed at transmitted stress levels under the first maximum.

3.1.4. Schwarz-P TPMS

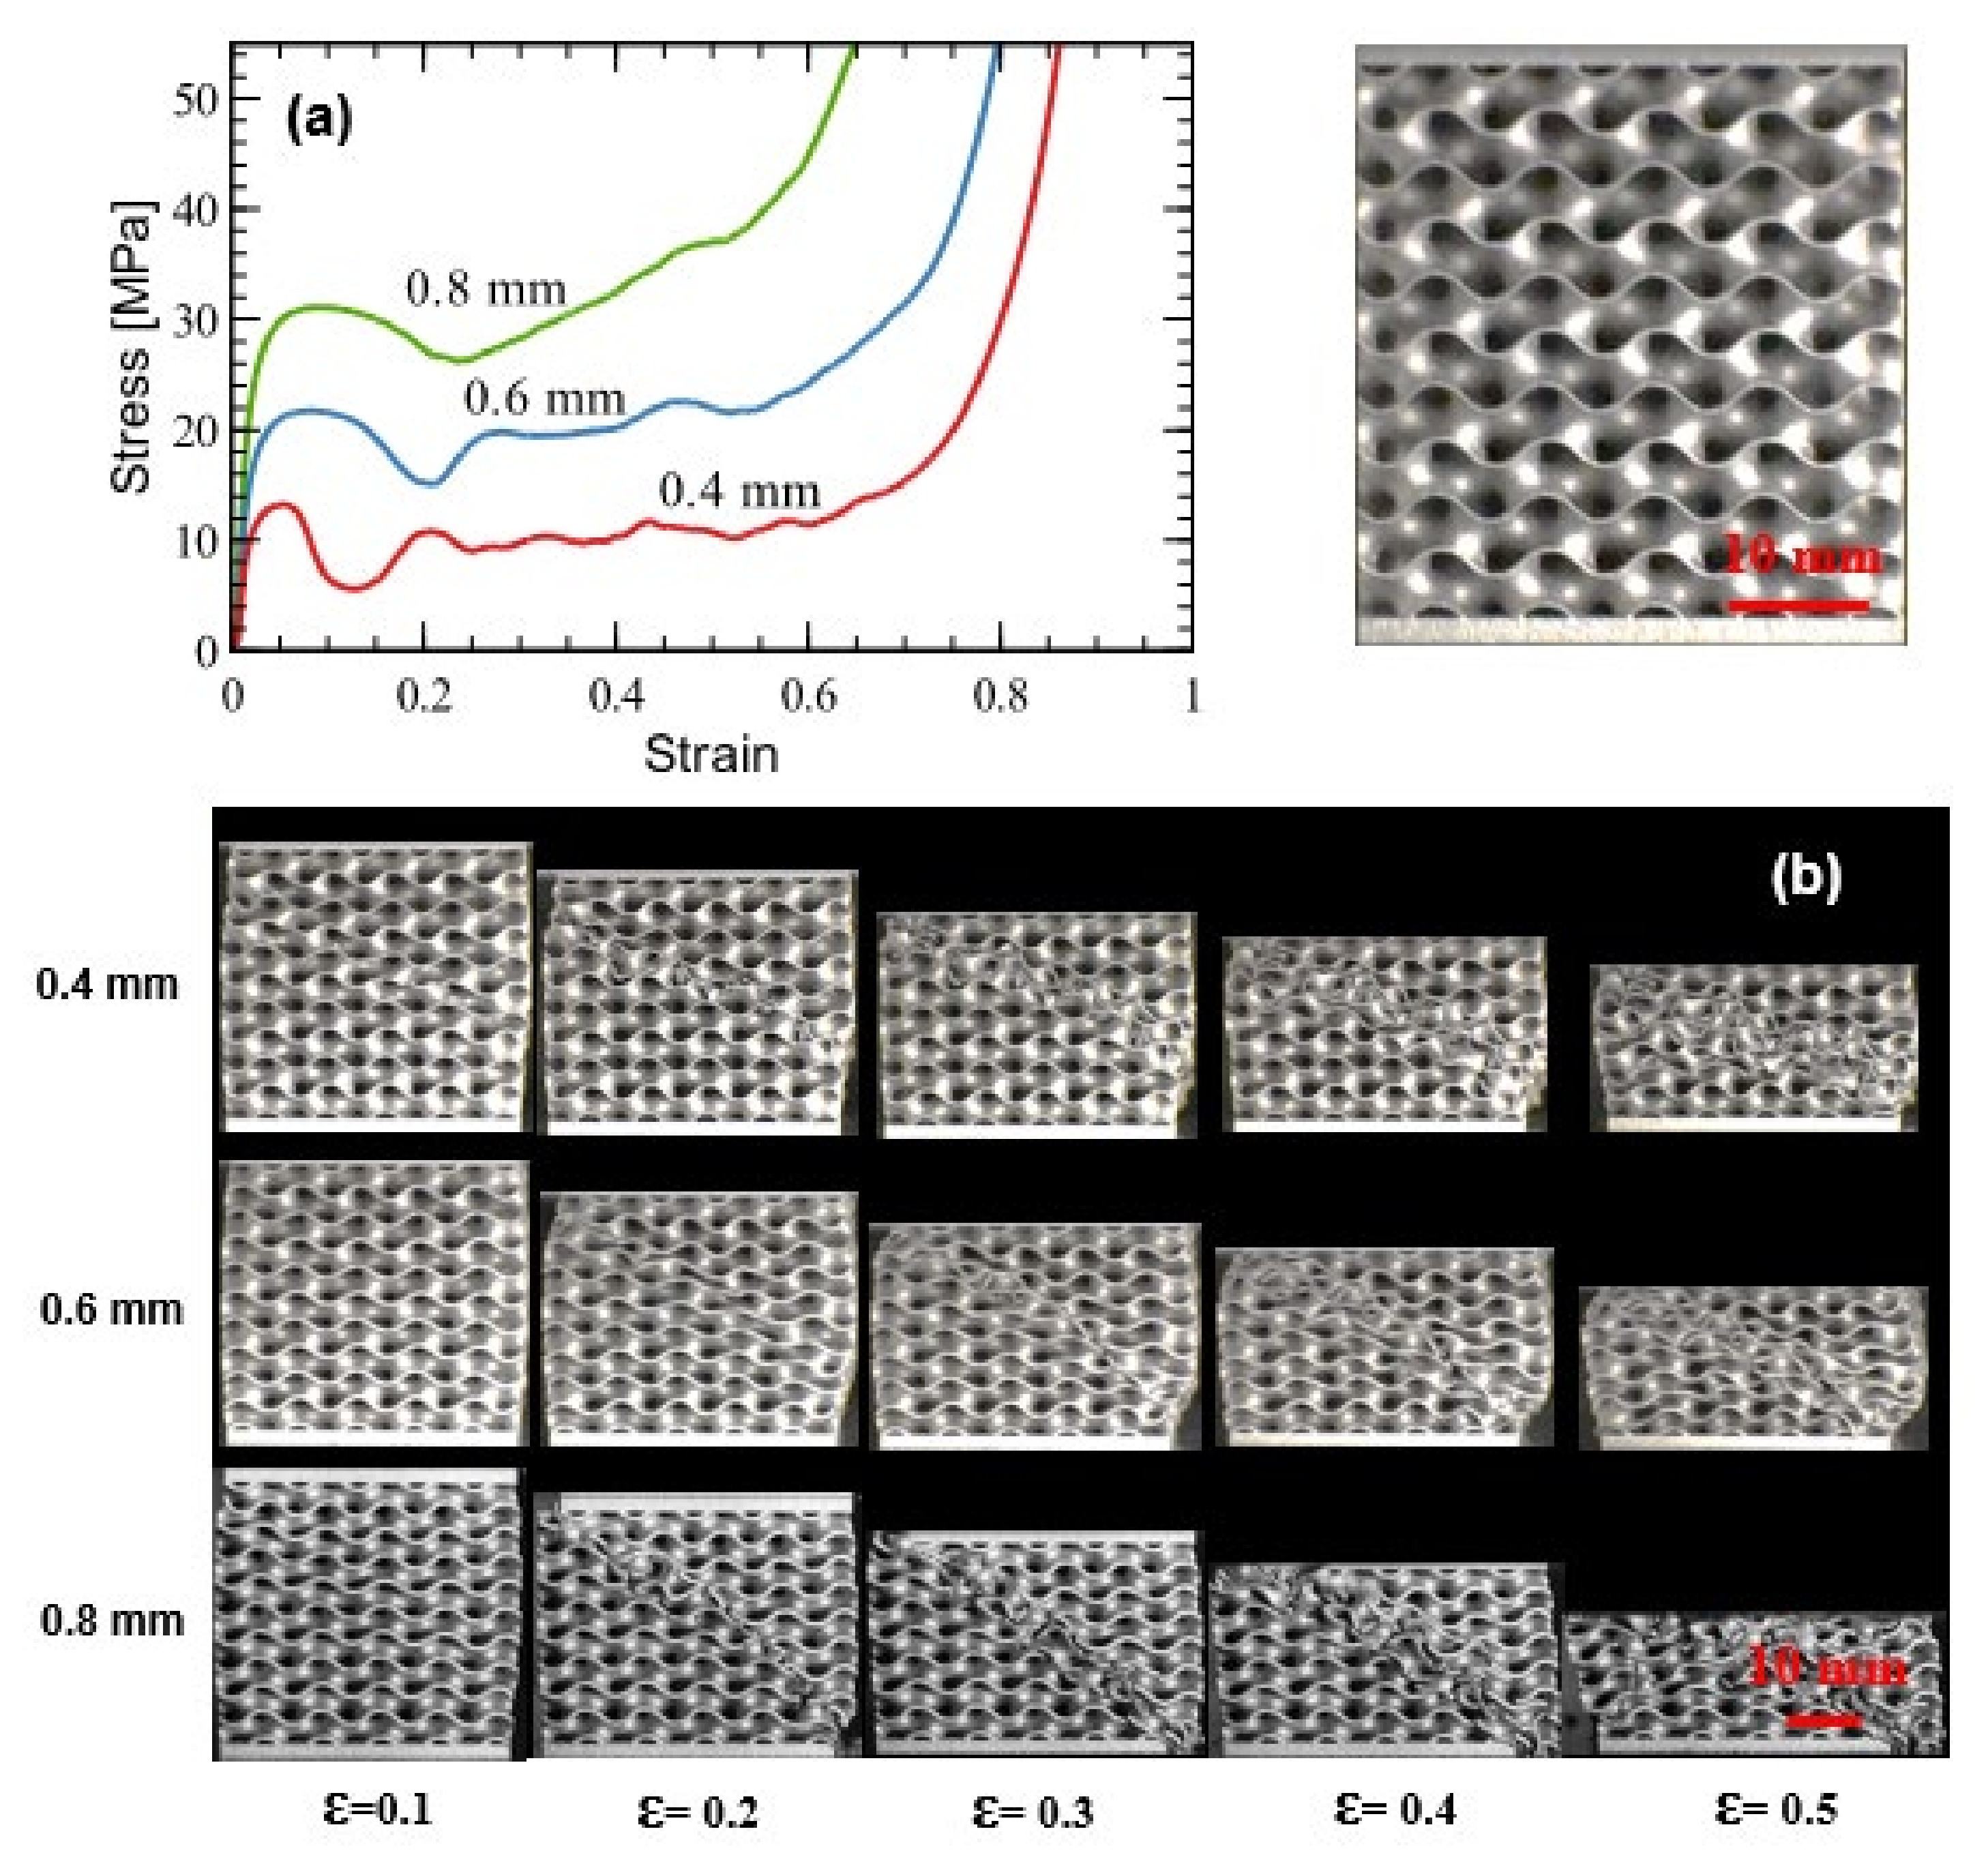
The Schwarz-P TPMS compressive response, shown in Figure 12a, resembles that of the honeycomb, with greater undulations at the highest relative density. This is attributable to the formation of localized failure bands as seen in Figure 12b, with each drop in stress coinciding with an inclined failure band localizing. All three specimens show slight hardening in the stress plateau prior to densification (Supplementary Video S2). An examination of the post-compression failure images in Figure 13 shows significant fracture at the extreme ends of the relative densities explored, with the 0.6 mm wall thickness (relative density of 0.17) showing fewer fracture surfaces, corresponding to a smoother stress plateau.

3.1.5. Diamond TPMS

As shown in Figure 14a, the diamond TPMS compressive response is similar to that of the Schwarz-P, a key difference being that even at the highest relative density (0.25) the stress plateau is relatively smooth, in comparison to the Schwarz-P. While a failure band does form for the diamond TPMS, as seen in Figure 14b, the band involves sliding over of cell walls along the shear plane, as opposed to complete cell-level collapse seen in the Schwarz-P specimens. This is also evident from a comparison between the failure images shown in Figure 13 and Figure 15 (Schwarz-P and diamond). The diamond TPMS compression curves have lower undulations and flatter plateaus in comparison to the Schwarz-P. The diamond TPMS geometries show barreling effects (Supplementary Video S3), particularly at higher relative densities, which are not seen for Schwarz-P geometries, which is consistent with other findings in the literature [29].

3.1.6. Gyroid TPMS

The gyroid TPMS compression response, shown in Figure 16a, shows relatively flat plateaus with clear hardening only evident for the highest relative density studied (0.25). A clear drop in stress is evident after the first maximum, at strain values between 0.1 to 0.3. All specimens show barreling (Supplementary Video S4), shown in Figure 16b, similar to the diamond TPMS. Examining the two surfaces of the post-compression specimen in Figure 17 shows both plastic yielding and fracture are observed in the gyroid specimens.

3.2. Effect of Tube Enclosure

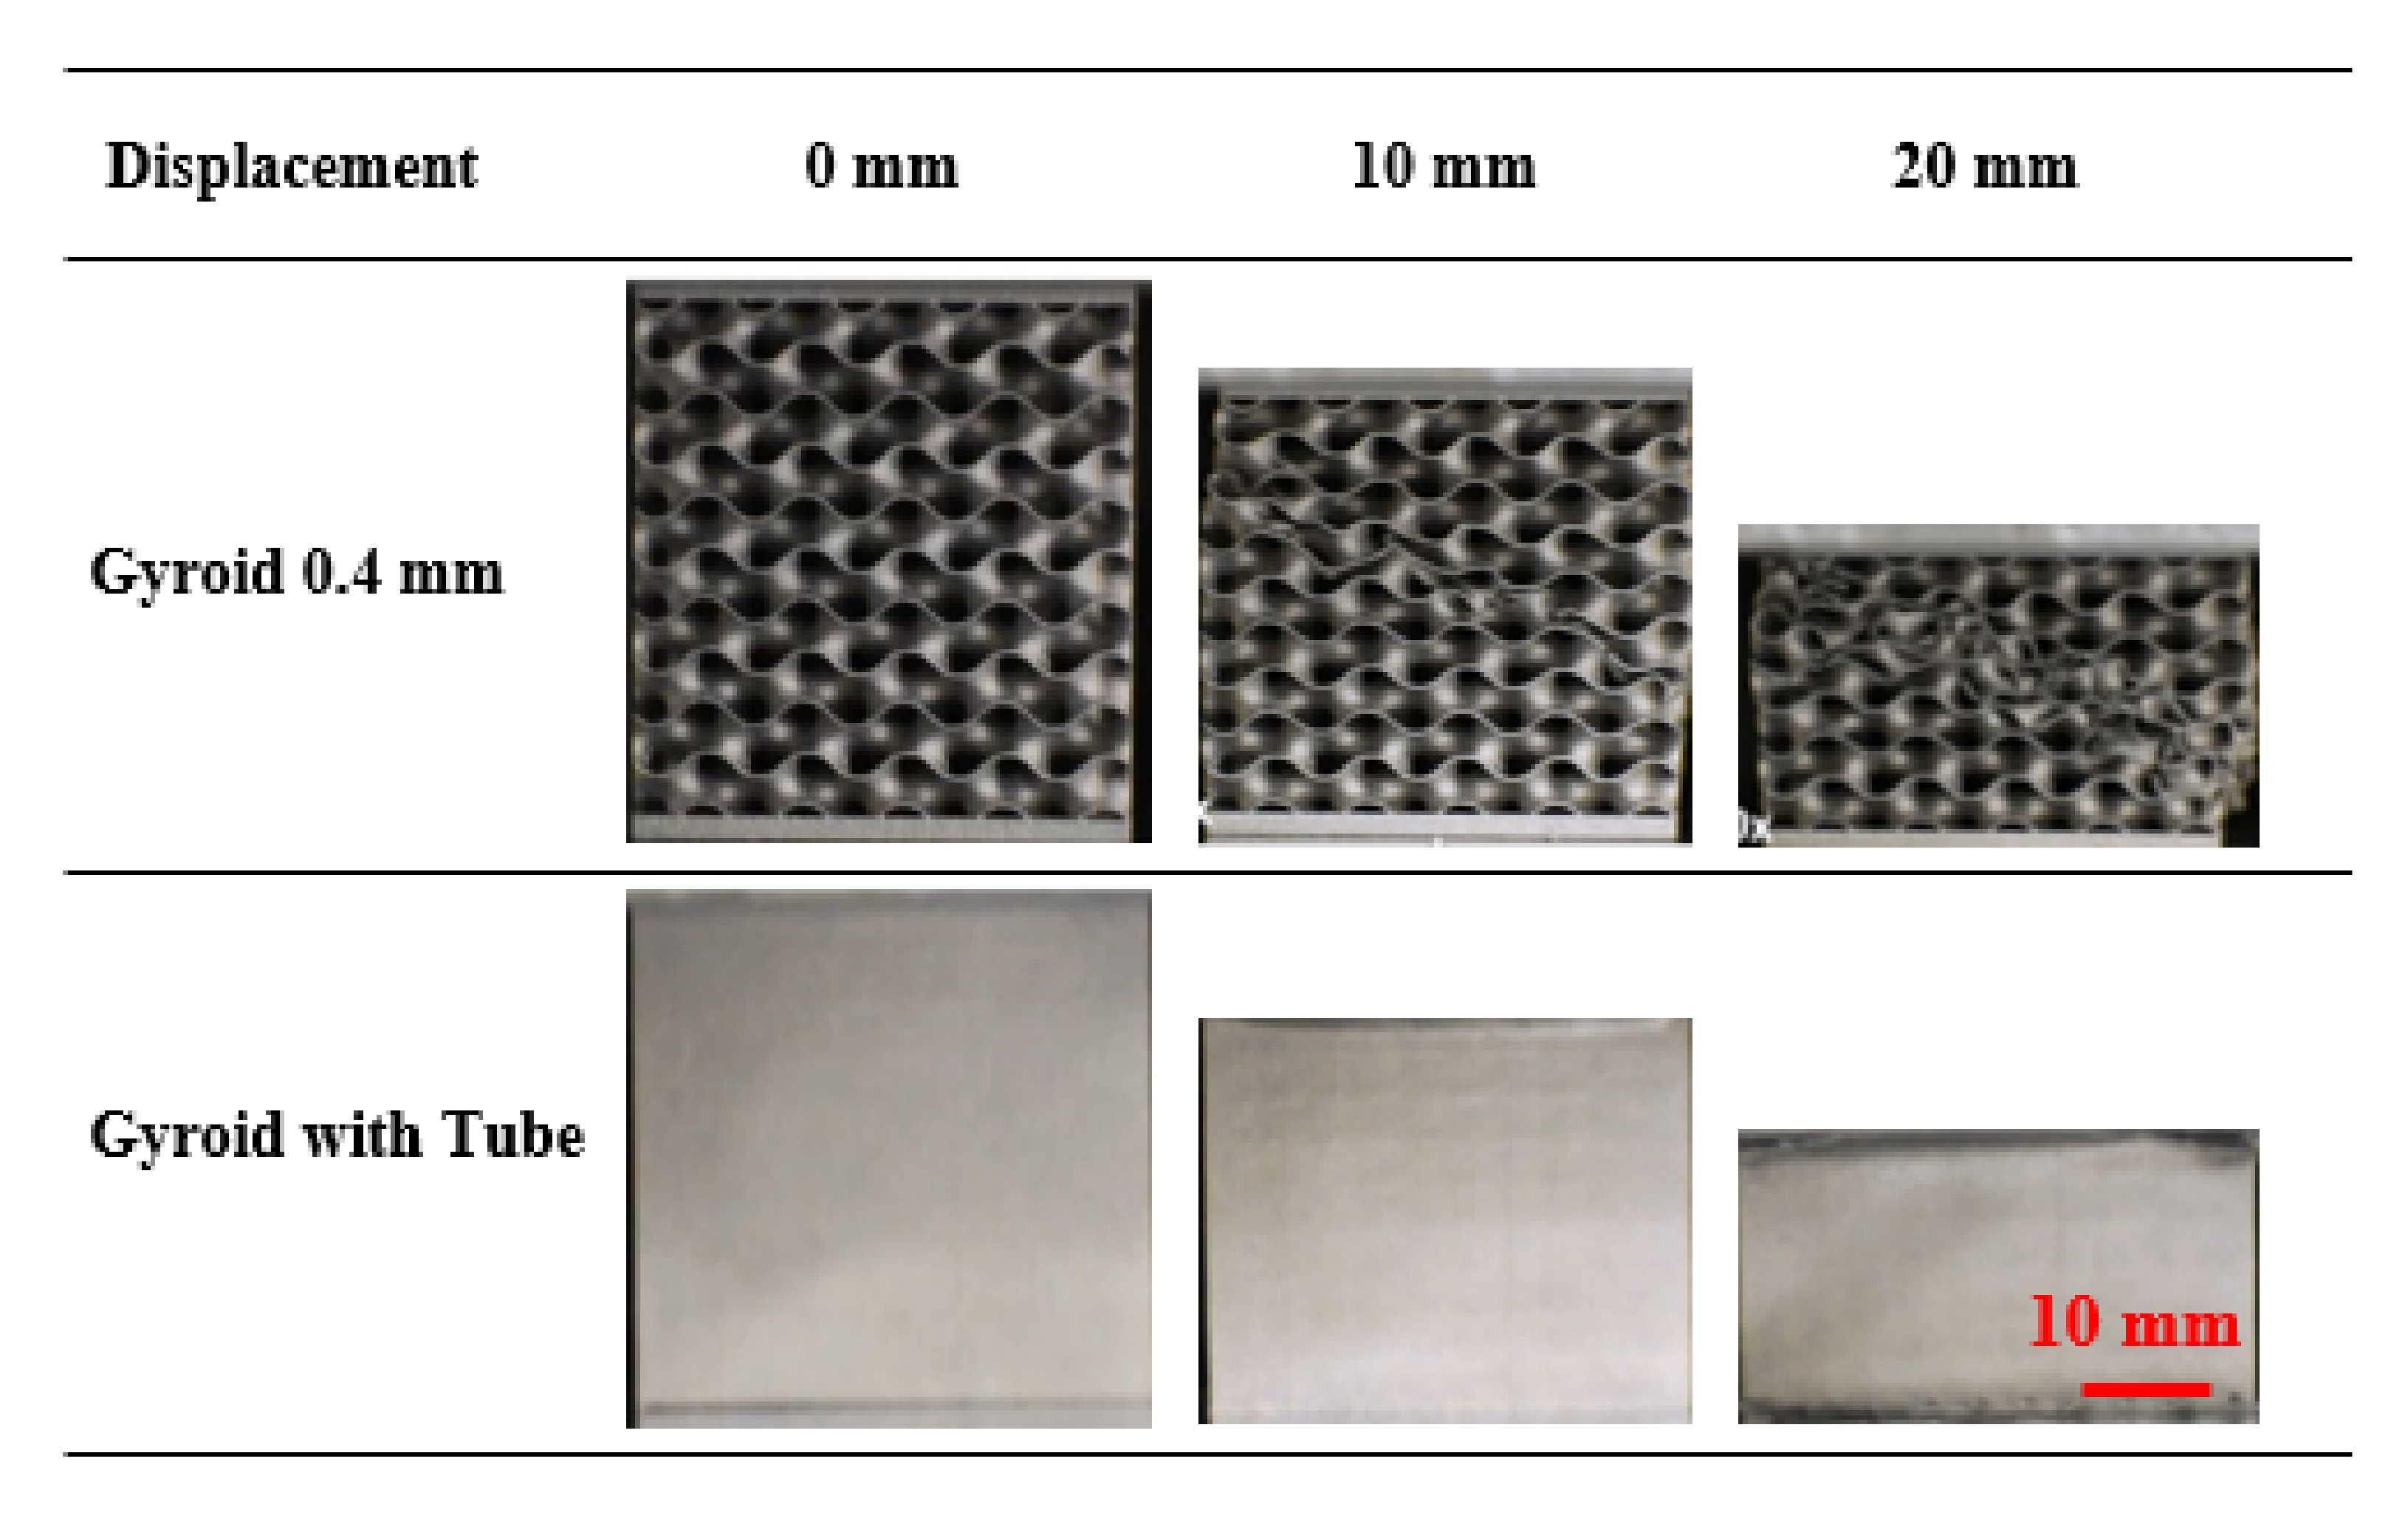
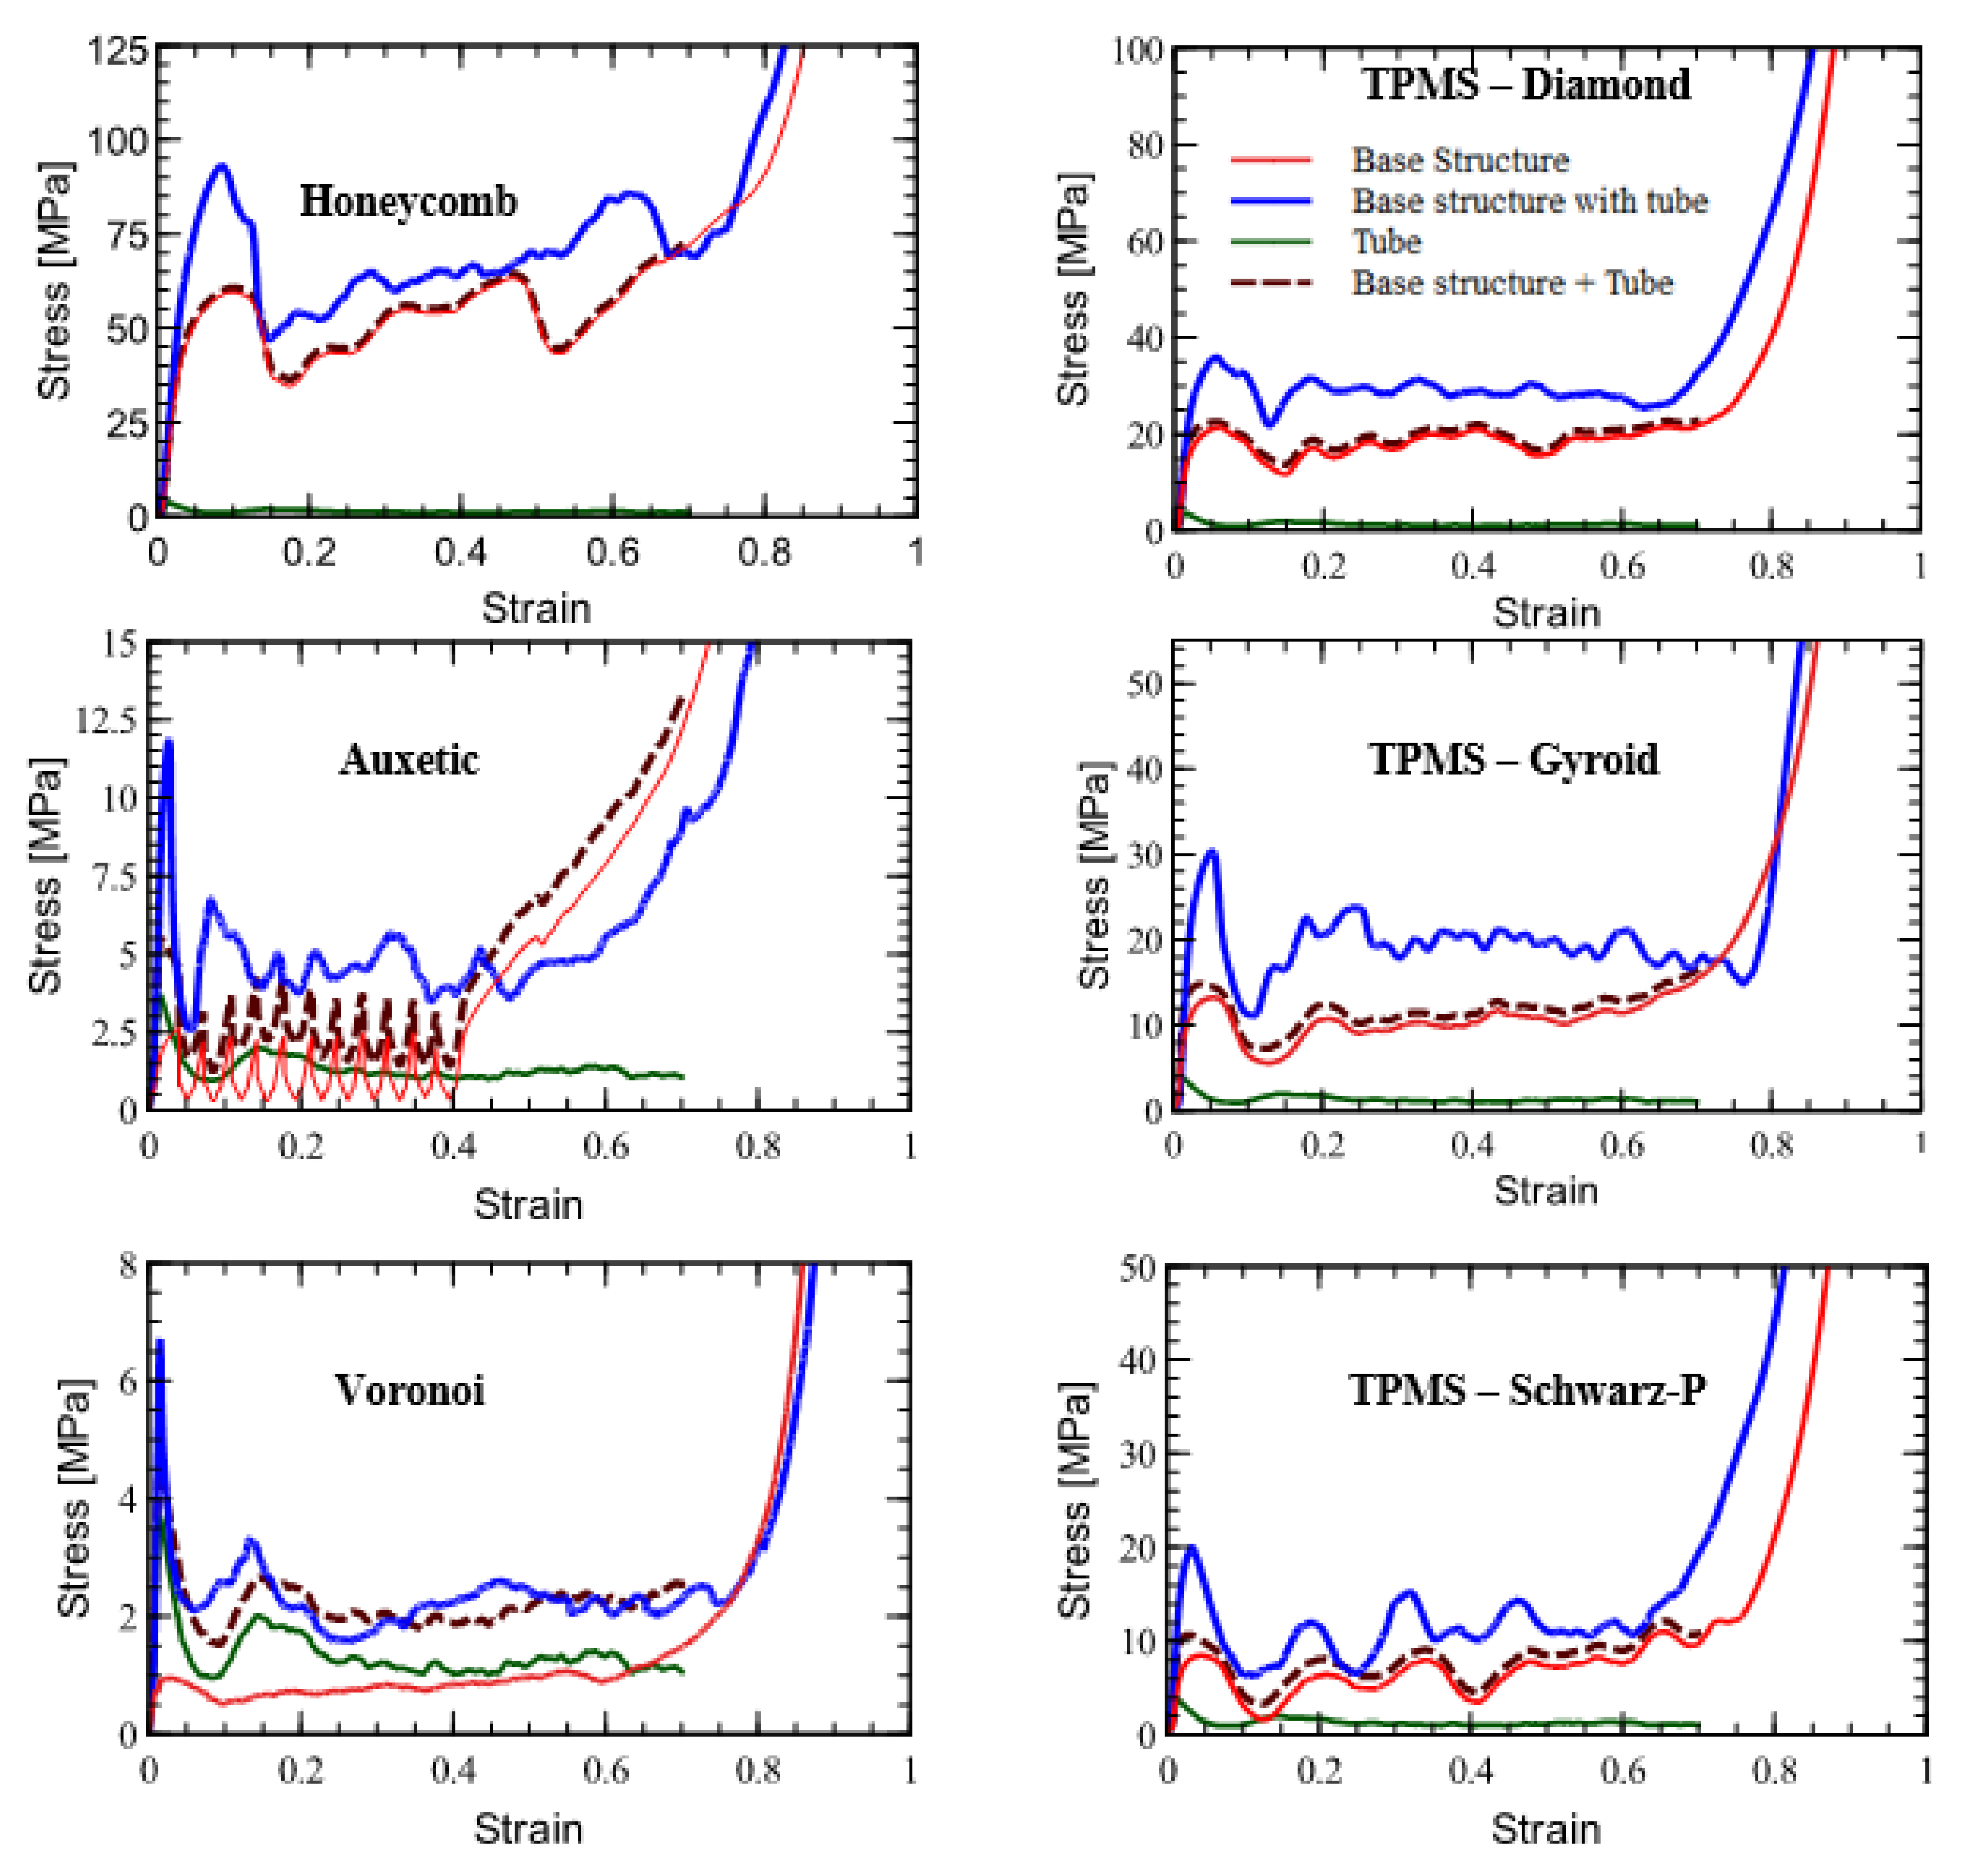
In addition to the six shapes discussed above, the lowest relative density design for each shape was fabricated with a 0.5 mm thick tube enclosing it and subjected to compression and compared against the identical specimen without a tube, as shown specifically for the gyroid shape in Figure 18. Figure 19 shows six graphs for the compression behavior of each of the six shapes, comparing specimens with and without tubes, along with the compression behavior of the tube alone (obtained from the average of compressing three hollow tubes without any infill). The graphs also include the numerical addition of the tube and cellular (base) structure response, which in all cases is lower than that achieved in reality, thus hinting at additional energy absorbed due to the interaction between tube and cellular structure. The dashed curve representing the numerical addition of the tube and base structure response was created using a Matlab code. The reaction force values of base structure and tube are added and divided by the cross-sectional area bounded by the tube to obtain an effective stress value at each strain increment. For the honeycomb and TPMS structures, the tube enclosure has the effect of increasing the peak stress by between two and three times. For the lattice structures, on account of their relatively lower peak stresses, the increase in peak stress due to the tube is far more substantial. In all cases, the stress plateau shifts upwards, and the onset strain of densification is not significantly altered, which is consistent with similar observations for foam-filled circular tubes [15]. The stress plateau has similar or higher undulations on account of the addition of the tube in all cases with the exception of the auxetic lattice, where it attenuates the sawtooth-like plateau profile.

4. Discussion: Towards an Ideal Energy Absorber

This work is primarily concerned with enabling a comparison between the six shapes studied here in the context of an ideal energy absorber. In this section, the results presented previously are converted into metrics that enable such a comparison and are examined for four different criteria that are relevant to energy absorption, with each being presented in turn. This is followed by a section that combines these findings to identify the most promising cellular shape from this study. In this discussion, the viewpoint adopted is that of a designer seeking to meet certain requirements while maximizing performance.

4.1. Specific Energy Absorption and Transmitted Stress

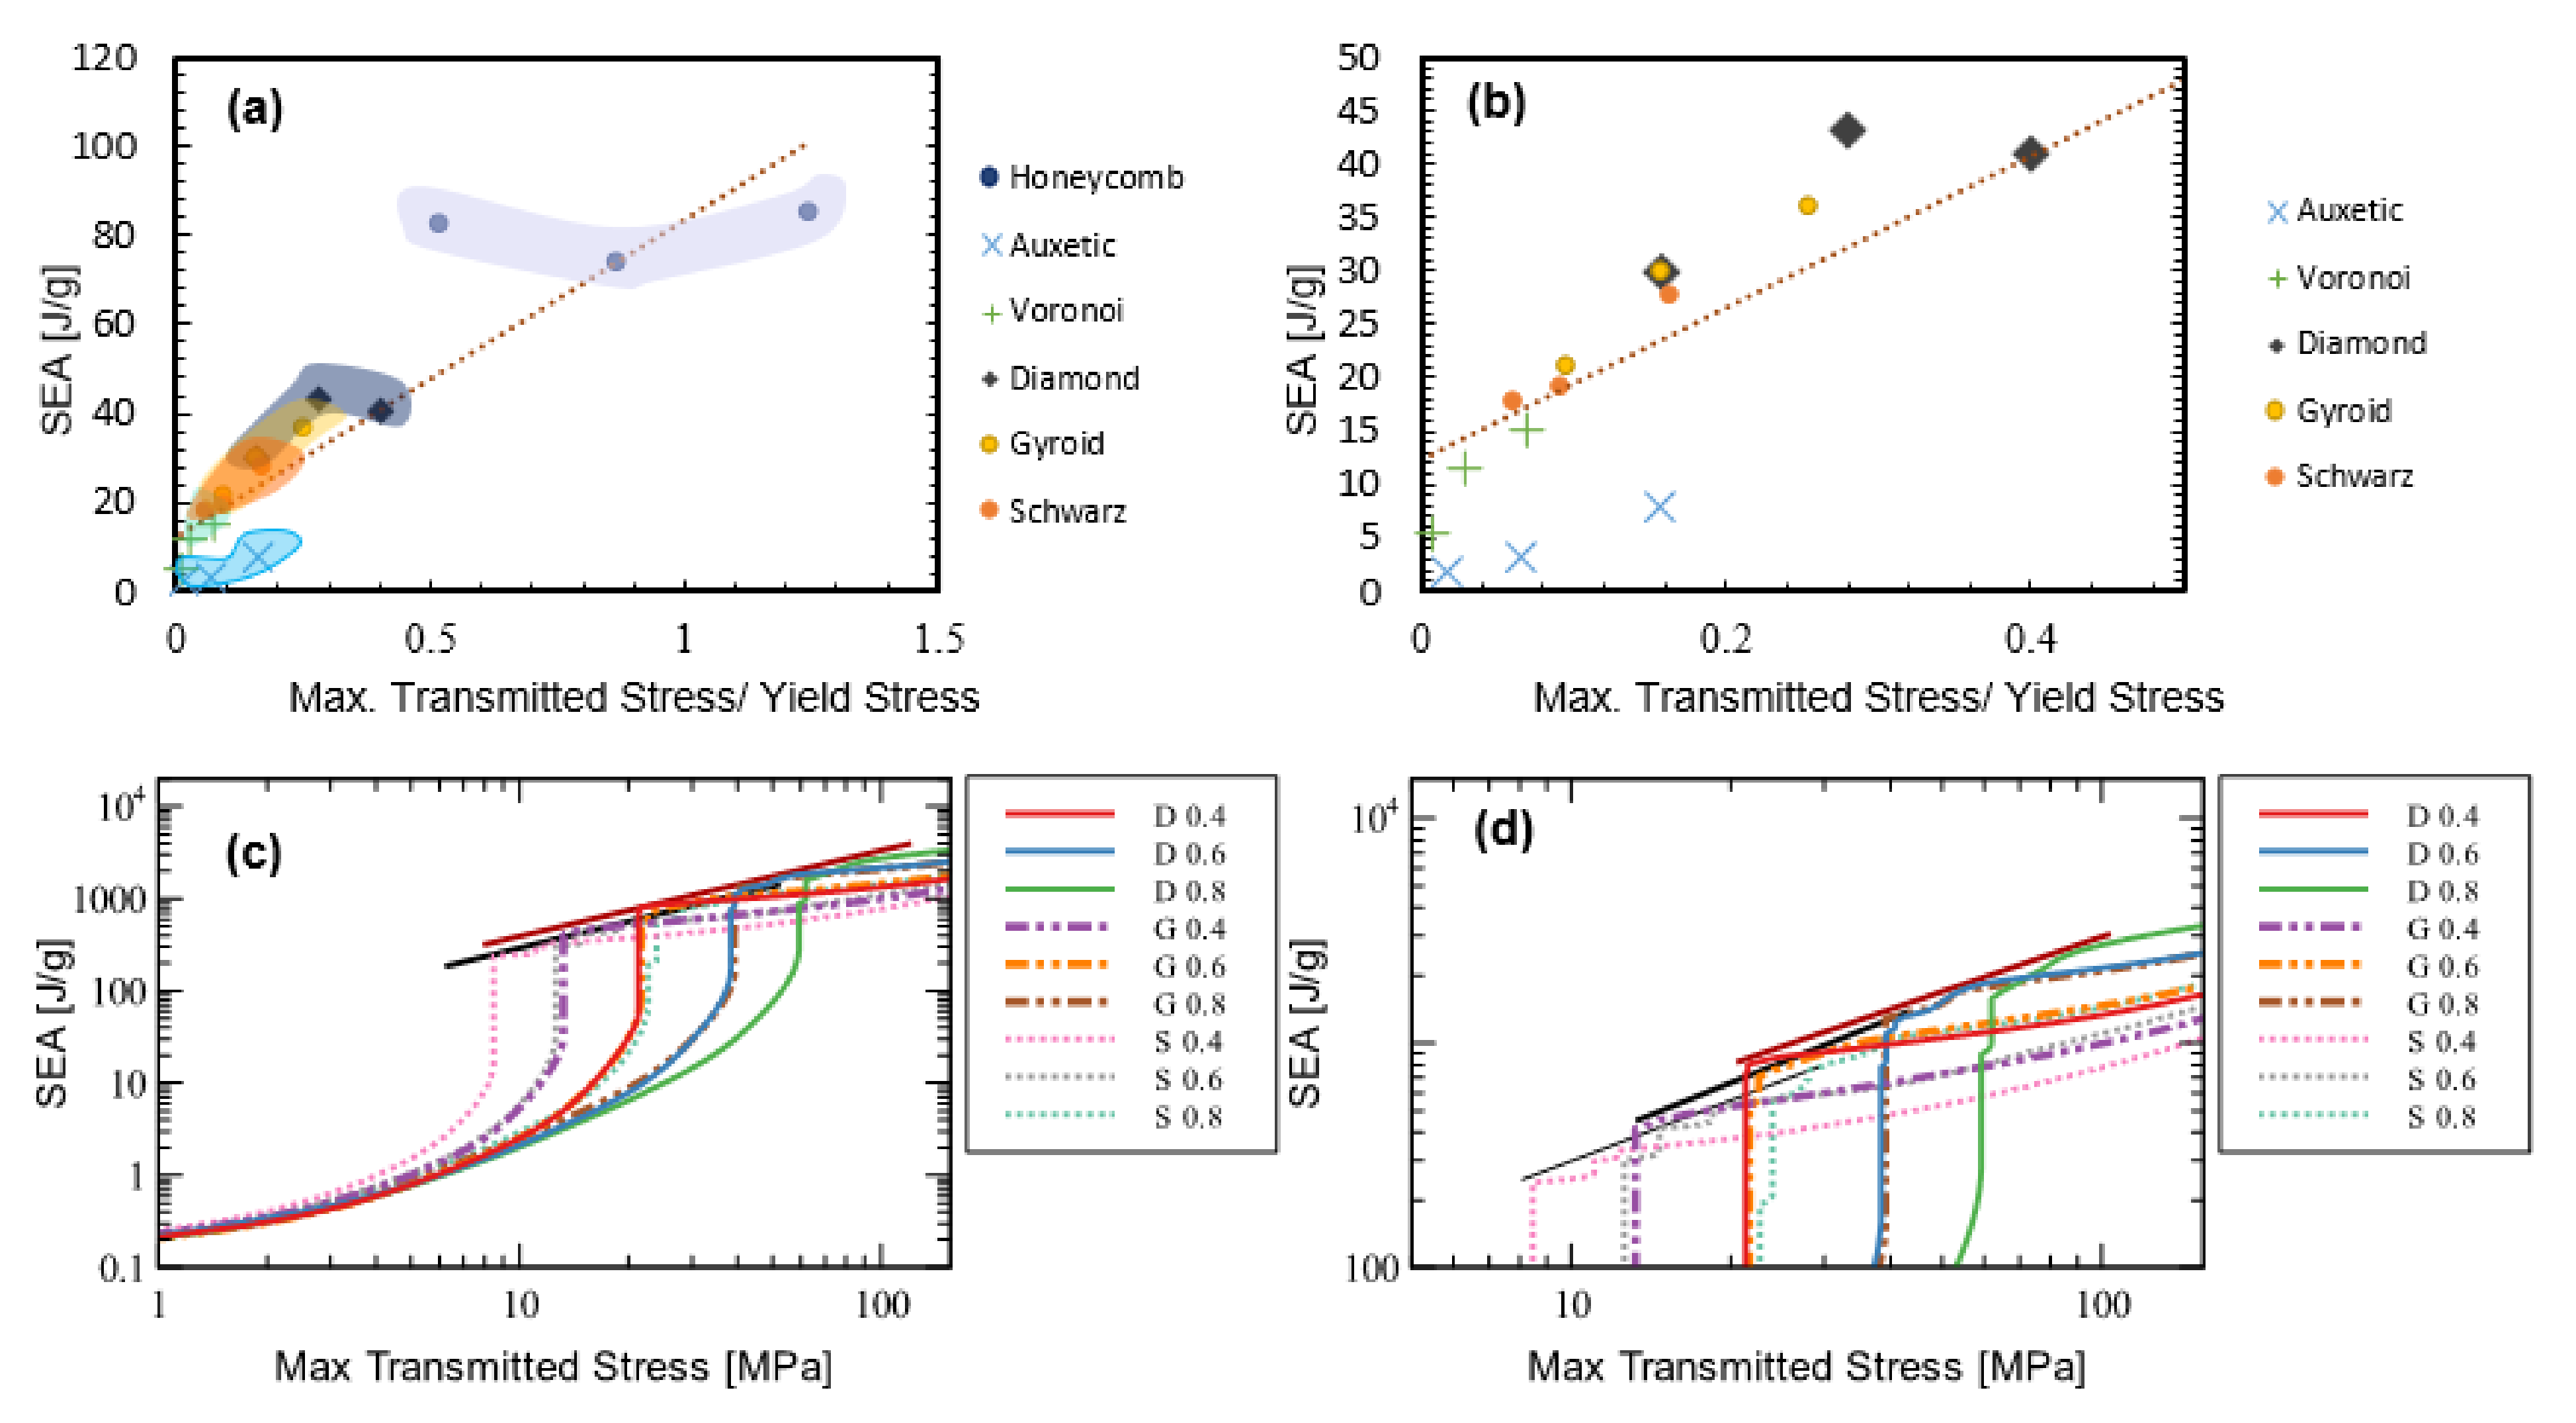
The first and most commonly used criterion to assess the performance of an energy absorption material is its specific energy absorption (SEA). SEA estimations, as discussed previously, are dependent on the assumption made on the upper bound of the strain value used to calculate them. In this work, the energy efficiency approach is used, where the maximum energy efficiency defines the onset strain of densification (see Figure 1). SEA, which increases with relative density, is best viewed in the context of the maximum transmitted stress, which from a designer’s perspective, is not just the initial maximum stress, but the true maximum during the portion of the stress–strain response utilized in the SEA calculation [39]. Following this approach, SEA vs. the normalized maximum stress (divided by AlSi10Mg yield strength) is shown in Figure 20a. An ideal energy absorber in this context would lie in the upper left corner, with high SEA at low maximum transmitted stresses. The trend line indicates that relative to the other cellular materials in the study, the TPMS geometries performed well, and the lattice geometries performed poorly. The honeycombs tested showed little change between SEA and relative density. Once the honeycombs are removed from the dataset, and the graph is replotted, as shown in Figure 20b, the prior observation differentiating TPMS from lattice structures is clearly borne out.
Another method of viewing SEA data is by plotting it against the maximum transmitted stress up to a given point through the compression event, as shown in Figure 20c for all three TPMS geometries tested in this study. The rationale behind this approach, also used by Zhang et al. [29], is that one can establish an envelope (shown in Figure 20c, and at higher magnification in Figure 20d, by the linear fits) to capture the SEA at the maximum transmitted stress prior to densification. The higher this enveloping line, the better performing the cellular structure. As shown in Figure 20d, this work concurs with that of Zhang et al. [29] in demonstrating that the diamond shape has the best overall performance with regard to SEA (in the context of maximum transmitted stress), followed by the gyroid and the Schwarz-P shapes.

4.2. Densification Efficiency

As described before, the onset strain of densification is an important metric in energy absorption, not just since it influences the estimation of SEA, but also since it is indicative of the usable stroke length in a compression event. As with SEA, the onset strain of densification for a given cellular shape is a function of its relative density, making direct comparisons between shapes challenging. An ideal energy absorber, in principle, would delay the onset strain of densification until such time as all that remains in the compressed material is fully dense, and all “negative” or empty space [39] is eliminated—this is not strictly true since structures do demonstrate bulging and at very high strains push materials outside the initial bounding box volume. Nevertheless, one may define a densification efficiency (ηD) in terms of the onset strain of densification (εD) and the relative density (ρ*/ρs) as:
η D = ε D 1 ρ ρ s
Thus, an ideal energy absorber would have a densification efficiency of 1, or 100%. For the 18 specimens in this study, densification efficiencies are shown in Figure 21. Once again, it is evident that the beam-based cellular structures have low densification efficiency, but the honeycombs, and TPMS structures exceed 70%, with the diamond showing the highest mean value, and the Schwarz-P showing the least variability across relative density values.
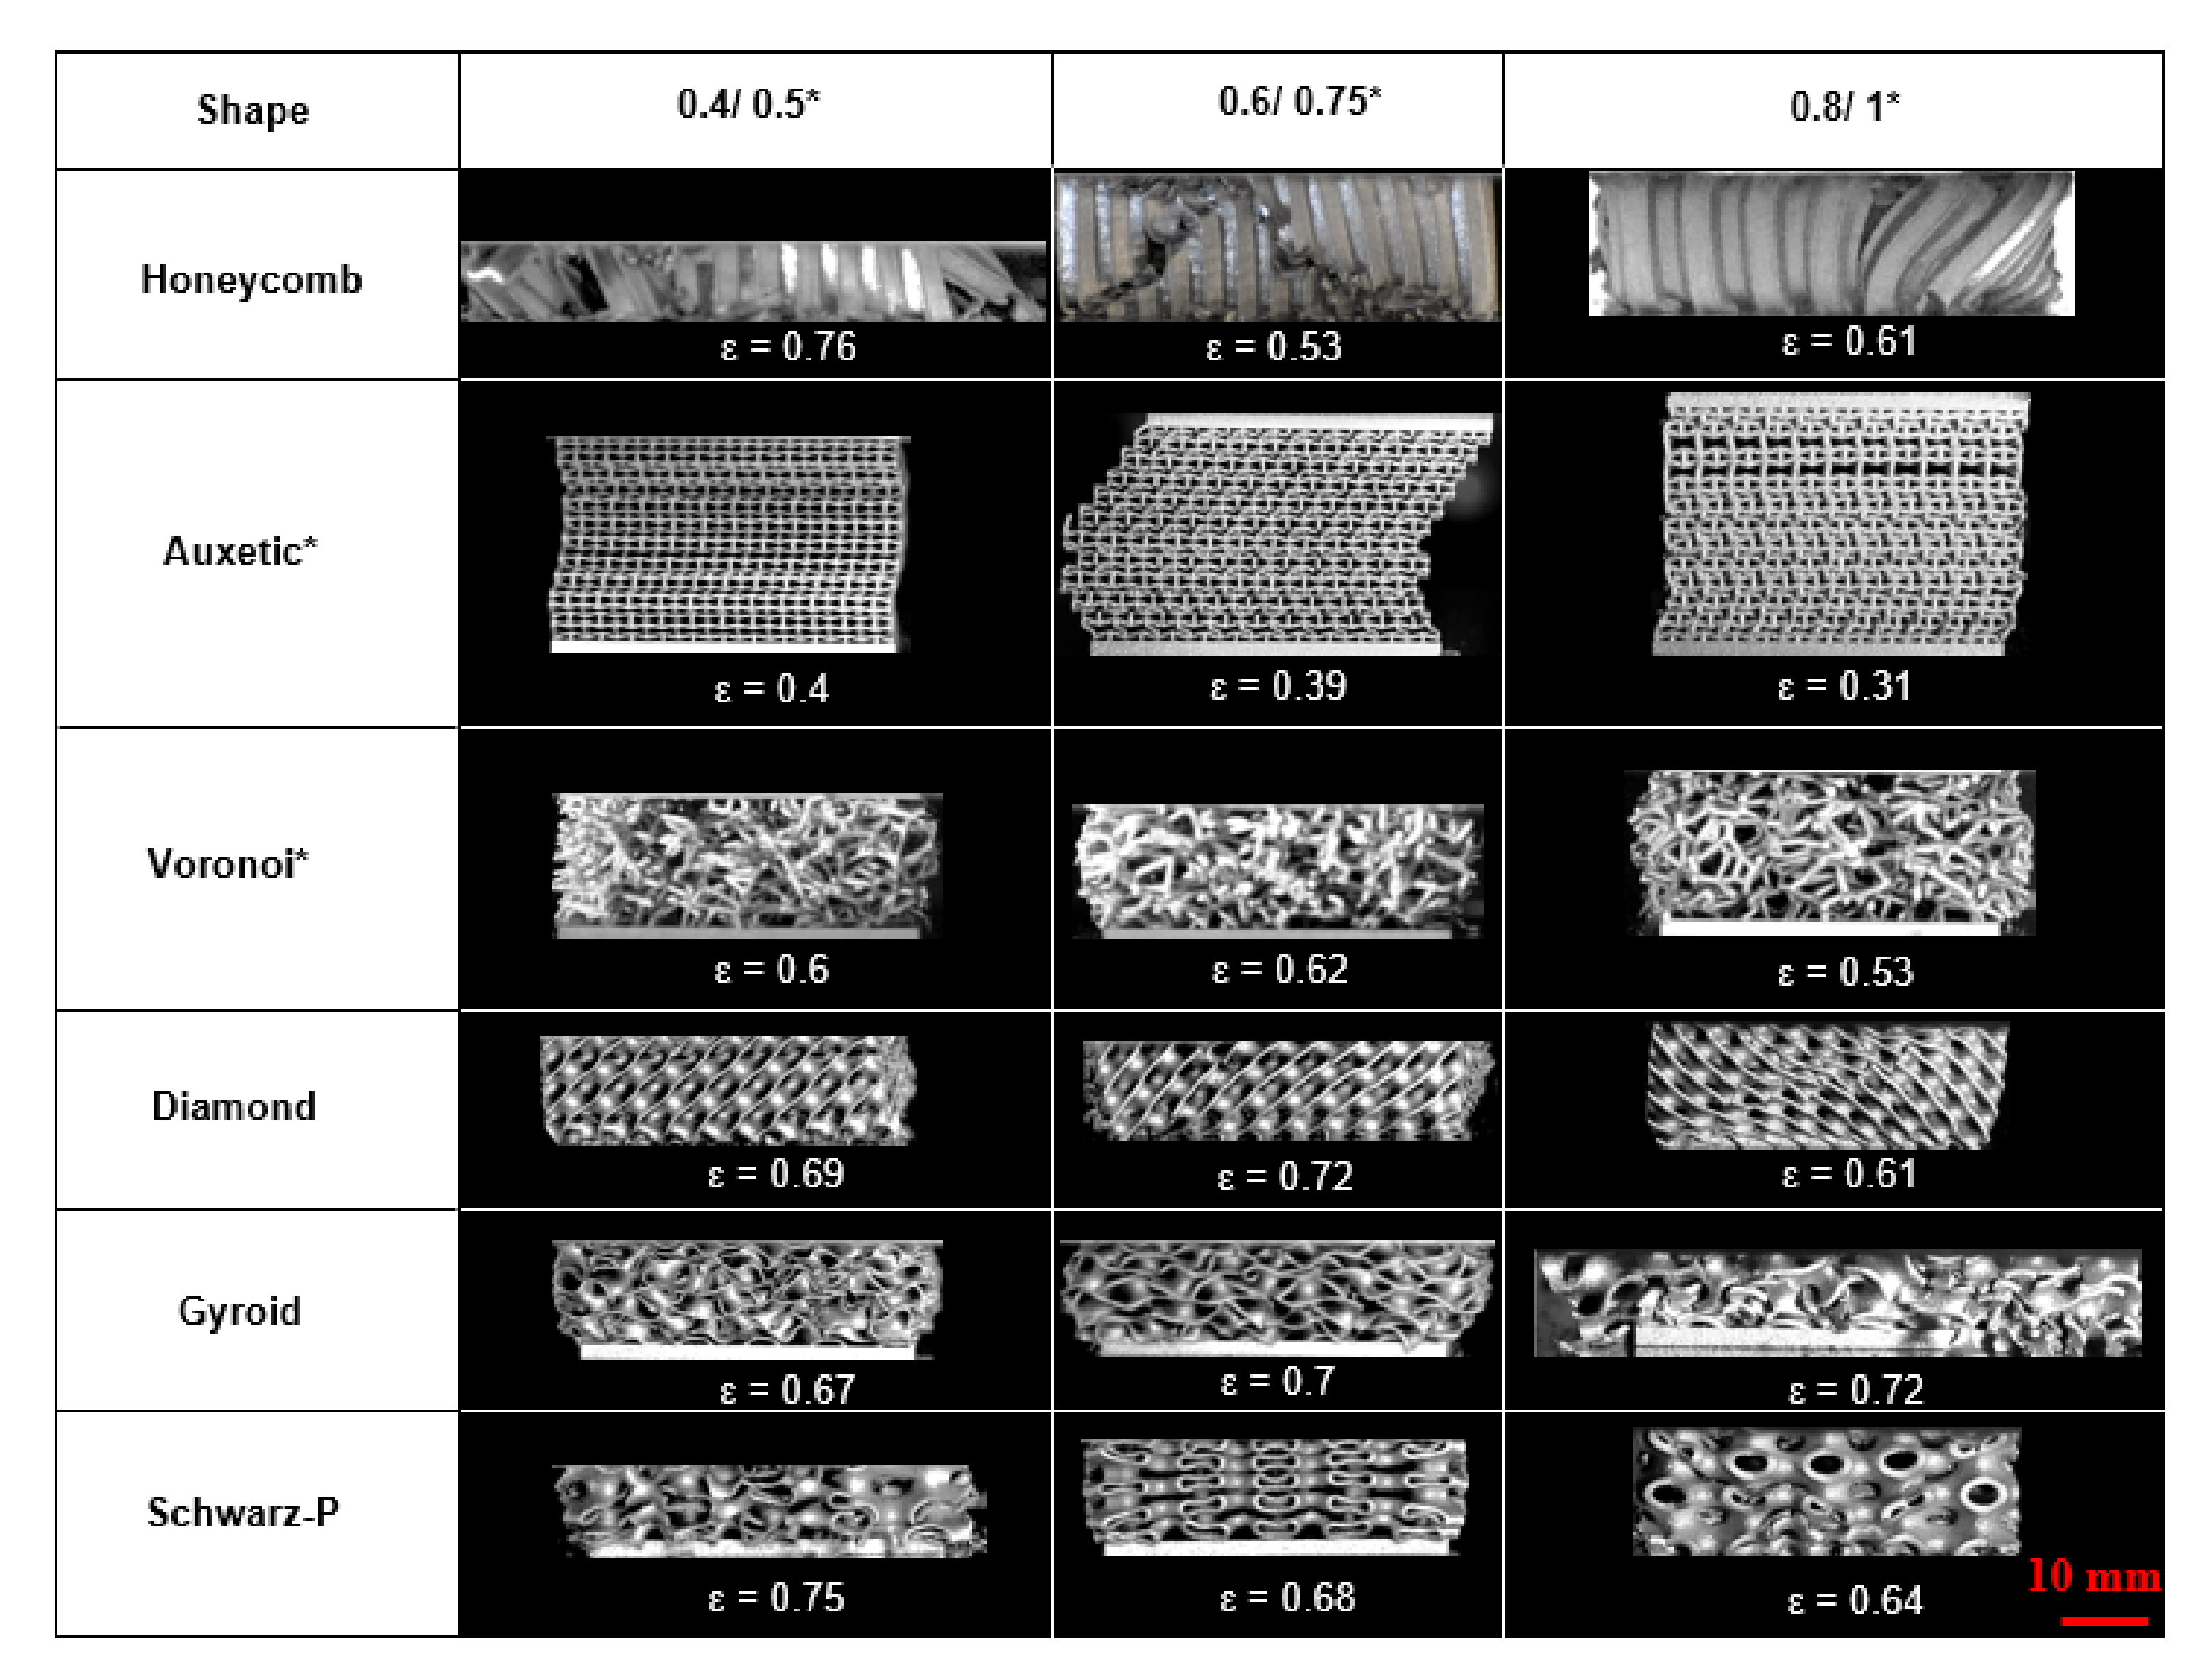
To get a sense of the physical reasons underlying why a particular shape has a specific densification efficiency, it is useful to examine the compressed structure at the instant corresponding to the onset strain of densification, as shown in the compilation in Figure 22. An examination of the auxetic and Voronoi lattice structures shows significant negative space retained between struts at densification, explaining their low densification efficiencies. The 0.4 mm honeycomb has the highest densification efficiency, but this is at least in part due to the lateral (horizontal) spreading of the collapsed structure, which also explains the higher εD value for the 0.8 mm thick gyroid. The diamond and Schwarz-P structures, while demonstrating some barreling, show limited lateral spread.

4.3. Plateau Undulation

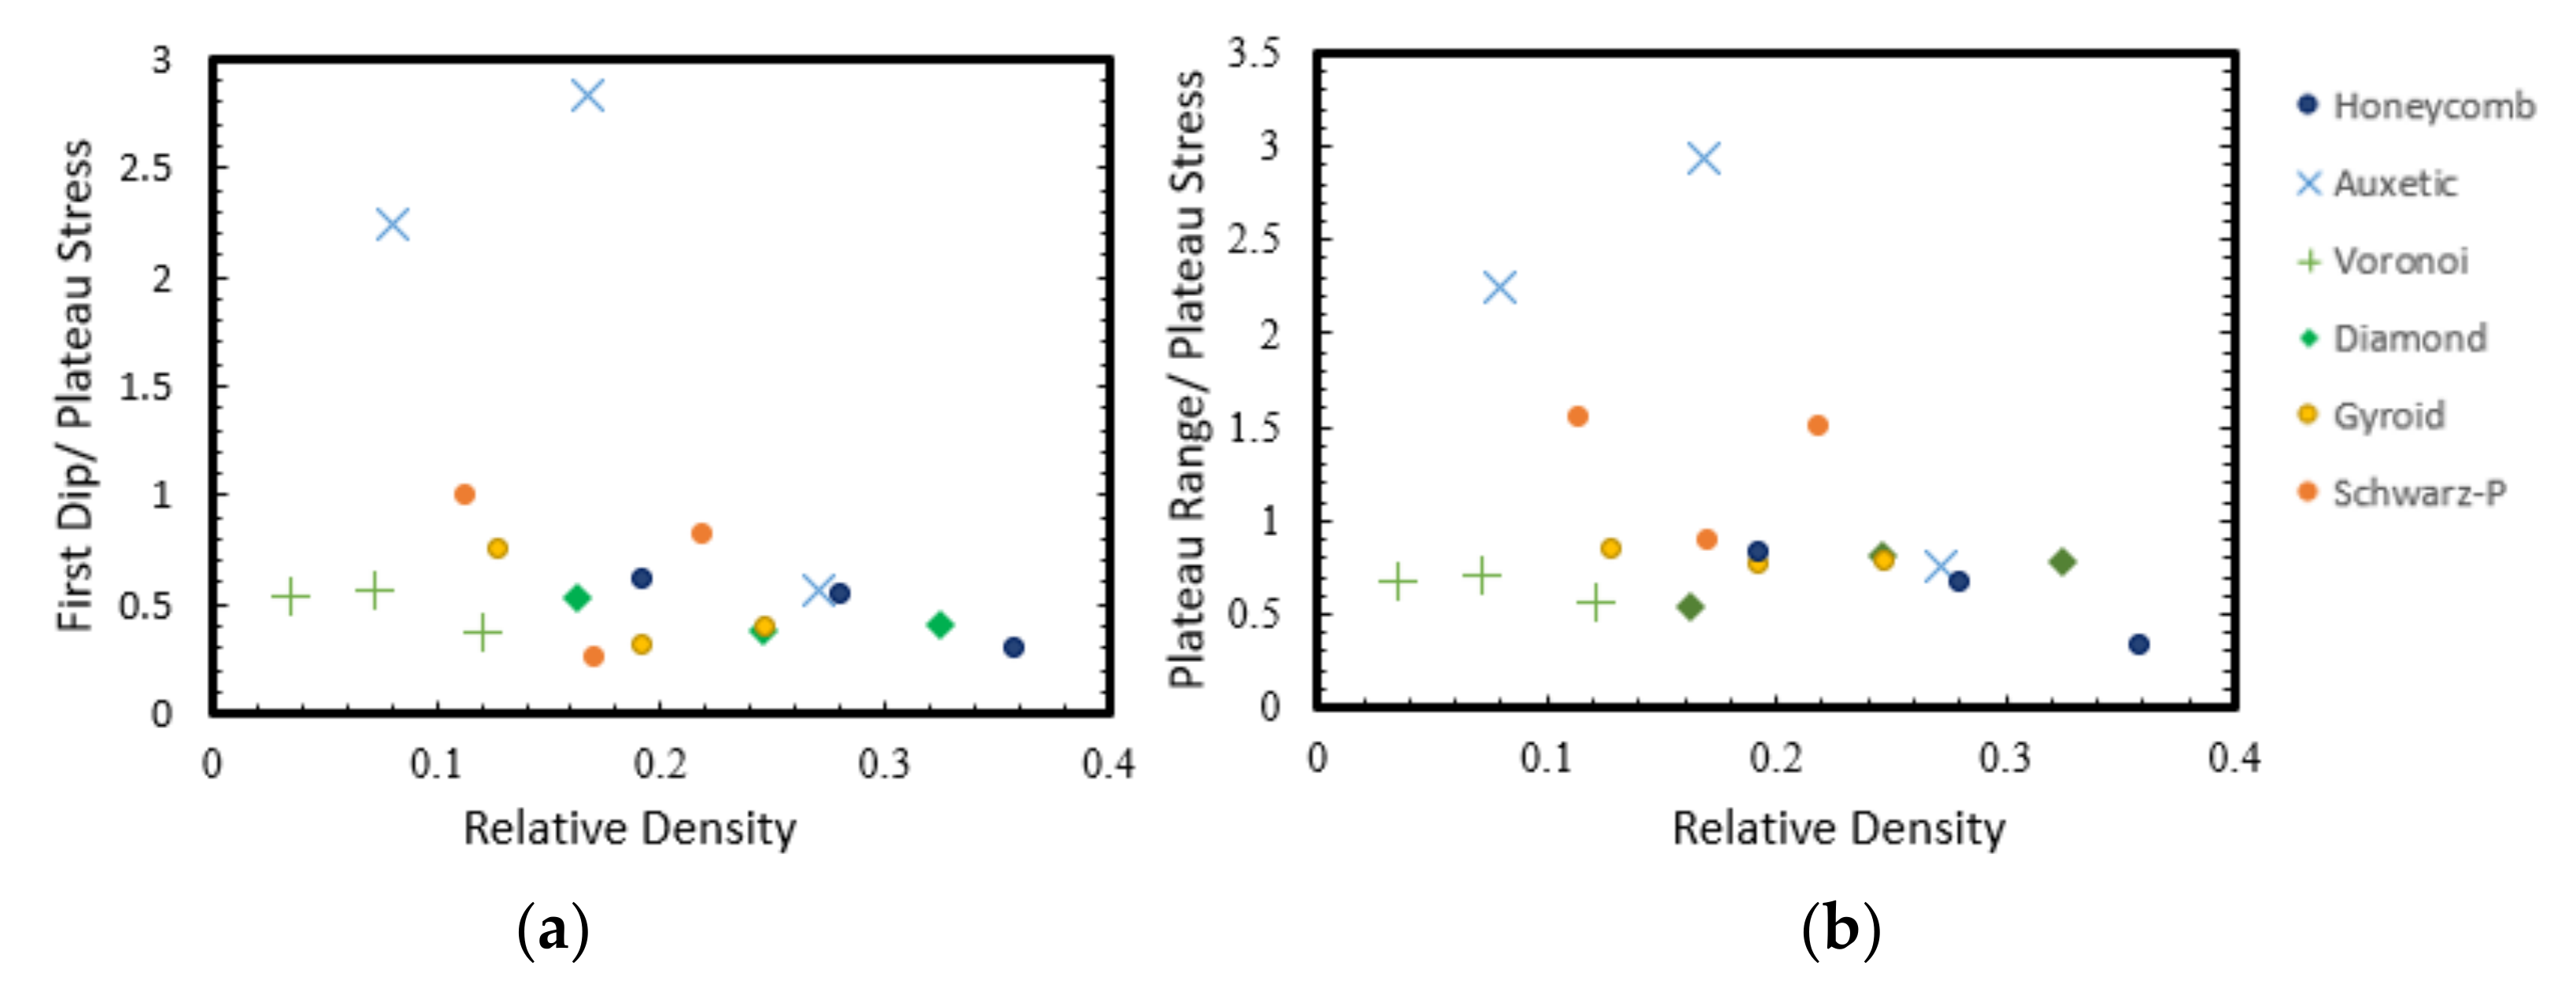
Undulations in the stress plateau have the undesirable effect of limiting SEA (relative to a perfectly flat plateau) and/or generating higher stresses than the initial first maximum stress. In addition, undulations could signal poor repeatability, resulting in more conservative designs to account for the higher uncertainty. In this sub-section, the first dip and plateau range terms introduced previously are evaluated, after normalizing them by plateau stress, and they are plotted in Figure 23a,b, respectively. The auxetic shape has the highest undulation as measured by both metrics, followed by the Schwarz-P. The remaining shapes, including the Voronoi lattice, are fairly similar in their undulation behavior. The stochastic nature of the Voronoi lattice, with beams at multiple orientations relative to the loading direction, smoothens the plateau relative to the auxetic shape.

4.4. Tunability

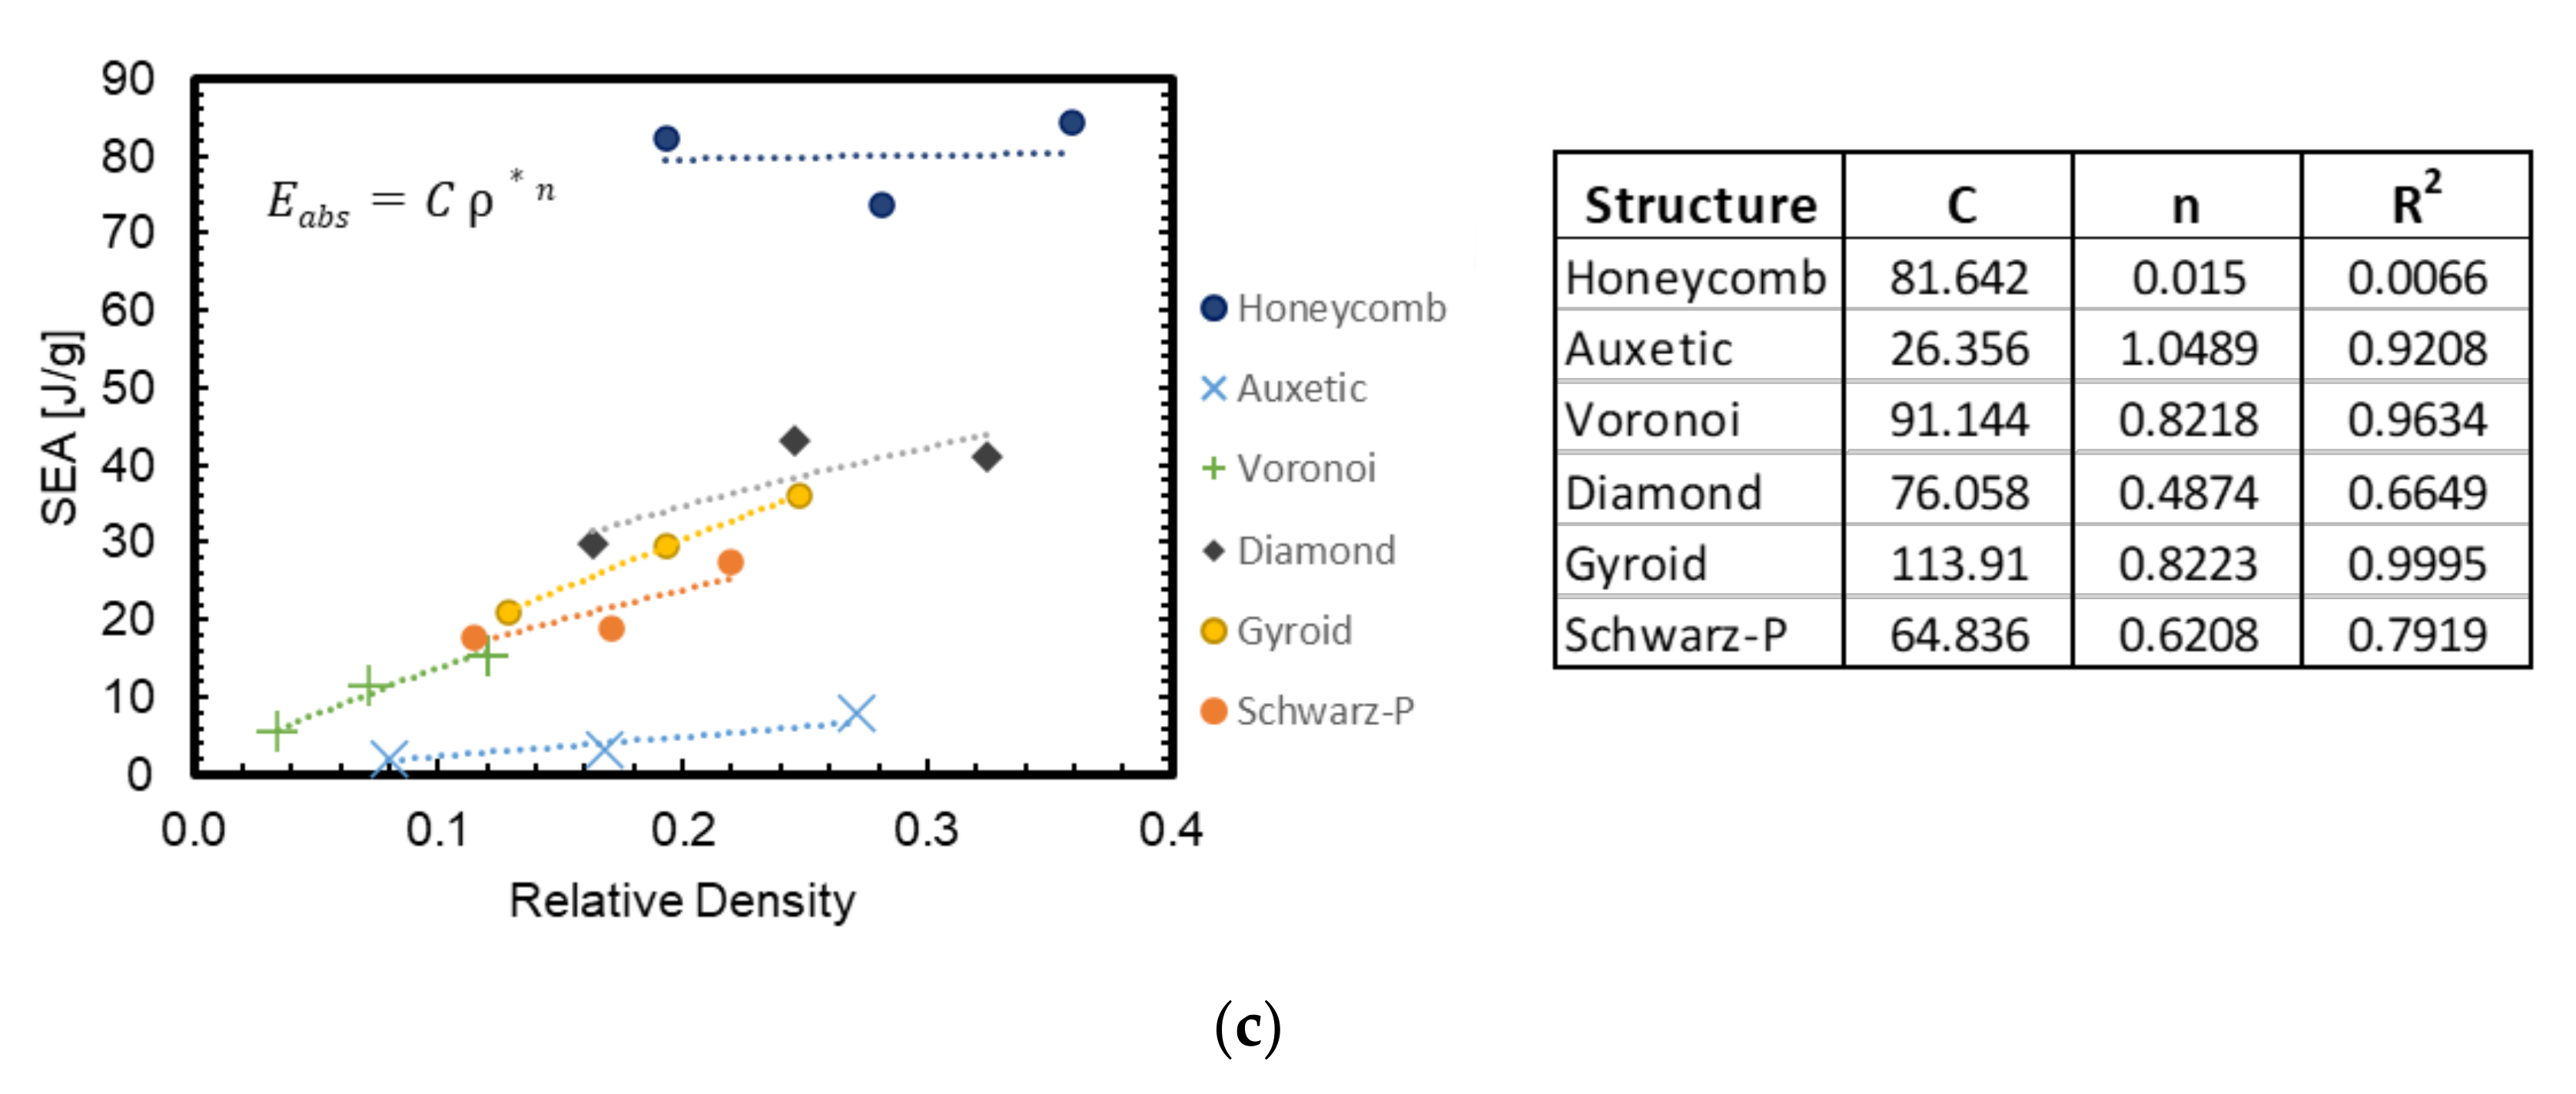
Tunability represents the designer’s ability to use a particular shape and relative density to meet certain requirements with a high degree of confidence. In the context of a metallic energy absorber, it typically has to withstand static, in-use loads, as well as absorb energy when needed during the impact event. For the former, it is vital that the designer is able to predict the effective modulus, for the latter, it is vital to predict the maximum transmitted stress and the SEA. All three of these metrics (the first two normalized) are shown in Figure 24a–c, respectively, as a function of relative density. Empirical power law fits are demonstrated for all three metrics, and the accompanying table provides the fit parameters as well as the quality of the fit as measured by its R2 value, for each shape studied. For the effective modulus and the maximum transmitted stress, the R2 value for all shapes is well in excess of 0.75, indicating a strong correlation between the metric of interest and the relative density associated with a particular shape. For SEA, however, the honeycomb shows very poor fit quality, which is likely attributable to the lateral spread at the low relative density honeycomb which inflated its SEA value. The diamond and the Schwarz-P have a lower quality of fit compared to the lattices and the gyroid, the latter performing the best overall for tunability across all three metrics.

4.5. Evaluating Overall Energy Absorption Performance

The above discussion is indicative of the fact that there is more than one metric when it comes to assessing the performance of a particular shape for its potential use as an energy absorber. A formal comparison will depend on the specific design requirements and weighting priorities associated with each one. The traffic-light method in Table 3 is one simple, if subjective, approach that may be taken to compare performance and even identify leading candidates for further improvement along specific performance vectors. The table suggests that of all six shapes studied in this work, the gyroid and the diamond TPMS shapes stood out as the best performers, followed by Schwarz-P and the honeycomb. The auxetic and Voronoi lattice shapes demonstrated the worst performance in at least one of the four criteria considered and are thus not recommended for further study for this application.

5. Conclusions

This work experimentally characterized the quasistatic compressive responses of six different cellular materials manufactured with the PBF-LB process in AlSi10Mg, with the aim of enabling comparisons between them along metrics of interest for the designers of metallic energy absorption structures. The work also examined the effect of enclosing them in tubes. The primary conclusions and contributions of this work are as follows:
  • The 20 µm layer thickness laser powder bed fusion process on a 100 W laser machine generates lattices, honeycombs and TPMS cellular structures with high fidelity as evidenced by microscopy and the agreement between measured and nominally designed relative densities.
  • A combination of four criteria may be used in determining the overall appropriateness of a cellular structure for implementation into energy absorbing system: (i) SEA vs. maximum transmitted stress; (ii) densification efficiency; (iii) plateau undulation; and (iv) tunability.
  • Auxetic and Voronoi lattice structures perform poorly as energy absorbers primarily due to low SEA relative to maximum transmitted stresses, and low densification efficiencies. Lattices are however highly tunable.
  • TPMS structures, in particular the diamond and gyroid shapes, show great promise as energy absorption materials, relative to honeycombs. This is primarily on account of their more gradual failure mechanism that includes folding and stacking of cell walls above each other, resulting in higher densification densities and lower plateau undulations.
  • Enclosing cellular structures in tubes has the effect of increasing peak stress while also increasing plateau stress undulations.

Supplementary Materials

The following supporting information can be downloaded at: https://www.mdpi.com/article/10.3390/jmmp6060140/s1, Video S1: Auxetic lattice under compression; Video S2: Schwarz-P TPMS under compression—comparison across three thicknesses; Video S3: Diamond TPMS under compression—comparison across three thicknesses; Video S4: Gyroid TPMS under compression—comparison across three thicknesses.

Author Contributions

Conceptualization, M.J., J.F. and D.B.; methodology, M.S., D.A. and I.E.R.-C.; design, D.A. and M.S.; testing, I.E.R.-C. and M.S.; formal analysis, M.S., I.E.R.-C. and D.A.; resources, M.J. and D.B.; writing—original draft preparation, M.S.; writing—review and editing, M.S. and D.B.; visualization, M.S. and I.E.R.-C.; supervision, D.B.; funding acquisition, M.J. and D.B. All authors have read and agreed to the published version of the manuscript.

Funding

This work was partially supported by an industry grant from BAE Systems, Award # AWD00034538.

Data Availability Statement

Not Applicable.

Acknowledgments

The authors would like to acknowledge Proto Labs, Inc. for their support with manufacturing the specimens used in this work and also for providing the process parameters associated with the laser powder bed fusion of AlSi10Mg.

Conflicts of Interest

The authors declare no conflict of interest.

References

  1. Yin, S.; Li, J.; Liu, B.; Meng, K.; Huan, Y.; Nutt, S.R.; Xu, J. Honeytubes: Hollow lattice truss reinforced honeycombs for crushing protection. Compos. Struct. 2017, 160, 1147–1154. [Google Scholar] [CrossRef] [Green Version]
  2. Harris, J.A.; Winter, R.E.; McShane, G.J. Impact response of additively manufactured metallic hybrid lattice materials. Int. J. Impact Eng. 2017, 104, 177–191. [Google Scholar] [CrossRef] [Green Version]
  3. Sun, G.; Jiang, H.; Fang, J.; Li, G.; Li, Q. Crashworthiness of vertex based hierarchical honeycombs in out-of-plane impact. Mater. Des. 2016, 110, 705–719. [Google Scholar] [CrossRef]
  4. Ha, N.S.; Lu, G.; Xiang, X. Energy absorption of a bio-inspired honeycomb sandwich panel. J. Mater. Sci. 2019, 54, 6286–6300. [Google Scholar] [CrossRef]
  5. Alantali, A.; Alia, R.A.; Umer, R.; Cantwell, W.J. Energy absorption in aluminium honeycomb cores reinforced with carbon fibre reinforced plastic tubes. J. Sandw. Struct. Mater. 2019, 21, 2801–2815. [Google Scholar] [CrossRef]
  6. Sun, Y.; Li, Q.M. Dynamic compressive behaviour of cellular materials: A review of phenomenon, mechanism and modelling. Int. J. Impact Eng. 2018, 112, 74–115. [Google Scholar] [CrossRef] [Green Version]
  7. Branch, B.; Ionita, A.; Patterson, B.M.; Schmalzer, A.; Clements, B.; Mueller, A.; Dattelbaum, D.M. A comparison of shockwave dynamics in stochastic and periodic porous polymer architectures. Polymer 2019, 160, 325–337. [Google Scholar] [CrossRef]
  8. Rakow, J.F.; Waas, A.M. Size effects and the shear response of aluminum foam. Mech. Mater. 2005, 37, 69–82. [Google Scholar] [CrossRef]
  9. Chen, B.C.; Zou, M.; Liu, G.M.; Song, J.F.; Wang, H.X. Experimental study on energy absorption of bionic tubes inspired by bamboo structures under axial crushing. Int. J. Impact Eng. 2018, 115, 48–57. [Google Scholar] [CrossRef]
  10. Tang, Z.; Liu, S.; Zhang, Z. Analysis of energy absorption characteristics of cylindrical multi-cell columns. Thin-Walled Struct. 2013, 62, 75–84. [Google Scholar] [CrossRef]
  11. Yang, K.; Xu, S.; Zhou, S.; Shen, J.; Xie, Y.M. Design of dimpled tubular structures for energy absorption. Thin-Walled Struct. 2017, 112, 31–40. [Google Scholar] [CrossRef]
  12. Xiang, Y.; Wang, M.; Yu, T.; Yang, L. Key Performance Indicators of Tubes and Foam-Filled Tubes Used as Energy Absorbers. Int. J. Appl. Mech. 2015, 7, 1550060. [Google Scholar] [CrossRef]
  13. Wu, F.; Xiao, X.; Yang, J.; Gao, X. Quasi-static axial crushing behaviour and energy absorption of novel metal rope crochet-sintered mesh tubes. Thin-Walled Struct. 2018, 127, 120–134. [Google Scholar] [CrossRef]
  14. Gibson, L.; Ashby, M. Cellular Solids: Structure and Properties, 2nd ed.; Cambridge University Press: Cambridge, UK, 1999. [Google Scholar]
  15. Ashby, M.F.; Evans, A.G.; Fleck, N.A.; Gibson, L.J.; Hutchinson, J.W.; Wadley, H.N.G. Metal Foams: A Design Guide; Butterworth Heinemann: Oxford, UK, 2010. [Google Scholar]
  16. Bhate, D.; Penick, C.A.; Ferry, L.A.; Lee, C. Classification and selection of cellular materials in mechanical design: Engineering and biomimetic approaches. Designs 2019, 3, 19. [Google Scholar] [CrossRef] [Green Version]
  17. Gümrük, R.; Mines, R.A.W. Compressive behaviour of stainless steel micro-lattice structures. Int. J. Mech. Sci. 2013, 68, 125–139. [Google Scholar] [CrossRef]
  18. Maskery, I.; Aboulkhair, N.T.; Aremu, A.O.; Tuck, C.J.; Ashcroft, I.A.; Wildman, R.D.; Hague, R.J.M. A mechanical property evaluation of graded density Al-Si10-Mg lattice structures manufactured by selective laser melting. Mater. Sci. Eng. A 2016, 670, 264–274. [Google Scholar] [CrossRef] [Green Version]
  19. Ozdemir, Z.; Hernandez-Nava, E.; Tyas, A.; Warren, J.A.; Fay, S.D.; Goodall, R.; Todd, I.; Askes, H. Energy absorption in lattice structures in dynamics: Experiments. Int. J. Impact Eng. 2016, 89, 49–61. [Google Scholar] [CrossRef] [Green Version]
  20. Hazeli, K.; Babamiri, B.B.; Indeck, J.; Minor, A.; Askari, H. Microstructure-topology relationship effects on the quasi-static and dynamic behavior of additively manufactured lattice structures. Mater. Des. 2019, 176, 107826. [Google Scholar] [CrossRef]
  21. McKown, S.; Shen, Y.; Brookes, W.K.; Sutcliffe, C.J.; Cantwell, W.J.; Langdon, G.S.; Nurick, G.N.; Theobald, M.D. The quasi-static and blast loading response of lattice structures. Int. J. Impact Eng. 2008, 35, 795–810. [Google Scholar] [CrossRef]
  22. Liu, X.; Suzuki, A.; Takata, N.; Kobashi, M.; Kato, M. Dual plateau stress of C15-type topologically close-packed lattice structures additive-manufactured by laser powder bed fusion. Scr. Mater. 2021, 202, 114003. [Google Scholar] [CrossRef]
  23. Liu, Y.; Schaedler, T.A.; Jacobsen, A.J.; Chen, X. Quasi-static energy absorption of hollow microlattice structures. Compos. Part B Eng. 2014, 67, 39–49. [Google Scholar] [CrossRef]
  24. Schaedler, T.A.; Ro, C.J.; Sorensen, A.E.; Eckel, Z.; Yang, S.S.; Carter, W.B.; Jacobsen, A.J. Designing Metallic Microlattices for Energy Absorber Applications. Adv. Eng. Mater. 2014, 16, 276–283. [Google Scholar] [CrossRef]
  25. Maskery, I.; Aboulkhair, N.T.; Aremu, A.O.; Tuck, C.J.; Ashcroft, I.A. Compressive failure modes and energy absorption in additively manufactured double gyroid lattices. Addit. Manuf. 2017, 16, 24–29. [Google Scholar] [CrossRef]
  26. Yan, C.; Hao, L.; Hussein, A.; Bubb, S.L.; Young, P.; Raymont, D. Evaluation of light-weight AlSi10Mg periodic cellular lattice structures fabricated via direct metal laser sintering. J. Mater. Process. Technol. 2014, 214, 856–864. [Google Scholar] [CrossRef]
  27. Ma, Z.; Zhang, D.Z.; Liu, F.; Jiang, J.; Zhao, M.; Zhang, T. Lattice structures of Cu-Cr-Zr copper alloy by selective laser melting: Microstructures, mechanical properties and energy absorption. Mater. Des. 2020, 187, 108406. [Google Scholar] [CrossRef]
  28. Liang, Y.; Zhou, W.; Liu, Y.; Li, Z.; Yang, Y.; Xi, H.; Wu, Z. Energy Absorption and Deformation Behavior of 3D Printed Triply Periodic Minimal Surface Stainless Steel Cellular Structures under Compression. Steel Res. Int. 2021, 92, 2000411. [Google Scholar] [CrossRef]
  29. Zhang, L.; Feih, S.; Daynes, S.; Chang, S.; Wang, M.Y.; Wei, J.; Lu, W.F. Energy absorption characteristics of metallic triply periodic minimal surface sheet structures under compressive loading. Addit. Manuf. 2018, 23, 505–515. [Google Scholar] [CrossRef]
  30. Harris, J.A.; McShane, G.J. Metallic stacked origami cellular materials: Additive manufacturing, properties, and modelling. Int. J. Solids Struct. 2020, 185–186, 448–466. [Google Scholar] [CrossRef]
  31. Du, Y.; Gu, D.; Xi, L.; Dai, D.; Gao, T.; Zhu, J.; Ma, C. Laser additive manufacturing of bio-inspired lattice structure: Forming quality, microstructure and energy absorption behavior. Mater. Sci. Eng. A 2020, 773, 138857. [Google Scholar] [CrossRef]
  32. Li, Q.M.; Magkiriadis, I.; Harrigan, J.J. Compressive strain at the onset of densification of cellular solids. J. Cell Plast. 2006, 42, 371–392. [Google Scholar] [CrossRef]
  33. Andrews, E.W.; Gioux, G.; Onck, P.; Gibson, L.J. Size effects in ductile cellular solids. Part II: Experimental results. Int. J. Mech. Sci. 2001, 43, 701–713. [Google Scholar] [CrossRef] [Green Version]
  34. Tekoglu, C.; Gibson, L.J.; Pardoen, T.; Onck, P.R. Size effects in foams: Experiments and modeling. Prog. Mater. Sci. 2011, 56, 109–138. [Google Scholar] [CrossRef]
  35. NTopology Platform. Available online: https://ntopology.com (accessed on 1 May 2020).
  36. Zhang, J.; Lu, G.; You, Z. Large deformation and energy absorption of additively manufactured auxetic materials and structures: A review. Compos. Part B 2020, 201, 108340. [Google Scholar] [CrossRef]
  37. ASTM F3302; Standard for Additive Manufacturing—Finished Part Properties—Standard Specification for Titanium Alloys via Powder Bed Fusion. ASTM Standards: West Conshohocken, PA, USA, 2018; Volume 10.04, pp. 1–8. [CrossRef]
  38. AMS2774E; IN718 Heat Treatment. SAE Standard: Warrendale, PA, USA, 2016.
  39. Casanova, L.; Anitha, V.V.; Kadway, N.; Gandhi, A.; Le, T.; Lee, C.; Bhate, D. On the Mechanical Behavior of Additively Manufactured Asymmetric Honeycombs. In Proceedings of the 2018 International Solid Freeform Fabrication Symposium, Austin, TX, USA, 13–15 August 2018. [Google Scholar]
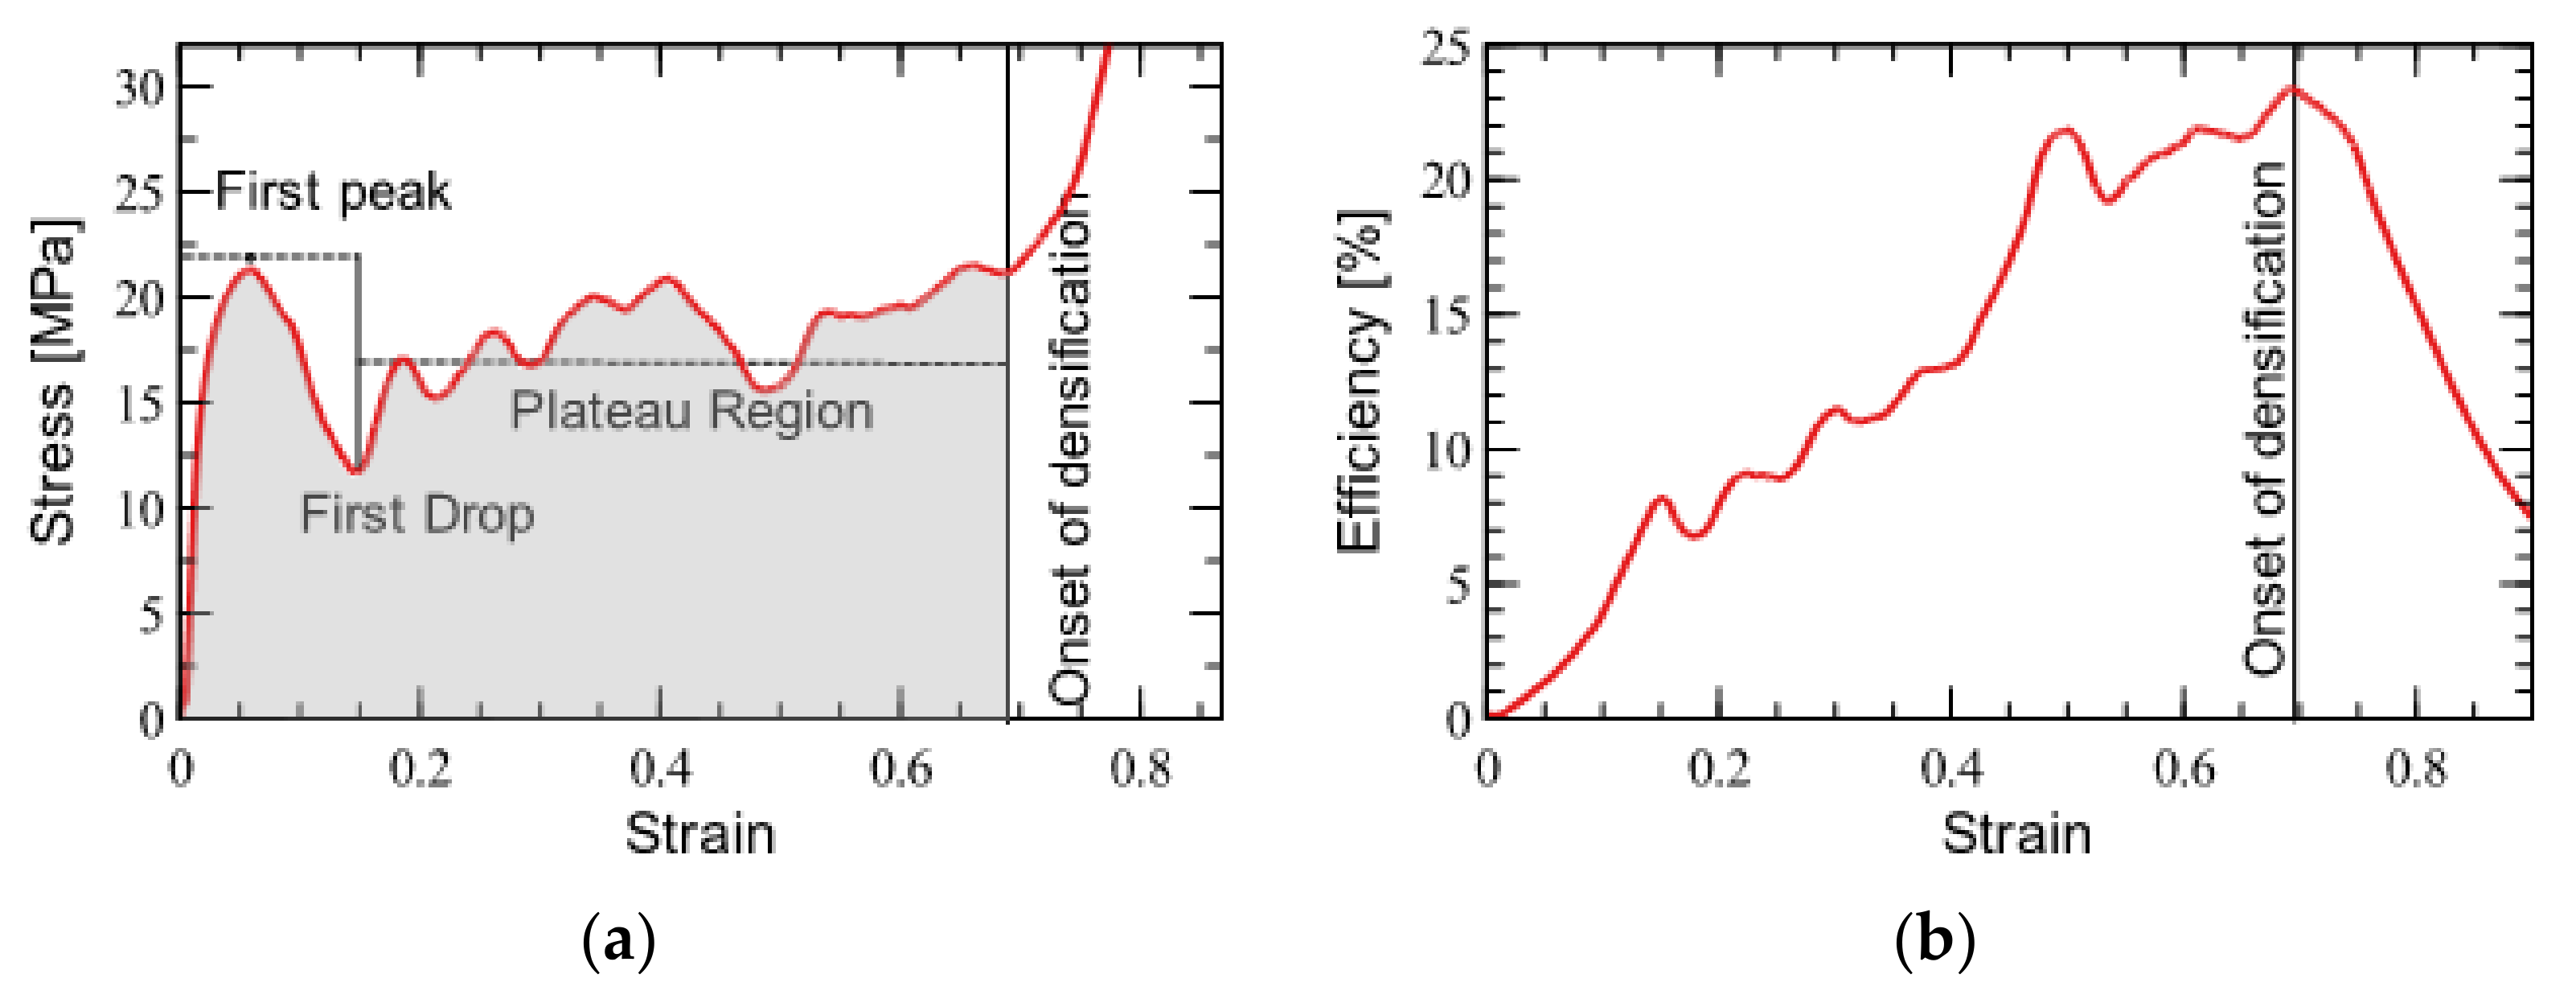
Figure 1. (a) a typical compression stress–strain response of a metallic lattice material showing the first peak, the plateau region, and the onset of densification, and (b) energy efficiency graphed against displacement, with the peak used to identify the onset of densification.
Jmmp 06 00140 g001
Figure 2. Design of cellular structures used in this study: (a) the six-unit cell shapes used in this study, (b) the same shapes enclosed in a 0.5 mm thin tube.
Jmmp 06 00140 g002
Figure 3. Build orientations of (a) specimens with end-plates, and (b) specimens enclosed in tubes.
Jmmp 06 00140 g003
Figure 4. Images of fabricated specimens for each of the six cell types showing good reproduction of design intent.
Jmmp 06 00140 g004
Figure 5. Three-dimensional measurement macroscope optical images and height maps of the specimens fabricated showing print quality and resolution.
Jmmp 06 00140 g005
Figure 6. (a) Stress–strain curves for honeycomb compression with 0.4-, 0.6- and 0.8-mm thickness (* the 0.8-mm specimen was tested on a different mechanical load frame), (b) honeycomb deformation for each of the three thicknesses at increasing strain.
Jmmp 06 00140 g006
Figure 7. Failure analysis on two surfaces of the 0.8 mm wall thickness honeycomb (relative density of 0.36) showing two inclined failure bands and lateral fractures in the wall evident on surface A; wall crimping visible on surface B.
Jmmp 06 00140 g007
Figure 8. (a) Stress–strain curves for an auxetic lattice shape under compression with 0.5, 0.75, and 1 mm beam diameters, (b) auxetic lattice deformation sequence for each of the three beam diameter specimens at increasing strain.
Jmmp 06 00140 g008
Figure 9. Failure analysis on two surfaces of the auxetic lattice: (a) for the 0.5 mm beam diameter specimen (relative density of 0.08), surface A shows beams collapsing and closing the re-entrant cell space, surface B shows shearing of planes; (b) the 1 mm beams (relative density of 0.27) show similar behavior on surface A, but surface B shows fracture along inclined planes.
Jmmp 06 00140 g009
Figure 10. (a) Stress–strain curves for Voronoi lattice shape under compression with 0.5, 0.75 and 1 mm beam diameters, and (b) Voronoi lattice deformation sequence for each of the three beam diameter specimens at increasing strain.
Jmmp 06 00140 g010
Figure 11. Failure analysis on two surfaces of the 0.75 mm beam diameter Voronoi lattice (relative density of 0.07).
Jmmp 06 00140 g011
Figure 12. (a) Stress–strain curves for Schwarz-P TPMS structure under compression with 0.4, 0.6 and 0.8 mm wall thicknesses, and (b) Schwarz-P TPMS deformation sequence for each of the three wall thickness specimens at increasing strain.
Jmmp 06 00140 g012
Figure 13. Failure analysis on two surfaces of the Schwarz-P TPMS structure for three different wall thicknesses/relative densities: (a) 0.4 mm/0.11; (b) 0.6 mm/0.17; (c) 0.8 mm/0.22.
Jmmp 06 00140 g013aJmmp 06 00140 g013b
Figure 14. (a) Stress–strain curves for diamond TPMS structure under compression with 0.4, 0.6 and 0.8 mm wall thicknesses, and (b) diamond TPMS deformation sequence for each of the three wall thickness specimens at increasing strain.
Jmmp 06 00140 g014
Figure 15. Failure analysis on two surfaces of the diamond TPMS structure for 0.4 mm wall thickness/0.13 relative density showing fractured cell walls.
Jmmp 06 00140 g015
Figure 16. (a) Stress–strain curves for gyroid TPMS structure under compression with 0.4, 0.6 and 0.8 mm wall thicknesses, and (b) gyroid TPMS deformation sequence for each of the three wall thickness specimens at increasing strain.
Jmmp 06 00140 g016
Figure 17. Failure analysis on two surfaces of the diamond TPMS structure for 0.4 mm wall thickness/0.13 relative density showing cell walls.
Jmmp 06 00140 g017
Figure 18. Gyroid TPMS structure with and without tube enclosure subjected to axial compression.
Jmmp 06 00140 g018
Figure 19. Stress–strain compressive behavior of cellular materials enclosed in tubes, compared to the same designs without a tube. Also shown is the behavior of the tube alone and the curve obtained from numerical addition of the tube and base structure.
Jmmp 06 00140 g019
Figure 20. (a,b) Comparison of change in specific energy absorption and normalized maximum transmitted stress with relative density for studied structures. (c,d) Logarithmic plot of energy absorbed per unit mass against maximum transmitted stress until the structure absorbs that energy.
Jmmp 06 00140 g020
Figure 21. Comparison of densification efficiencies for each of the six shapes and three relative densities (dimensions marked with * correspond to lattice strut diameters used for auxetic and Voronoi structures, which were slightly larger than the wall thickness associated with the other structures).
Jmmp 06 00140 g021
Figure 22. Deformation of cellular structures at the densification strain, mentioned below the picture of individual cellular shape. * Dimensions marked with * correspond to structures marked with *.
Jmmp 06 00140 g022
Figure 23. Plateau undulation quantified as (a) normalized first dip, and (b) normalized plateau range.
Jmmp 06 00140 g023
Figure 24. (a) Normalized effective modulus, (b) normalized maximum transmitted stress, and (c) SEA, all plotted as a function of relative density. The adjacent tables provide the fit parameters, with the R2 value indicative of the quality of the fit.
Jmmp 06 00140 g024aJmmp 06 00140 g024b
Table 1. Compilation of quasi-static energy absorption studies in lattice structures manufactured with metal additive manufacturing.
Lattice GeometryProcess and MaterialRelative Density Range (%)Strain or Displacement Rates
BCC lattice [17]PBF-LB Stainless Steel 316L3.5–13.80.25 mm/min
Uniform and graded thickness BCC lattice [18]PBF-LB AlSi10Mg22 (nominal)1.8 mm/min
BCC and BCC-Z latticePBF-LB Stainless Steel 316L3.5–15.9 (nominal)0.5 mm/min
Cubic, diamond and re-entrant lattice [19]EBM Ti6Al4V13.7–16.60.2 mm/min
Octet truss, rhombic dodecahedron, diamond and dode-medium lattices [20]PBF-LB Inconel 71815–30 (nominal)1 mm/min
Pillar octahedral and octahedral lattices [21]PBF-LB Stainless Steel 316L2.9–16.60.5 mm/min (elastic), 1 mm/min (plateau)
Lattice geometry mimicking C15 Laves phase [22]PBF-LB Al-12Si17–37 (nominal)0.002 s−1
Hollow micro-lattice [23,24]Photopolymerization + Nickel coating~1.1–32 (nominal)1 mm/min
TPMS double gyroid [25]PBF-LB AlSi10Mg22 (nominal)0.54 mm/min
TPMS diamond [26]PBF-LB AlSi10Mg5–15 (nominal)0.4 mm/min
TPMS diamond [27]PBF-LB Cu-Cr-Zr copper alloy10–20 (nominal)Quasi-static, rates not specified
TPMS P-type and G-type [28]PBF-LB Stainless Steel 316L22.5–36.70.001 s−1
TPMS P-type, diamond and gyroid [29]PBF-LB Stainless Steel 316L10.4–31.40.001 s−1
Stacked origami sheet-based materials [30]PBF-LB Stainless Steel 316L18.9–30.50.001 s−1
Bio-inspired cylindrical surface infilled with lattice struts [31]PBF-LB AlSi10MgNA1 mm/min
BCC: Body Centered Cubic; PBF-LB: Laser Powder Bed Fusion; EBM: Electron Beam Melting.
Table 2. Unit cell shapes and relative densities designed for the study.
Unit Cell ShapeThickness (mm)Nominal Relative DensityNominal Mass (g)Measured Relative Density Measured Mass (g)% Difference
Honeycomb0.40.2034.740.1931.94−8.05
0.60.3051.160.2848.18−5.82
0.80.3966.840.3663.18−5.48
Auxetic0.50.0840.540.0844.8510.62
0.750.1861.730.1768.3910.79
10.2988.470.27102.8316.23
Voronoi0.50.0323.260.0323.09−0.75
0.750.0629.940.0731.595.53
10.0938.470.1242.219.71
Diamond0.40.1645.380.1642.43−6.51
0.60.2559.560.2553.85−9.58
0.80.3373.480.3267.74−7.81
Schwarz P0.40.1336.810.1332.85−10.75
0.60.1946.590.1942.43−8.93
0.80.2656.420.2549.89−11.57
Gyroid0.40.1139.280.1134.85−11.29
0.60.1750.350.1745.67−9.30
0.80.2361.500.2256.49−8.15
Table 3. Comparison matrix for all shapes studied in this work.
SEA vs. Max
Transmitted Stress
Densification EfficiencyPlateau
Undulation
TunabilityOverall
Honeycomb21122
Auxetic lattice33313
Voronoi lattice32113
Diamond TPMS11121
Gyroid TPMS11111
Schwarz-P TPMS11222
The color indicates performance level of the structure: green indicates good performance, yellow indicates average performance, and red indicates poor performance.
Publisher’s Note: MDPI stays neutral with regard to jurisdictional claims in published maps and institutional affiliations.