1. Introduction
Throughout the history of aviation, aircraft manufacturers have always tried to produce better and stronger designs for their aircrafts. All parts of an aircraft must be strong enough to carry heavy loads in all directions, so construction is of key importance. Aircrafts designed for long-distance travel have a different internal structure than aircrafts designed for agriculture or search and rescue missions [
1,
2,
3]. The primary factors to consider in aircraft structures are strength, weight and reliability. The factors determine the requirements to be met by any material used to construct or repair the aircraft. All materials used to construct an aircraft must be reliable. Reliability minimizes the possibility of dangerous and unexpected failures. Types of stresses on the wings, fuselage and landing gear of aircrafts are tension, compression, shear, bending and torsion. These stresses are absorbed by each component of the wing structure and transmitted to the fuselage structure. Wings develop a major portion of the lift to raise an aircraft. Wing structures carry some of the heavier loads found in the aircraft structure. The particular design of a wing depends on many factors, such as size, weight, speed, rate of climb and use of the aircraft. The wing must be constructed so that it holds its aerodynamic shape under extreme stresses.
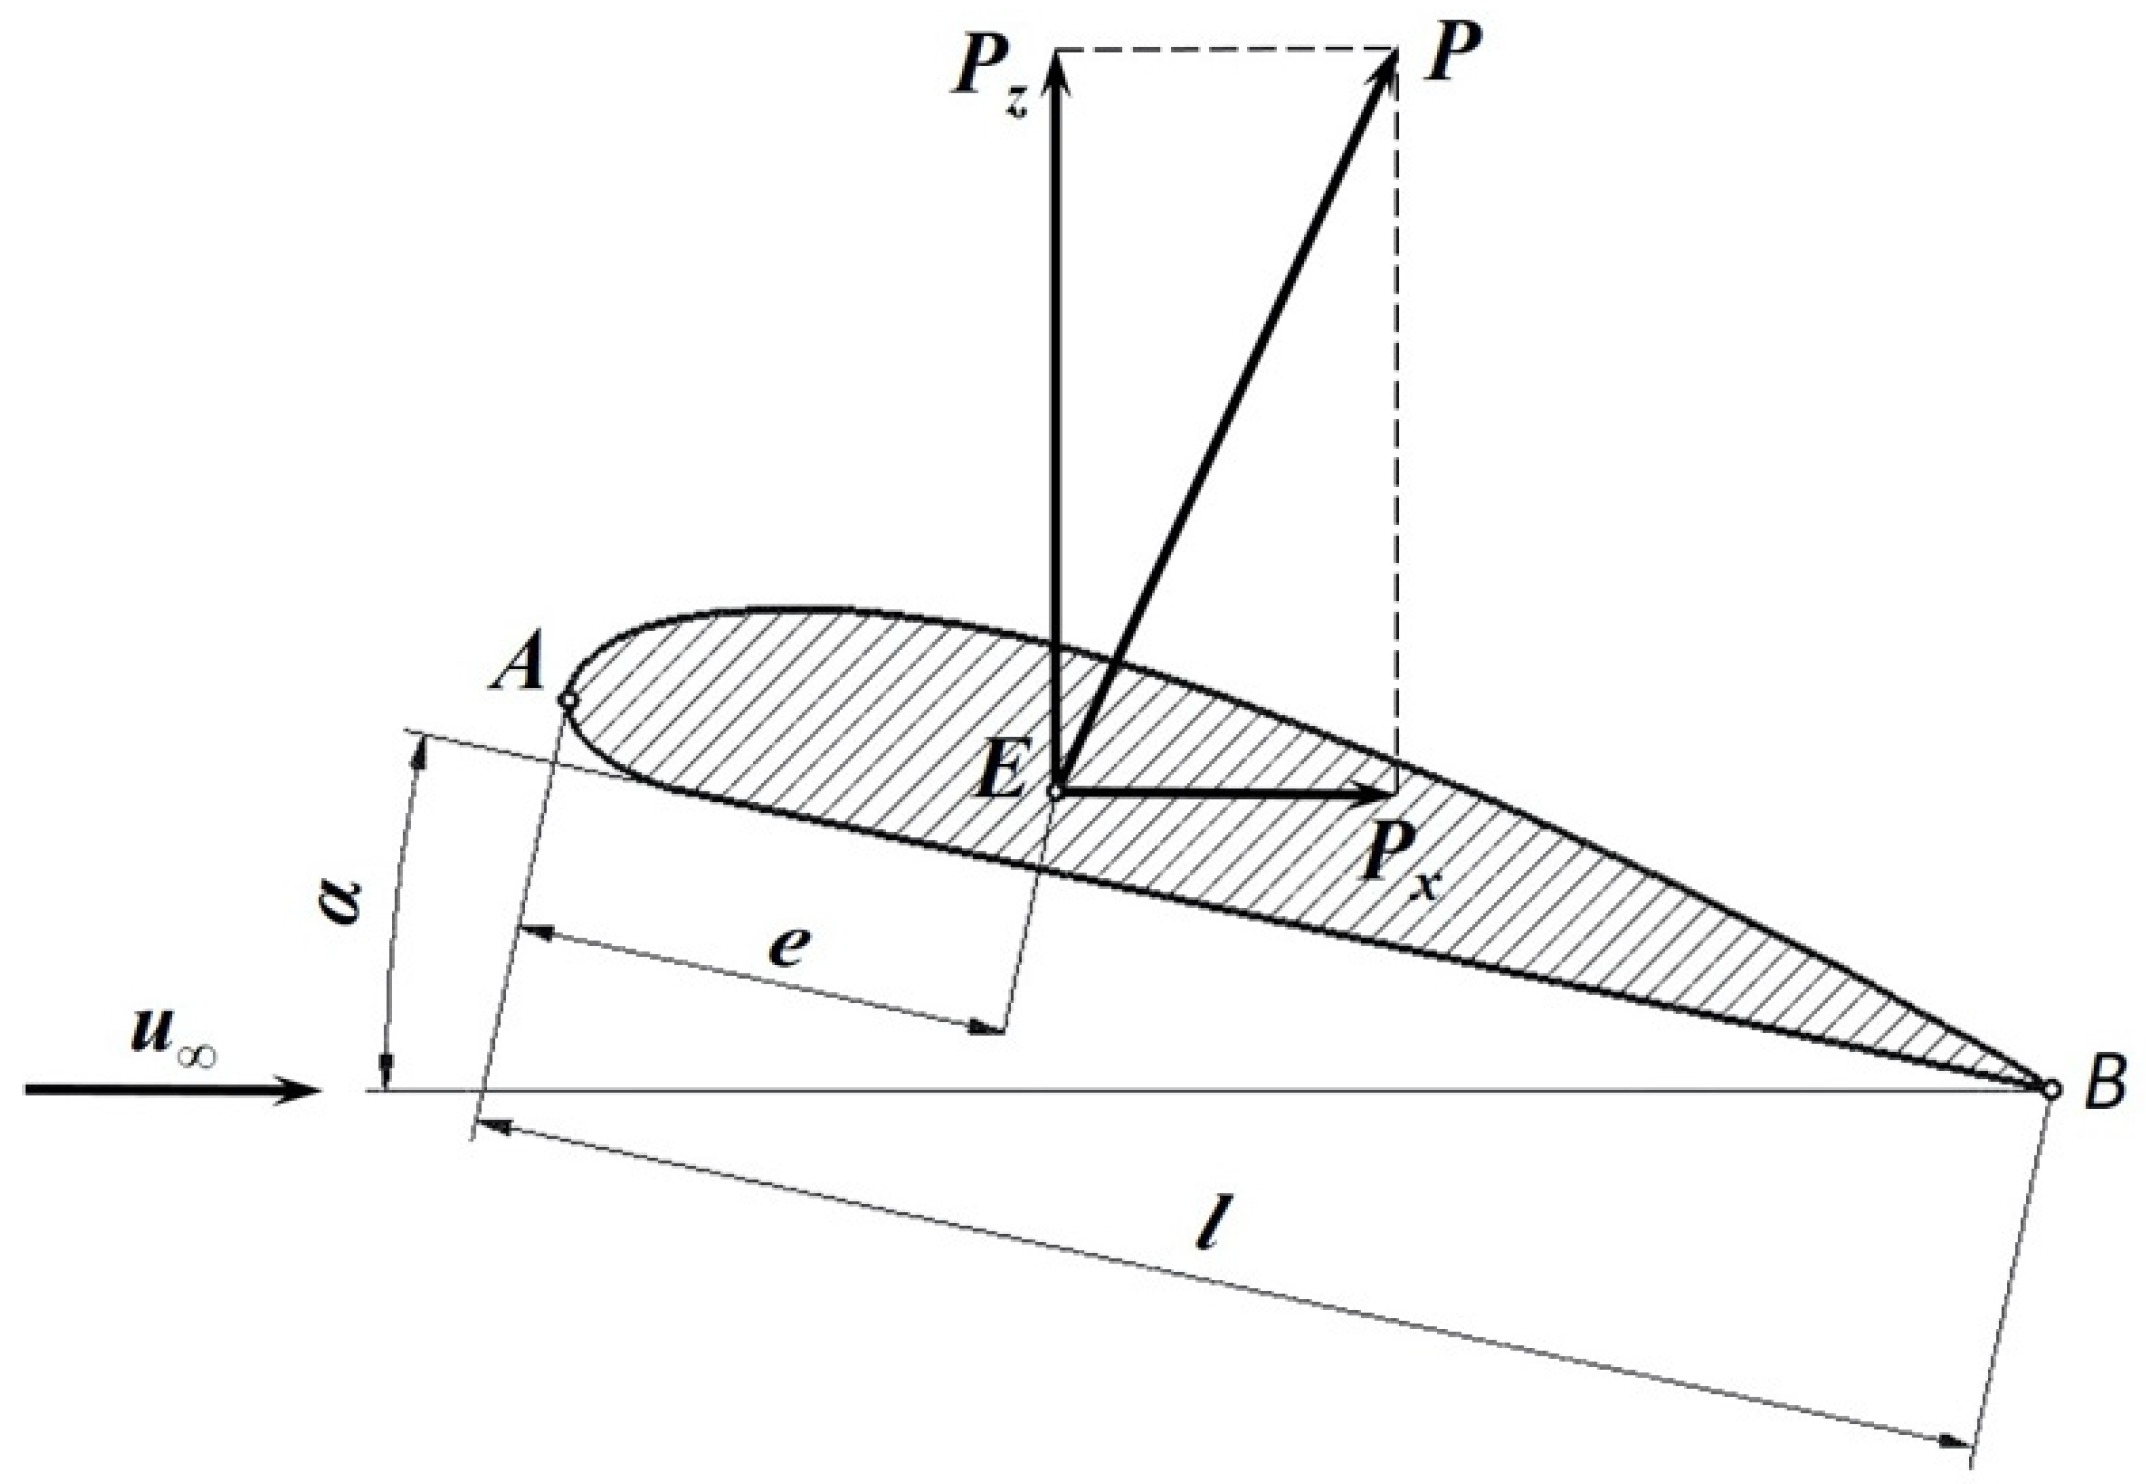
At higher air velocities, there is generally lower pressure on the upper surface of the wing. This results in a pressure difference between the upper and lower surfaces of the wing. The pressure difference creates lift force, directed upward, perpendicular to the undisturbed direction of velocity. Overpressure is created on the lower surface and under pressure on the upper surface of the wing. The mechanism of lift force generation is also related to the angle of attack. A decrease in the angle of attack is accompanied by an increase in the speed of the air surrounding the object, while an increase in the angle of attack causes an increase in the lift force up to a critical point. Reaching this point causes the so-called stall under flight conditions as a result of a decrease in the lift force [
4,
5].
The lift force, Pz, is a component of the reaction occurring in motion relative to a solid body and a fluid medium, perpendicular to the direction of motion of this body in a stationary medium or the direction of flow of an undisturbed medium flowing around a stationary, solid body [
1,
6,
7,
8]. The lift force at a given airspeed determines the serviceability of the aircraft. The drag occurring under these conditions determines the magnitude of the propulsion force (propeller thrust and jet force) necessary to provide a given airspeed [
8,
9]. The drag force, Px, is the force that acts in the direction of the velocity vector of the incoming airflow [
10,
11].
The point of application of the resultant aerodynamic force, P, formed by the components of the lift force, Pz, and the drag force, Px, is called the center of pressure (
Figure 1). If the angle of attack increases, the value of the aerodynamic force changes and the center of pressure moves towards the leading edge [
4,
12,
13].
The lift force, Pz, is described by the following Equation (1):
where:
Cz—dimensionless lift coefficient;
ρ—density of air;
V—velocity of the air stream;
S—wing lift surface area.
The aerodynamic drag force depends on the shape of the test object, its size and its position relative to the flowing air stream. The direction of the drag force is opposite to the flight of the aircraft.
The drag force, Px, is described by the following Equation (2):
where:
From the viewpoint of flight mechanics, the drag force, Px, is an unfavorable force because it opposes motion, while the lift force, Pz, is a desirable force because it lifts the weight of the flying object in the air in horizontal flight.
The ratio of lift to drag or, relating dimensional to dimensionless quantities for a given shape and position of a solid, the ratio of lift coefficient to drag coefficient is called the aerodynamic efficiency or K—efficiency of the streamlined solid [
13].
The aerodynamic efficiency of the whole object is determined to a large extent by the aerodynamic efficiency of its individual elements, i.e., the efficiency inherent in the given shape of the cross-sectional profiles. The value of the coefficients Cz, Cx and K = Cz/Cx(α) depends not only on the shape of the airfoil but also on its position relative to the direction of undisturbed flow V
∞ [
11,
14,
15].
The aerodynamic characteristics of airfoils are determined theoretically and experimentally in specialized wind tunnels through special procedures for an airfoil of infinite span, which makes it possible to recalculate these characteristics for airfoils of any span [
9,
16,
17].
Based on the results obtained from the model test and basic calculations, the following characteristics were obtained:
Cz = f(α) lift characteristics, i.e., the change in the lift coefficient and the characteristics;
Cx = f(α), i.e., the change in the drag coefficient as a function of the angle of attack, α;
Cz = f(Cx) characteristics or the so-called drag polar, also called the Lilienthal curve;
K = Cz/Cx(α) characteristics, i.e., aerodynamic efficiency of the airfoil.
Since the literature extensively discusses how to provide accurate and robust approximation methodologies for experimentally derived results that are well suited for problems of industrial interest, weighted approximations are proposed for this purpose to provide high accuracy while exploiting the structural nature of the grid or spatial approximation [
16,
18]. Innovation in aerospace involves accelerating, pushing the boundaries at the component and product levels in manufacturing operations and rethinking supply chains—in some cases at the business model level. It is now possible to create parts with complex geometries and shapes that, in many cases, cannot be created without 3D printing. The low cost in terms of design optimization makes 3D printing an attractive, lower-cost alternative for replacing conventional computerized numerical control (CNC) machining and other tooling processes for smaller parts and finished assemblies. In the aerospace industry, three-dimensional (3D) printing can provide a number of benefits such as reduced cycle times, lower production costs and lower part weights. Wang et al. [
19] reviewed current 3D printing practices in the aerospace industry. In their literature review, they identified five factors critical to the application of advanced 3D printing technologies in the aerospace industry, and a fuzzy systems approach combining a fuzzy geometric mean and a fuzzy analytic hierarchy process was used to evaluate the applicability and relative importance of the identified factors. The findings provide valuable information for countries or regions considering extending 3D printing applications to their aerospace industry [
19]. Three-dimensional printing offers almost infinite possibilities for rapid prototyping. Therefore, its application has been considered in many research fields, from mechanical engineering and medicine to materials science and chemistry. Electrochemistry is another field of science that can certainly benefit from 3D printing technologies, paving the way for the design and manufacture of cheaper, more efficient and widely available devices. Ambrosi et al. [
20] provided a general overview of the most commonly available 3D printing methods where 3D printing has been adopted as a possible tool for rapid prototyping [
11]. Other researchers evaluated geometric errors on the edges of machine parts produced by 3D modeling and printing [
21].
Thus far, there has been no visual system that supports 3D printing and meets the ease-of-use and cost requirements of most applications. The vision system allows the mapping of the aircraft model. Three-dimensional visual inspection is simply too expensive and complex for most cases. Furthermore, there are few vision tools that would work with real images that can be used for 3D printing. Therefore, an additional PC would need to be installed to actually address a given application. This would result not only in the need for more space, but also in programming requirements. In contrast, using a smart camera works very efficiently and features a significant ease of use. The computer vision system that monitors the printing process and the automation system enables continuous the sequential 3D printing of device parts [
3]. Additive manufacturing (AM) and 3D printing transform virtual 3D computer-aided design (CAD) models into physical objects. By digitally cutting CAD data, 3D scanning or tomography, AM builds objects layer by layer without the need for molds or machining. AM enables the decentralized, on-demand manufacturing of custom objects using digital information storage and data searches over the Internet. The continuing shift from rapid prototyping to rapid manufacturing creates new challenges for both mechanical engineers and material scientists. As polymers are by far the most widely used class of materials for AM, this review focuses on polymer processing and the development of polymers and advanced polymer systems specifically for AM. AM techniques include photo solidification (stereolithography), selective laser sintering (SLS), material and binder spraying (inkjet and aerosol 3D printing), laminated object manufacturing (LOM), deposition (FDM, 3D dispensing, 3D fiber deposition and 3D plotting) and 3D bioprinting. The range of polymers used in AM includes thermoplastics, thermosets, elastomers, hydrogels, functional polymers, polymer blends, composites and biological systems [
22,
23].
Three-dimensional printing or additive manufacturing is a novel method of producing parts directly from a digital model using a layer-by-layer build-up approach. This toolless production method enables the production of fully dense metal parts in a short time and with high precision. Additive manufacturing features such as part design freedom, part complexity, light weight, part consolidation and feature design are of particular interest to metal additive manufacturing in aerospace, oil and gas, marine and automotive applications. Powder bed fusion, where each layer of a powder bed is selectively fused using an energy source such as a laser, is the most promising additive manufacturing technology that can be used to produce small, complex metal parts [
24]. The most important advantages of 3D printing include the ability to print individual elements at a fairly low price without having to run the entire production line. When preparing a test product, its appearance can be checked and its parameters verified, which allows production errors to be avoided. A number of changes can also be made to the model to improve it according to the manufacturer’s preferences. The 3D printout is also characterized by high accuracy and precision as well as a faithful representation of the shape of the model. The large variety of materials enables the printing of various materials and parts with complex and advanced geometries. It is an innovative method used in various industries, but it is not without its drawbacks. One of the weaknesses of 3D printing is the long printing time, which can take up to 24 h for larger items. Undoubtedly, another disadvantage is the loud operation of the device and the generation of large amounts of heat, which causes rooms and devices to heat up. If problems are encountered while printing, the process must be restarted. Unfortunately, this increases the production time. Furthermore, a lot of knowledge and skill is required to print very small elements with a complex structure, and 3D printers come at a high price [
25].
Due to the fact that performing aerodynamic tests of aircrafts in real conditions is very expensive and requires expensive specialized equipment and large hangar areas, we decided to investigate whether mapping aircraft in 3D technology would allow such tests to be performed in laboratory conditions.
The value of aerodynamic coefficients shows information on the aerodynamic properties of an aircraft with a specific purpose, taking into account the following environmental parameters: air mass (density), ambient temperature and geometric parameters of the aircraft. Aerodynamic parameters make it possible to assess the flying properties of a flying object, ranging from stability and steerability to controllability in the implementation of the volatile task of the object, and, in particular, military aircrafts, such as the tested object. Actual results are not available due to military confidentiality.
The aim of this study was to investigate the aerodynamic properties of the M-346 “Bielik” aircraft model made with 3D technology. The airframe of the M-346 aircraft was designed in such a way as to obtain the highest efficiency and effectiveness during flight training at relatively low operating costs. The structure of the two-seater, two-engine airplane was designed completely with the use of the latest design programs, which allowed, in the long run, to introduce any possible changes in the body of the jet in a very short time. The model of the aircraft M-346 “Bielik” was chosen for the research because of the construction and body of the aircraft, which can be used in agriculture as well as for search and rescue missions. Another aim of the work was to assess the geometric similarities between the data source model and the real plane. The scientific nature of the article lies in the fact that the results obtained from experimental analyses in the wind tunnel allow for less costly research in comparison with research on a real object. In addition, the preparation of the model allows for faster changes at the design stage. Air contact geometry prepared for 3D printing of the test object allows CFD to be used in the implementation of numeral calculations.
2. Materials and Methods
The materials used to build the airframe were primarily aluminum alloys and composites reinforced with glass and carbon fiber. In order to maintain the high efficiency of the aircraft in the process of exploitation, the manufacturer introduced a system of the inspection and replacement of elements, which consisted in disassembling the modules and replacing them with new or improved ones without needing to verify their operation on the aircraft or recalibrating them.
The classic aerodynamic layout consisted of sweptback wings with LERX (Leading Edge Root eXtensions) roots and a single vertical stabilizer with a rudder. In addition, trapezoidal air blades were mounted between the LERX and the wings. The wings were trapezoidal in shape and had stressed skin and a triple-spar construction with an extended leading edge located along the fuselage. For such an arrangement, fuselage vortices generate lift in a more efficient way. The leading-edge sweep was 31°, the leading-edge extension sweep was 72° and the trailing-edge sweep was −2°. On the leading edge of the wing, there were two-part slots with an automatic control system powered by electricity. On the trailing edge of the wing, there were elevons and Fowler flaps controlled hydraulically. The single vertical tailplane was also trapezoidal in shape, with a three-spar stressed skin structure. The one-piece rudder and the tailplane consisting of trapezoidal horizontal stabilizers were made in the form of a honeycomb sandwich construction. The advantage of the tailplane used in the M-346 aircraft is the ability to work in two modes: as additional elevators or as ailerons. The aerodynamic system of M-346 is characterized by the fact the aircraft maintains full maneuverability during flight, even at high angles of attack. The computer controlling the front flaps changes the profile of the curvature of the plane so that we obtain the optimal aerodynamic conditions. In addition, the use of differentially tilted surfaces of the tailplane significantly improves the possibility of pitch control. The above-average performance and extremely modern construction and design of the fighters of the fifth generation made the M-346 become a desirable unit willingly purchased by many countries.
To realize the aerodynamic research in laboratory conditions, it was necessary to use a 3D scan of an aircraft model with parameters as close as possible to those of the real aircraft. The scope of the work included the creation of a physical model using 3D printing technology and the conduction of experimental tests in a wind tunnel.
The stages of the respective work are as follows:
Scanning the M-346 base model using a Nikon scanner along with a Model Maker MMDx scan head;
Creating a 3D CAD model based on an existing object using Geomagic Design X;
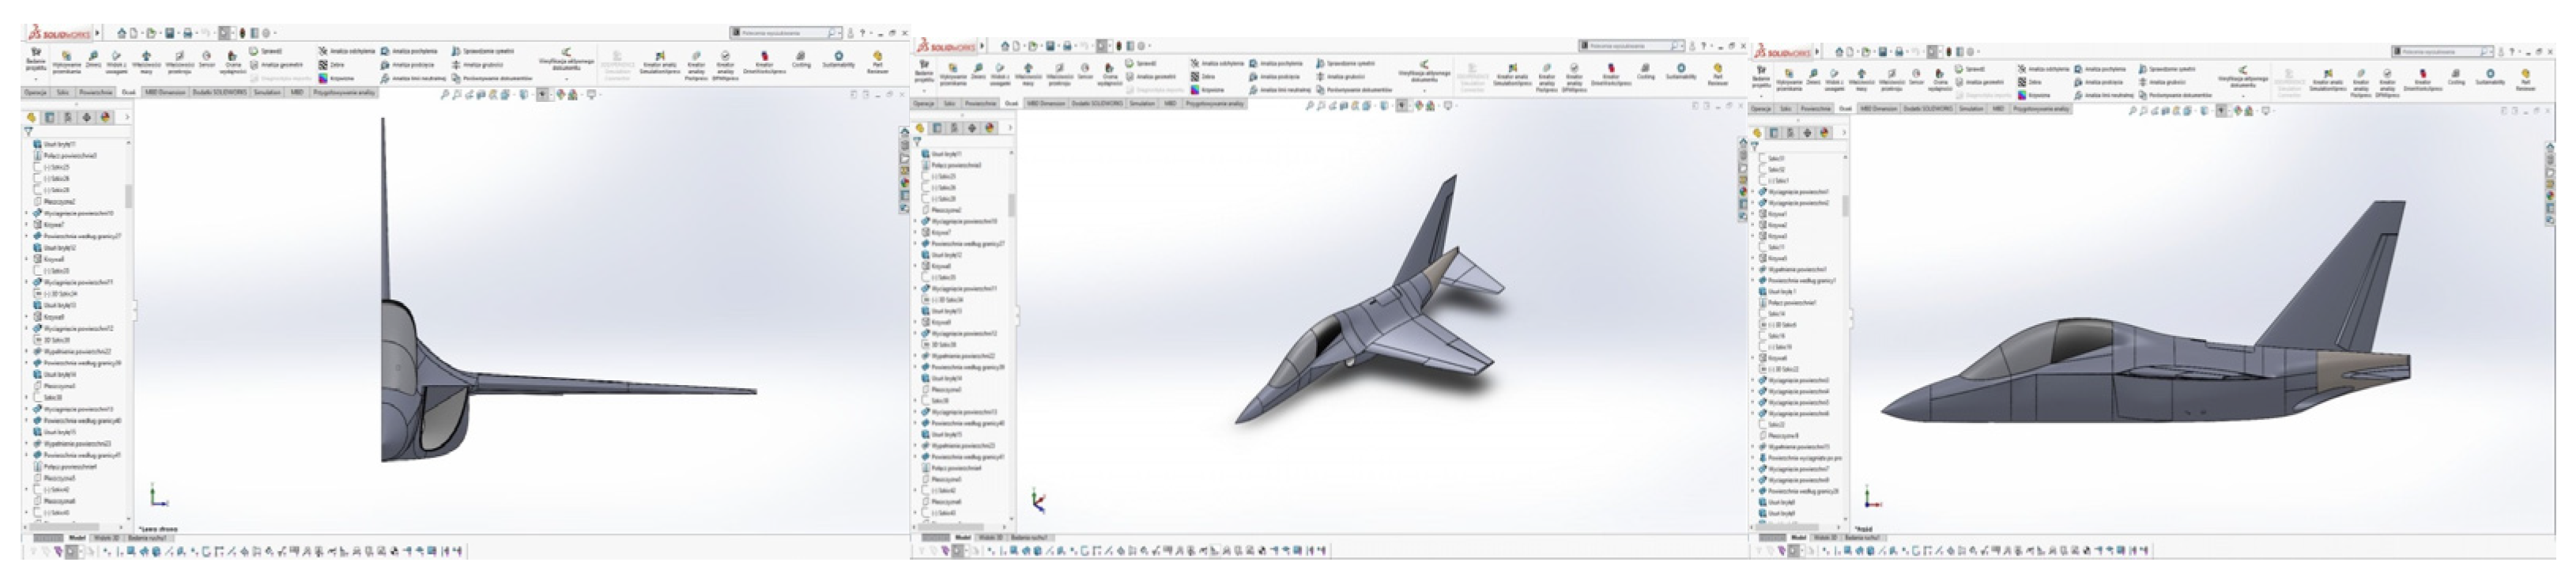
Based on the three-dimensional model, creating the geometry of the M-346 aircraft model using SolidWorks;
Optimizing and simplifying the model geometry;
Printing the test model using a MakerBot Replicator Z18 3D printer;
Preparing the model for experimental testing by proper treatment and finishing;
Conducting experimental studies in the Gunt HM 170 wind tunnel;
Calculating the lift coefficient, Cz, and drag coefficient, Cx;
Analyzing research findings.
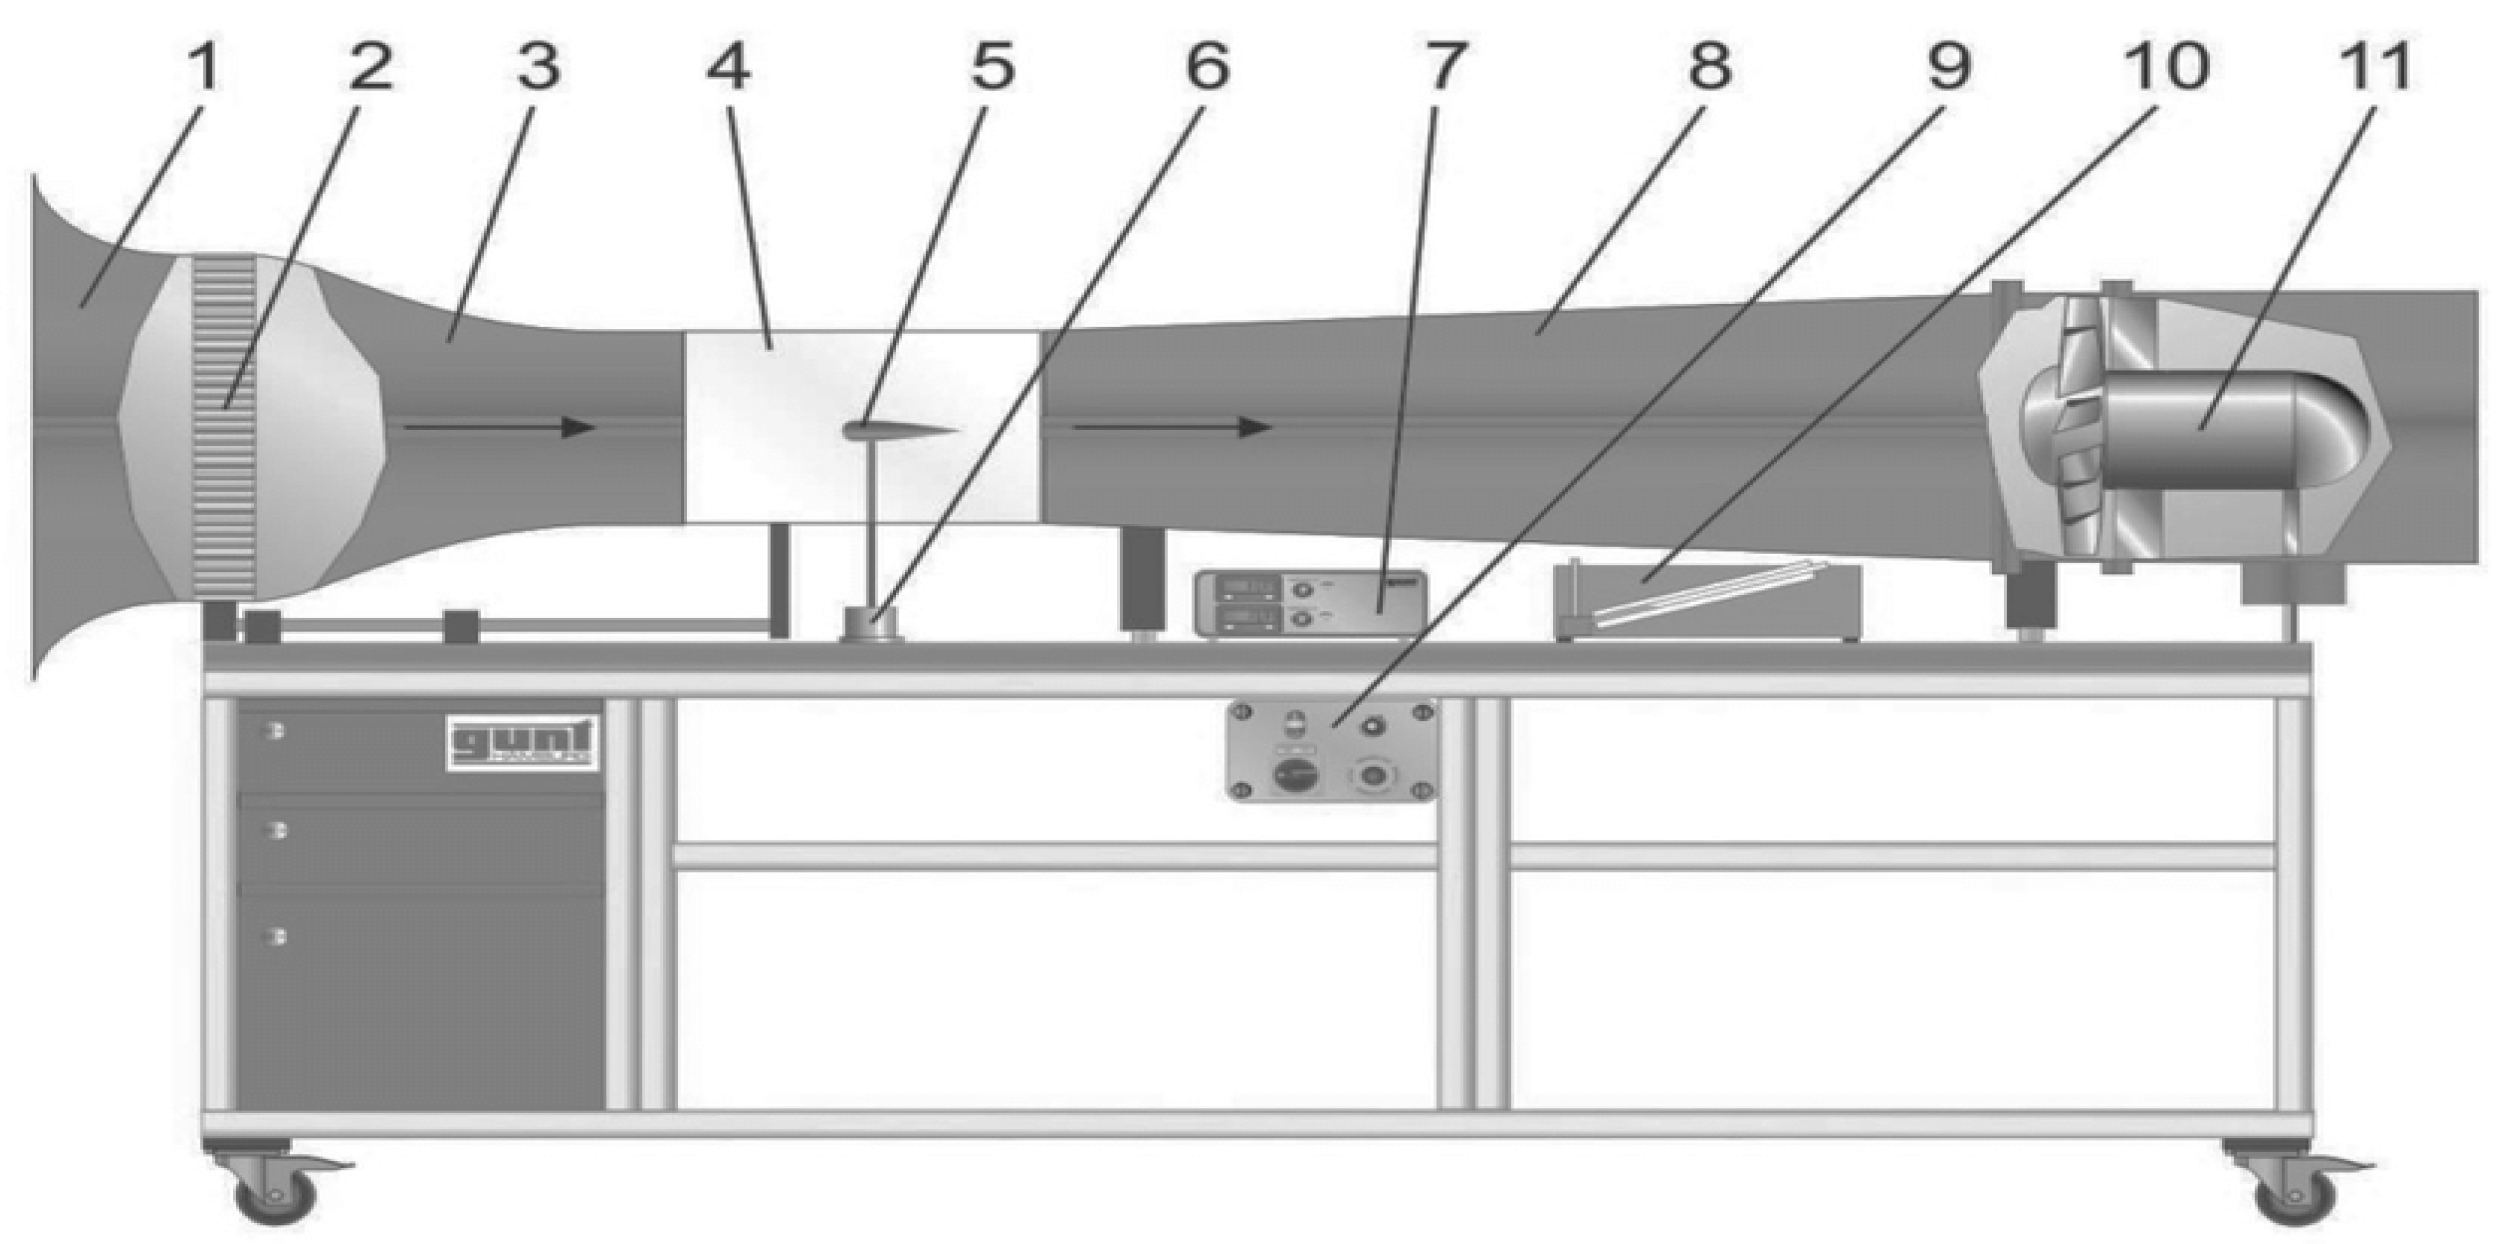
An open-circuit Gunt HM 170 wind tunnel with a closed square measuring section was used to perform experimental tests on the printed M-346 model. The detailed structure is shown in
Figure 2.
The characteristic feature of the tunnel is that the tested model remains stationary in the measurement space while the air is in motion, which allows for the proper flow around the object to be obtained. Air sucked from the environment is accelerated through the measurement section, decelerated in a diffuser and then pumped outside the tunnel with the help of a fan. The nozzle contour and a flow straightener ensure a uniform velocity distribution with little turbulence in the closed measuring section. The advantage of the Gunt HM 170 tunnel is the reduced pressure pulsation and lower flow resistance [
26]. The technical data are summarized in
Table 1.
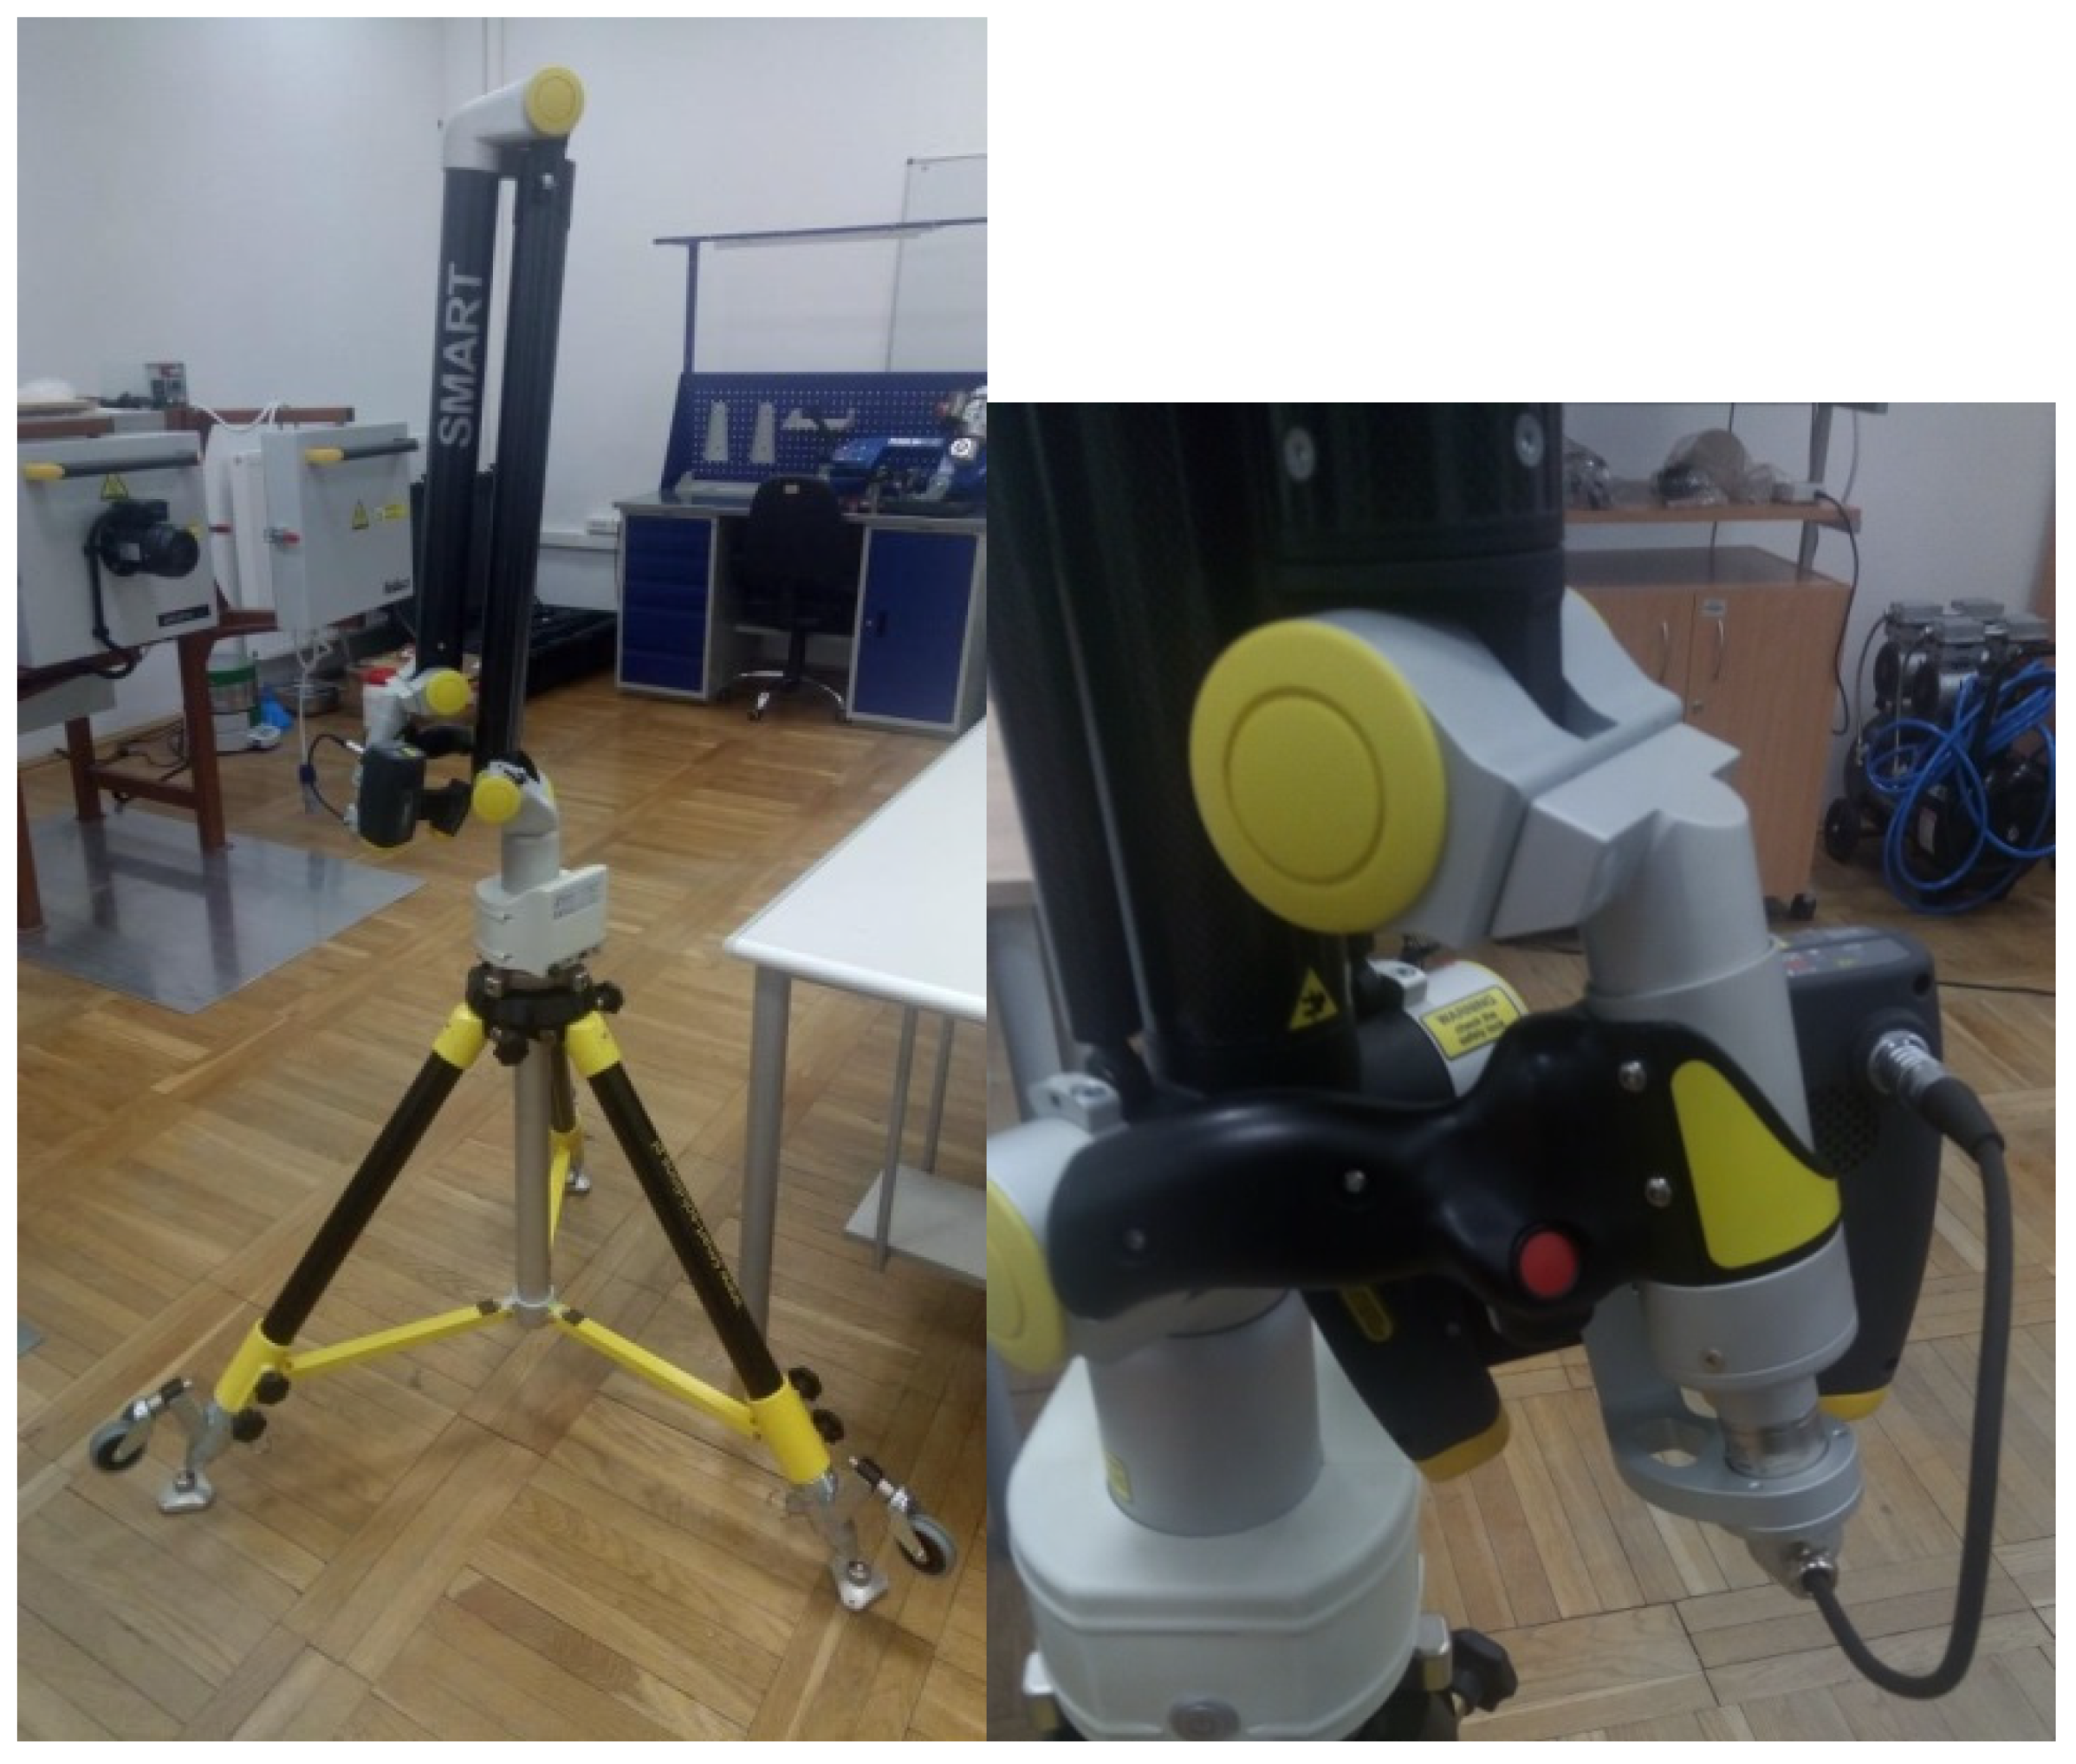
2.1. Nikon Model Maker MMDx
A Nikon Metrology 3D scanner along with a Model Maker MMDx (
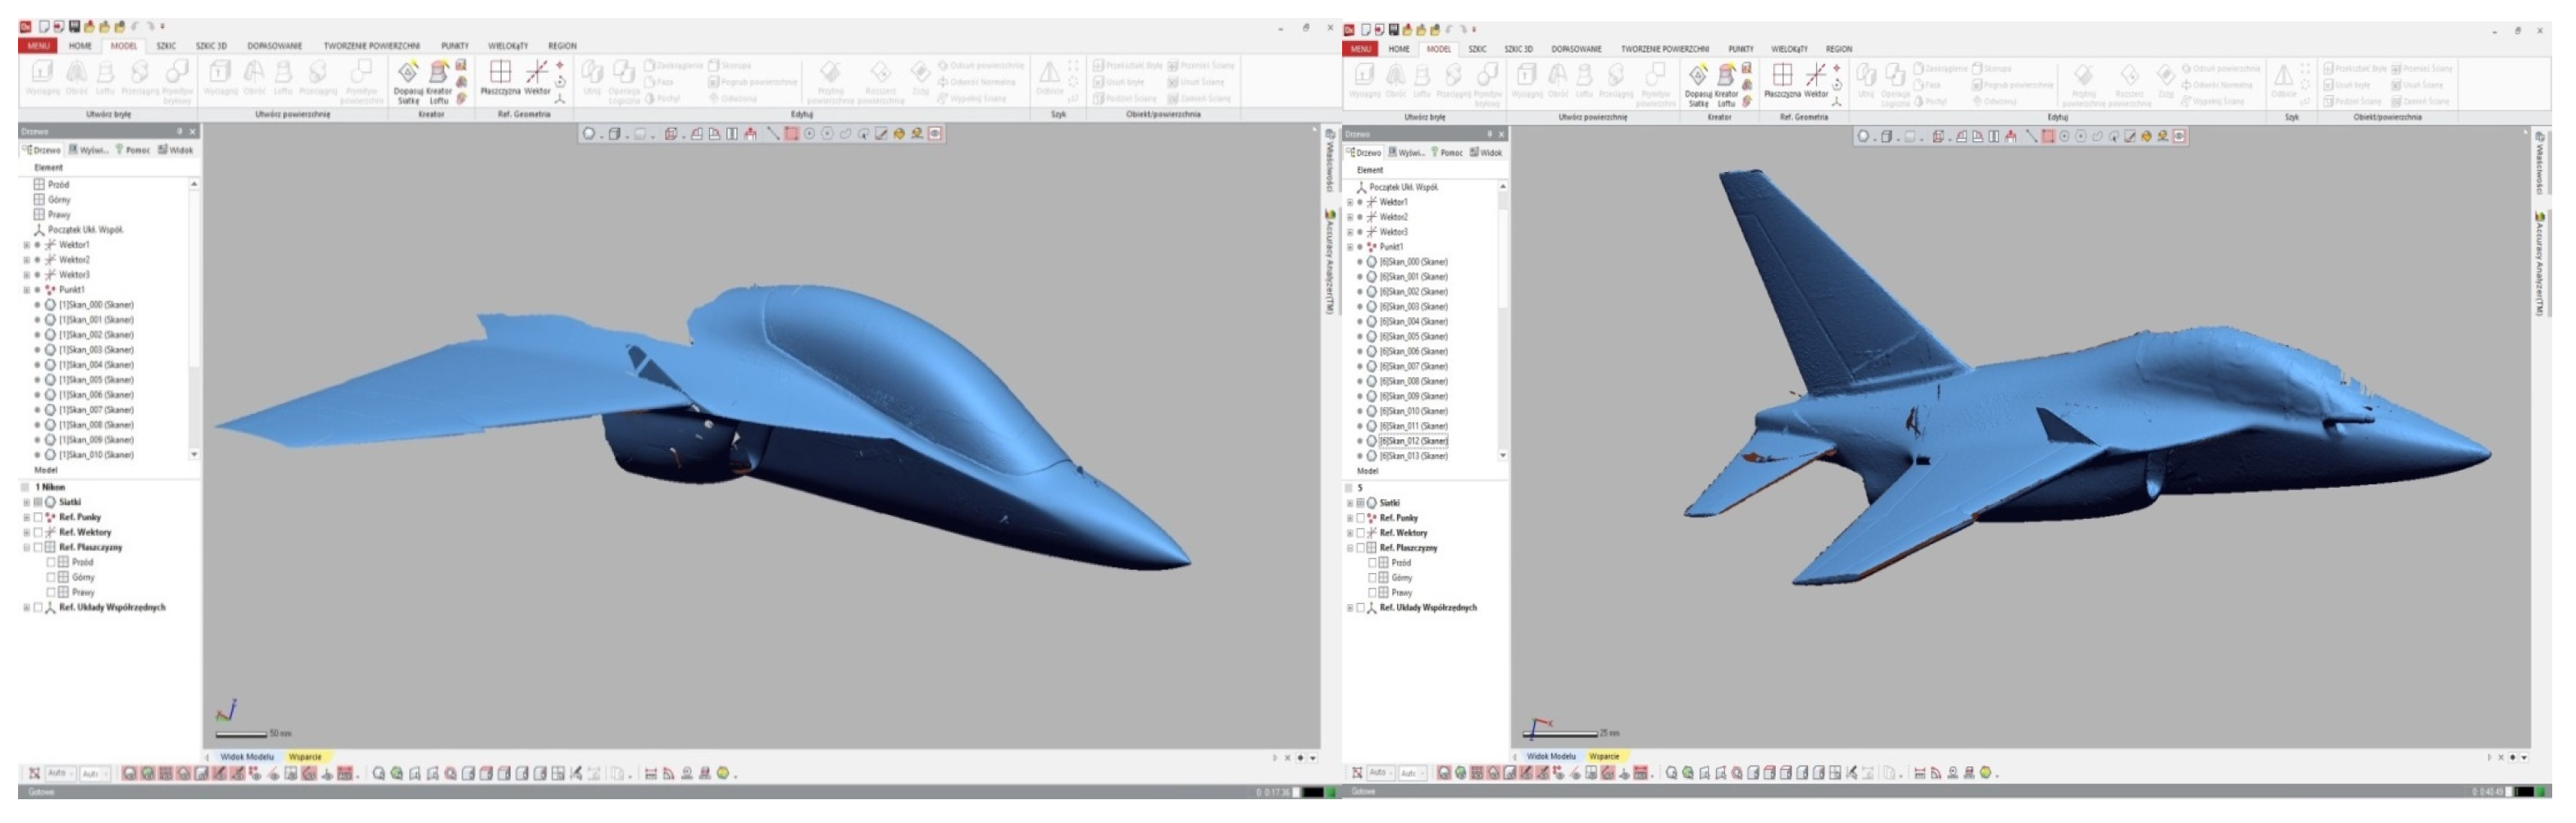
Figure 3) laser scanning head was used to scan the base object, i.e., M-346 “Bielik”. This scanner was mounted on a measurement arm. Its high scanning accuracy, versatility and performance make it ideal for part scanning, product geometry inspection and reverse engineering. With its advanced ESP3 technology, the Model Maker scanner adapts the power of the laser beam to the surface of the object to be scanned. Such beam adaptation is performed on an ongoing basis during the scanning process and is based on the actual characteristics of the surface being scanned. As a result, the Model Maker scanner is able to accurately and efficiently handle the details of any surface, color or topography—without the need to repeat the scan multiple times or use special surface opacifiers like other scanners do. The benefits of the Model Marker MMDx include faster and more accurate scanning that saves time and money. The scanner is ergonomic, lightweight and compact but also ruggedly built for use in any workshop, lab or manufacturing environment and optimized for difficult-to-scan surfaces. It also features plug-and-play connections for quick and easy setup and high scanning throughput with fast digital data capture. The head with a manual, seven-axis, coordinate-measuring arm was mounted on a lightweight and portable tripod for easy operation. The modular construction of the 3D scanner, the advanced arm design and the high accuracy of the head scanning allowed for the scanned object to be obtained in the form of a point cloud (
Figure 4), which was acquired in real time and uploaded to Geomagic Design X software. From this, a preliminary geometry of the aircraft was obtained, which was further optimized. The Nikon scanner used for the research very accurately collected data from the surface of the scanned model with an accuracy of 0.1 mm. Therefore, all unevenness from painting and dust made it difficult to quickly recreate the model in the software used. Therefore, it was necessary to filter, smooth and sometimes even remove the excess point cloud work on a computer with software, which is very demanding in terms of hardware (the software requires 20–30 GB of disk space and memory of about 20 GB). Then, the model had to be cleaned, and the glass of the cabin was properly painted. Here, non-destructive materials were used. This should be taken into account as some cleaning agents may cause tears in the material. The applied method of covering the glass caused additional deformation during scanning; therefore, the glass had to be made from scratch on the basis of several cross-sections of the point cloud. Linear movements (without vibrations), at an equal distance from the element, greatly accelerate the scanning process, producing scans of much better quality and with less noise. In addition, during mechanical processing, the material must not be overheated. For PLA, the limit is 60 degrees; it is very easy to destroy the model, in which case the work must be restarted. When preparing the model, attention must be paid to the temperature; at 60 degrees, PLA deforms easily, and in the event of damage such as deformation of, say, the fuselage, where the solid is quite large, the surface can be recreated by filling and smoothing in the case of thin-walled parts of the model, e.g., wings. The upper and lower parts of the airfoils may be deformed, irretrievably losing the original profile, despite the need for repair. During processing, one should pay attention to thin elements of the model; it is very easy to lose the correct shape of the aviation profile due to the low deformation temperature of the PLA material of about 60 degrees.
2.2. Geomagic Design X
Geomagic Design X is a reverse engineering software. This process involves the creation of a three-dimensional CAD model of an existing object based on a point data cloud or a triangle mesh obtained as a result of 3D scanning. The program allows one to recreate a fully editable solid model so that at each stage, there is an opportunity to make changes in order to optimize and improve it. This software was used to generate the model M-346 as a result of mapping the geometry of the base model. Geomagic Design X was not only used to edit the solid model but also enabled the continuous control of the modeling accuracy and allowed any imperfections to be repaired. Thus, the created model was used to generate an SLT file, which was used in SolidWorks in a further stage of the work.
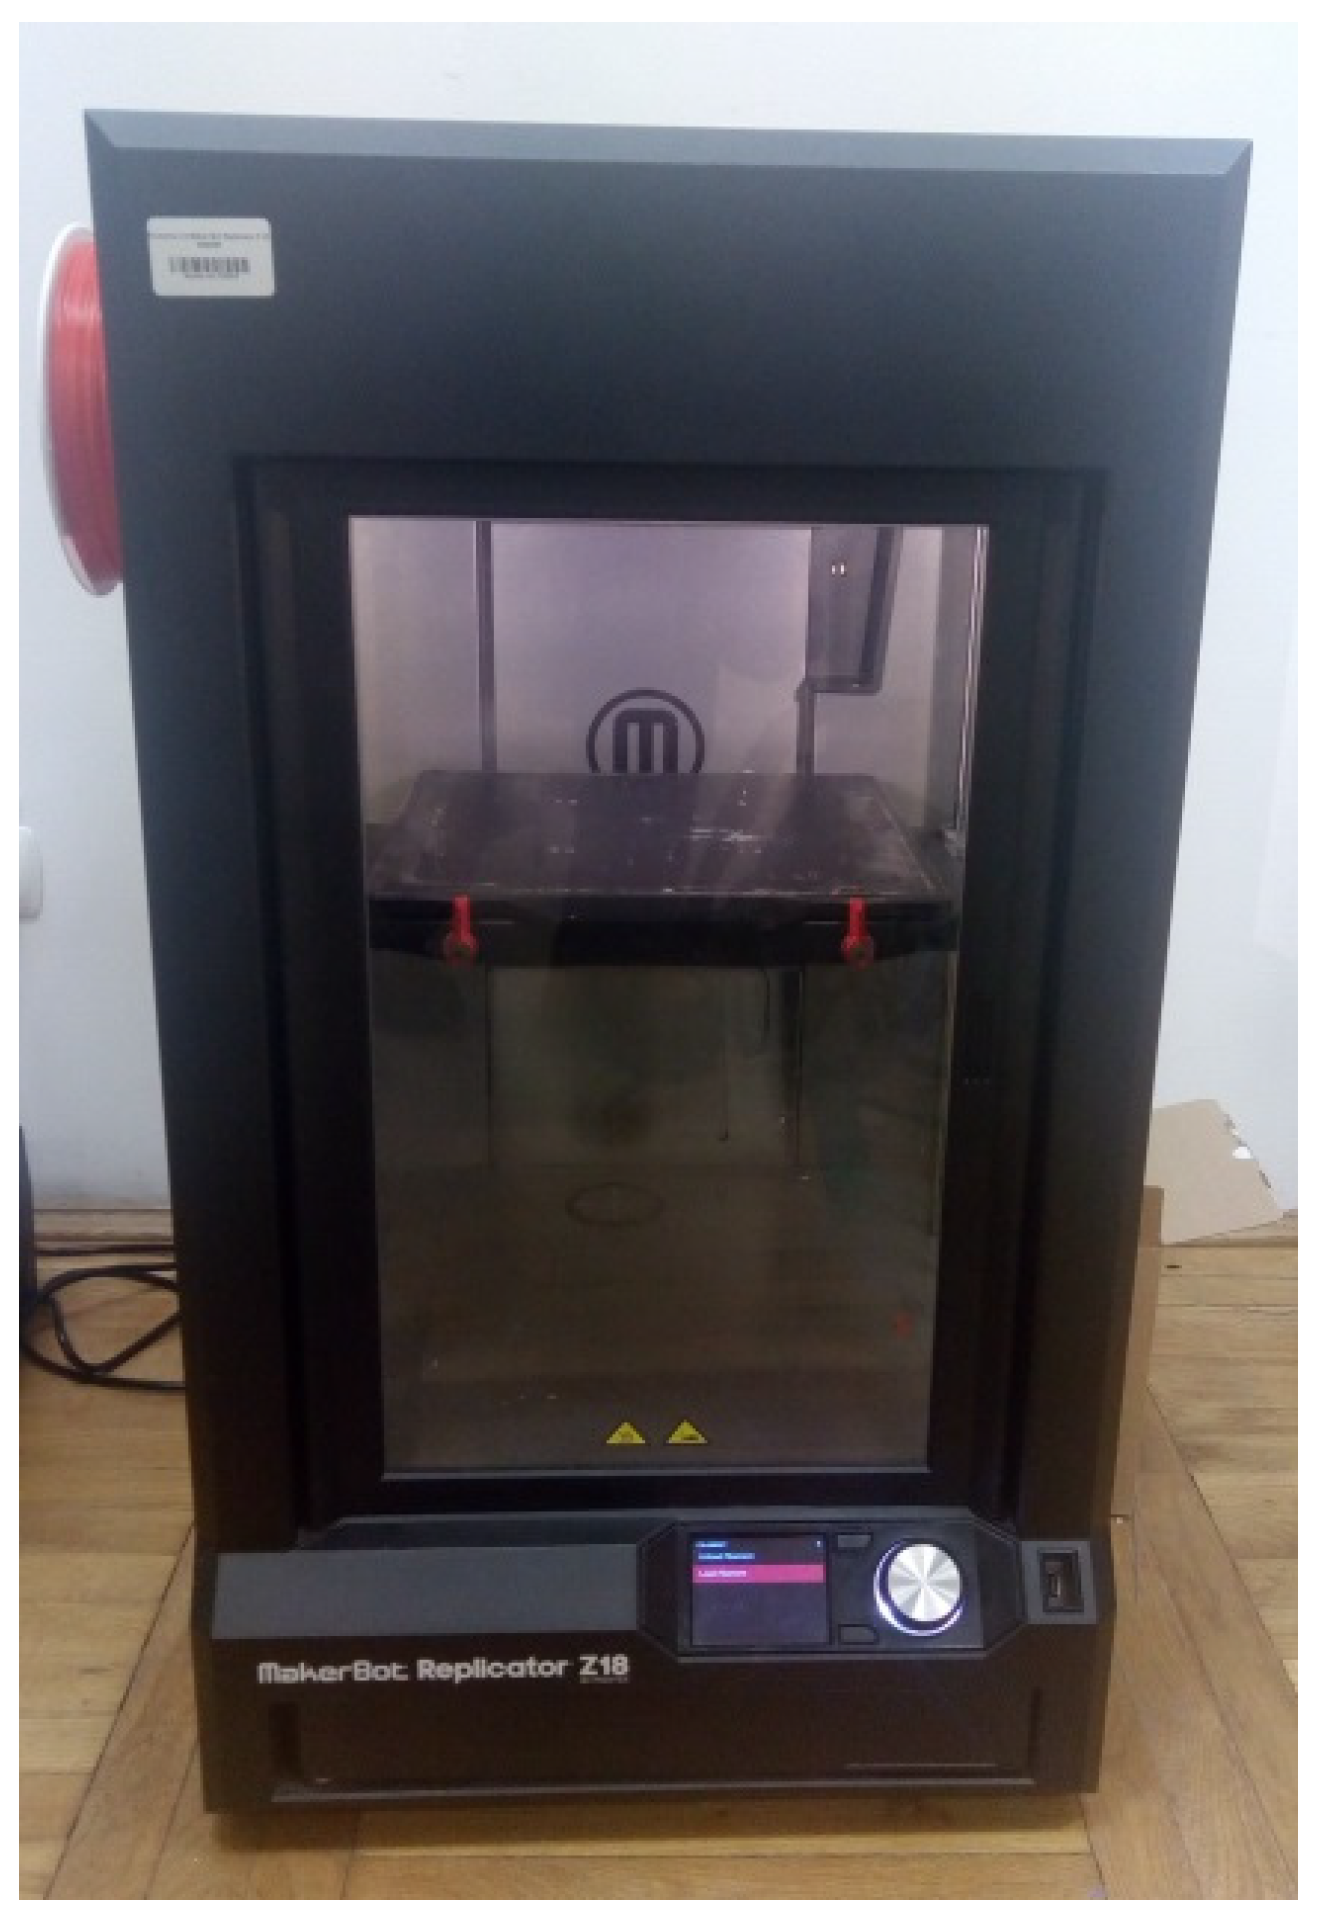
2.3. MakerBot Replicator Z18
Due to the assumed geometry of the M-346 “Bielik” model and the desire to obtain the best possible finishing quality, the printing was realized using the MakerBot Replicator Z18 printer (
Figure 5) [
27]. The printer’s working surface of 305 × 305 × 457 mm enabled the simultaneous printing of many elements. The tightly closed and heated space designed to maintain a constant temperature of the printing process of successive layers limited the shrinkage during cooling of the material, which had a particular impact on the obtainment of an object with the required parameters. The material used during the printing was polylactide (PLA), which is a biodegradable thermoplastic polyester produced from renewable resources. It is translucent and can be compared to conventional thermoplastics. Due to its properties, it can be used for processing without additional enhancements. In terms of properties, PLA is similar to polystyrene; however, when modified, it has properties similar to polypropylene and polyethylene. PLA has the ability to crystallize by stretching, and if crystallized by temperature, its impact strength can be modified; it can be copolymerized and processed on most processing equipment. It can be made into transparent films or injection-molded into blow-molding preforms such PET. It has excellent organoleptic properties and is ideal for food contact [
28].
Although PLA has good physical and rheological properties, it is combined with many additives to optimize it for special applications. These modifications are carried out by mixing PLA with different additives. The first case is the addition of fillers or fibers to PLA. Blends with polysaccharides are used: starch, which reduces the price and biological degradation time, and cellulose in the form of fibers increases stiffness and temperature resistance. Another type of blend is that with inorganic fillers such as talc, mica or glass. Improved tensile strength, which can be illustrated by the resistance of a cup to cracking when squeezed, requires the addition of rubbers. For the production of PLA, corn or sugar beets are most commonly used. Approximately 2.5 kg of corn grain (with 15% moisture content) is needed to produce 1 kg of PLA [
29]. This amount depends on the starch content in the grains and on the efficiency of each step of the polymer production process: the conversion of starch to dextrose, the conversion of dextrose to lactic acid and the polymerization reaction. Goh et al. investigated the mechanical properties, such as tensile, compressive and shear strength, of a carbon-fiber-reinforced thermoplastic. Anisotropic mechanical properties were observed in all tests. The landing gear of the unmanned aerial vehicle was designed and manufactured and optimized for topology using experimentally derived mechanical properties. The tests proved that the chassis structure was able to withstand extreme operating conditions [
30,
31].
The printer uses fused deposition modeling (FDM) technology. Due to its size, it is a device suitable for creating large models. The 3D printer uses the most modern construction solutions consisting of a tightly closed and heated working chamber along with a precise platform with autocalibration. Such solutions guarantee the highest quality of model, even during long printing processes.
2.4. CAD Software—SolidWorks
The SolidWorks program is one of many CAD software for spatial design available in the market. The program allows the generation of spatial geometry as a result of solid or surface modeling; based on the 3D model of the part, it is possible to make assembly models, technical drawings, motion and load simulations, animations and much more, and the necessary 2D documentation [
32] can also be made.
In order to give the final shape and dimensions to the M-346 model, the described SolidWorks CAD program was used. Based on the solid base model obtained in the Geomagic Design X program, the SolidWorks program allowed for the 3D model to be designed, consisting of three-dimensional geometry defined by its edges, walls and surfaces [
22]. The actual M-346 aircraft is a very complex structure; therefore, the resulting CAD geometry had to be optimized by simplifying parts of the airframe structural elements. Due to the limited dimensions of the measurement space, the final dimensions were designed to take full advantage of the wind tunnel capabilities.
The research model of M-346 “Bielik” was created using a Nikon Model Maker MMDx scanner together with Geomagic Design X software, made available by the Polish Air Force Academy in Dęblin. Using the scanner contributed significantly to the rapid acquisition of the preliminary geometry of the aircraft without having to design it from scratch.
The generated image was sent to a computer in real time, which allowed for direct control over the scanning accuracy while operating the arm with the scanning head mounted on it. As it was not possible to obtain a uniform shape of the aircraft, it was necessary to perform several scans from each side of the base object. Thus, the generated images were assembled using the Geomagic Design X program, resulting in a uniform structure of the M-346 model. In the next stage of work, the SolidWorks program was used to optimize the model. Due to the limited dimensions of the wind tunnel measurement space (technical data are presented in
Table 1) and the way of mounting, the left side of the airplane was used for testing, while the real dimensions were reduced. Finally, a model with the following dimensions was obtained: length—420 mm; width of half of the model—180 mm; height with the vertical stabilizer without landing gear—150 mm (
Figure 6). In addition, we decided to split the fuselage of the model into two parts, and the division line was located just behind the fairing at the height of the air intake to the engines. In order to carry out further finishing and testing works, additional fixing holes were added to the body of the M-346 model. The first one had the shape and dimensions of an M6 nut and was used to securely and stably fix the test object in the wind tunnel. The hole was placed in the fuselage division line into left and right parts at a distance of 244 mm to the center of the hole from the nose of the aircraft and a height of 40 mm. Another two holes with diameters of 2 mm were placed in the dividing line just behind the cockpit fairing, which were intended to be used to connect the two parts of the model after 3D printing.
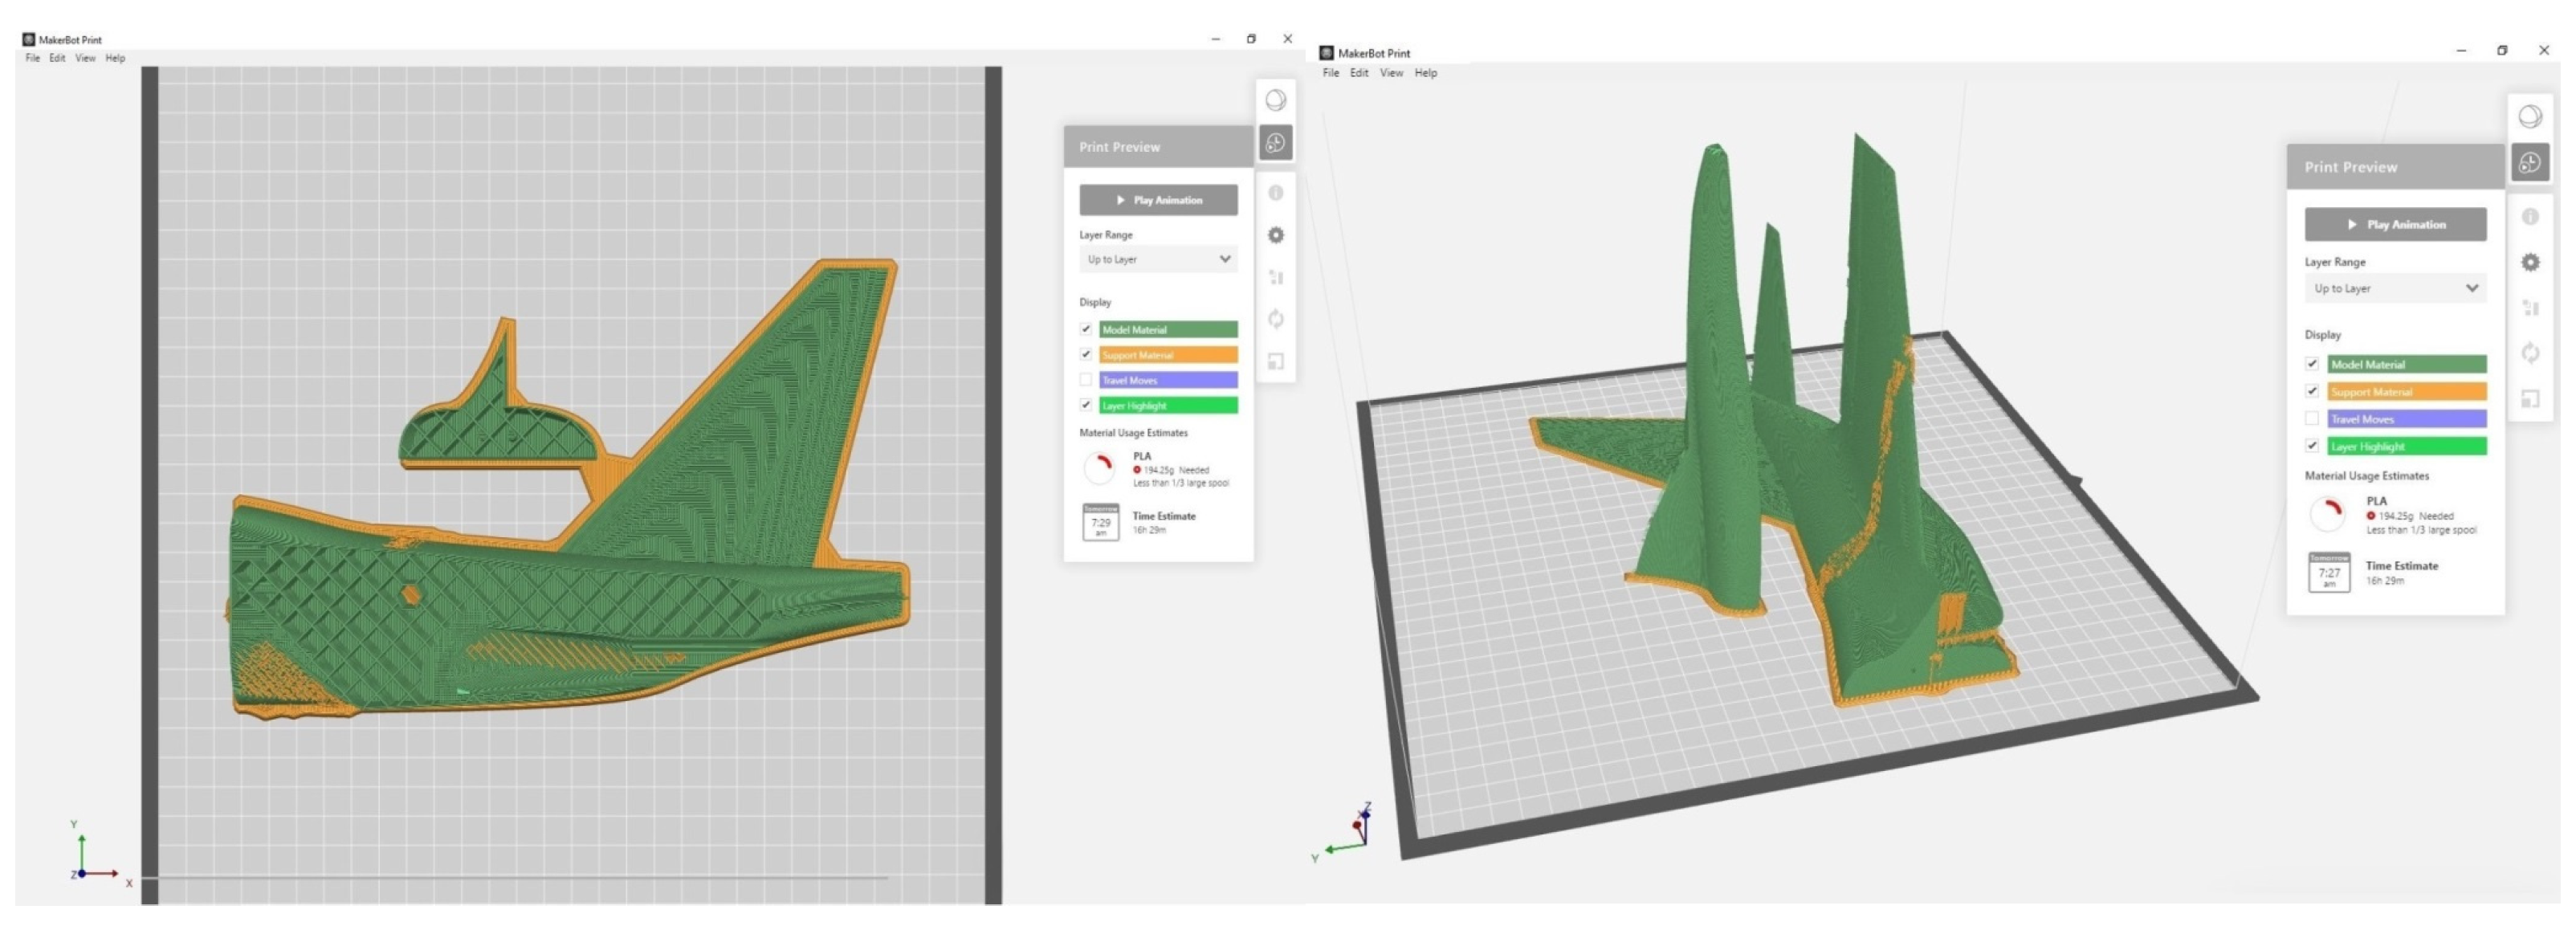
The prepared model was implemented into the MakerBot Print program, which allowed for a batch file of the 3D printer MakerBot Replicator Z18 to be generated. In order to reduce the mass, we decided to only fill the printout to 20%, which allowed for the printing process time to be reduced. The software also allowed individual layers to be previewed throughout the cycle with visible filling and places where additional fixing holes were used (
Figure 7). The model was created with fused deposition modeling (FDM) 3D printing technology, which allows for designed parts to be printed from thermoplastic material. PLA material in the form of a wire with a diameter of 1.75 mm, fed from a spool, was melted in an extruder and then applied in layers in the printer chamber, where it cooled down to form the designed model. The total process time was 16 h and 29 min, and the mass of the M-346 model after removing the material excess was 194 g.
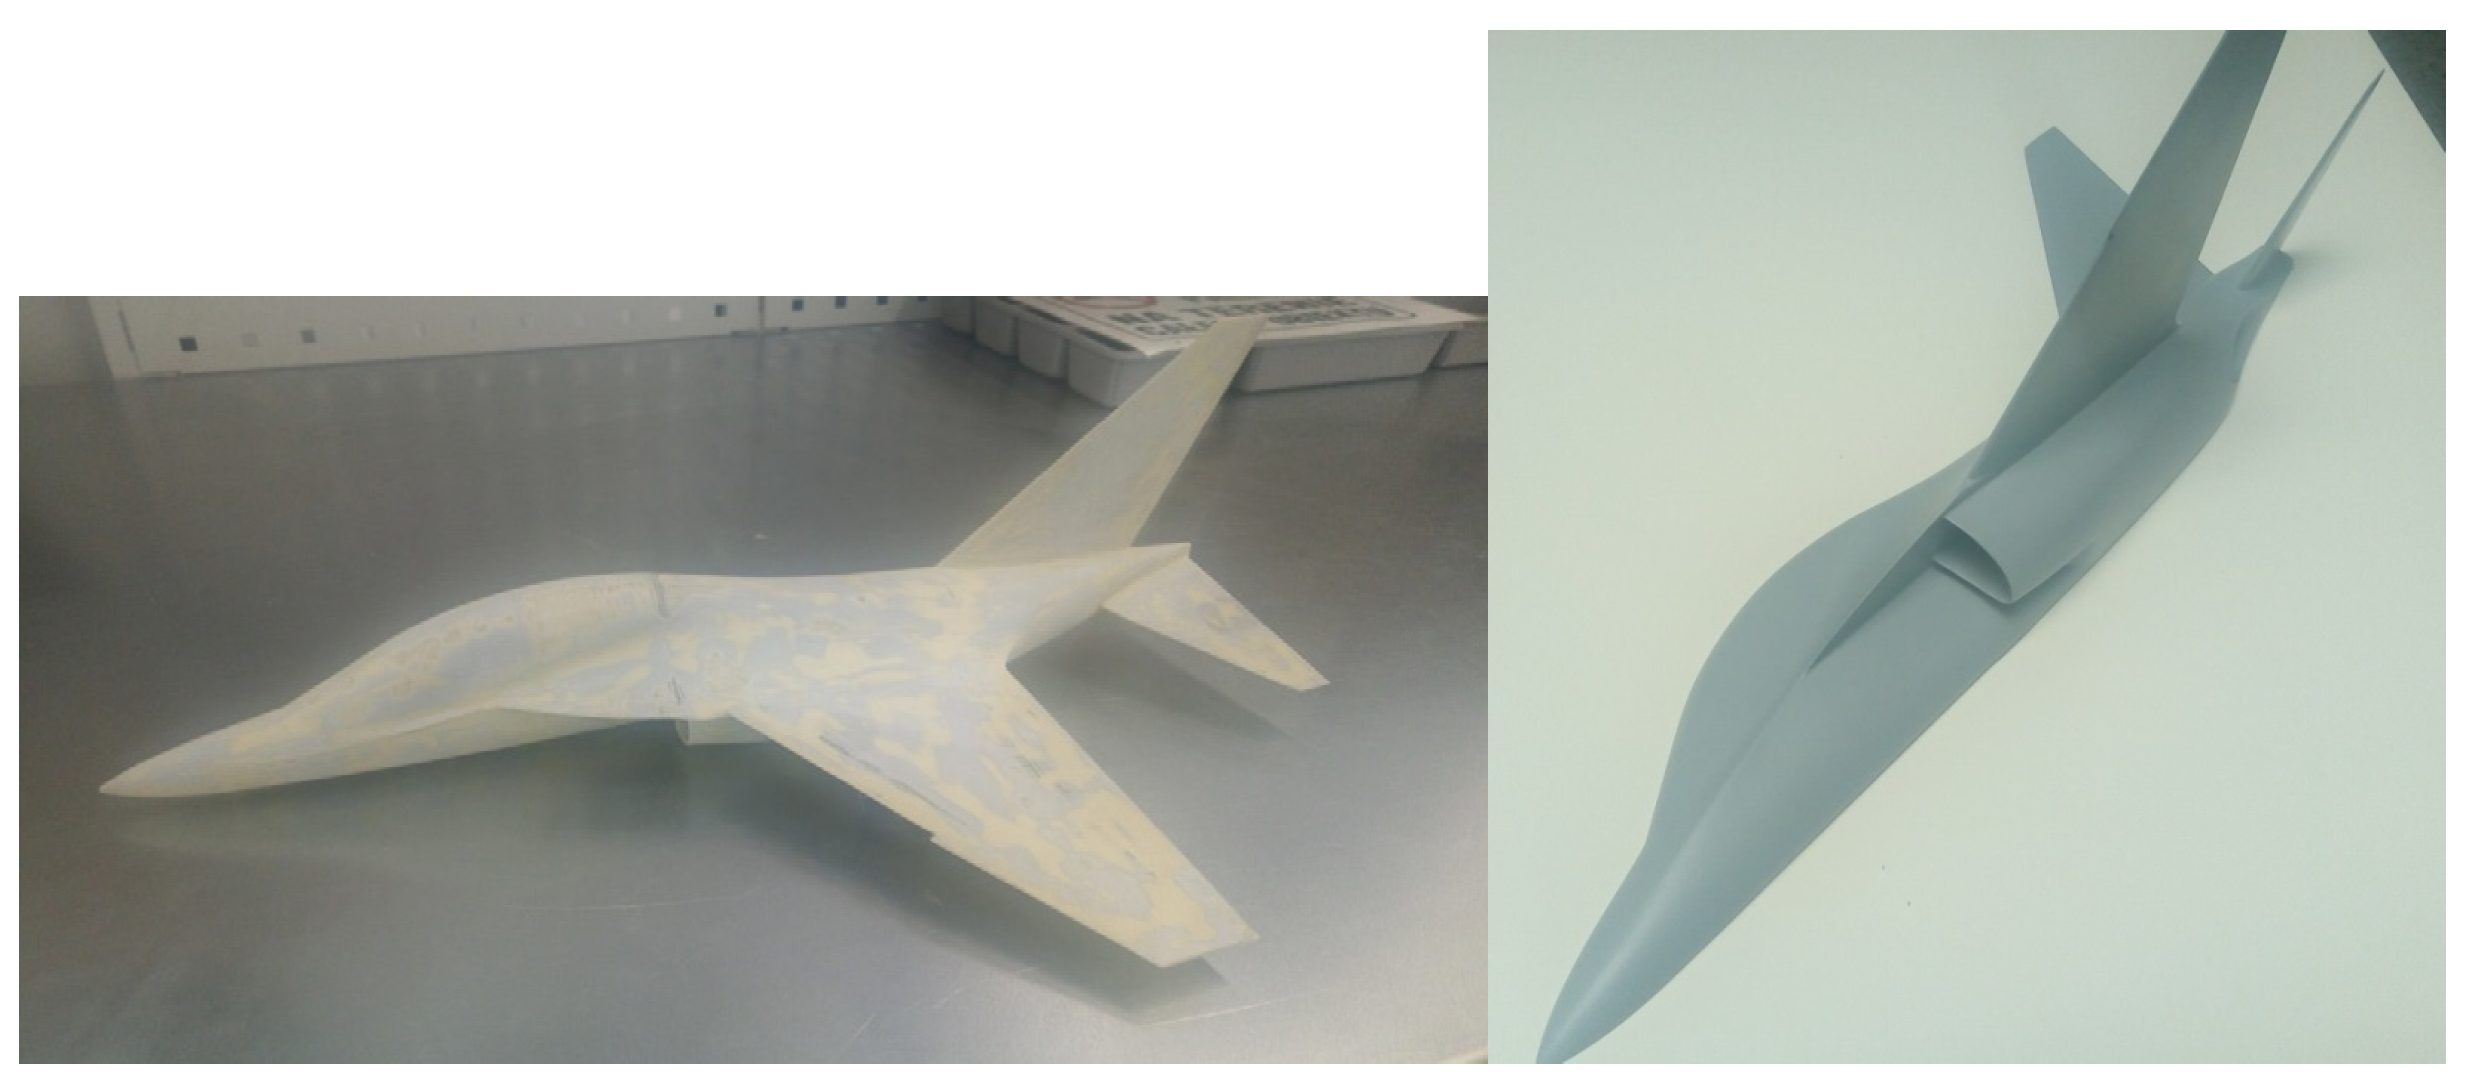
After the printing was completed, further work was performed to join the two parts together. The excess thermoplastic material of the substrate was removed with a scalpel, and asperities and burrs were polished with P180-grit sandpaper. Two rods with diameters of 2 mm and lengths of 60 mm were prepared and placed in the fixing holes. The rods as well as the joint surface of both parts were covered with a two-component epoxy adhesive. Due to the fast setting time of the glue and hardener mixture, the two joined elements had to be aligned in a short time. The object was left to dry for 24 h. After drying, a set of needle files was used to remove excess glue and asperities. In the next stage of work, we decided to use a smoothing compound and spray putty to achieve the desired structure of the test object finish. Before applying the putty, the surface was cleaned of any file debris using compressed air and was degreased. Depending on the amount of hardener used, a small amount of compound was prepared, and then a thin layer was applied to cover the entire model. The whole thing was left to dry for another 24 h. Using a set of P220, P400, P600 and P800 sanding papers, the excess compound was removed, and the surface of the model was smoothened (
Figure 8). The entire surface was again cleaned of dust using compressed air. The next three layers of spray putty, applied at intervals of 30 min, filled in the remaining irregularities.
In order to complete the visual effect, the M-346 model was painted by applying an acrylic primer for plastics as a base and then, after it dried, a gray topcoat. The whole process of painting was carried out in a paint chamber with the proper ventilation and equipment necessary to protect the eyes and respiratory tract. In order to accelerate the curing process, the spray booth was heated to 45 °C. The final effect had to be repeated because of the inclusion of particles, so the surface of the model was matted, cleaned and degreased, and then, a layer of topcoat was reapplied. In the end, a model with a satisfactory surface finish was obtained. The object prepared in this way was used for tests in the wind tunnel.
Tests were performed for the left half of the M-346 model in a clean configuration. The wing mechanization elements and steering elements were in a neutral position, the undercarriage was retracted and no suspensions in the form of beams or additional fuel tanks were used. To simplify the model, the whole fuselage was optimized with wings, a tailfin and a tailplane as one common unit, without the possibility to move the steering elements.
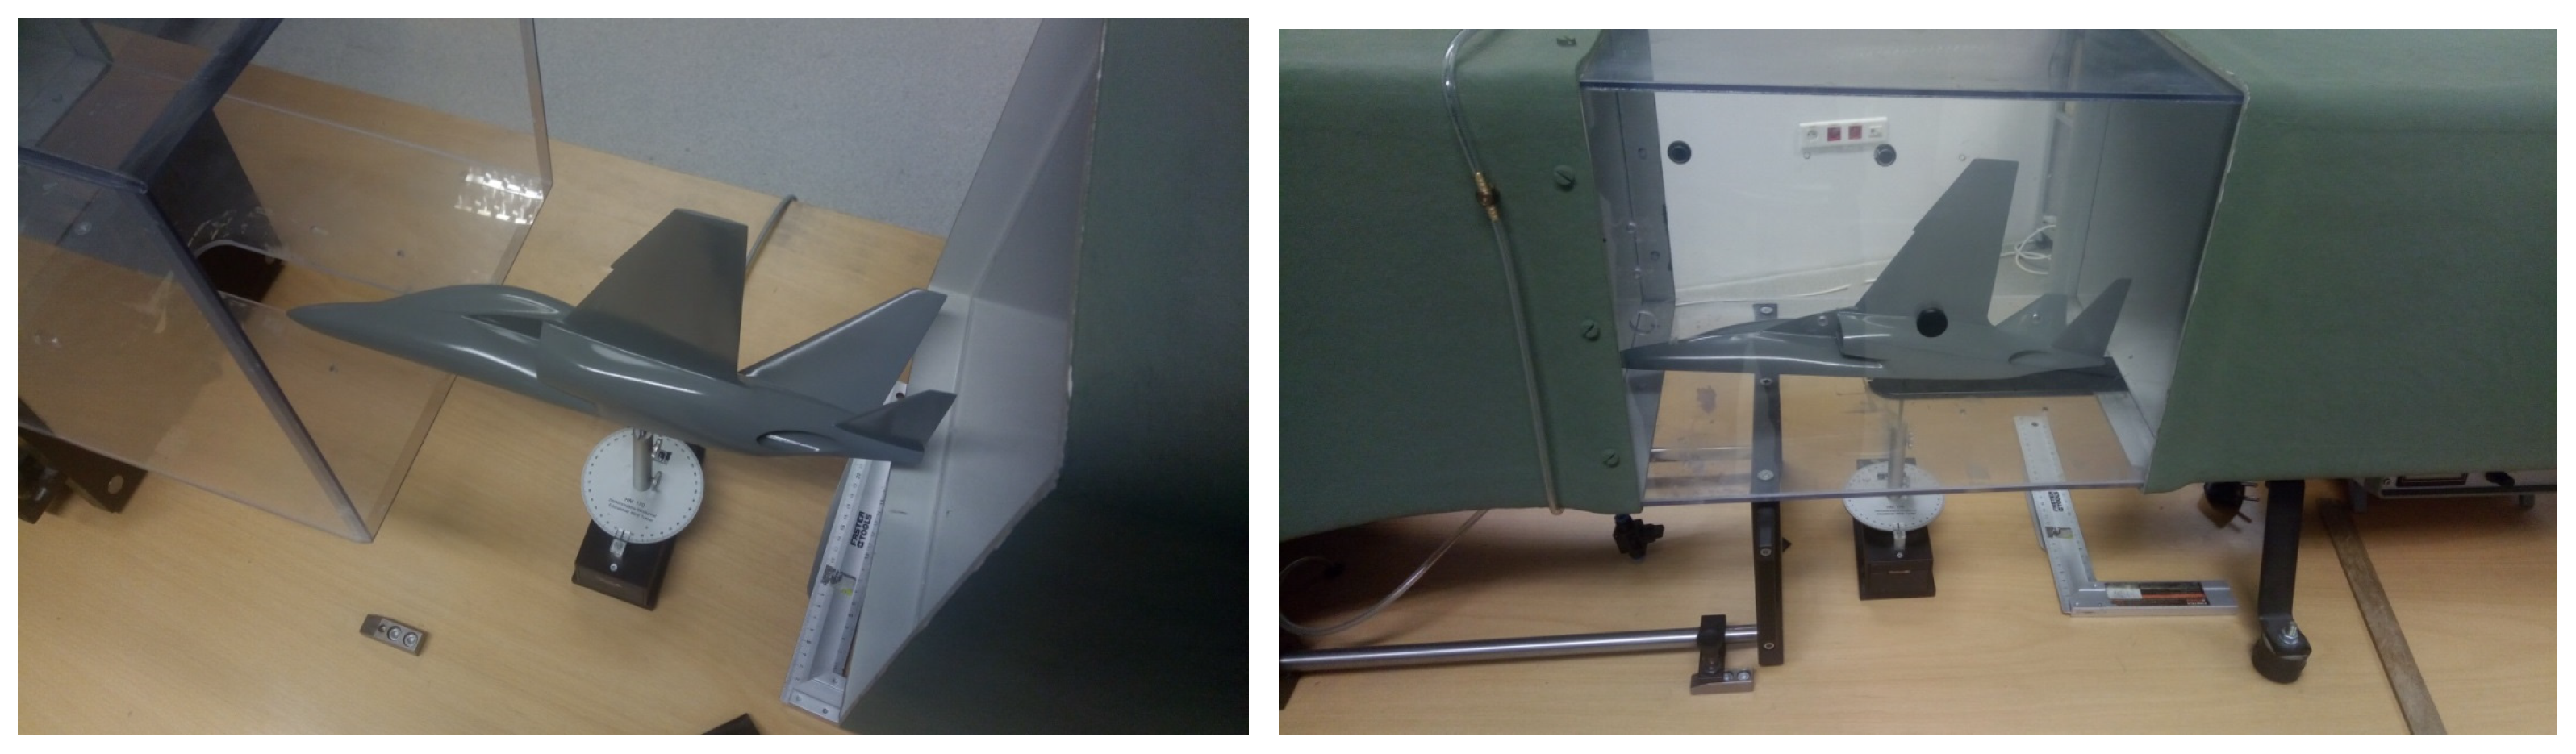
A Gunt HM 170 wind tunnel (
Figure 9) was used to conduct experimental tests on the M-346 model.
According to the manufacturer, the wind tunnel used is an open-type tunnel with a closed measurement section, a square cross-section and dimensions of 292 × 292 × 420 mm, where the maximum velocity of the air stream is 28 m s−1. During the measurement, the velocity of the medium flowing around the model was read using a manometer with an inclined tube, while the values of the lift force, Pz, and the drag force, Px, were read directly from the measuring system equipped with two digital displays. The center of the mounting was dictated by the thickness of the model in a given cross-section. The center of mass made it impossible to install the seat post from the tunnel in a stable manner. The engine inlet was obstructed; the walls were about 15 mm thick, so the mounting hole was made about 20 mm behind the center of mass and 6 mm above. In this place, it was possible to create a hole that was 30 mm deep for a secure seat post assembly. It was located above the inlet to the engine.
The first step was to mount the test object in the measurement space. For this purpose, a hole in the shape of an M6 nut placed in the dividing line into two equal halves was used. The M6 nut was screwed onto the threaded rod until a noticeable resistance was felt, and then the whole thing was inserted into the hole in the model. This assembly was placed in the measurement space and aligned horizontally, and the rod was locked with two knobs. After verifying the grip of the fixation, the housing was closed tightly.
Turning on the power source, it was necessary to verify the connection of all the wires of the measuring system for the lift force, Pz, and the drag force, Px, and to reset it to zero by setting the actual angle of attack, α, on the angle scale at 0°. Before starting the experiment, it was also necessary to read the data from the thermometer in the laboratory (
Table 2).
The next step was to select specific air flow velocities in the measurement system in the range between 0 and 28 m s
−1 and to set particular values of the angle of attack—both positive and negative. In order to carry out the experiment on the tested object, measurements were taken for four values of the air flow: 15, 20, 25 and 27 m s
−1. The positive angle of attack values were changed every 2° using a circular disc with an angular scale ranging from 0 to 16°, while the negative angle of attack values were changed from 0 to −12°. After reading the data of the lift force, Pz, and the drag force, Px, from the measuring system for a given setting, the whole process was repeated until complete results were obtained, which are presented in
Table 3.
3. Results
The lift force, Pz, and the drag force, Px, were measured in the wind tunnel for positive and negative angles of attack, α. On their basis, after transforming the formulas, the values of the lift coefficients, Cz, were calculated. Then, graphs were drawn for all tested air flow velocities: graphs of the relationship between the lift force, Pz, and the drag force, Px, for positive and negative angles of attack, α; a summary diagram of the lifting force, Pz, for positive and negative angles of attack, α; a cumulative diagram of the drag force, Px, for positive and negative angles of attack, α; graphs of the relationship between the lift force coefficient, Cz, and the drag force coefficient, Cx, for positive and negative angles of attack, α; a collective diagram of the lift force coefficient, Cz, for positive and negative angles of attack, α; a collective diagram of the drag force coefficient, Cx, for positive and negative angles of attack, α; graphs of the polar characteristics, Cz = f (Cx), of the M-346 model; graphs of the characteristics of aerodynamic perfection, K = Cz/Cx (α), as a function of the angle of attack, α, of the M-346 model; and a cumulative graph of the characteristics of aerodynamic perfection, K = Cz/Cx (α), as a function of the angle of attack, α, of the M-346.
In accordance with the conducted aerodynamic tests, the characteristics developed on the basis of the available literature and guidelines for this type of measurements were described in accordance with the guidelines.
Based on the diagrams produced and the results obtained, the following analyses were performed for the tested air flow velocities: V = 15, 20, 25 and 27 m s−1. In order to perform a summary analysis of the values obtained during the experimental test in the wind tunnel or calculated in the further course of the procedure, cumulative graphs of the characteristics for all considered air flow velocities were prepared: the lifting force, Pz, as a function of the angle of attack, α; drag force, Px, as function of the angle of attack, α; the lift force factor, Cz, as a function of the rake angle, α; coefficient of drag force, Cx, as a function of the rake angle, α; polar characteristic, Cz = f (Cx); and aerodynamic excellence characteristics, K.
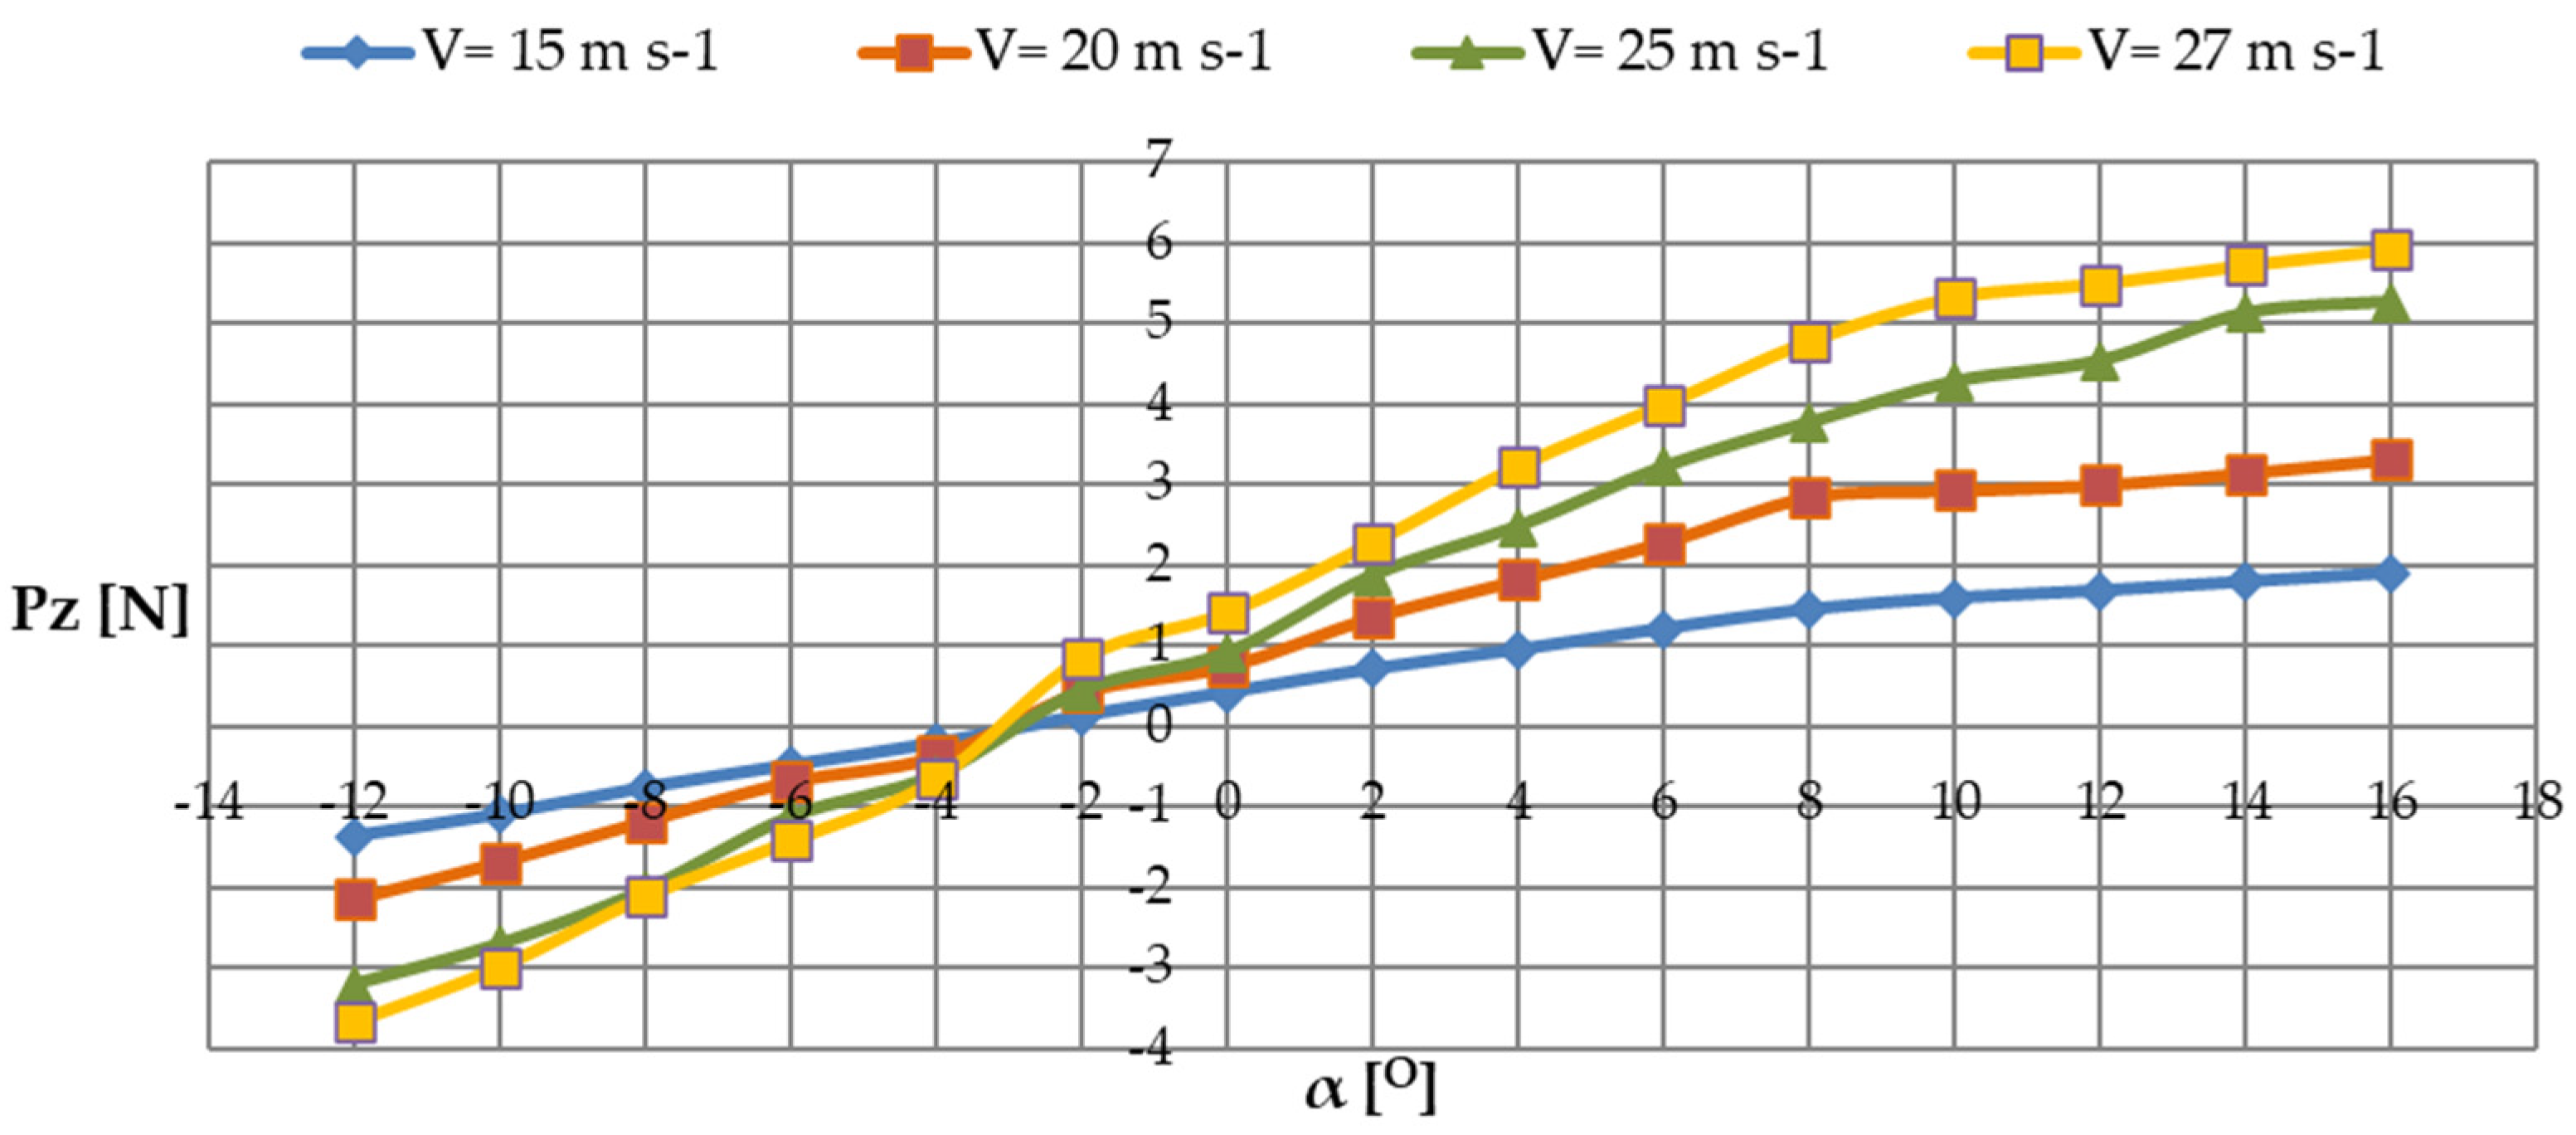
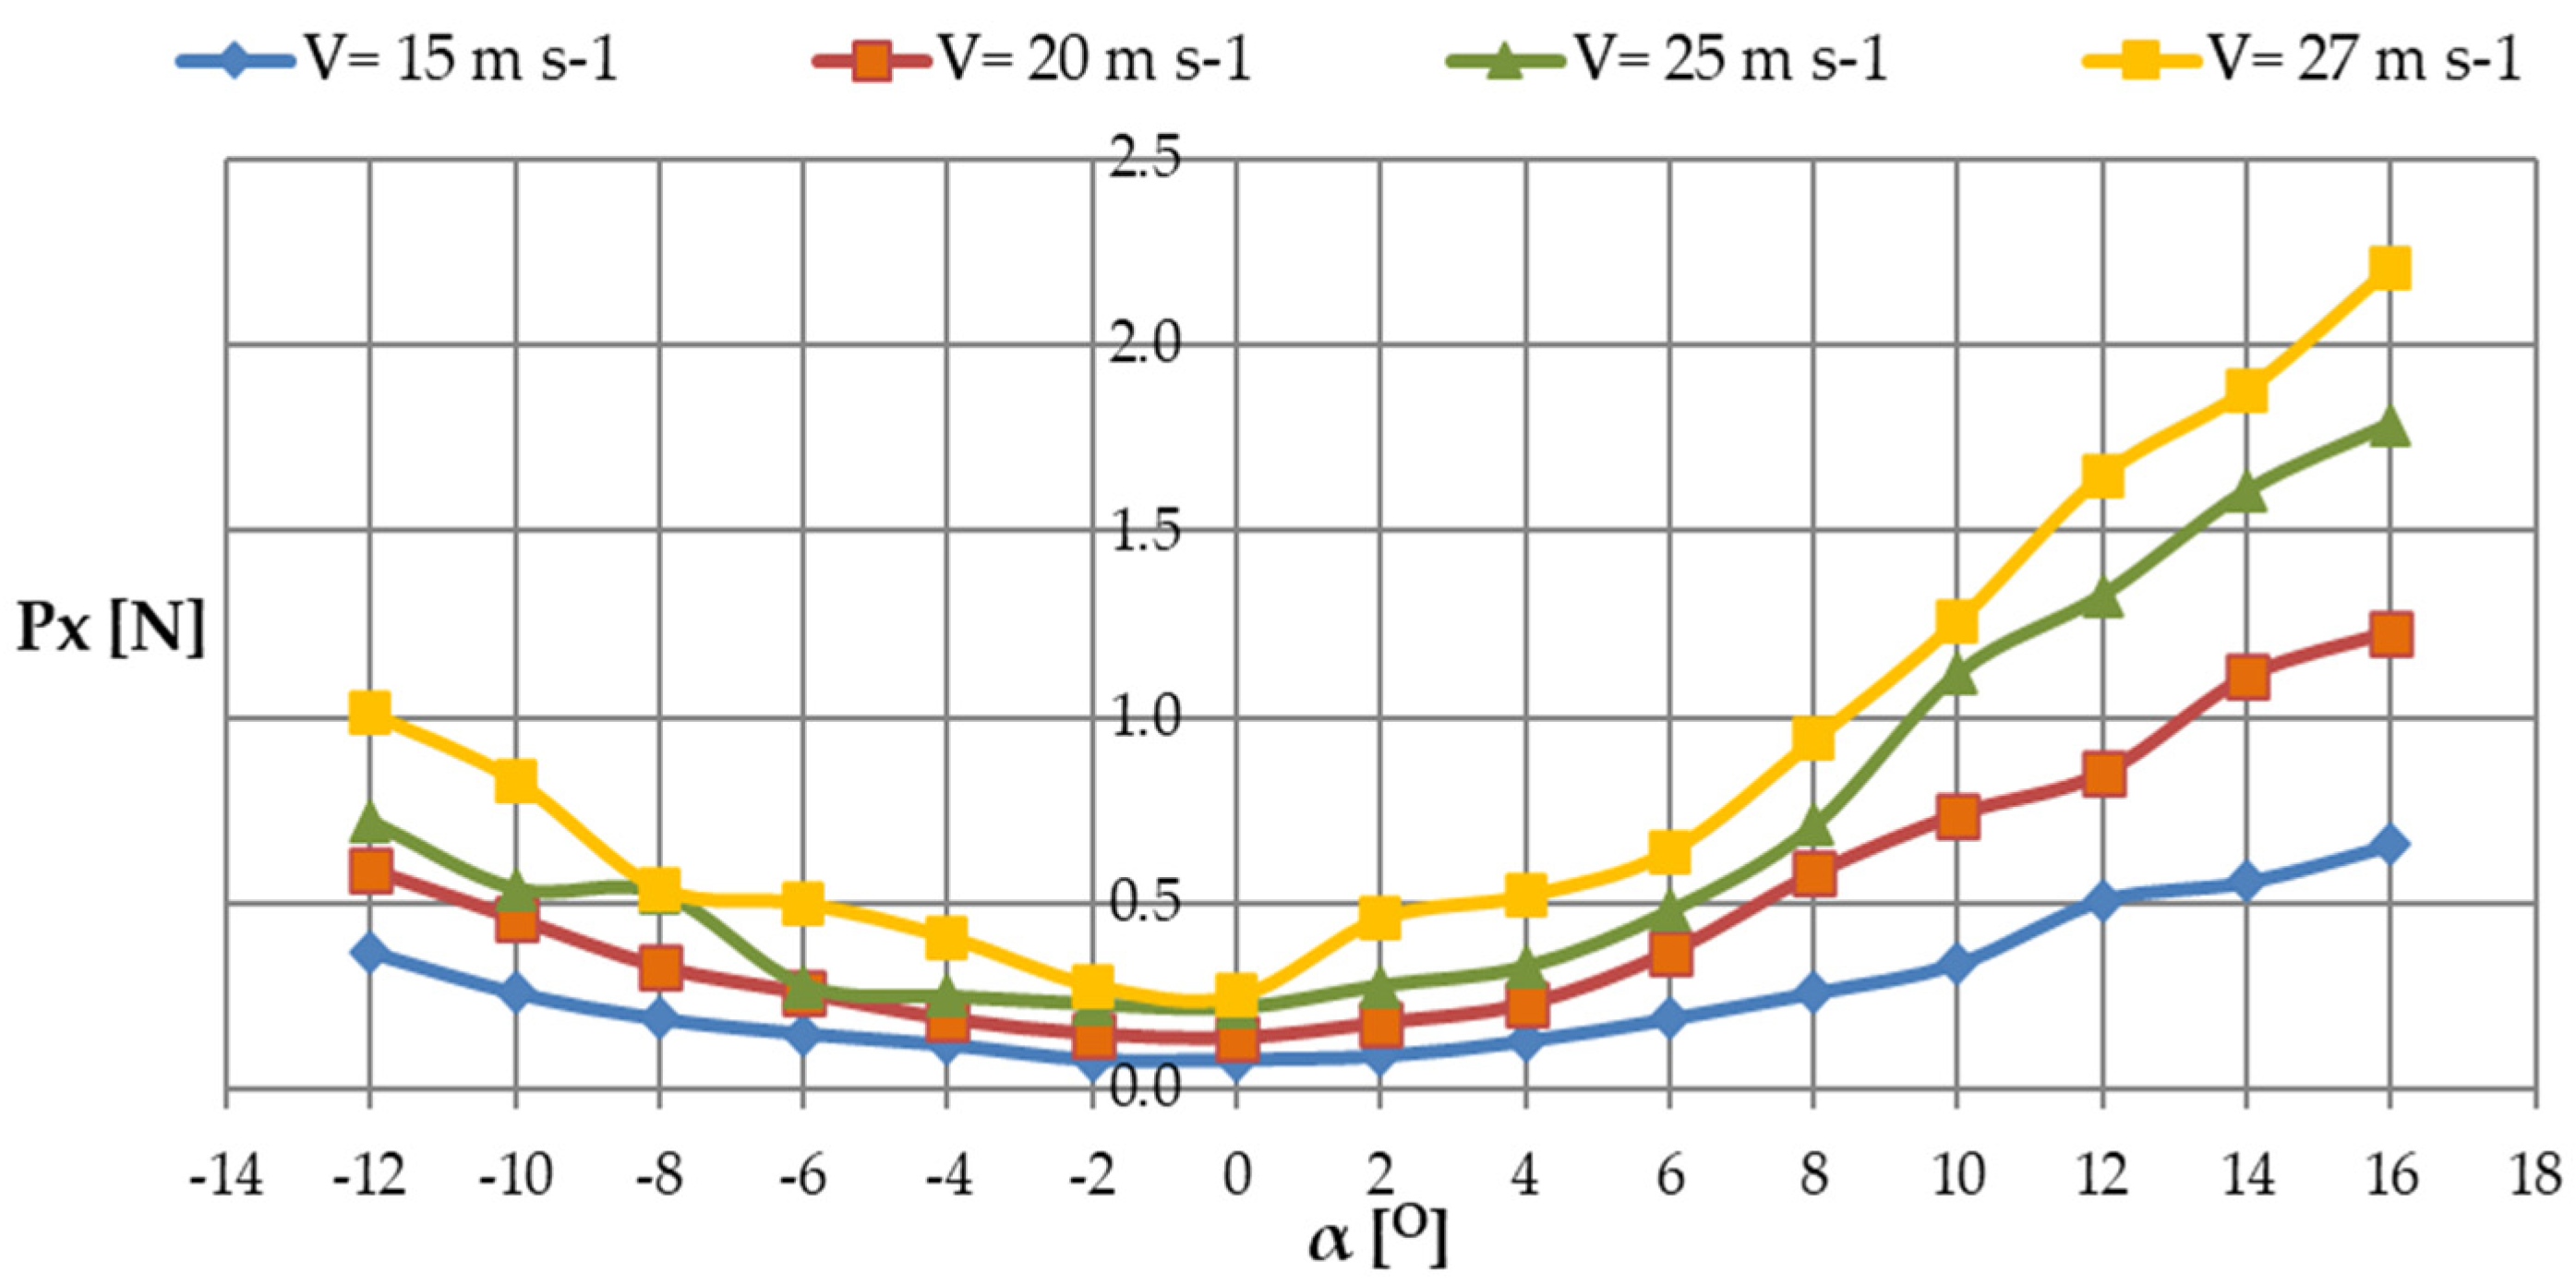
3.1. The Lift Force, Pz, and the Drag Force, Px
The obtained results of lift force, Pz, and drag force, Px, for different values of airflow, V, and the ratio between these forces are illustrated in the group diagram (
Figure 10 and
Figure 11).
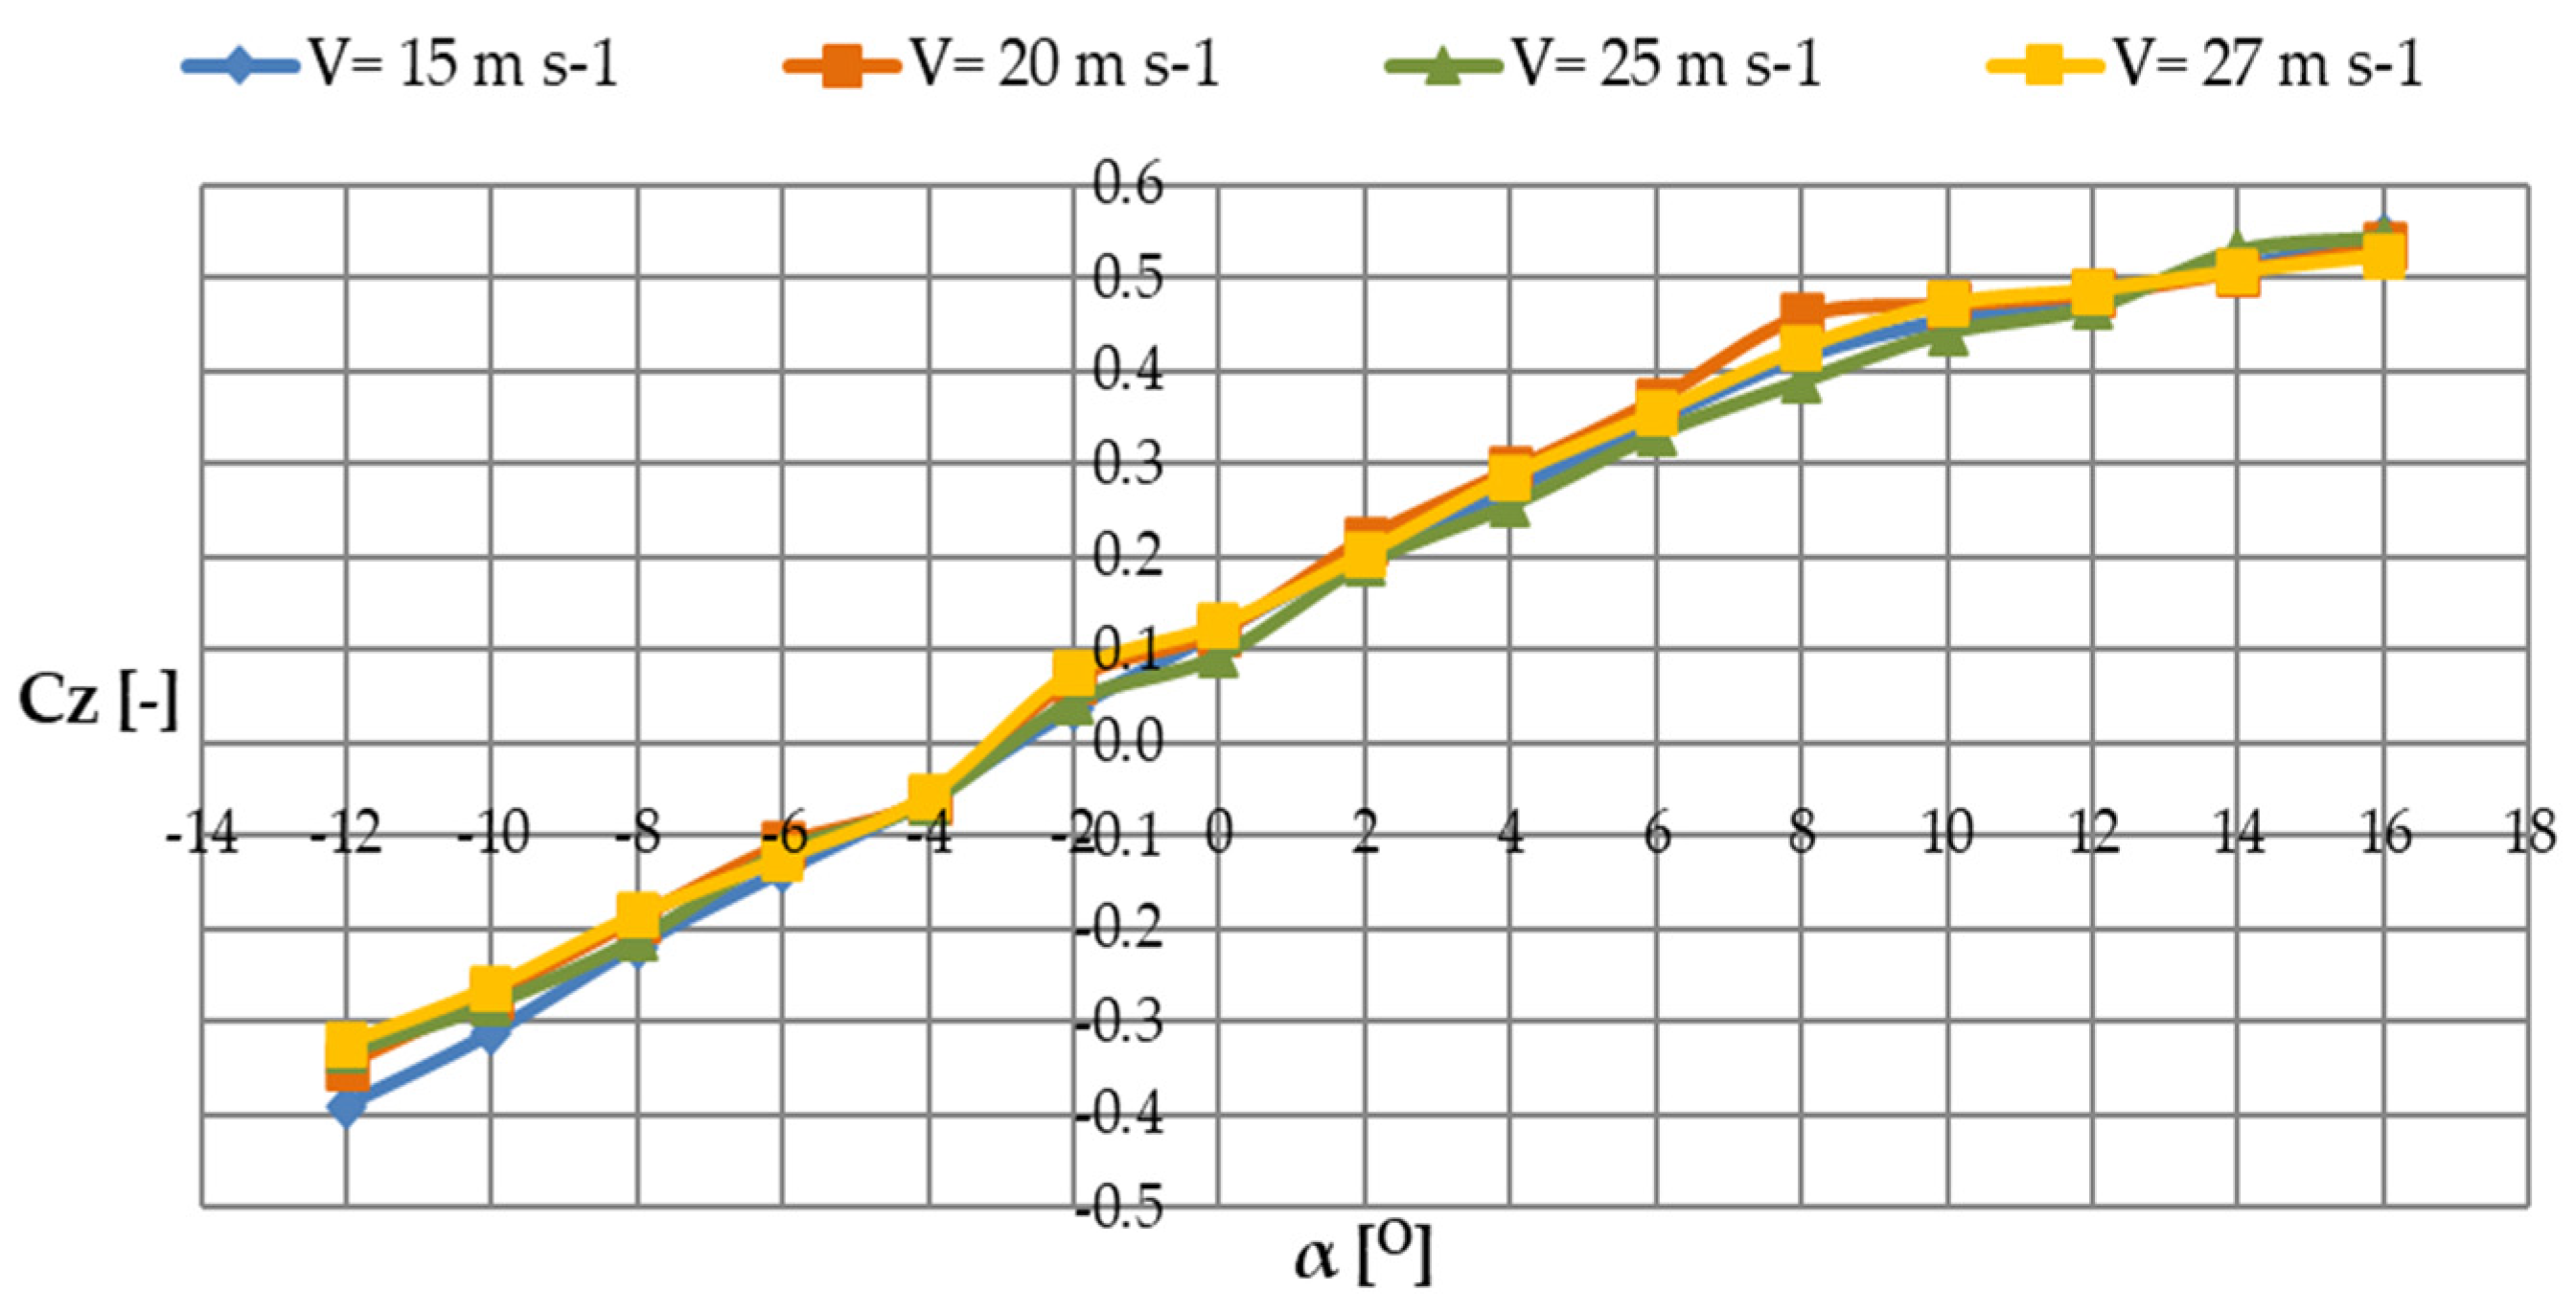
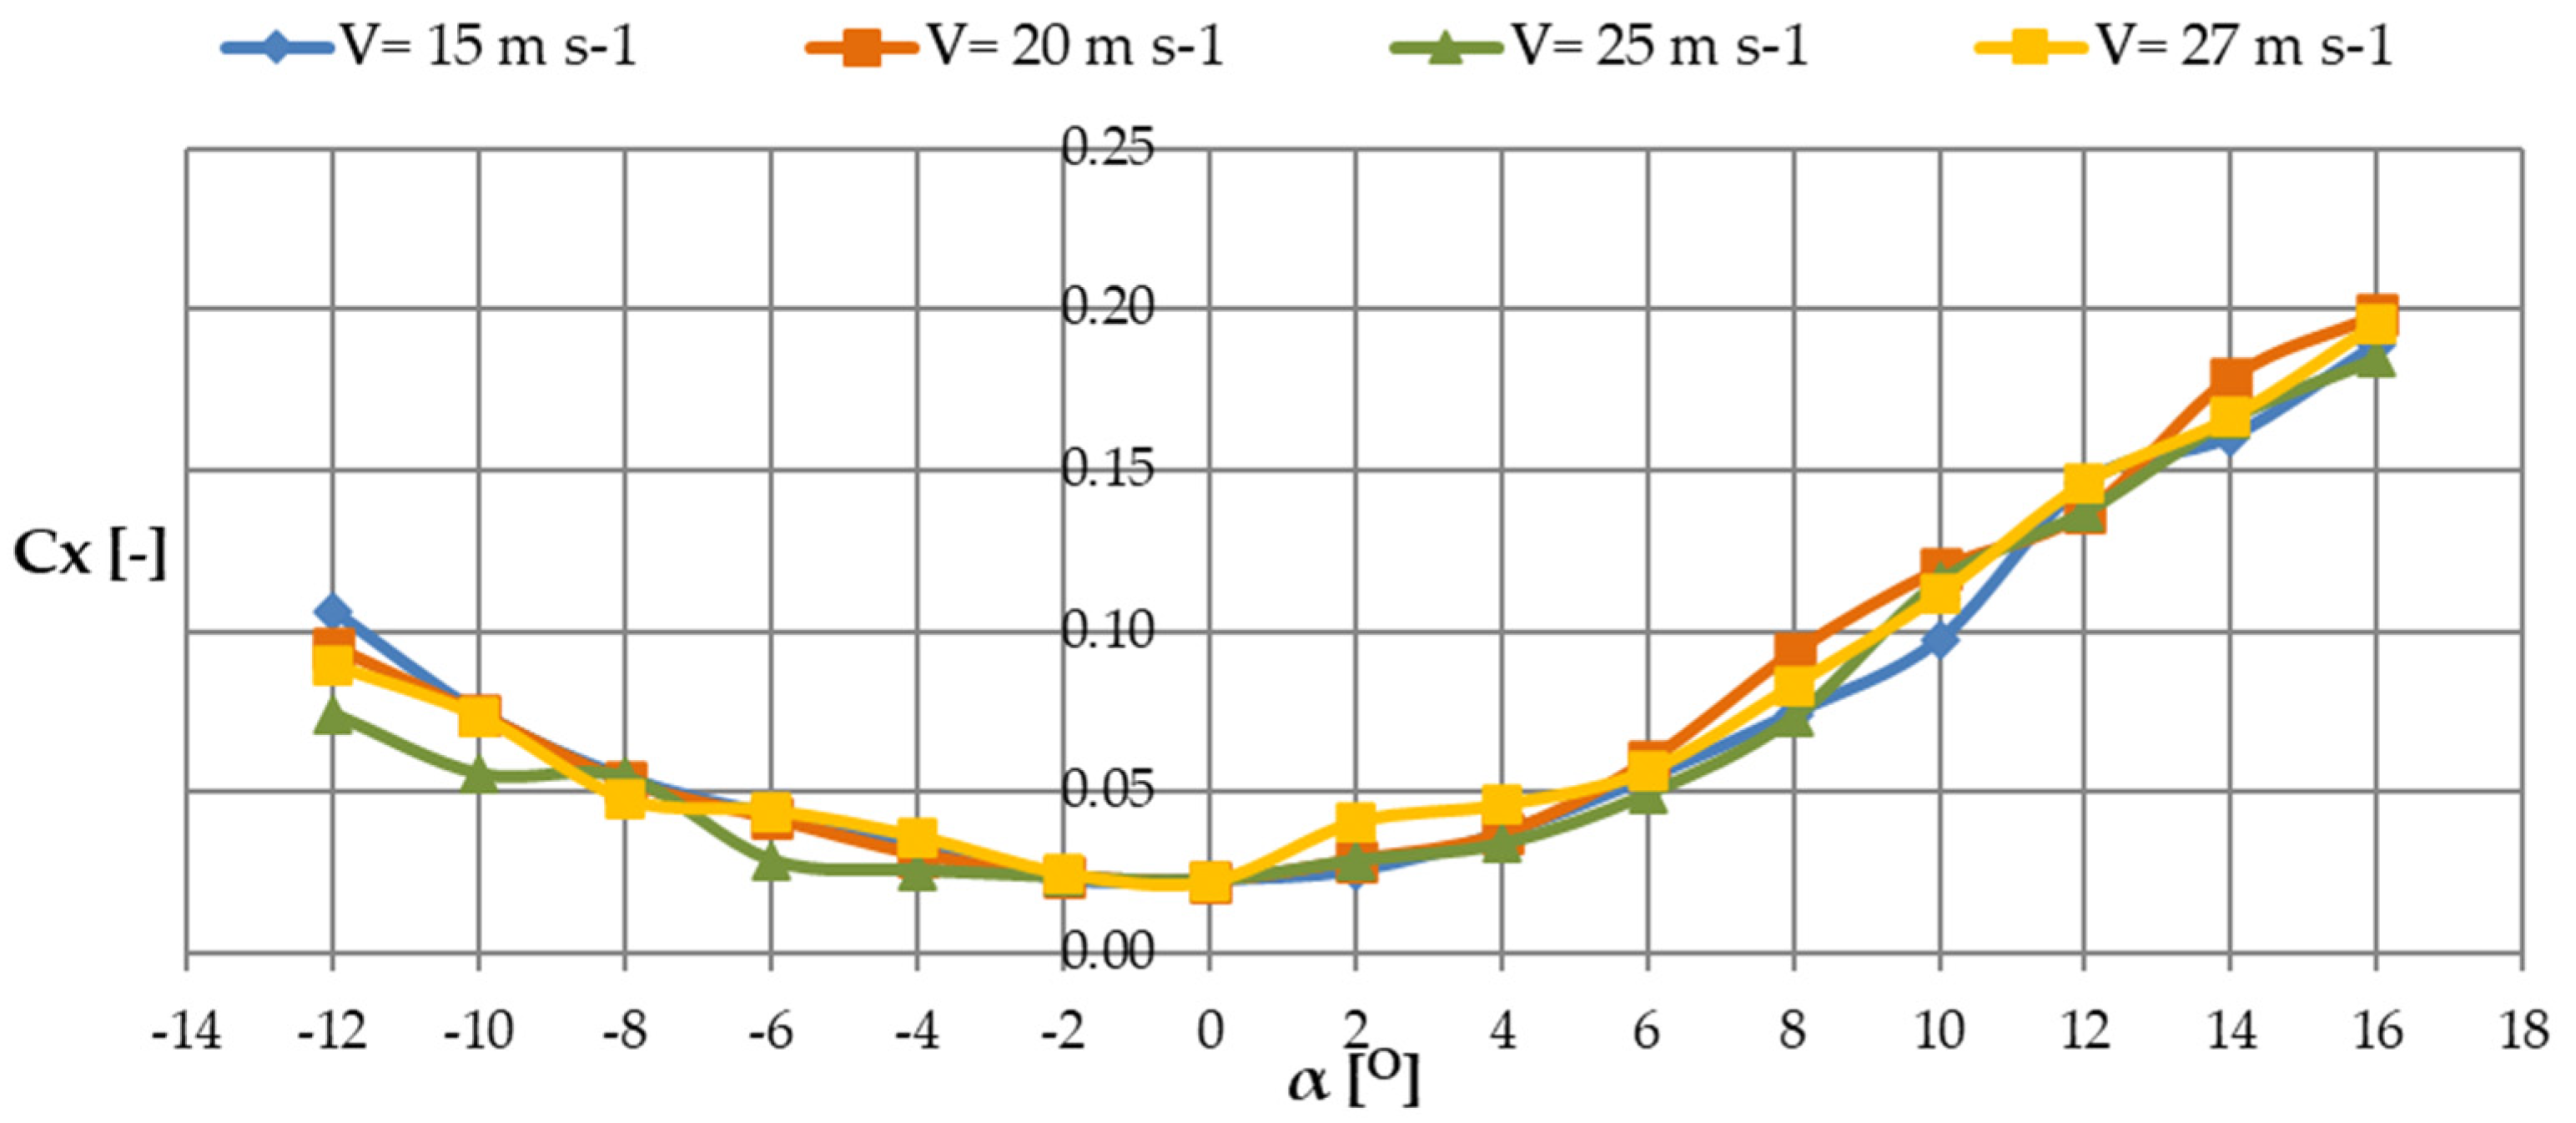
3.2. The Lift Coefficient, Cz, and the Drag Coefficient, Cx
The values of lift force coefficient, Cz, and aerodynamic drag force coefficient, Cx, were calculated using the equations for lift force, Pz, and drag force, Px. Using the above formulas and substituting relevant numerical data, the values of lift force coefficient, Cz, and aerodynamic drag force coefficient, Cx, were calculated for selected air flow velocities, V, and positive and negative angles of attack, α. The results obtained are summarized in
Table 4.
The obtained results of the lift force coefficient, Cz, and aerodynamic drag force coefficient, Cx, for individual values of the air flow, V, and the ratio between these coefficients as a function of the angle of attack, α, are presented in the summary plots (
Figure 12 and
Figure 13).
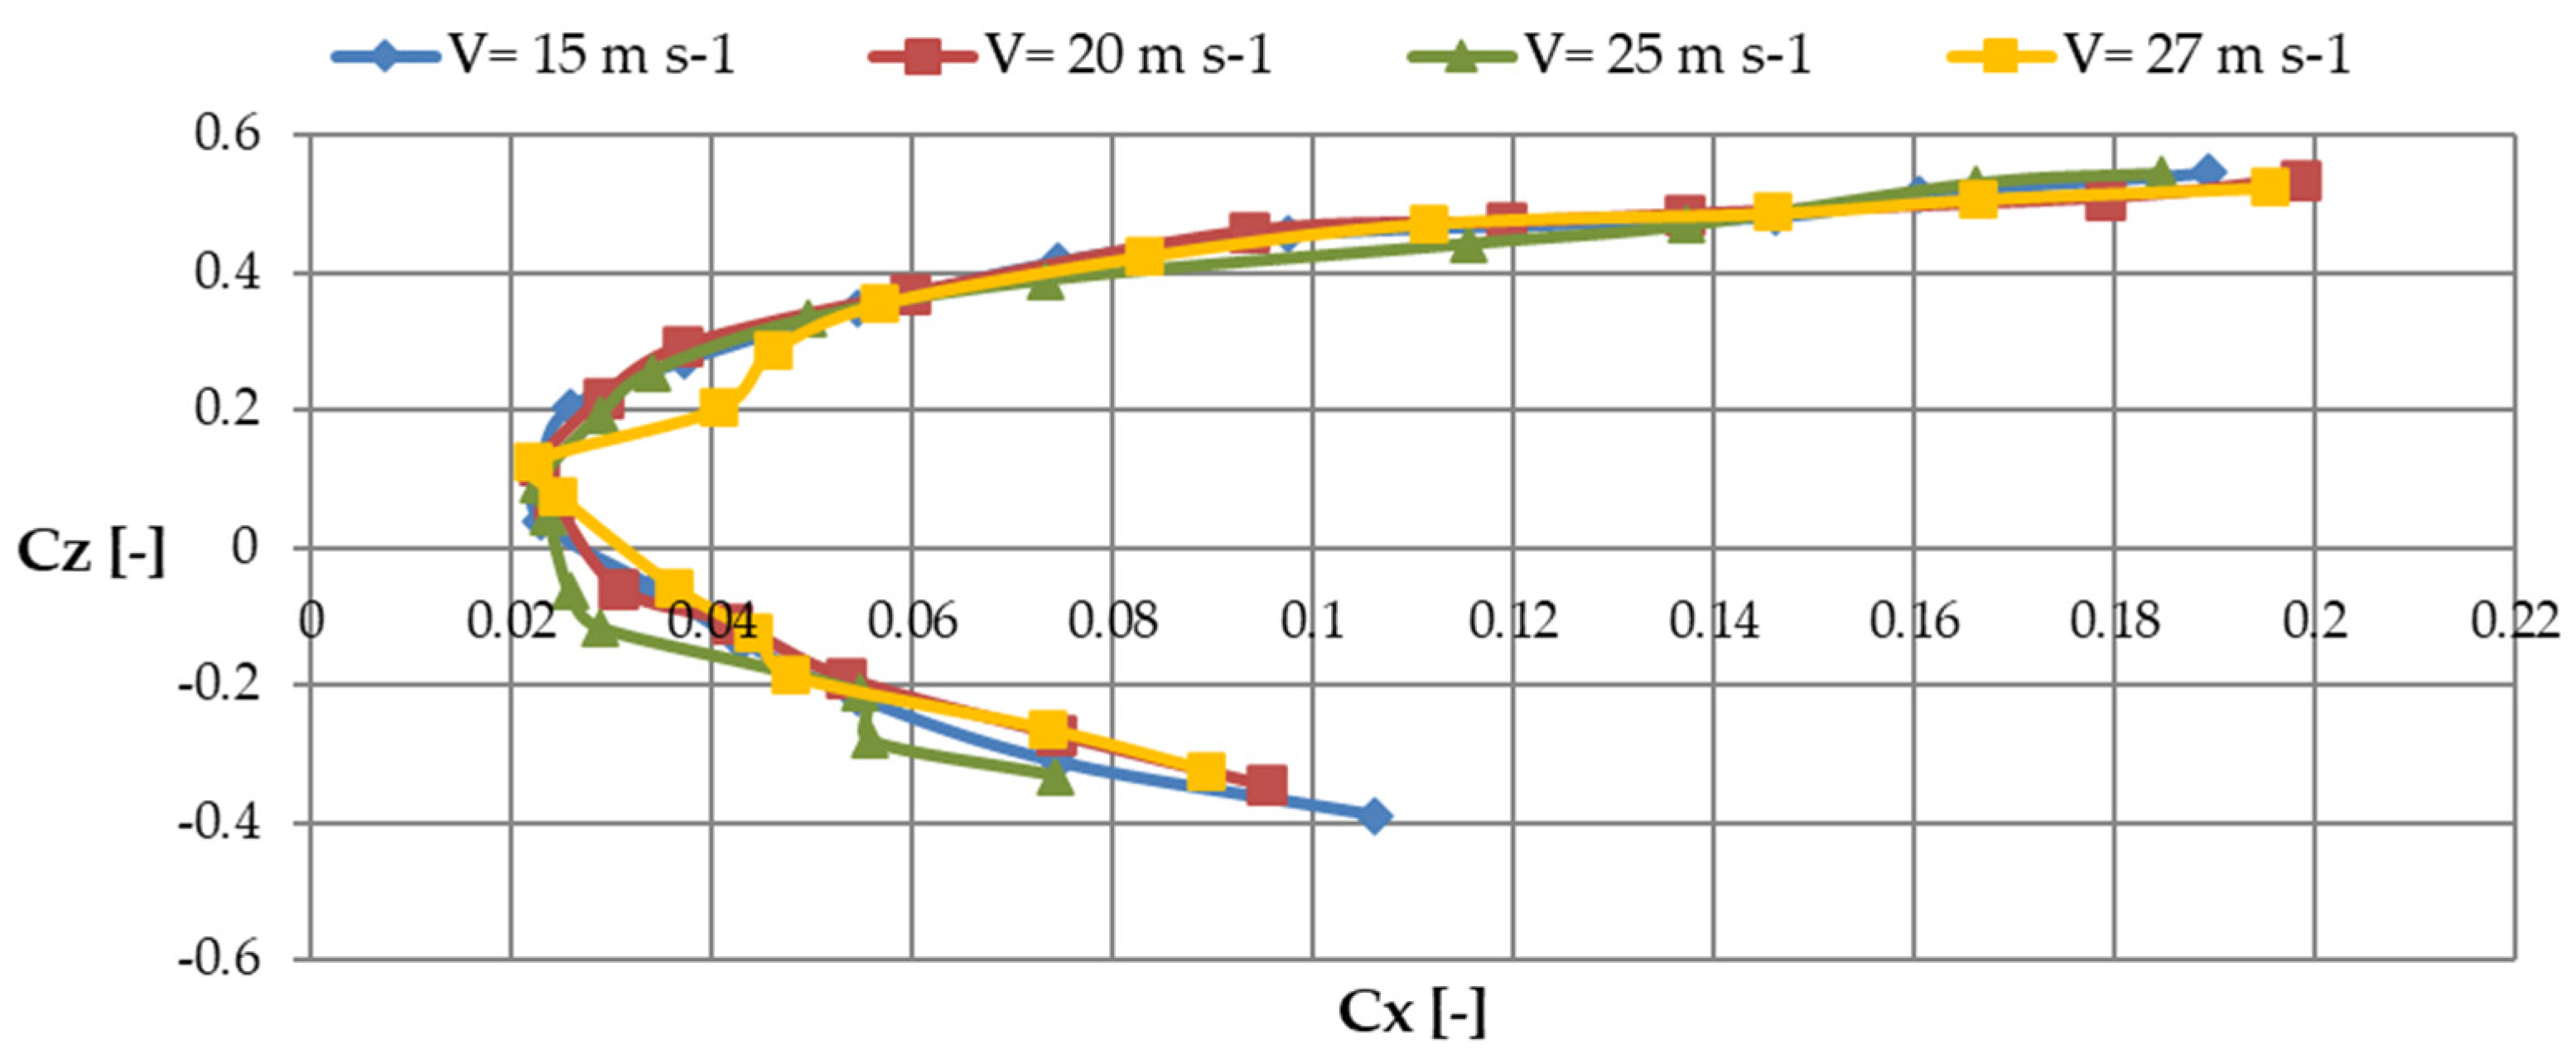
3.3. Polar Characteristics, Cz = f(Cx)
Based on the numerical results of the lift force coefficient, Cz, and the drag force coefficient, Cx, for positive and negative angles of attack, α, for the considered air flow velocities, summarized in
Table 5, a summary plot of the polar characteristics, Cz = f(Cx), of the tested model of the M-346 plane was prepared (
Figure 14).
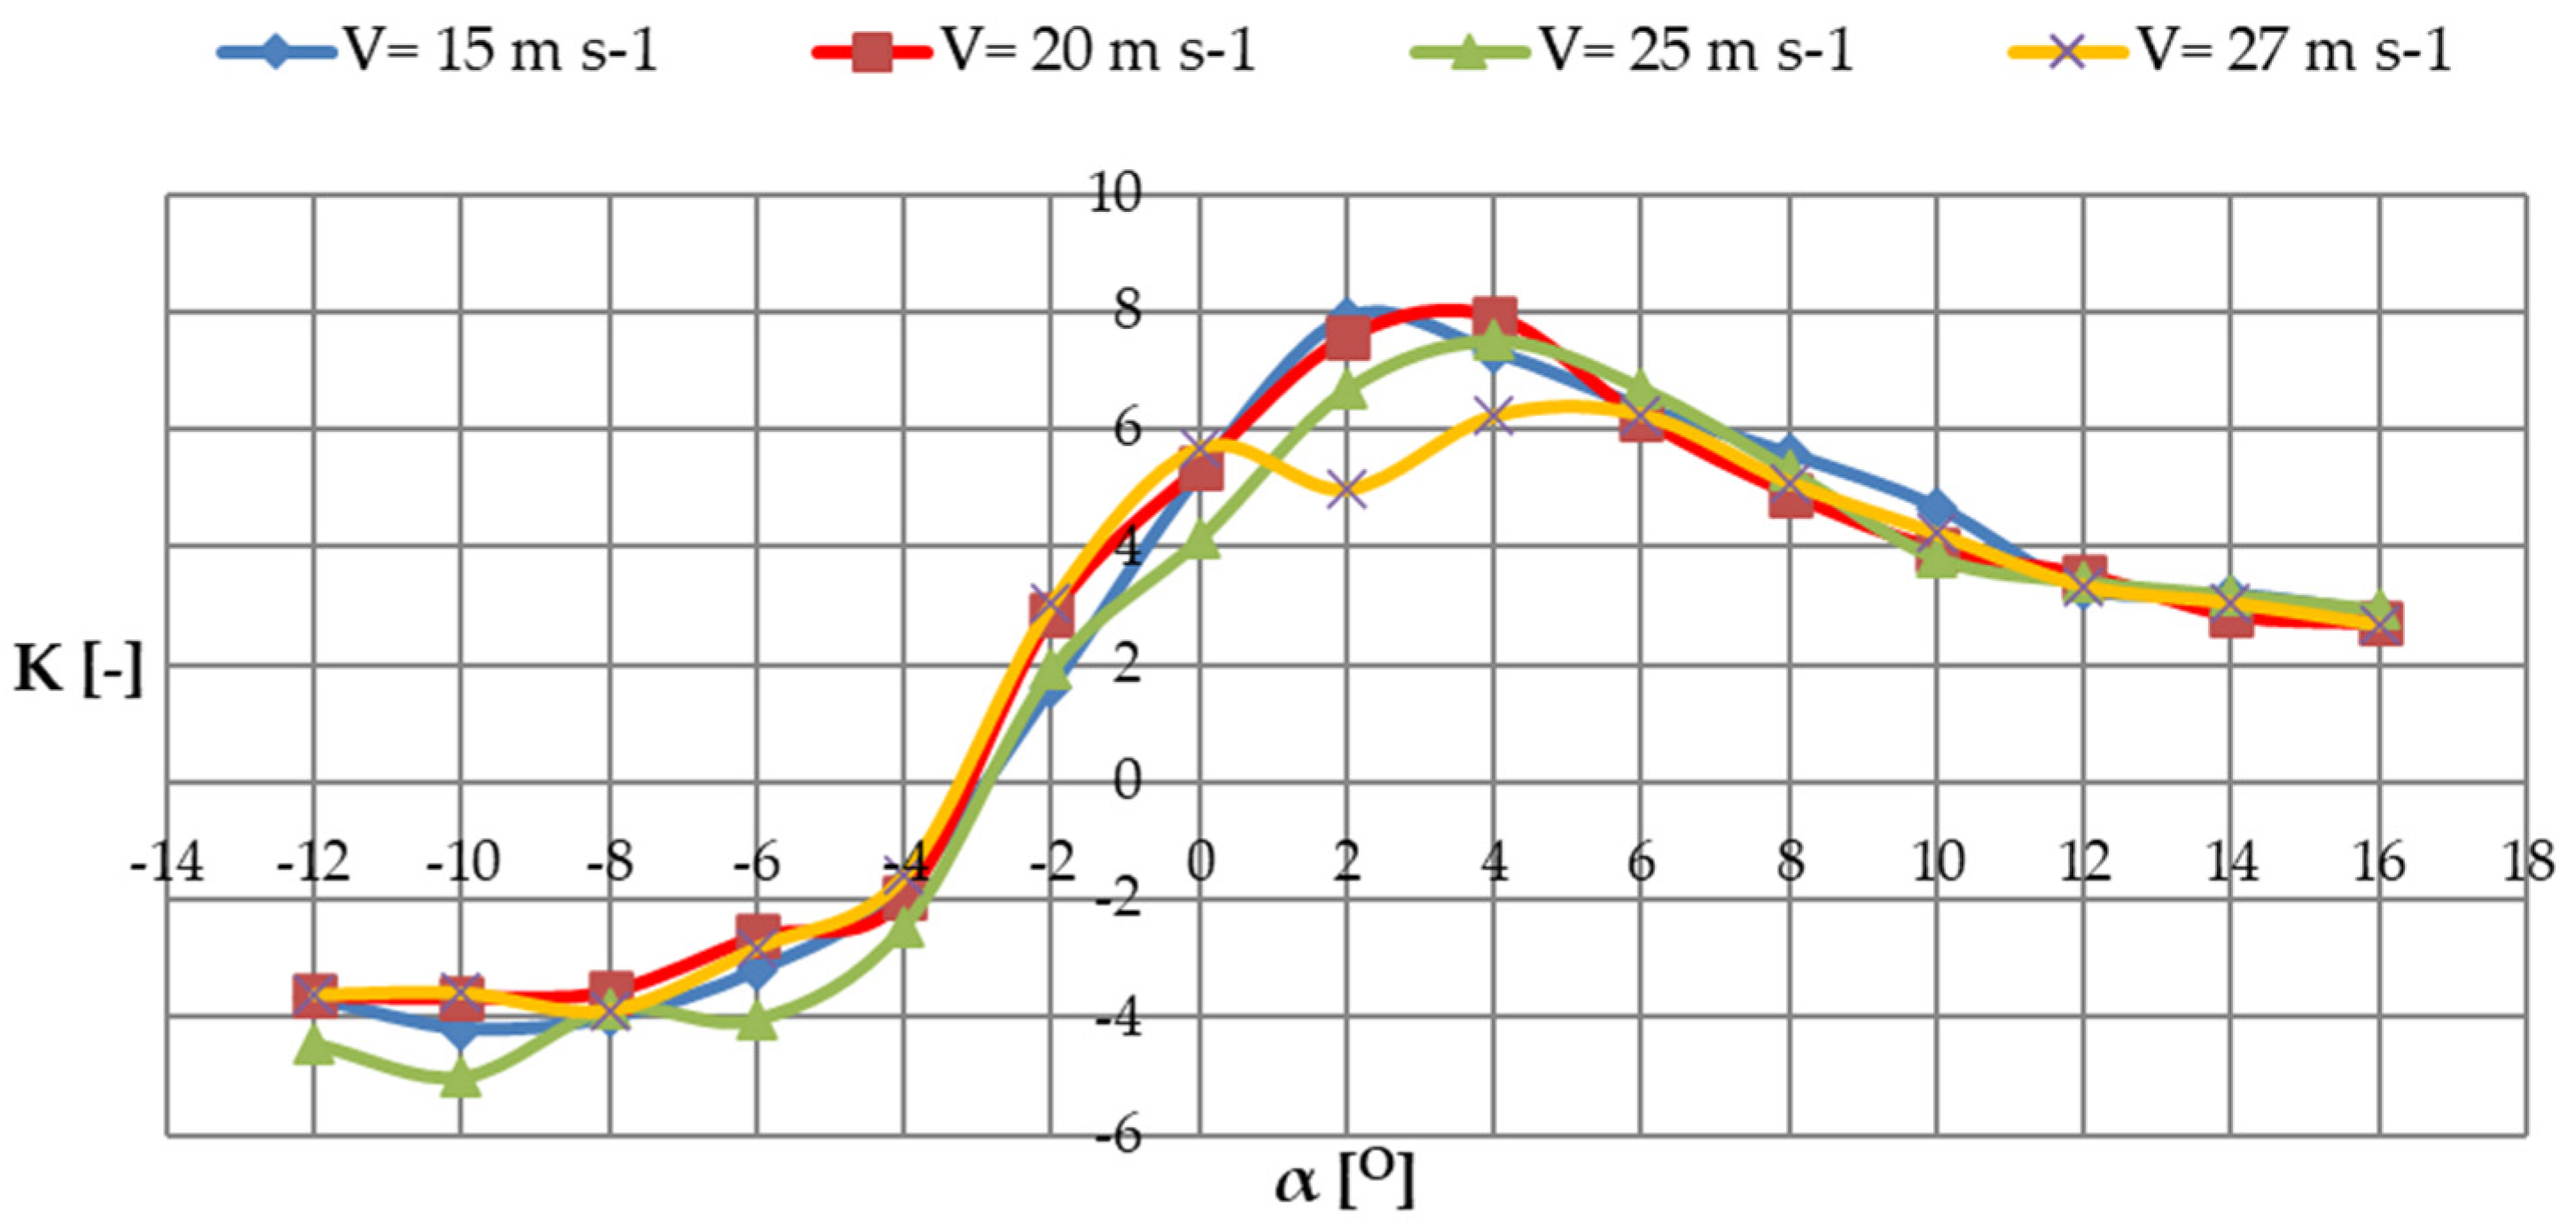
3.4. K—Aerodynamic Efficiency Characteristics
On the basis of the obtained numerical values of the lift force coefficients, Cz, and the drag force coefficients, Cx, for positive and negative angles of attack, α, for the considered air flow velocities, summarized in
Table 4, a table of the calculated values of aerodynamic efficiency, K, was prepared (
Table 5).
In addition, the results summarized in
Table 5 are presented in graphical form to clearly illustrate the changing values of aerodynamic efficiency, K, against the given air flow velocities (
Figure 15).
4. Discussion
Based on the characteristics of the summary plot of lift forces, Pz, for positive and negative angles of attack, α, for all tested airflow velocities, it can be concluded that the waveform of the individual lines is correct and consistent with that reported in the literature [
33]. For the air flow velocities under consideration, an increase in the lift force can be observed as the positive or negative angle of attack increases. For air flow velocity V = 27 m s
−1, there is an irregularity in the pattern of the characteristics in the range of the angle of attack α = −4° ÷ 0°. The cumulative plot analysis of the drag force characteristics, Px, for positive and negative angles of attack, α, for all tested airflow velocities has a parabola shape, which is consistent with the literature [
34]. The smallest values of the curves are reached at α = 0°, while the largest deviations in the waveforms can be observed at the extreme values of the α angle. Irregularities in the shape of the individual curves can be observed at air flow velocities V = 20 and 25 m s
−1; however, the greatest disturbance of the drag force characteristic, Px, can be seen at V = 27 m s
−1.
In the summary plot of the lift coefficient, Cz, for positive and negative angles of attack, α, for all tested airflow velocities, slight differences in the individual curves can be observed. All the characteristics obtained maintain a similar range, and it is easy to observe an increase in the value of Cz along with the increase in the positive or negative angle of attack, α. The summary graph of the drag force coefficient, Cx, for positive and negative angles of attack, α, for all tested airflow velocities has a parabola shape, which is consistent with the literature [
33]. Literature values for the Cz coefficient are in the range of 0.021 to 2.21, while the values of the Cx coefficient are in the range of 0.0018 to 0.5. The smallest value for all curves was obtained at an angle of attack of α = 0°. As the positive or negative angle of attack increased, irregularity in the individual characteristics was observed in all cases studied, but the greatest differences were achieved for speeds of V = 25 and 27 m s
−1. The characteristics of the obtained curves on the summary plot of the polar characteristics, Cz = f(Cx), of the tested model M-346 for all tested air flow velocities show the shape of a parabola. The highest irregularity, as in the previously discussed cases, was obtained for air flow velocities of V = 25 and 27 m s
−1. The smallest value of the polar characteristic was obtained at a lift force coefficient value of Cz ≈ 0.1. In the summary graph of the aerodynamic efficiency characteristic, K = Cz/Cx(α), as a function of the angle of attack of the M-346 model, irregularity of the resulting curves for airflow velocities of V = 25 and 27 m s
−1 was also observed. Particularly large deviations occurred at negative angles of attack of α = −12° ÷ −4° as well as a marked decrease in values at positive angles of α = 2° ÷ 4°. It is also worth noting that aerodynamics research is closely linked to other scientific disciplines. The materials and structures used are of particular importance. It can therefore be concluded that improvements in aerodynamic performance are possible with the application of technological innovations. Sivaji et al. [
35] paid particular attention to the possible deformations arising during measurements made, especially for aircraft wings with a high elongation factor.
Previous research has confirmed the applicability of CAD/CAM techniques as an alternative means of determining aerodynamic characteristics for tunnel testing. Szczepaniak et al. pointed out the limitations of computer simulations. In their work, they also paid attention to measurement errors, which are associated with the need to carry out the validation of results and the use of other software to verify the correctness of results [
36].
The applied measurement and control system in the wind tunnel made it possible to measure and change the inclination of the angle of attack and the glide angle of the tested models and to measure the dynamic pressure of the undisturbed flow. Previous research has proven that the measurement and control system is a versatile and accurate tool [
33,
37,
38].
Other authors have also pointed out the importance of structural weight through the bending moment and static stability (trim) through the pitching moment and center of gravity of the aircraft [
39]. Edwin, on the other hand, considered the optimization of the Grumman X-29 aircraft, in which he minimized the structural weight translated into speed force by tilting the wing forward [
40]. In the construction of the glider, a sequential design procedure was used to optimize the aerodynamics of the wing structure by tilting it forward. The number of design variables selected ranged from 25 to 35 variables. Selected criteria of maximum aerodynamic performance and minimum structural weight in aeroplasticity constraints were also taken into account [
34,
41]. In the context of the aeroelastic optimization of aerostructures, Butler et al. [
42] calculated the minimum structural weight of a high aspect ratio composite wing provided that both divergence velocity and flutter do not exceed an acceptable upper limit. The wing was modeled as a series of box beams, taking into account aeroelastic loads based on the aerodynamic strip theory. Design variables included engine position and the location of spars, as well as variation in laminate thickness. Peter et al. [
5] presented a combined aerodynamic and structural optimization model of a high-speed civil aircraft wing. This design included minimal aerodynamic drag and structural weight subject to limitations imposed on torsional divergence and strength. Other ongoing aerospace research towards optimizing multidisciplinary aircraft design was presented by Negm and Maalawi [
43], who formulated a global objective function for civil transport aircraft optimization design. They considered a range of design objectives and constraints in a broad sense, for which several optimization strategies were tested. In their research, they considered aircraft weight, structural safety, flight comfort and cost. Others suggested using MATLAB software to solve design optimization problems. It allows for assumed mathematical concepts to be broken down into simple ideas and contains many easy-to-follow simulations that can also be used in this field [
44]. Livine et al. [
45] optimized the wing design using a composite structure, taking into account both aerodynamic and structural performances in modeling. Aerodynamic efficiency was measured via minimum drag requirements, while structural efficiency was measured via minimum structural weight below strength and stiffness. The development and use of automated wing design in a multidisciplinary environment were discussed by Neill et al. [
14], who implemented a directional algorithm using sensitivity analysis and constraint approximations. Papila et al. [
46] performed an optimization by investigating the induced drag penalty associated with flight under lower lift coefficient conditions. Their wing structural model consisted of a main box section and 15 equally spaced ribs. The research of Librescu and Maalawi [
47,
48] dealt with the optimization of a composite wing with a spanwise gradient in terms of material or shear wall thickness. The objective function was measured by maximizing the divergence rate while keeping the total structural weight equal to that of the baseline design. During the research, it became clear that global optimization solutions could be achieved for different wing designs.
In this study, once the aerodynamic load distribution was determined, bending and shear stresses could be calculated. Homogeneous material and linear elastic behavior were assumed. The bending stress in the spar flange was calculated using engineering beam theory [
12,
13,
49,
50]. The analyzed plots showed a tendency to maintain their pattern in line with the literature. Despite the apparent irregularities at the limit values of the angle of attack and the significantly irregular curves obtained for air flow velocities of V = 25 and 27 m s
−1, it can be concluded that they fell within the error limits.
Zhang et al. highlighted the importance of 3D printing in aerospace manufacturing. With the rapid development of computer and information automation, advanced manufacturing technologies (such as numerical control technology and computer-aided manufacturing) were invented and improved. In the face of strong competition in the international market of the 21st century, the use of advanced technologies is becoming one of the main battlegrounds. Reverse engineering technology has developed rapidly in recent years, whereby computer-aided digital (CAD) product models can be obtained quickly and accurately; when combined with optimization design, computer-aided design and finite element analysis are obtained. Reverse engineering significantly improves the efficiency of new product development. As one of the representative technologies of the third industrial revolution, three-dimensional (3D) printing technology has been adopted in reverse engineering to rapidly manufacture products in many fields. Moreover, 3D printing is gradually penetrating every step of product design, attracting more and more attention from the industrial and investment communities [
7,
51]. Goh et al. also investigated the interlayer fracture toughness of a carbon-fiber-reinforced thermoplastic for the first time. Their research showed that the temperature of the nozzle and bed during 3D printing decreases with the printing speed [
52,
53].


 ,
, 


