Communication

Evaluating Temperature Control in Friction Stir Welding for Industrial Applications

1
Department of Mechanical Engineering, Brigham Young University, Provo, UT 84602, USA
2
Department of Manufacturing Engineering, Brigham Young University, Provo, UT 84602, USA
*
Author to whom correspondence should be addressed.
J. Manuf. Mater. Process. 2021, 5(4), 124; https://doi.org/10.3390/jmmp5040124
Submission received: 22 October 2021 / Revised: 12 November 2021 / Accepted: 12 November 2021 / Published: 19 November 2021
(This article belongs to the Special Issue Advanced Joining Processes and Techniques)

Abstract

:
Reports in the literature indicate that temperature control in Friction Stir Welding (FSW) enables better weld properties and easier weld process development. However, although methods of temperature control have existed for almost two decades, industry adoption remains limited. This work examines single-loop Proportional-Integral-Derivative (PID) control on spindle speed as a comparatively simple and cost-effective method of adding temperature control to existing FSW machines. Implementation of PID-based temperature control compared to uncontrolled FSW in AA6111 at linear weld speeds of 1–2 m per minute showed improved mechanical properties and greater consistency in properties along the length of the weld under temperature control. Additionally, results indicate that a minimum spindle rpm may exist, above which tensile specimens do not fracture within the weld centerline, regardless of temperature. This work demonstrates that a straightforward, PID-based implementation of temperature control at high weld rates can produce high quality welds.

1. Introduction

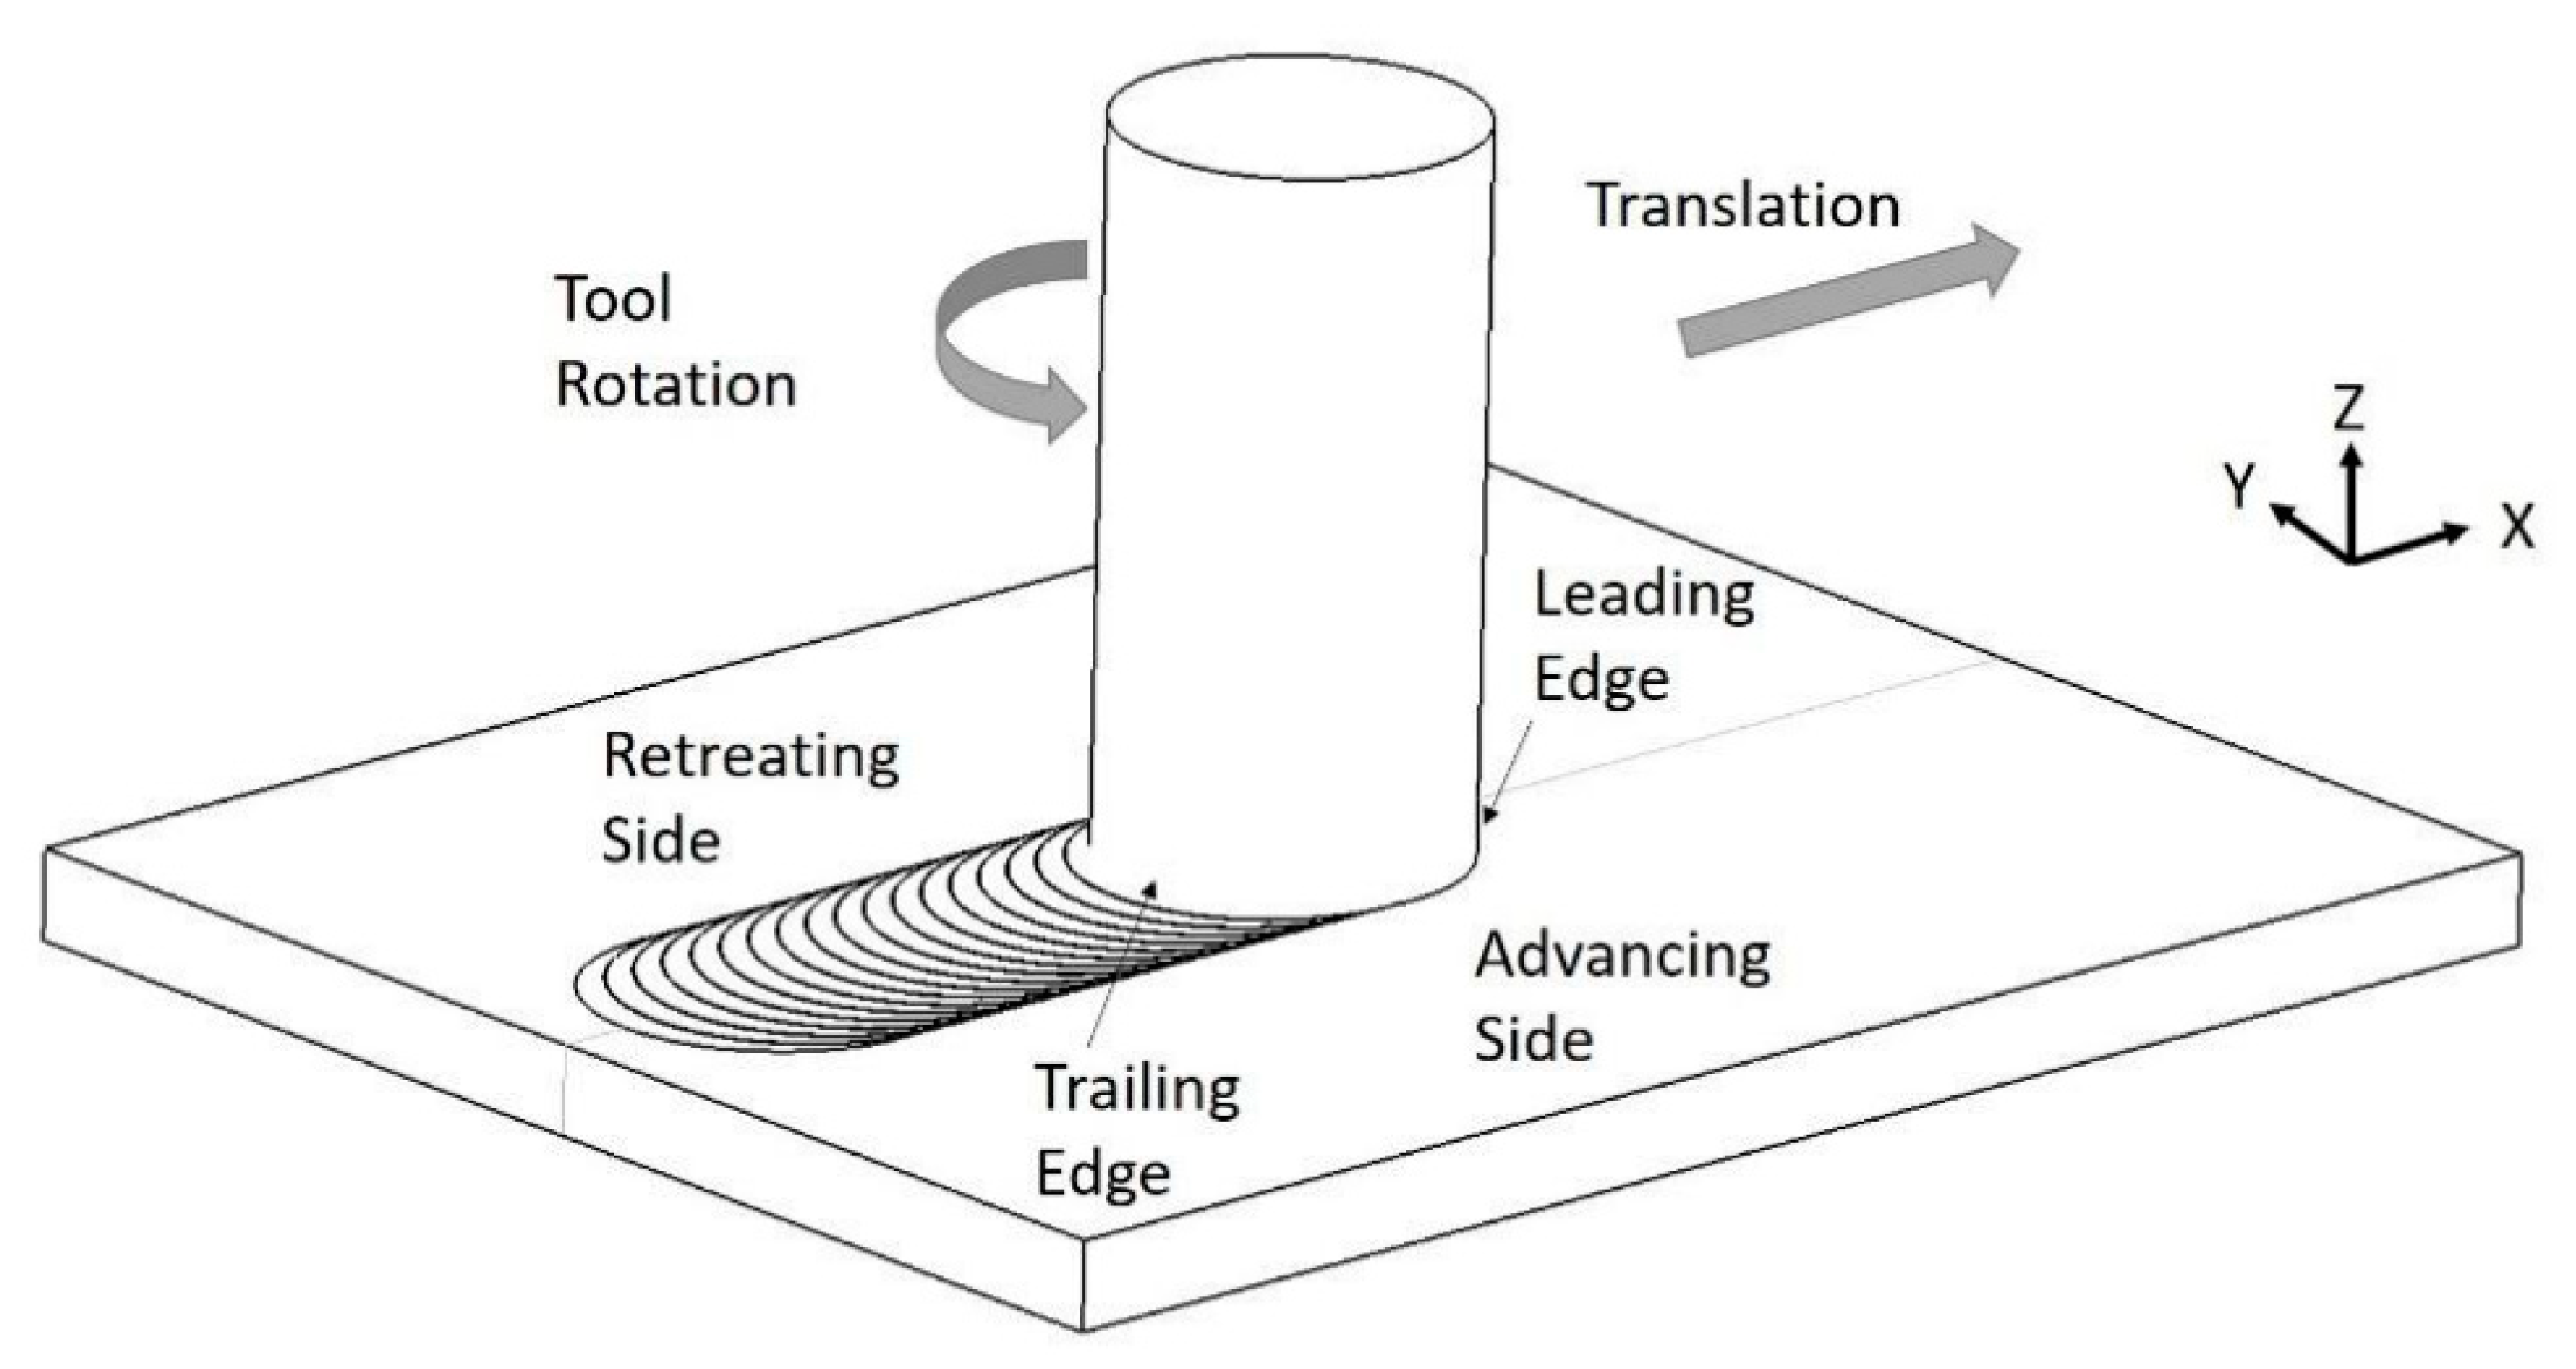
1.1. Friction Stir Welding

Solid-state welding, or the joining of materials below their bulk melting temperatures, has been evaluated in various forms for millennia. Traditionally, this type of technology was considered the work of a skilled blacksmith or even the craft of a fine sword maker. The art of “heat and beat” metallurgy has led to numerous materials processing innovations, including forging, swaging, and other processing technologies. However, the recognition that these same techniques could be used solely for joining led to a stream of patented technologies starting in 1940 in Great Britain, which has continued until today. While developing technology around machine design and control has enabled increasingly sophisticated approaches, one solid-state joining technology that was a clear break away from a more traditional approach of rubbing one material on another was FSW. This approach took advantage of precision machines to use a non-consumable tool to stir two materials together, causing a locally controlled forging action that could be directed along the path of a weld seam. Figure 1 depicts a rotating FSW tool that has been plunged into the interface of two abutting plates and translated along that interface. Due to the nature of both translational and rotational components of the tool movement, non-homogeneous mixing occurs across the cross-section of a weld. The side that benefits from the combination of rotational and translational components of velocity is known as the advancing side, while the other side of the weld is known as the retreating side.

1.2. Why Temperature Control?

As FSW was enabled through advances in precision machines and controls by providing path specific management of a tool under load, the entire process depends on our ability to skillfully manage positions, velocities, loads, temperatures, torques, and boundary conditions. Friction stir welding was originally enabled by control of positions and velocities, and the original patent in 1991 [1] led to more than 1500 additional patents designed to better understand how to control the process to achieve targeted properties. Like many other solid-state joining processes, FSW is dependent on heat generated from a combination of friction and deformation. Friction-based heating is created at the interface of the FSW tool and material to be welded, and is dependent on the surface interfaces and frictional reaction between two materials (tool and workpiece). The heat generated from deformation of the material is specific to the geometry of the tool, the process parameters of the weld, and the characteristic temperature dependent properties of the material being joined. This interaction between the FSW tool and the workpiece creates a feedback loop that is linked to the power input transmitted through the tool via rotational energy and compressive pressure on the weld nugget that generates heat through friction and deformation.
Initial implementations of FSW relied on skilled research teams to develop a specific welding parameter for a fixed tool and set of boundary conditions to achieve a desired output. While this approach has yielded many successful applications of the process, starting as early as 1995 [2,3,4,5], this approach adds to the cost of development and makes transitions from machine to machine problematic at best [6]. The difficulties associated with the development of new welding parameters and transferring parameters to different equipment is largely based on the coupled nature of interactions within a friction stir weld. Friction from the tool generates heat, heat softens the material, softer material generates less heat, and these coupled interactions can lead to unstable welding conditions. If anything related to the setup is changed that affects heat transfer or heat generation otherwise-stable parameters can lead to catastrophic results [7,8,9].
To counter the challenges created from a fully coupled thermo-mechanical welding environment, significant efforts have been made to more closely control the process. Initial efforts focused on control of the axial forces on the FSW tool [10], which came to be known as force control. Significant efforts have been made to implement axial force control, further simplifying the complex and coupled interactions between the FSW tool and the workpiece; however, more extensive control is needed to be able to completely overcome the challenges of developing process parameters for FSW.

1.3. History of Temperature Control in FSW

As temperature has a strong link to post-weld properties [9,11,12], control of specific temperatures within the FSW process seems like a natural progression. Yet, while FSW was invented in 1991, investigations of temperature control did not begin until 2009 [11,12,13]. Over the past decade, many different control methods have been proposed which would theoretically and practically provide excellent temperature control, although there has been disagreement as to which method is the best [14]. However, this environment of dispute has likely discouraged industrial adoption of control, especially as superior methods tend to be the most complicated to implement. A full review of the methods, advantages, and complexities of other temperature control methods has previously been published.
Additionally, most research into temperature control in aluminum has been performed at low feedrates of from 60 to 600 mmpm (millimeters per minute), with one other reported feedrate of 960 mmpm [9]. Industry, by comparison, generally seems to run non-temperature-controlled welds at feedrates of 1000–3000 mmpm. Matching industry-expected feedrates while under temperature control is likely the most important factor in increasing industrial adoption and is a focus of the current study.
This paper examines one of the simpler and easy-to-implement options for temperature control, namely single-loop PID, and analyzes its effectiveness at the industry-oriented feedrates of 1000 and 2000 mmpm. These parameters were selected to determine whether this method provides a clear benefit in regard to weld properties (yield strength), tool temperatures, and property consistency along the weld, with the end goal of encouraging and increasing industry adoption of temperature control.

2. Materials and Methods

The primary methods of temperature control that have been suggested over the past decade have previously been reviewed in [14], where single-loop PID control was determined to be the simplest to implement, specifically when controlling the spindle speed based on the tool temperature. To test the effectiveness of this method, 900-mm-long FSW welds in AA6111, a heat-sensitive aluminum alloy, were produced with and without control at 1000 mm/min and 2000 mm/min, to determine the effectiveness at higher feedrates.

2.1. Material Properties
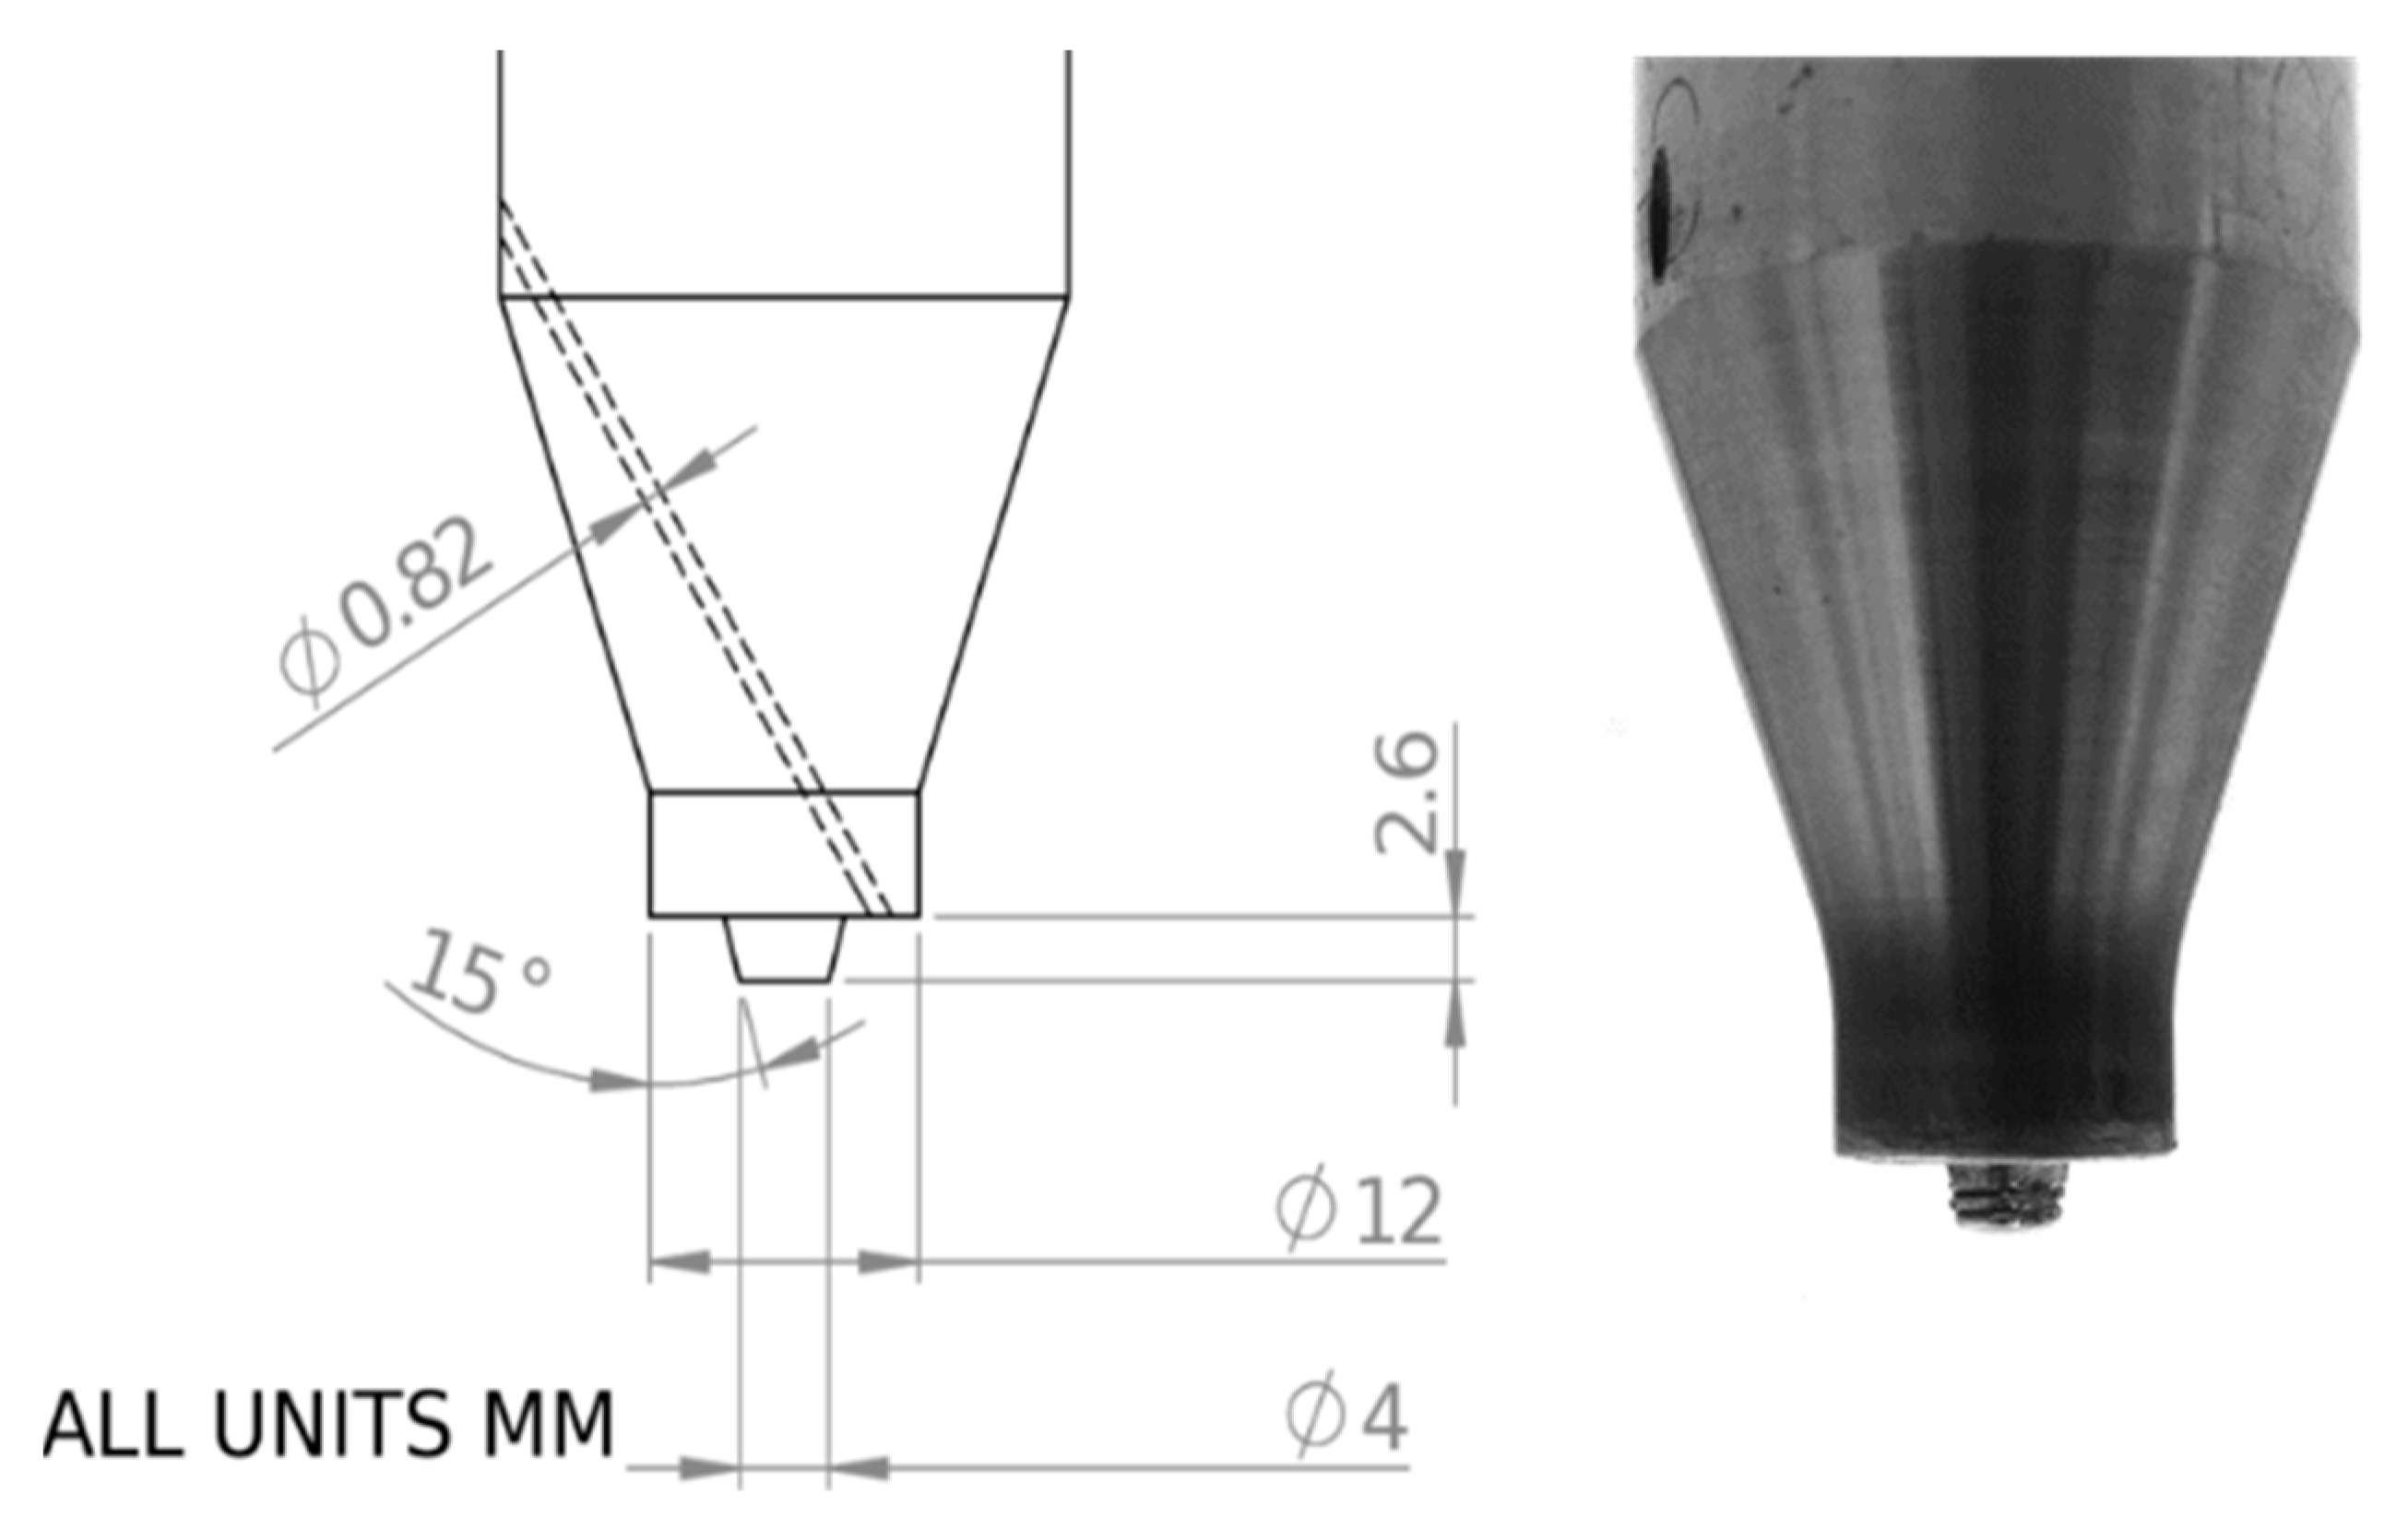
Per ASM handbook volume 2B, the Ultimate Tensile Strength (UTS) of AA6111-T4 generally ranges from 250–285 MPa, while AA6111-T6 has a UTS of 340 MPa [14]. Our material, which was originally of a T4 temper, had aged for about a year at room temperature before welding. Thus, it is better designated as AA6111-T4 + natural aging. Several tensile tests of our Base Material (BM) revealed a UTS of 311 ± 0.48 MPa, which is in agreement with a “T4+” temper.

2.2. The Tool

The tool used is composed of H13 tool steel, with a scrolled, 12-mm-diameter shoulder, and a 2.6-mm-deep tapered pin, with a coarse thread and 3 flats. It has a 0.82-mm-diameter hole drilled through the EDM process, which leads from the upper shank of the tool to within 0.5 mm of breaking through the shoulder of the tool, as seen in Figure 2. From previous experimentation, the hole breaking through does not appreciably affect temperature measurement as long as the time delay is known, but complicates the securement of the thermocouple [14].

2.3. Temperature Measurement

Temperature measurement was performed with a 0.8 mm diameter, ungrounded, type K thermocouple (Omega SCASS-032U-12) embedded into the 0.82 mm hole in the tool shown in Figure 2. The thermocouple built with a 304 stainless sheath, was slipped into hole that was drilled through the body of the tool. With the thermocouple at depth against the bottom of the EDM drilled hole, a pipe clamp was secured around the circumference of the tool at the hole entrance, which pinned the thermocouple in place during the FSW process. As previous investigations have thoroughly investigated the type and placement of thermocouples for closed-loop control in FSW [15,16], this study focused on maintaining a fixed position rather than investigating the placement and lag associated with the setup.
The signal from the thermocouple was transmitted using a TC-Link -1CH -LXRS node attached to the CAT-50 non-chilled toolholder, which wirelessly transmitted over Bluetooth to a WSDA-BASE-101-LXRS analog base station at a rate of 64 samples/second. The base station logged the temperature, and then transmitted the thermocouple voltage remapped on a 0–3.3 V scale to the PLC. Temperature was filtered with a sum of squared error (SSE) filter [17] in order to achieve smooth temperature and first-derivatives for the temperature control. The time delay in temperature from the tool to the PLC was experimentally determined to be 0.2 s.

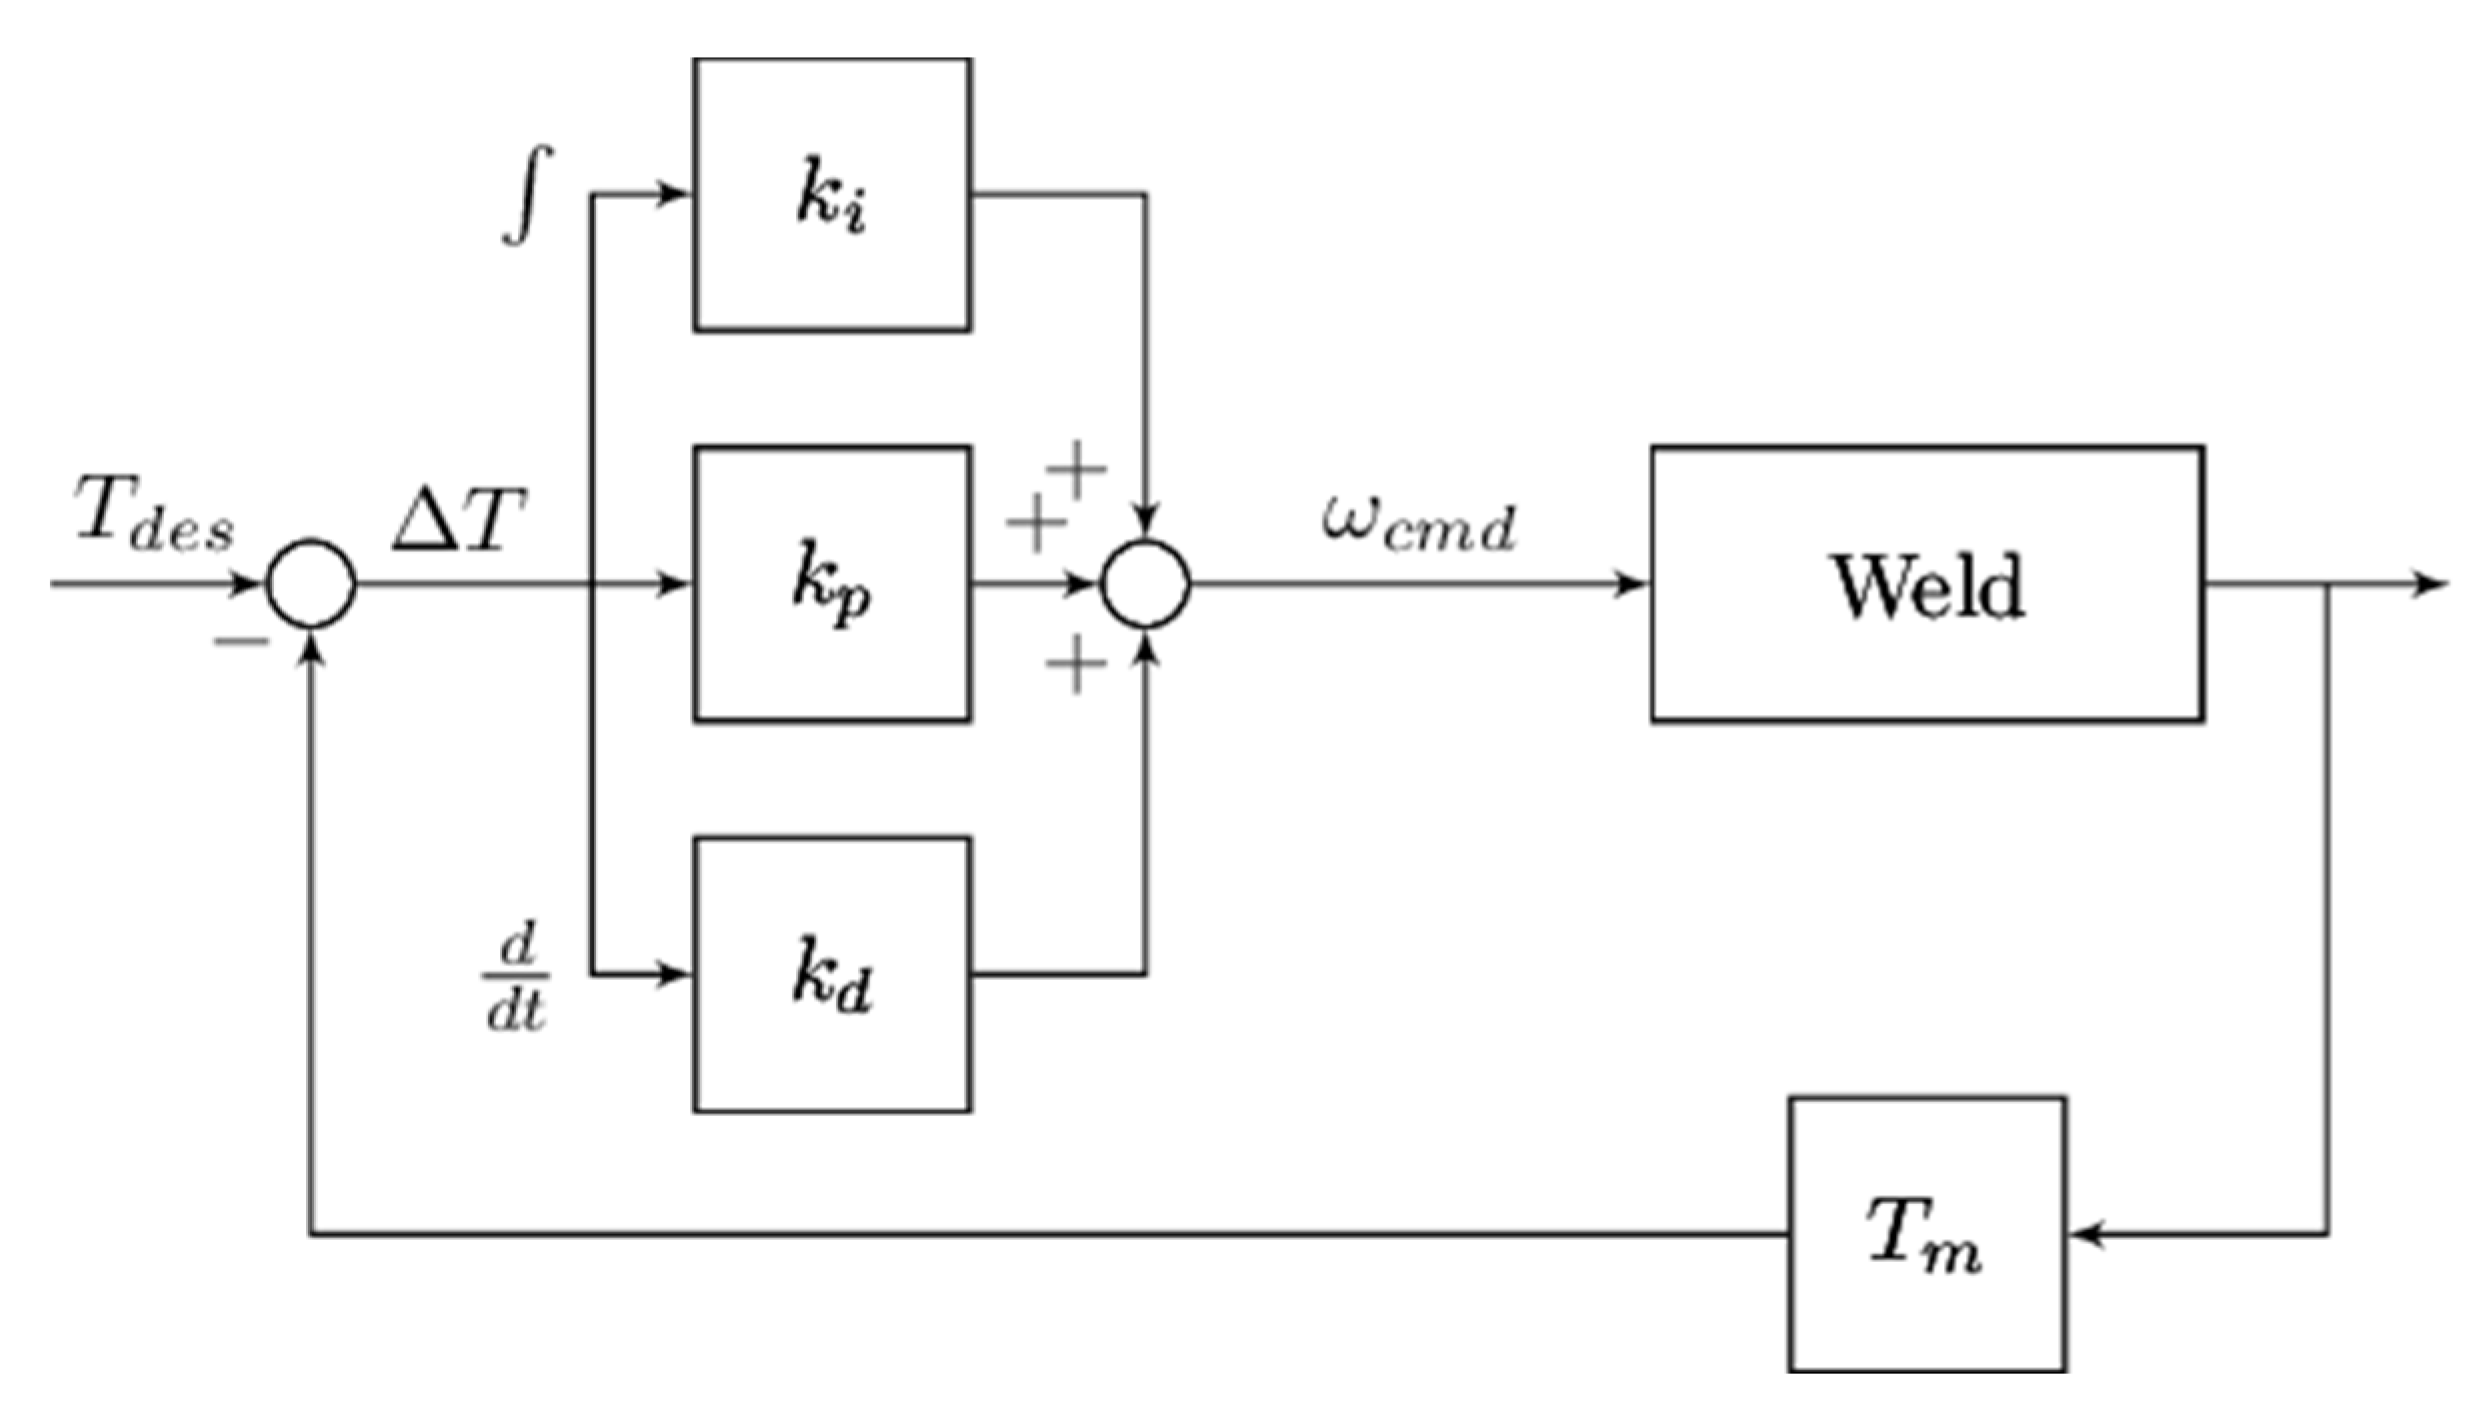
2.4. Temperature Control Method

The chosen control method is a single-loop Proportional-Integral-Derivative (PID) control, as shown in Figure 3, using the thermocouple temperature as the input and controlling the spindle speed. This method was chosen for several reasons, including previous good performance and ease of implementation on an existing FSW machine as shown in [14]. A detailed comparison of different temperature control techniques is also provided in that reference. The controller gains are tuned through the auto-tuner, running a single bead-on-plate weld at the desired feedrate and set-point temperature. The tuned gains are used as PD control (Integral gain set to 0) until the thermocouple temperature reaches within 5 °C of the set-point temperature at which point the integral gain is set to the tuned value. This acts as a form of anti-windup control, and assists in minimizing both the temperature overshoot and rise time. Even if the temperature later exceeds the 5 °C bounds, it remains as PID control.

2.5. Auto-Tuner

The auto-tuner used was an adaptive relay test, based on a first-order plus dead-time model [18]. The general idea of this auto-tuner is to slowly adjust the rpm, in steps, to find an rpm that keeps the temperature relatively constant and at the temperature for which you are tuning. Then it starts a series of steps of +/− 10% of that rpm and watches how the temperature rises and falls. This allows automatic system identification, and calculation of the optimal PID parameters after 5–6 “cycles” of +/− 10%. A typical tuning weld is shown in Figure 4. To successfully run an auto-tuning weld, parameters that will cross the window of temperature that you are tuning for are needed; however, guessing parameters that will achieve this on a single run is much less difficult than finding parameters that will successfully run in production. The length of weld required for auto-tuning varies with the feedrate, with around 600 mm needed for 1000 mmpm and 900 mm for 2000 mmpm.

2.6. Experimental Design
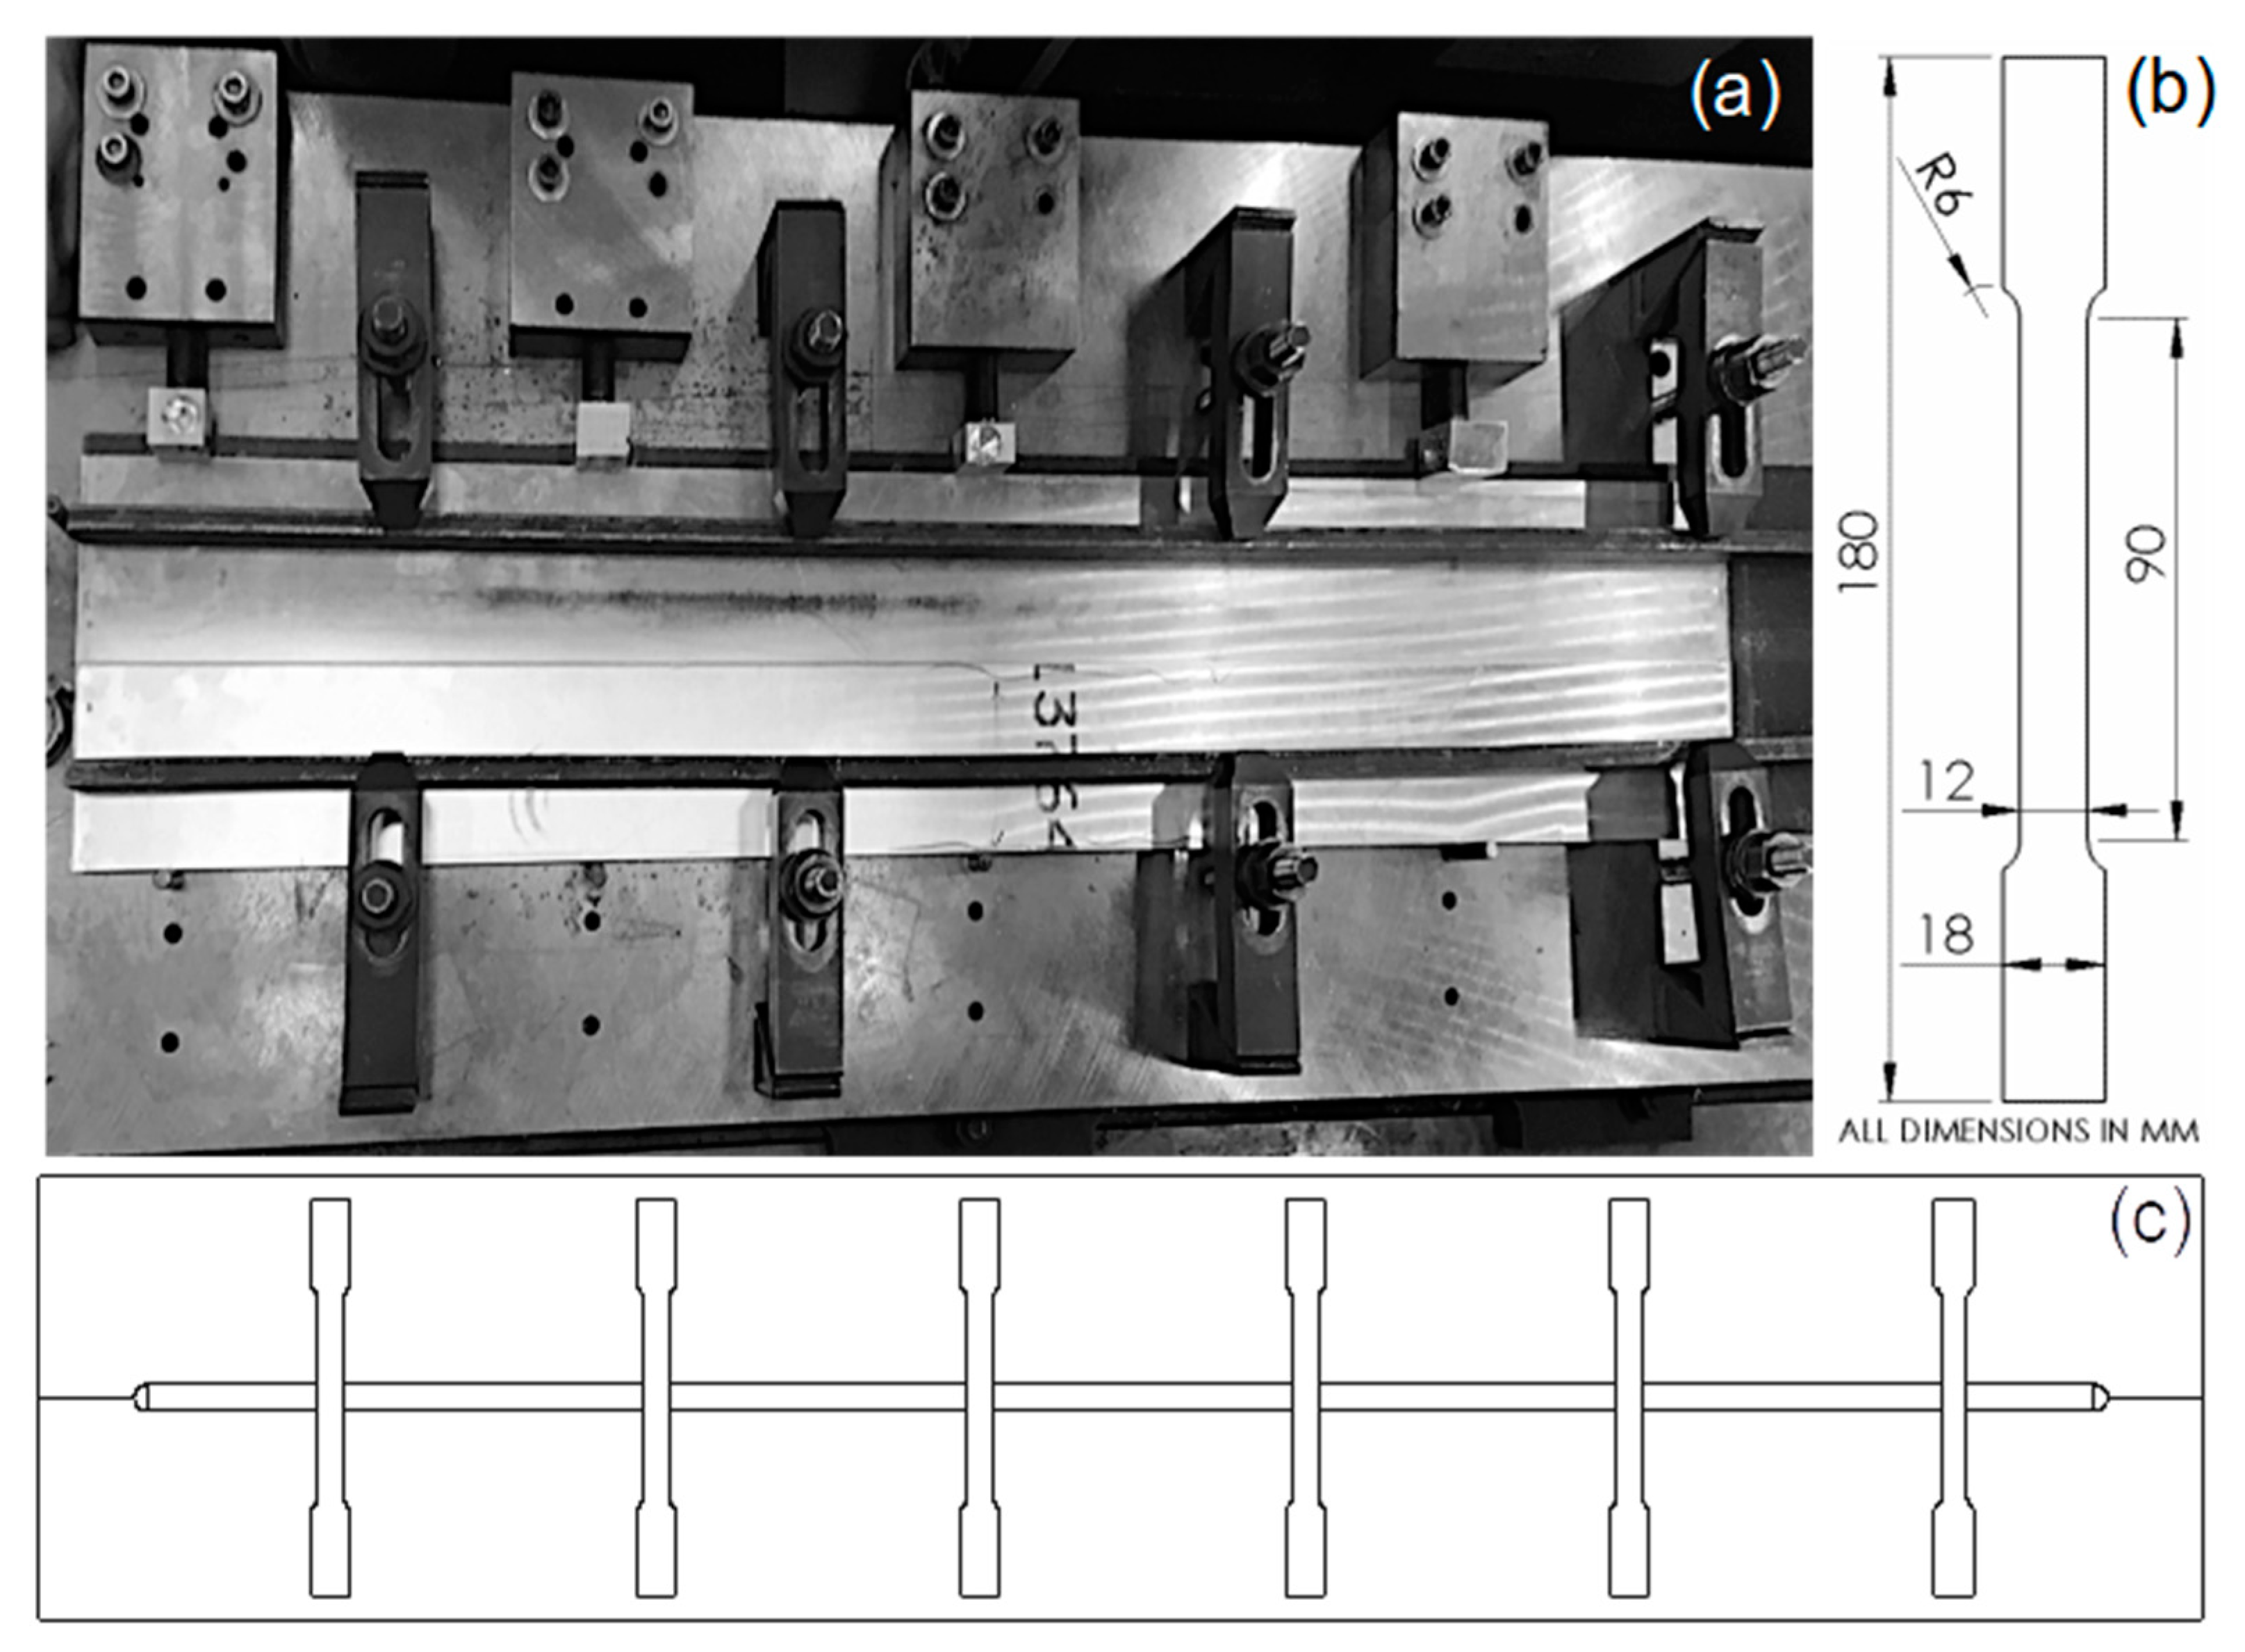
With the two chosen feedrates of 1000 mmpm and 2000 mmpm, four temperature control set-points of 375, 400, 425, and 450 °C were used for each feedrate, with an additional weld with no temperature control (fixed rpm). For each set of feedrate/temperature conditions, one auto-tuning weld was performed, and then one weld was run using the auto-tuned PID settings. After welding, the tool was allowed to cool to approximately 30 °C before the next tuning weld was performed.

2.7. Weld Setup

Welding was performed on a Transformation Technologies, Inc. RM-2 type linear Friction Stir Welding machine retrofitted with a Bond Technologies high-speed B&R-based controller. Each coupon of the AA6111 base material was 200 × 1000 × 2.7 mm in size, resulting in a welded specimen size of 400 × 1000 × 2.7 mm. Welds were 900 mm in length, and the weld and machine parameters were logged at a rate of 1250 Hz. A 400 × 1000 × 6 mm plate of mild steel was placed under the weld to protect the main anvil of 50 mm thick steel. Two 12 × 25 mm bars of mild steel were used to evenly distribute the clamping load from four step clamps along the length of the coupons. Four screw blocks, with corresponding pins on the other side of the weld, were used to provide a lateral clamping force. An image of the overall setup is given in Figure 5a. The tool lead angle was 2° rearward with regards to the welding direction.

2.8. Tensile Testing
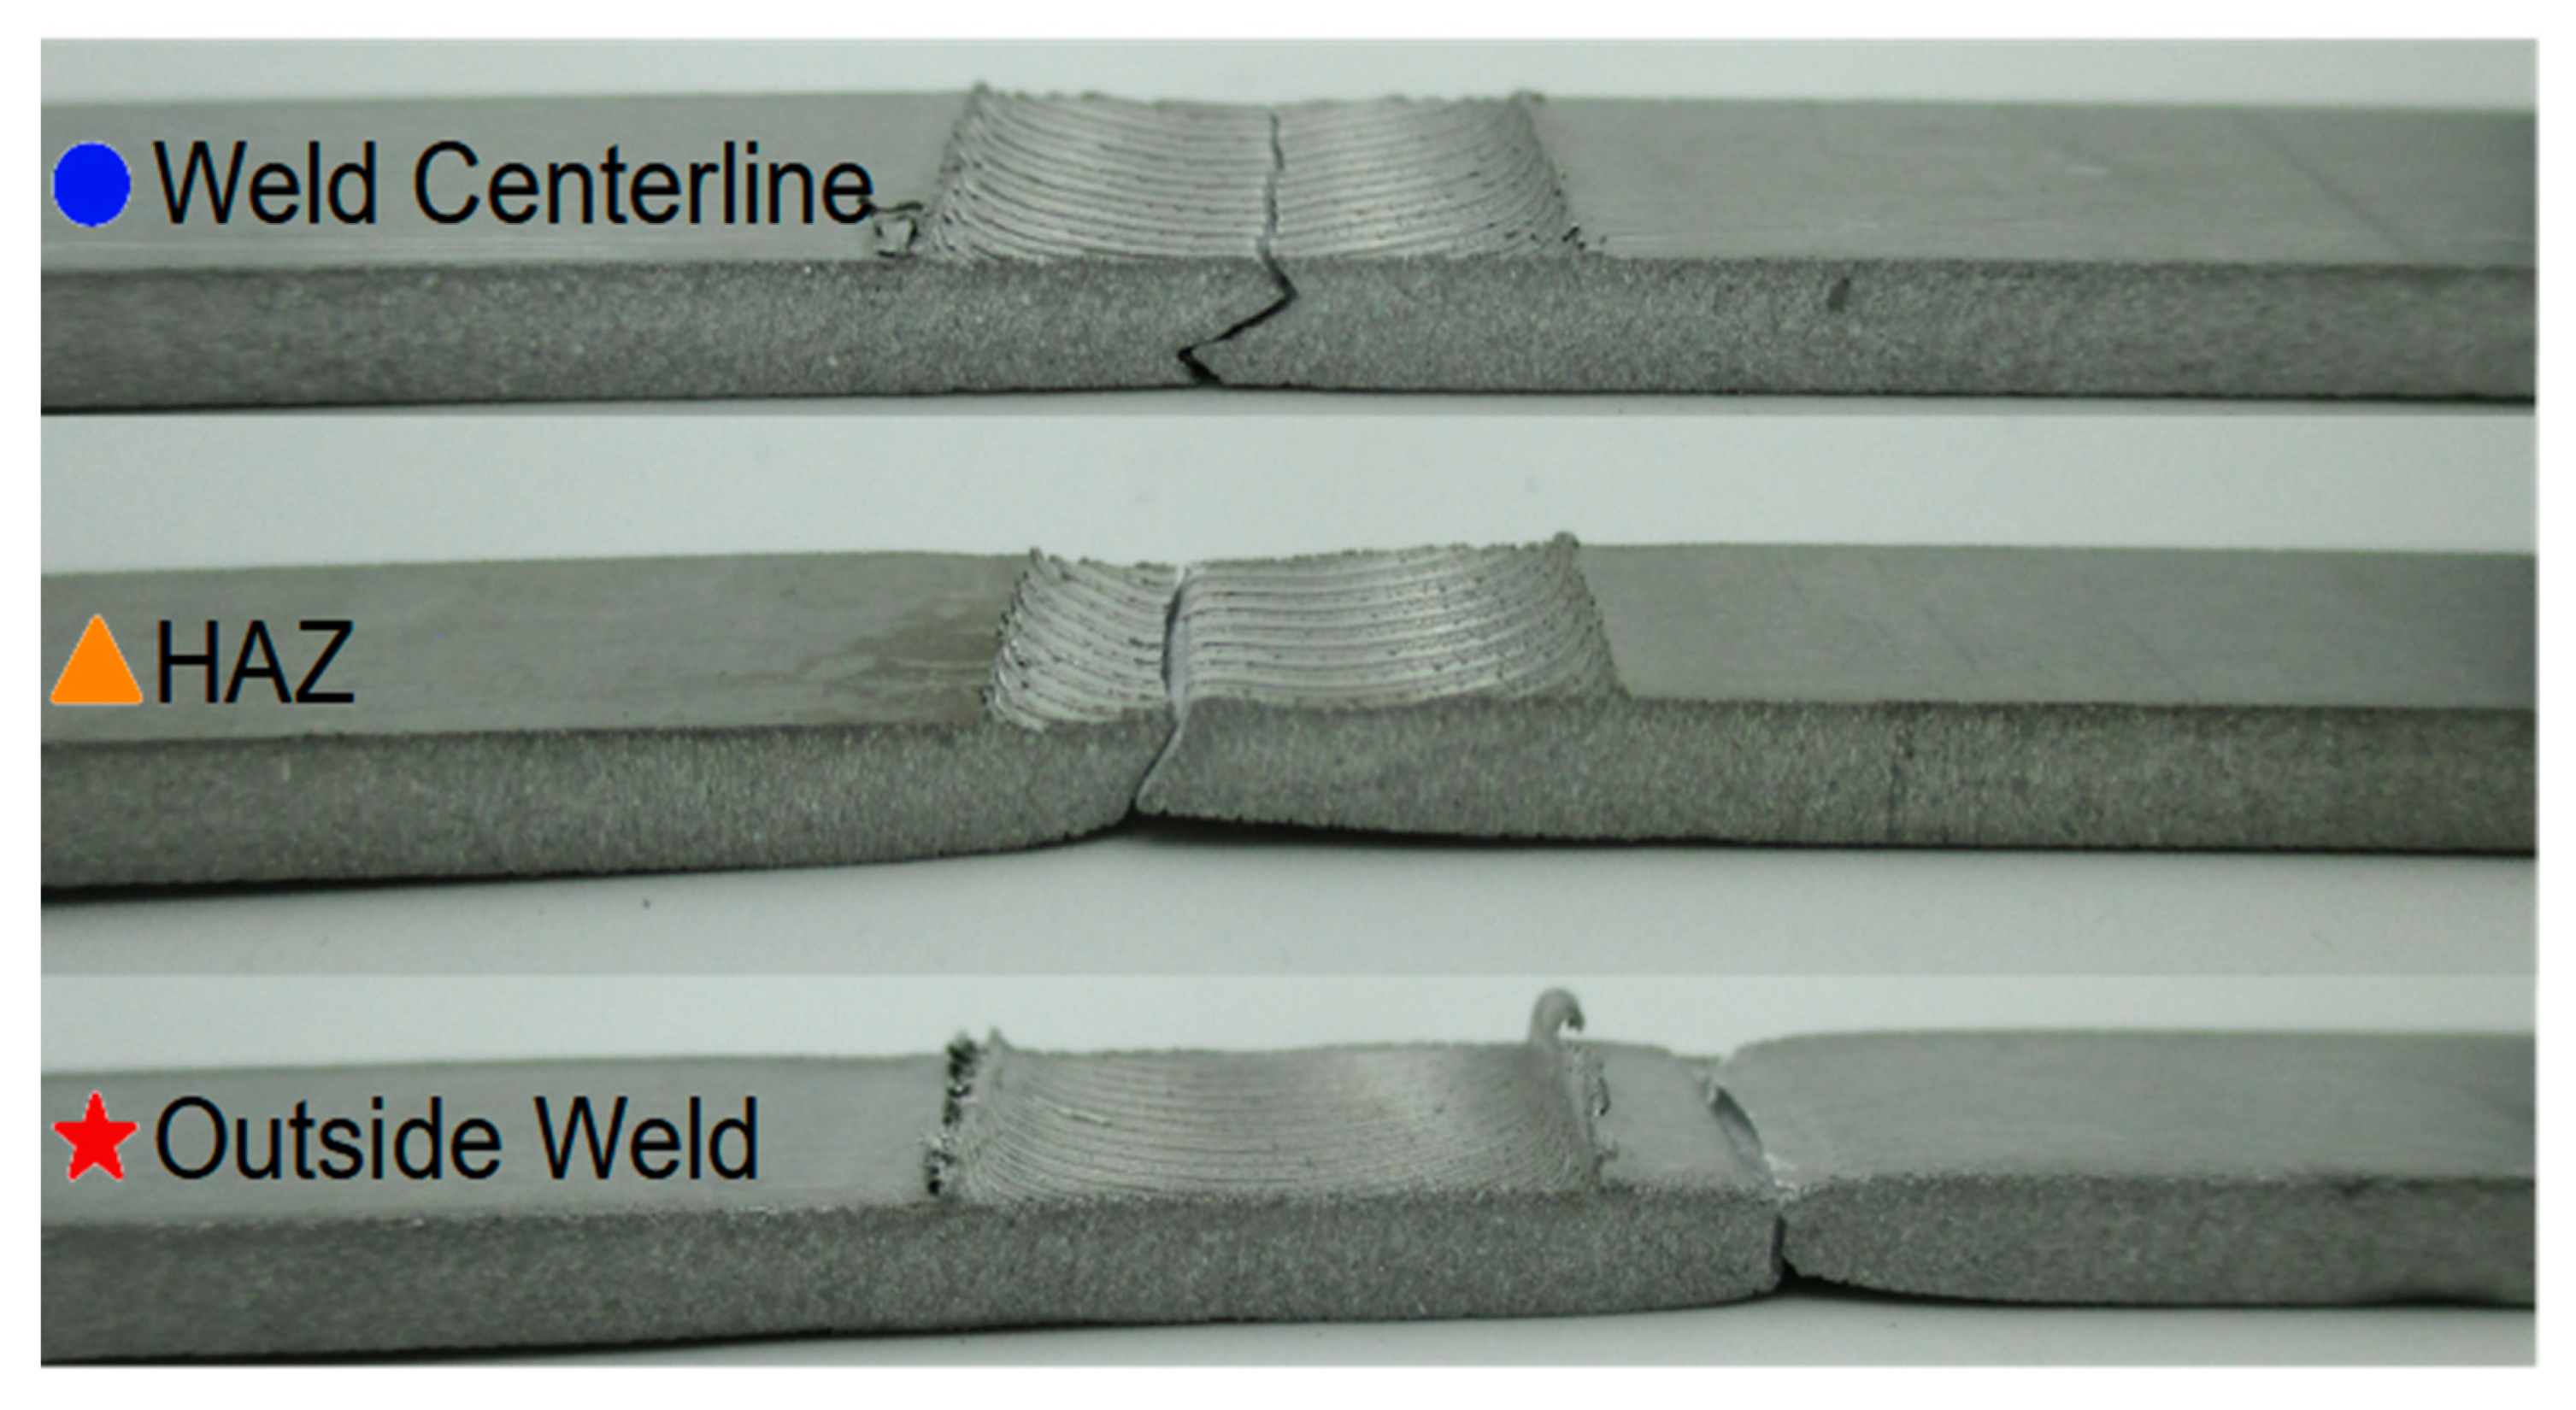
After welding, the specimens were aged at room temperature for 114.5 ± 0.4 h. During this time, an abrasive water-jet machine was used to cut tensile-testing coupons at regular intervals along the weld length. Six tensile specimens (dimensions shown in Figure 5b, locations in Figure 5c) were tested from each weld. The specimens were pulled at a displacement rate of 10 mm/min on an Instron 4204 until fracture, recording the maximum force. These maximum forces were then converted into an Ultimate Tensile Strength (UTS)-based upon the tensile specimen dimensions. Tensile specimens of unwelded base material (BM) were also pulled under the same conditions, resulting in a UTS of 311 ± 0.48 MPa.

2.9. Fracture Modes

Since weld fractures in FSW are more complicated than fracture/no fracture, we also categorized the weld fracture modes. This led to interesting results further on, but for now a simple overview of the three categories is sufficient. The three main categories are: Weld Centerline (CL), Heat-Affected Zone (HAZ), and Outside the Weld (OW). Fractures on the CL generally occur due to an incomplete weld, with some form of the original seam remaining as a wormhole or oxide layer (“lazy S”), or through a failure to weld the full depth of the seam (Lack of Penetration). Fractures in the HAZ can be caused by too much heat, which over-ages the material, and finally, fractures outside the weld are generally considered the best fracture mode. However, OW fractures can occur at lower weld strengths than a HAZ fracture, depending on the heat experienced during the weld and the final local strengths of the weld bead. To clarify these descriptions, an example of each fracture category is provided in Figure 6. Further explanation of defect types in FSW is found in [19].

3. Results and Discussion

This section details the results of the measured temperature of the thermocouple in the tool head compared to other control methodologies, and the effect of spindle speed and temperature on fracture methods.

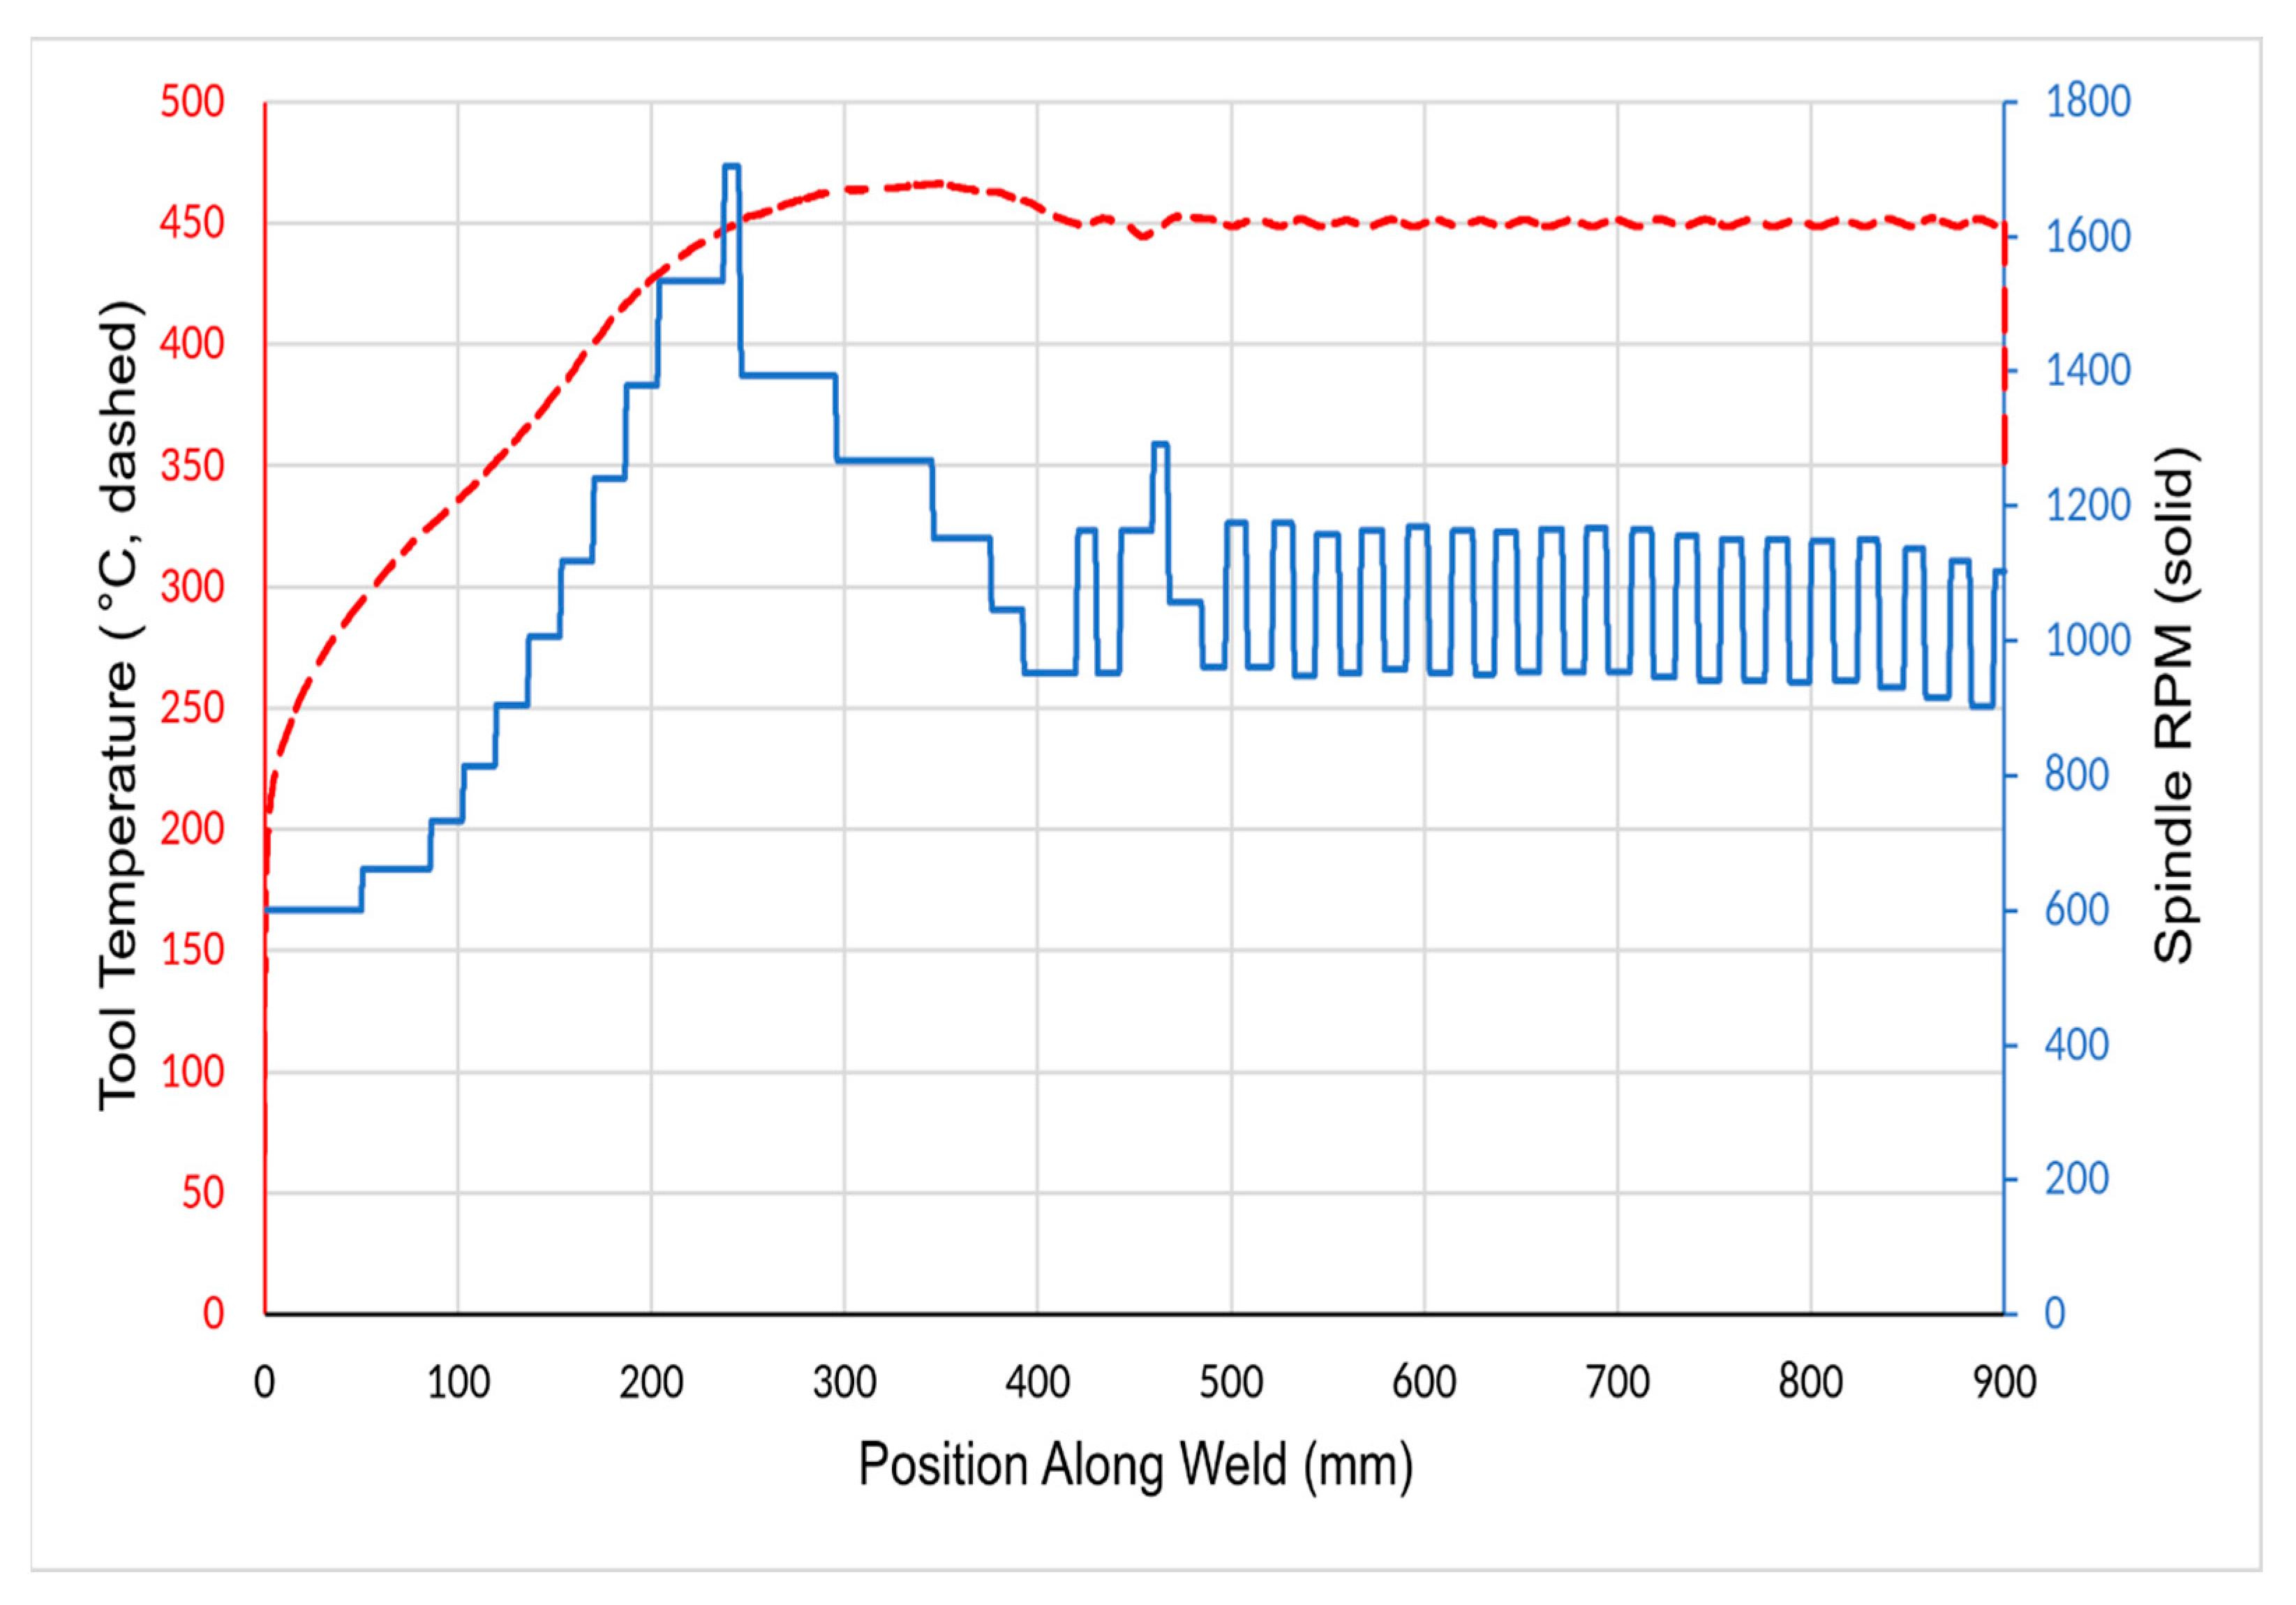
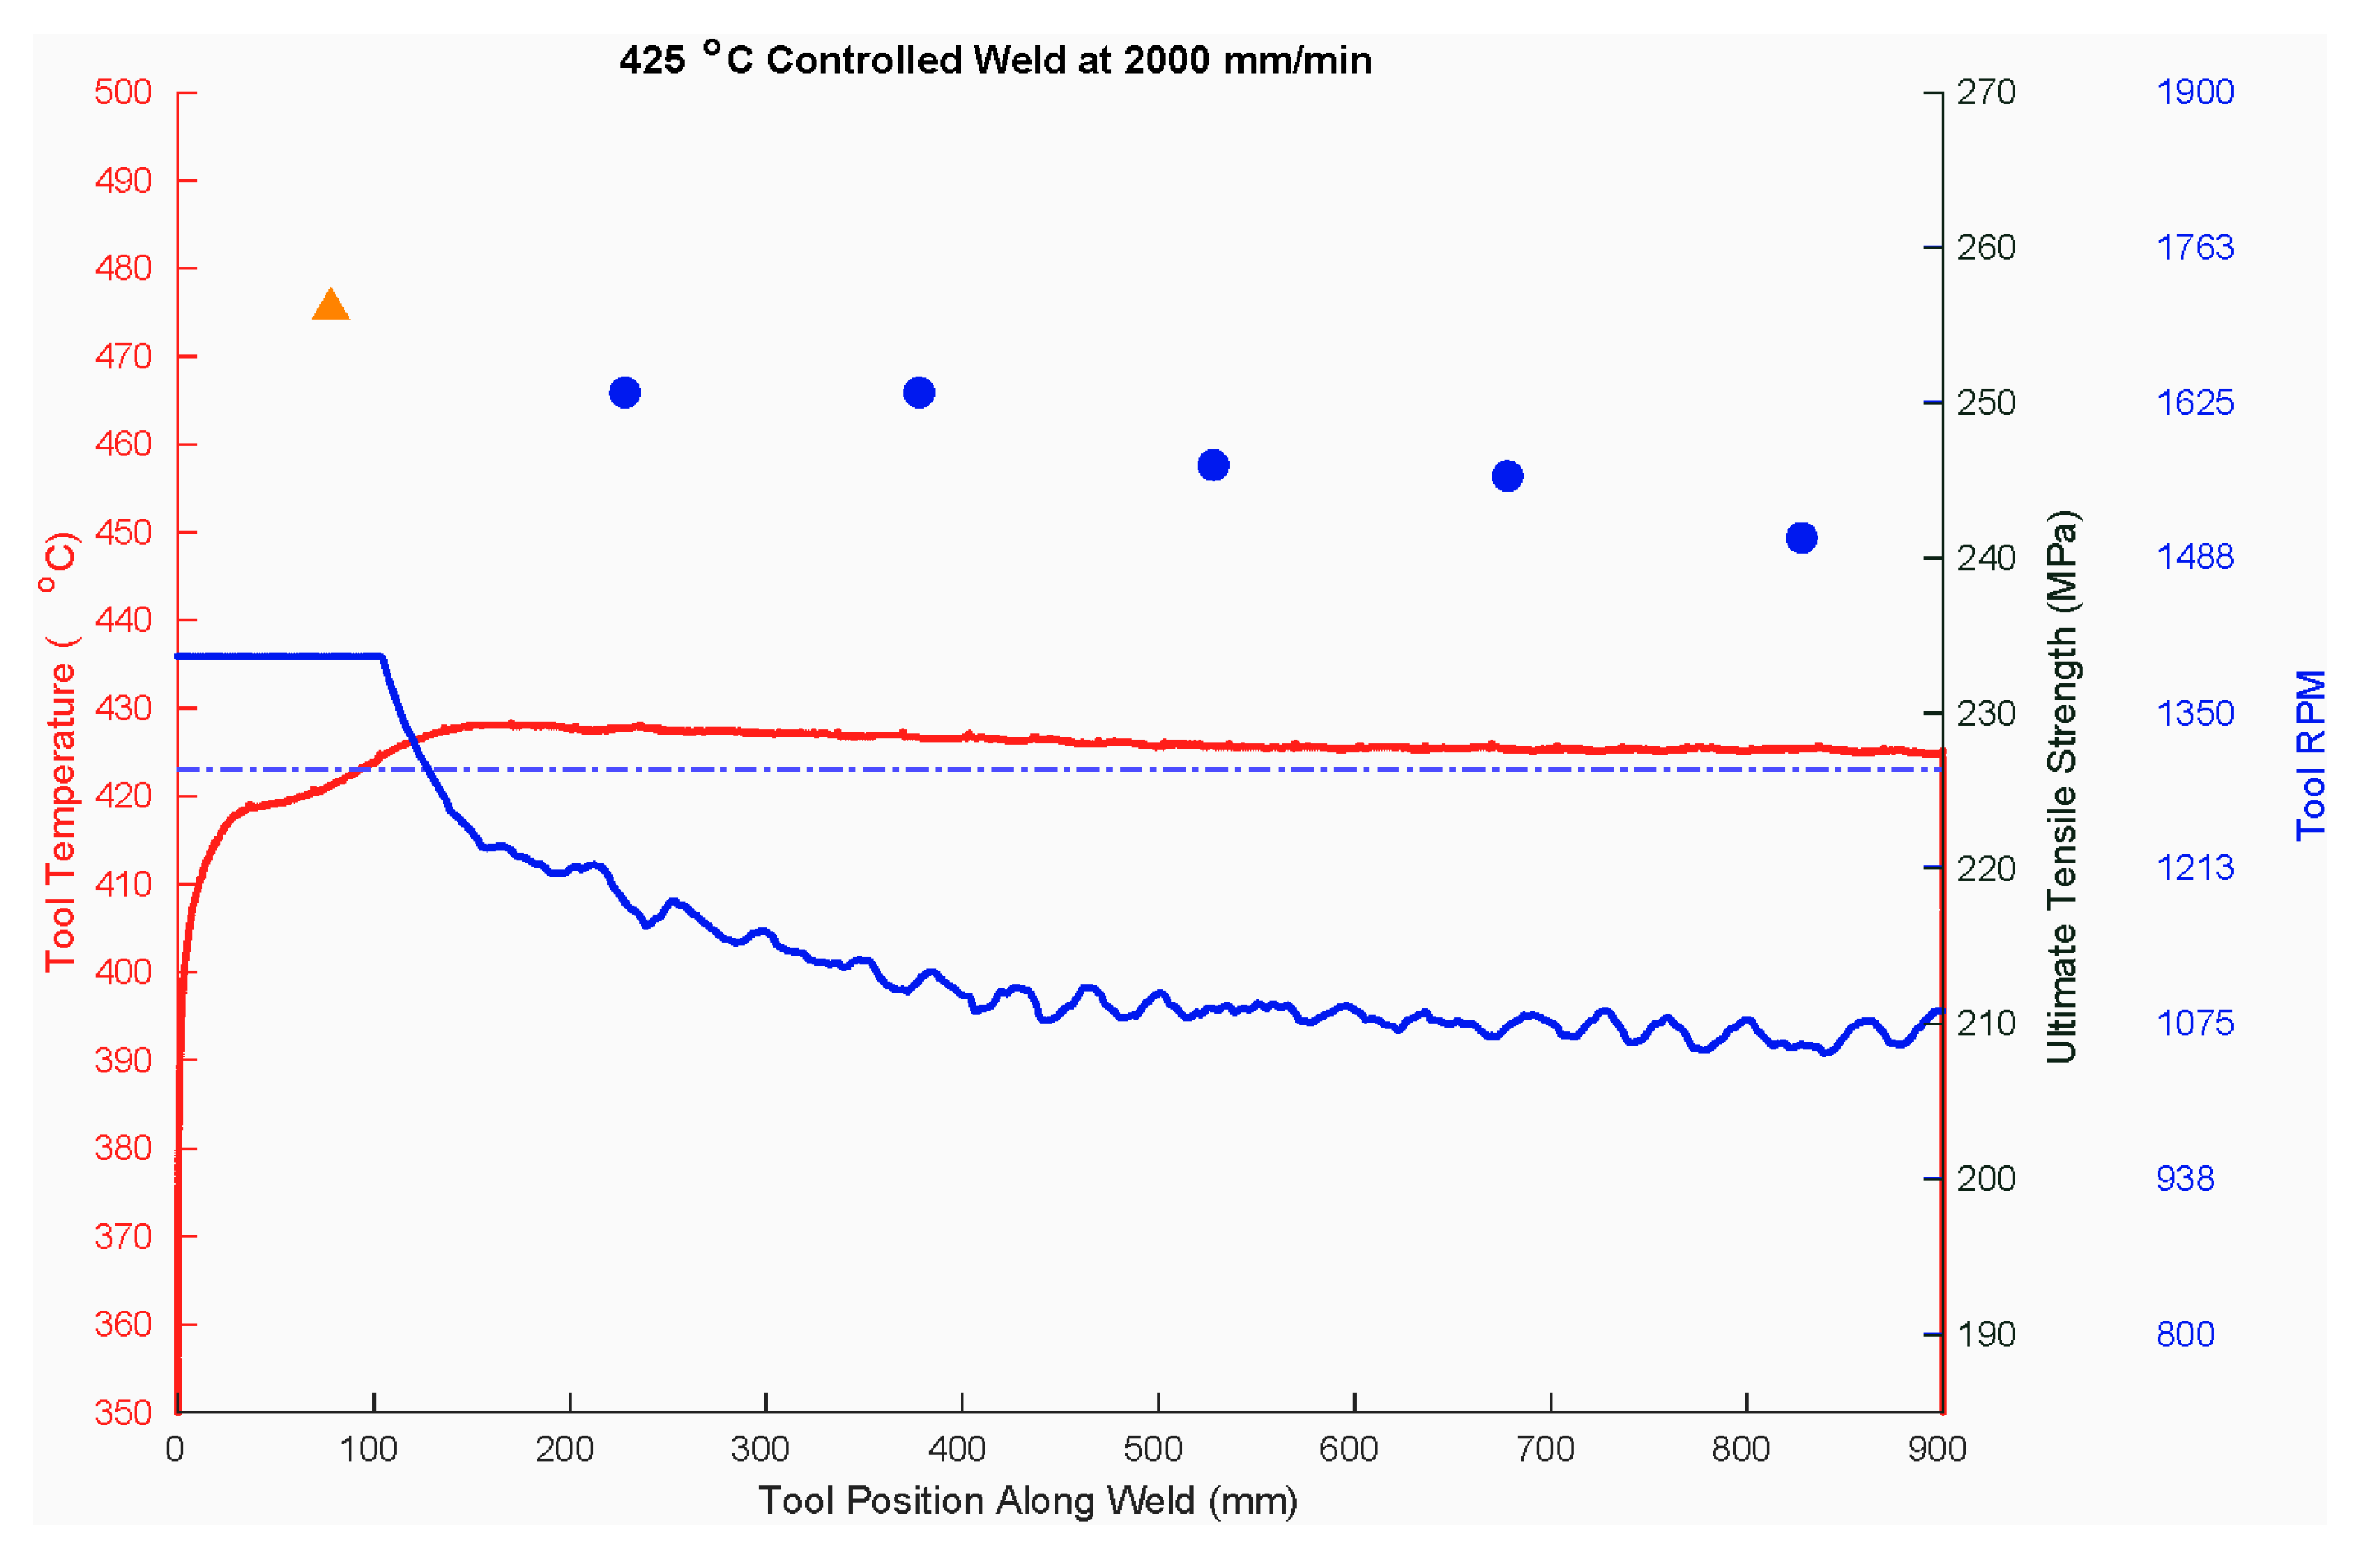
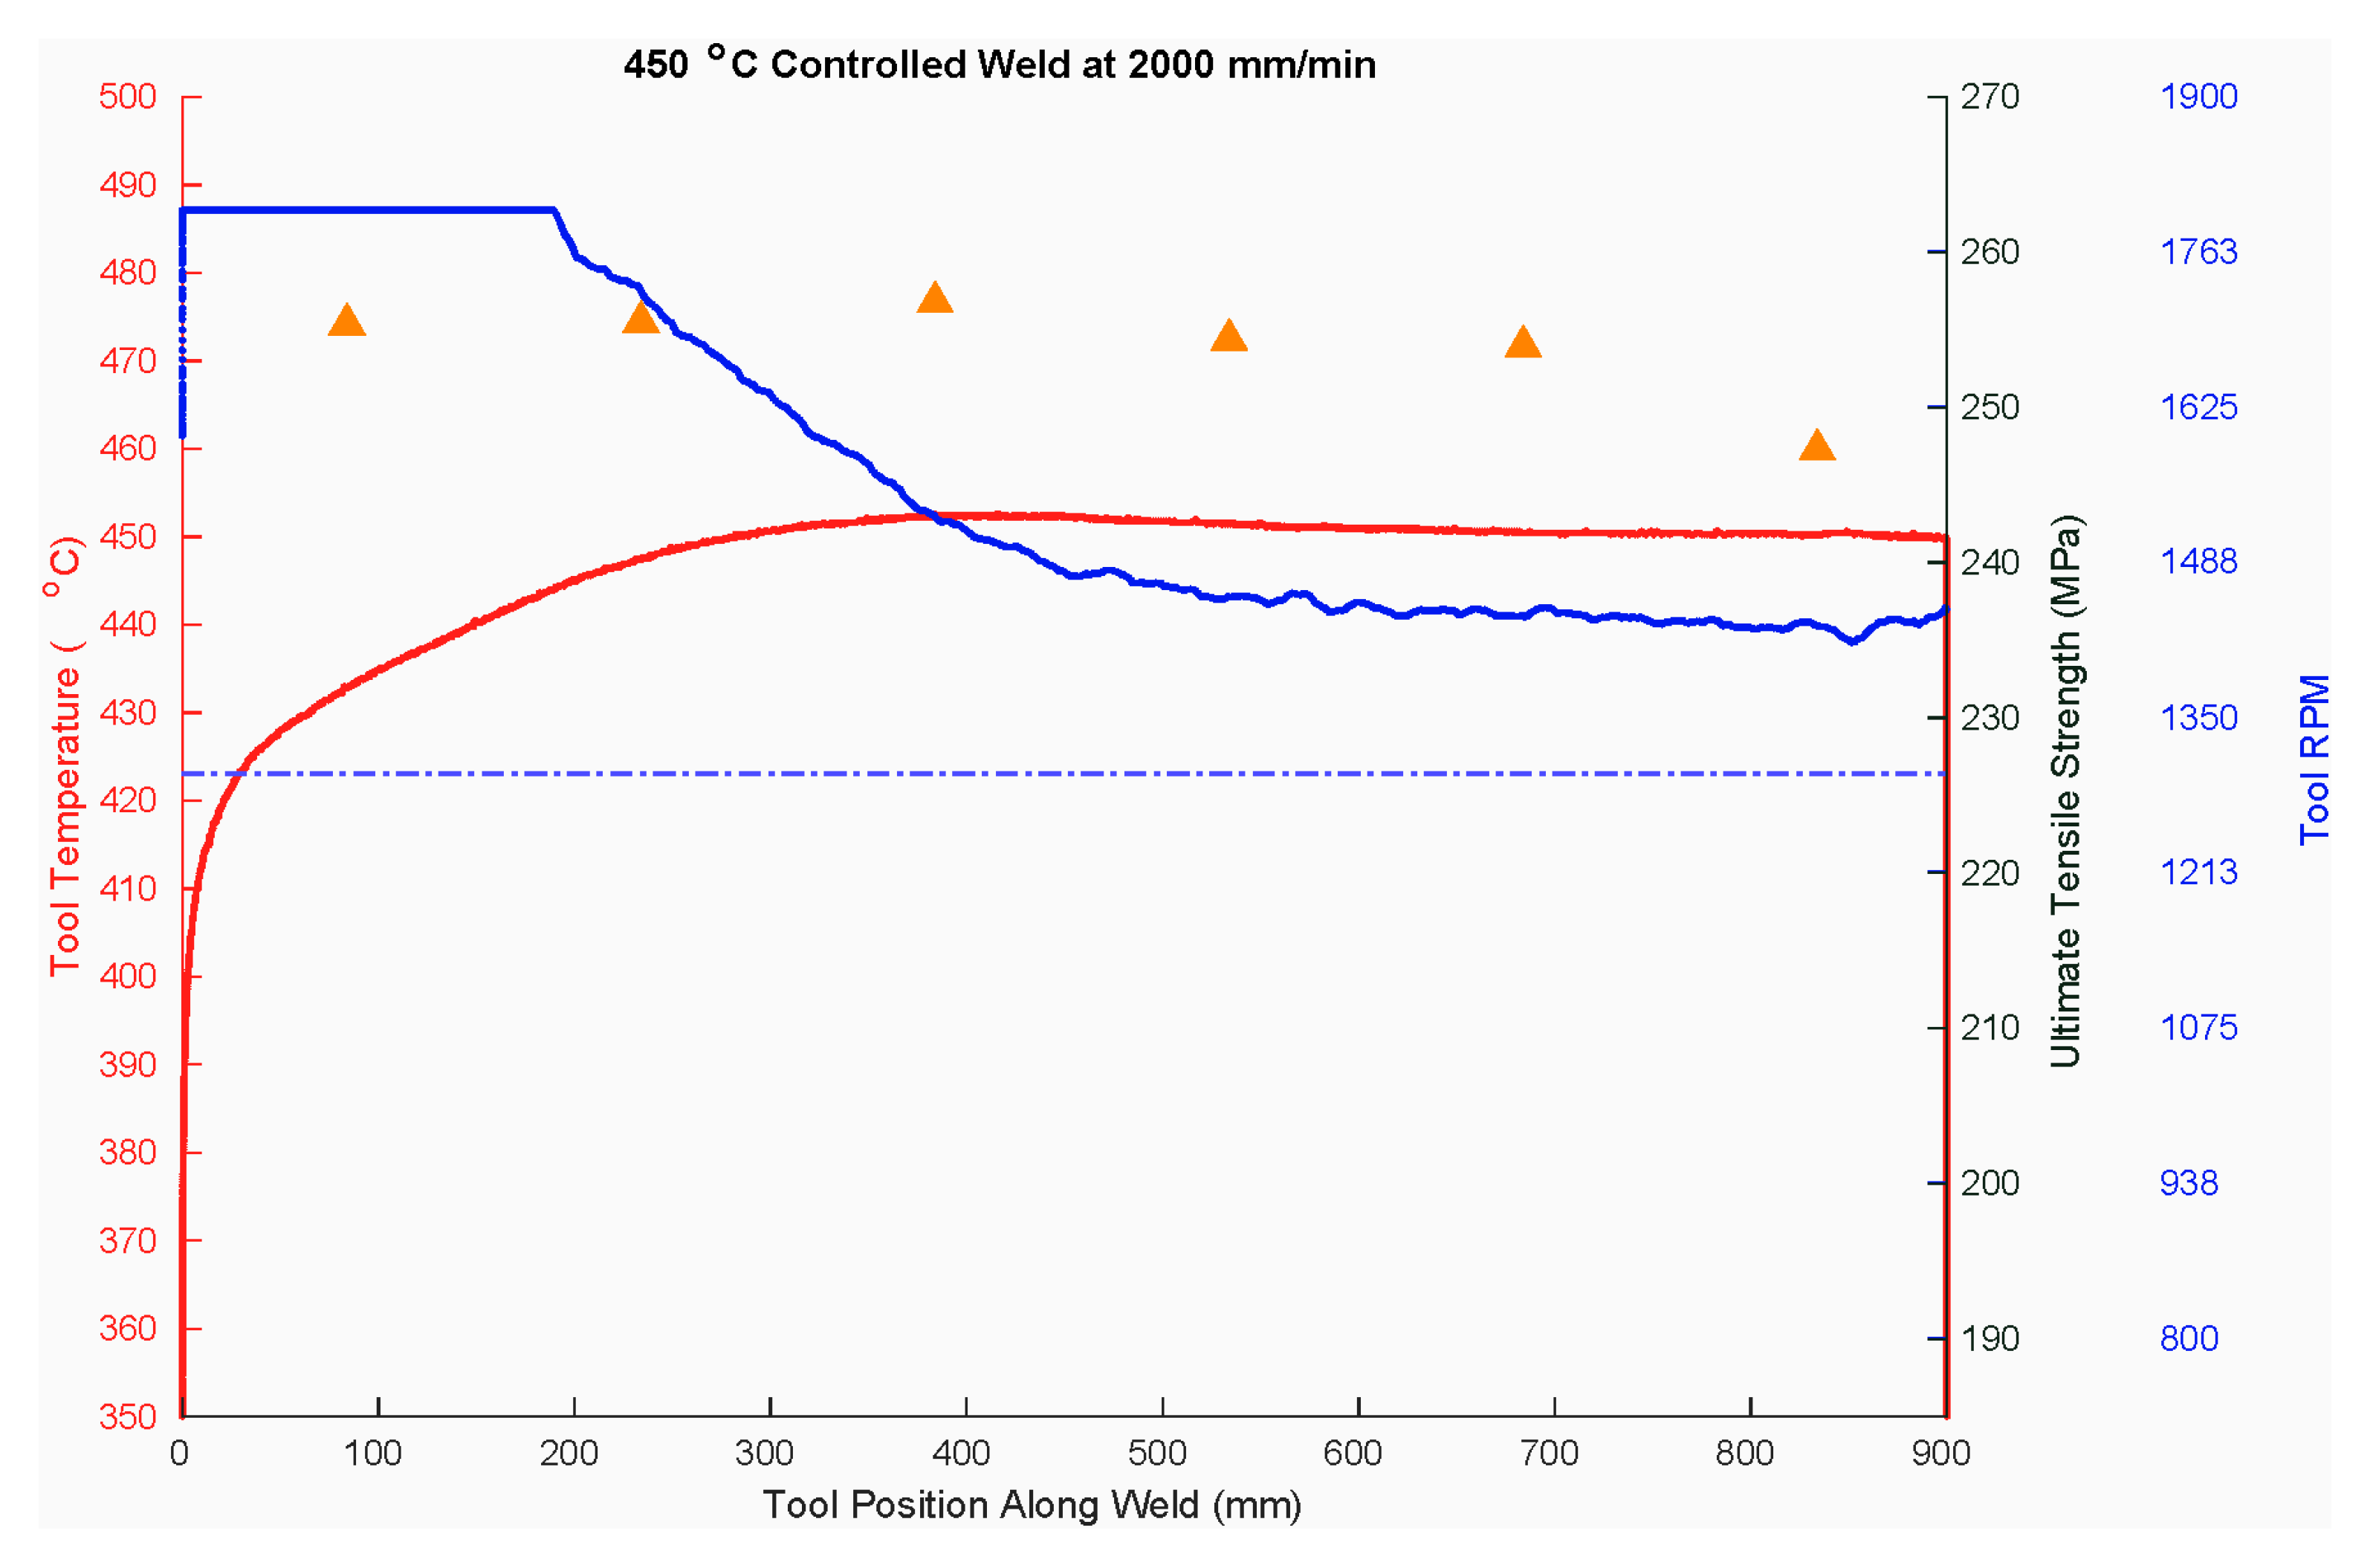
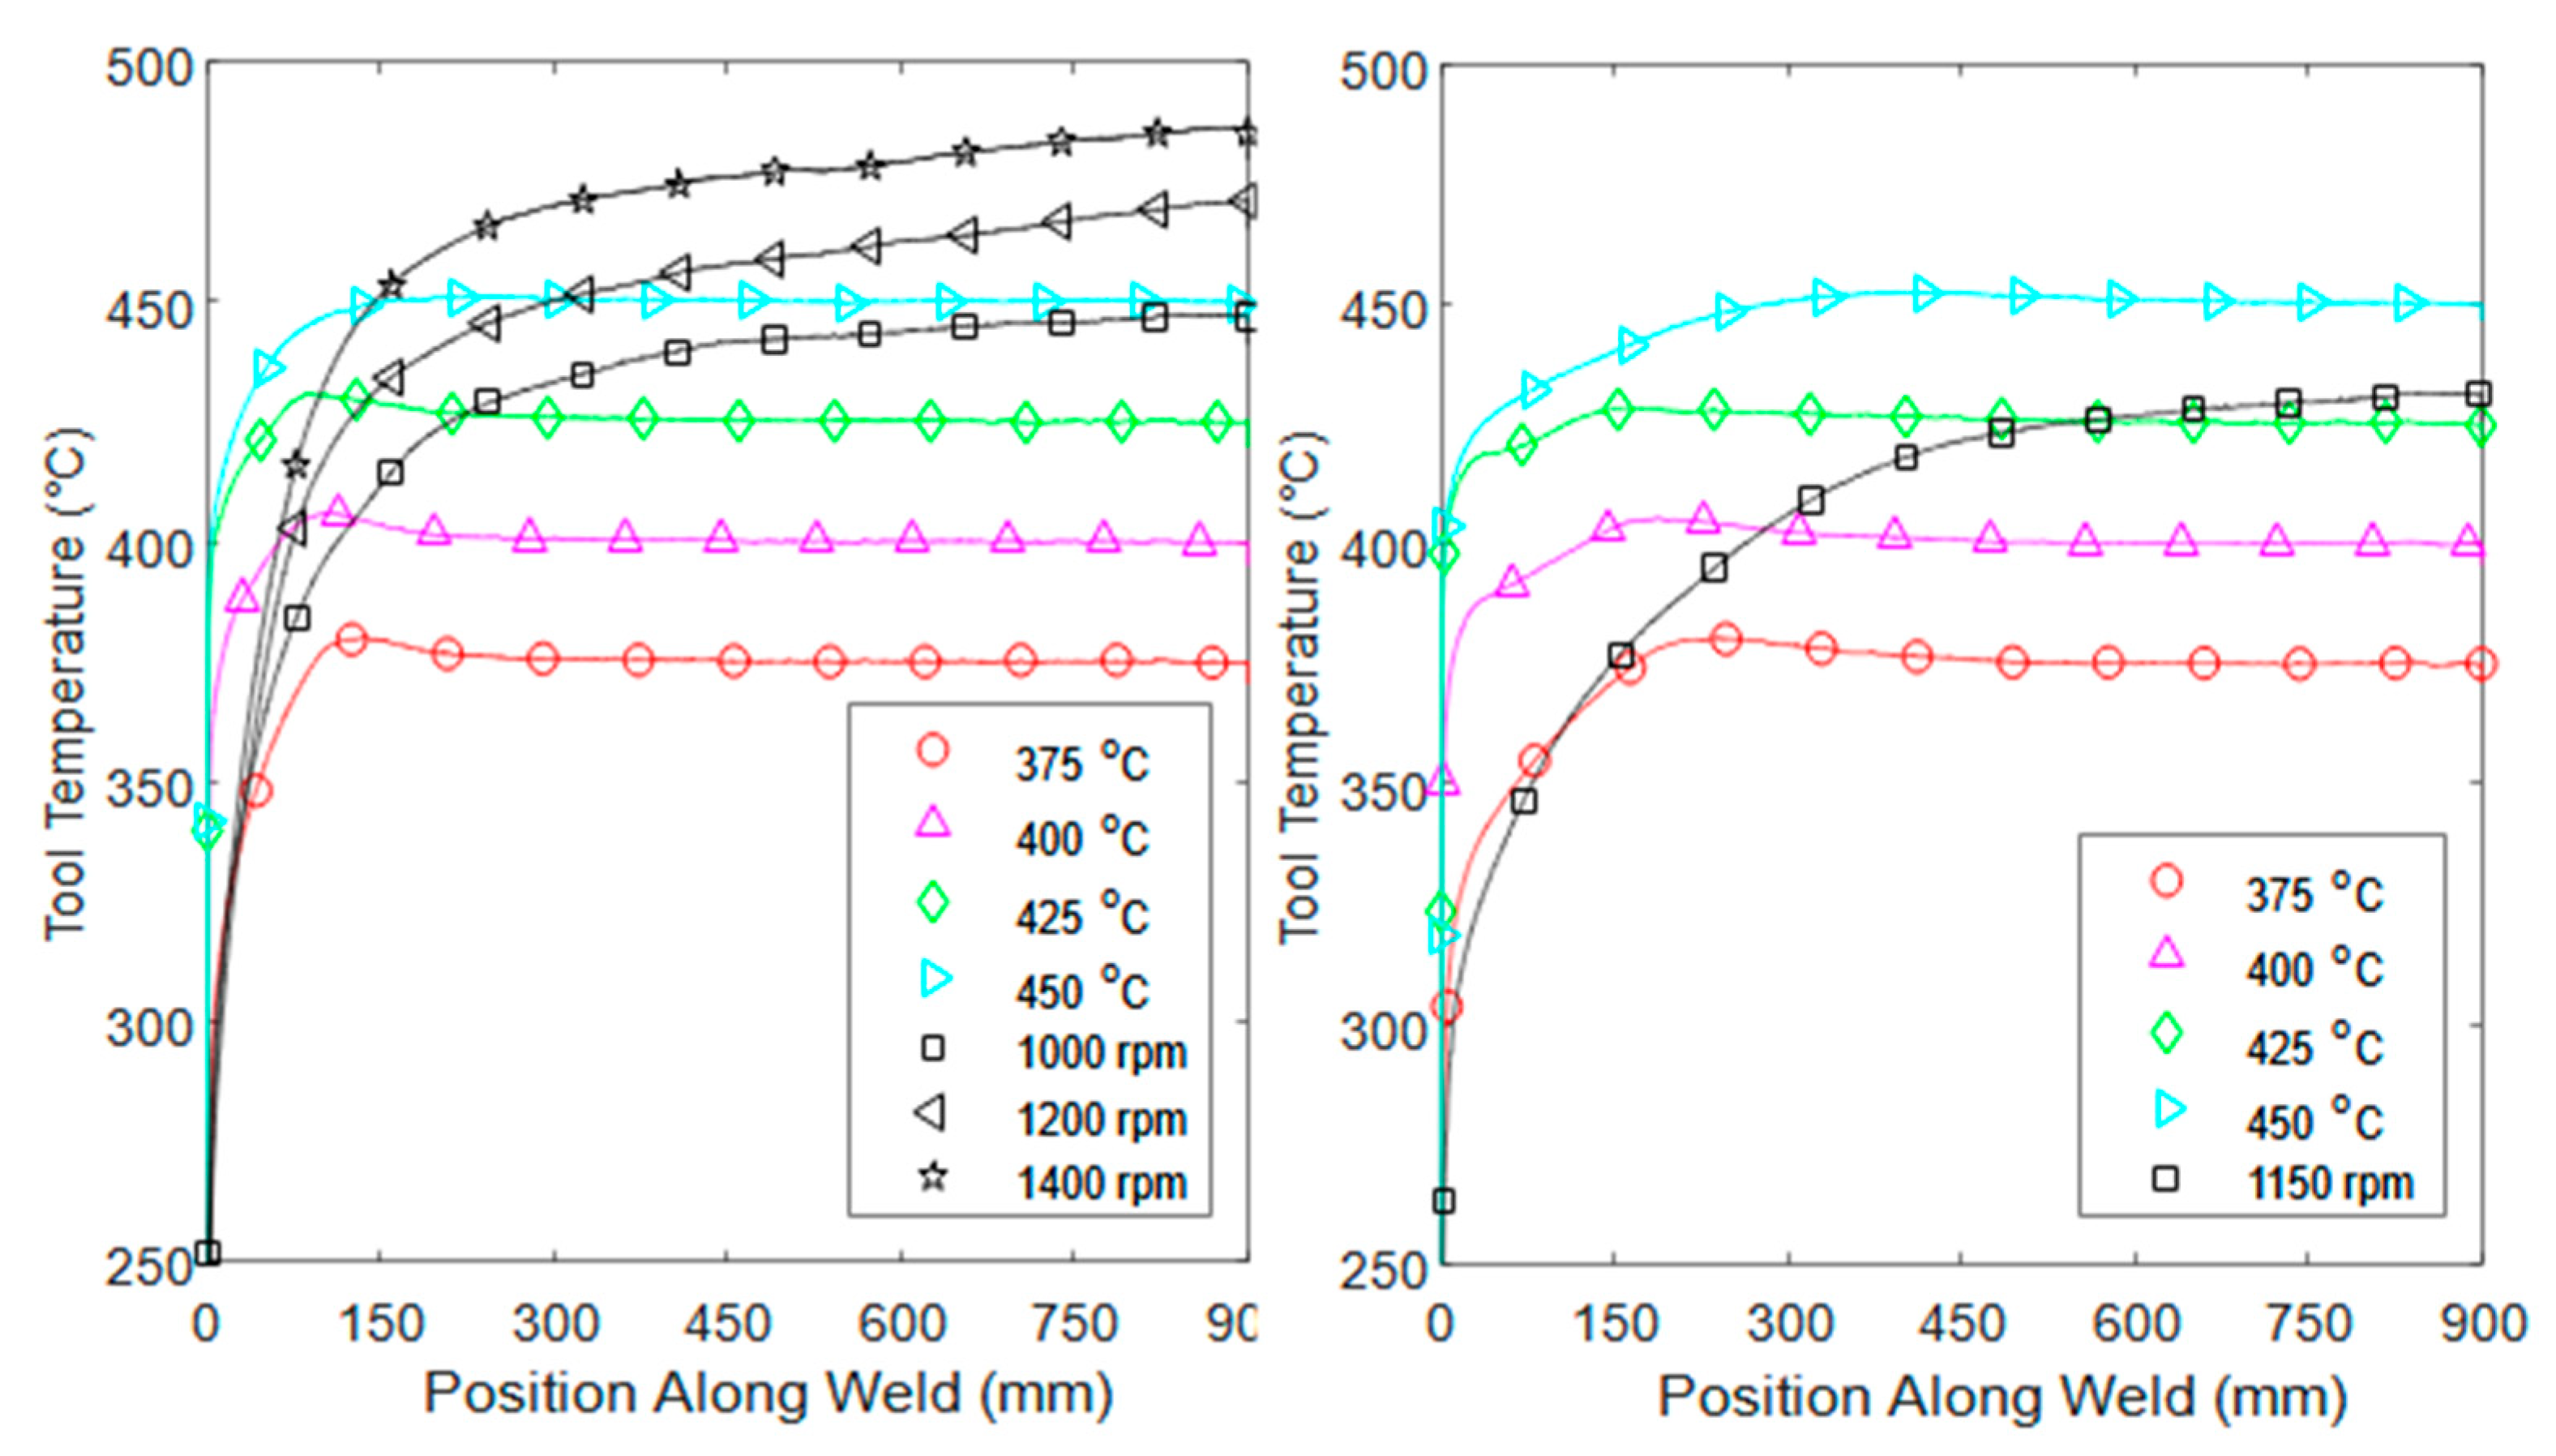
3.1. Temperature Results

Due to the nature of a weld, when the weld starts, it is the furthest it can possibly be from the control temperature, see Figure 7 and Figure 8. PID control thus pins the rpm at the highest allowable speed until the temperature starts to get close to the control temperature (set-point), at which point the rpm smoothly slows down to an equilibrium. The speed at which the temperature rises to the set-point, the maximum value of the temperature above the set-point, and the deviation of temperature at steady-state are all important variables in considering the performance of a temperature control method. It is difficult to compare the uncontrolled temperature response with the controlled response, due to the differences, but comparisons to other temperature control methods are possible. An earlier comparison of how single loop PID compares to more sophistic temperature control algorithms was previously presented [14].
Figure 9 shows the temperature response as a function of position along the weld in both the controlled and fixed-rpm welds. Note the difference in consistency—if 460 °C was a critical temperature, then only the 1000 rpm weld in the 1000 mmpm fixed-rpm series would have passed. Note, however, that the temperature experienced by the weld would still have varied over the length of the weld by more than 100 °C. The weld controlled at 450 °C, by contrast, was at 440 °C within the first 50 mm of traverse, and did not deviate by more than 10 °C from the set-point from that point forward. The variation in rotational velocity to achieve that control is shown in Figure 8.
The relative similarity of the temperature-controlled welds across the two feedrates should also be noted—identical set-point temperatures resulted in similar temperature responses. The discrepancies in the 2000 mmpm set during the beginning portion of the weld are due to the limitations of our machine. Due to issues with the spindle, it was limited to 1800 rpm at the time these welds were performed. With a higher max rpm, the machine would be better able to respond to the increased heating requirements at the higher feedrate. However, the fixed-rpm welds also displayed this issue, where the 1150 rpm/2000 mmpm weld actually reached a lower maximum temperature than the 1000 rpm/1000 mmpm weld, and had a slower temperature increase as well. Resolving this without control would call for a manually tuned, inflexible program with stepped rpm levels—perhaps 1800 for the first 100 mm of weld, then 1600 for the next 100 mm, etc. A properly tuned PID setup will accomplish this automatically, and in a flexible way, automatically accounting for slight variations between welds.

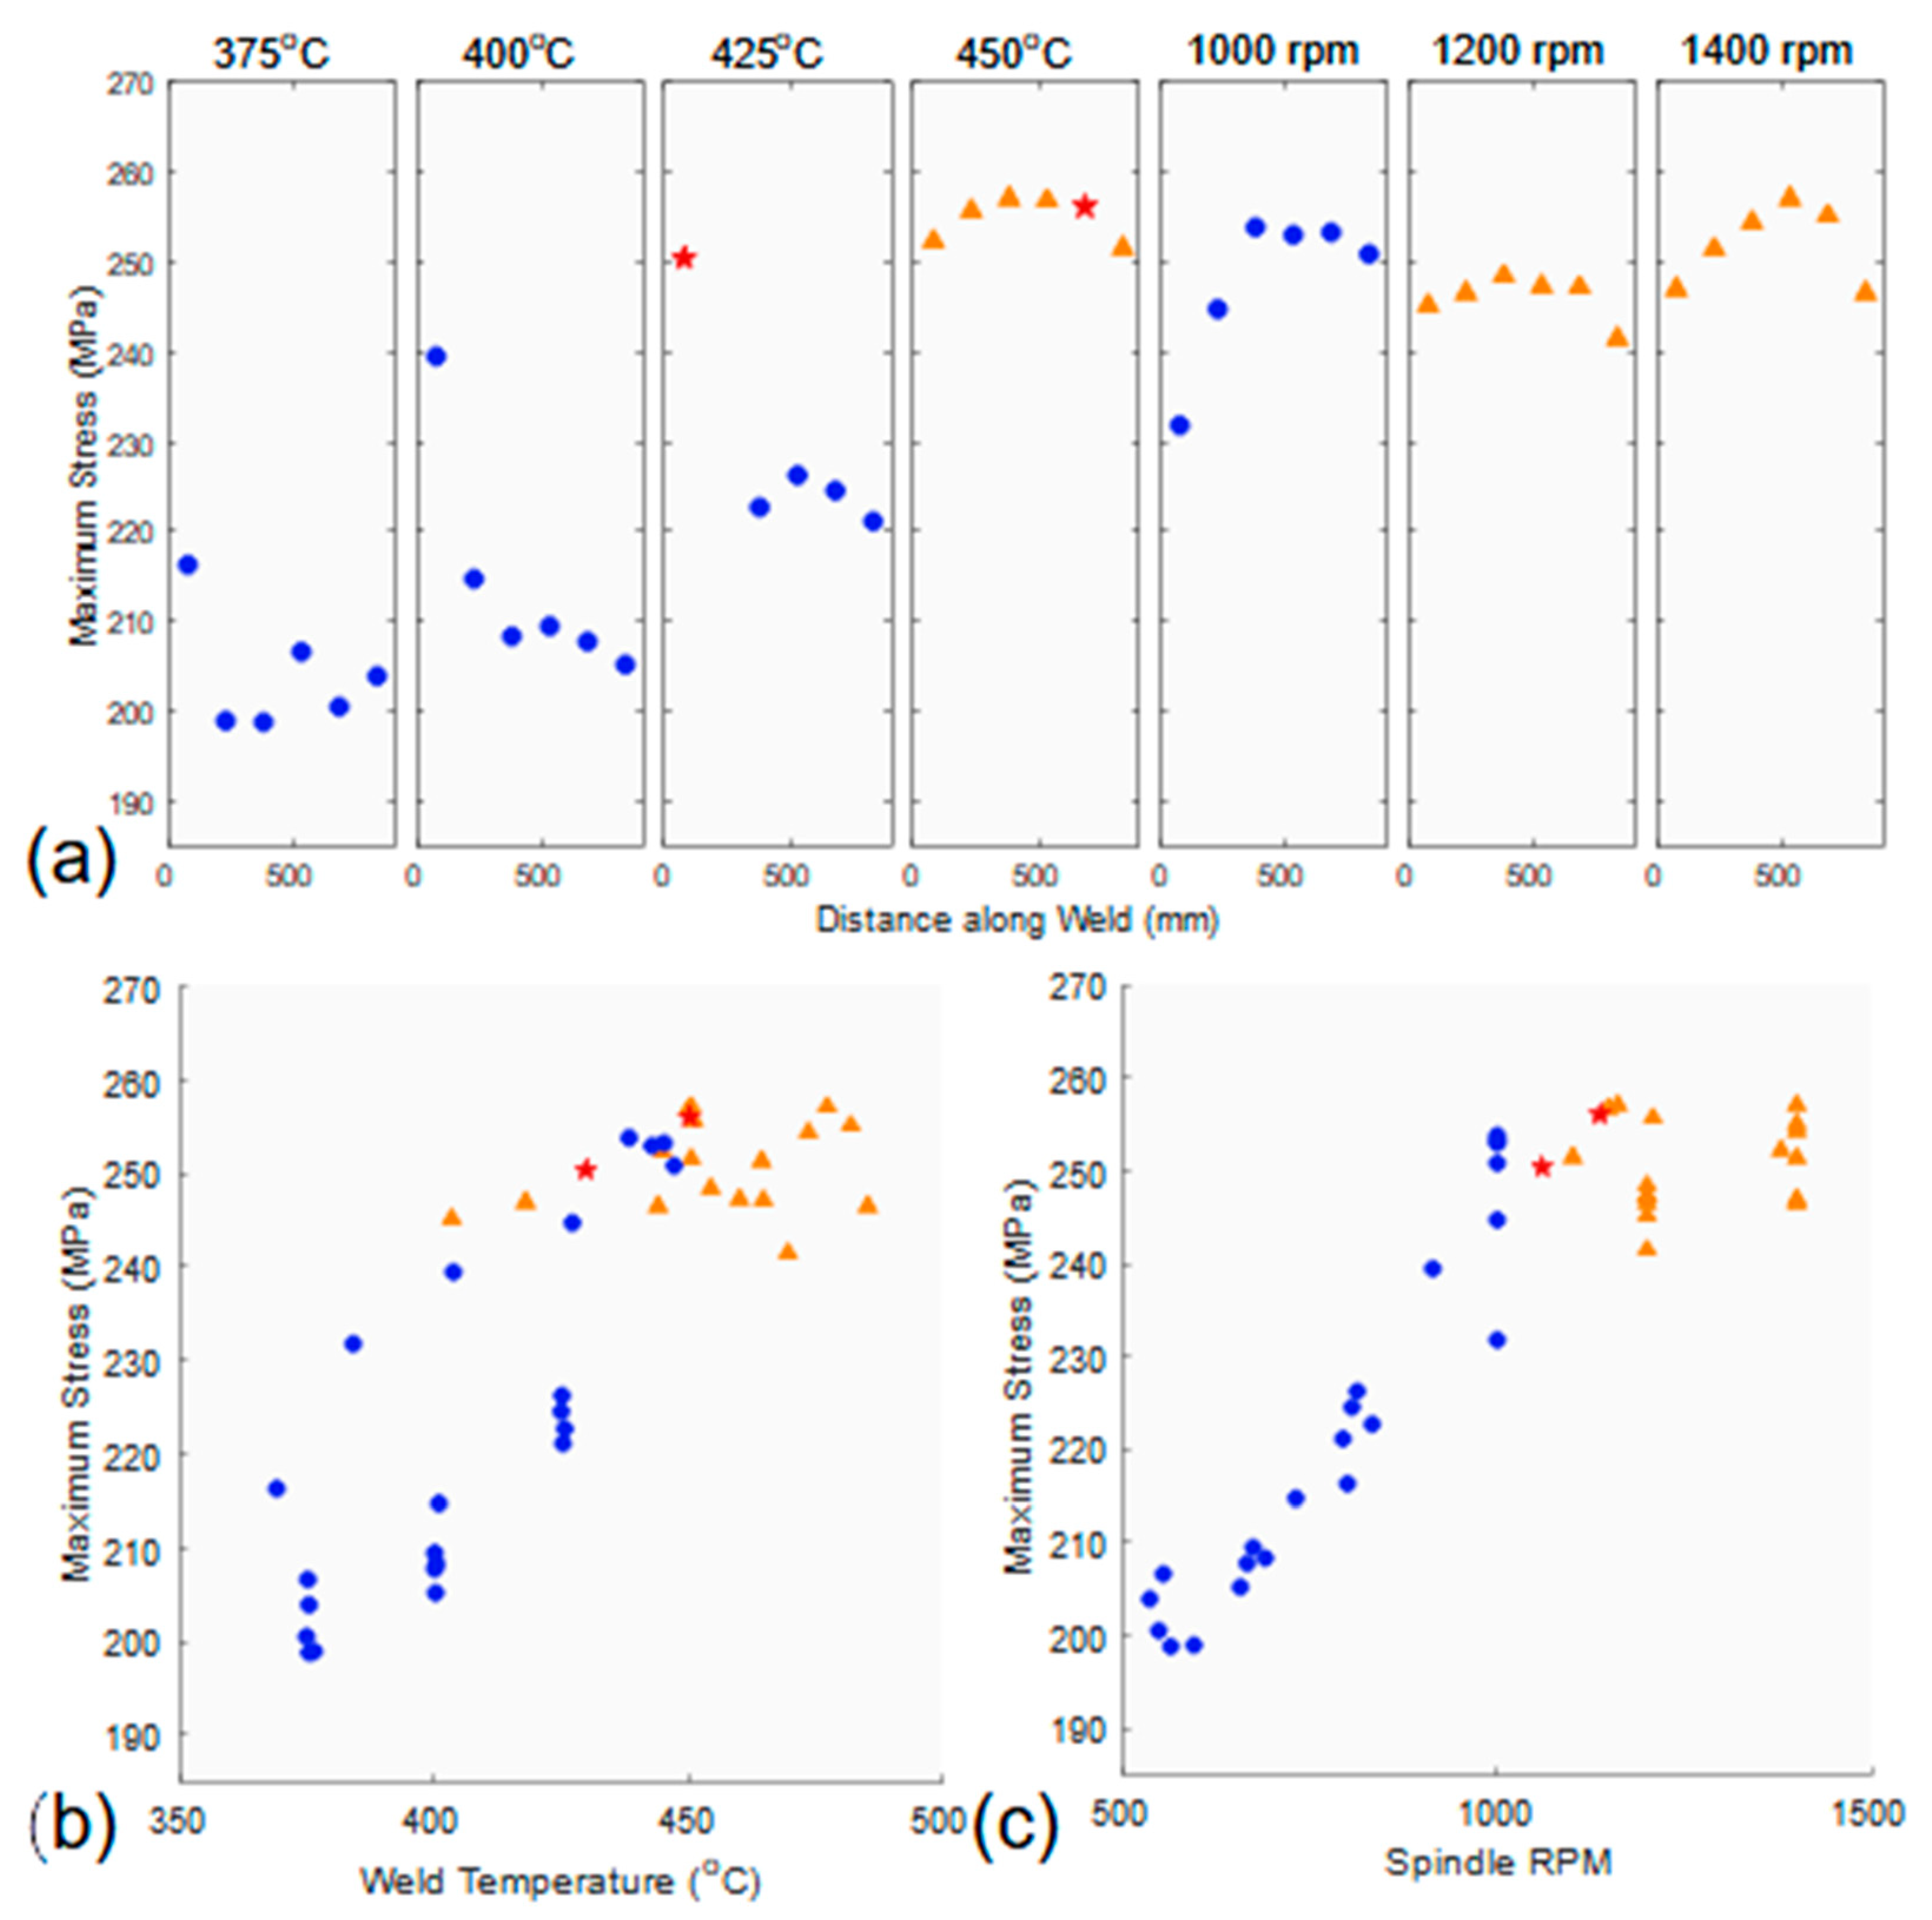
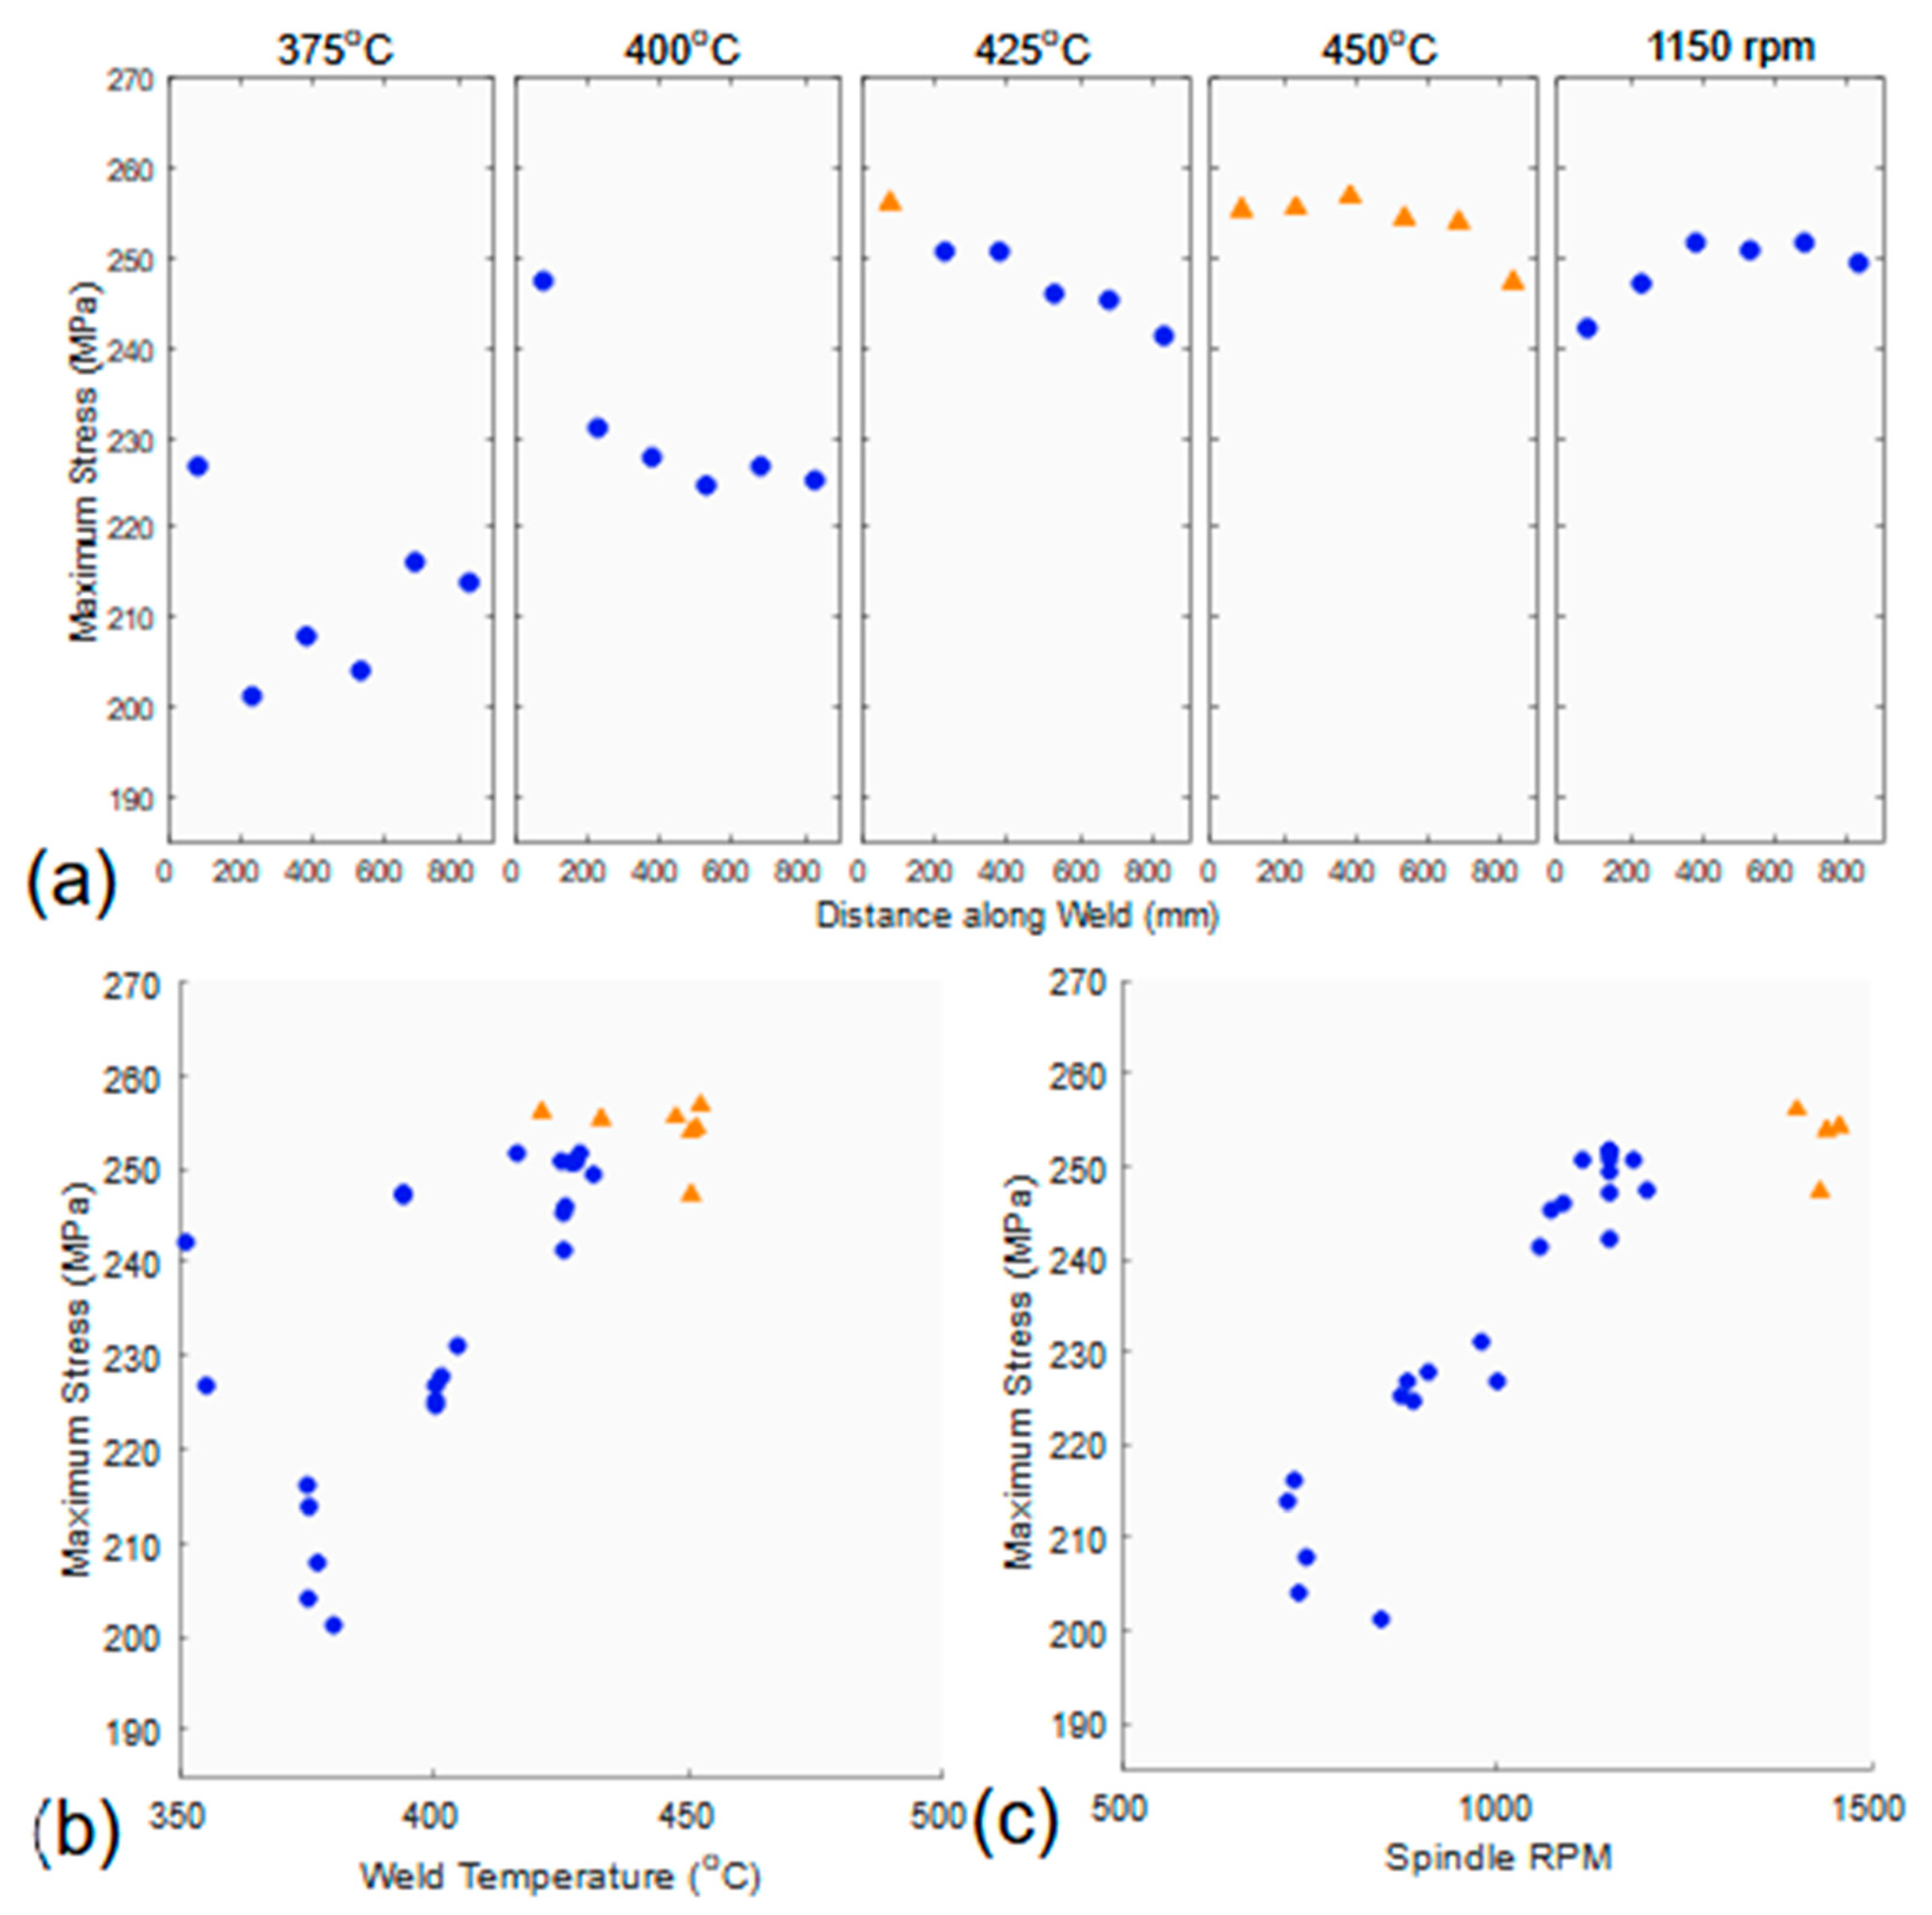
3.2. Weld Strength Results

Examining only the average UTS and the standard deviation of the six tensile specimens from each weld (Table 1), a few trends are apparent. First, the welds at the lowest set-point temperatures had the lowest strengths, but there was a slow rise in strength with set-point temperature, ending at the 450 °C temperature-controlled welds. These welds, in fact, are the best, with the highest average strength and also the lowest standard deviation among their respective feedrates, when examining statistics on the data as a function of weld position. The fixed-rpm welds, by comparison, have good strengths that are slightly below those of the 450 °C welds, but greater standard deviations, showing greater inconsistencies in weld properties along the welds. Overall, the welds ranged from 66 to 82% of the base material strength; however, the reported values for “fresh” 6111-T4 ranged from 250 to 285 MPa [20,21], meaning that most of the welds here could be considered 100% of the base “fresh” material strength.
However, looking only at the average strengths and standard deviations does not tell the whole story. Figure 10a and Figure 11a show how the welds’ strengths changed across the course of each weld. The 375–425 °C temperature-controlled welds start out with a spike of high strength, which quickly falls, while the strengths of the other welds are relatively constant. The temperature-controlled welds are characterized by a high initial rpm, which then slowly falls to reduce thermal input as the temperature approaches the set-point. Correlating the weld strengths with the spindle rpm reveals a strong positive correlation between the rpm and the resultant weld strength, as seen in Figure 10c and Figure 11c. There is also a transition point in the plot at around 1050 rpm for 1000 mmpm, and 1300 rpm for 2000 mmpm, where the strengths level off and the fracture modes change. This transition point can be seen in Figure 7 and Figure 8 as a dashed line at 1300 rpm. These figures show that the rotational velocity of welds at 2000 mmpm/425 °C dropped below the transition point, while welds controlled at 450 °C maintained rotational velocity above 1300 rpm throughout the entire weld. This is likely due to a minimum level of mixing needed to avoid a “lazy S” defect. Other researchers have found similar results in AA6061 [22], although at much lower feedrates.
By examining the fixed-rpm welds, it is also evident that maintaining a consistent rpm does not guarantee consistent weld strengths. The strengths still rise and then fall as the temperature of the weld increases (see Figure 9). This is also evident in Figure 10b and Figure 11b, where there is an upward trend of strength with respect to weld temperature. However, these plots do not show the same marked transition point from CL to HAZ fractures, which demonstrates that the minimum level of mixing must still take place for a successful bond.
Considering the relatively small sample sizes, an analysis for the difference in mean strength by Dunnett’s method of the 450 °C controlled weld in comparison to the fixed rpm welds results in p-values of 0.07, 0.02, and 0.63 for the 1000, 1200, and 1400 rpm welds, respectively, in the 1000 mmpm set. A similar analysis of the 2000 mmpm set, with the 450 °C weld as control in comparison to the 1150 rpm weld results in a p-value of 0.03. All statistical indicators are thus in agreement that the 450 °C controlled welds in general led to higher strengths than were achieved by the fixed-rpm method.

4. Conclusions

We examined one of the simplest methods of adding control—single-loop PID control of the spindle rpm based on the tool temperature—and demonstrated that it provides a tangible benefit in comparison to FSW with a fixed rpm when the linear weld rates are near industrial speeds (1000–2000 mmpm). This method of control is simple to implement on an existing FSW machine, as all it requires is existing digital control of spindle speed, a spare PID channel on the PLC, and a wireless thermocouple embedded in the tool.
This study elucidated the benefits of applying a temperature control strategy to industrial application of FSW, including greater consistency in weld strengths along the length of a weldment and improved weld fracture mechanisms, which ultimately demonstrated a consistent ability to fracture in the HAZ or outside the weld region all together. Furthermore, a thorough study of thermally controlled welds in comparison to fixed RPM welds revealed the existence of an apparent minimum RPM that influenced the fracture mechanisms regardless of the weld temperature. This minimum RPM threshold provides further understanding of process control for FSW, as it recognizes that while thermal control aids in reducing variation in FSWs there are still fundamentally minimum requirements for energy input that must be met to produce good welds. Based on the results of this study, we recommend an implementation of PID temperature control with a minimum rpm as a way to improve weld properties and consistency to the FSW industry.
These findings may also be of use in weld development, as the transition point in strength will likely remain at a similar temperature throughout the regimes of different weld feedrates, enabling simpler determination of suitable rpm ranges for production. This temperature may also be consistent across other heat-treatable aluminum alloys, but additional research is needed for that determination.

Author Contributions

Conceptualization, Y.H.; methodology, A.W.; validation, A.W.; formal analysis, A.W.; investigation, A.W. and T.R.M.; resources, Y.H.; writing—original draft preparation, A.W.; writing—review and editing, Y.H., A.W.; supervision, Y.H.; project administration, Y.H.; funding acquisition, Y.H. and T.R.M. All authors have read and agreed to the published version of the manuscript.

Funding

This work was supported by TWB Company, LLC through tooling and raw material, and by the Nuclear Regulatory Commission (NRC) [award number 31310019M0006].

Conflicts of Interest

The authors declare no conflict of interest.

References

  1. Smith, I.J.; Lord, D.D.R. FSW Patents—A Stirring Story. SAE Trans. 2007, 116, 772–780. [Google Scholar]
  2. Mishra, R.S.; Mahoney, M.W. Friction Stir Welding and Processing; ASM International: Materials Park, OH, USA, 2007; p. 360. [Google Scholar]
  3. NASA Marshall Space Flight Center (MSFC). Space Shuttle Technology Summary—Friction Stir Welding; NASA MSFC: Huntsville, AL, USA, 2001.
  4. Sanders, D.; Edwards, P.; Grant, G.; Ramulu, M.; Reynolds, A. Superplastically Formed Friction Stir Welded Tailored Aluminum and Titanium Blanks for Aerospace Applications. In Proceedings of the 6th EUROSPF Conference, Carcassonne, France, 3–5 September 2008. [Google Scholar]
  5. Hoyos, E.; Escobar, S.; De Backer, J.; Martin, J.; Palacio, M. Manufacturing Concept and Prototype for Train Component Using the FSW Process. J. Manuf. Mater. Process. 2021, 5, 19. [Google Scholar] [CrossRef]
  6. Hovanski, Y.; Upadhyay, P.; Carlson, B.; Szymanski, R.; Luzanski, T.; Marshall, D. FSW of Aluminum Tailor Welded Blanks Across Machine Platforms. In Friction Stir Welding and Processing VIII; Springer International Publishing: Cham, Switzerland, 2015; pp. 99–105. [Google Scholar]
  7. Bachmann, A.; Gamper, J.; Krutzlinger, M.; Zens, A.; Zaeh, M.F. Adaptive model-based temperature control in friction stir welding. Int. J. Adv. Manuf. Technol. 2017, 93, 1157–1171. [Google Scholar] [CrossRef]
  8. Cederqvist, L.; Garpinger, O.; Hagglund, T.; Robertsson, A. Cascaded control of power input and welding temperature during sealing of spent nuclear fuel canisters. In Proceedings of the ASME Dynamic Systems and Control Conference (DSCC), Cambridge, MA, USA, 12–15 September 2010; pp. 453–460. [Google Scholar]
  9. Silva-Magalhães, A.; Cederqvist, L.; De Backer, J.; Håkansson, E.; Ossiansson, B.; Bolmsjö, G. A Friction Stir Welding case study using Temperature Controlled Robotics with a HPDC Cylinder Block and dissimilar materials joining. J. Manuf. Process. 2019, 46, 177–184. [Google Scholar] [CrossRef]
  10. Busu, N.A.; Jaffarullah, M.S.; Low, C.Y.; Shaari, M.S.B.; Armansyah; Jaffar, A. A Review of Force Control Techniques in Friction Stir Process. Procedia Comput. Sci. 2015, 76, 528–533. [Google Scholar] [CrossRef] [Green Version]
  11. Cederqvist, L.; Johansson, R.; Robertsson, A.; Bolmsjo, G. Faster temperature response and repeatable power input to aid automatic control of friction stir welded copper canisters. In Proceedings of the Friction Stir Welding and Processing V—TMS Annual Meeting & Exhibition, San Francisco, CA, USA, 15–19 February 2009; pp. 39–43. [Google Scholar]
  12. Cederqvist, L.; Reynolds, A.P.; Sorensen, C.D.; Garpinger, O. Reliable FSW of Copper Canisters Using Improved Process and Regulator Controlling Power Input and Tool Temperature. In Proceedings of the 8th International Symposium on Friction Stir Welding, Timmendorfer Strand, Germany, 18–20 May 2010; pp. 934–943. [Google Scholar]
  13. Fehrenbacher, A.; Duffie, N.A.; Ferrier, N.J.; Zinn, M.R.; Pfefferkorn, F.E. Temperature Measurement and Closed-loop Control in Friction Stir Welding. In Proceedings of the 8th International Symposium on Friction Stir Welding, Timmendorfer Strand, Germany, 18–20 May 2010; pp. 943–962. [Google Scholar]
  14. Wright, A.; Smith, D.; Taysom, B.; Hovanski, Y. Transitioning FSW to a Controlled Production Process; Springer International Publishing: Cham, Switzerland; pp. 91–104.
  15. Ross, K.; Sorensen, C. Advances in Temperature Control for FSP. In Friction Stir Welding and Processing VII; Mishra, R., Mahoney, M.W., Sato, Y., Hovanski, Y., Verma, R., Eds.; Springer International Publishing: Cham, Switzerland, 2013; pp. 301–310. [Google Scholar]
  16. Ross, K.A. Investigation and Implementation of a Robust Temperature Control Algorithm for Friction Stir Welding; Brigham Young University: Provo, UT, USA, 2012. [Google Scholar]
  17. Taysom, B.S.; Sorensen, C.D. Advances in Signal Processing for Friction Stir Welding Temperature Control. In Friction Stir Welding and Processing X; Springer International Publishing: Cham, Switzerland, 2019; pp. 135–147. [Google Scholar]
  18. Taysom, B.S.; Sorensen, C.D. Adaptive relay autotuning under static and non-static disturbances with application to friction stir welding. ISA Trans. 2020, 97, 474–484. [Google Scholar] [CrossRef] [PubMed]
  19. Albannai, A. Review The Common Defects In Friction Stir Welding. Int. J. Sci. Technol. Res. 2020, 9, 318–329. [Google Scholar]
  20. Kaufman, J.G. Properties and Applications of Wrought Aluminum Alloys. In ASM Handbook 2B, Properties and Selection of Aluminum Alloys; Anderson, K., Weritz, J., Kaufman, J.G., Eds.; ASM International: Materials Park, OH, USA, 2019; pp. 202–275. [Google Scholar]
  21. Anderson, K.; Weritz, J.; Kaufman, J.G. (Eds.) Nominal Compositions and Composition Limits for Wrought Aluminum Alloys. In ASM Handbook 2B, Properties and Selection of Aluminum Alloys; ASM International: Materials Park, OH, USA, 2019; pp. 606–611. [Google Scholar]
  22. Choi, W.; Morrow, J.D.; Pfefferkorn, F.E.; Zinn, M.R. Welding parameter maps to help select power and energy consumption of friction stir welding. J. Manuf. Process. 2018, 33, 35–42. [Google Scholar] [CrossRef]
Figure 1. Diagram of the friction stir welding processing showing a rotating tool translating down the interface of two abutting plates.
Jmmp 05 00124 g001
Figure 2. Schematic of thermocouple placement in tool (left) and actual tool (right).
Jmmp 05 00124 g002
Figure 3. Graphical representation of the PID control implementation.
Jmmp 05 00124 g003
Figure 4. Typical tuning weld using the auto-tuner. A stable state was reached at around 450 mm, and roughly 20 cycles of +/− 10% rpm were able to be completed, far exceeding the minimum of 5 cycles.
Jmmp 05 00124 g004
Figure 5. (a) Image of weld setup, showing weldpiece and clamping, etc. (b) Dimensions of tensile specimen. (c) Illustration of tensile specimen locations in relation to the weld. First tensile specimen is centered at 85 mm into the weld, with each subsequent specimen spaced 150 mm from the previous.
Jmmp 05 00124 g005
Figure 6. Examples of the three classes of fracture modes. At the top is a Weld Centerline (CL) break, showing an incomplete weld; in the center is a HAZ break, revealing a complete weld; and at the bottom is the “best” fracture mode: a break outside the weld. This same designation is used throughout this work.
Jmmp 05 00124 g006
Figure 7. Plot depicting the variation of rotational velocity (blue) to achieve a temperature (red) of 425 °C. Threshold for rotational velocity to achieve acceptable fracture is shown with a dashed line at 1300 RPM.
Jmmp 05 00124 g007
Figure 8. Plot depicting the variation of rotational velocity (blue) to achieve a temperature (red) of 450 °C. Threshold for rotational velocity to achieve acceptable fracture is shown with a dashed line at 1300 RPM.
Jmmp 05 00124 g008
Figure 9. Temperature-controlled response for each weld at 1000 mmpm (left) and 2000 mmpm (right). The welds are labeled according to the control method: either the set-point temperature for the temperature-controlled welds, or the value of the fixed rpm for the uncontrolled welds. Markers are for convenience in curve identification, the true sampling rate was 64 Hz.
Jmmp 05 00124 g009
Figure 10. Effect of weld position, spindle rpm, and weld temperature for the 1000 mmpm welds. (a) Weld strengths as a function of tensile specimen location, as shown in Figure 5. The distinguishing parameters of each weld (temperature-controlled or fixed-rpm) are listed along the top. (b) Weld strengths as a function of the tool temperature experienced by the tensile specimen location during welding. (c) Weld strengths as a function of the spindle rpm at the tensile specimen location. For all, marker types are as given in Figure 6: circle—CL, triangle—HAZ, star—OW. Experimental error for tensile values is ±2.0 MPa.
Jmmp 05 00124 g010
Figure 11. Effect of weld position, spindle rpm, and weld temperature for the 2000 mmpm welds. (a) Weld strengths as a function of tensile specimen location, as shown in Figure 5. The distinguishing parameters of each weld (temperature-controlled or fixed-rpm) are listed along the top. (b) Weld strengths as a function of the tool temperature experienced by the tensile specimen location during welding. (c) Weld strengths as a function of the spindle rpm at the tensile specimen location. For all, marker types are as given in Figure 6: circle—CL, triangle—HAZ, star—OW. Experimental error for tensile values is ±2.0 MPa.
Jmmp 05 00124 g011
Table 1. Summary of tensile results by weld.
1000 mmpm WeldsMean UTS (MPa)Std. Dev (MPa)
375 °C204.26.7
400 °C214.112.8
425 °C230.111.2
450 °C254.92.4
1000 rpm247.98.6
1200 rpm246.02.5
1400 rpm251.94.4
2000 mmpm weldsMean UTS (MPa)Std. Dev (MPa)
375 °C211.79.3
400 °C230.58.6
425 °C248.35.2
450 °C253.93.4
1150 rpm248.83.7
Publisher’s Note: MDPI stays neutral with regard to jurisdictional claims in published maps and institutional affiliations.

