
Transfer and Optimisation of Injection Moulding Manufacture of Medical Devices Using Scientific Moulding Principles


Abstract
:1. Introduction
- Maximising the mould opening and closing speeds aid in reducing the cycle time. This is considered during machine selection. The opening and closing speeds are affected by slide complexity and tool size so should be a priority when setting up the moulds [4].
- Injection time can be incrementally reduced by minimizing the part thickness. Less material will need to be injected and therefore will reduce cycle time. Reducing the wall thickness can also positively affect the cooling time [8].
- Material selection is often overlooked when attempting to optimize the injection moulding cycle time. Some materials will require higher flow rates or higher injection pressures. This means the material will enter the mould and fill the cavities faster than other materials leading to a shorter cycle time [8].
- The mould tooling is a huge factor when it comes to the cooling time. A properly designed mould tool will cater for effective supply or cooling water and air. Well-maintained and clean cooling channels will ensure parts are cooled quickly and consistently [8]. As the cooling time is the longest stage of the injection moulding cycle, often representing greater than 70% of the total cycle, it is vital mould tooling is properly designed and maintained [9].
2. Materials and Methods
2.1. Materials
2.2. Injection Moulding
2.3. Methods
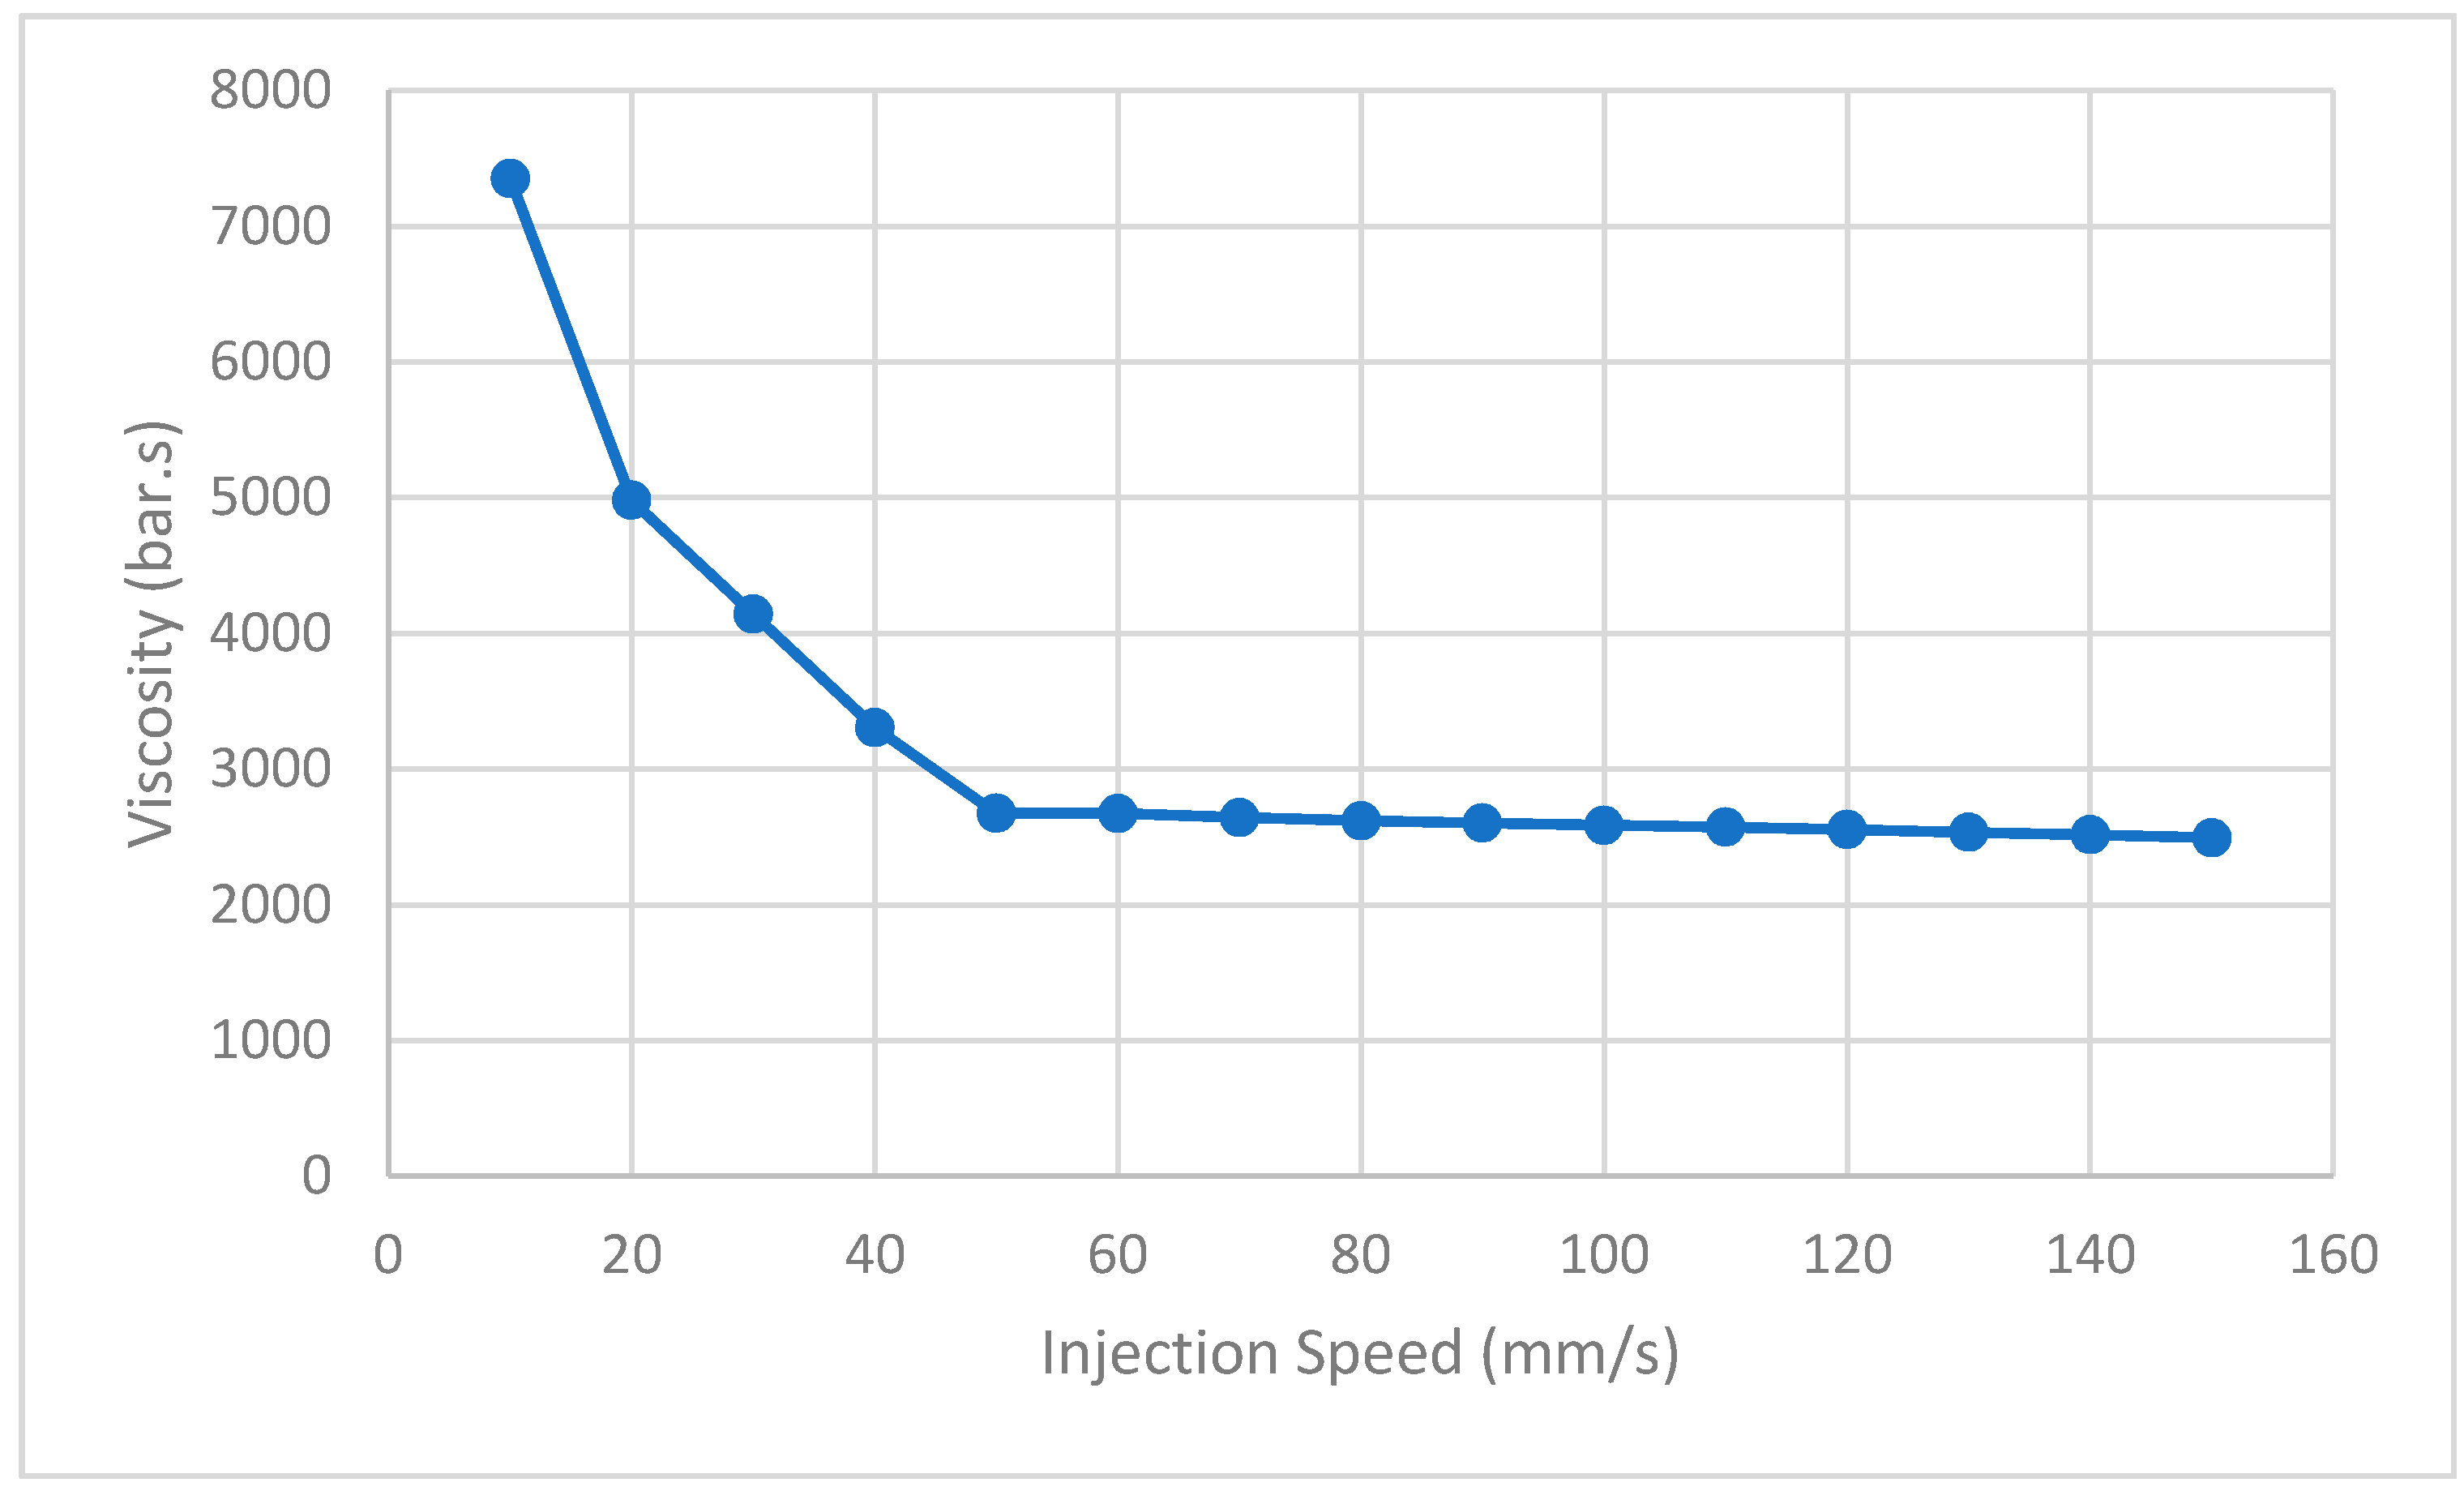
2.3.1. Rheology
2.3.2. Cavity Balance
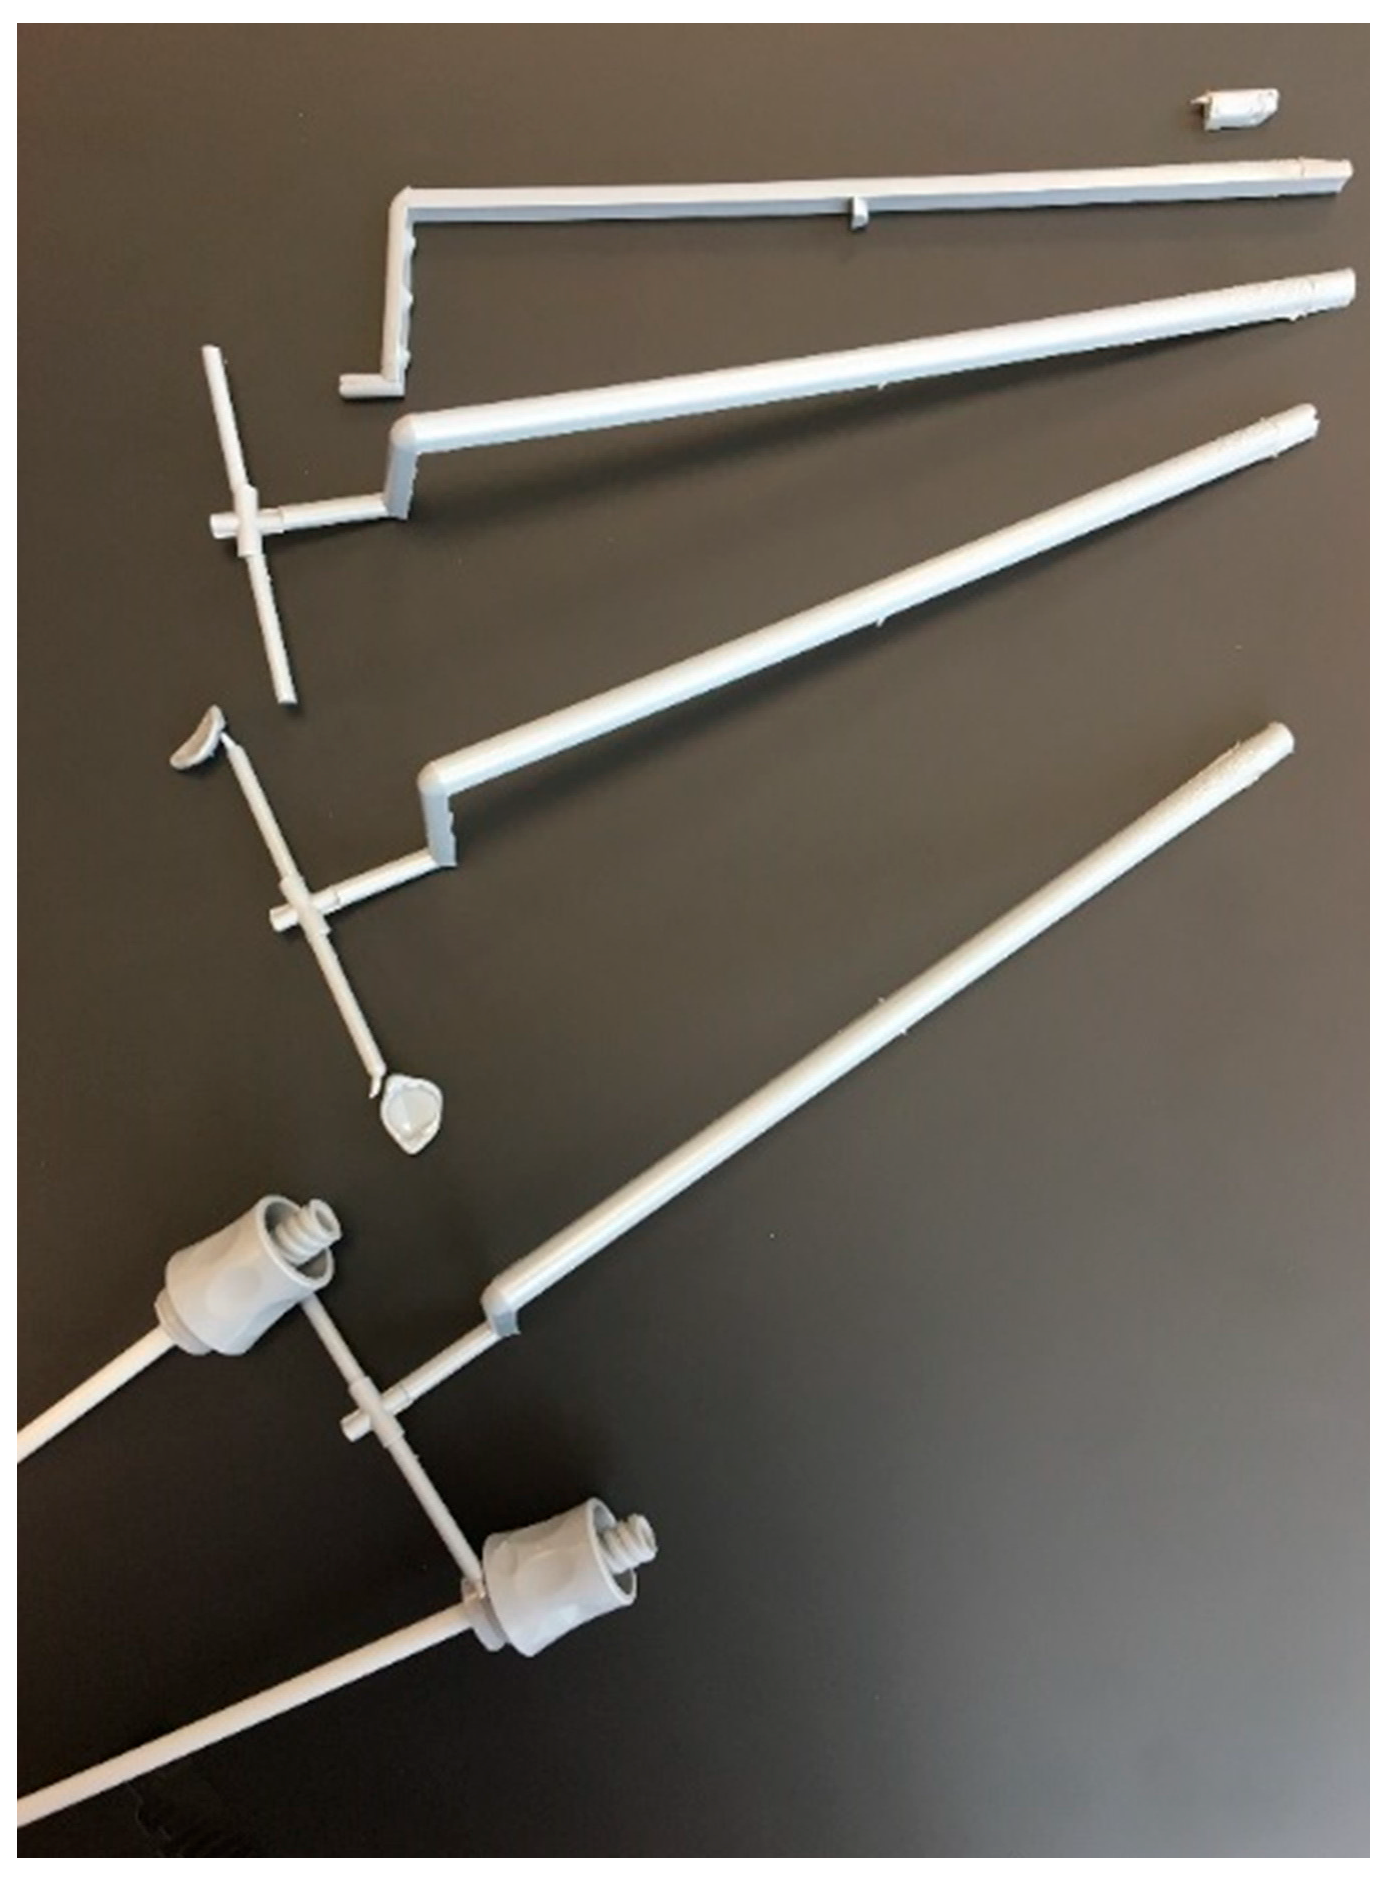
2.3.3. Pressure Drop
- Nozzle of the machine
- Sprue
- Primary runner
- Secondary runner
- Gate
- End of Fill
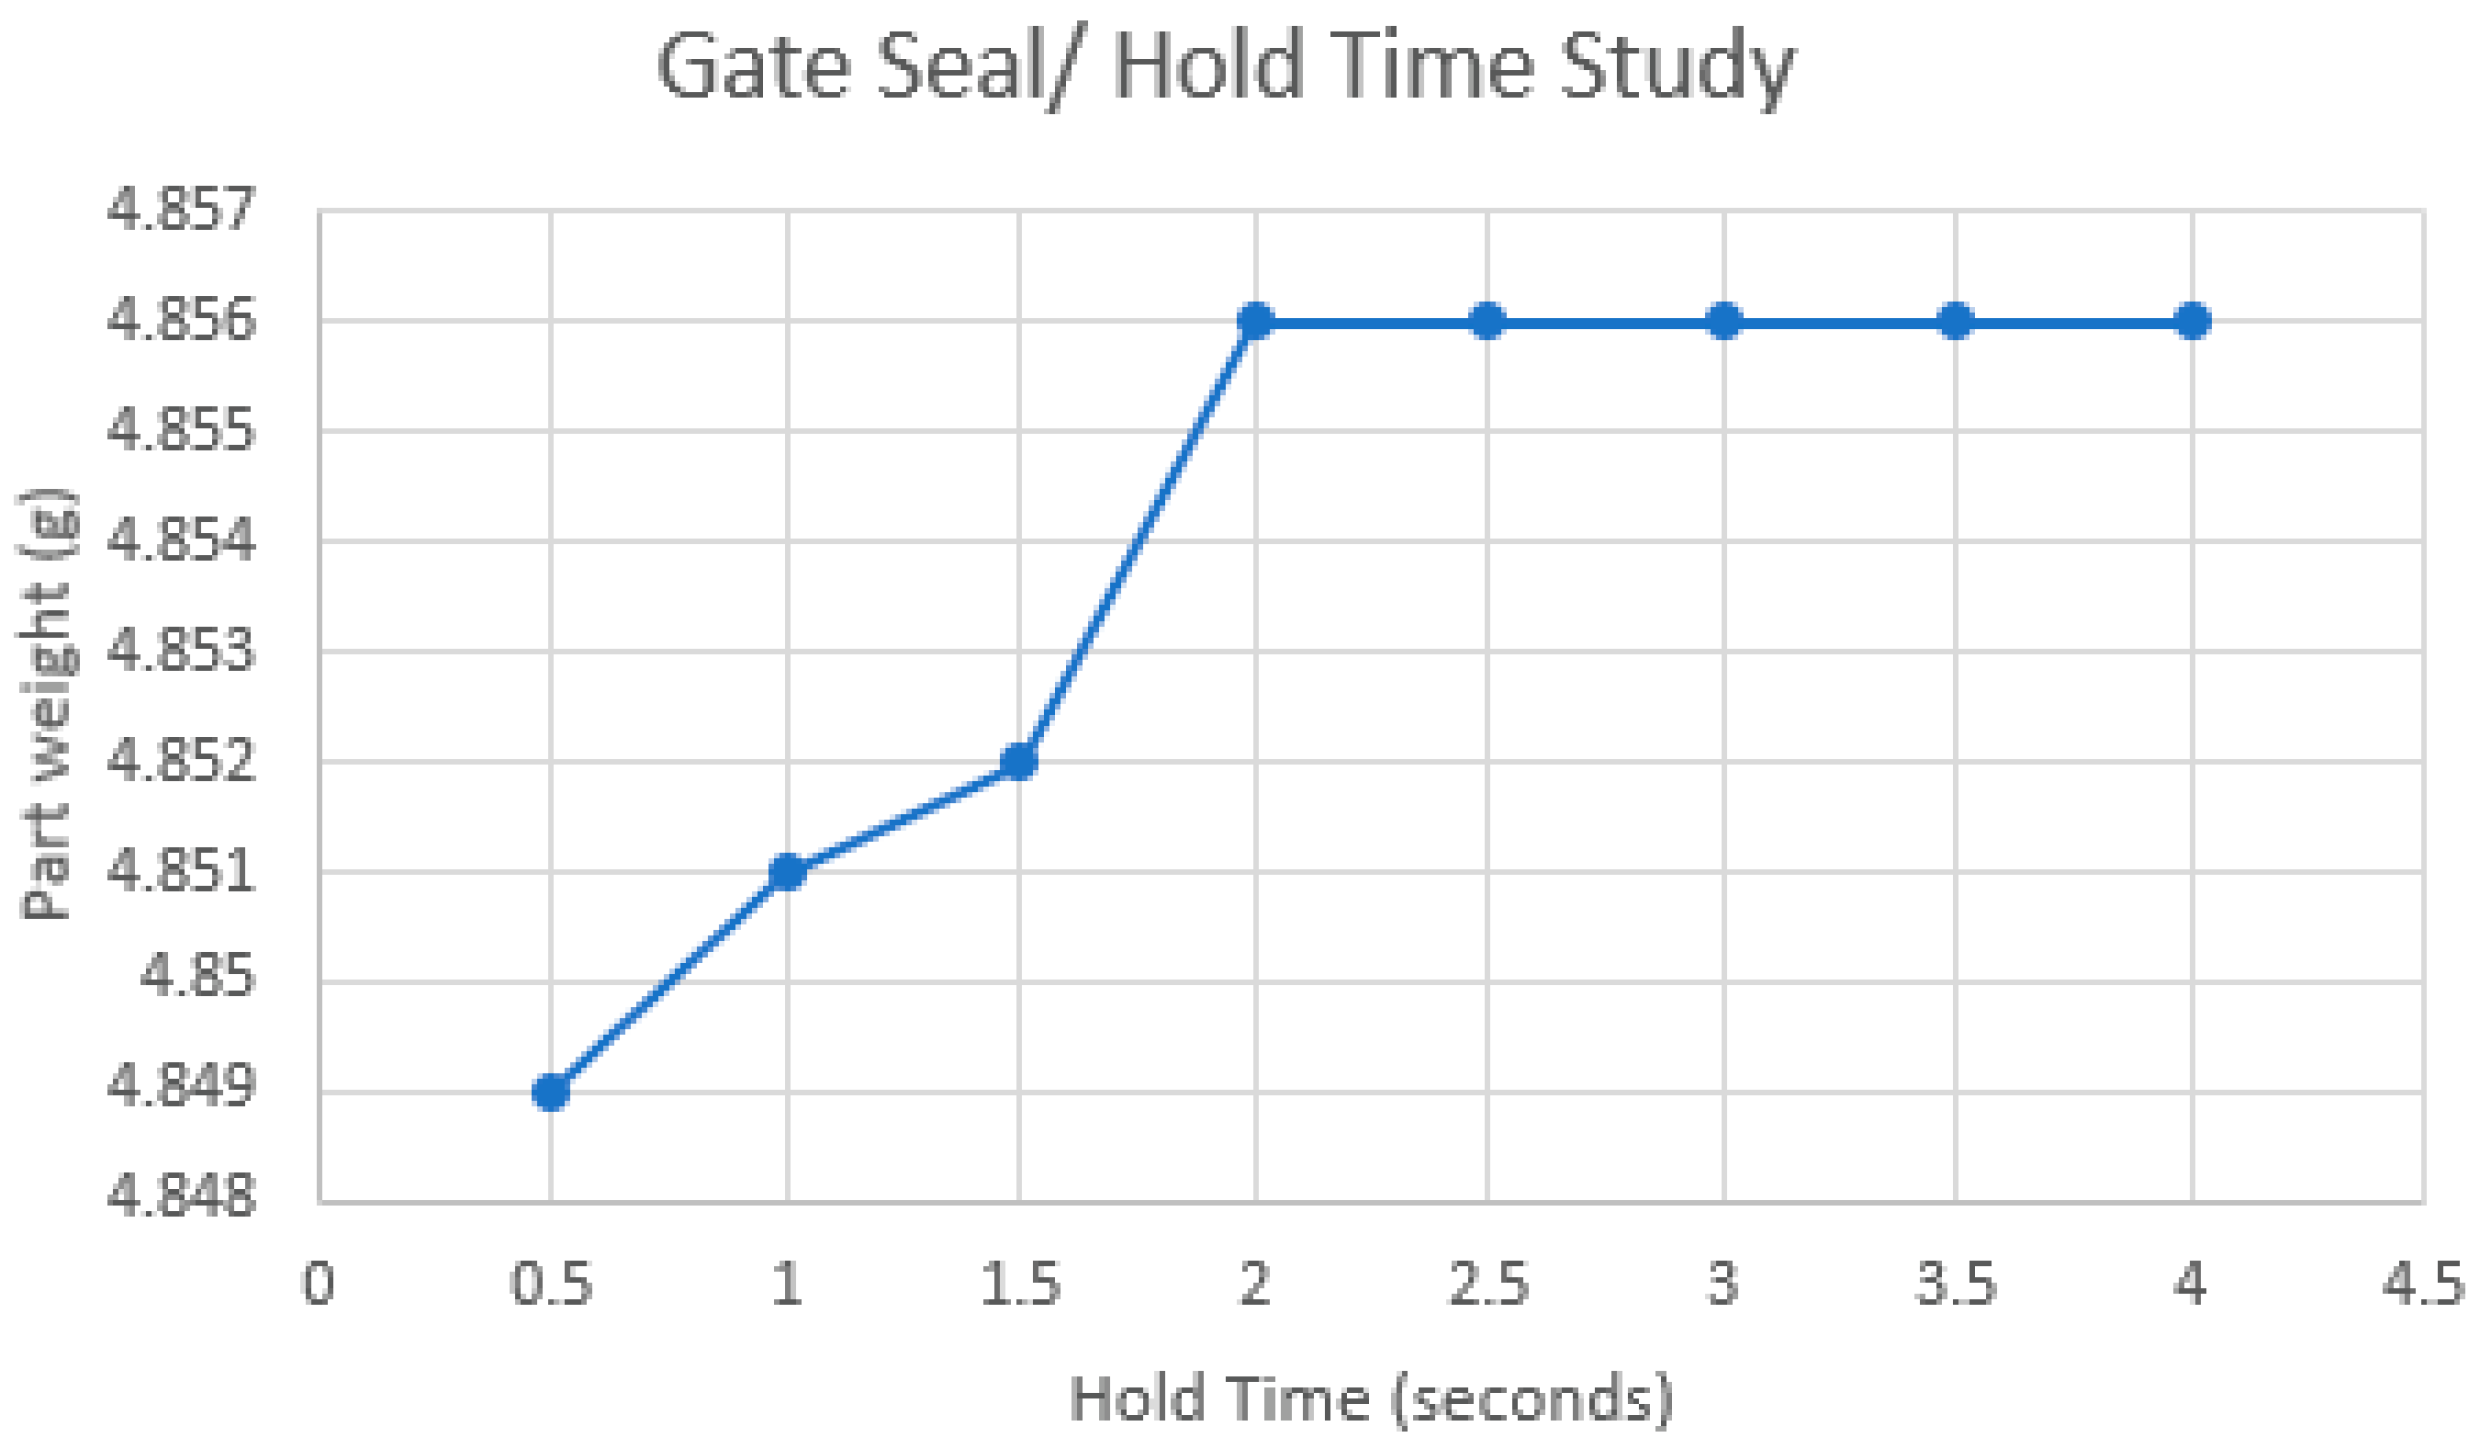
2.3.4. Gate Seal Study
2.3.5. Hold Pressure Study
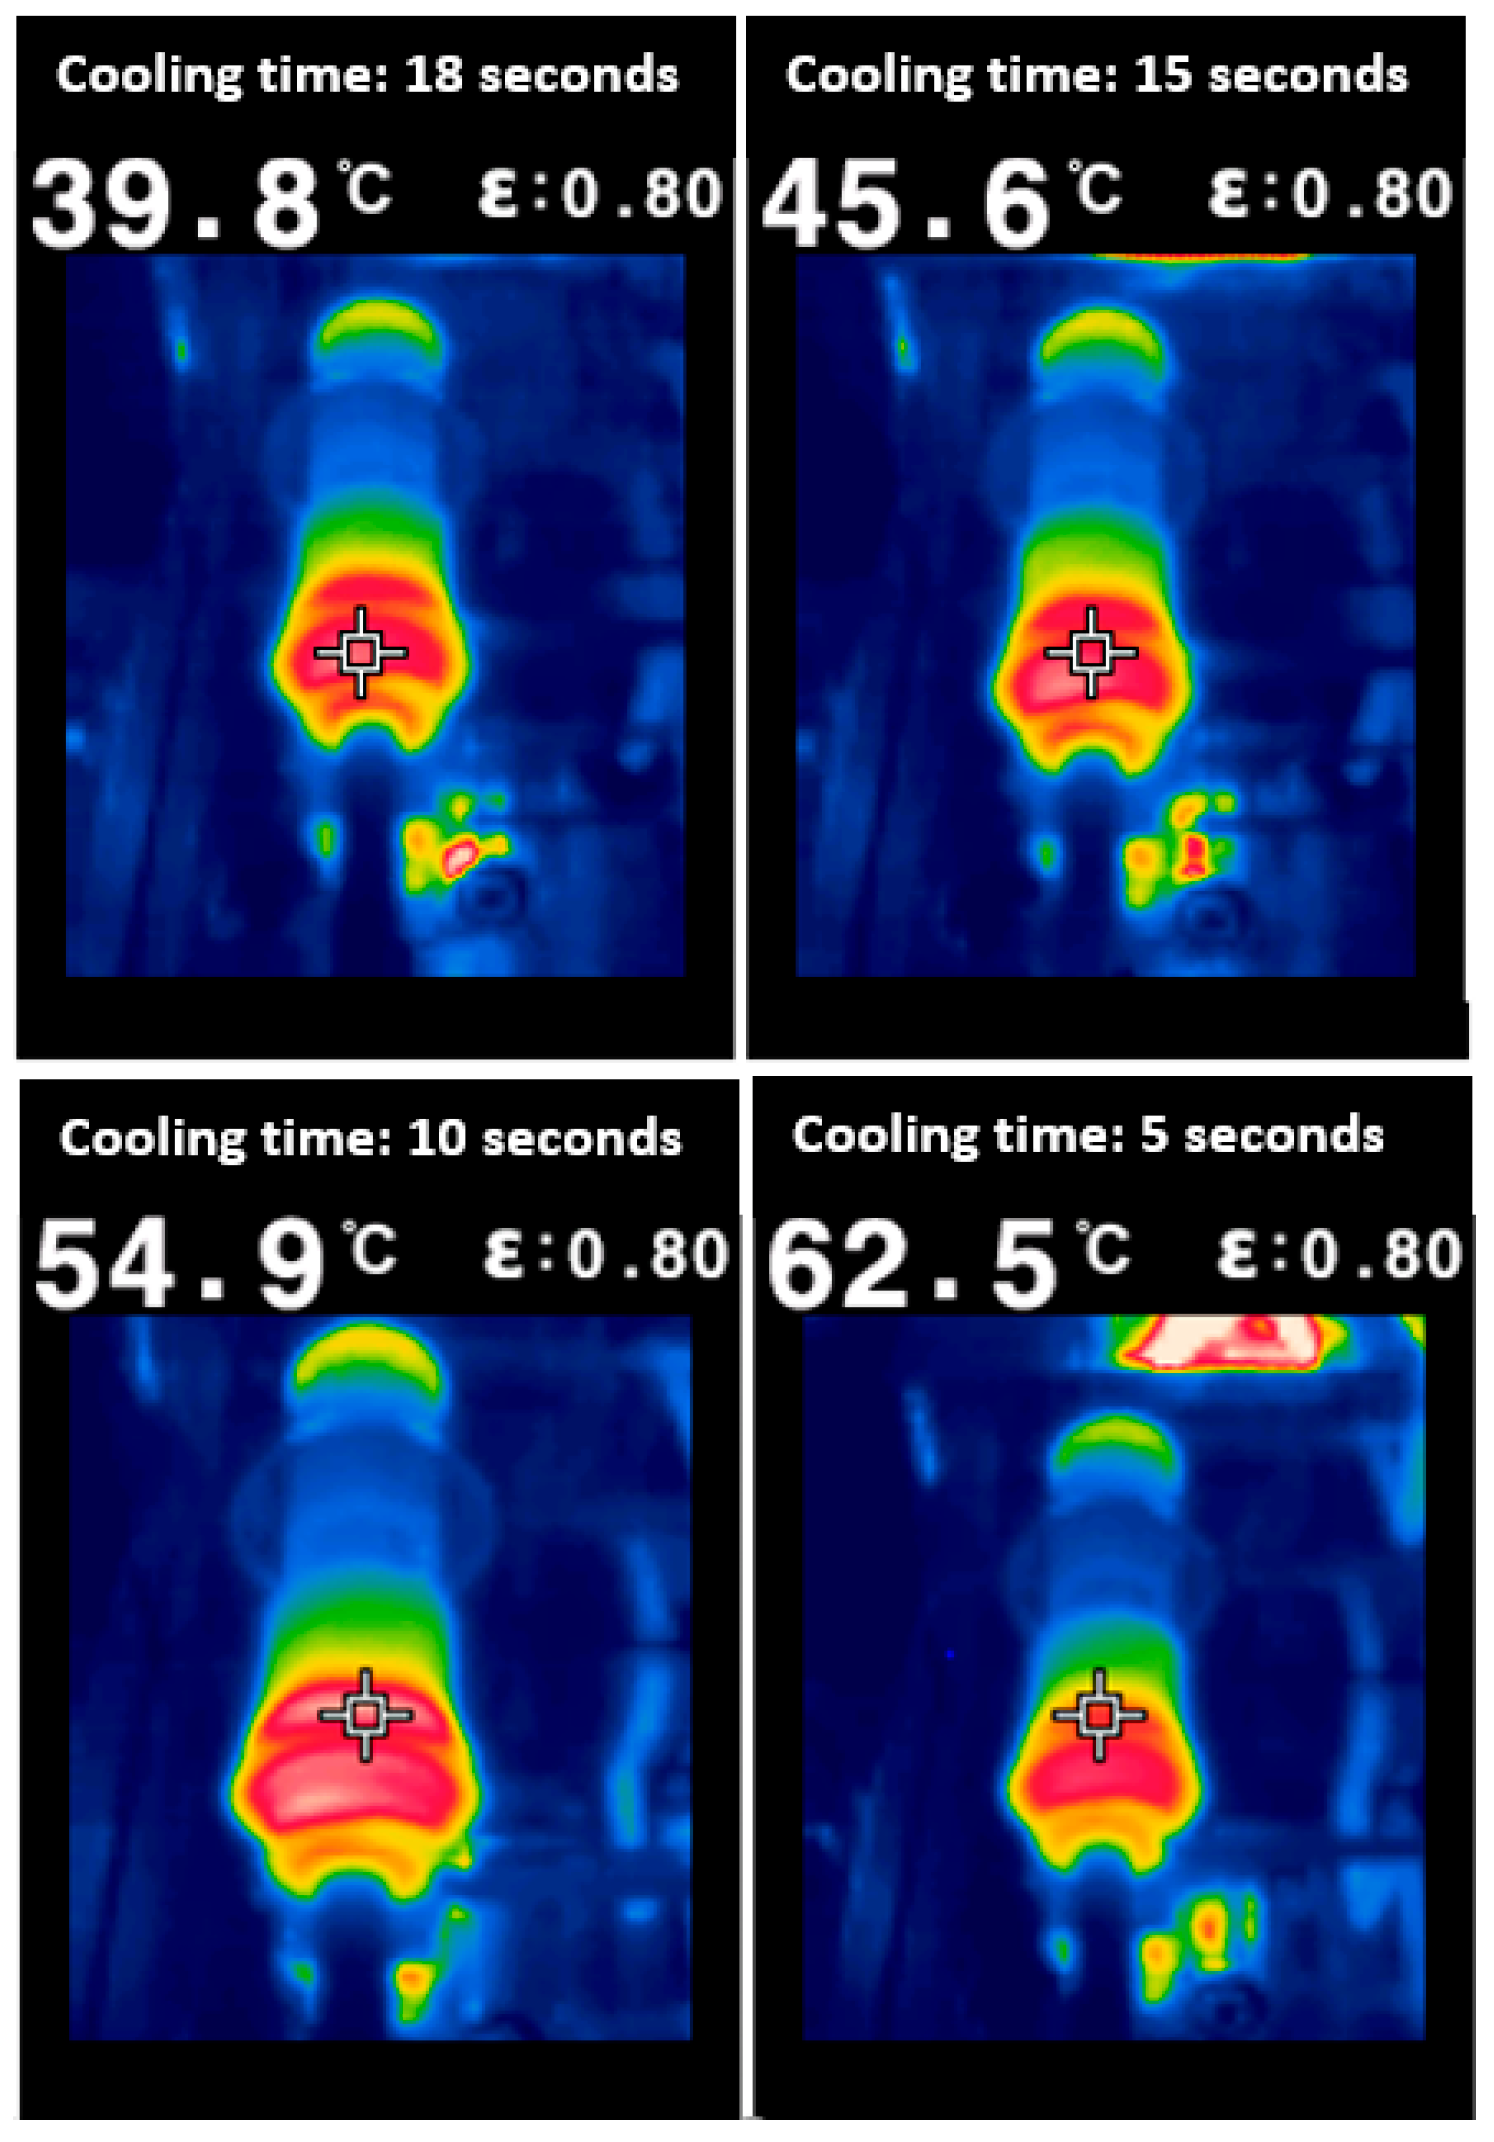
2.3.6. Cooling Time Study
2.3.7. Process Window—Design of Experiments
- Barrel Temp
- Mould Temp
- Hold Pressure
- Hold Time
- Material Lot
2.3.8. Process Analysis
3. Results
3.1. Injection Moulding Optimal Condition Study
3.1.1. Injection Speed Optimisation
3.1.2. Mould Cavity Balance
3.1.3. Pressure Drop Study
3.1.4. Gate Seal
3.1.5. Cooling Time Optimisation
3.2. Process Window DOE
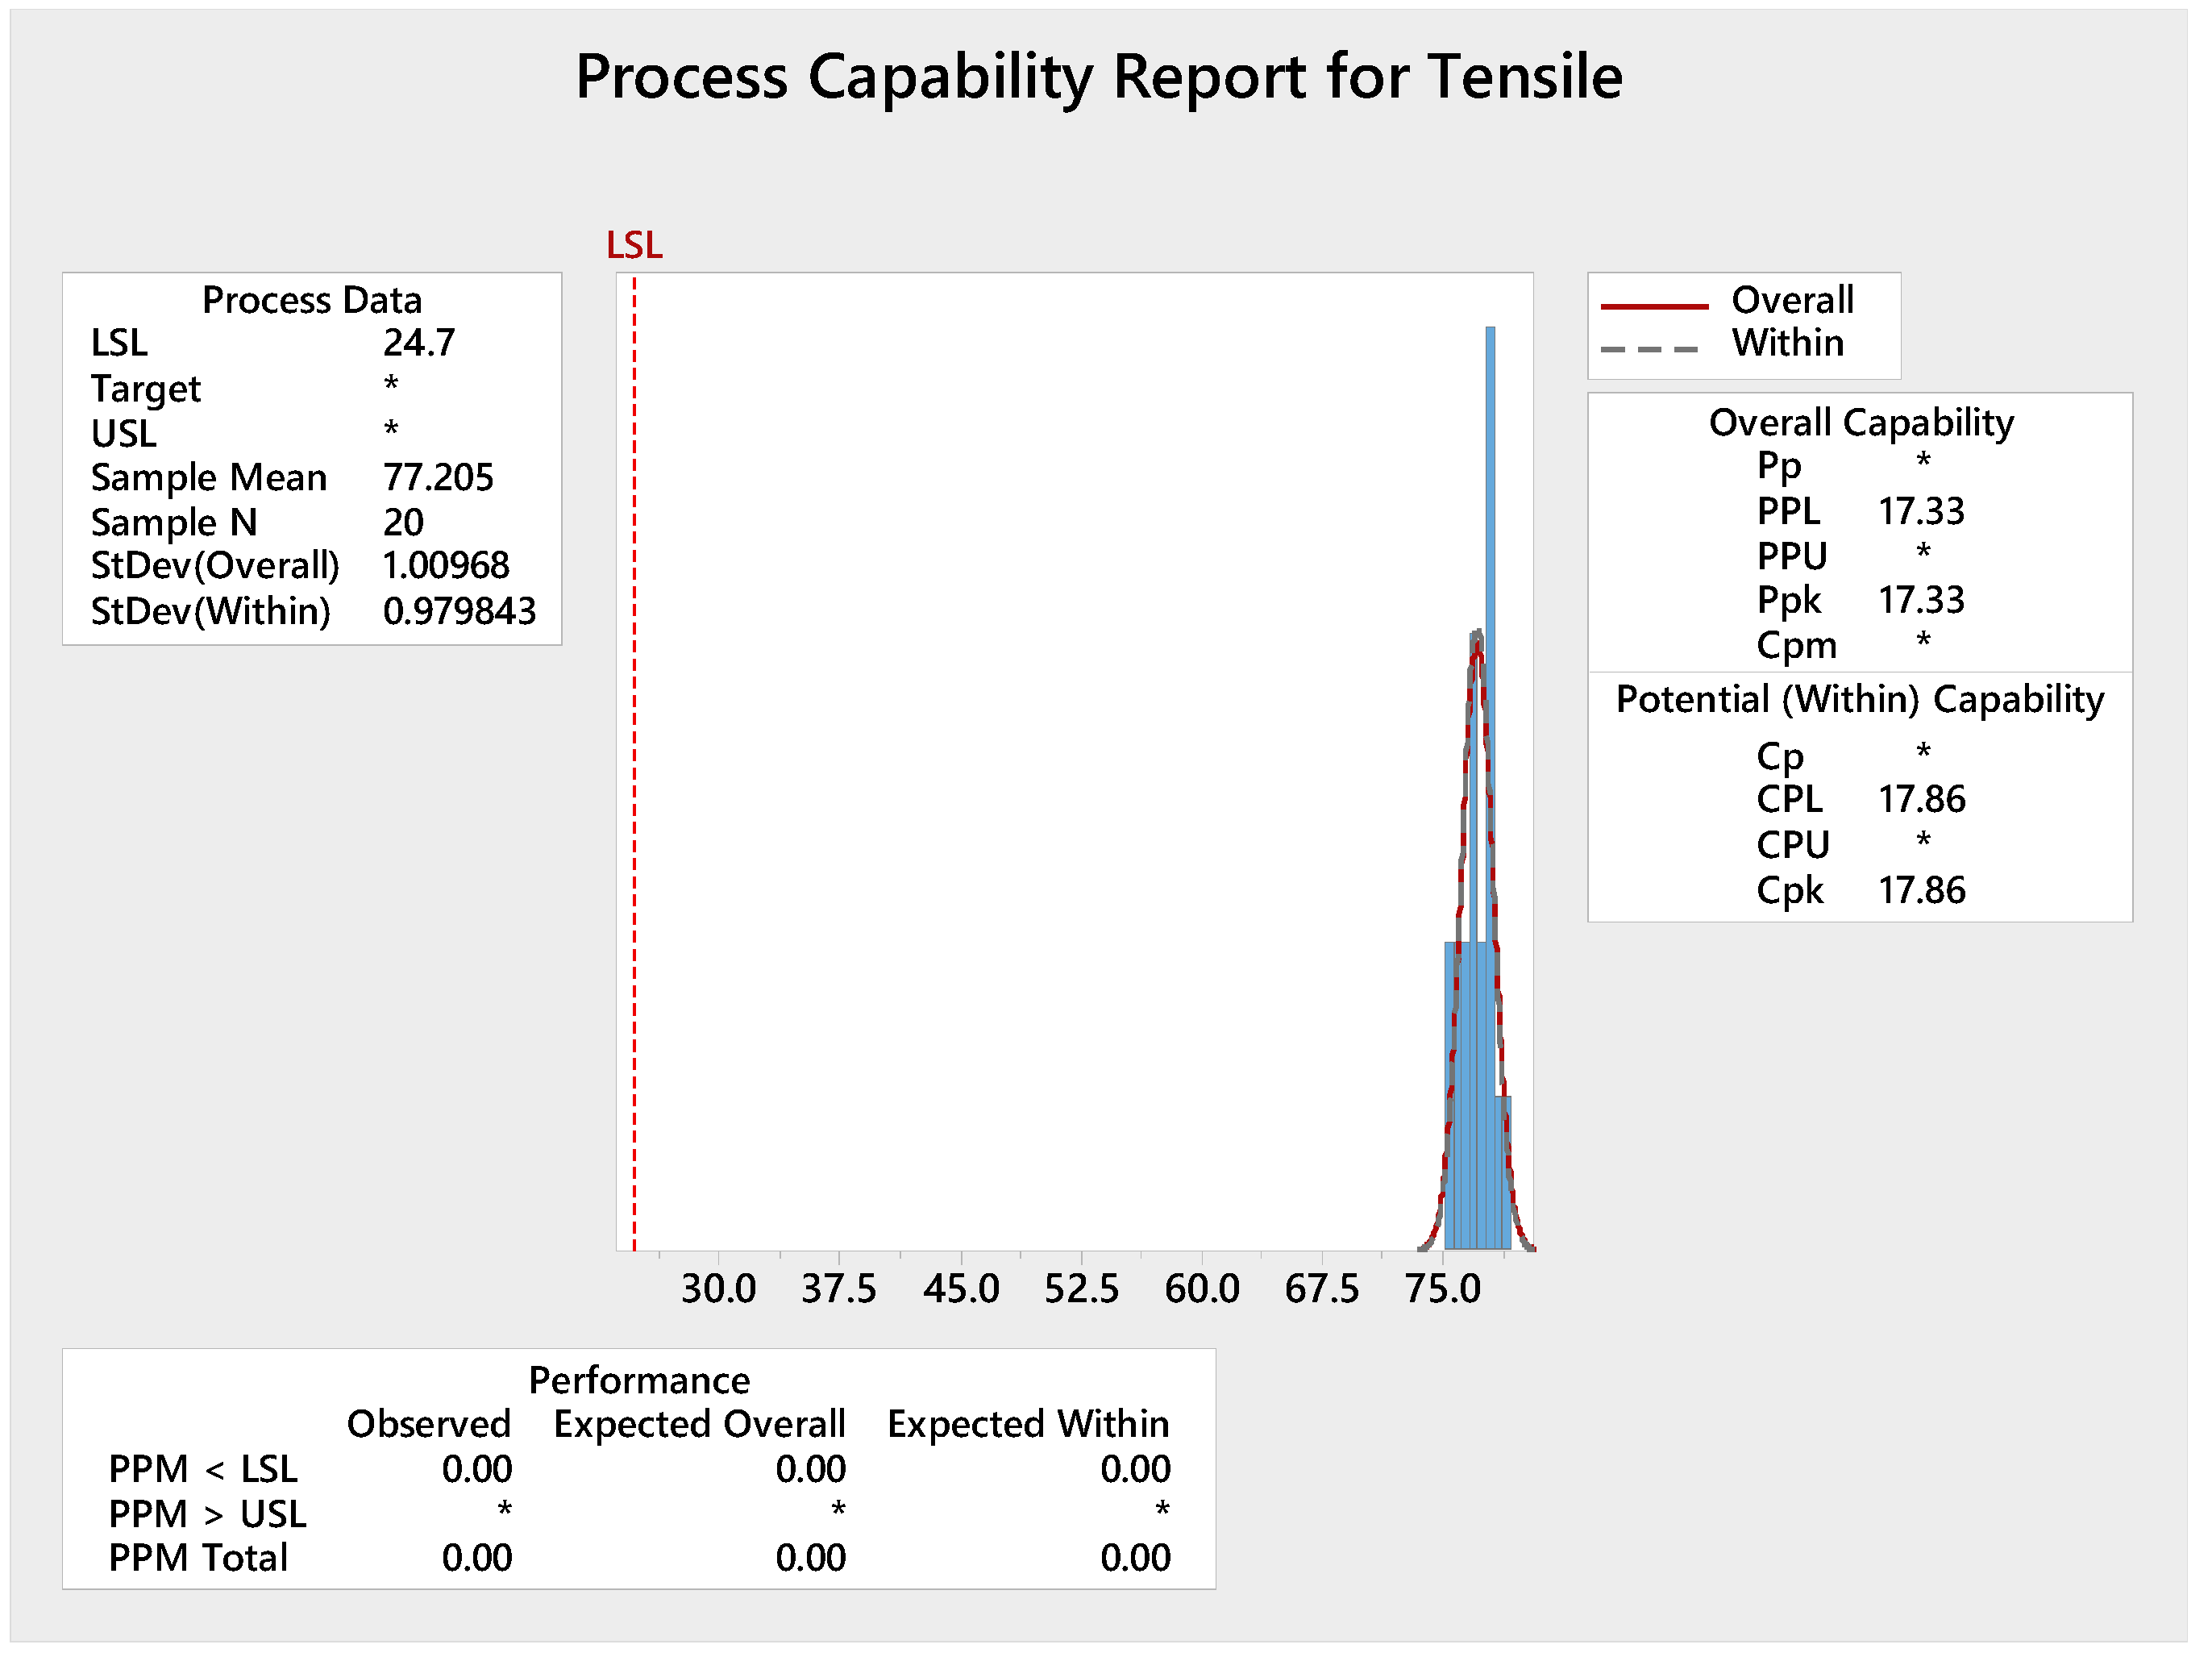
3.3. Process Assessment
3.4. Developed Process Overview
3.5. Cycle Time Analysis
3.5.1. Cycle Time Calculations
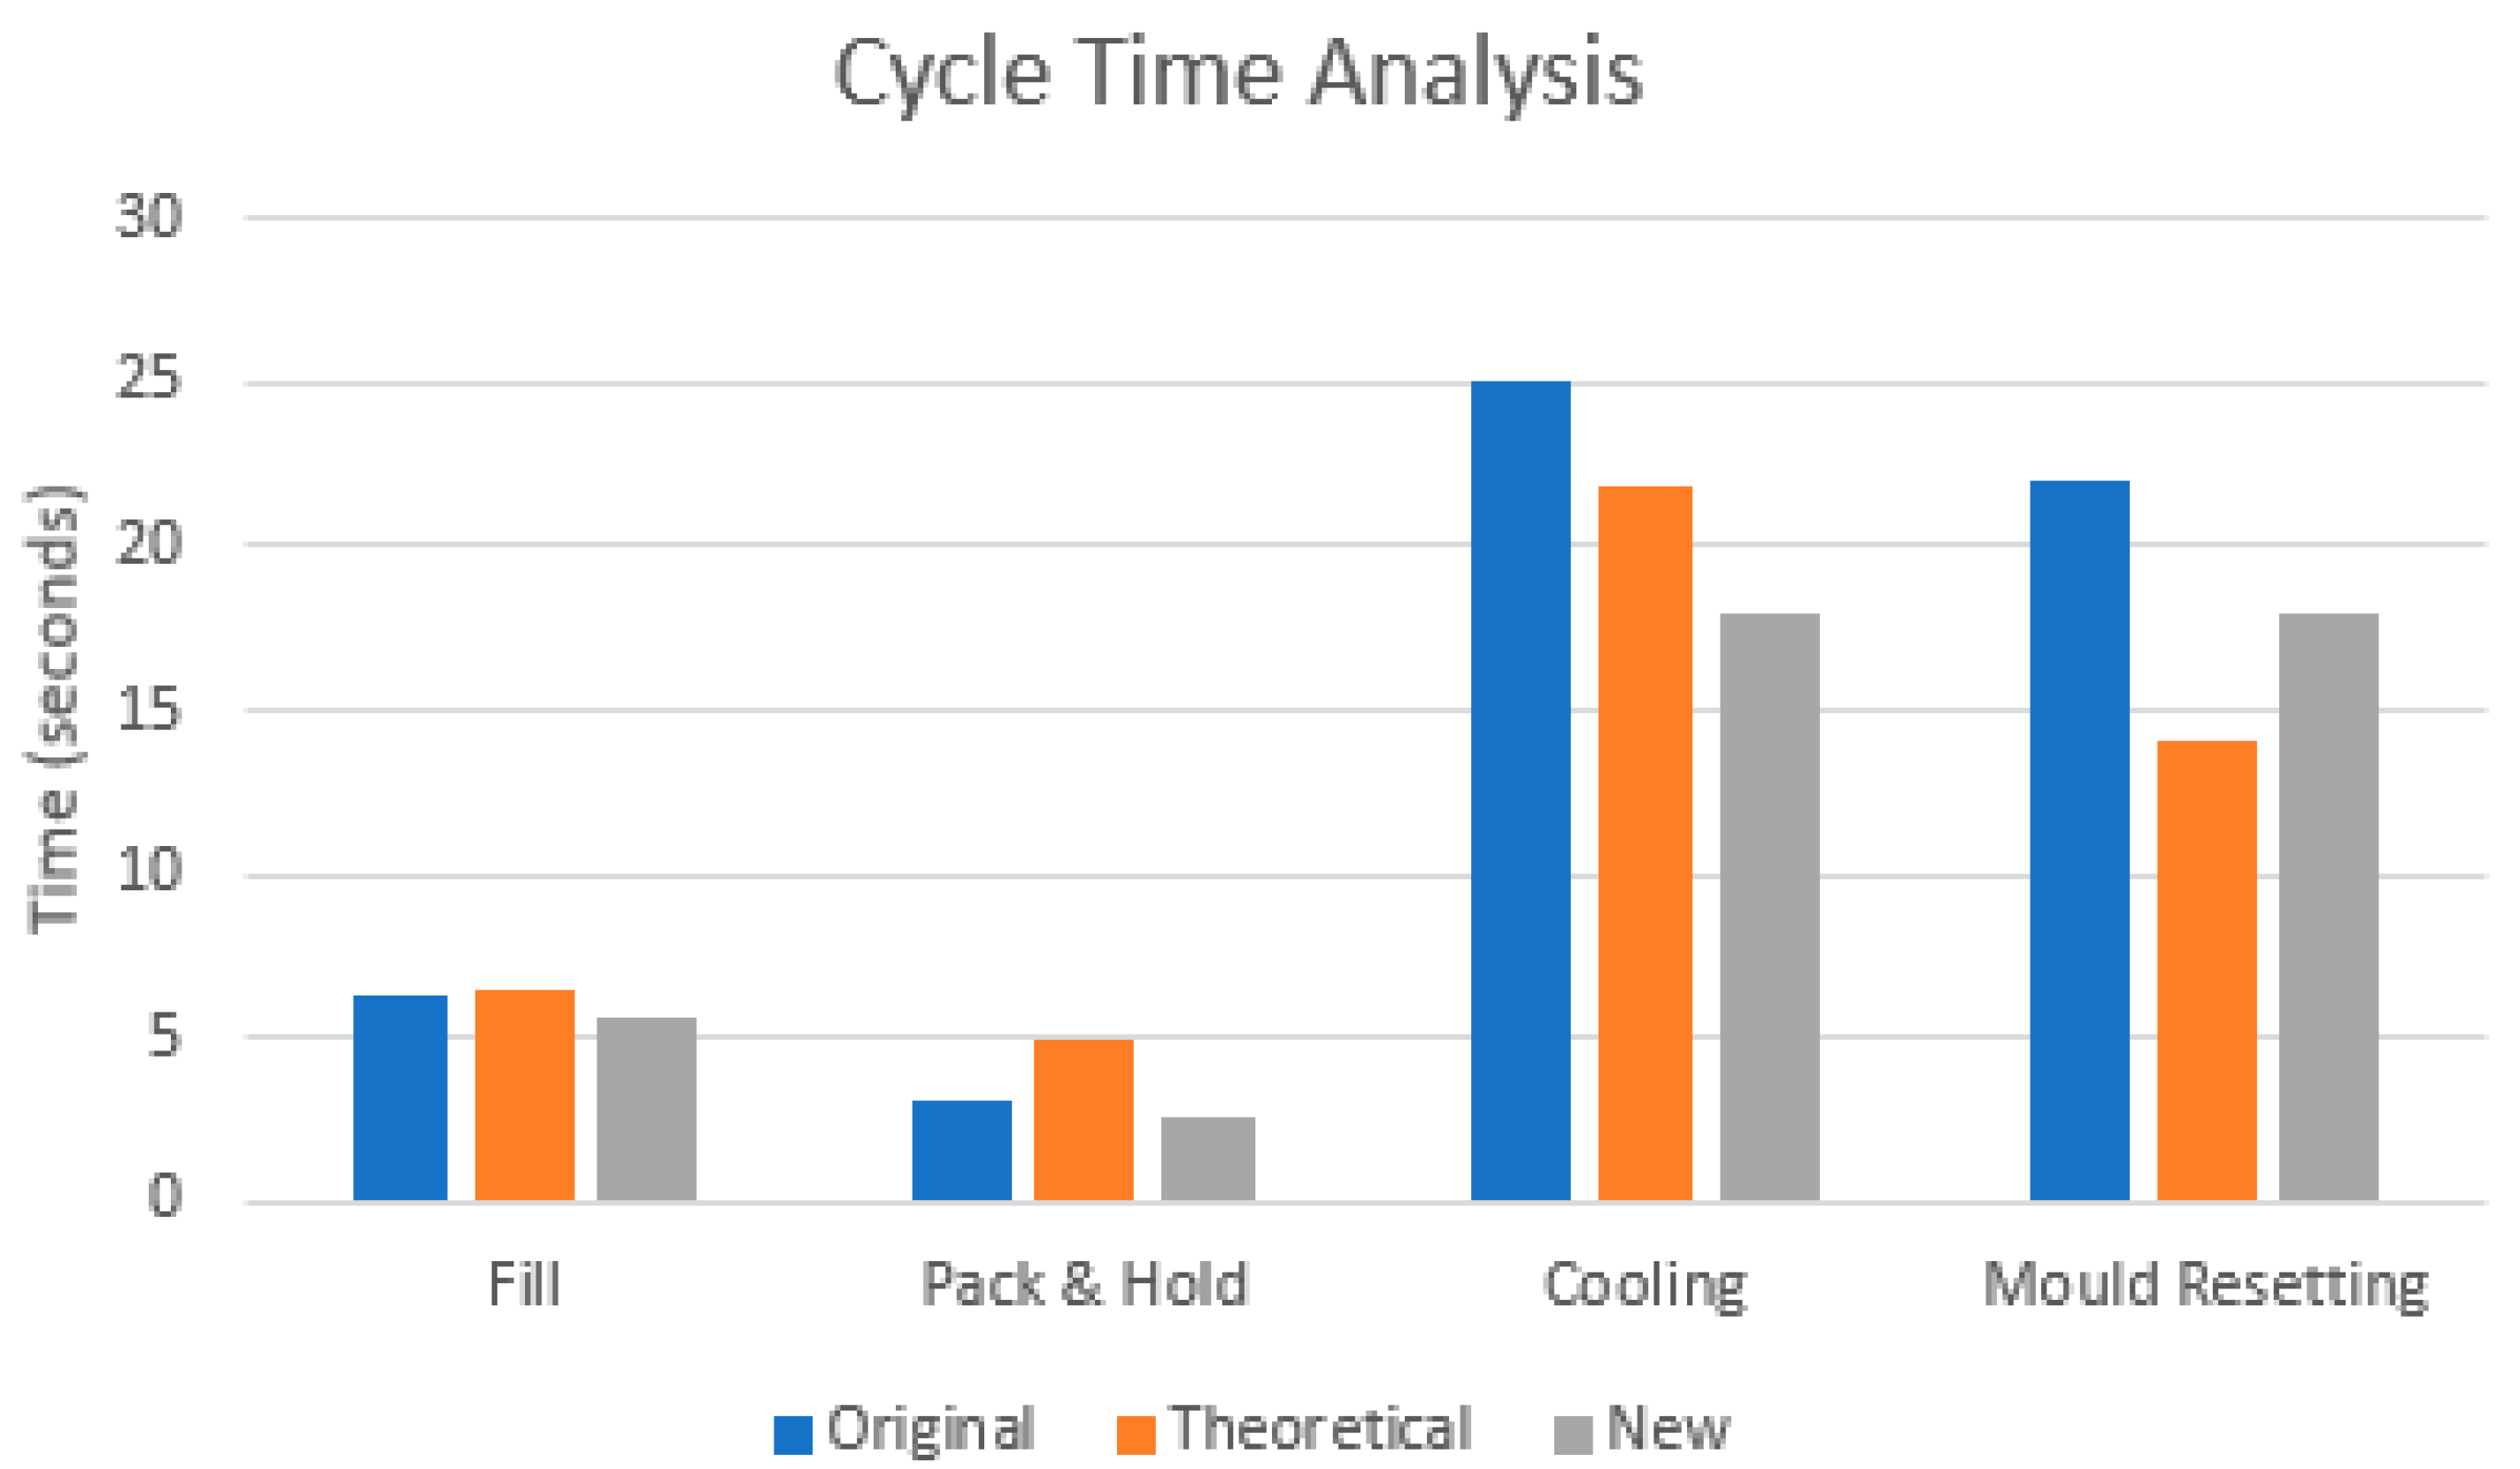
3.5.2. Cycle Time Comparison
4. Conclusions and Future Work
- There are additional studies that were omitted from this study that could be completed as follow-up studies. These include optimising the decompression speed and distance, analysing the gate shear rate, and identifying the most suitable clamping force for the process. These studies could be carried out to assess the impact of them on the process outcome.
- To gain a further reduction in cycle time, the design of the part could be reviewed, particularly the maximum wall thickness. Reducing the maximum wall thickness of the part results in a significant reduction in the cooling time.
- As the newer machine model the 375 V machine has a larger barrel size and an increased clamping force, the machine would be capable of processing parts using a mould tool with additional cavities. A four cavity mould would use 92.2% of the shot size capacity of this machine. This is above the recommended shot size percentage as issues with melt uniformity could occur [21]. The process and equipment is capable of moulding using a three-cavity mould, which would give a percentage of shot used of 69%. This would result in an increased output of approximately 33%.
- The introduction of mould flow analysis prior to the manufacture of the mould tool will aid with the prediction of how to create consistent parts from each cavity. The use of mould flow analysis can analyse the filling and packing phase as it shows how the resin behaves as it flows into the mould. This could confirm resin suitability. It can also be used to optimise the cooling time and complete warp analysis, which would optimise the overall injection moulding process by potentially resulting in a reduction in both cycle time and scrap. This could confirm the theoretically calculated cooling times for varying wall thickness. Mould flow analysis is recommended for the prediction of the moulded part’s the strength again identifying potential weak points or points of failure prior to transfer of the product to production [21,22,23].
- Introduction of automation to the loading and unloading steps of the injection moulding cycle could aid in further optimisation of the process. In the current setup, the dilator shaft is manually loaded over the core pins for moulding. When the cycle is complete, the dilator is manually removed from the machine. The implementation of robots in the cell could reduce the cycle time of the process and result in an increase in throughput. Reduction in cycle time could be achieved in the mould resetting time due to eliminating manual loading and also in the cooling time as the parts would not need to be cooled as long as they would not be handled by the operators. It could also reduce part rejects as automation provides more repeatability and consistency. An introduction of both robots and smart manufacturing into the process could see a reduction in labour costs and therefore saving on production costs.
Author Contributions
Funding
Data Availability Statement
Acknowledgments
Conflicts of Interest
References
- MacKenzie, G. A Closer Look at Scientific Molding Theory. Plastics Today, 2013. Available online: https://www.plasticstoday.com/content/closer-look-scientific-molding-theory/76083266419520 (accessed on 17 May 2020).
- DeVries, G. Advantages of Scientific Molding Practices. Plastic Components, 2018. Available online: https://www.plasticcomponents.com/blog/advantages-of-scientific-molding-practices (accessed on 6 June 2020).
- Paulson Training Programs Inc. Injection Molding as a Scientific Technology. 2020. Available online: https://www.paulsontraining.com/what-is-scientific-molding/ (accessed on 5 June 2020).
- Sealect Plastics. Mold Flow Analysis. 2020. Available online: https://sealectplastics.com/mold-flow-analysis/ (accessed on 28 July 2020).
- MacKenzie, G. Optimizing Your Molding Cycle. Plastics Technology. 2016. Available online: https://www.ptonline.com/blog/post/optimizing-your-molding-cycle (accessed on 9 June 2020).
- Kulkarni, S. Robust Processing, Part 1: The Aesthetic, Dimensional, and Control Process Windows. Plastics Today, 2009. Available online: https://www.plasticstoday.com/content/robust-processing-part-1-aesthetic-dimensional-and-control-process-windows/24285366012481 (accessed on 7 June 2020).
- Bozzelli, J. Minimize Screw Recovery & Cycle Times. Plastics Technology. 2012. Available online: https://www.ptonline.com/articles/minimize-screw-recovery-cycle-times (accessed on 8 June 2020).
- Cook, I. Manufacturing Productivity (11 Tips to Improve Your Performance). GWP Group, 2021. Available online: https://www.gwp.co.uk/guides/manufacturing-productivity-tips/ (accessed on 19 September 2021).
- Schwartz, J. How to Minimize Cycle Time in Injection Moulding. RevPart, 2018. Available online: https://revpart.com/maximizing-cycle-time-in-injection-molding/ (accessed on 9 June 2020).
- Vishnuvarthanan, M.; Panda, R.; Ilangovan, S. Optimisation of Injection Molding Cycle Time Using Moldflow Analysis. Middle-East J. Sci. Res. 2021, 13, 944–946. [Google Scholar]
- Chen, X.; Wang, L.; Shi, J.; Shi, H.; Liu, Y. Effect of Barium Sulphate Nanoparticles on Mechanical Properties and Crystallization Behaviour of HDPE. Polym. Polym. Compos. 2010, 18, 145–152. [Google Scholar] [CrossRef]
- Sanchea-Soto, M.; Virginia Candal, M.; David, A.; Illescas, S. Experimental study on the strength of adhesion obtained by over-molding between different materials. Inject. Molding Process. Des. Appl. 2011, 268–282. [Google Scholar]
- Beall, G. By Design: Polypropylene Part Design, Part 1. Plastics Today, 2002. Available online: https://www.plasticstoday.com/materials/design-polypropylene-part-design-part-1/1296682952229 (accessed on 2 June 2020).
- Stack Plastics Inc. Insert Molding. 2020. Available online: https://www.stackplastics.com/insert-molding (accessed on 8 June 2020).
- Mercado-Colmenero, J.M.; Almazan Lazaro, M.A.; Donate, C.; Paramio, M.A.; Idoipe, A.; Garcia, J.M.; Sevillano, J.; Puerto, A. Analytical calculation model for determining the cycle time in injection molding parts applied to design optimization algorithms. WIT Trans. Built Environ. 2016, 166, 427–438. [Google Scholar] [CrossRef] [Green Version]
- Liang, J.Z.; Ness, J.N. The calculation of cooling time in injection moulding. J. Mater. Process. Technol. 1996, 57, 62–64. [Google Scholar] [CrossRef]
- ACO MOLD. How to Calculate Weight Tolerance of a Molded Part? 2020. Available online: www.acomold.com/how-to-calculate-weight-tolerance-of-a-molded-part.html (accessed on 26 July 2020).
- BASF Corporation Engineering Plastics. Estimating Cooling Times in Injection Molding; Technical Expertise. 2007. Available online: http://www2.basf.us/PLASTICSWEB/displayanyfile?id=0901a5e1801499d3 (accessed on 8 June 2020).
- Williams, J. What Goes into Injection Molding Cooling Time? Medical Design and Outsourcing, 2017. Available online: https://www.medicaldesignandoutsourcing.com/injection-molding-cooling-time/ (accessed on 9 June 2020).
- Engineers Edge. Thermal Diffusivity Table. 2020. Available online: https://www.engineersedge.com/heat_transfer/thermal_diffusivity_table_13953.htm (accessed on 30 June 2020).
- Bozzelli, J. What Percentage of Barrel Capacity Should Your Shot Size Be? Plastics Technology. 2011. Available online: https://www.ptonline.com/articles/what-percentage-of-barrel-capacity-should-your-shot-size-be (accessed on 15 July 2020).
- FimmTech. Procedure to Estimate Cavity Balance. Available online: http://injectionmoldingonline.com/HowTo/CavityBalance.aspx (accessed on 22 July 2020).
- Mercado-Colmenero, J.M.; Almazan Lazaro, M.A.; Donate, C.; Karlinger, P. A new procedure for calculating cycle time in injection molding based on plastic part geometry recognition. Int. J. Adv. Manuf. Technol. 2018, 98, 441–477. [Google Scholar] [CrossRef]


| Moulding Process | Barrel Temp (°C) | Mould Temp (°C) | Injection Speed (mm/s) | Holding Pressure (bar) | Holding Time (s) | Cooling Time (s) |
|---|---|---|---|---|---|---|
| Original (Arburg 221 M) | 210–240 | 18–50 | 40.7 | 200–700 | 1–6 | 10–35 |
| StdOrder | Run Order | Barrel Temp. (°C) | Mould Temp (°C) | Hold Pressure (MPa) | Hold Time (s) | Material Lot | Thread Dimension (Inches) | Maximum Tensile Strength (Lbf) |
|---|---|---|---|---|---|---|---|---|
| 7 | 1 | 220 | 50 | 450 | 2 | B | 0.556” | 77.8 |
| 5 | 2 | 220 | 18 | 450 | 2 | A | 0.555” | 76.8 |
| 3 | 3 | 220 | 50 | 350 | 2 | A | 0.555” | 78.1 |
| 14 | 4 | 240 | 18 | 450 | 4 | A | 0.555” | 77.3 |
| 1 | 5 | 220 | 18 | 350 | 2 | B | 0.555” | 75.7 |
| 11 | 6 | 220 | 50 | 350 | 4 | B | 0.555” | 77.4 |
| 10 | 7 | 240 | 18 | 350 | 4 | B | 0.555” | 77.9 |
| 19 | 8 | 230 | 34 | 400 | 3 | A | 0.555” | 78.2 |
| 13 | 9 | 220 | 18 | 450 | 4 | B | 0.555” | 75.9 |
| 9 | 10 | 220 | 18 | 350 | 4 | A | 0.555” | 76.4 |
| 18 | 11 | 230 | 34 | 400 | 3 | B | 0.555” | 77.2 |
| 15 | 12 | 220 | 50 | 450 | 4 | A | 0.555” | 78.1 |
| 8 | 13 | 240 | 50 | 450 | 2 | A | 0.557” | 79.0 |
| 6 | 14 | 240 | 18 | 450 | 2 | B | 0.556” | 75.3 |
| 17 | 15 | 230 | 34 | 400 | 3 | A | 0.555” | 76.2 |
| 12 | 16 | 240 | 50 | 350 | 4 | A | 0.555” | 76.8 |
| 16 | 17 | 240 | 50 | 450 | 4 | B | 0.556” | 77.1 |
| 4 | 18 | 240 | 50 | 350 | 2 | B | 0.555” | 76.4 |
| 20 | 19 | 230 | 34 | 400 | 3 | B | 0.555” | 77.9 |
| 2 | 20 | 240 | 18 | 350 | 2 | A | 0.555” | 78.6 |
| Shot No. | Weight (g) | |||
|---|---|---|---|---|
| Cavity 1 | Cavity 2 | Difference | Imbalance % | |
| 1 | 4.362 | 4.348 | 0.014 | 0.32% |
| 2 | 4.342 | 4.342 | 0.000 | 0.00% |
| 3 | 4.346 | 4.336 | 0.010 | 0.23% |
| 4 | 4.317 | 4.335 | 0.018 | 0.42% |
| 5 | 4.351 | 4.335 | 0.016 | 0.37% |
| 6 | 4.365 | 4.352 | 0.013 | 0.30% |
| 7 | 4.334 | 4.330 | 0.004 | 0.09% |
| 8 | 4.381 | 4.383 | 0.002 | 0.05% |
| 9 | 4.304 | 4.343 | 0.061 | 0.91% |
| 10 | 4.385 | 4.363 | 0.022 | 0.50% |
| Moulding Process | Barrel Temp (°C) | Mould Temp (°C) | Injection speed (mm/s) | Holding Pressure (bar) | Holding Time (s) | Cooling Time (s) |
|---|---|---|---|---|---|---|
| Original (Arburg 221 M) | 210–240 | 18–50 | 40.7 | 200–700 | 1–6 | 10–35 |
| New (Arburg 375 V) | 210–240 | 18–50 | 55 | 350–450 | 2–4 | 18 |
| Shot No. | Weight (g) | Shot No. | Weight (g) | Shot No. | Weight (g) | Shot No. | Weight (g) |
|---|---|---|---|---|---|---|---|
| 1 | 4.86 | 9 | 4.861 | 17 | 4.861 | 25 | 4.858 |
| 2 | 4.859 | 10 | 4.858 | 18 | 4.858 | 26 | 4.859 |
| 3 | 4.861 | 11 | 4.857 | 19 | 4.859 | 27 | 4.859 |
| 4 | 4.859 | 12 | 4.86 | 20 | 4.859 | 28 | 4.86 |
| 5 | 4.859 | 13 | 4.859 | 21 | 4.861 | 29 | 4.861 |
| 6 | 4.858 | 14 | 4.862 | 22 | 4.862 | 30 | 4.858 |
| 7 | 4.86 | 15 | 4.86 | 23 | 4.861 | 31 | 4.86 |
| 8 | 4.862 | 16 | 4.86 | 24 | 4.859 | 32 | 4.861 |
| Average (g) | 4.860 | Average (g) | 4.860 | Average (g) | 4.86 | Average (g) | 4.860 |
| Range (g) | 0.004 | Range (g) | 0.005 | Range (g) | 0.004 | Range (g) | 0.003 |
| Max (g) | 4.862 | Max (g) | 4.862 | Max (g) | 4.862 | Max (g) | 4.861 |
| Min (g) | 4.858 | Min (g) | 4.857 | Min (g) | 4.858 | Min (g) | 4.858 |
| Moulding Stage | Time (s) | ||
|---|---|---|---|
| Original | Theoretical | New | |
| Fill | 6.2 | 6.41 | 5.65 |
| Pack & Hold | 3 | 4.916 | 2.5 |
| Cooling | 25 | 21.893 | 18 |
| Mould Resetting | 22 | 14.06 | 18 |
| Total cycle time | 56.2 | 47.28 | 44.15 |
Publisher’s Note: MDPI stays neutral with regard to jurisdictional claims in published maps and institutional affiliations. |
© 2021 by the authors. Licensee MDPI, Basel, Switzerland. This article is an open access article distributed under the terms and conditions of the Creative Commons Attribution (CC BY) license (https://creativecommons.org/licenses/by/4.0/).
Share and Cite
Fitzgerald, A.; McDonald, P.; Devine, D.; Fuenmayor, E. Transfer and Optimisation of Injection Moulding Manufacture of Medical Devices Using Scientific Moulding Principles. J. Manuf. Mater. Process. 2021, 5, 113. https://doi.org/10.3390/jmmp5040113
Fitzgerald A, McDonald P, Devine D, Fuenmayor E. Transfer and Optimisation of Injection Moulding Manufacture of Medical Devices Using Scientific Moulding Principles. Journal of Manufacturing and Materials Processing. 2021; 5(4):113. https://doi.org/10.3390/jmmp5040113
Chicago/Turabian StyleFitzgerald, Aimee, Paul McDonald, Declan Devine, and Evert Fuenmayor. 2021. "Transfer and Optimisation of Injection Moulding Manufacture of Medical Devices Using Scientific Moulding Principles" Journal of Manufacturing and Materials Processing 5, no. 4: 113. https://doi.org/10.3390/jmmp5040113
APA StyleFitzgerald, A., McDonald, P., Devine, D., & Fuenmayor, E. (2021). Transfer and Optimisation of Injection Moulding Manufacture of Medical Devices Using Scientific Moulding Principles. Journal of Manufacturing and Materials Processing, 5(4), 113. https://doi.org/10.3390/jmmp5040113