
Effect of Sheets’ Thickness and Rivet Geometry on Mechanical Properties of Orbital Riveted Aluminium Joints: Experimental and Numerical Analysis


Abstract
:1. Introduction
- Less stress on the parts to be joined;
- Elimination of cracks caused by other technologies such as impact riveting;
- Cold-head forming by avoiding bending or swelling of the fastener shank;
- Use of smaller presses in terms of size, energy consumption, and cost;
- Less rigid fixturing and longer lasting tools;
- Virtually silent and vibration-free process;
- Consistency and uniformity of the joint.
2. Materials and Methods
2.1. Materials
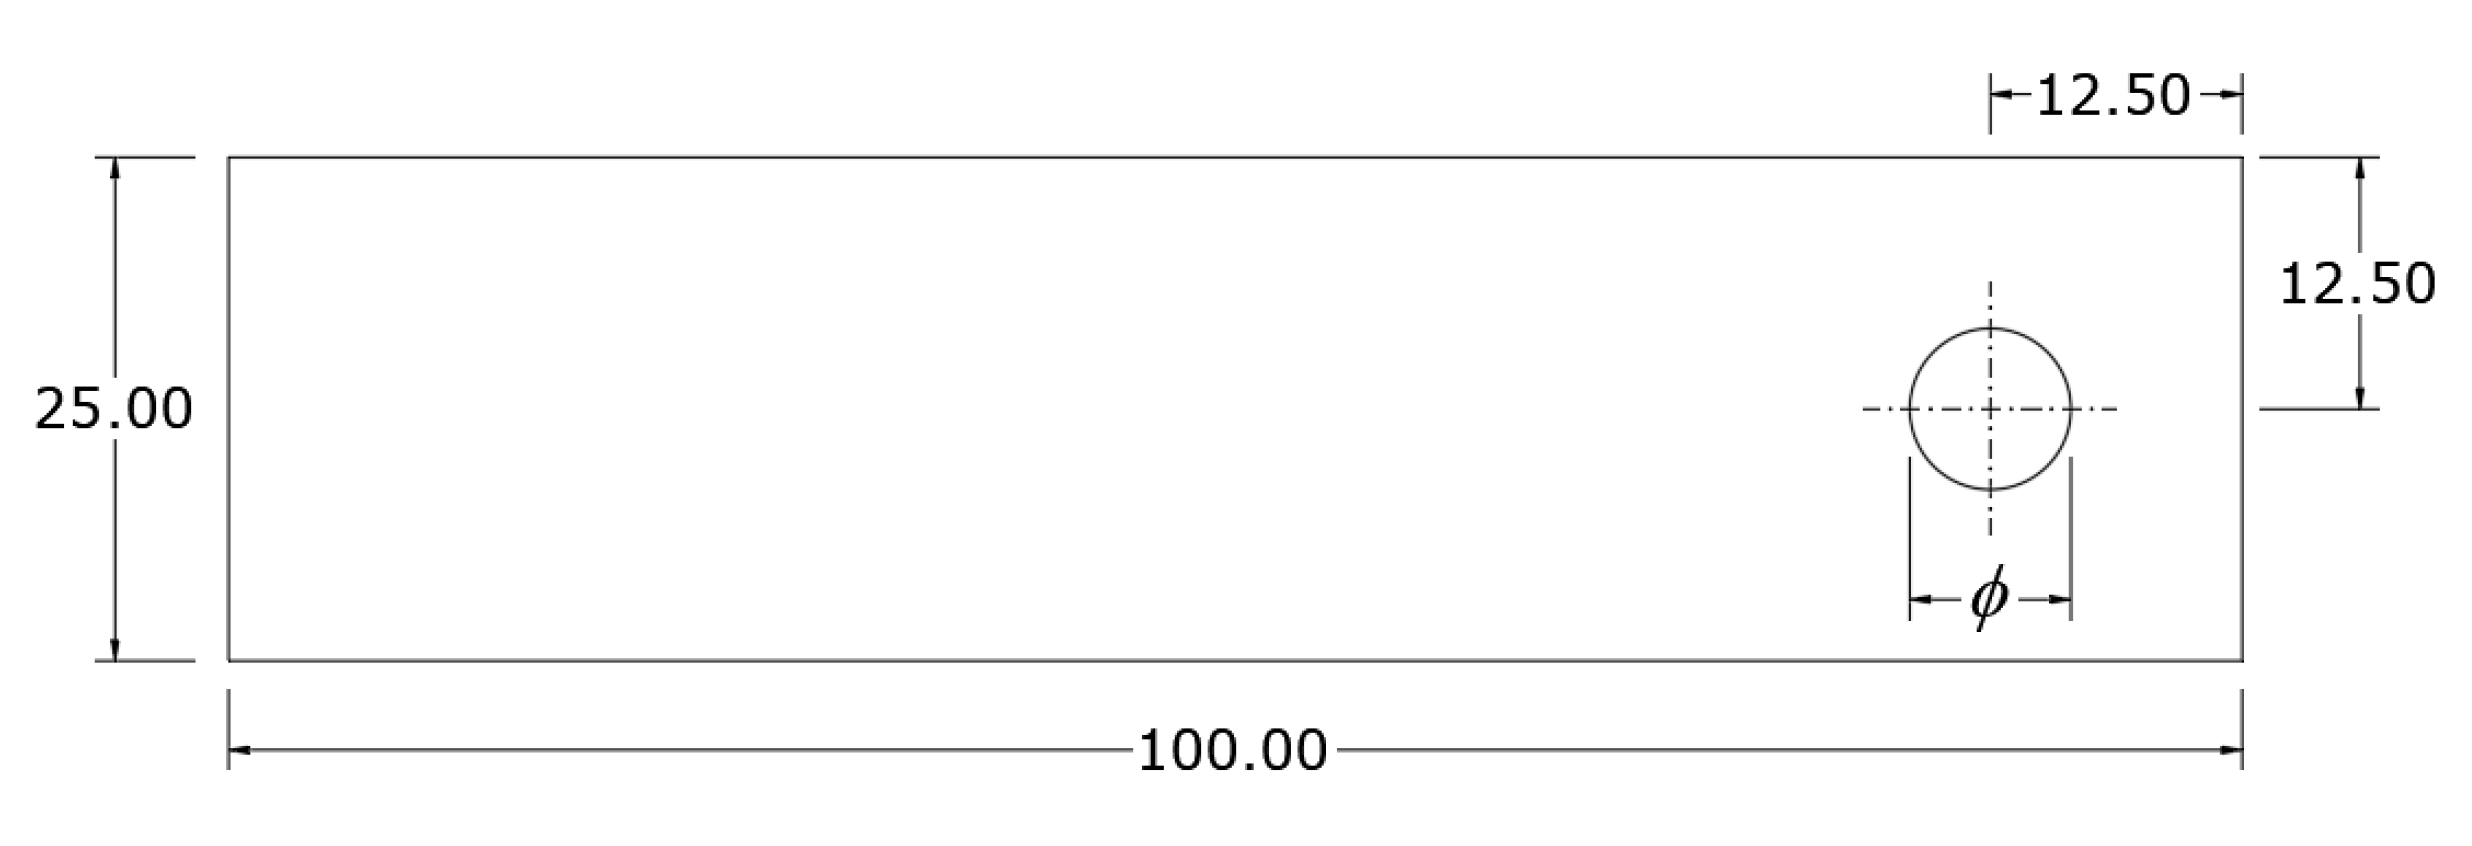
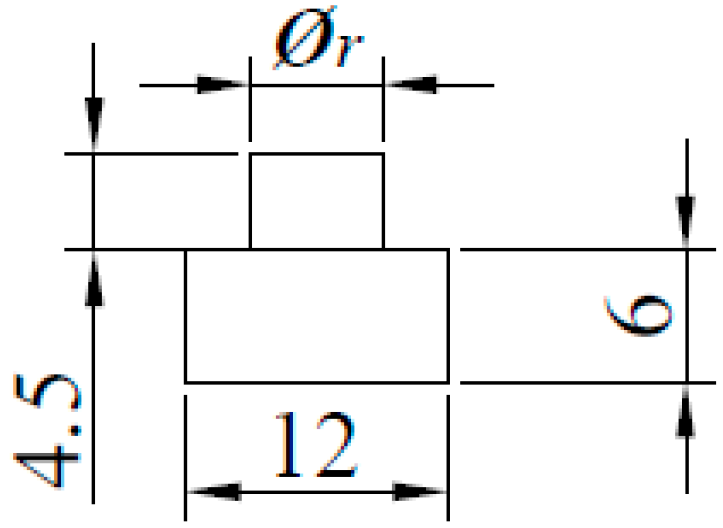
2.2. Geometry
- -
- Symmetrical joints, where the two sheets have the same thickness, i.e., 1.5 mm;
- -
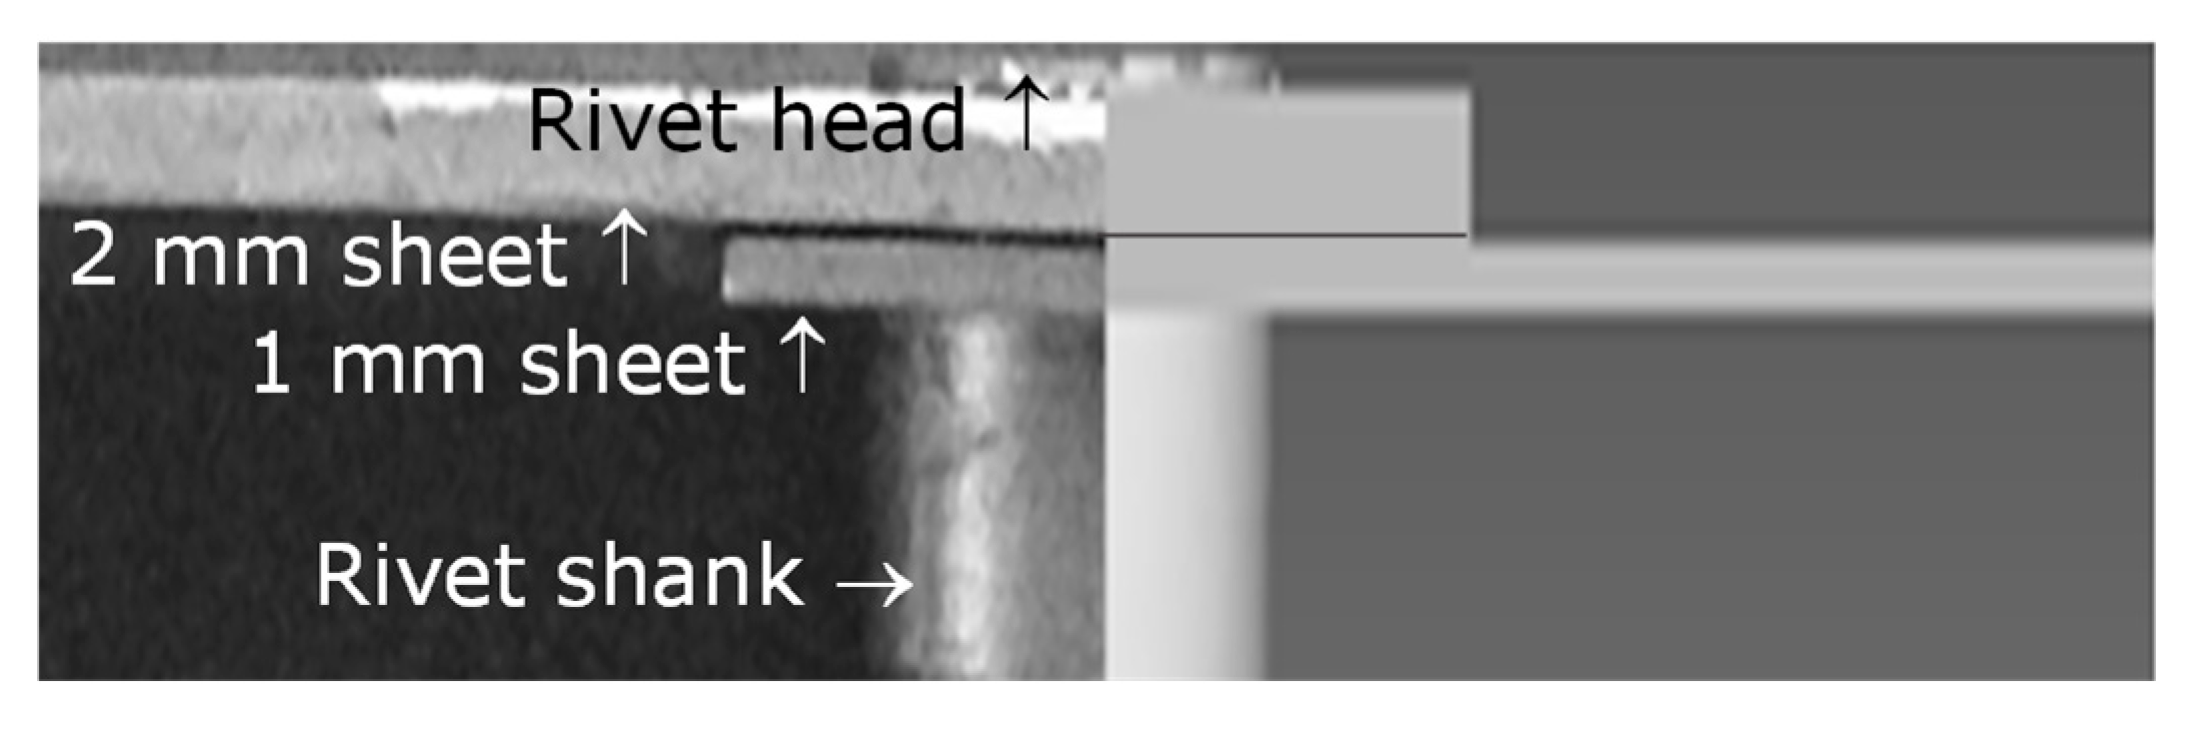
- Asymmetric joints, where the upper and lower sheets have different thicknesses, i.e., 2 mm and 1 mm, respectively.
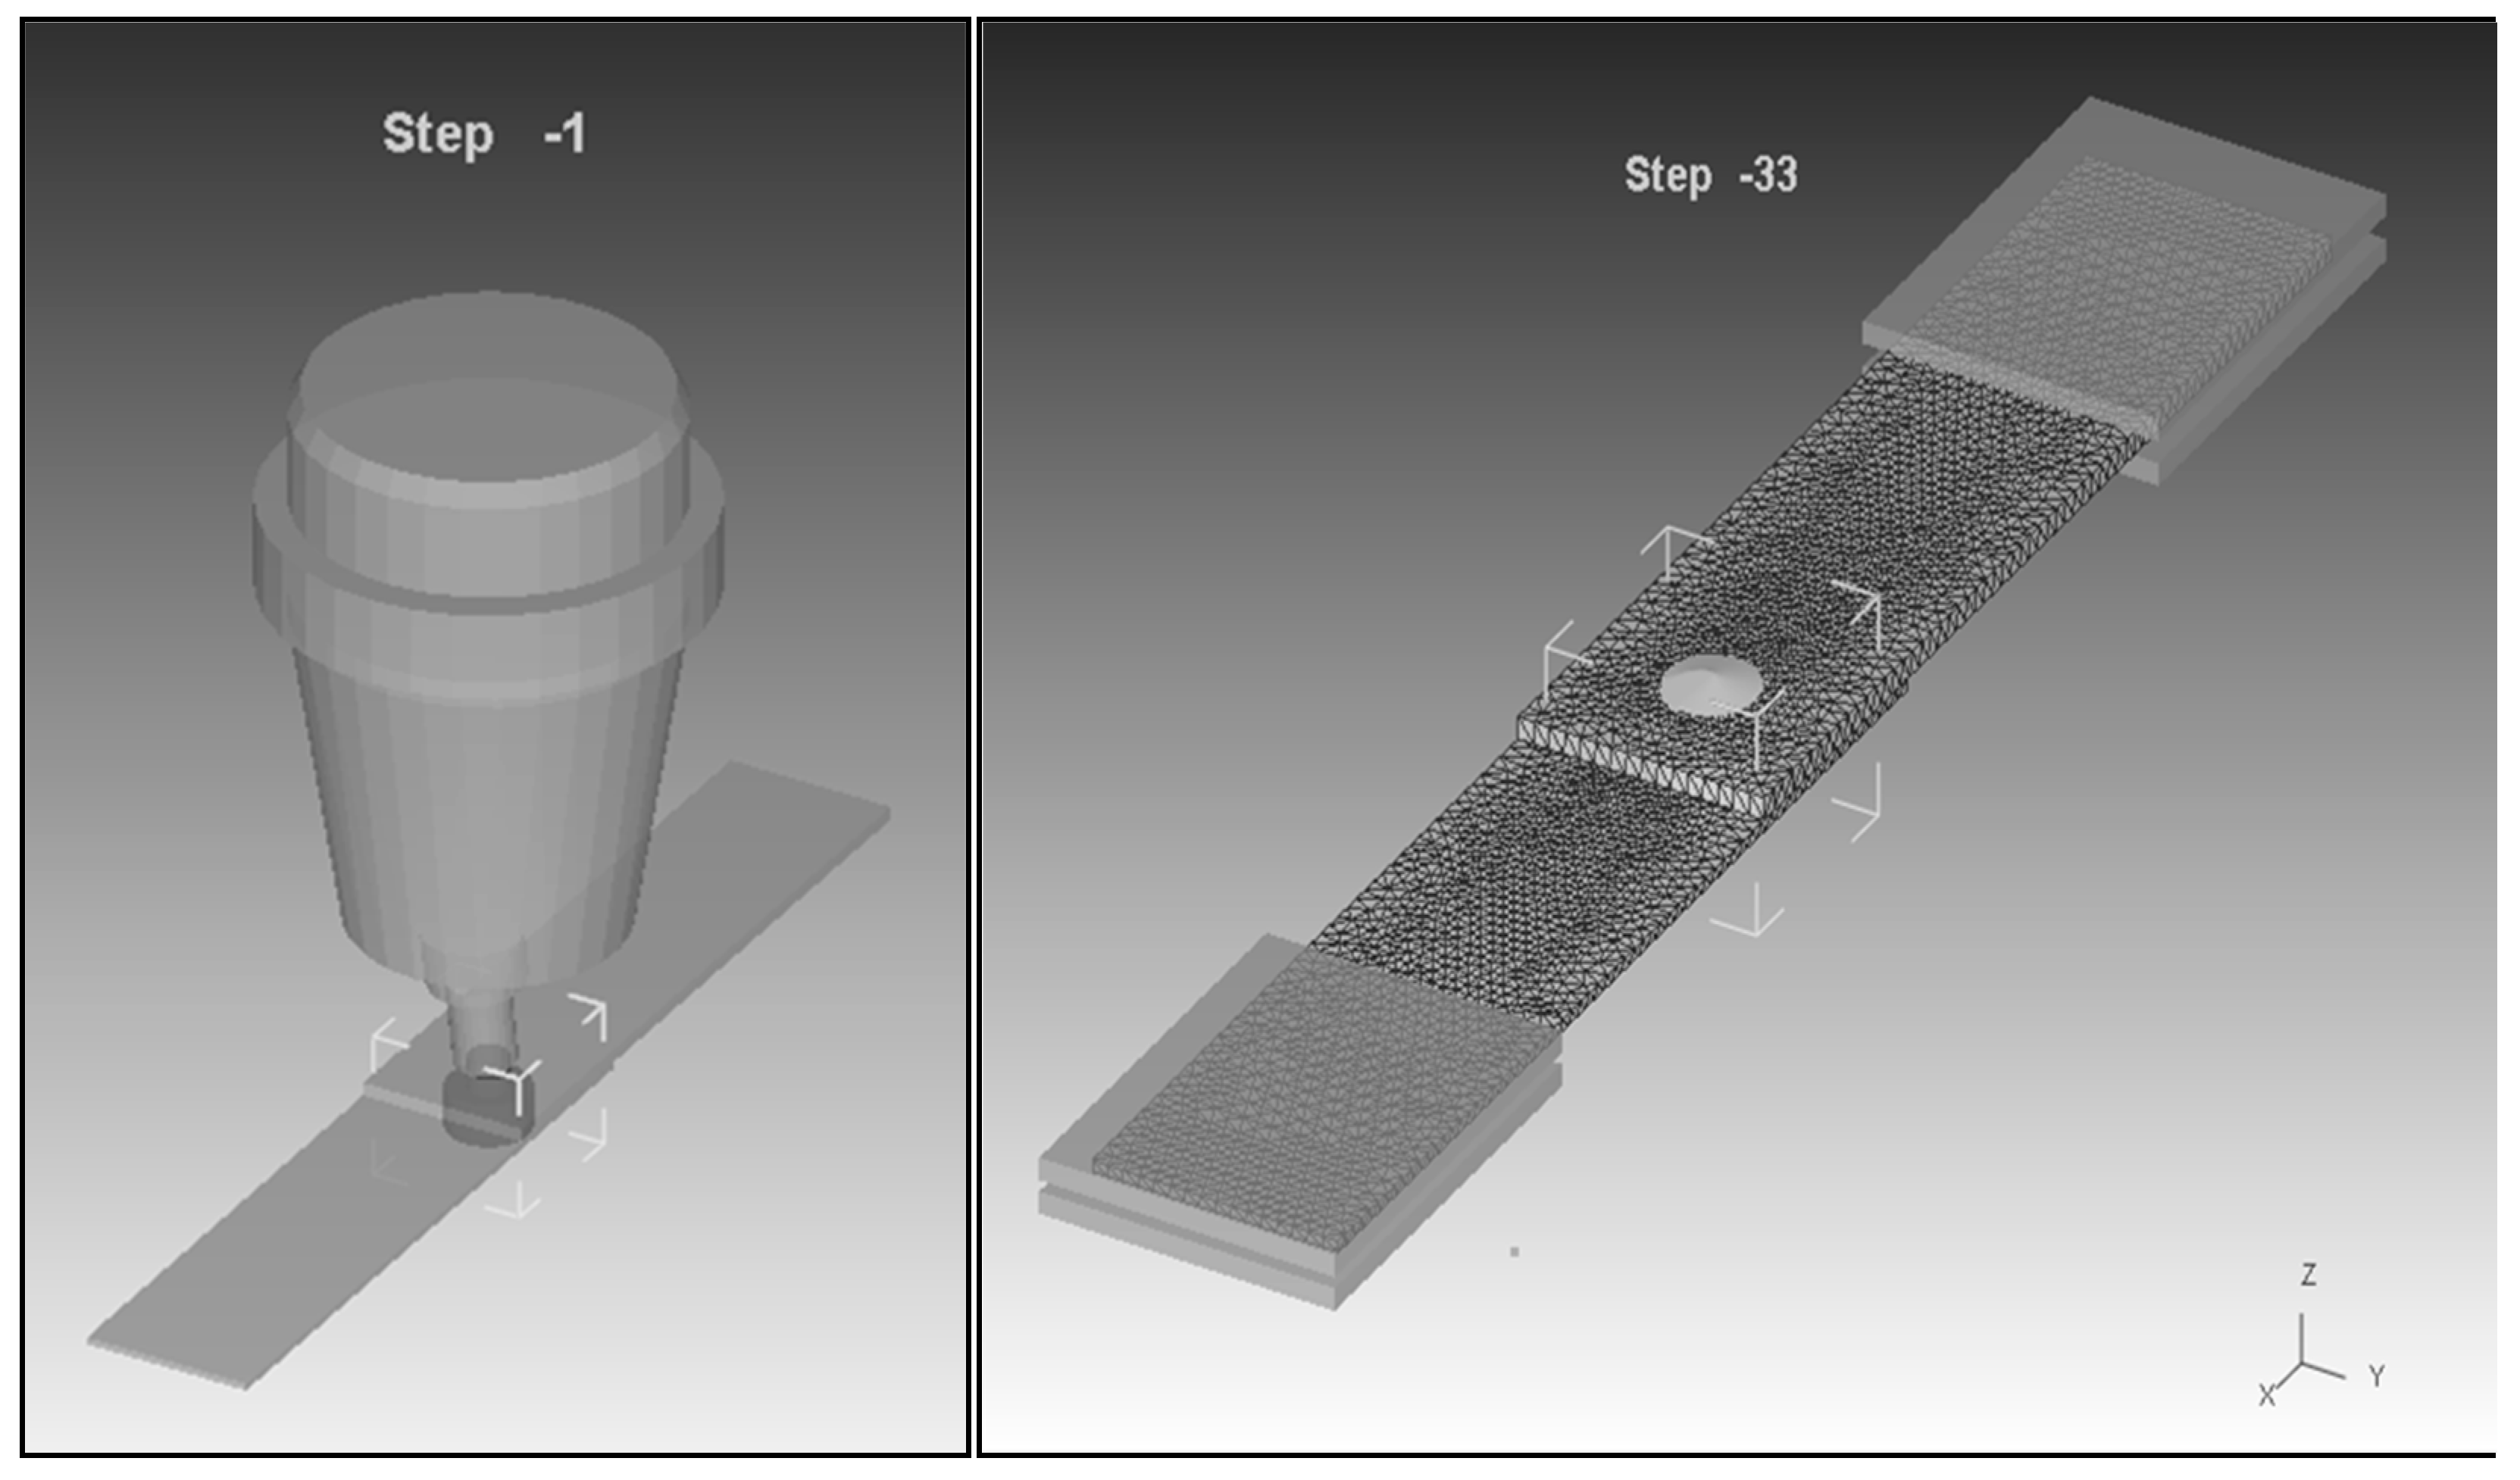
2.3. Joining Process
2.4. Single-Lap Shear Test
3. Finite Element Analysis
Fracture Criterion
4. Results from the Single-Lap Shear Tests
- -
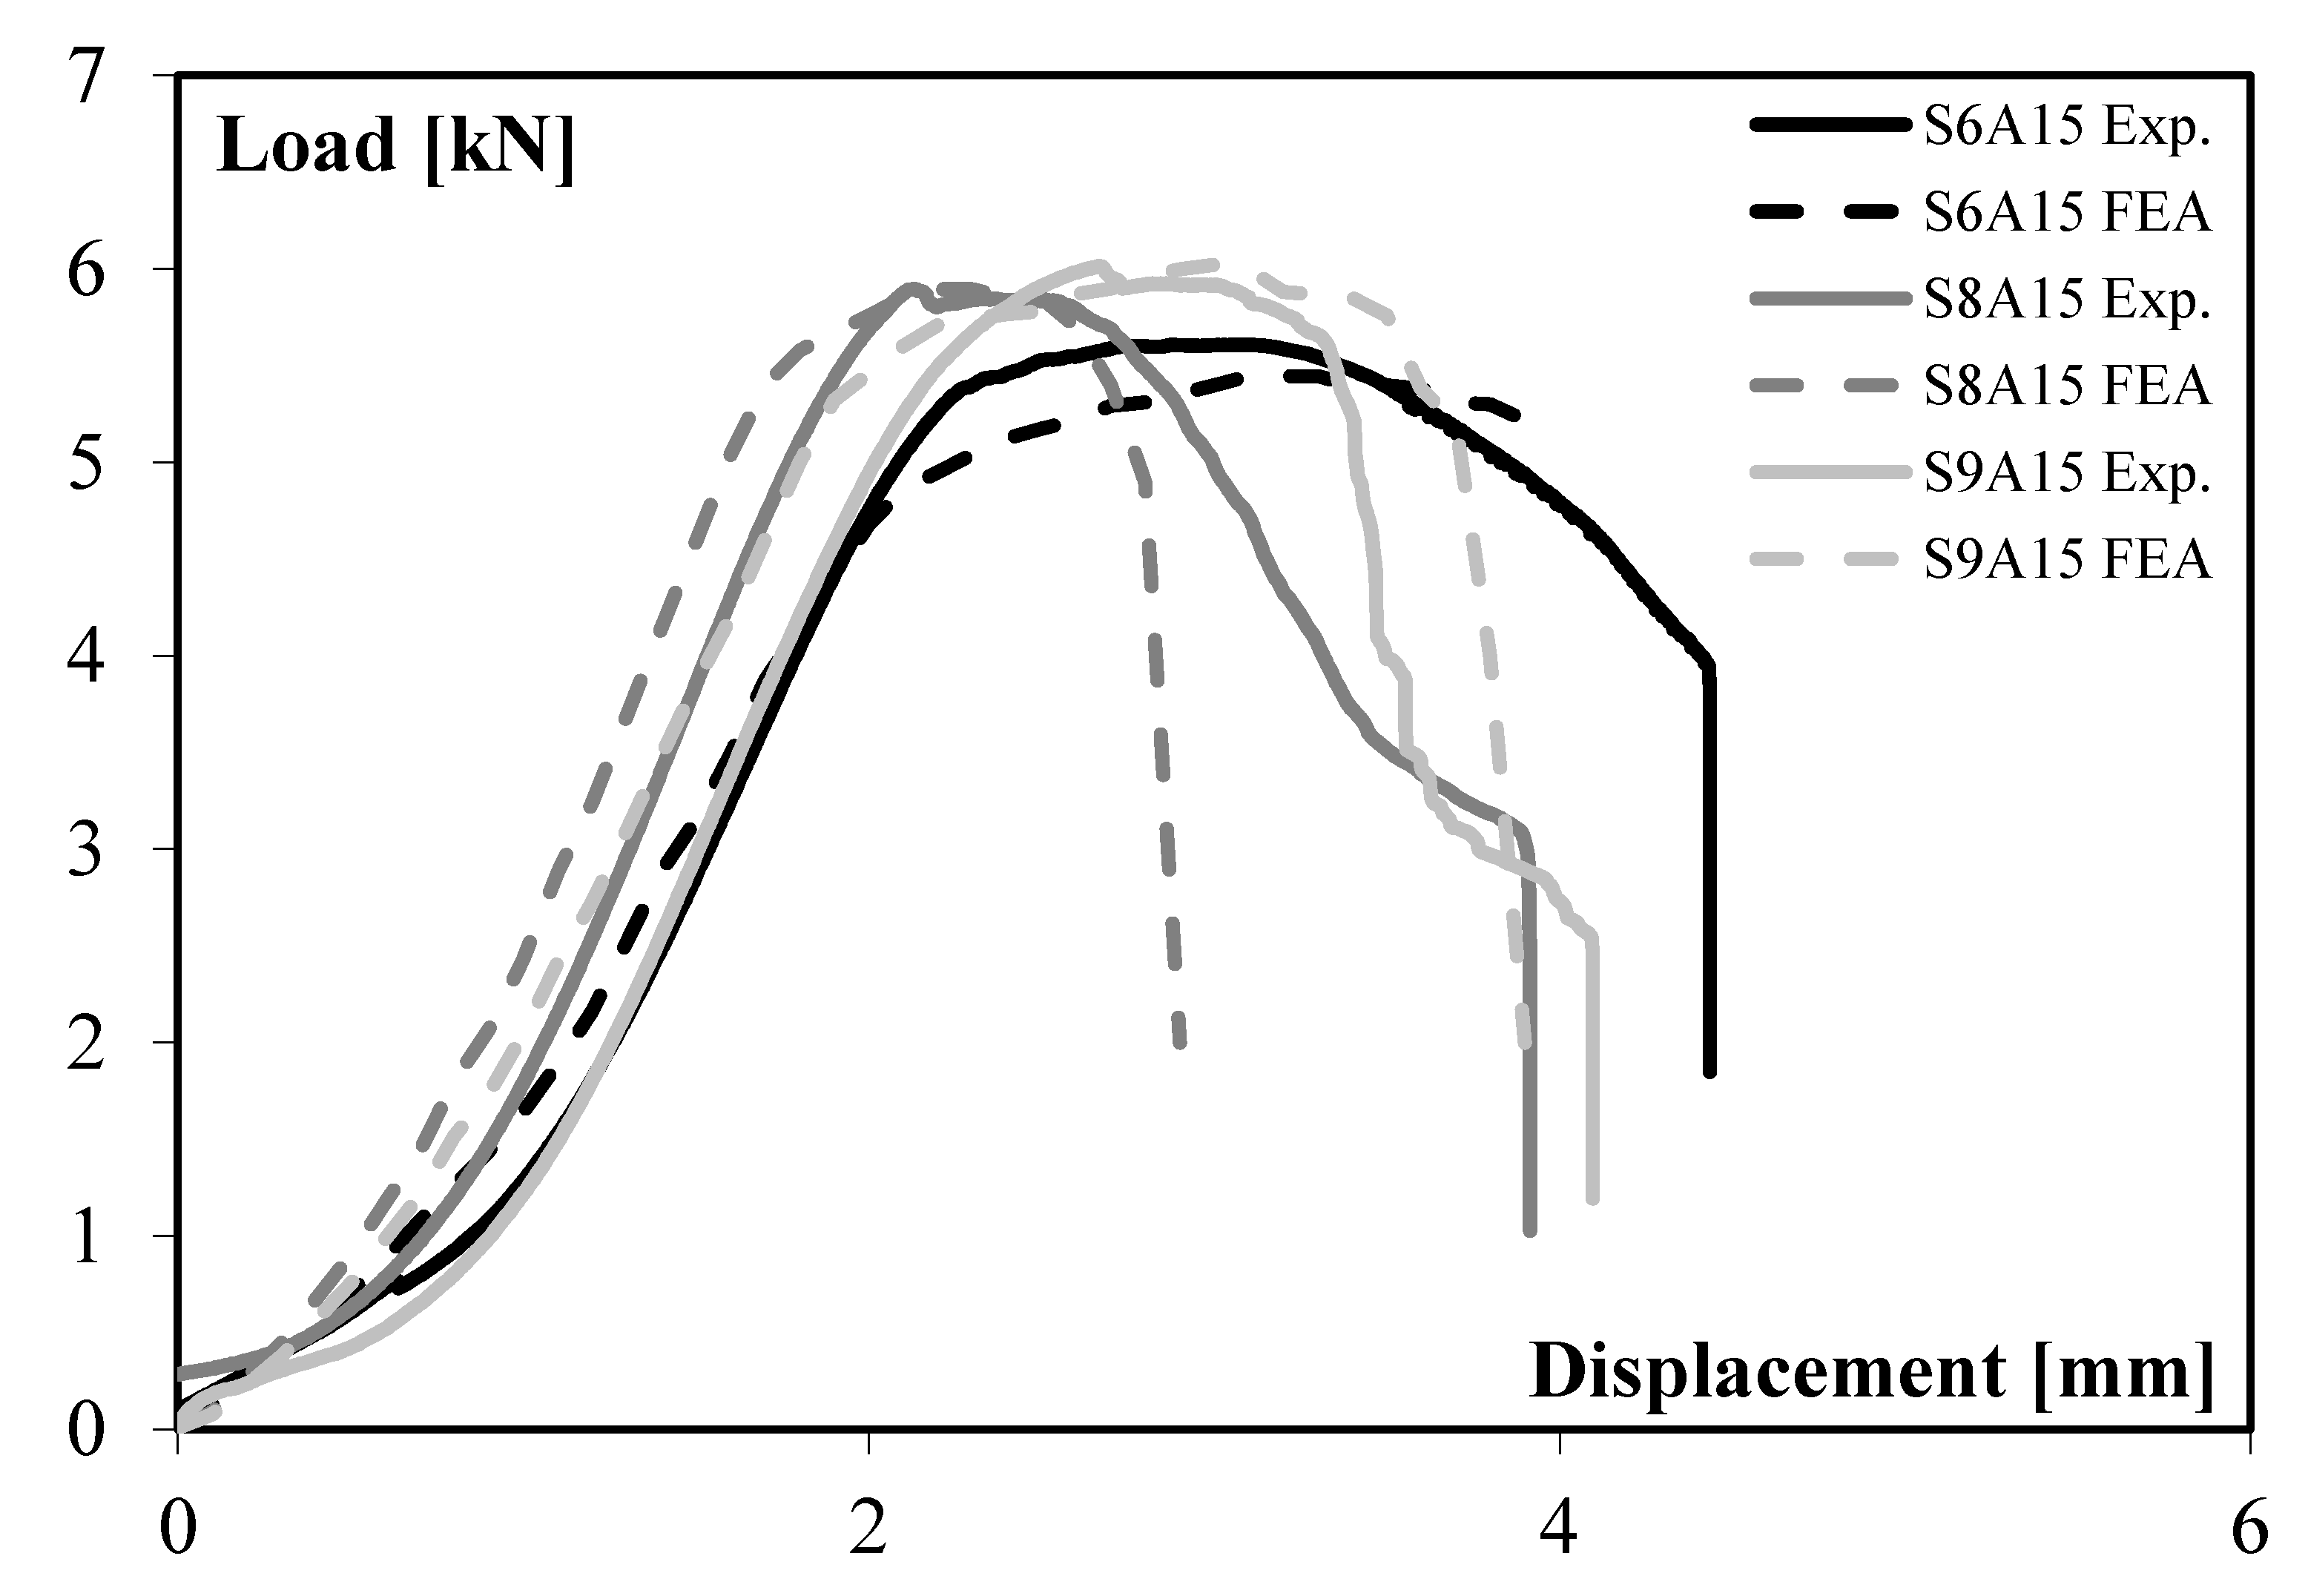
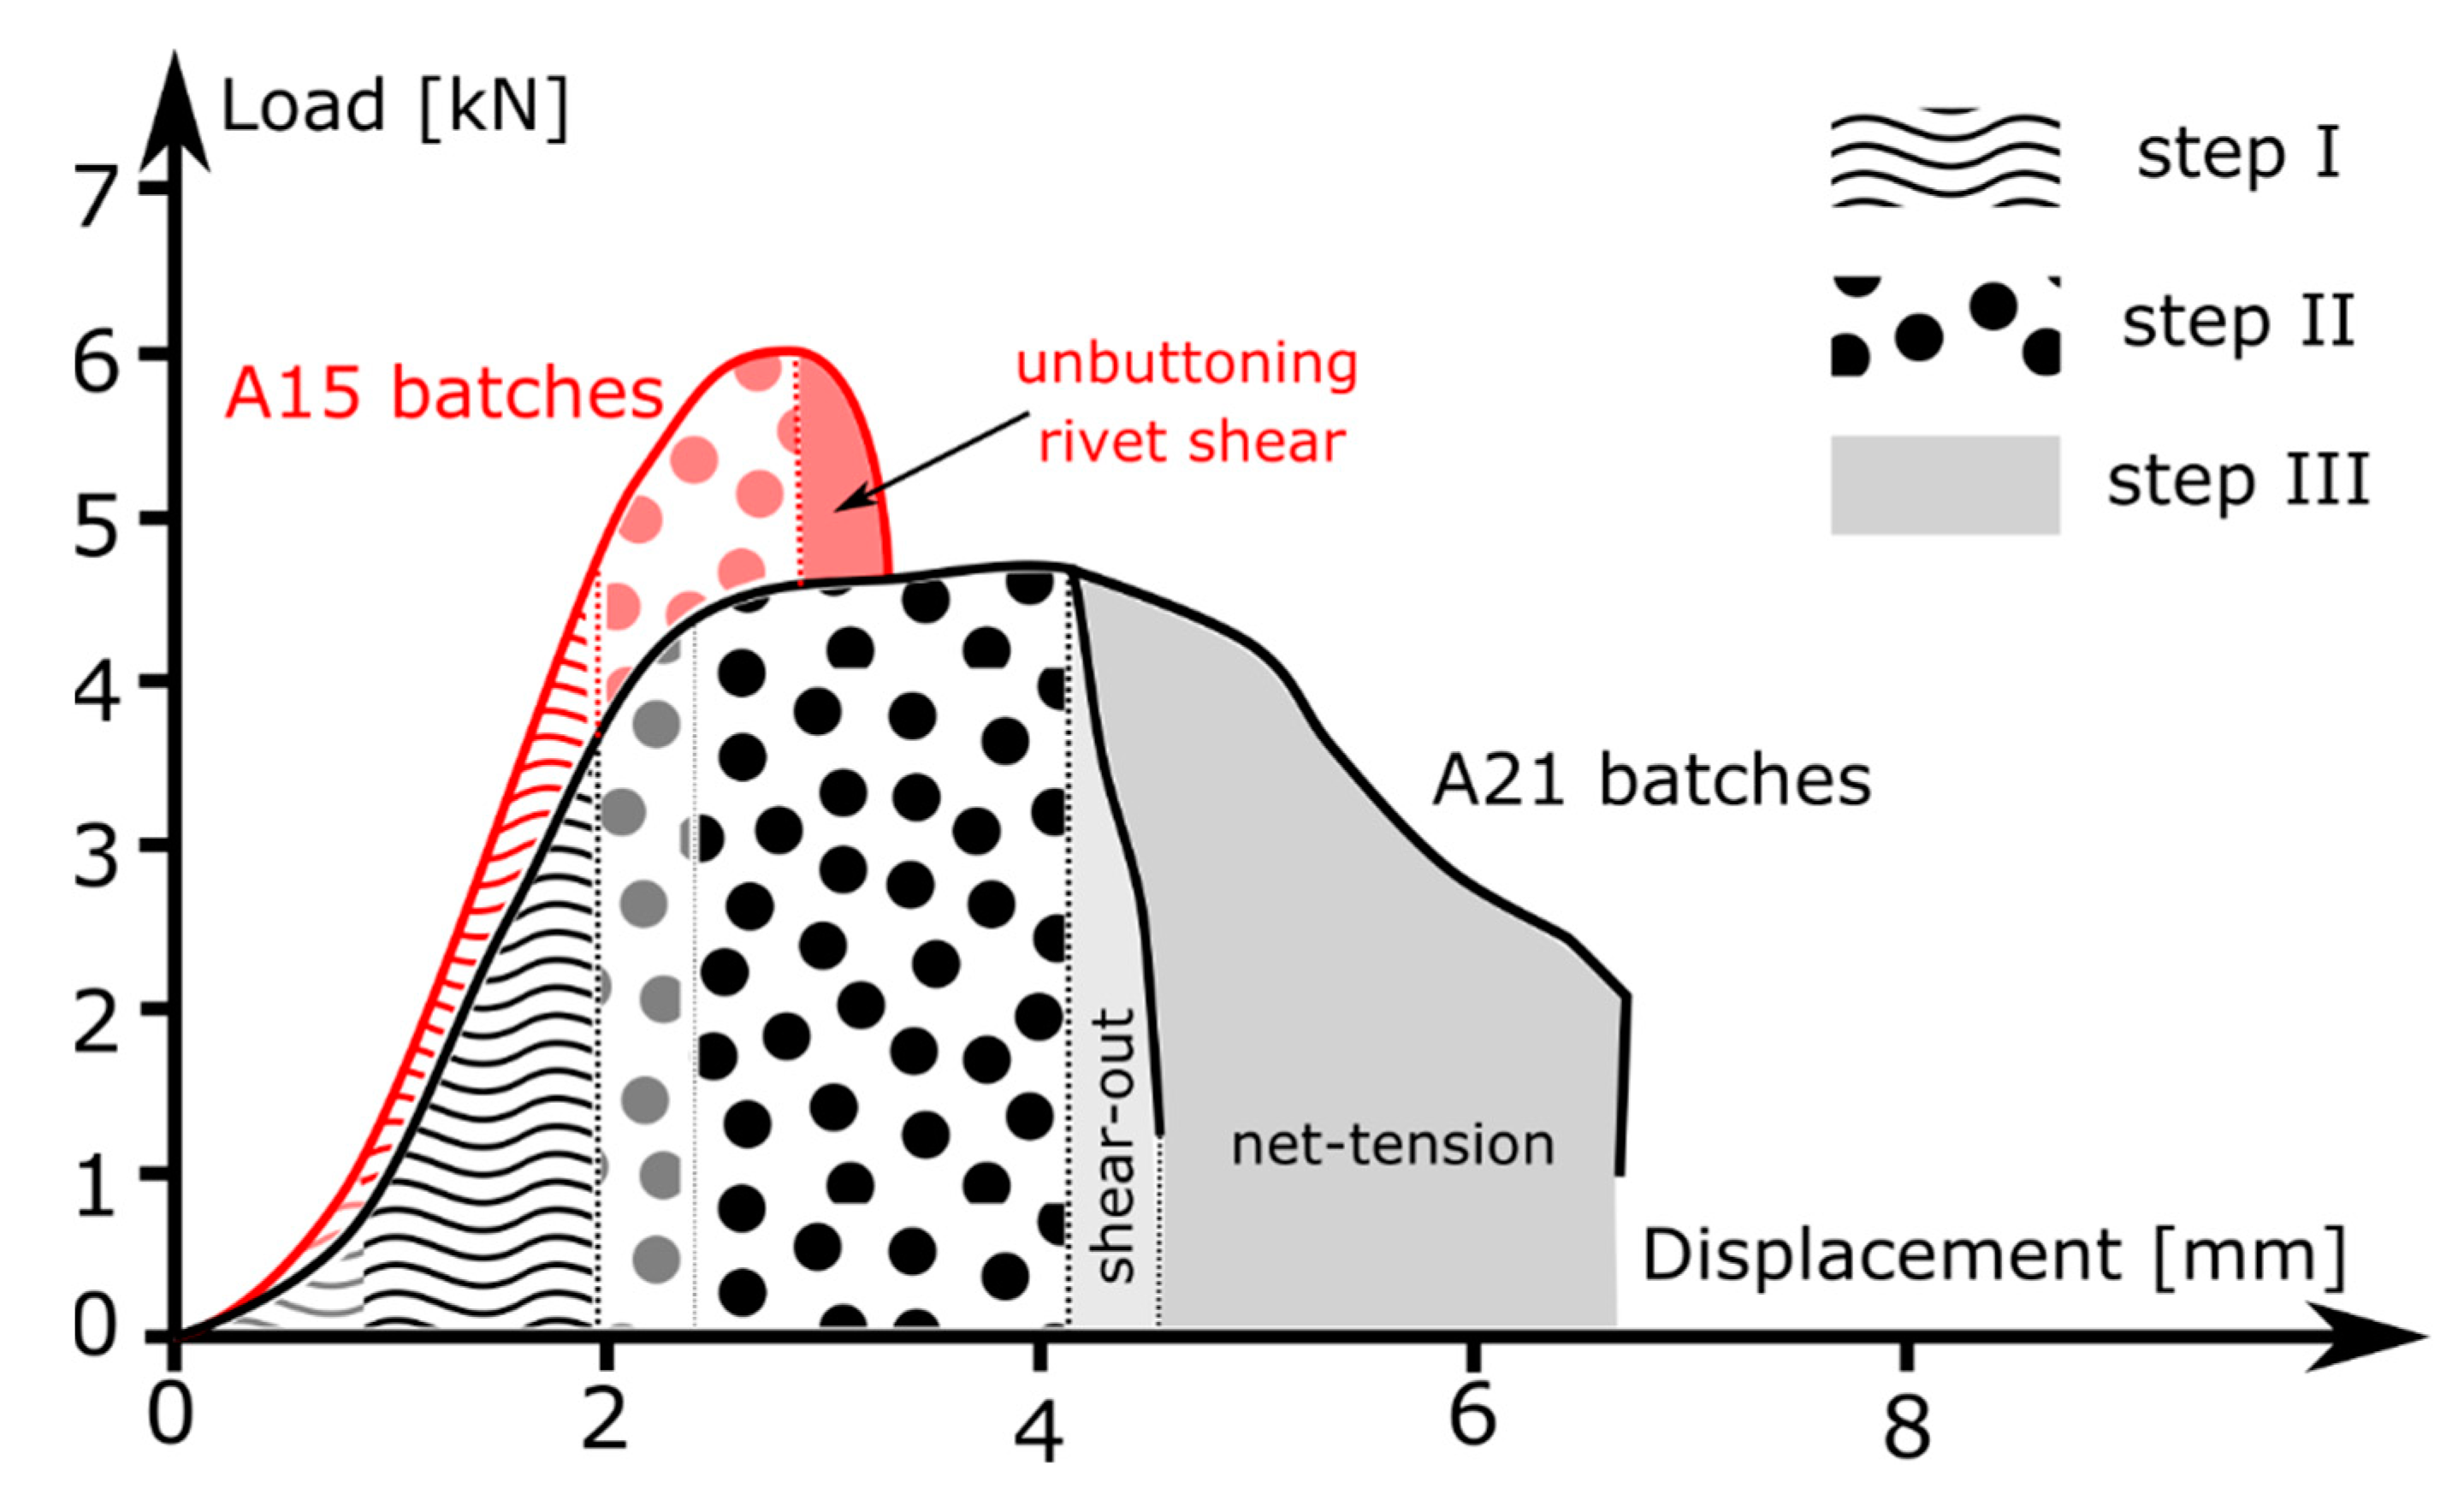
- In the initial region, at low displacement, two sub-steps can be seen. First, mechanical adjustments (i.e., backlash and axis deviation) occur. These have no effect on the mechanical behaviour of the joint and are not considered in the performance evaluation of the riveted joints. Then, in the second sub-step, a progressive and linear increase in load with increasing displacement is observed. The strength of the joint depends on the shear strength of the rivet. The slope, which is indirectly related to the stiffness of the joint, is similar for all specimens of this configuration.
- -
- In the next region, a gradual loss of linearity of the load–displacement trend is observed followed by a decrease in the slope ΔP/ΔL of the curve. The sample starts to twist, and the sheets move away from each other, causing some local deformation. Consequently, at this stage, the performance of the joint depends only on the rivet and the resistance is carried by the joining point. The curve increases until reaching the maximum value.
- -
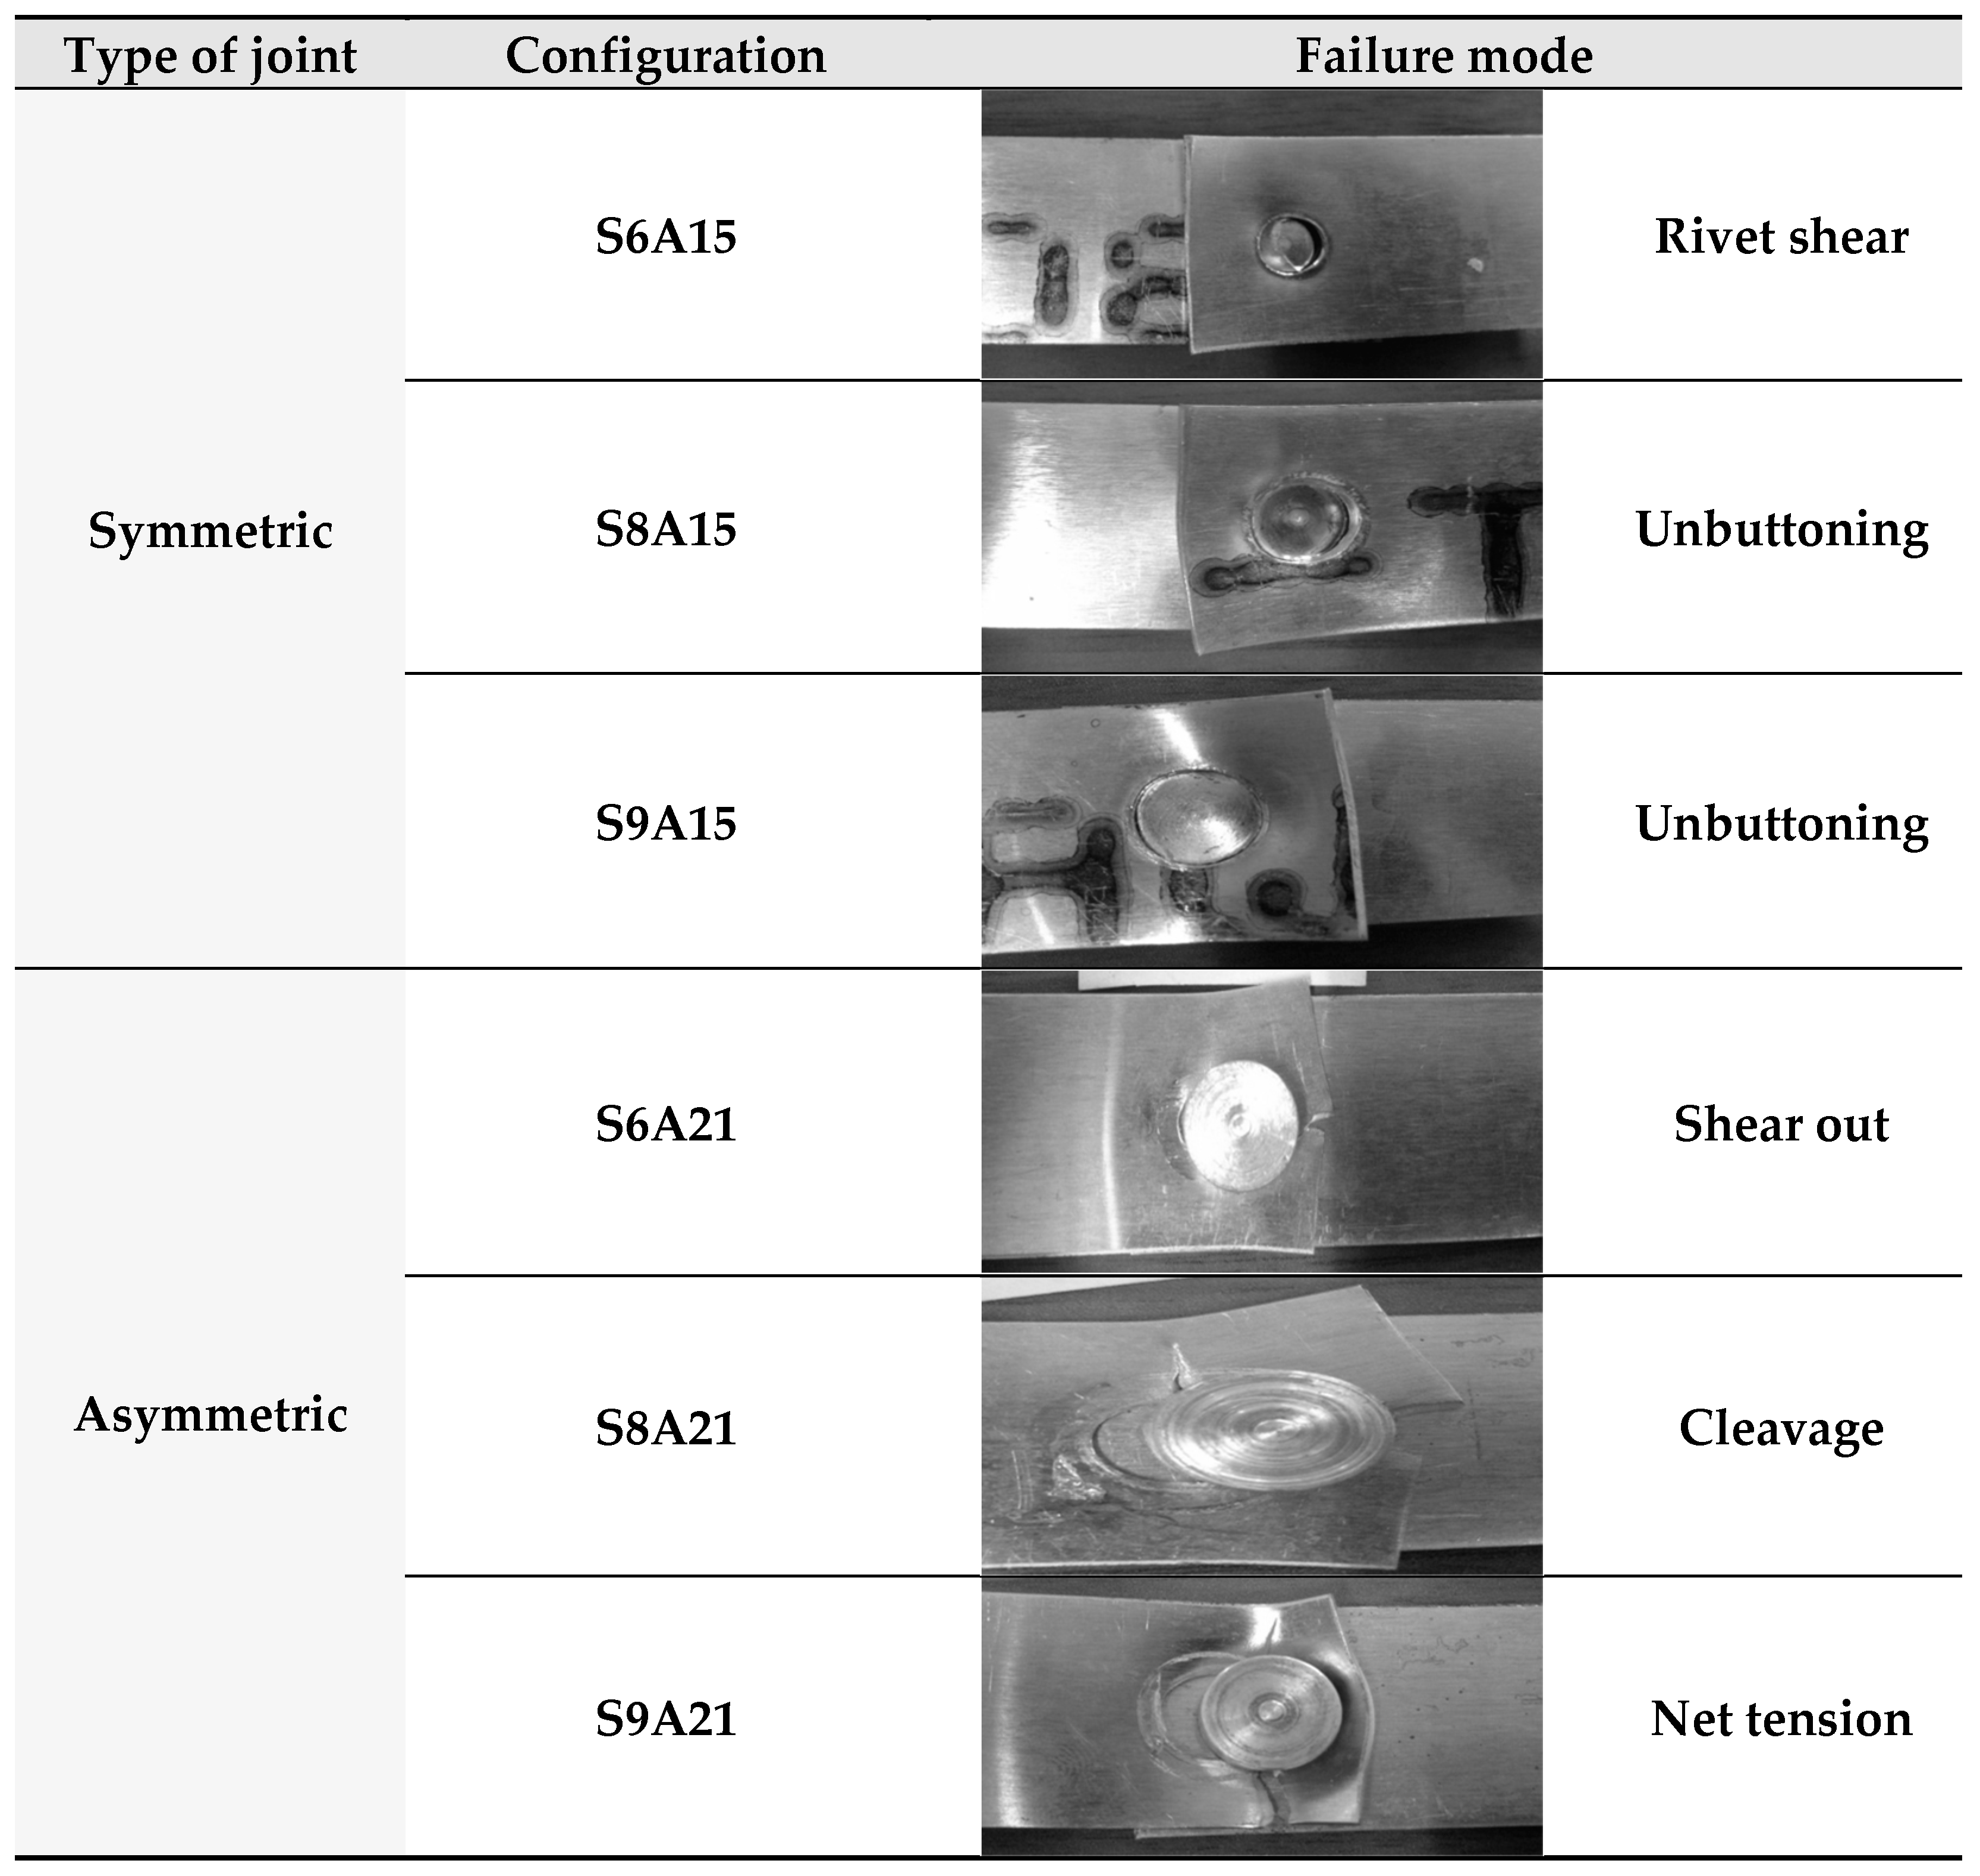
- Additionally, in the last region, two sub-steps can be seen. First, the load starts to decrease, but its specific trend depends on the type of failure mode, which can occur for rivet shear or unbuttoning. For a smaller rivet diameter (i.e., sample S6A15), the load decrease is slighter: the fracture occurs for rivet shear, i.e., the shear cracks propagate gradually in the rivet. For a higher rivet diameter (i.e., samples S8A15 and S9A15) the corresponding curves show a similar trend, and the load decrease is more drastic, with the slope also changing at the end: the fracture occurs for unbuttoning, while the load decreases gradually. Finally, all specimens break down and the load decreases drastically.
- -
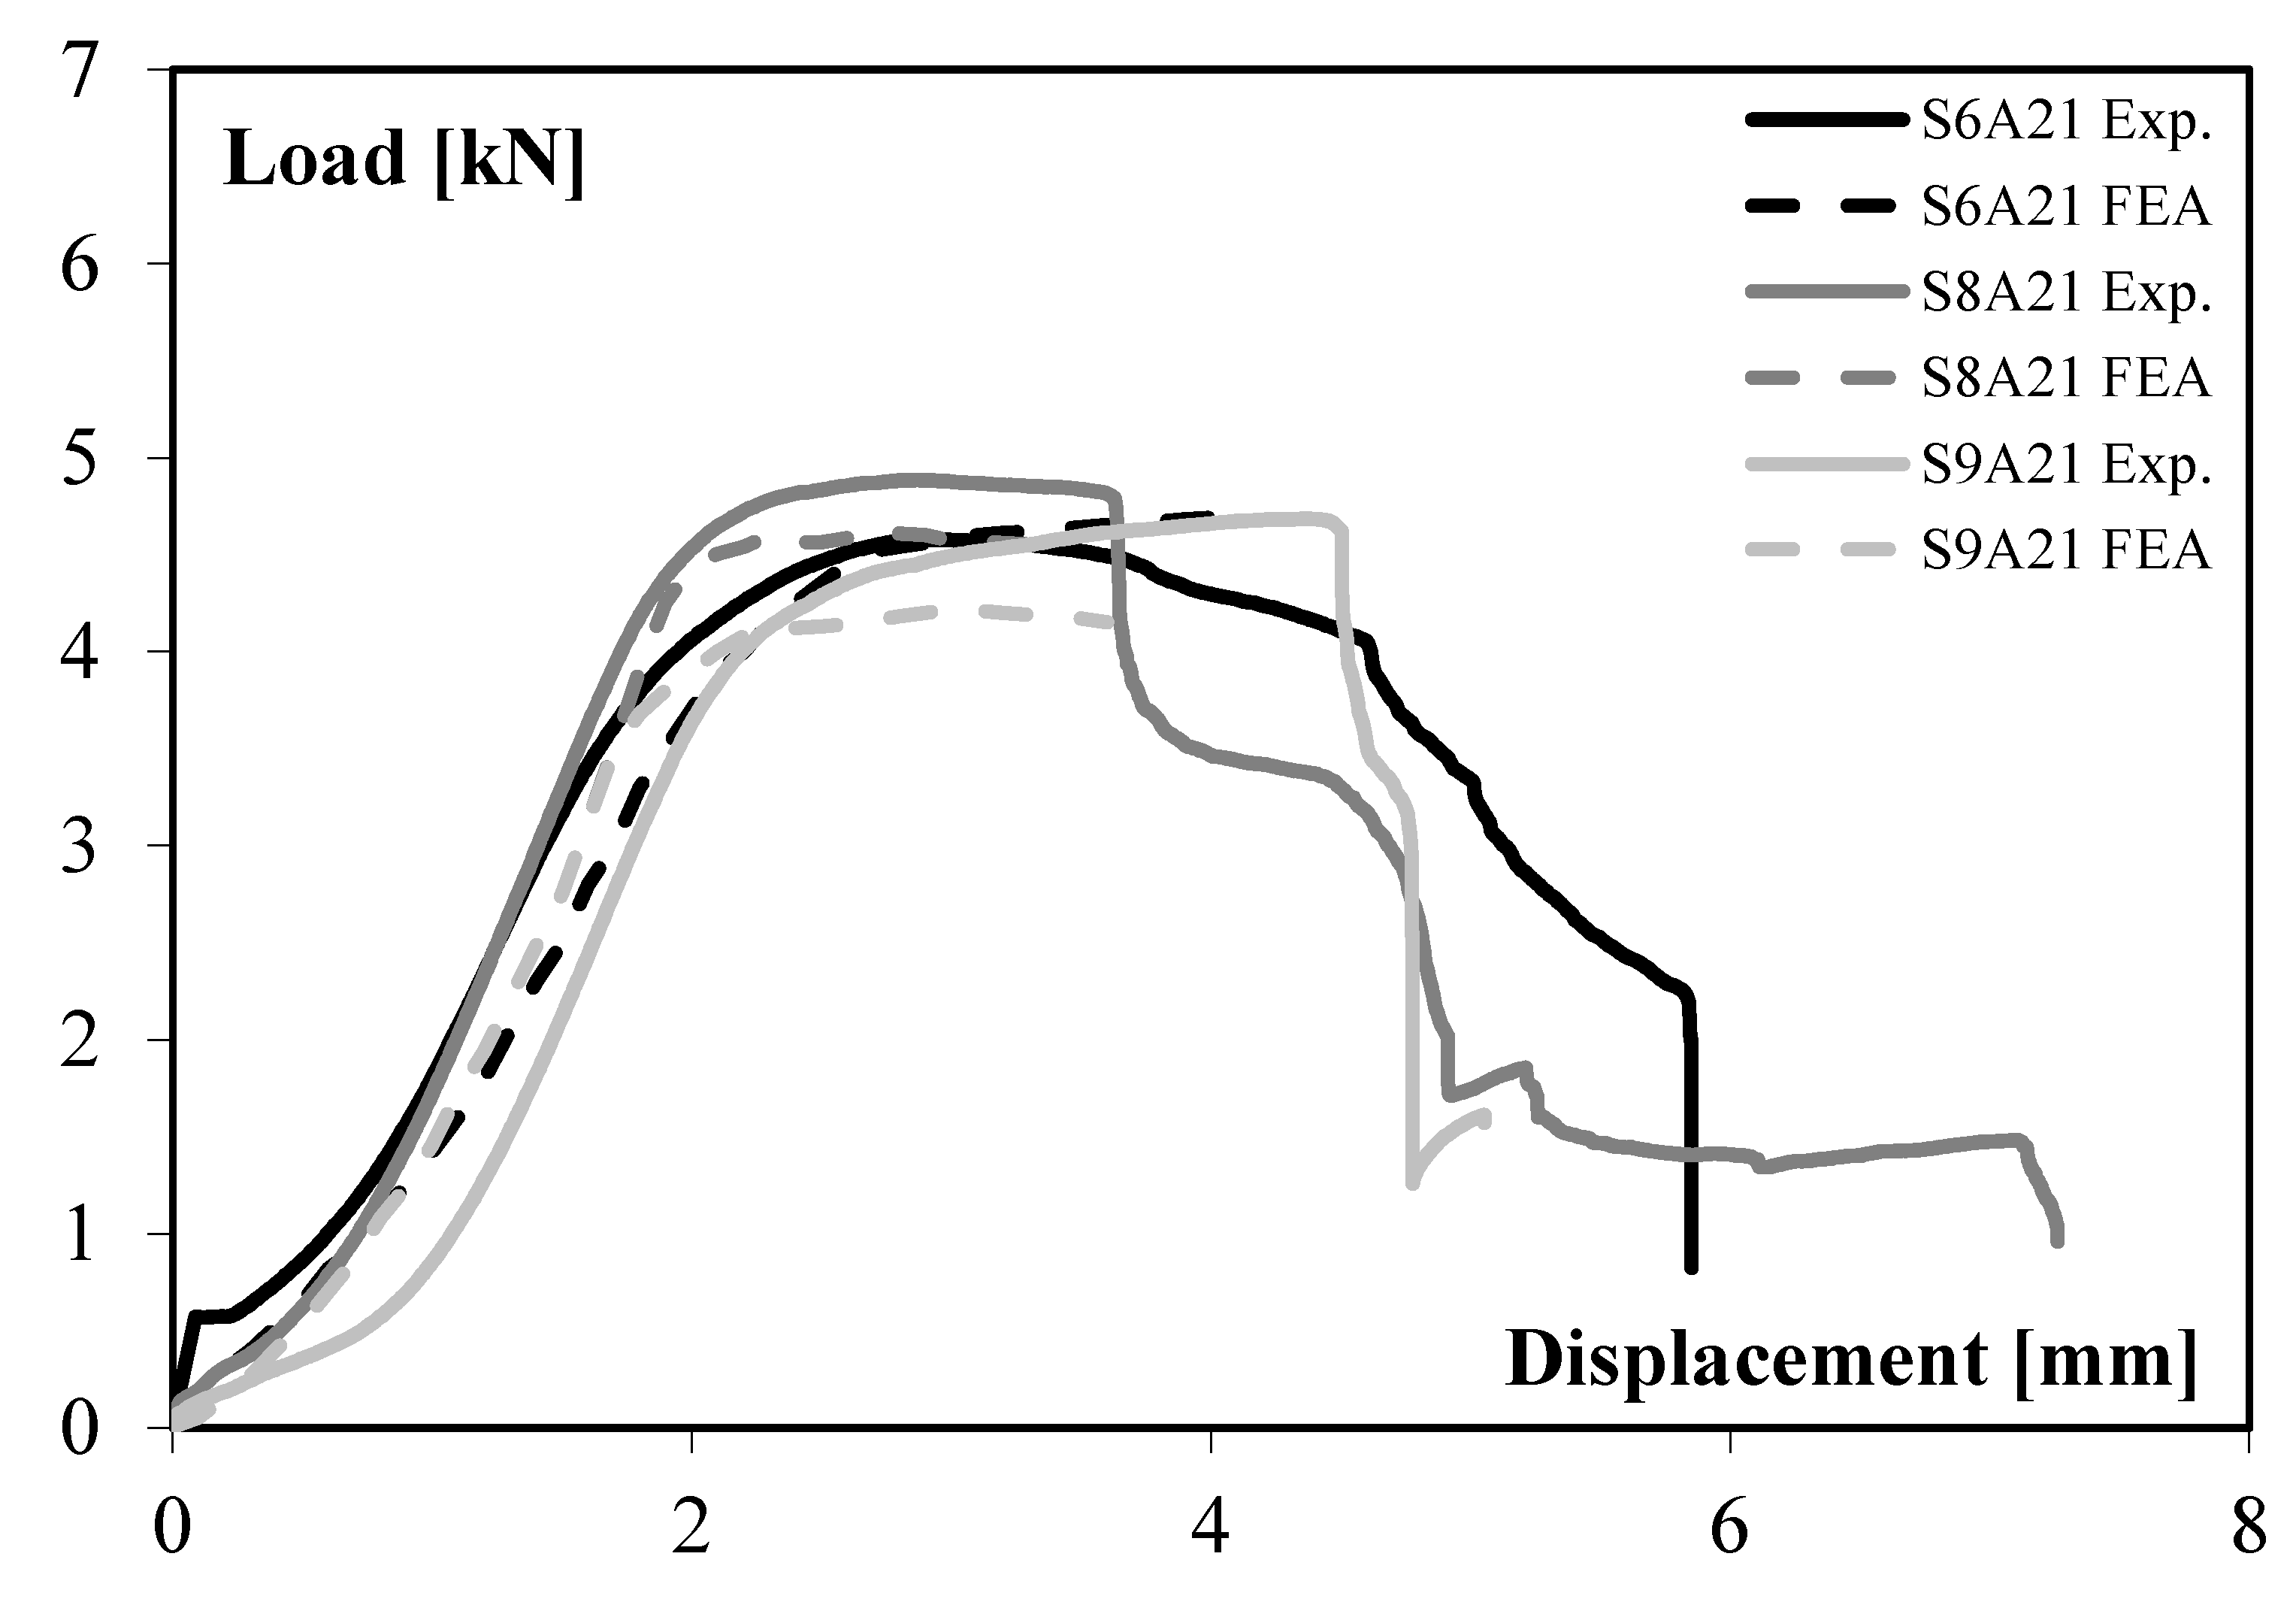
- For a low rivet diameter, the load slightly decreases at first, and then the slope of the curve changes and the reduction is more sudden. The distance between the edge of the hole and the edge of the sheet is small, and the fracture occurs for shear out.
- -
- For a high rivet diameter, the load decreases drastically. The area of the sample cross section is particularly small, and fracture occurs for net tension.
- -
- For a medium rivet diameter, the trend shows a few steps with a final residual load. This trend seems to be a compromise between the previous ones: drastic decrease, slight, again drastic, and plateau. In fact, the fracture occurs for cleavage, which can be considered as a mixed failure modes between shear out and net tension [23].
Experimental/Numerical Comparison
- -
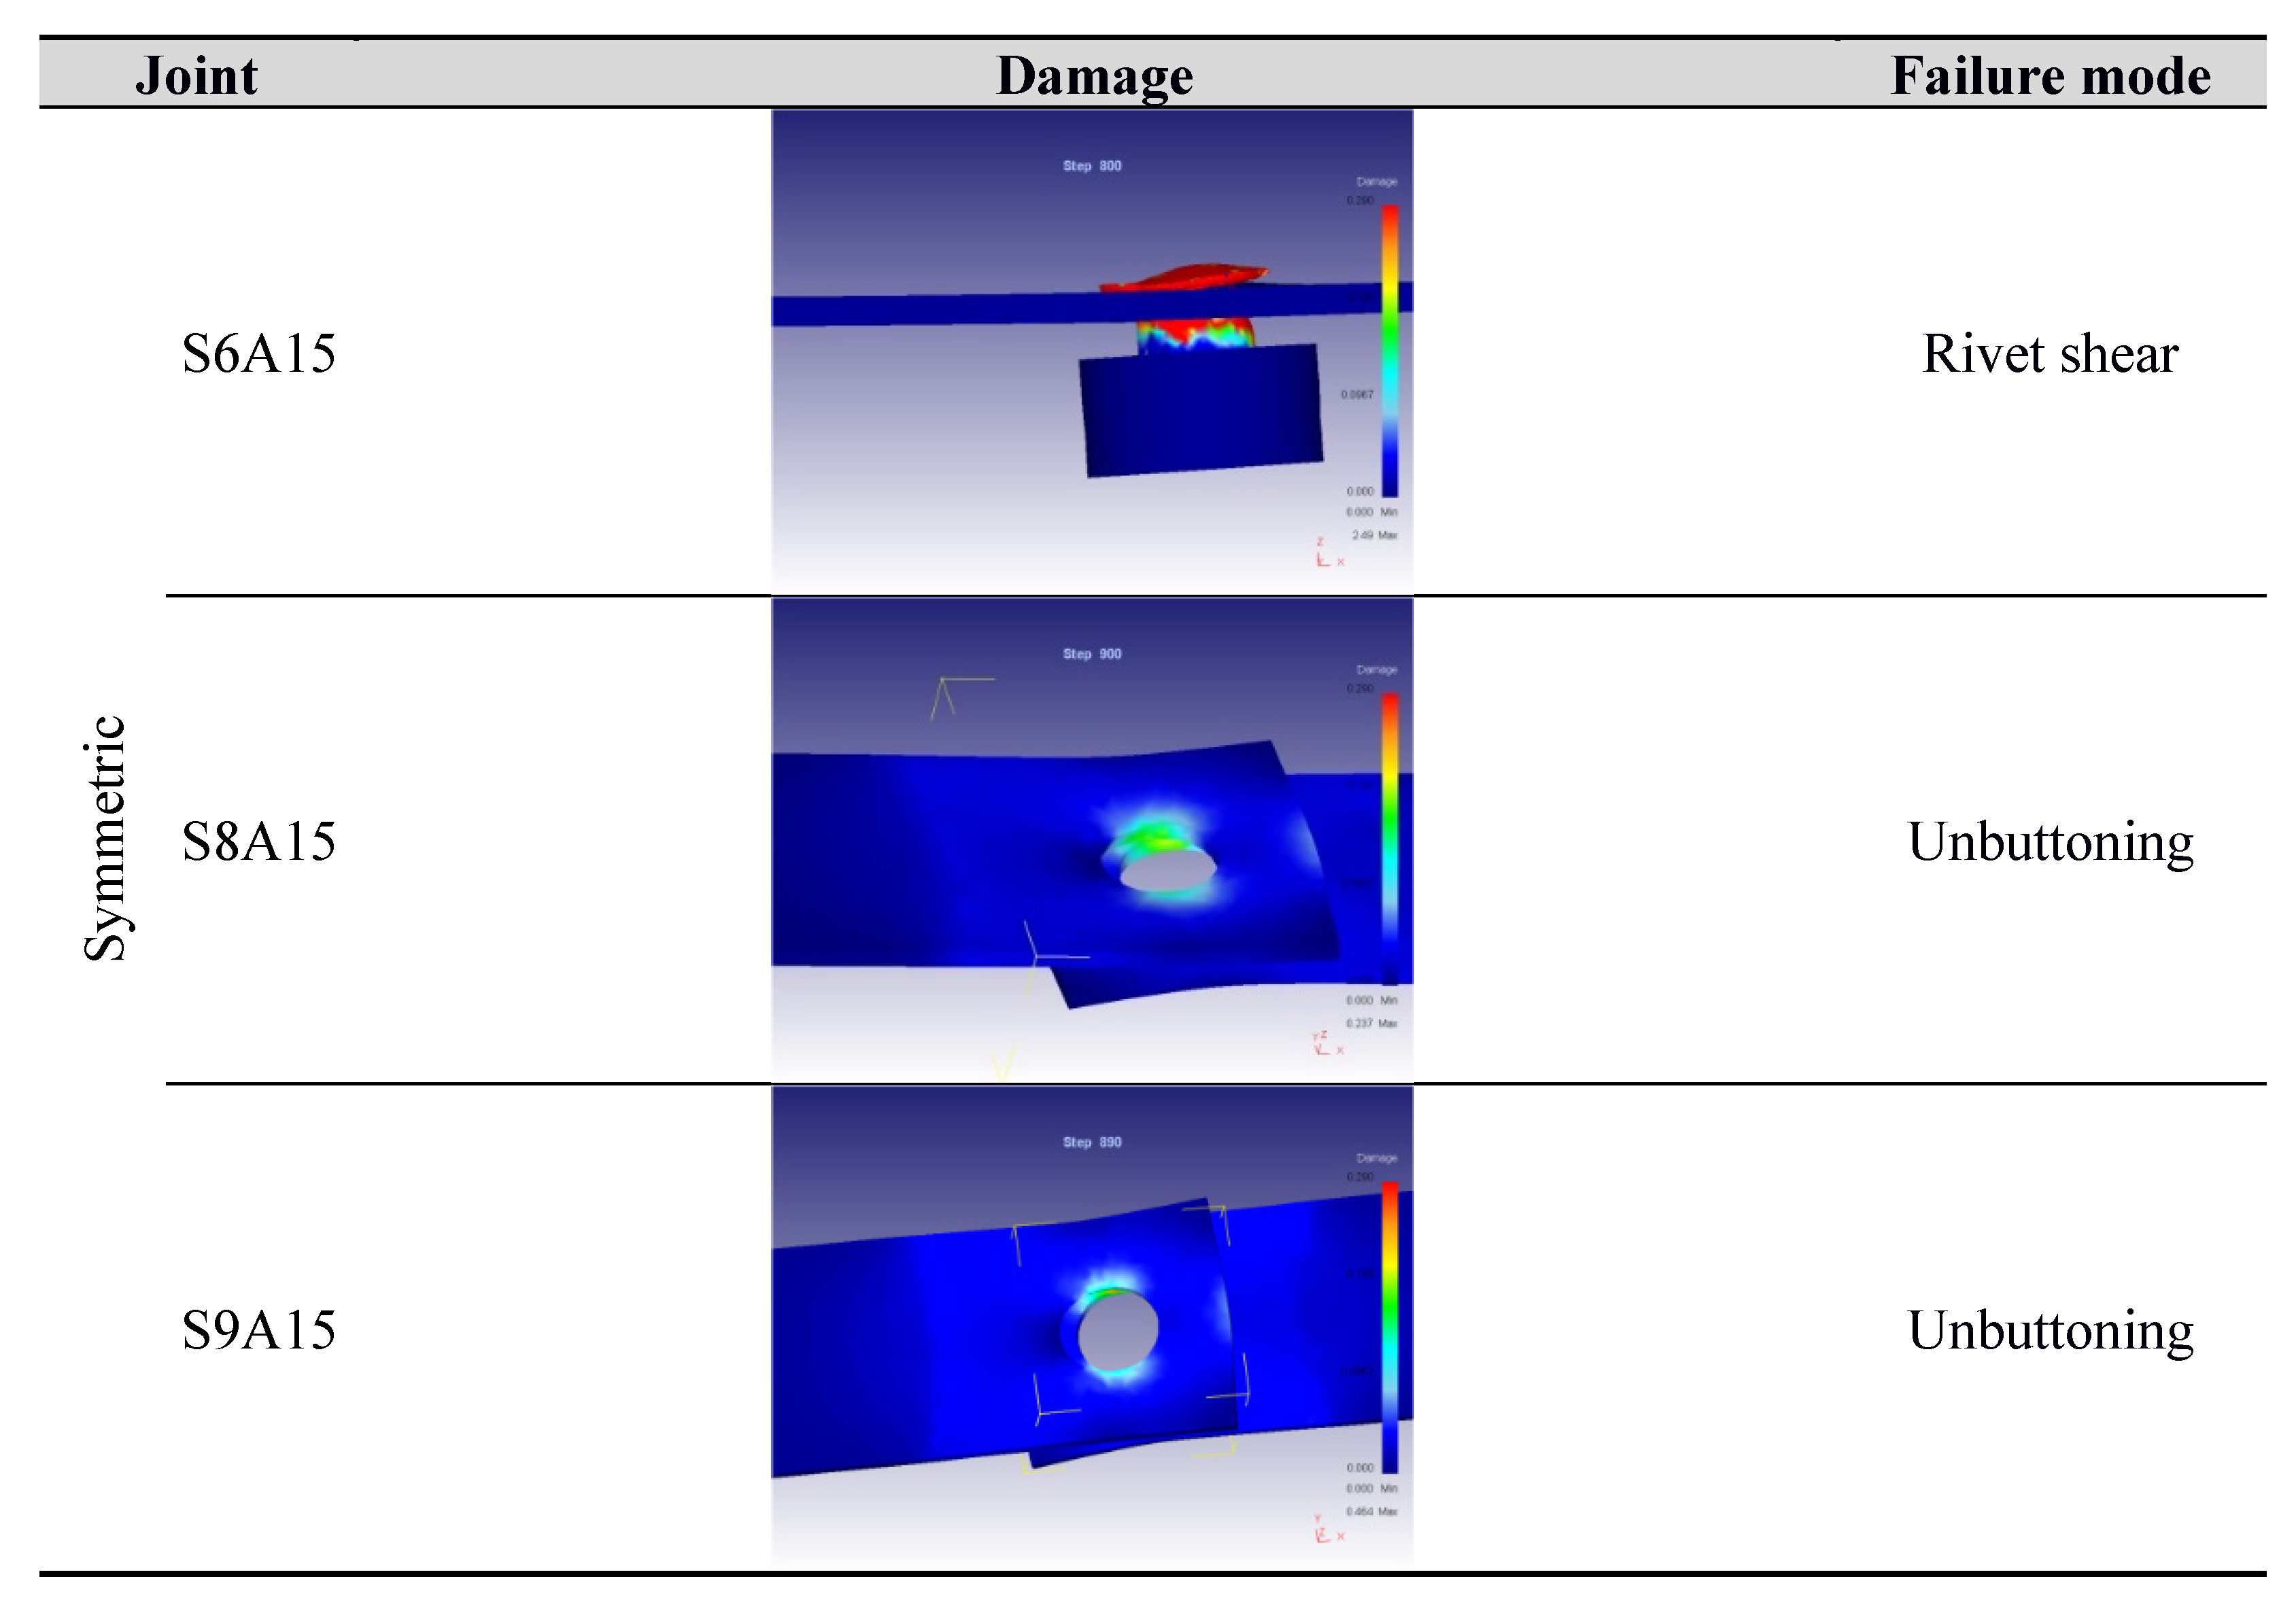
- Symmetrical joint S6A15: the damage value at the rivet exceeds the threshold (0.29) at the neck of this last, while the values at the sheets are less than 0.2, proving the prediction of failure due to the shear of the rivet.
- -
- Symmetrical joint S8A15: in this numerical simulation, the values of damage are very low, while the hole of the thinner sheet is subjected to a strong deformation. At high strain, the rivet head inside the hole lifts off. The type of failure of the joint can be considered as unbuttoning.
- -
- Symmetrical joint S9A15: in this configuration, the results are similar to the previous ones, so the failure can be predicted as unbuttoning of the rivet.
- -
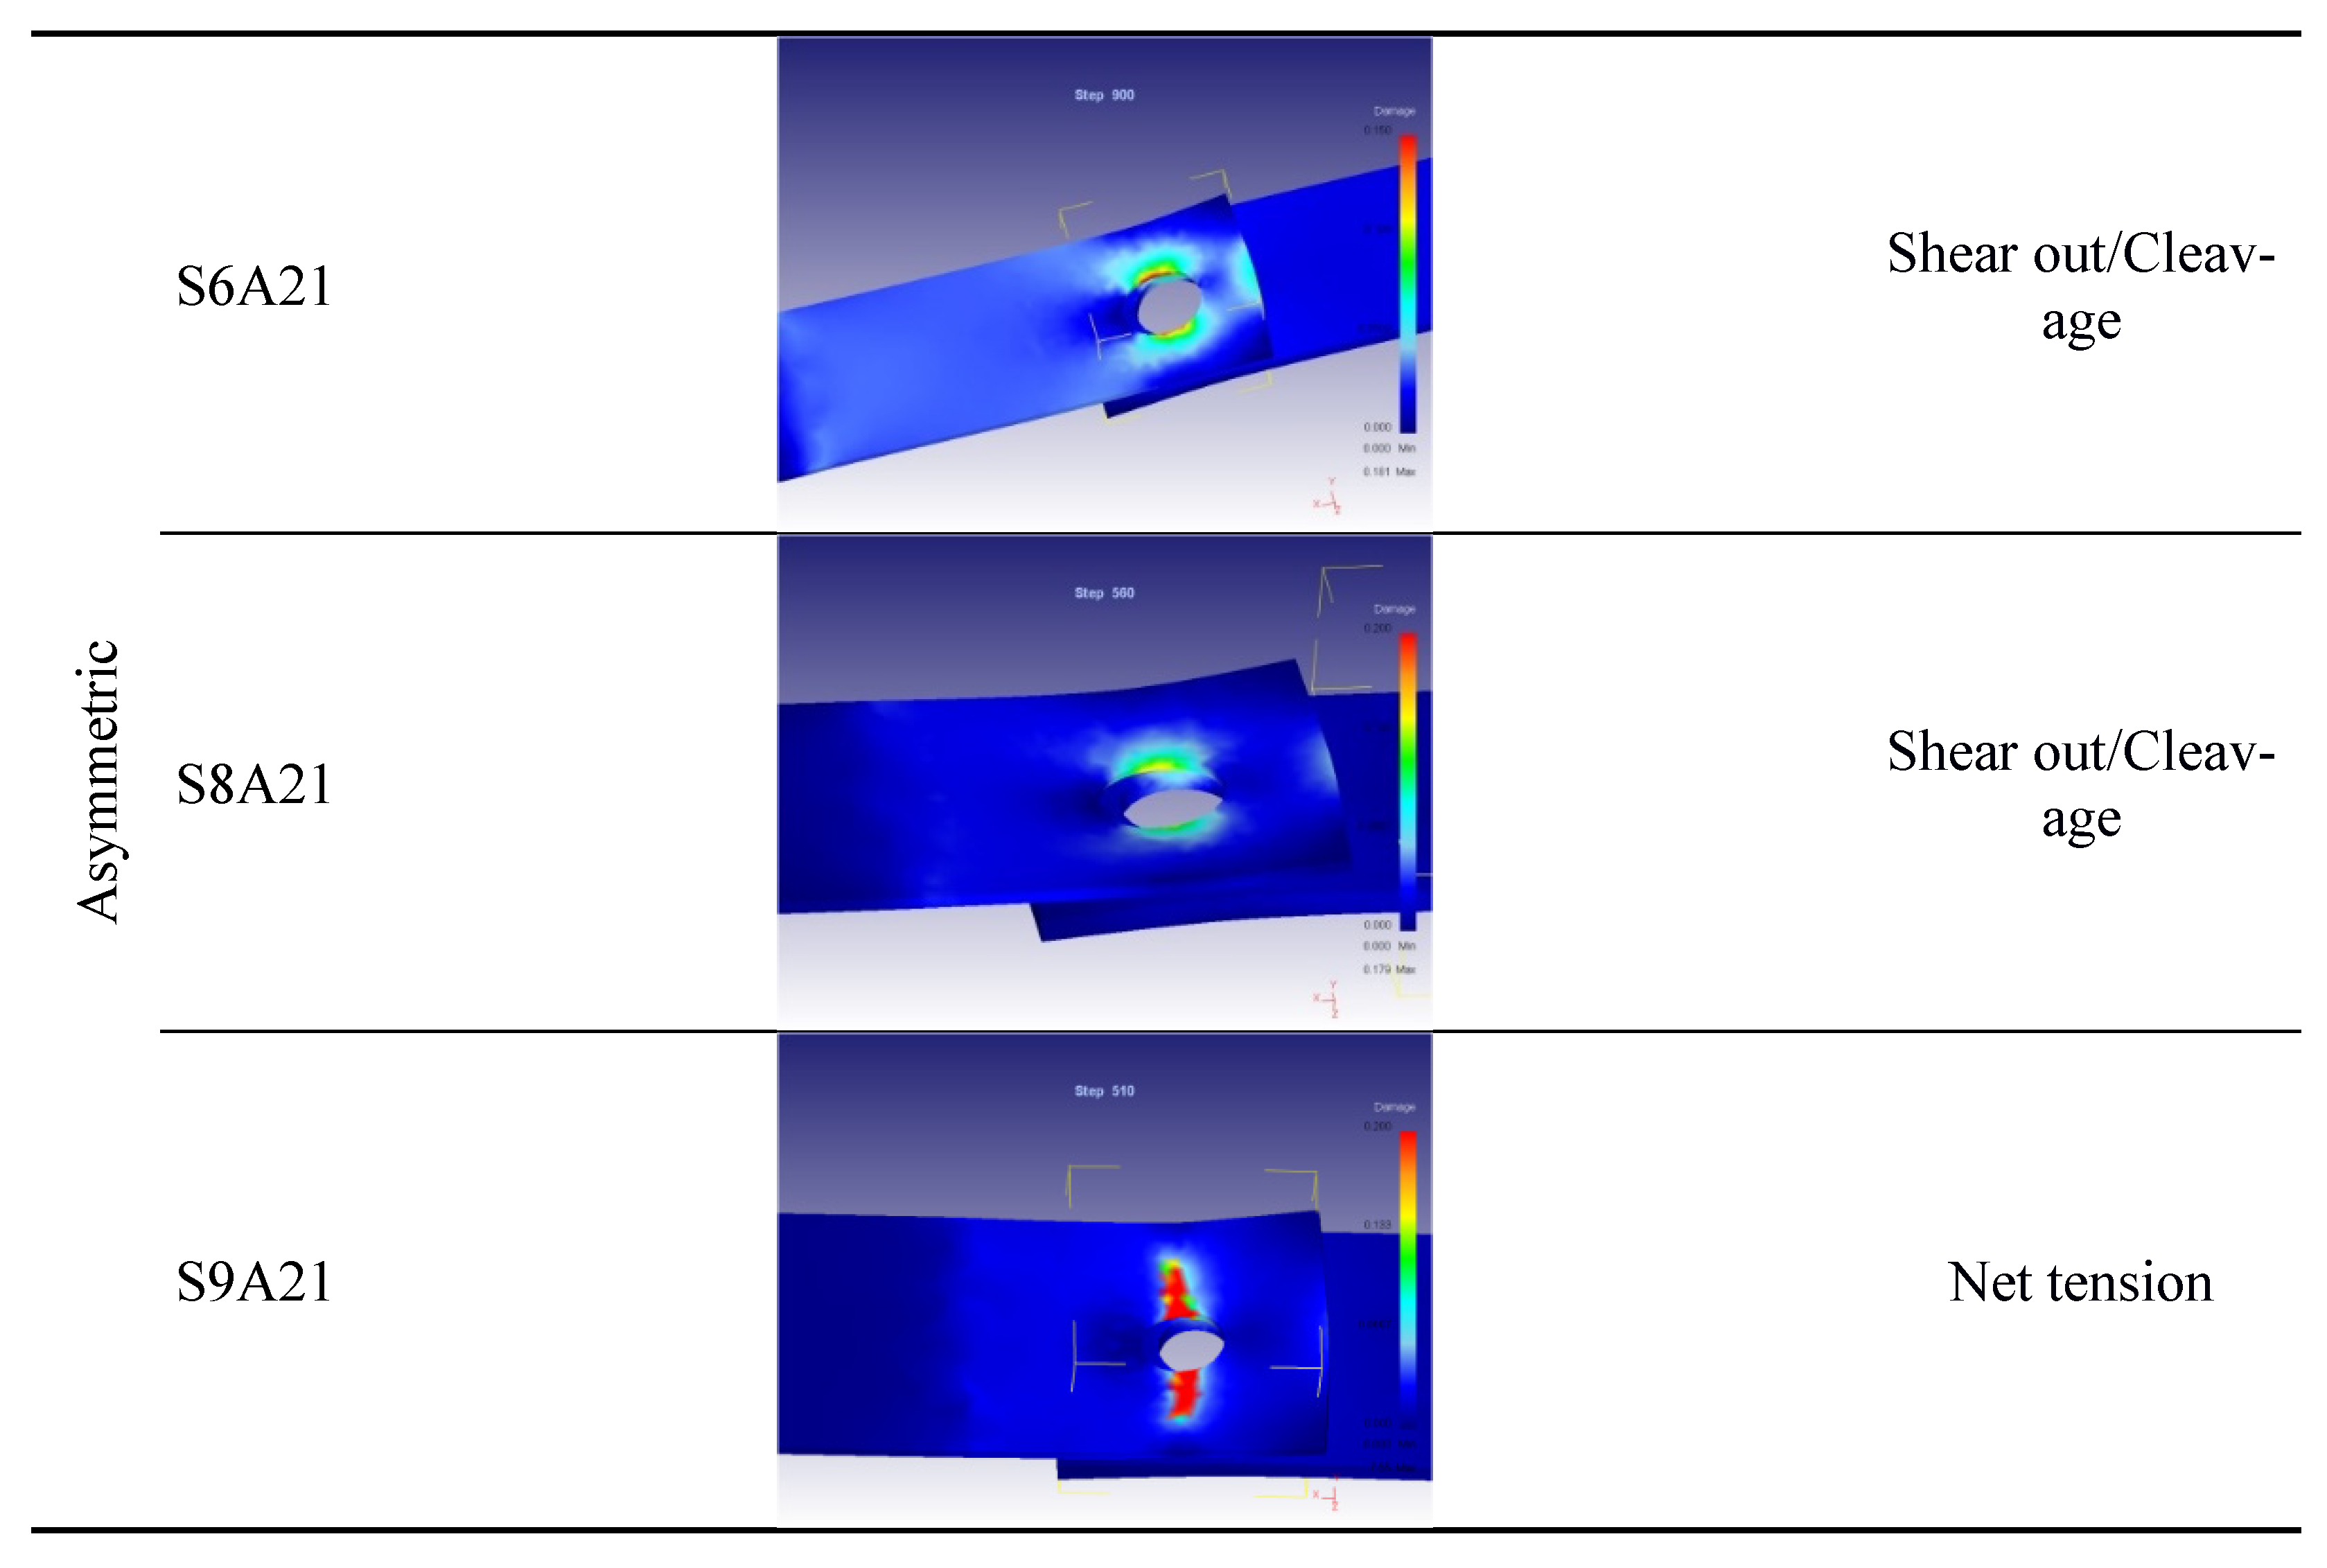
- Asymmetrical joint S6A21: the damage is localised in the lower (thinner) sheet, around the hole and near the edge of the same sheet. It can be determined that the failure mode is shear out or cleavage.
- -
- Asymmetrical joint S8A21: a very similar distribution to the previous one is observed, high damage values are localised between the hole and the edge of the sheet; this distribution leads simultaneously to shear out and net tension of aluminium, i.e., cleavage failure mode.
- -
- Asymmetrical joint S9A21, the damage reaches the critical value in the thinner sheet along a line perpendicular to the axis of the joint; the failure mode is clearly due to the net tension.
5. Failure Map
- -
- For a thickness of 1 mm, the hole diameter affects the values of the ratios e/d and w/d, which determine the observed transition between net tension and shear out, respectively;
- -
- For a thickness of 1.5 mm, the hole diameter determines the observed transition between rivet shear and unbuttoning.
- -
- A transition point between rivet shear and unbuttoning, on the hyperbola related to t = 1 mm;
- -
- A transition point between shear out and net tension, on the hyperbola related to t = 1.5 mm.
- -
- For t = 1 mm: for high diameters, the failure occurs for net tension (NT), whereas for low diameters it occurs for shear out (SO). For a middle value, the point overlaps with the transition point and, consequently, a mixed fracture can be observed, i.e., cleavage (C). This is interesting as it is difficult to predict it with, for instance, a typical e/d-w/d graph;
- -
- For t = 1.5 mm: by decreasing the hole diameter, it is possible to observe the transition between unbuttoning (UN) and rivet shear (RS).
6. Conclusions
- -
- In the symmetrical joints, the symmetry reduces the bending phenomena, the area around the hole is subjected to a bearing phenomenon, and the fracture occurs mainly for unbuttoning. If the rivet has a diameter of 6 mm, it is possible to observe a fracture of the rivet head for a shear action. Then, there is a transition between the two failure modes.
- -
- In the case of asymmetrical joints, the resistance is lower not only due to the asymmetry of the joint, but also due to the lower thickness of the upper aluminium sheet, which favours deformation around the hole and the resulting progressive damage. In this case, a transition from shear out to net tension is evident as rivet diameter is increased: shear out < cleavage < net tension.
Author Contributions
Funding
Institutional Review Board Statement
Informed Consent Statement
Data Availability Statement
Conflicts of Interest
References
- LeBacq, C.; Brechet, Y.; Shercliff, H.R.; Jeggy, T.; Salvo, L. Selection of joining methods in mechanical design. Mat. Des. 2002, 22, 405–416. [Google Scholar] [CrossRef]
- Karim, M.A.; Jeong, T.E.; Noh, W.; Park, K.Y.; Kam, D.H.; Kim, C.; Nam, D.G.; Jung, H.; Park, Y.D. Joint quality of self-piercing riveting (SPR) and mechanical behavior under the frictional effect of various rivet coatings. J. Manuf. Process. 2020, 58, 466–477. [Google Scholar] [CrossRef]
- El-Sayed, M.M.; Shash, A.Y.; Abd-Rabou, M.; ElSherbiny, M.G. Welding and processing of metallic materials by using friction stir technique: A review. J. Adv. Join. Process. 2021, 3, 100059. [Google Scholar] [CrossRef]
- Hassanifard, S.; Varvani-Farahani, A. A Comparative Study on Fatigue Response of Aluminum Alloy Friction Stir Welded Joints at Various Post-Processing and Treatments. J. Manuf. Mater. Process. 2021, 5, 93. [Google Scholar] [CrossRef]
- Haque, R. Quality of self-piercing riveting (SPR) joints from cross-sectional perspective: A review. Arch. Civ. Mech. Eng. 2018, 18, 83–93. [Google Scholar] [CrossRef]
- Xu, H.; Zhang, Y.; Peng, R.; Zhu, L.; Lu, Y. Simulation and experimental study on the strength of Al7075-T6 clinched joint. Eng. Fail. Anal. 2021, 129, 105735. [Google Scholar] [CrossRef]
- Presz, W. Planetary riveting of electric bimetallic micro-contacts. Proc. Manuf. 2019, 27, 83–90. [Google Scholar] [CrossRef]
- Patel, V.; Rathod, H.; Lalit, V.; Pratik, P.; Vipul, P. Design and manufacturing of orbital riveting machine (ORM). Int. J. Adv. Res. Eng. Sci. Tech. 2017, 4, 136–142. [Google Scholar]
- Jagtap, S.; Kavade, M. Orbital Riveting—A design and development of new machine. Int. J. Mech. Prod. Eng. Res. Dev. 2014, 2, 6–10. [Google Scholar]
- Xion, W.; Wang, Y.; Li, X.P.; Mei, S.; Tian, Z.X. Study on the Forming Process and Deformation Behavior of Inner Ring in the Wheel Hub Bearing Based on Riveting Assembly. Materials 2019, 12, 3785. [Google Scholar] [CrossRef] [Green Version]
- Stutz, W.R. Productivity and quality improvements through orbital forming. Assem. Autom. 2003, 23, 147–152. [Google Scholar] [CrossRef]
- Sontakke, K.G.; Vaidya, R.D.; Mate, D.M. Design and Analysis of Drilling Cum Riveting Machine. J. Emerg. Technol. Innov. Res. 2014, 1, 419–426. [Google Scholar]
- Satbhai, S.H.; Zagade, D.B.; Shaikh, S.S.; Somwanshi, B.V.; Baravkar, P.S.; Sonawane, D.P. A Paper on Study & Design of Multipurpose Riveting Machine. Int. Res. J. Eng. Technol. 2017, 2, 1508–1514. [Google Scholar]
- Mahmoudi, M.; Sadat Baha, M.; Khajehpour, P.; Yousefi, A. Experimental and analytical comparison in orbital riveting machine and radial riveting unit in an orbital machine. In Proceedings of the 3rd International Conference on Research in Science and Technology, Berlin, Germany, 9 July 2016. [Google Scholar]
- Patil, A.S.; Wankhede, S.V. Design Development and Analysis of Indexable Tool Head and Auto-feed Table Mechanism for Portable Orbital Form Rivetter. Int. J. Sci. Eng. Res. 2017, 8, 381–384. [Google Scholar]
- Di Bella, G.; Borsellino, C.; Calabrese, L.; Proverbio, E. Durability of orbital riveted steel/aluminium joints in salt spray environment. J. Manuf. Process. 2018, 35, 254–260. [Google Scholar] [CrossRef]
- Available online: www.taumel.com (accessed on 18 May 2021).
- International Organization for Standardization. ISO 12996:2013- Mechanical Joining—Destructive Testing of Joints–Specimen Dimensions and Test Procedure for Tensile Shear Testing of Single Joints; International Organization for Standardization: Geneva, Switzerland, 2013. [Google Scholar]
- Cockroft, M.G.; Latham, D.J. Ductility and the Workability of Metals. J. Inst. Met. 1968, 96, 33–39. [Google Scholar]
- Venugopal Rao, A.; Ramacrishnan, M. Comparative evaluation of theoretical failure criteria for workability in cold forging. J. Mater. Process. Technol. 2003, 142, 29–42. [Google Scholar] [CrossRef]
- Borsellino, C.; Micari, F.; Ruisi, V.F. Central Bursts Prediction in Extrusion. In Proceedings of the International Conference on the Design and Production of Dies and Molds, Istanbul, Turkey, 21–23 June 1997. [Google Scholar]
- Calabrese, L.; Proverbio, E.; Galtieri, G.; Borsellino, C. Effect of corrosion degradation on failure mechanisms of aluminium/steel clinched joints. Mater. Des. 2015, 87, 473–481. [Google Scholar] [CrossRef]
- Valenza, A.; Fiore, V.; Borsellino, C.; Calabrese, L.; Di Bella, G. Failure Map of Composite Laminate Mechanical Joint. J. Compos. Mater. 2007, 41, 951–964. [Google Scholar] [CrossRef]
- Calabrese, L.; Proverbio, E.; Di Bella, G.; Galtieri, G.; Borsellino, C. Assessment of ageing effect on the mechanical behaviour of steel/aluminium self-piercing riveted joint. Int. J. Mech. Mater. Eng. 2015, 10, 1–13. [Google Scholar] [CrossRef] [Green Version]
- Fiore, V.; Calabrese, L.; Scalici, T.; Bruzzaniti, P.; Valenza, A. Experimental design of the bearing performances of flax fiber reinforced epoxy composites by a failure map. Compos. Part. B 2018, 148, 40–48. [Google Scholar] [CrossRef]


| Type of Joint | Configuration | Rivet Diameter ϕr (mm) | Hole Diameter ϕ (mm) | Top Sheet (mm) | Bottom Sheet (mm) |
|---|---|---|---|---|---|
| Symmetric | S6A15 | 6.0 | 6.2 | 1.5 | 1.5 |
| S8A15 | 8.0 | 8.2 | 1.5 | 1.5 | |
| S9A15 | 9.0 | 9.3 | 1.5 | 1.5 | |
| Asymmetric | S6A21 | 6.0 | 6.2 | 2.0 | 1.0 |
| S8A21 | 8.0 | 8.2 | 2.0 | 1.0 | |
| S9A21 | 9.0 | 9.3 | 2.0 | 1.0 |
| Stroke Min Max (mm) | Max Push Strength (kN) | Motor Output (kN) | Air Pressure (bar) | Air Consumption (Nlt) |
|---|---|---|---|---|
| 0–40 | 13.5 | 0.37 | 5.2 | 10.4 |
| Type of Joint | Configuration | Punch Force (kN) | Working Time (s) | Displacement of the Punch (mm) |
|---|---|---|---|---|
| Symmetric | S6A15 | 5.0 | 4 | 0.8 |
| S8A15 | 8.0 | 4 | 0.8 | |
| S9A15 | 9.0 | 3 | 0.8 | |
| Asymmetric | S6A21 | 5.0 | 4 | 0.8 |
| S8A21 | 8.0 | 4 | 0.8 | |
| S9A21 | 9.0 | 3 | 0.8 |
| Component | Size (mm) | Elements | Nodes |
|---|---|---|---|
| Rivet | 6 | 29,400 | 6900 |
| 8 | 32,600 | 7400 | |
| 9 | 38,000 | 8900 | |
| Sheets | 1.5 (top) | 21,000 | 5800 |
| 1.5 (bottom) | 22,600 | 6100 | |
| 2 | 25,800 | 6500 | |
| 1 | 12,000 | 3700 |
| Aluminium Alloy | Chemical Composition (%) | |||||||||||
|---|---|---|---|---|---|---|---|---|---|---|---|---|
| Cu | Fe | Si | Mg | Mn | Zn | Bi | Pb | Cr | Ti | Other | Al | |
| AA 2011 | 5 ÷ 6 | 0.40 (Max) | 0.20 (Max) | 0.05 (Max) | 0.05 (Max) | 0.10 (Max) | 0.2 ÷ 0.6 | 0.2 ÷ 0.6 | Rest | |||
| AA6082 T6 | 0.10 (Max) | 0.50 (Max) | 0.7 ÷ 1.3 | 0.6 ÷ 1.2 | 0.4 ÷ 1.0 | 0.20 (Max) | 0.25 (Max) | 0.10 (Max) | 0.10 | Rest | ||
| Aluminium Alloy | Flow Curve Parameters | Damage Critical Value | |
|---|---|---|---|
| D | |||
| AA 2011 | 292.463 | 0.027 | 0.29 |
| AA6082 T6 | 572.425 | 0.211 | 0.2 |
| Type of Joint | Configuration | Punch Force | Rivet Diameter | Rivet Height | ||||||
|---|---|---|---|---|---|---|---|---|---|---|
| (kN) | (mm) | (mm) | ||||||||
| Exp. | FEA | Δ | Exp. | FEA | Δ | Exp. | FEA | Δ | ||
| Symmetric | S6A15 | 5.00 | 5.44 | 8.8% | 8.92 | 9.01 | 1.0% | 9.75 | 10.04 | 3.0% |
| S8A15 | 8.00 | 8.90 | 11.3% | 11.67 | 11.62 | −0.4% | 9.80 | 10.03 | 2.3% | |
| S9A15 | 9.00 | 9.51 | 5.7% | 11.43 | 11.42 | −0.1% | 9.84 | 10.03 | 1.9% | |
| Asymmetric | S6A21 | 5.00 | 5.77 | 15.4% | 9.55 | 9.24 | −3.2% | 9.75 | 10.00 | 2.6% |
| S8A21 | 8.00 | 8.18 | 2.3% | 10.21 | 10.30 | 0.9% | 9.80 | 10.00 | 2.0% | |
| S9A21 | 9.00 | 9.74 | 8.2% | 11.70 | 11.72 | 0.2% | 9.86 | 10.05 | 1.9% | |
| Type of Joint | Configuration | Maximum Load | ||
|---|---|---|---|---|
| (kN) | ||||
| Exp. | FEA | Δ | ||
| Symmetric | S6A15 | 5.52 | 5.50 | −0.4% |
| S8A15 | 6.06 | 5.90 | −2.6% | |
| S9A15 | 5.96 | 6.00 | 0.7% | |
| Asymmetric | S6A21 | 4.72 | 4.50 | −4.7% |
| S8A21 | 4.69 | 4.50 | −4.1% | |
| S9A21 | 4.38 | 4.30 | −1.8% | |
Publisher’s Note: MDPI stays neutral with regard to jurisdictional claims in published maps and institutional affiliations. |
© 2021 by the authors. Licensee MDPI, Basel, Switzerland. This article is an open access article distributed under the terms and conditions of the Creative Commons Attribution (CC BY) license (https://creativecommons.org/licenses/by/4.0/).
Share and Cite
Di Bella, G.; Calabrese, L.; Borsellino, C.; Alderucci, T. Effect of Sheets’ Thickness and Rivet Geometry on Mechanical Properties of Orbital Riveted Aluminium Joints: Experimental and Numerical Analysis. J. Manuf. Mater. Process. 2021, 5, 102. https://doi.org/10.3390/jmmp5040102
Di Bella G, Calabrese L, Borsellino C, Alderucci T. Effect of Sheets’ Thickness and Rivet Geometry on Mechanical Properties of Orbital Riveted Aluminium Joints: Experimental and Numerical Analysis. Journal of Manufacturing and Materials Processing. 2021; 5(4):102. https://doi.org/10.3390/jmmp5040102
Chicago/Turabian StyleDi Bella, Guido, Luigi Calabrese, Chiara Borsellino, and Tiziana Alderucci. 2021. "Effect of Sheets’ Thickness and Rivet Geometry on Mechanical Properties of Orbital Riveted Aluminium Joints: Experimental and Numerical Analysis" Journal of Manufacturing and Materials Processing 5, no. 4: 102. https://doi.org/10.3390/jmmp5040102
APA StyleDi Bella, G., Calabrese, L., Borsellino, C., & Alderucci, T. (2021). Effect of Sheets’ Thickness and Rivet Geometry on Mechanical Properties of Orbital Riveted Aluminium Joints: Experimental and Numerical Analysis. Journal of Manufacturing and Materials Processing, 5(4), 102. https://doi.org/10.3390/jmmp5040102