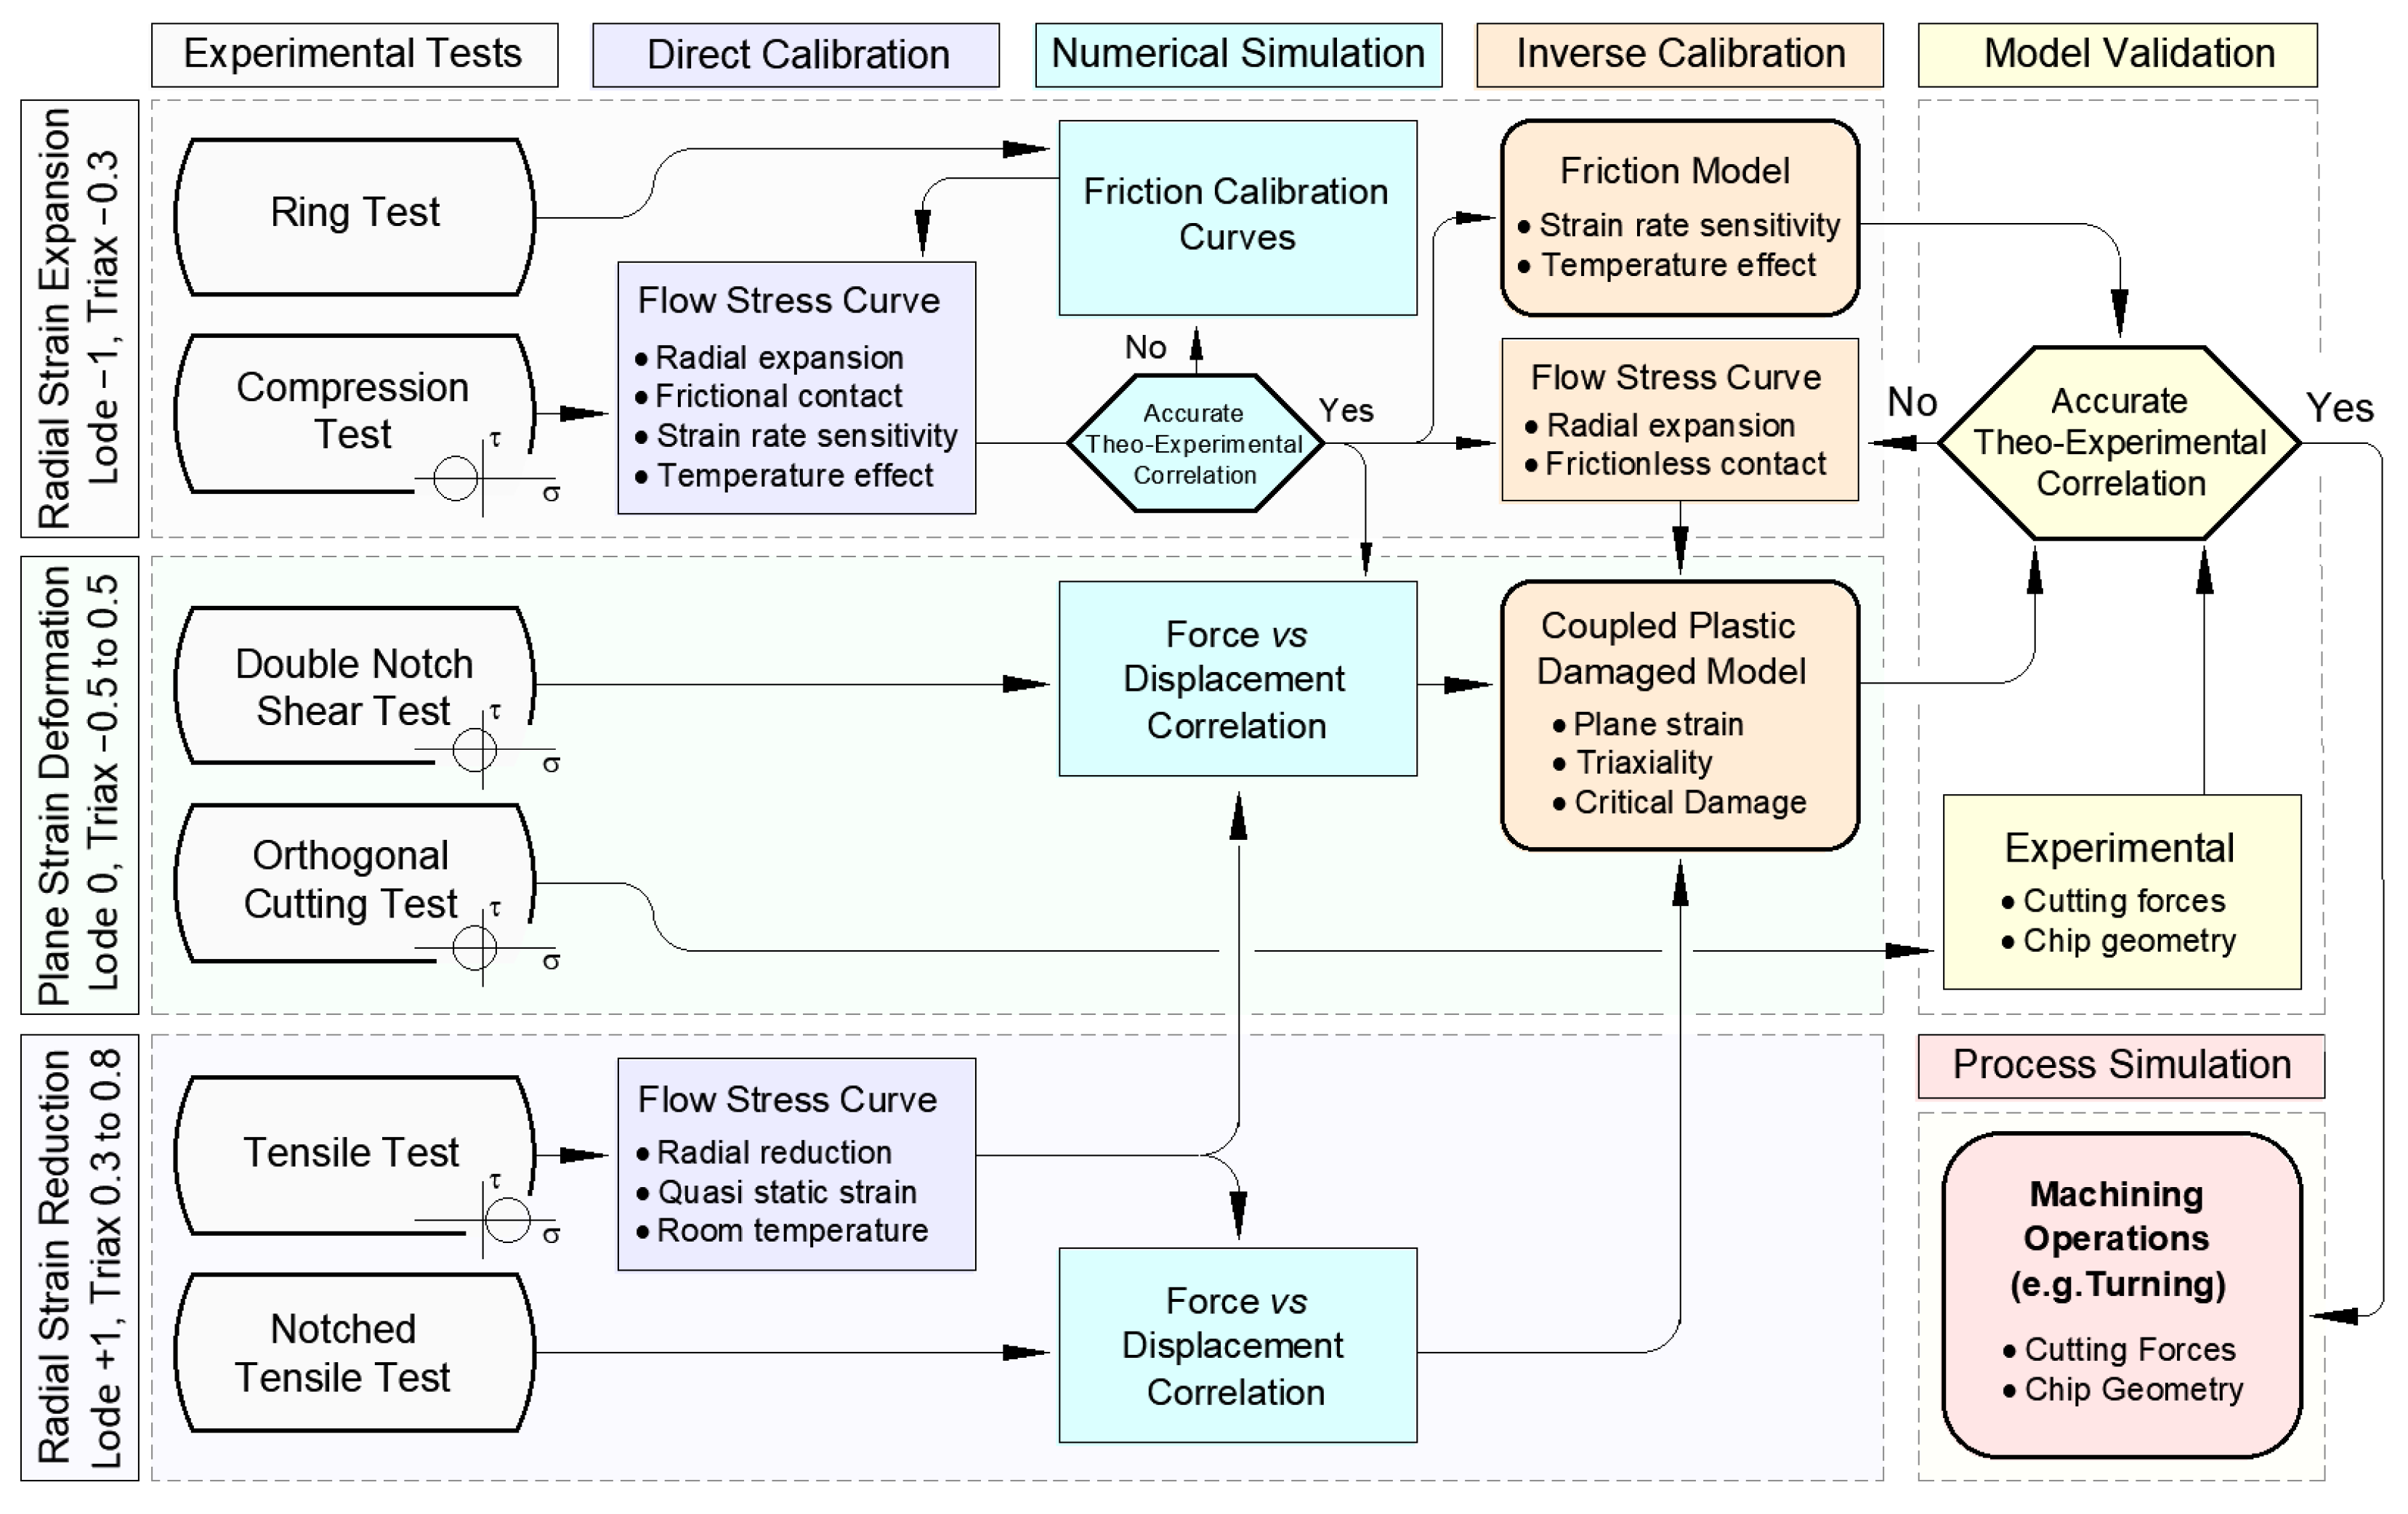
This section focuses on the experimental characterization and inverse calibration methodologies conducted on the AMed 18Ni300 maraging steel to determine its mechanical and tribological behaviors. It begins by introducing the compression tests on both ring and cylindrical specimens. These tests were conducted for a dual purpose: (i) a direct characterization of the material flow stress under radial strain expansion accounting for material sensitivity to strain rate and temperature; and (ii) to estimate friction coefficient at the tool-workpiece interface resorting to a combined experimental-numerical approach. Special emphasis is given to the apparatus that was developed by the authors to perform uniaxial compression tests under extreme thermo-mechanical conditions. In continuation, radial strain reduction tests are performed on both cylindrical and notched cylindrical specimens, tensile tests representing an adequate approach towards identifying the material damage behavior dependence on Lode angle and positive stress triaxialities. Double notch plane strain specimens were also tested for a complementary range of intermediate stress triaxialities at null Lode angle. The inverse analysis of the tests on double notched specimens also allowed establishing the material constitutive plastic law in a more representative state-of-stress to metal cutting. The combined experimental-numerical methodology proposed by the authors requires the inverse analysis of the experimental characterization tests. Thus, ABAQUS FEM software has been used in the full extent of mechanical and tribological characterization modelling, considering an elastoplastic approach with a von Mises (J2) yield criterion with isotropic hardening.
4.1. Initial Definition
The uniaxial compression test and the ring compression test were selected to evaluate the mechanical and tribological properties of the AMed 18Ni300 steel, when submitted to one-dimensional compression and axisymmetric expansion, at different loading rates. These are the most used tests to evaluate the flow stress and friction in metal plasticity [
27,
28] and can be carried out using the same experimental apparatus, allowing similar tribological conditions between the specimens and the compression platens. Under these experimental conditions and based on adequate inverse analysis procedures, it is possible to identify the individual contribution of plasticity and friction.
The compression test involves reducing the height of axisymmetric specimens, by uniaxial compression, between two flat and parallel platens (
Figure 5a). Compression tests were carried out on cylindrical specimens with a cross-section of 4 mm diameter (
) and a height-to-diameter ratio,
. In order to evaluate the mechanical response in conditions compelling to those found in metal cutting, tests were conducted for a wide range of strain rates from quasi-static up to 6000 s
−1. A thin film of graphite grease was used to lubricate the compression platens. However, despite even the best interface conditioning practices, no homogeneous deformation can be attained due the impossibility to eliminate the frictional shear on both contact interfaces between compression platens and the test specimen (
Figure 5b,c). The ideal mechanical response, frictionless flow curve, can be only attained by eliminating the friction contribution on the experimental load–displacement curve using post-processing techniques. To account for tribological phenomenon on the contact interfaces, ring shape specimens were also tested under compression to several pre-determined height decrements (
Figure 6a).
As the ring height is reduced, the outer diameter expands radially outwards and the change in inner diameter depends on both compression in the axial direction and the interfacial friction between ring and compression platens. If friction is small, both the inner and the outer diameter expand. However, due to friction hindering of the radial expansion of the specimen material, the inner diameter can become smaller than the original diameter (
Figure 6b), for higher values of friction [
29]. In this research, the dimensions of the ring specimens were 7, 3.5, and 2.5 mm, corresponding to the outside diameter, inside diameter, and height, respectively (approx. 6:3:2 ratio). The experimental tests were performed for two different lubrication conditions: (i) lubricated contact, in which graphite grease was applied on the compression platens in order to reproduce the tribological conditions of the previously described uniaxial compressions tests, and (ii) dry contact, to study the effect of temperature and loading rate on friction coefficient under similar operative conditions as those observed in machining processes. While for quasi-static conditions it is possible to perform interrupted tests planning various compression stages (several stages and, thus a sequence of experimental measures), in high-speed tests it is not possible to apply such a practice due to the high kinetic energy of the incident bar and thus, only single stages were carried out (a single measure per experimental test). In-between compression stages, the values of specimen’s inner diameter and height were measured using a digital precision caliper gauge and recorded before and after the tests. Each test/experimental measurement produces only one experimental point to be placed on the calibration curves. At least 3 tests were performed for each experimental condition to detect possible gaps in the experimental results that could be attributed to homogeneity and isotropy issues related with the AMed material production and specimens manufacturing.
Friction can be estimated by a comparison of experimental data with friction calibration curves generated in advance by numerical procedures. The calibration curves were obtained by means of finite element-based simulations using Abaqus software. Both compression platens were considered rigid; the bottom platen was considered static, whereas the upper platen motion was set to be consistent with the velocity of the experimental tests. The mechanical behavior (stress–strain data) of the materials to be used in the numerical simulation was determined by means of the compression tests performed on cylindrical specimens, as previously described. The calibration curves for quasi-static conditions are exemplified in
Figure 6c and show that low values of friction give rise to increase the inner diameter of the specimens during deformation, whereas high values promote a decrease in the specimen’s inner diameter.
The uniaxial compression tests were carried out in a customized split-Hopkinson pressure bar (SHPB), specially designed to provide a wide range of strain rate conditions and temperatures, schematically shown in
Figure 7. This apparatus makes use of a single load cell and specific displacement transducers for all testing conditions, ranging from quasi-static, low strain rates and high strain rates tests, thus eliminating the typical calibration deviations associated with the utilization of different testing machines. The main components can be grouped into three main systems: (i) impact bench, (ii) instrumentation and data acquisition systems, and (iii) rate-based actuators.
The impact bench features basic structural parts, kinematics transmission systems, a thermostatic chamber, and a pair of compression platens. The compression platens were made from a powder metallurgy (PM) composite material consisting of tungsten carbide particles and a cobalt metallic binder (WC–15 wt% Co), that provides the required compromise between hardness and toughness. Thus, assuring that the rigid substrate endures the very demanding conditions of high temperatures and extreme compressive loads but also withstands the shock and vibration of impact tests. In order to limit asperity interlocking contribution to the friction mechanism, the platens’ surface was polished, having shown average roughness values (Ra) in the range of 0.009 to 0.032 µm along the radial direction. Chemical adhesion between the material pair platens-specimen was controlled through the application of a TiAlSiN coating with a thickness of not less than 2.5 µm, using a PVD HiPIMS process.
An electric furnace was used to allow testing temperatures above reference room temperature (
Figure 8b). This heating unit was installed directly in the impact zone, surrounding the compression platens, as seen in
Figure 8c, allowing testing temperatures up to 900 °C. This furnace consists of a chamber lined with refractory material where the electric heating resistors are located, with the particularity of having a through hole in the sides to permit the compression platens’ action (
Figure 8b).
The instantaneous strain, stress and strain-rate are calculated based on the monitorization of the three main physical parameters: time, load, and displacement; being the instant time implicit in the data acquisition systems. A multipurpose data acquisition board, National Instruments PCI-6115 combined with appropriate software (LabView) was used to monitor these parameters, allowing sampling rates of up to 10 MHz. Since the presented experimental technique deviates from the commonly used SHPB in the way that both force and displacement values are taken from direct measurements, special sensors were installed for such purpose. A full Wheatstone bridge arrangement used for load calculation and installed in the first quarter of the transmitter bar, promoting an extended time window without the interference of the reflected wave. The elastic deformation of the bar under compressive loads causes the gauges’ resistance to change and thus, the load cell electrical output signal can be linearly correlated with the applied load. Yet, this voltage output is very low, so a VISHAY 2310B signal conditioning amplification system was required to amplify the electrical signal. For room temperature conditions, inductive position sensors were mounted directly between compression platens in order to promote the precision, accuracy and resolution of the experimental measurements. This experimental technique prescinds of complex data post-processing necessary to account for elastic deformation of the testing machine and allows measuring the distance between compression platens with high resolution under very high velocities and severe accelerations. For compression tests conducted at high temperature, the inductive sensors are no longer viable. To surpass this limitation, linear sliding potentiometer sensors were positioned outside the thermostatic chambers, directly on both incident and transmitter bars and thus, the performance of the sensors is not affected by even the most demanding thermal conditions. A total of 3 potentiometers were installed; 1 on the incident bar and 2 on the transmitter bar and, the distance between compression platens can be measured by correlating the differential value between potentiometers (
Figure 7b).
An adequate linear actuator was selected according to the desired strain rate range. For quasi-static and low strain rate compression tests (less than 1
), the hydraulic ram cylinder was used (
Figure 9a). Dynamic tests can be subdivided into medium strain rate tests (100 to 1000
), which were carried out resorting to the electromagnetic actuator (
Figure 9b) and, high strain rate tests (above 1000
), which were performed using the pneumatic gun (
Figure 9c). The electromagnetic actuator comprises several components such as the electrical circuits for charging and firing the banks of energy-storage capacitors and a series of coils that generate the electromagnetic pressure to accelerate the striker bar. The pneumatic gun consists of a pressure vessel that allows precise control of the amount of energy released during compression for a given air pressure. A pneumatic trigger valve allows the stored air volume to flow through a launcher tube, converting pneumatic energy into kinetic energy and, thus, accelerating the striker bar. The impacting velocity is limited by the mass of the striker bar and the strain rate signature of the compression tests depends on the specimen ability to dissipate the corresponding kinetic energy. Despite these fundamentals, it is difficult to achieve an adequate signal noise ratio due to the abrupt pressure impact and wave propagating through the split Hopkinson bar during test monitorization. Thus, a consumable thin nylon sheet of 1 mm was placed between the strike bar and the incident bar for better loading control. With regards to the hydraulic actuator, an electrical pump supplies the required fluid at appropriate flow rates and pressure for the quasi-static and low strain rate compression tests.
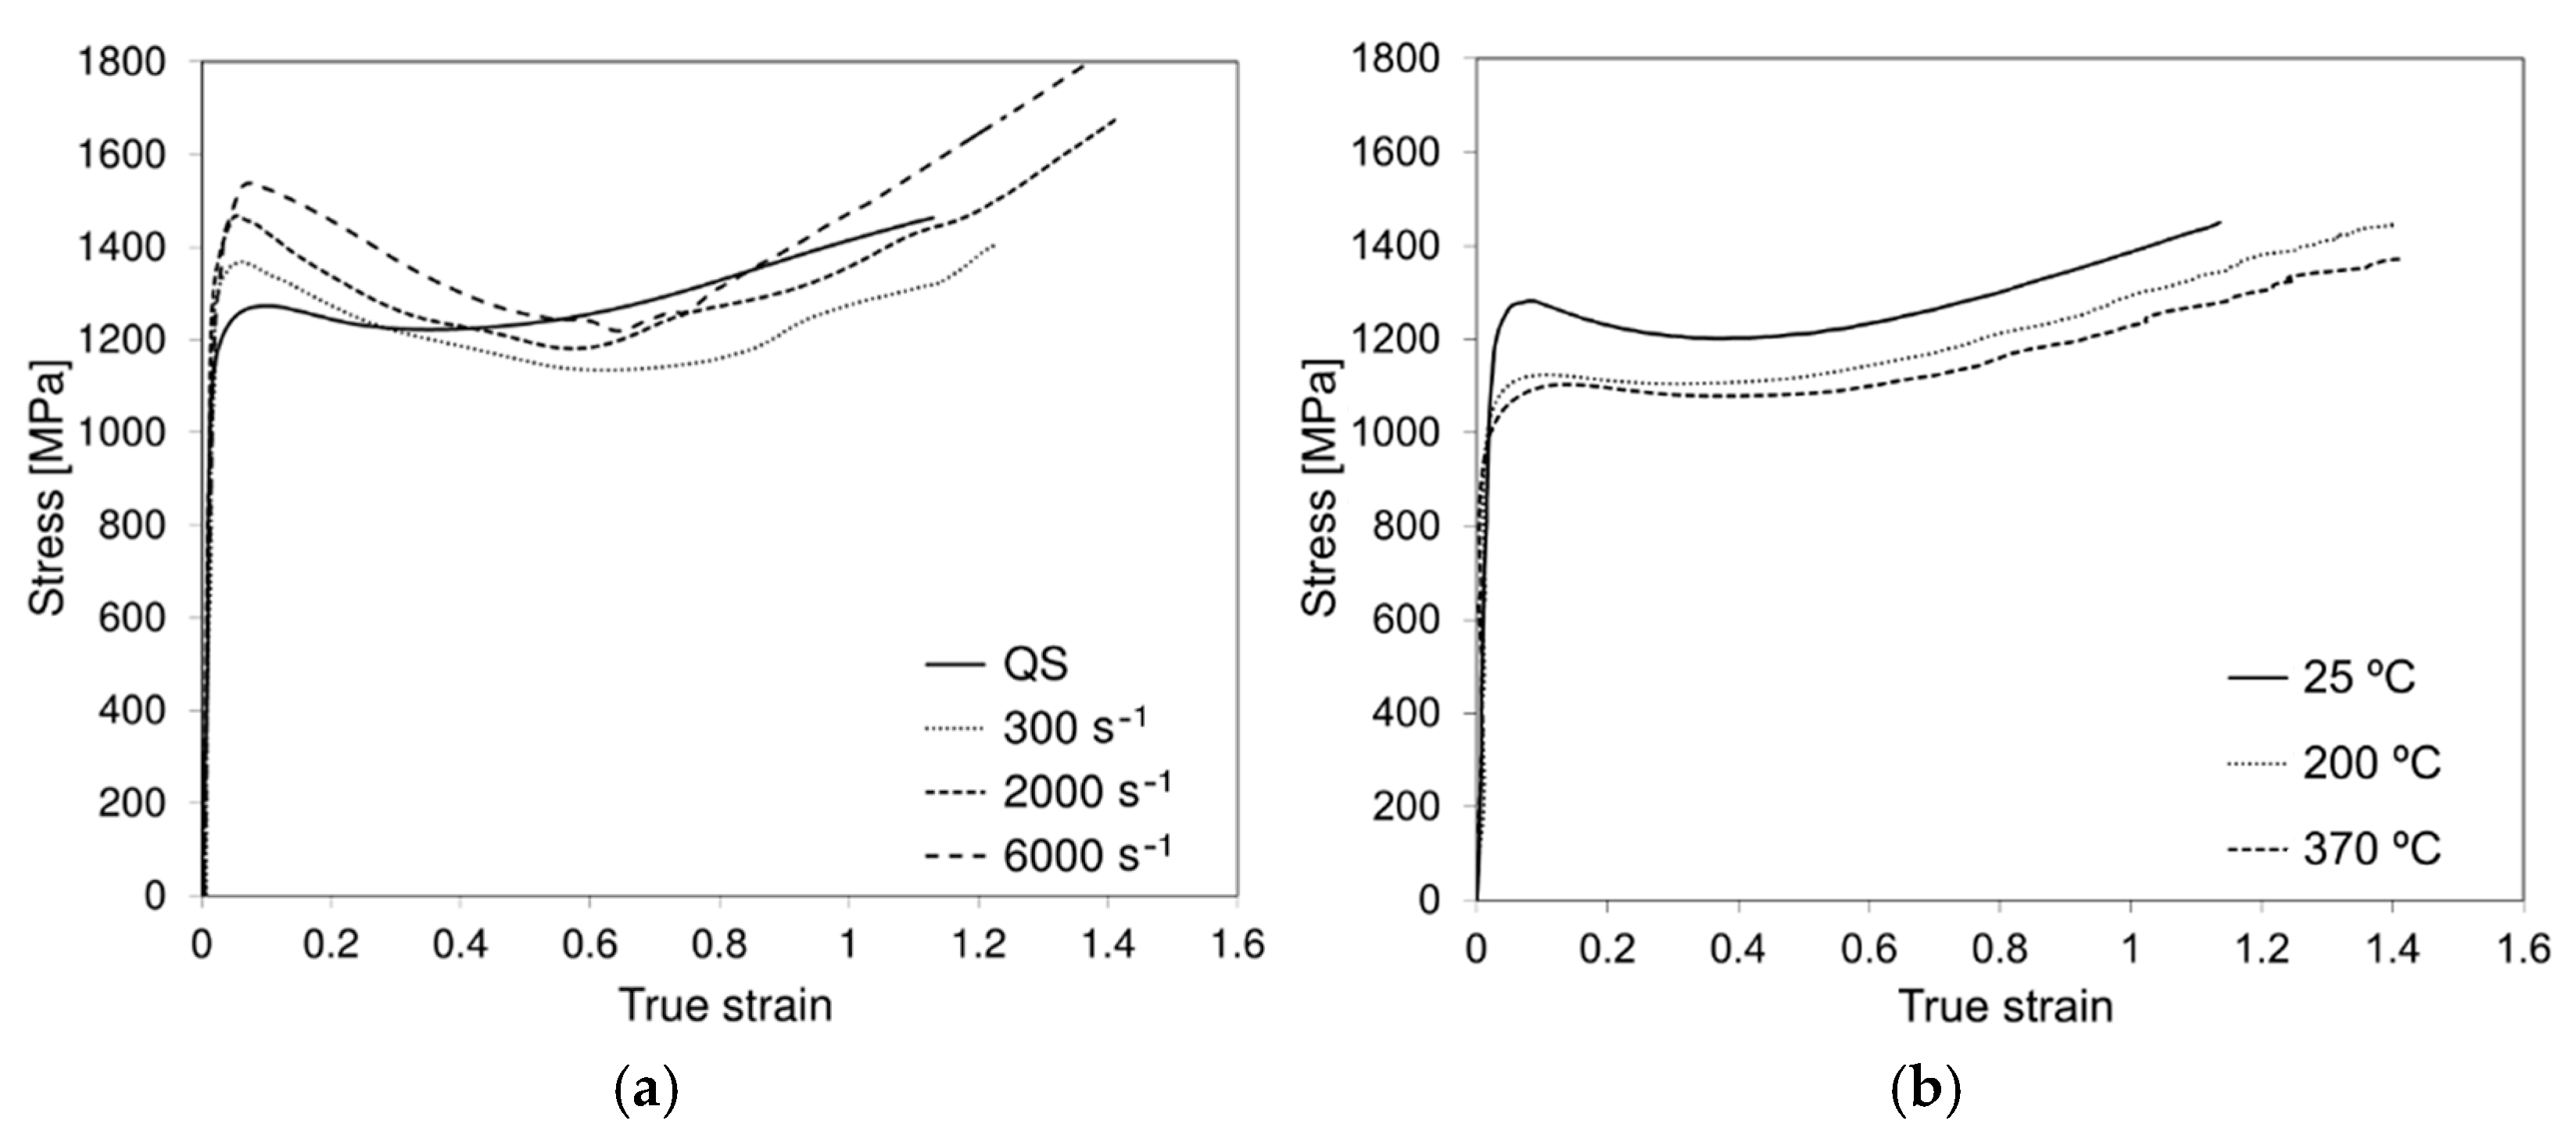
The flow curves obtained from compression tests at room temperature under different strain rate conditions are presented in
Figure 10a, where three distinct stages can be observed: (i) for incipient deformation the material exhibits a typical strengthening mechanism up to strains of approximately 0.1, (ii) followed by a sudden softening behavior down to a minimum flow stress value, point after which a (iii) secondary stage of strengthening is observed. Regarding incipient deformation, an increase of 20% in maximum strength is observed from quasi-static conditions to 6000 s
−1. It is also worth noticing that the softening behavior seems to be more pronounced with increasing strain rates and, the instant at which the lowest flow stress was measured seems to shift in the positive direction along the strain axis. Moreover, for high strains, the rate-dependent behavior tends to similar stress values of the quasi-static compression tests. In general terms, the results show a peculiar hardening-softening behavior and markedly strain-rate sensitivity with effect on both the flow stress values and curve morphology.
Figure 10b shows the quasi-static high temperature behavior of the AMed 18Ni300 maraging steel. Regarding the relative low temperatures of the workpiece material when submitted to cutting and the aging transformations of the maraging steel starting at 450 °C the maximum tested temperature was of 370 °C [
30,
31,
32]. Apart from the already identified hardening behavior, the stress–strain response of the materials seems to present typical softening for increasing temperature in AMed metallurgical conditions and constant curve morphology.
Based on the results of the mechanical testing and after a probing calibration of the standard Johnson–Cook model (Equation (1)) for the AMed 18Ni300 maraging steel, the limitations of this equation have become clear. Despite its capacity for displaying the strain hardening and thermal softening effects of most materials, the Johnson–Cook model shows itself unable to reproduce the almost perfectly plastic behavior of the maraging steel in simple uniaxial compression, even for room temperature and quasi-static conditions. This is somewhat expected once the standard Johnson–Cook does not account for several important effects, such as the thermal-strain softening phenomena, intrinsic strain-strain rates paths, and temperature- and strain-induced phase transformation, among others. Also, in this calibration procedure the complex plastic deformation which takes place in the specimen (body) resumed as a single collection of data points, does not account for localization problems happening in the real body (e.g., fracture, adiabatic shear bands), which certainly deviate the stress–strain state from the homogenous one assumed to calculate the data originally furnished. Simpler models just Voce equation [
33] and Silva equation [
6] have proved to be capable to reproduce the sigmoidal stress–strain curve of the AMed 18Ni300 maraging steel. In their standard format, these athermal equations are commonly used at low strain rates with negligible temperature sensitivity and thus strain becomes nearly isothermal [
34]. Its application to metal cutting should be clarified, where deformation is almost adiabatic, and heat remains where it is generated. In what follows, the authors consider that conventional metal cutting involves a cold chip formation mechanics, and the high temperature of chip is a result/output parameter of the plastic flow itself. As counterexample, the billet temperature in hot forging is an input parameter achieved prior the forging operation (e.g., by which metallurgical phase transformations may occur). This approach considers that final temperature of a formed chip or deformed cylindrical specimen should be equivalent after the plastic deformation, under comparable operative conditions (e.g., initial room temperature, strain, and strain-rate conditions). The accuracy of the model coefficients can be also improved by considering the loading signature of the process (strain-strain rate history) [
6]. Thus, parameters should be obtained using experimental tests considering the signature of the machining process (strain-strain rate history). In other words, the final chip temperature can be estimated by considering the initial temperature of the uncut chip/workpiece (e.g., room temperature, external heating or cryogenic machining), heat transfer mechanisms (e.g., frictional heating, internal heating), and the inelastic heat fraction of plastic work that is converted into heat. As a result, a combined Swift-Voce law will be introduced in what follows to model the isothermal quasi-static hardening of this combined approach for the best fit to the present experimental data of AMed 18Ni300 maraging steel.
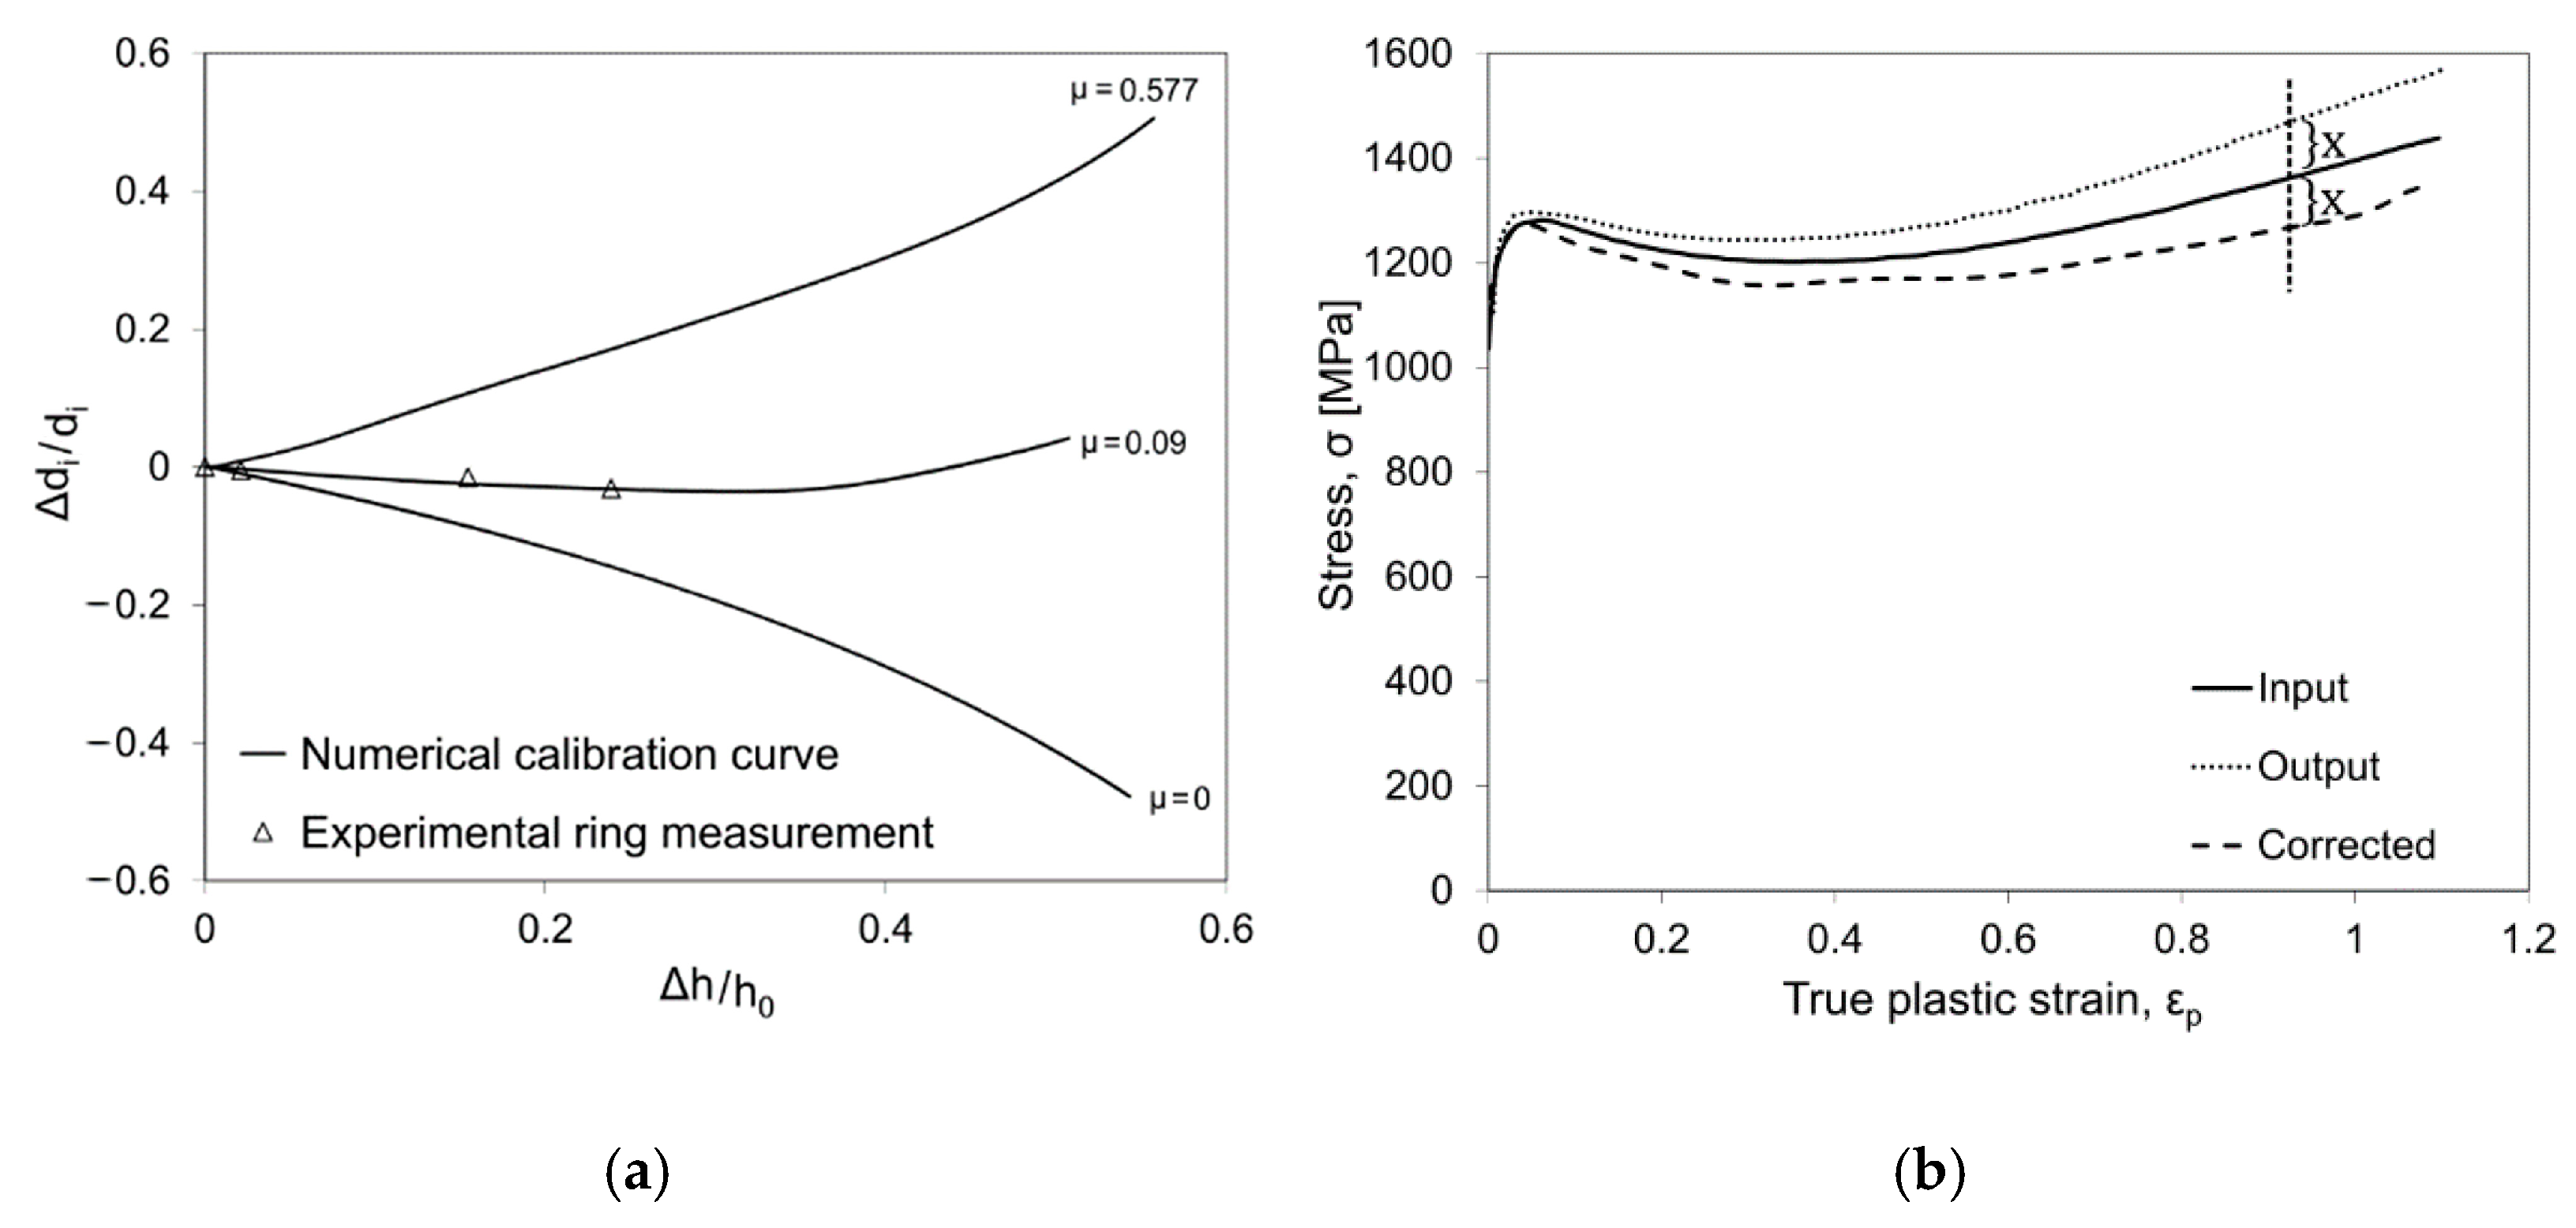
The above mentioned friction estimates method results from an experimental-numerical identification approach in which the first step corresponds to performing compressive tests on cylindrical and ring specimens under the same loading, lubrication and temperature conditions. Compression of cylinder specimens enables the estimation of trial flow stress curves that are used to simulate the corresponding ring compression test (friction calibration curves) for different friction coefficients. An example of friction calibration curves is shown in
Figure 11a, where the ring inner diameter variation (Δ
di/
di) is plotted over ring height variation (Δh/h
0). The comparison of these curves with the experimental results allows the estimation of a friction coefficient
μ = 0.09. The strain–stress curves used in the numerical estimative of friction calibration curves are not frictionless, even when contacting interfaces of the compression platen are lubricated. Thus, an iterative process must be applied in order to exclude the friction contribution from the trial flow stress. Furthermore, it helps to reduce the propagation of errors caused by the uncertainties of the tribomechanical calibration. This process consists in the inverse numerical simulation of the compression test using the flow stress as obtained from mechanical testing, labelled as “input” in
Figure 11b, and the previously determined friction coefficient (first estimate). The resulting stress–strain curve will be an overestimate of the flow stress curve due to a double contribution of the frictional mechanism (i.e., the unknown experimental friction plus the numerically set friction), labelled as “output” in
Figure 11b. By subtracting the friction overestimation, one can derive the corrected frictionless material response. Yet, an iterative process is required since the ring compression simulation is also material-dependent and new friction calibration curves should be determined, allowing a convergence towards the frictionless flow stress curve, labelled as “corrected curve” in
Figure 11b, and the final identification of the friction coefficient value. It is relevant to highlight the increasing contribution of friction, for increasing strain rate and temperature, which in turn emphasizes the importance of frictionless flow stress estimation in metal cutting simulation.
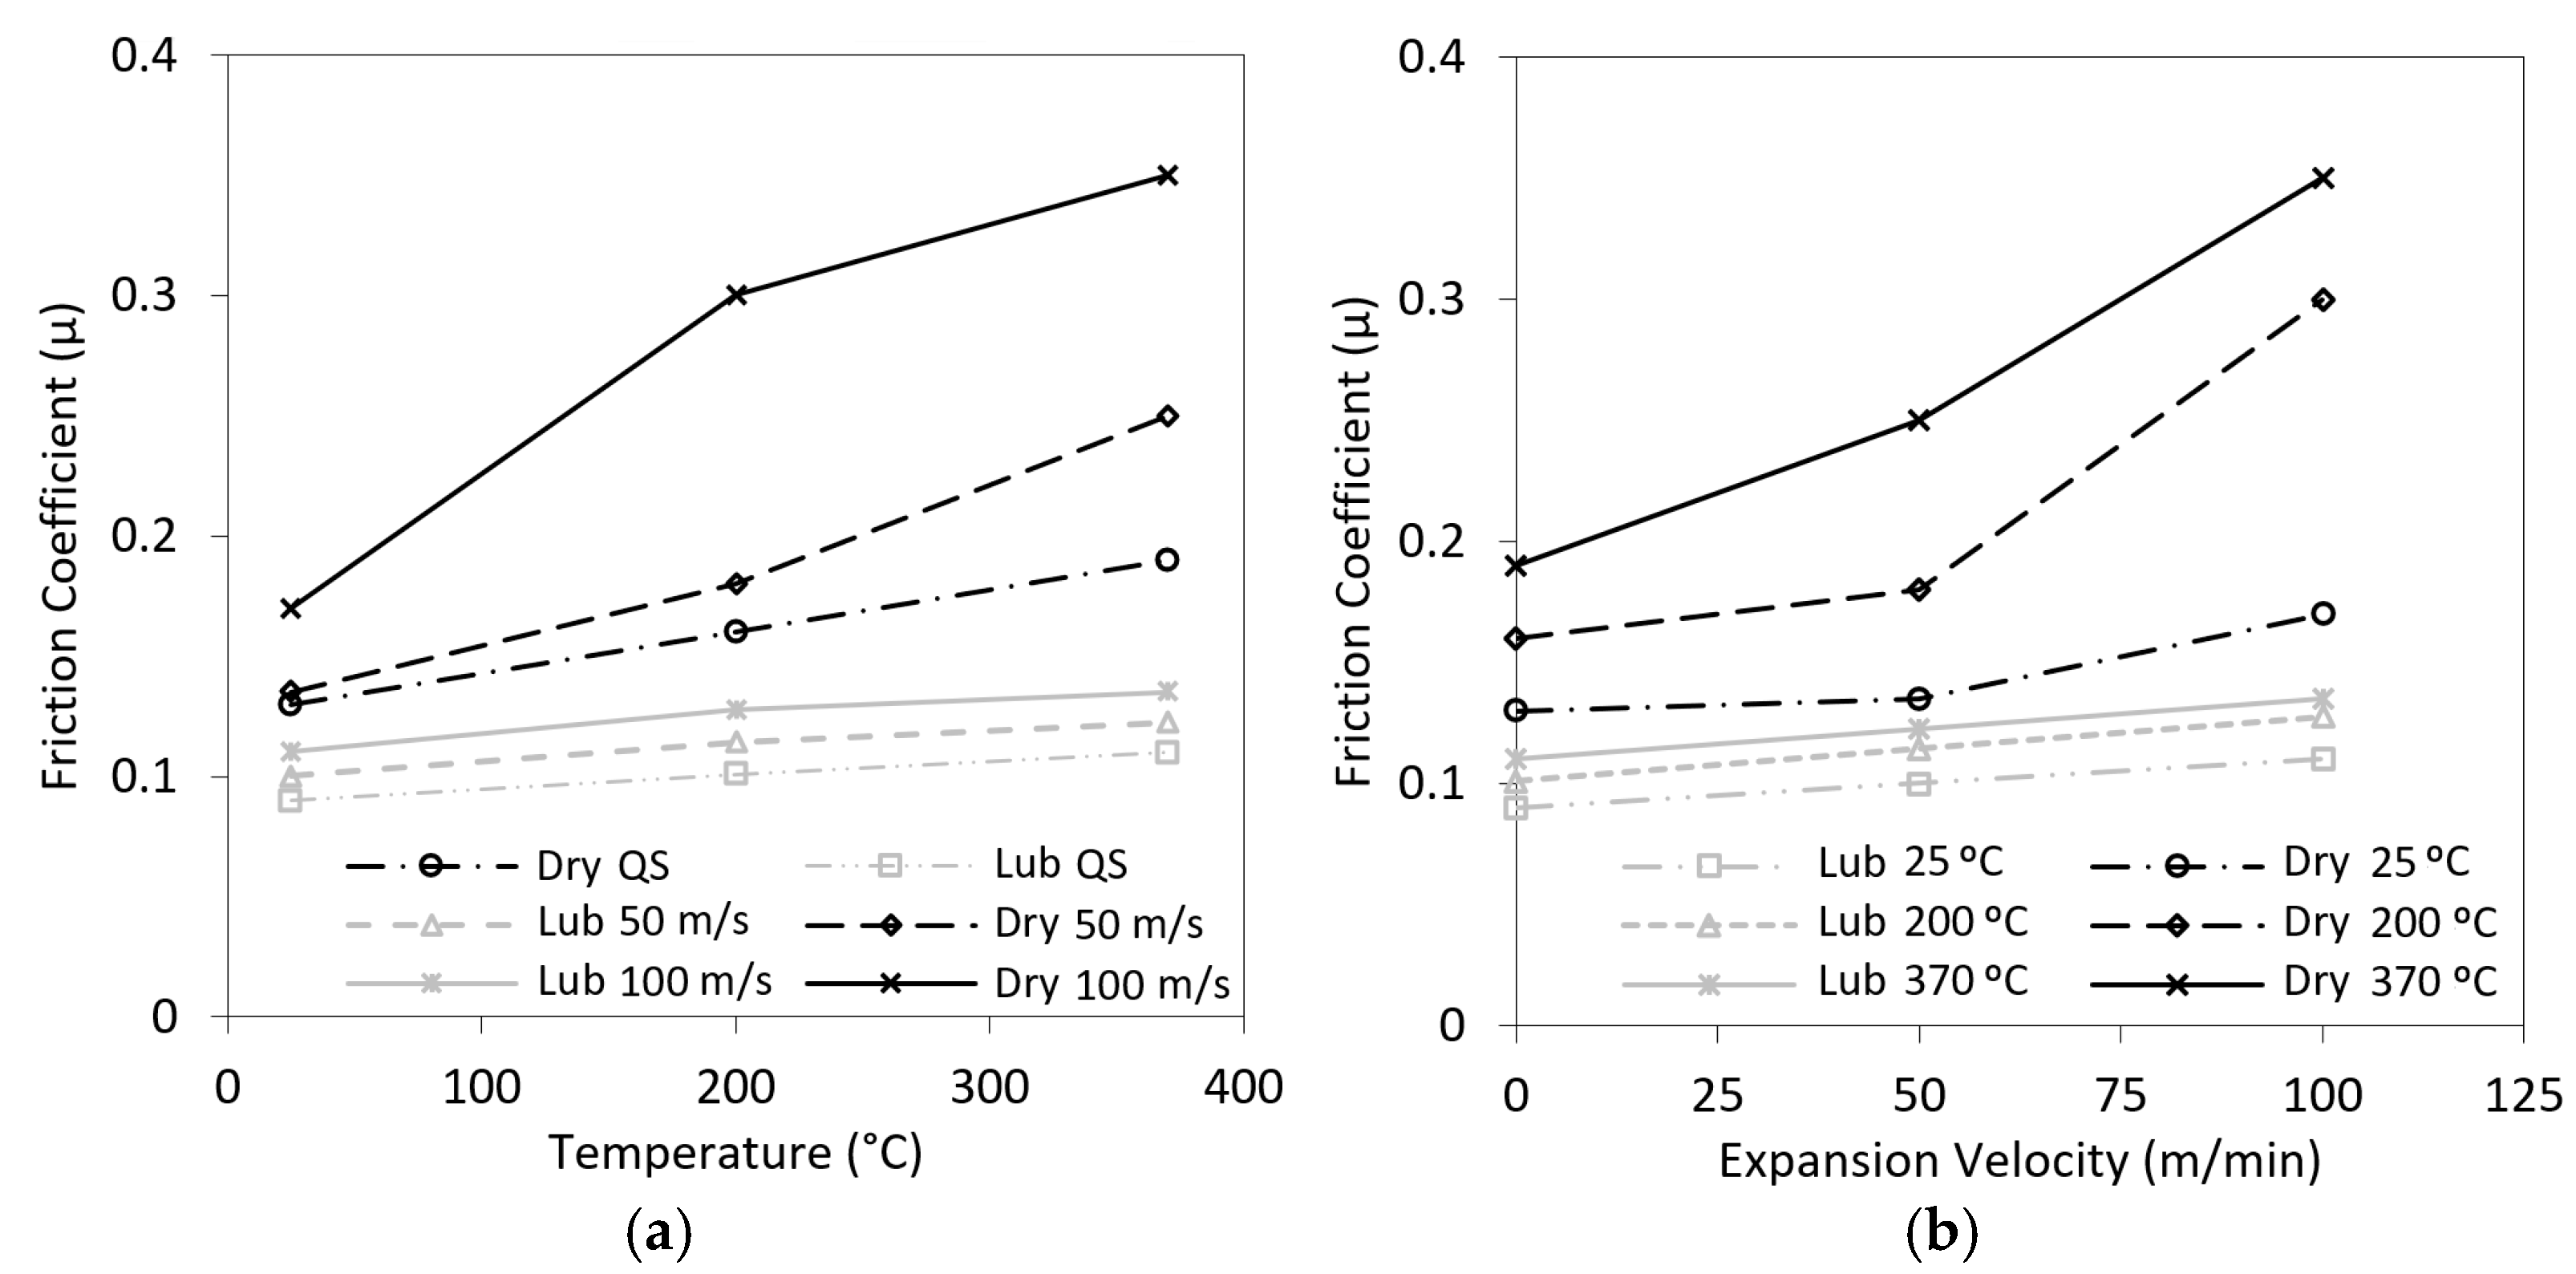
The influence of lubrication, temperature, and strain rate conditions on the friction coefficient value in tool-workpiece contact interface are shown in
Figure 12. It is observed that the use of graphite lubricant (labelled as “Lub”) significantly decreases friction adhesion phenomenon for the materials’ interface in all tested conditions. Still with regards to lubricated conditions, a very consistent (yet modest) increasing trend is found for rising temperatures and strain rates. On the other hand, for dry conditions (labelled as “Dry”), friction coefficient tends to double when the temperature rises from room temperature to approximately 370 °C (
Figure 12a). Similarly, to temperature, strain rate seems to promote an increasing friction coefficient (
Figure 12b). Such results provide evidence of the friction dependence on cutting conditions where the material experiences large strains and high strain rates in the primary deformation zone and most of generated heat due to plastic work to the chip [
32], which in turn slides against the tool at the secondary deformation zone.
4.2. Compliance with Metal Cutting Conditions
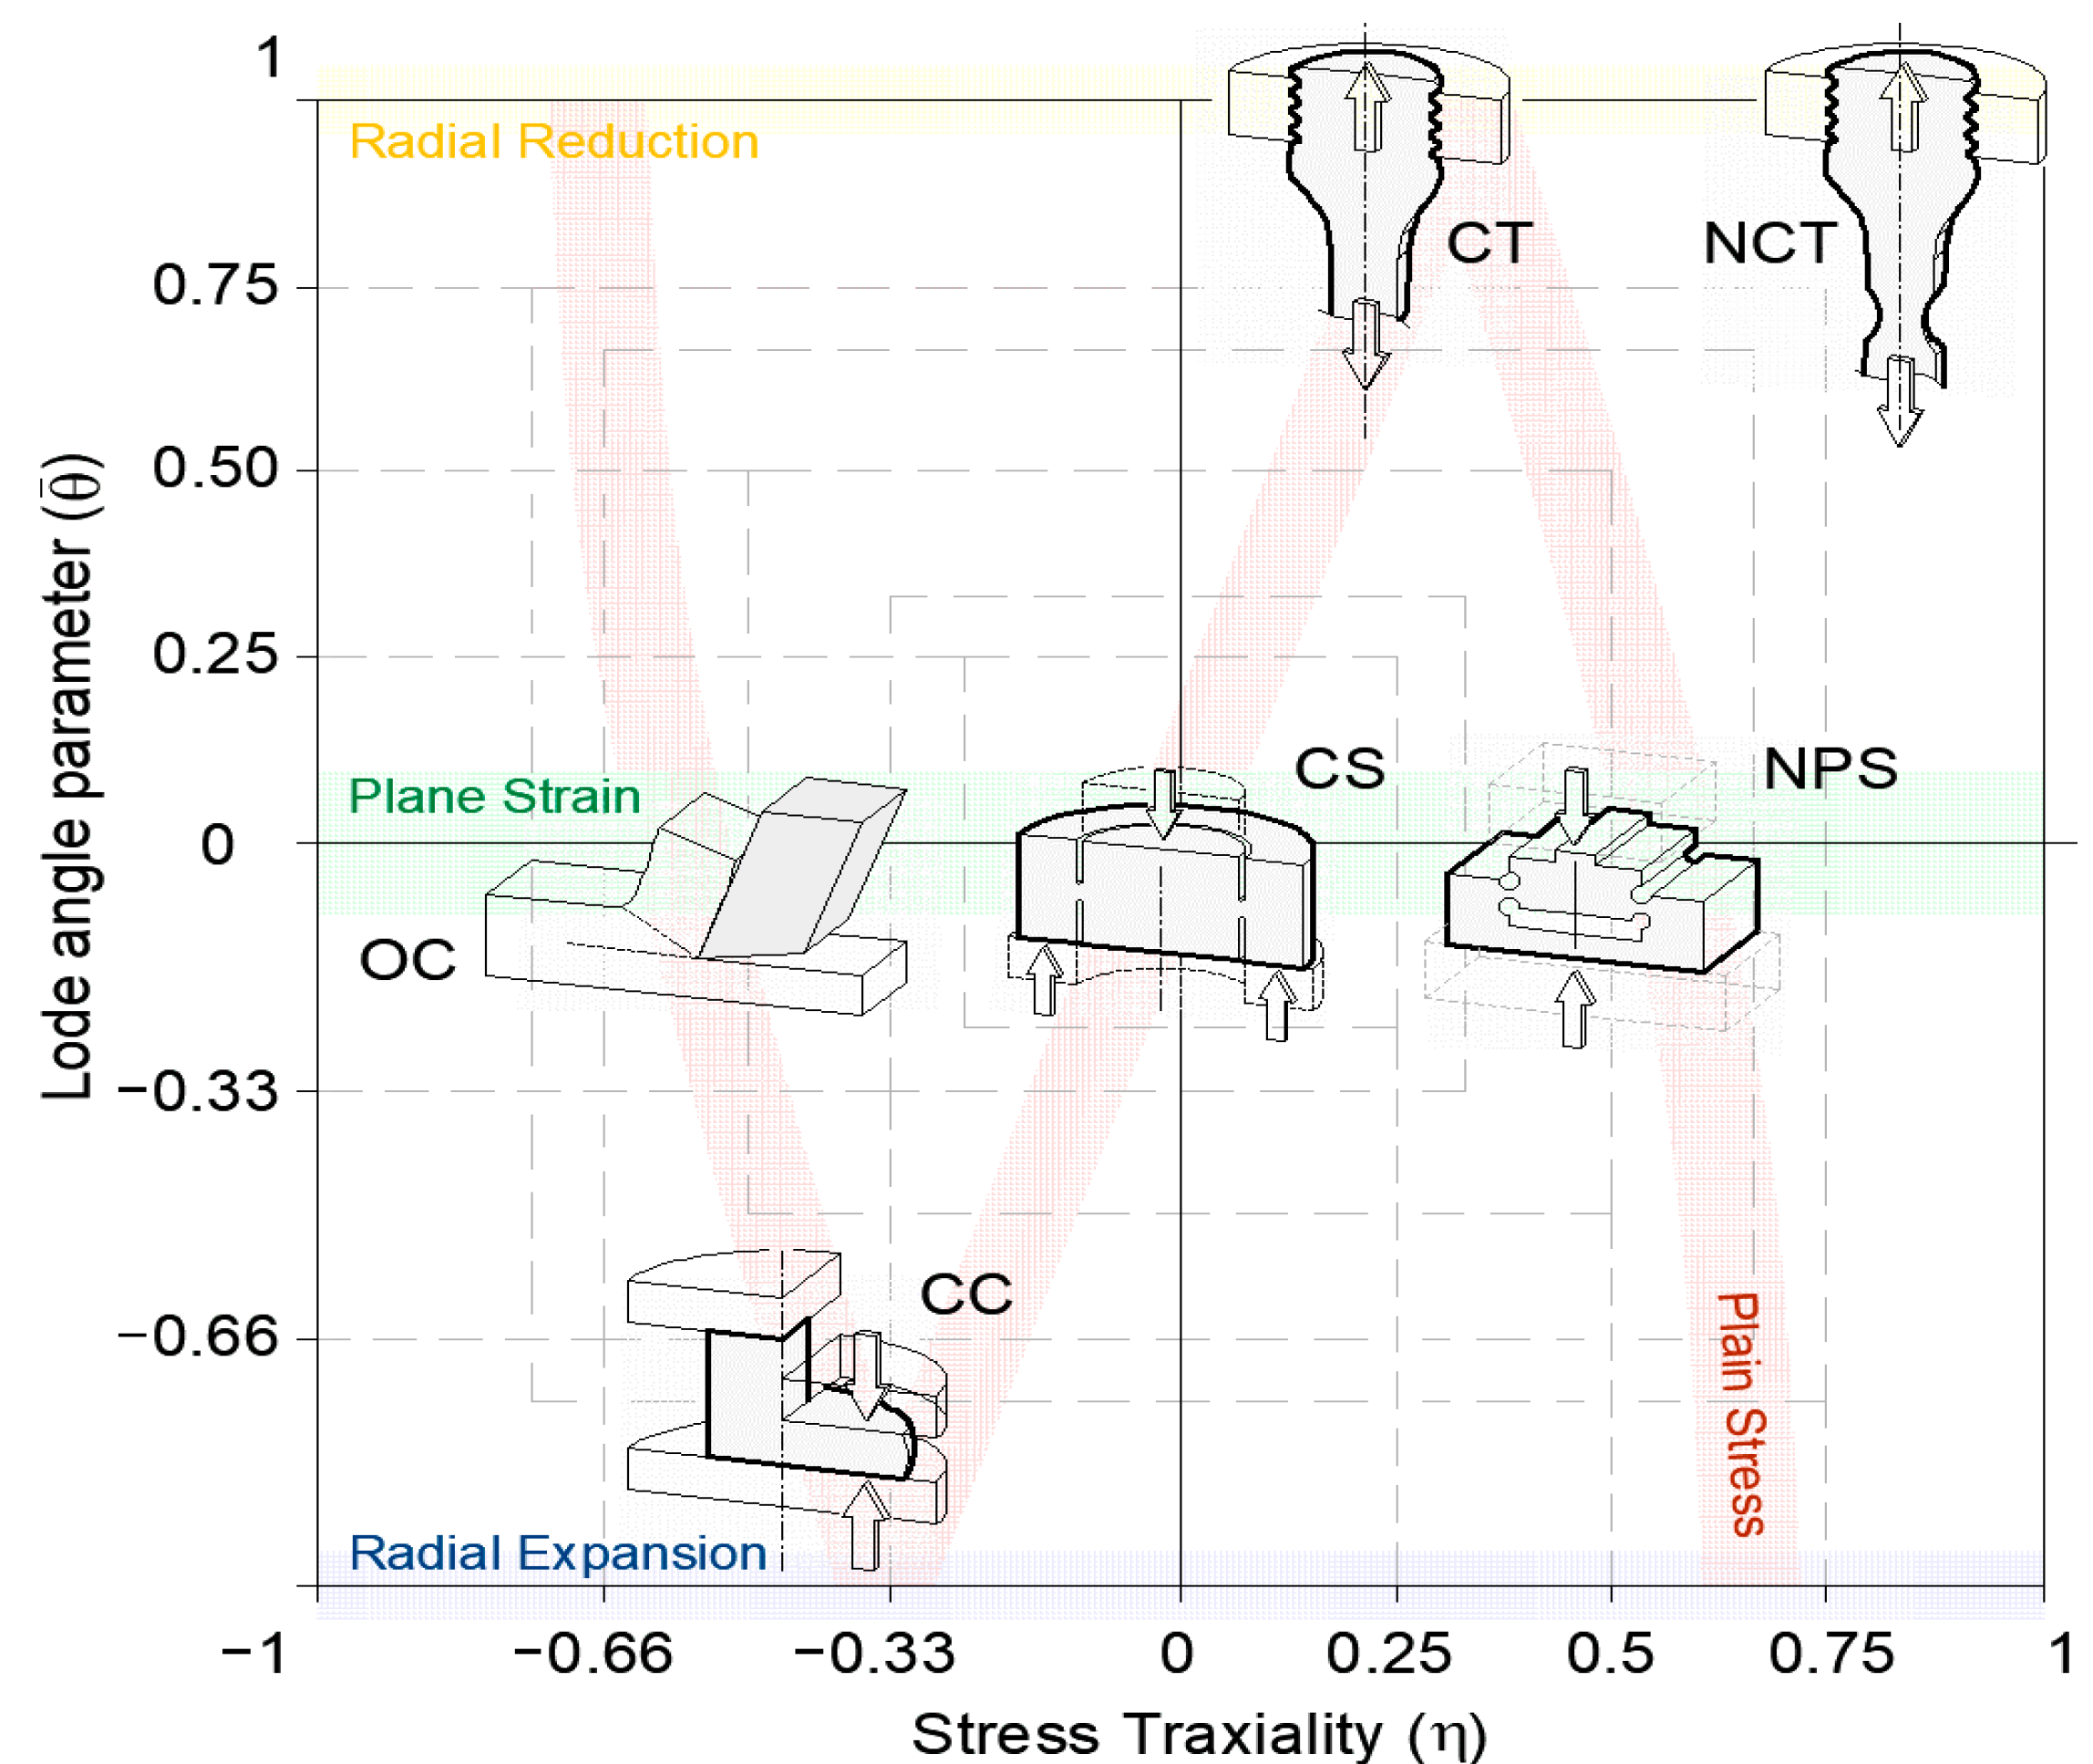
Tensile tests of smooth cylindrical specimens (CT in
Figure 2) were conducted in order to evaluate the stress–strain response of the AMed 18Ni300 maraging steel in radial reduction conditions (positive Lode angle parameter and stress triaxiality). Such geometrical-loading configuration allows for an assessment of the state-of-stress influence on the plastic behavior of the alloy, through direct comparison of the stress–strain curves with the ones obtained through radial expansion (compressive loading). Given that the tests were conducted for distinct notch geometries, it is also possible to access the stress triaxiality influence on ductility, enabling damage initiation model identification for a high range of stress triaxiality, which will be further discussed. The general morphology of the tensile specimens is shown in
Figure 13 and the parametrized notch dimensions are described in
Table 2. The theoretical stress triaxiality (
), assuming unaltered notch contour with deformation, has been calculated according to Bridgman [
35] analytical prediction for each tensile specimen geometry. Quasi-static conditions were ensured through the imposition of a 1 mm/min pulling speed to the machine crosshead (Instron 5900R universal servo-hydraulic testing machine), which registered load through the built-in 100 kN load cell and displacement through the usage of an extensometer (MTS 632.12C-20) with a 25 mm gauge length.
The severe plastic deformation in metal cutting highlights the importance of its thorough characterization, especially since it is widely acknowledged that depending on the state-of-stress, the deformation behavior can significantly differ in certain materials [
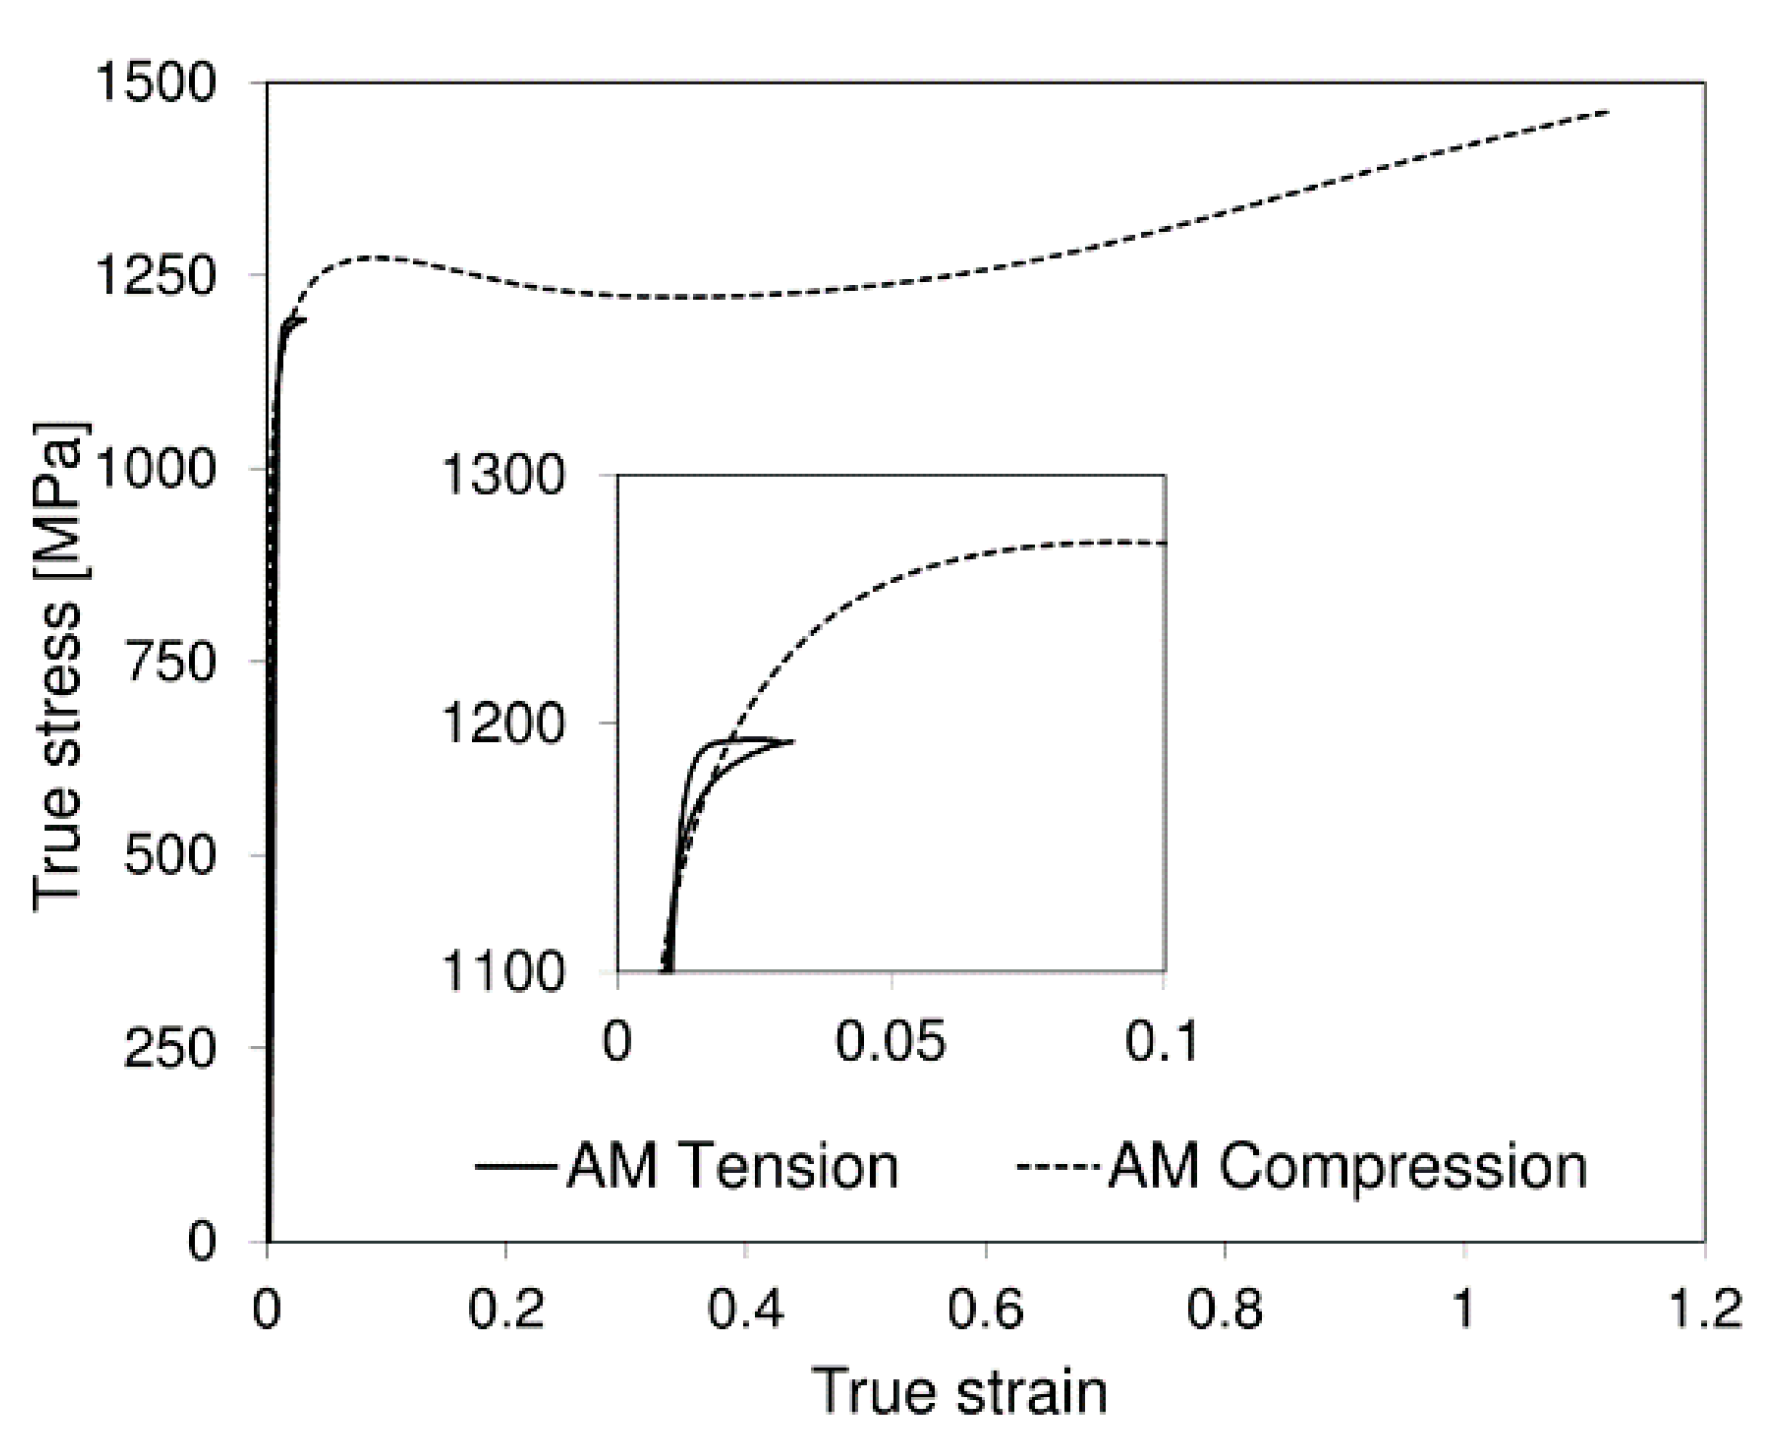
19]. The comparison between the true stress–strain curves of the AMed 18Ni300 maraging steel obtained from compression and unnotched tensile tests is shown in
Figure 14. It is relevant to notice that due to the plastic instability, which leads to non-uniform deformation, the tensile curve is shown up to necking. Despite the very limited extent of uniform plastic deformation of the unnotched tensile tests, a clear plateau that corresponds to plastic yield is noticed, revealing a considerably distinct yield strength depending on loading direction. The observed strength differential effect between compression and tensile loading suggests the sensitivity of the tested alloy to the state-of-stress. Similar behavior has been reported for several AMed alloys [
36,
37], including the same maraging steel alloy [
38]. However, this behavior does not seem to be exclusive of AMed metallurgical condition, given that appreciable differences between compressive and tensile yield strengths have also been noted for martensitic steels [
39], including the same maraging steel alloy of conventional manufacturing (wrought) [
40]. In addition, the magnitude of the tension/compression strength differential shows similar values (~10%) to that reported for the same material.
In order to accurately portray the plastic deformation during the metal cutting simulation, the mechanical response should be compliant with the plane strain conditions of the chip formation mechanism. Due to its ability to cover an intermediate range of stress triaxialities and null Lode angle parameter, the suitability of the double-notched specimen towards the calibration of plastic and damage models, for cutting applications has been demonstrated by multiple authors [
1,
18]. These plane strain specimens consist of symmetric double notched geometries (refer to
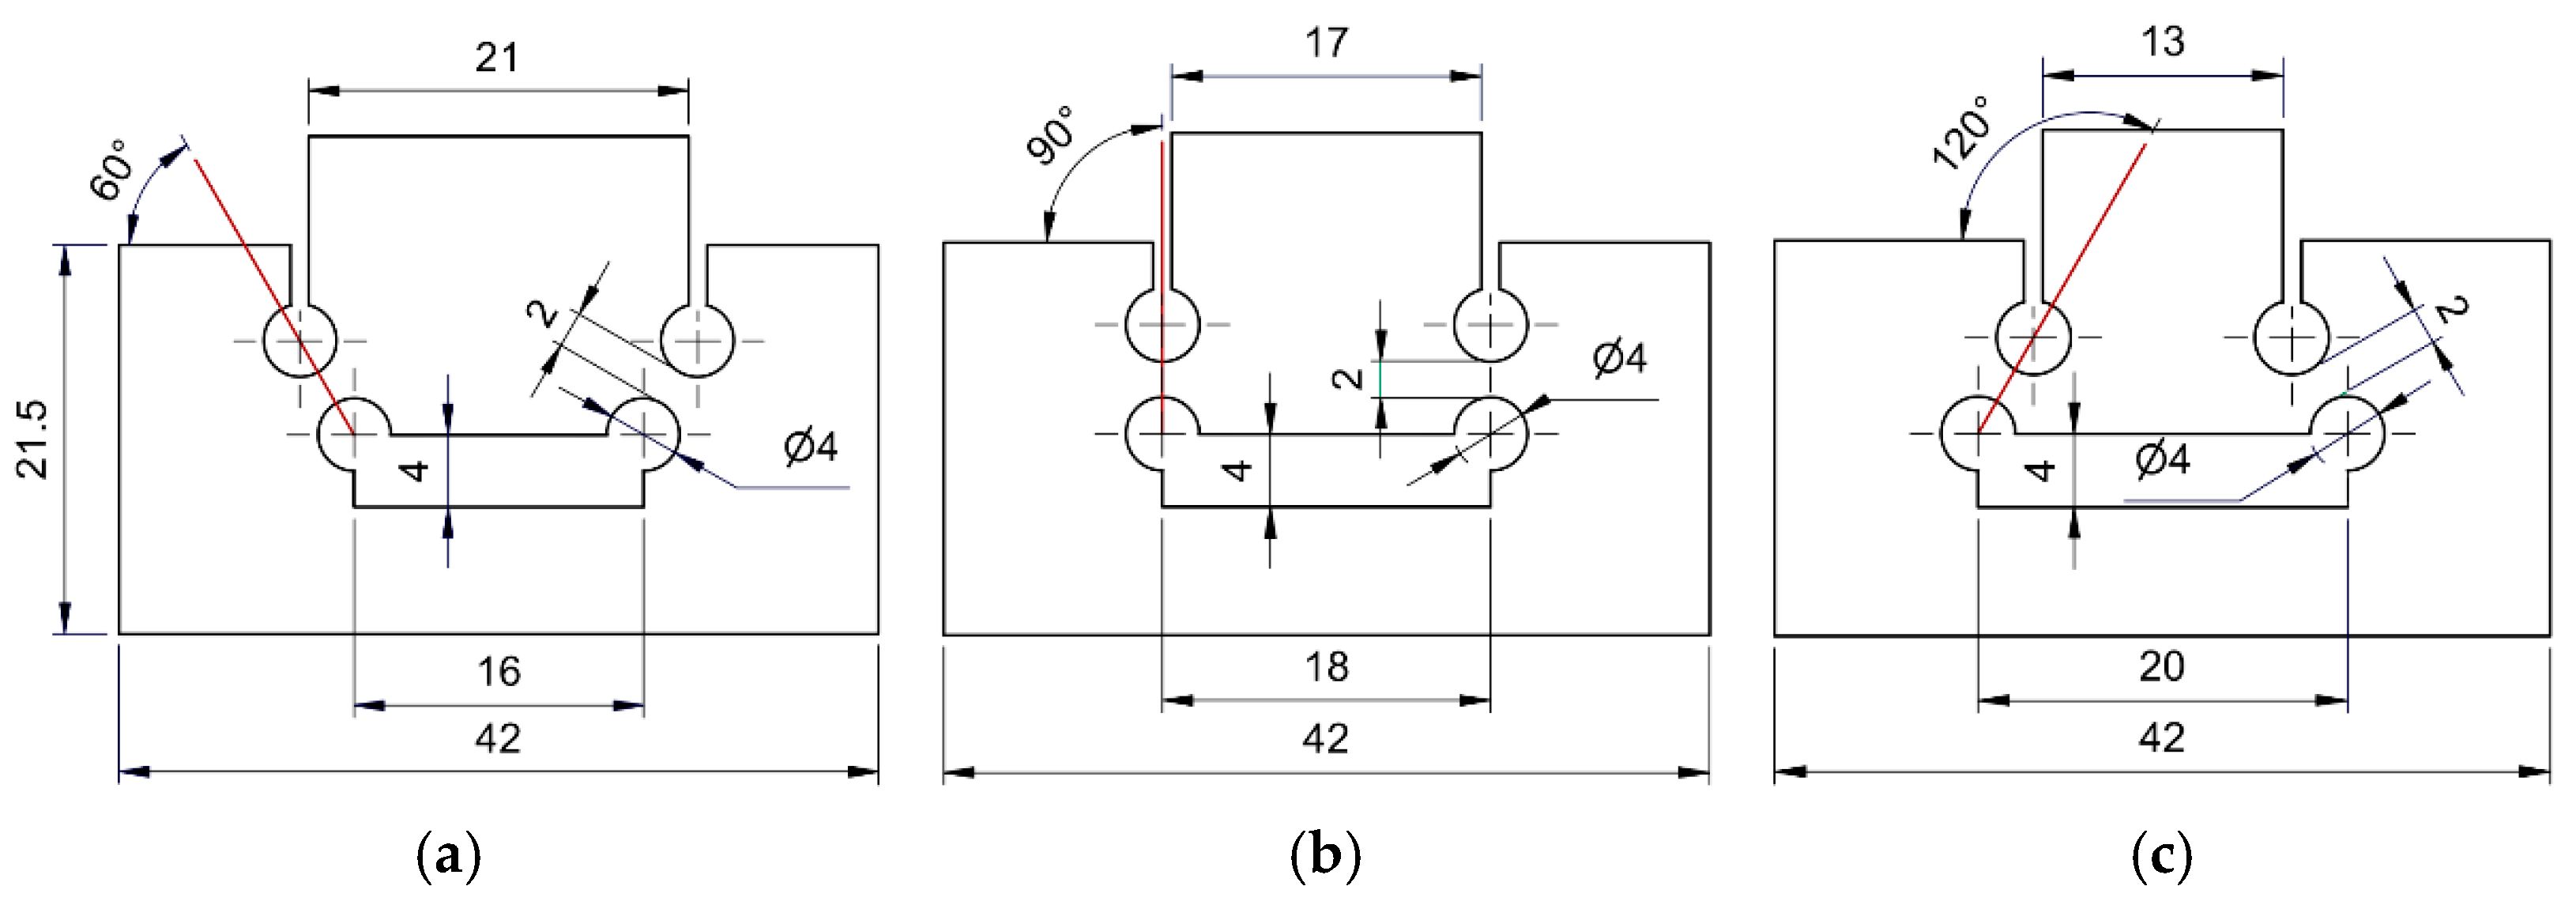
Figure 15), where cylindrical starter cracks have been introduced to create a constant ligament length of 2 mm before loading. The length of the ligament allows to confine plastic deformation to a small region in between the cylindrical notches. The experiments consist in determining the punch shearing load–displacement evolution when the specimen is compressed between compression platens, from which critical damage and flow stress of the material under plane strain conditions may be deduced. Through the variation of the double notch configuration, it is possible to change the specimens’ pressure angle, which is defined by the straight line that is colinear with the centers of the two cylindrical notches. Such modification results in a change of stress triaxiality within the same null Lode angle parameter (plane strain conditions). In the current research work, three distinct pressure angles were tested. For a pressure angle of 90°, null (or close to null) stress triaxiality due to the theoretically pure shear condition is achieved; for a pressure angle of 60° a combination of compression and shear is attained, developing intermediate negative stress triaxialities; for a pressure angle of 120°, a combination of a tensile and shear state-of-stress is achieved, yielding intermediate positive stress triaxialities.
The tests were carried in the same universal testing machine as the tensile tests. A quasi-static compression speed of 1 mm/min was imposed to the machine crosshead and two repetitions were conducted in order to ensure experimental repeatability. Due to specimen symmetry, it was important to ensure not only that the compression plates were parallel between each other (top and bottom), but also perpendicular to crosshead displacement direction. Even though there is a major focus of these specimens towards the identification of the damage initiation and evolution model, they provide very important insight on material’s plasticity and flow stress validity. Given the flaws of typical mechanical characterization methodology, say, for example, friction in compression tests and plastic instability in tensile test, added to the fact that none of both is in identical state-of-stress conditions to cutting (plane strain), the notched bar shear tests allow for a crucial inverse calibration of the plasticity models identified through direct calibration.
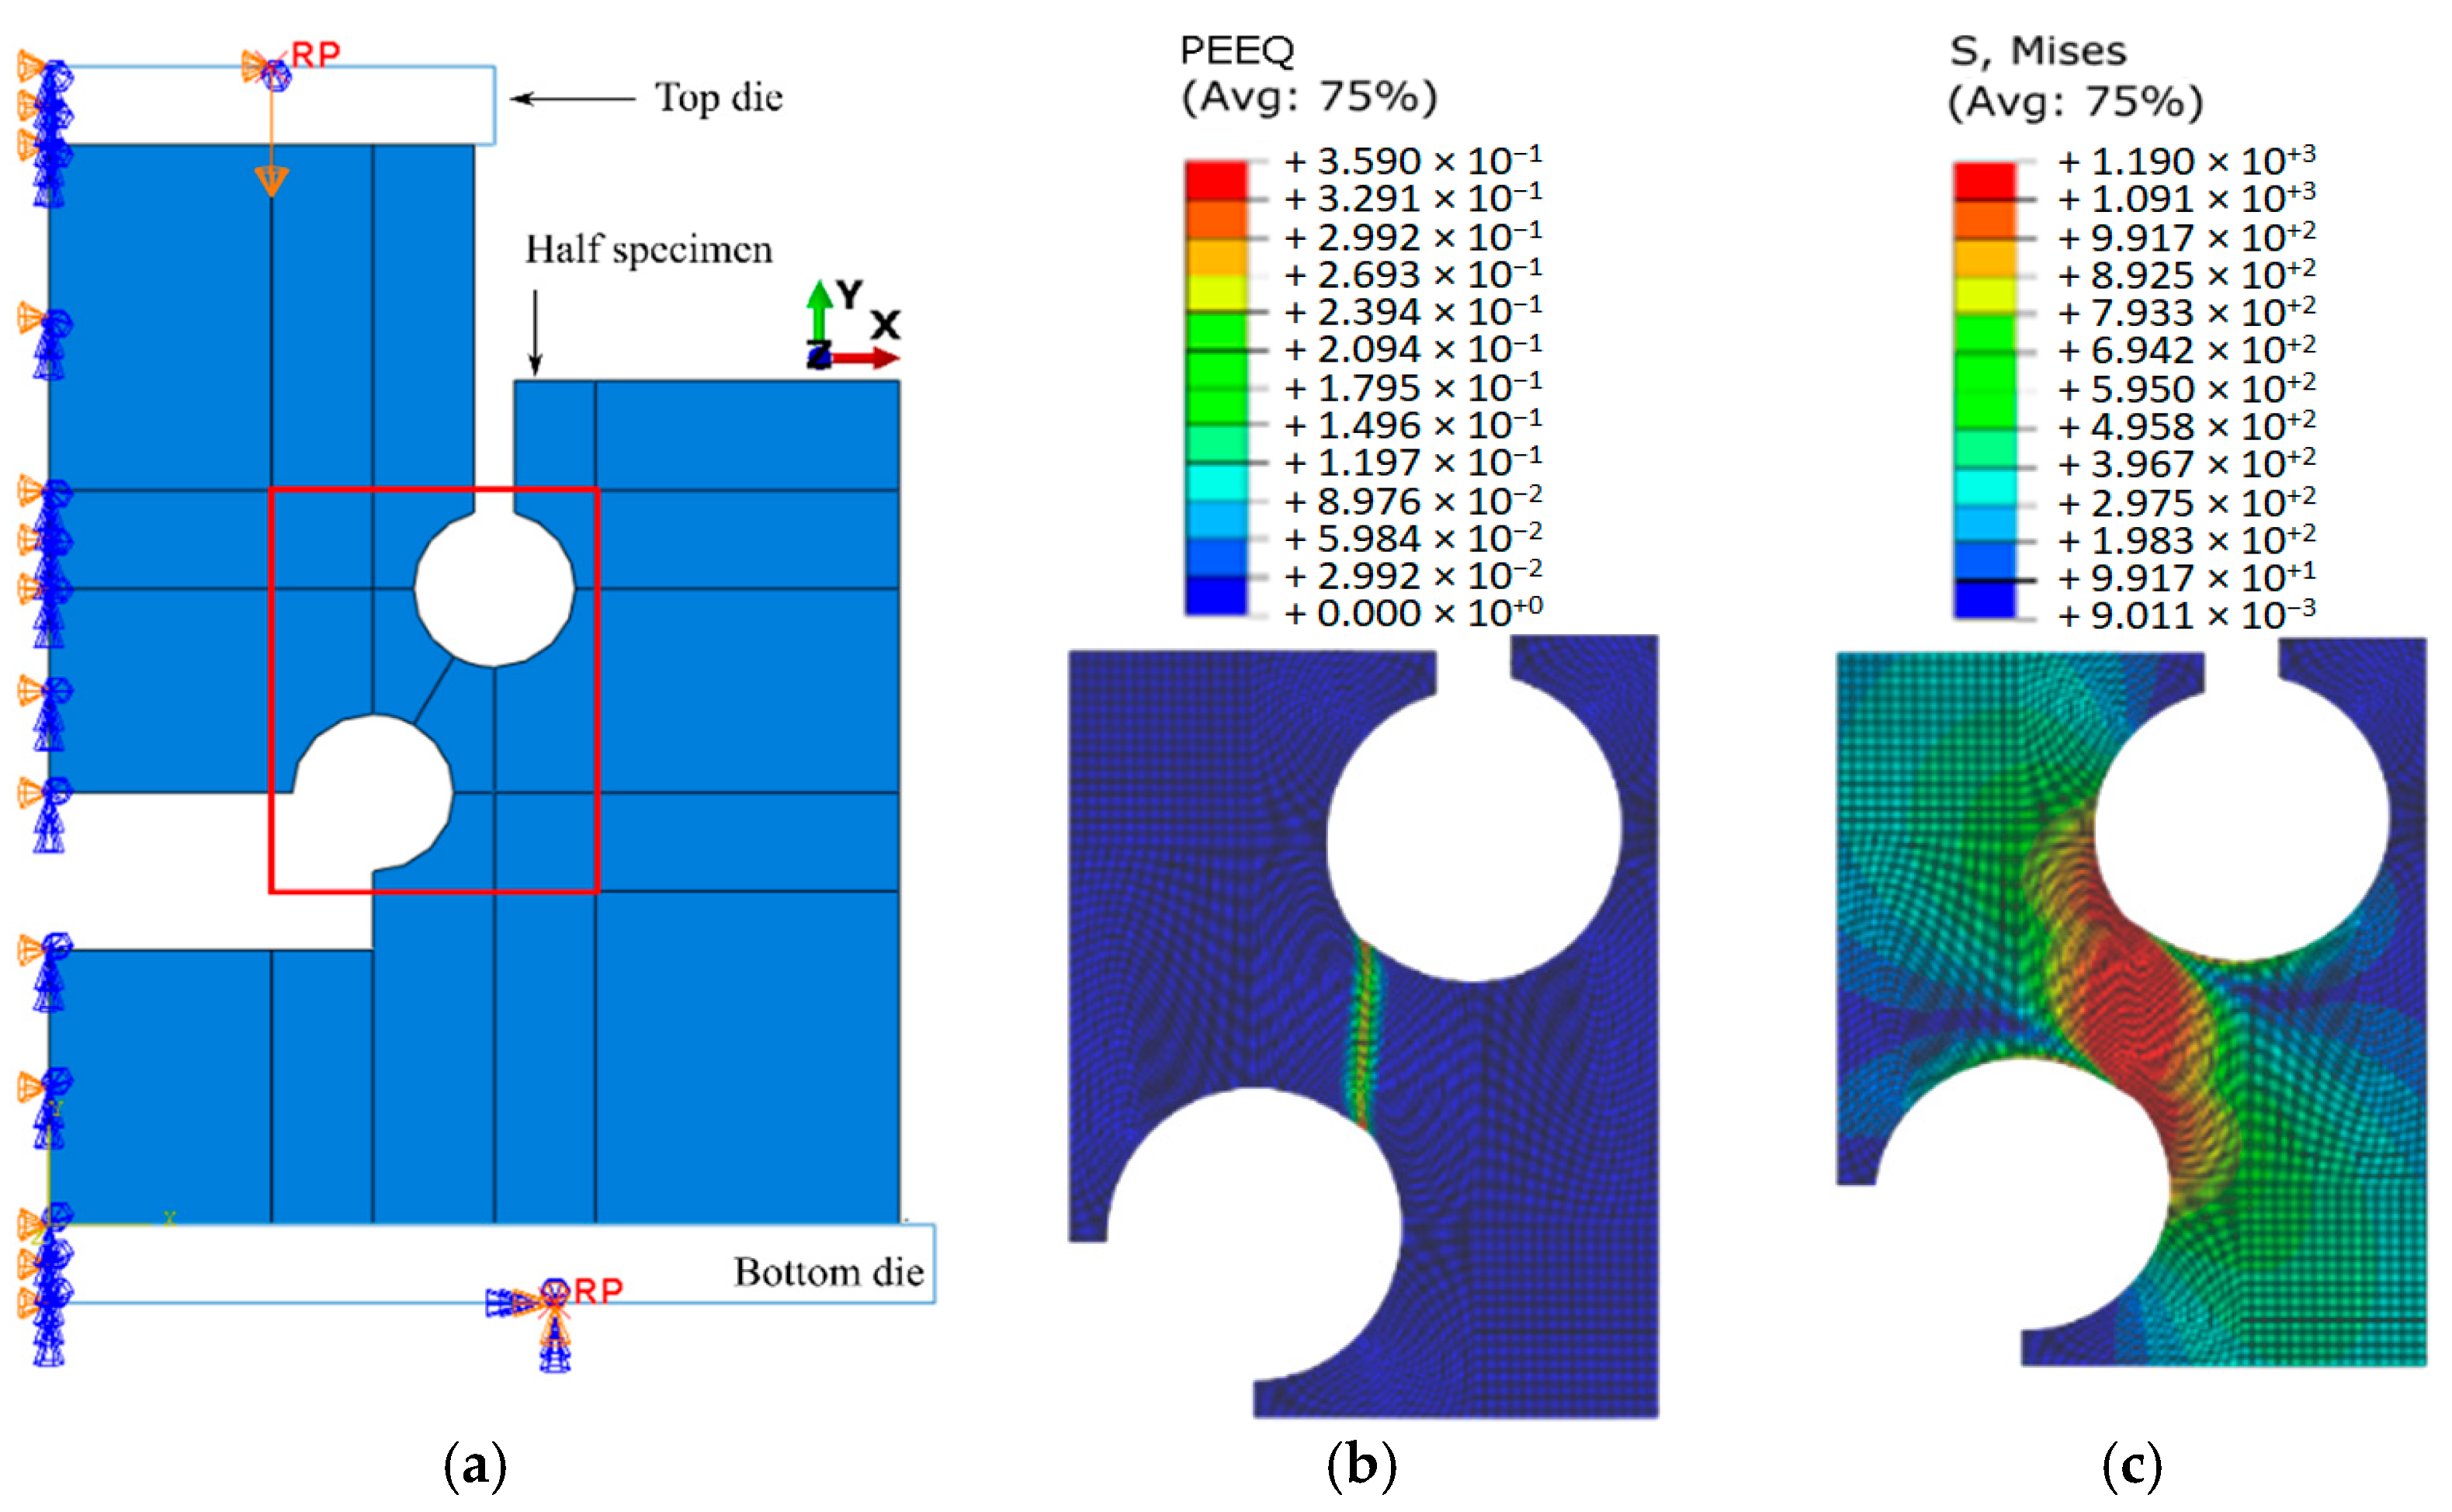
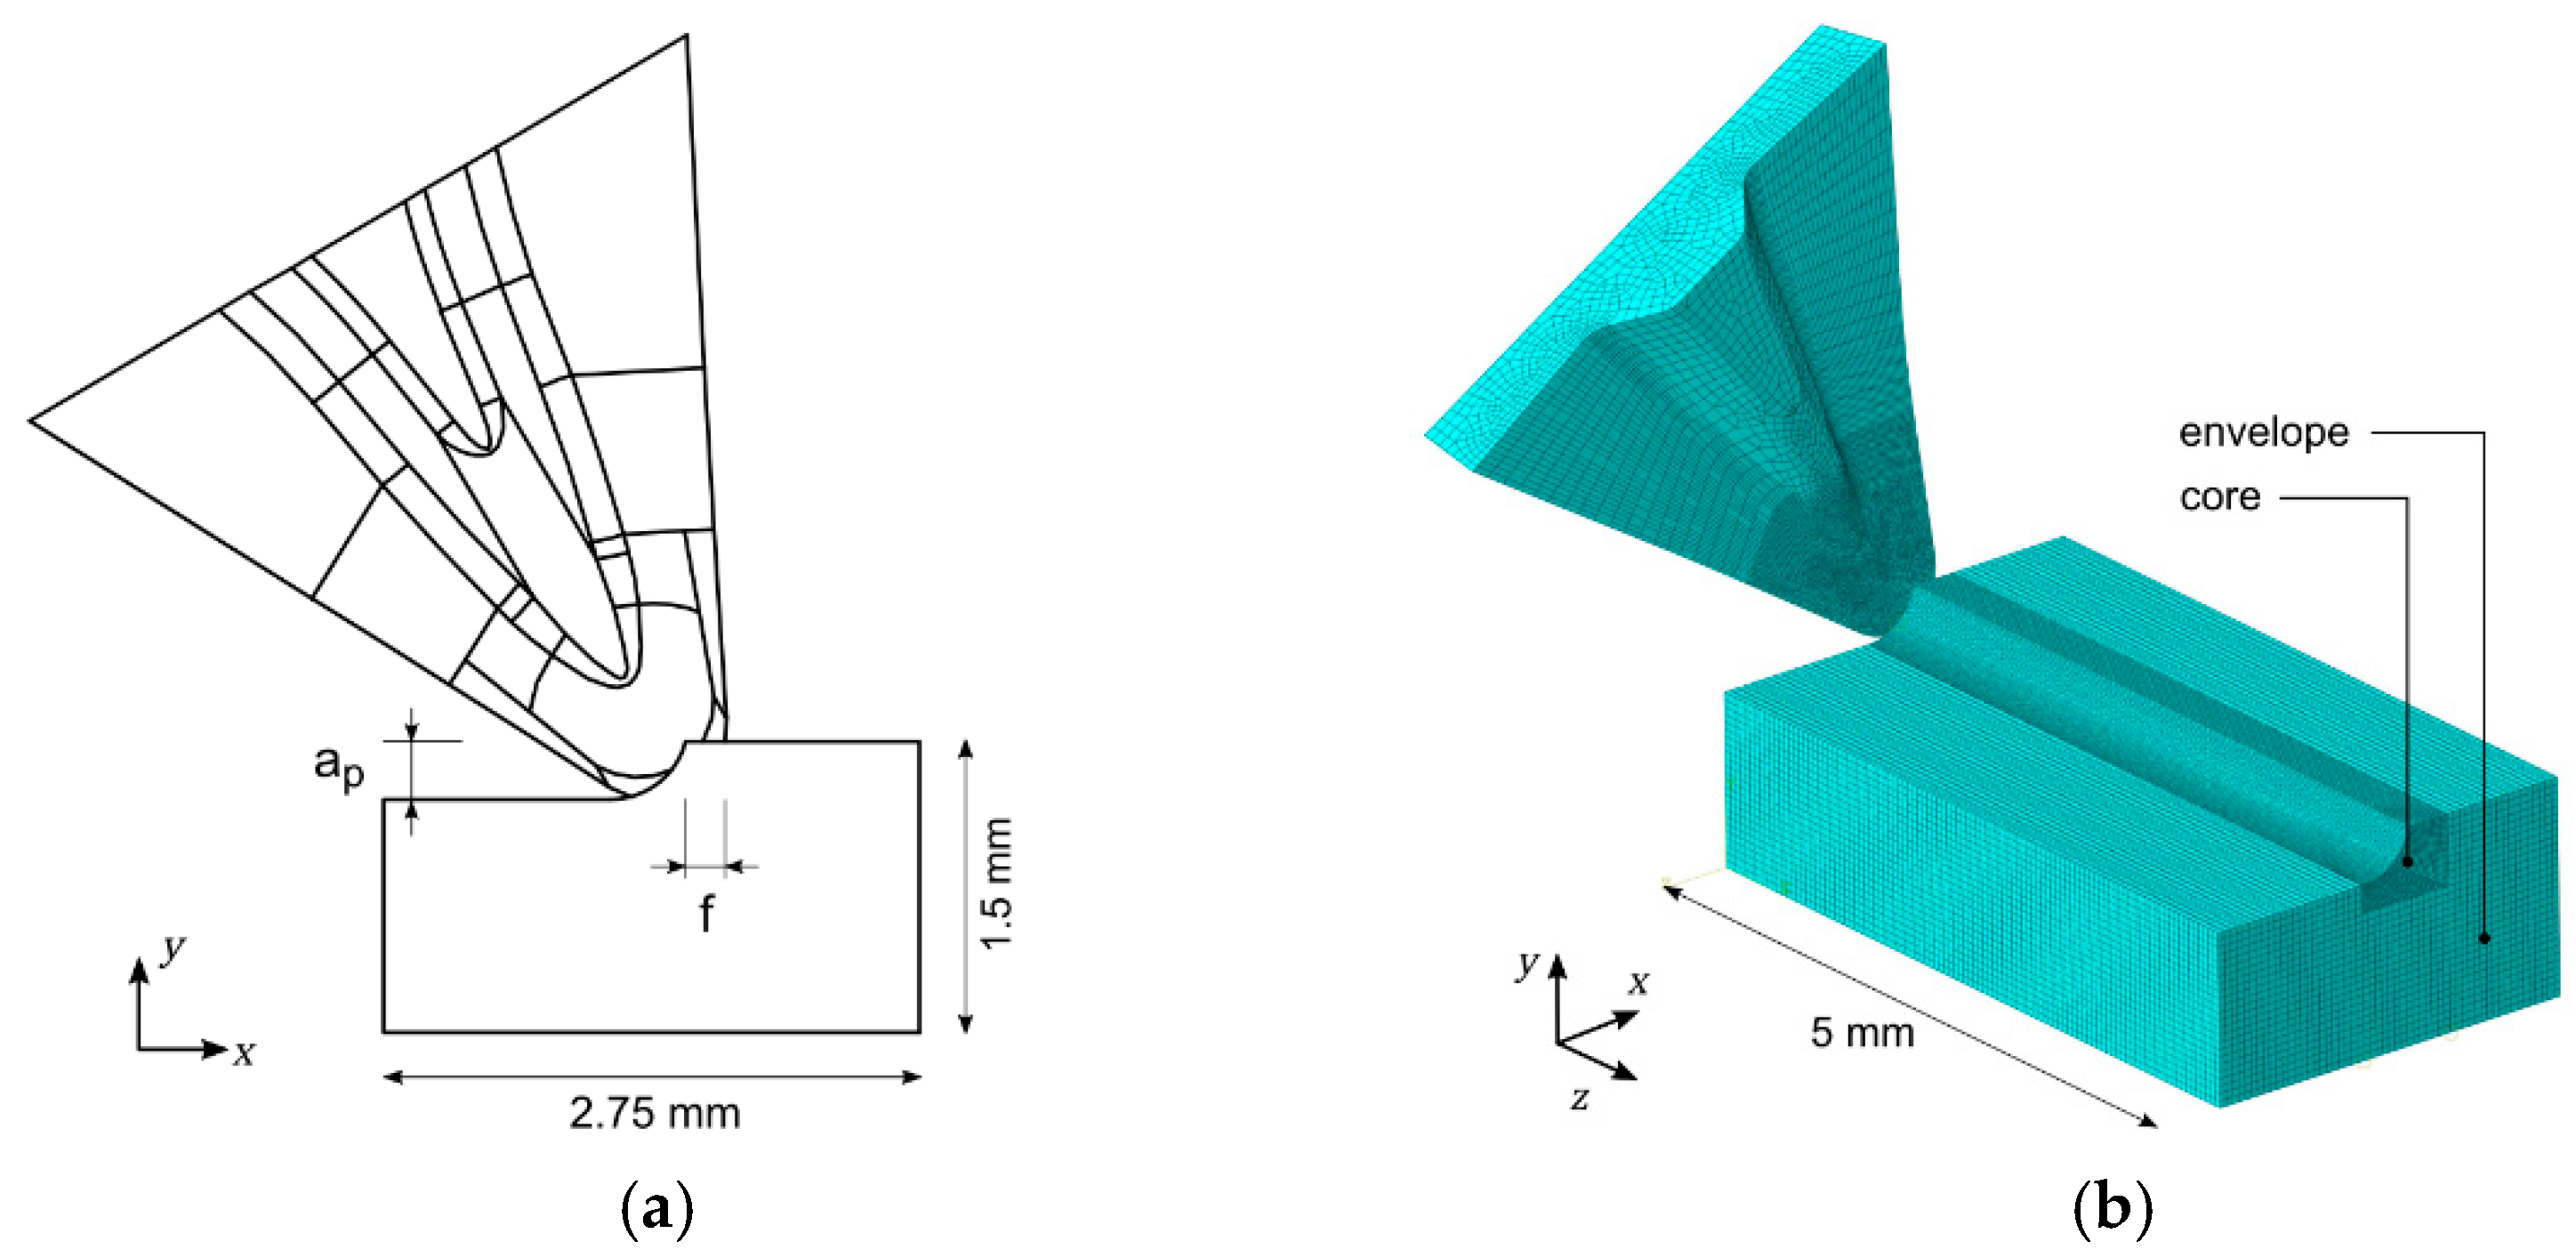
In this research work, a 2D plane strain approach was used for the simulation of the double notched plane strain specimens. Their symmetry enabled the modelling of half-specimen (refer to
Figure 16). Four-noded elements with reduced integration (CPE4R) and an element size mesh of 0.05 mm were used. The model consists of a top die (with one degree of freedom in vertical direction) that compresses the specimen onto a bottom die (encastred). Both dies were modelled as rigid bodies.
The successful portrayal of the double notched specimens’ plastic deformation behavior theoretically ensures a material plasticity law in a similar state-of-stress to metal cutting. Such can be achieved through the development of constitutive laws that are sensitive to the state-of-stress or, alternatively, through the inverse calibration of simpler plastic laws with the plane strain specimen. Considering the latter, it is of utmost importance to establish physically admissible upper and lower boundaries for the inverse estimation of the plane strain compliant plastic law, making the direct calibration of the tensile and compression tests a necessary initial step.
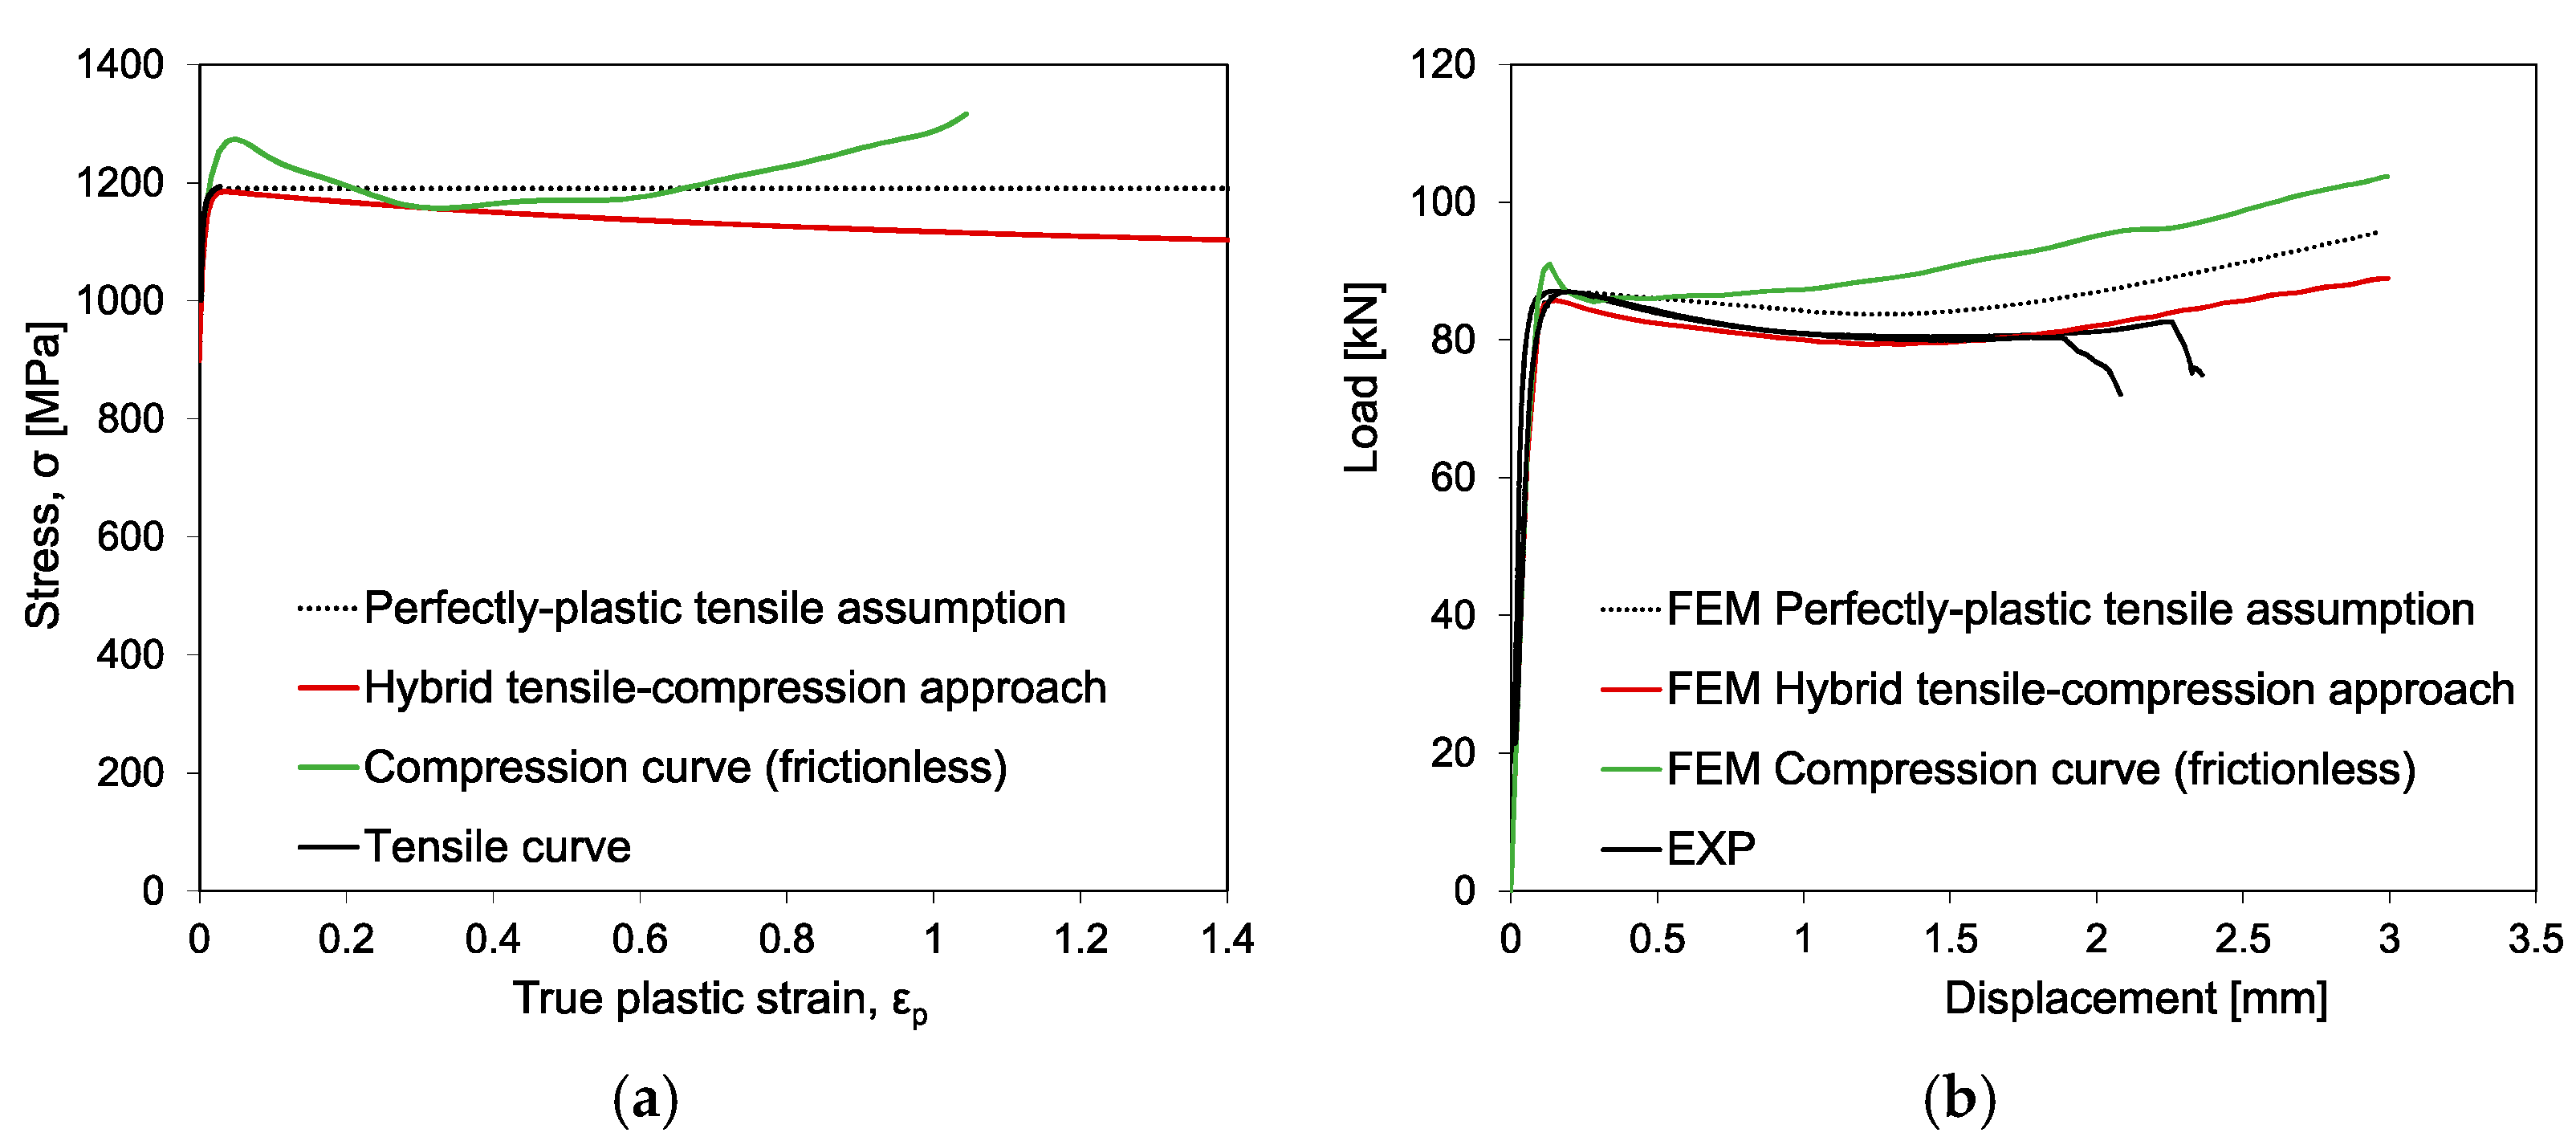
The double notched plane strain specimens have been simulated using distinct flow stresses based on the conducted characterization tests, which are shown in
Figure 17a. The green curve corresponds to the (frictionless) compression test and the black dotted curve to the perfectly plastic assumption of the tensile test. An extrapolation of the tensile tests was required, given its limited extent within uniform plastic deformation. In addition, a third curve that corresponds a combined inverse calibration (based on both tensile and compression direct calibration) was built. The curve captures the tensile material response for low strain values and assumes quasi-linear negative strain hardening that is tangent to the minimum stress values obtained by compression testing. Due to allowing for an initial hardening and its saturation (or even softening) the combined Swift-Voce law (Equation (4)) has been selected to model the isothermal quasi-static hardening of this hybrid approach and the parameters are shown in
Table 3.
Figure 17b shows the comparison between the experimental and the numerical load–displacement results for the 60° pressure angle double notched plane strain specimens, using each of the three distinct plastic flow stress evolutions illustrated in
Figure 17a. It is important to note that a damage model was not included at this stage, given the initial focus was on the assessment of plastic behavior.
The load displacement results show very high sensitivity to the applied plastic load, which can be related with the highly heterogeneous shear strain field. It is observed that the flow stress obtained from frictionless compression testing (green curve) and perfectly plastic tensile assumption overestimate the experimental loads. On the other hand, the combined inverse calibration, inspired on both tensile and compression test data, can accurately depict the plastic behavior of the double-notched plane strain specimens.
As regards to the damage initiation model, the numerical procedure for fracture strain estimation consists in the simulation of both notched and unnotched tensile tests as well as the notched plane strain tests (using the inversely identified model) and comparing the numerical load–displacement curves with the experimentally obtained. Damage initiation was defined as the displacement at which the calibrated FEM plastic prediction and the experimental curve diverge.
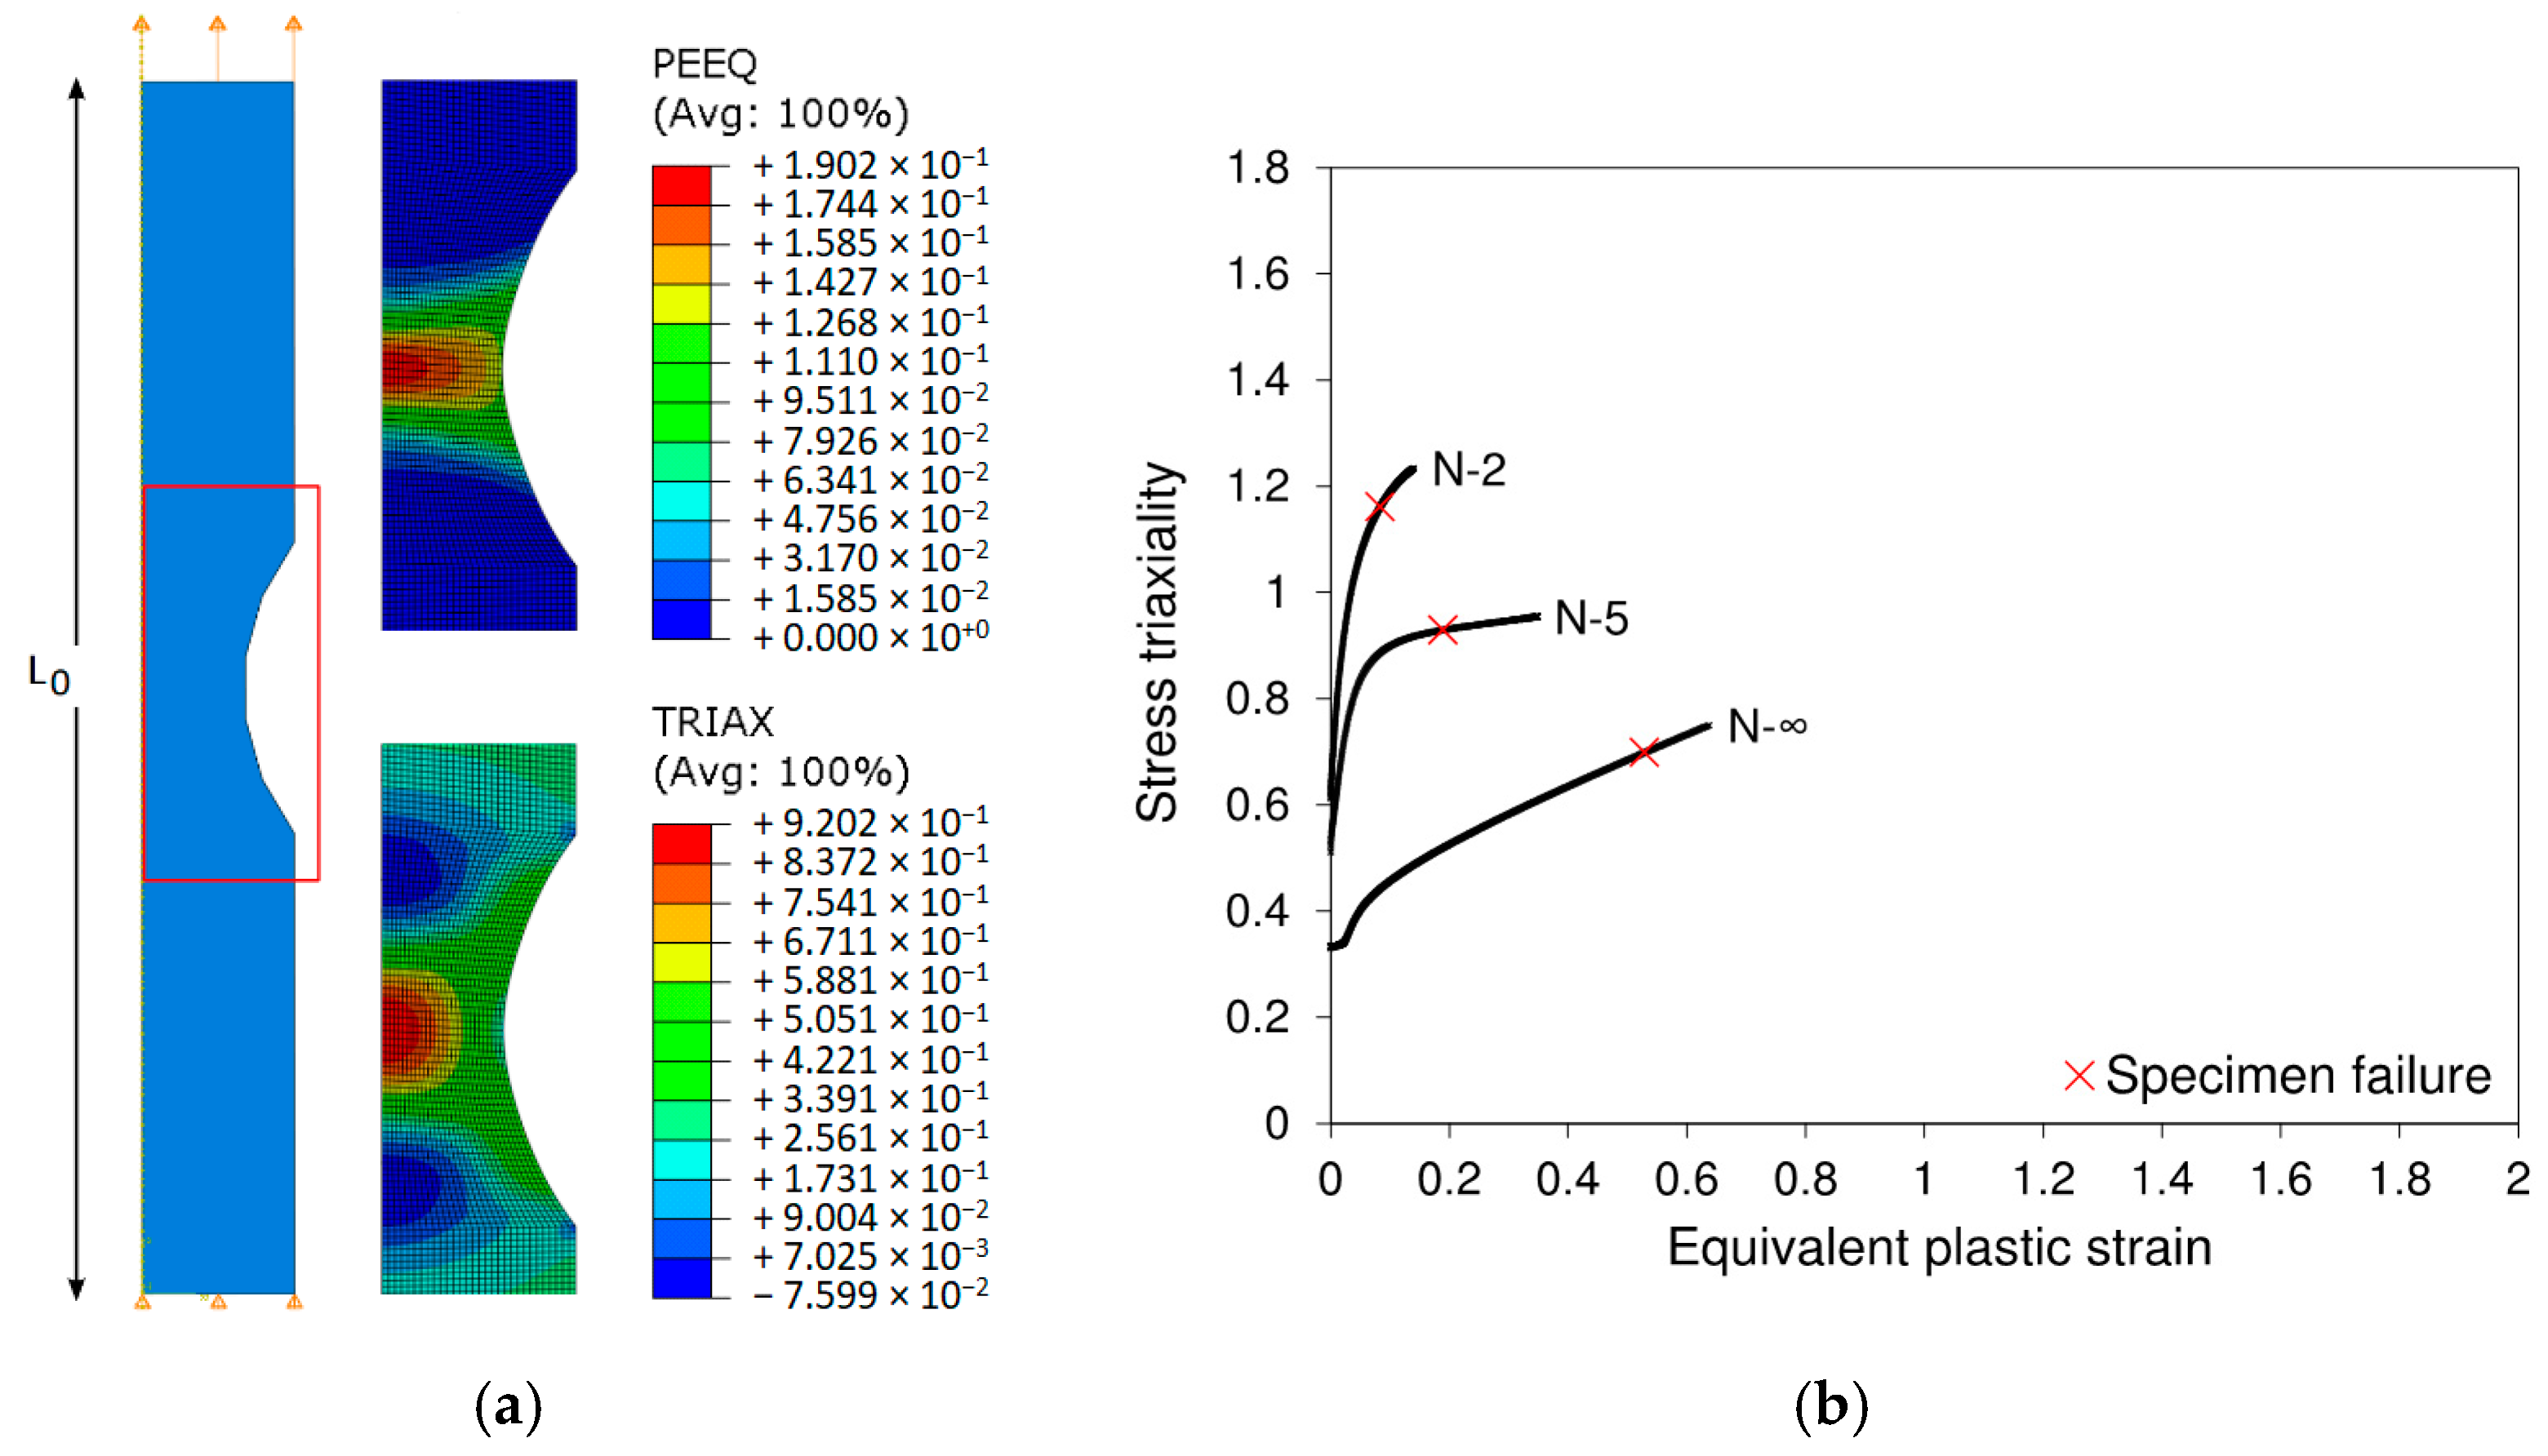
For the tensile tests simulation, four-noded axisymmetric elements with reduced integration (CAX4R) were used to mesh the specimens with an element size of 0.1 mm. The adopted boundary conditions include, apart from axisymmetry, null displacement in vertical direction of the bottom nodes and a vertical displacement on the top nodes, as illustrated in
Figure 18a. The numerical models were built for the extensometer gauge length, which was of 25 mm.
Figure 18a additionally shows the field distributions of equivalent plastic strain and stress triaxiality of a notched specimen N-5, refer to
Table 2. It is observed that both are localized in the center region of the specimen, where will be maximum. That location has, therefore, been selected for data retrieval as regards the failure strains and respective stress triaxialities, which are shown in
Figure 18b, in the function of equivalent plastic strain. The results are in accordance with the predicted trend of lower ductility for higher stress triaxiality (or more pronounced notch geometry). Despite the accurate theoretical prediction of stress triaxiality (
for very incipient strain values, the intense geometrical softening of the specimens (mostly as diffuse necking) results in deviation from initial notch morphology. Thus, a significant evolution of stress triaxiality up to fracture is noticed, highlighting the need for the application of this numerical methodology in order to circumvent plastic deformation localization and instability in tensile loading which hinders direct estimation of fracture strain.
With reference to the double-notch plane strain tests, the determination of fracture strain in function of stress triaxiality and the equivalent plastic strain field distributions was supported by the experimental images of the deformed specimen shapes.
Figure 19a illustrates the procedure for the deformed shape of the 60° pressure angle notched bar specimen at the damage onset. Relevant to highlight is the similarity between the numerical and experimental specimen deformed shape, which allows for a further validation of the inversely identified plastic law. In addition, it is possible to notice the beginning of crack propagation (signaled dashed line) which, relying on the numerical model, enables the identification of stress triaxiality (
Figure 19c) and equivalent plastic strain (
Figure 19b) along the actual experimental crack path. Experimental crack location is in accordance with the maximum equivalent plastic strain at the hole contour surfaces. Such has promoted the propagation of the crack from the surface to the center of the ligament and the identification of the equivalent plastic strain and stress triaxiality fracture thresholds for each notched specimen.
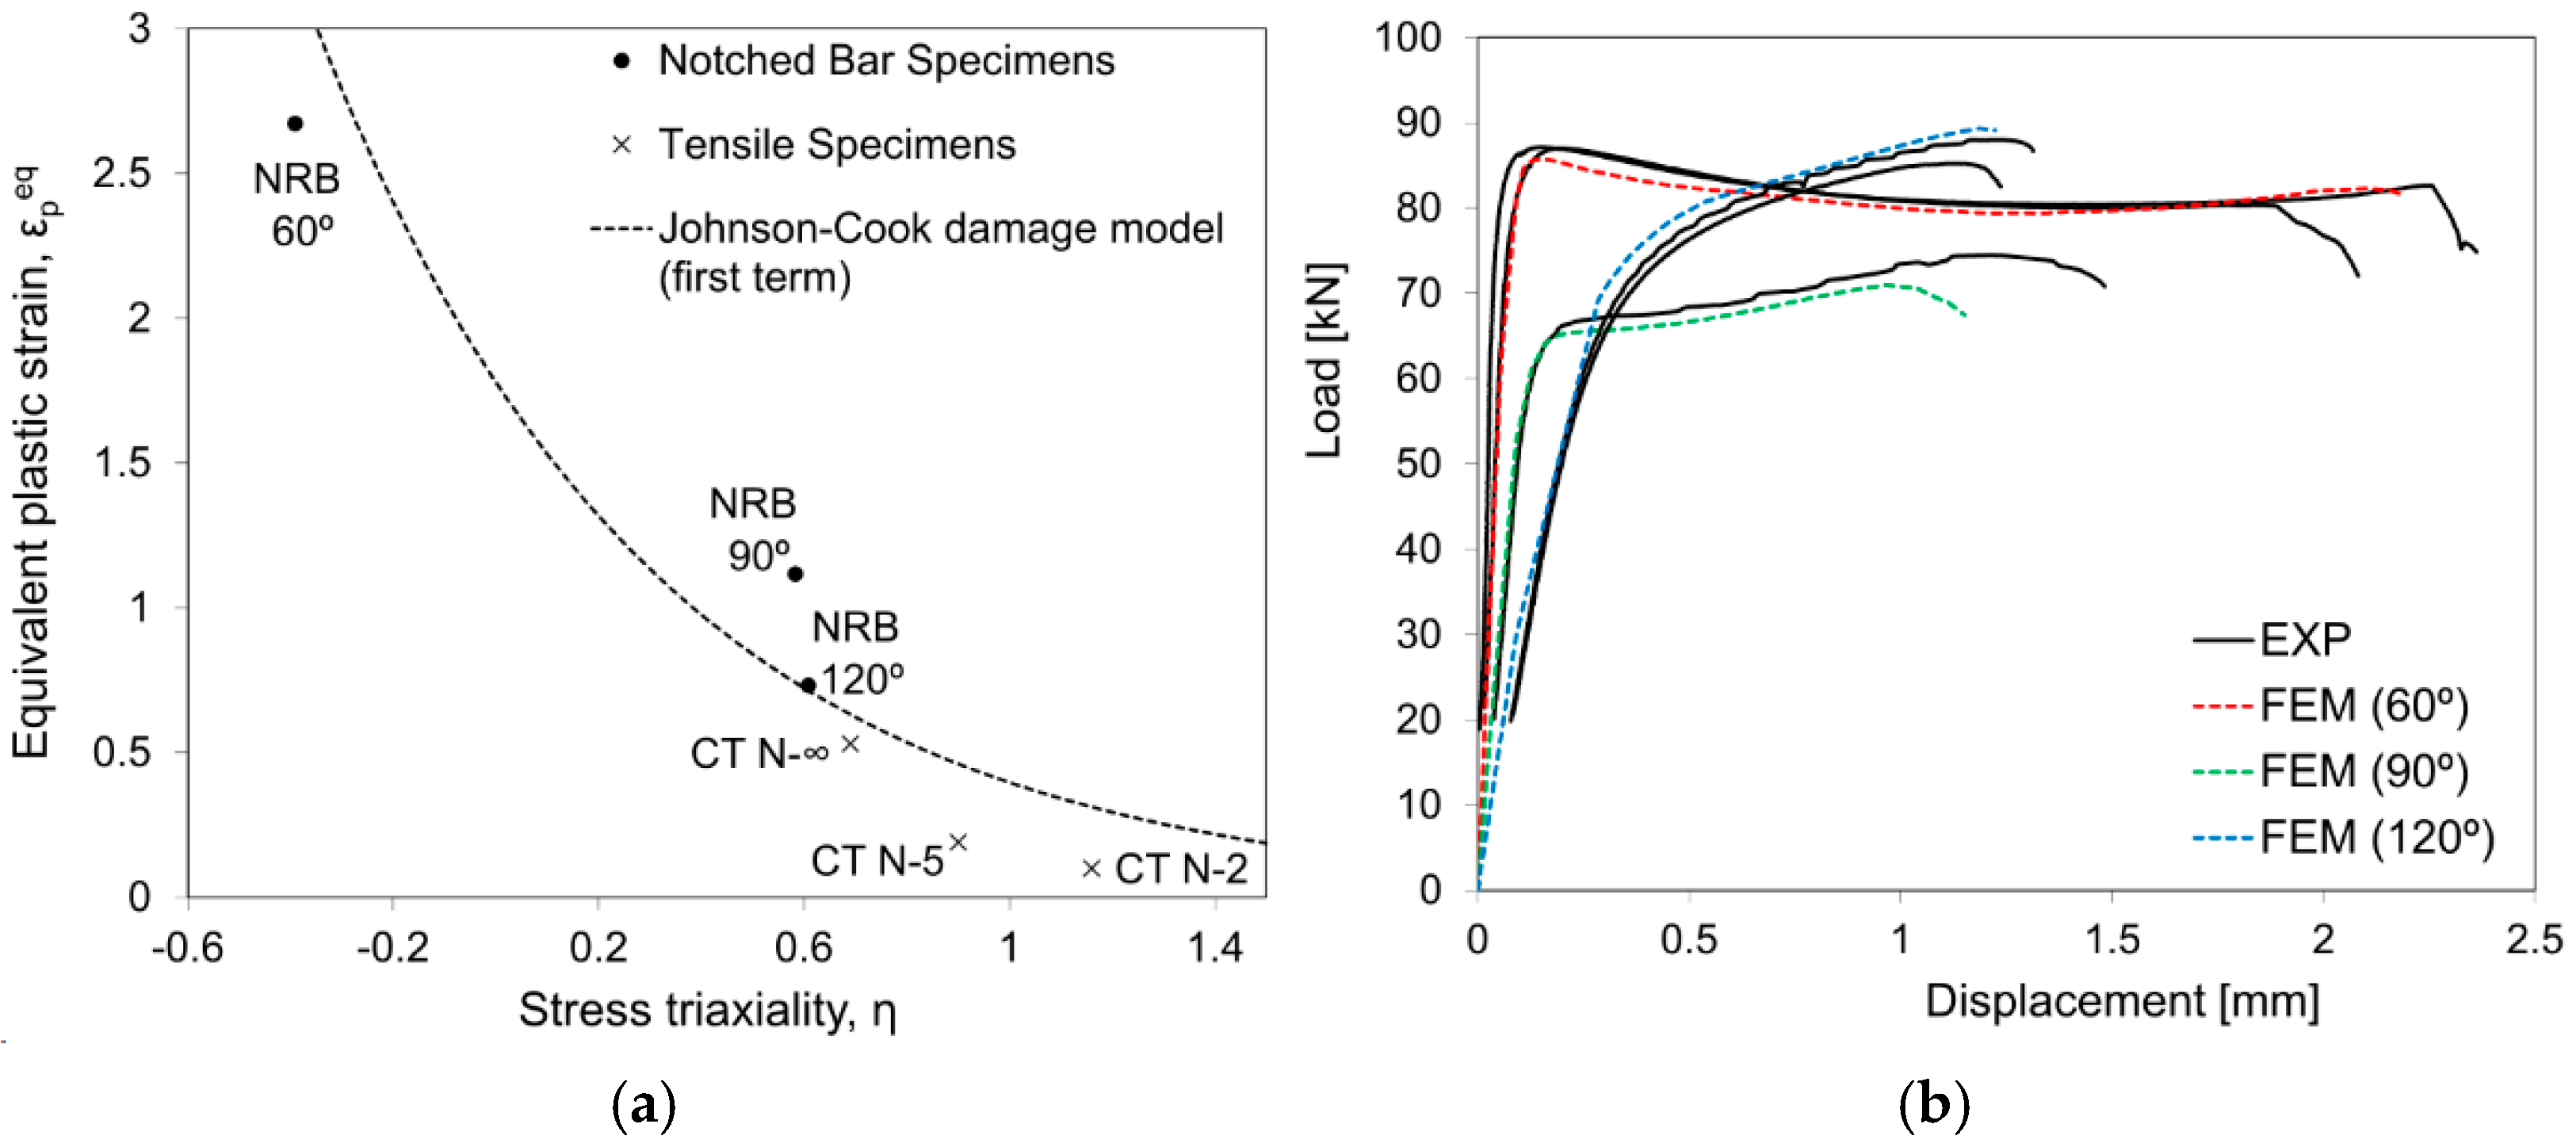
Figure 20a shows the identified damage initiation law that was fitted to the experimentally-numerically obtained fracture strains for each distinct specimen. The reduced JC damage law (first term of Equation (2)) was fitted to the identified exponential decrease in fracture strain, for increasing stress triaxiality.
With regards to material damage evolution, element degradation was defined through critical damage dissipation energy definition, as previously presented in Equation (3). It has been inversely estimated for the AMed maraging steel, through the comparison between experimental and numerical results. A critical damage dissipation energy density of
= 10 mJ/mm
3 was found. The load–displacement curves of
Figure 20b present the comparison between the experimental double-notch tests and the constitutive modelling (plasticity and damage) for the AMed maraging steel. Taking into account the significantly distinct load levels and fracture strains, a good agreement seems to be found with the suggested approach and results.
With regards to the viscoplastic behavior of the maraging steel, the C parameter of the second term of Johnson Cook plasticity equation (Equation (1)) was calibrated based on the compression tests, which were conducted for increasing levels of strain rate. Despite the very challenging characterization, it is well known that fracture onset is sensitive to strain rate. In this study, that effect has been inversely identified, based on literature values on the same material. High strain rate tensile tests [
41] and Charpy tests [
42] are usually applied towards the identification of stain rate influence on fracture strain, which is typically modelled through the
parameter in the second term of the Johnson Cook damage initiation model (refer to Equation (2)). An average value was considered (
= 0.03), taking into account the range of literature estimation (0.014 >
> 0.05). All material properties are summarized in
Table 4. It is important to note that heat transfer, thermal conductivity, and thermal expansion parameters for this exact material batch were obtained from [
43], where a detailed description of its calculation is performed.
