1. Introduction
With a turnover of 103 billion euros, the metal industry is one of the largest German industrial sectors, which is characterized by volatile market conditions and a high level of competition [
1,
2]. Small and medium manufacturing companies (SMEs) see increasingly serious problems in meeting delivery deadlines and throughput times [
3]. Apart from commercial planning systems for generating production plans, companies continue to use Excel (31%) and manual processes (10%) as a basis for planning [
4]. The same is valid for machine changeover processes. Consequently, it is essential to ensure the profitability of a production company by means of efficient production planning and control and the resulting high level of responsiveness and flexibility. It is necessary to optimally align production planning with market and customer requirements and maintain plant efficiency at a high and stable level [
5]. Here, the acquisition of real-time data provides an adequate response to the requirements and great potential for production planning and control in order to optimize the scheduling and coordination of work orders, as well as to react immediately to disturbance variables or unforeseen deviations from the plan [
4,
6]. In addition, transparency and improvement of human decision-making processes is necessary and can be provided by data driven methods [
7].
An approach for optimizing the production outcome can be realized by increasing plant productivity itself. For this purpose, the availability of the plants must be increased by localizing and reducing different types of losses. The changeover processes contribute highly negative the availability of a production line as they add no value. Cyber Physical Production Systems (CPPS) can contribute to the aim of increasing OEE by the intelligent utilization of sensor data for modern techniques as Machine Learning (ML) in a manufacturing environment. In this research, we focus on the detection of changeover processes as one element of availability.
The OBerA project (OBerA: “Optimization of processes and machine tools through provision, analysis and target/actual comparison of production data”) was established to support metalworking companies from the SME sector in the digitalization of their system landscape. The project consortium consists out of five production-oriented companies from the region of Franconia in northern Bavaria, Siemens as technology partner and the University of Applied Sciences Würzburg-Schweinfurt as an academic partner.
Table 1 shows the production companies of the OBerA project, which are small and medium size enterprises (SME) from the region of northern Bavaria from different industrial sectors. The intention was to cover a broad spectrum of different companies standing exemplarily for the region of northern Bavaria.
In the beginning of the project for each SME from
Table 1, use cases were identified in workshops with all partners. It was defined that:
every company has at least one use case,
use cases must have a financial benefit,
use cases must be implemented within the project runtime, and the learnings of the implementation are shared in dedicated workgroups.
Table 2 shows the defined use cases of the project OBerA. The three focus topics changeover, production planning, and tool management were identified and corresponding use cases were derived. Developments for the use case of the company Pabst for the “Detection of changeover phases” will be presented in this article.
A major goal of the project OBerA is to establish real-time data transparency in order to facilitate deviation management to increase productivity. To achieve this, availability management for the production facilities needs to be improved. Especially, this project aim arises from the boundary conditions of SMEs, as they must be very flexible and at the same time efficient in their value adding chain. Hence, the OEE is a reasonable indicator for controlling the productivity, but sufficient data needs to be derived for its calculation. Further, OEE is highly influenced by changeover processes, which is according to
Table 2 one of the focus topics for the OBerA SMEs. Related to their production characteristics (see
Table 1, right most column), the product variety is high, as well as the complexity of the manufactured parts.
In this context, Yazdi et al. [
8] investigate the relationship of OEE and manufacturing sustainability by a time-series analysis of a lab material handling system with conveyor belts and a robotic arm. In their research, they indexed value-adding and non-value-adding sub processes by video analysis to derive the OEE. In an extended research, the same research group [
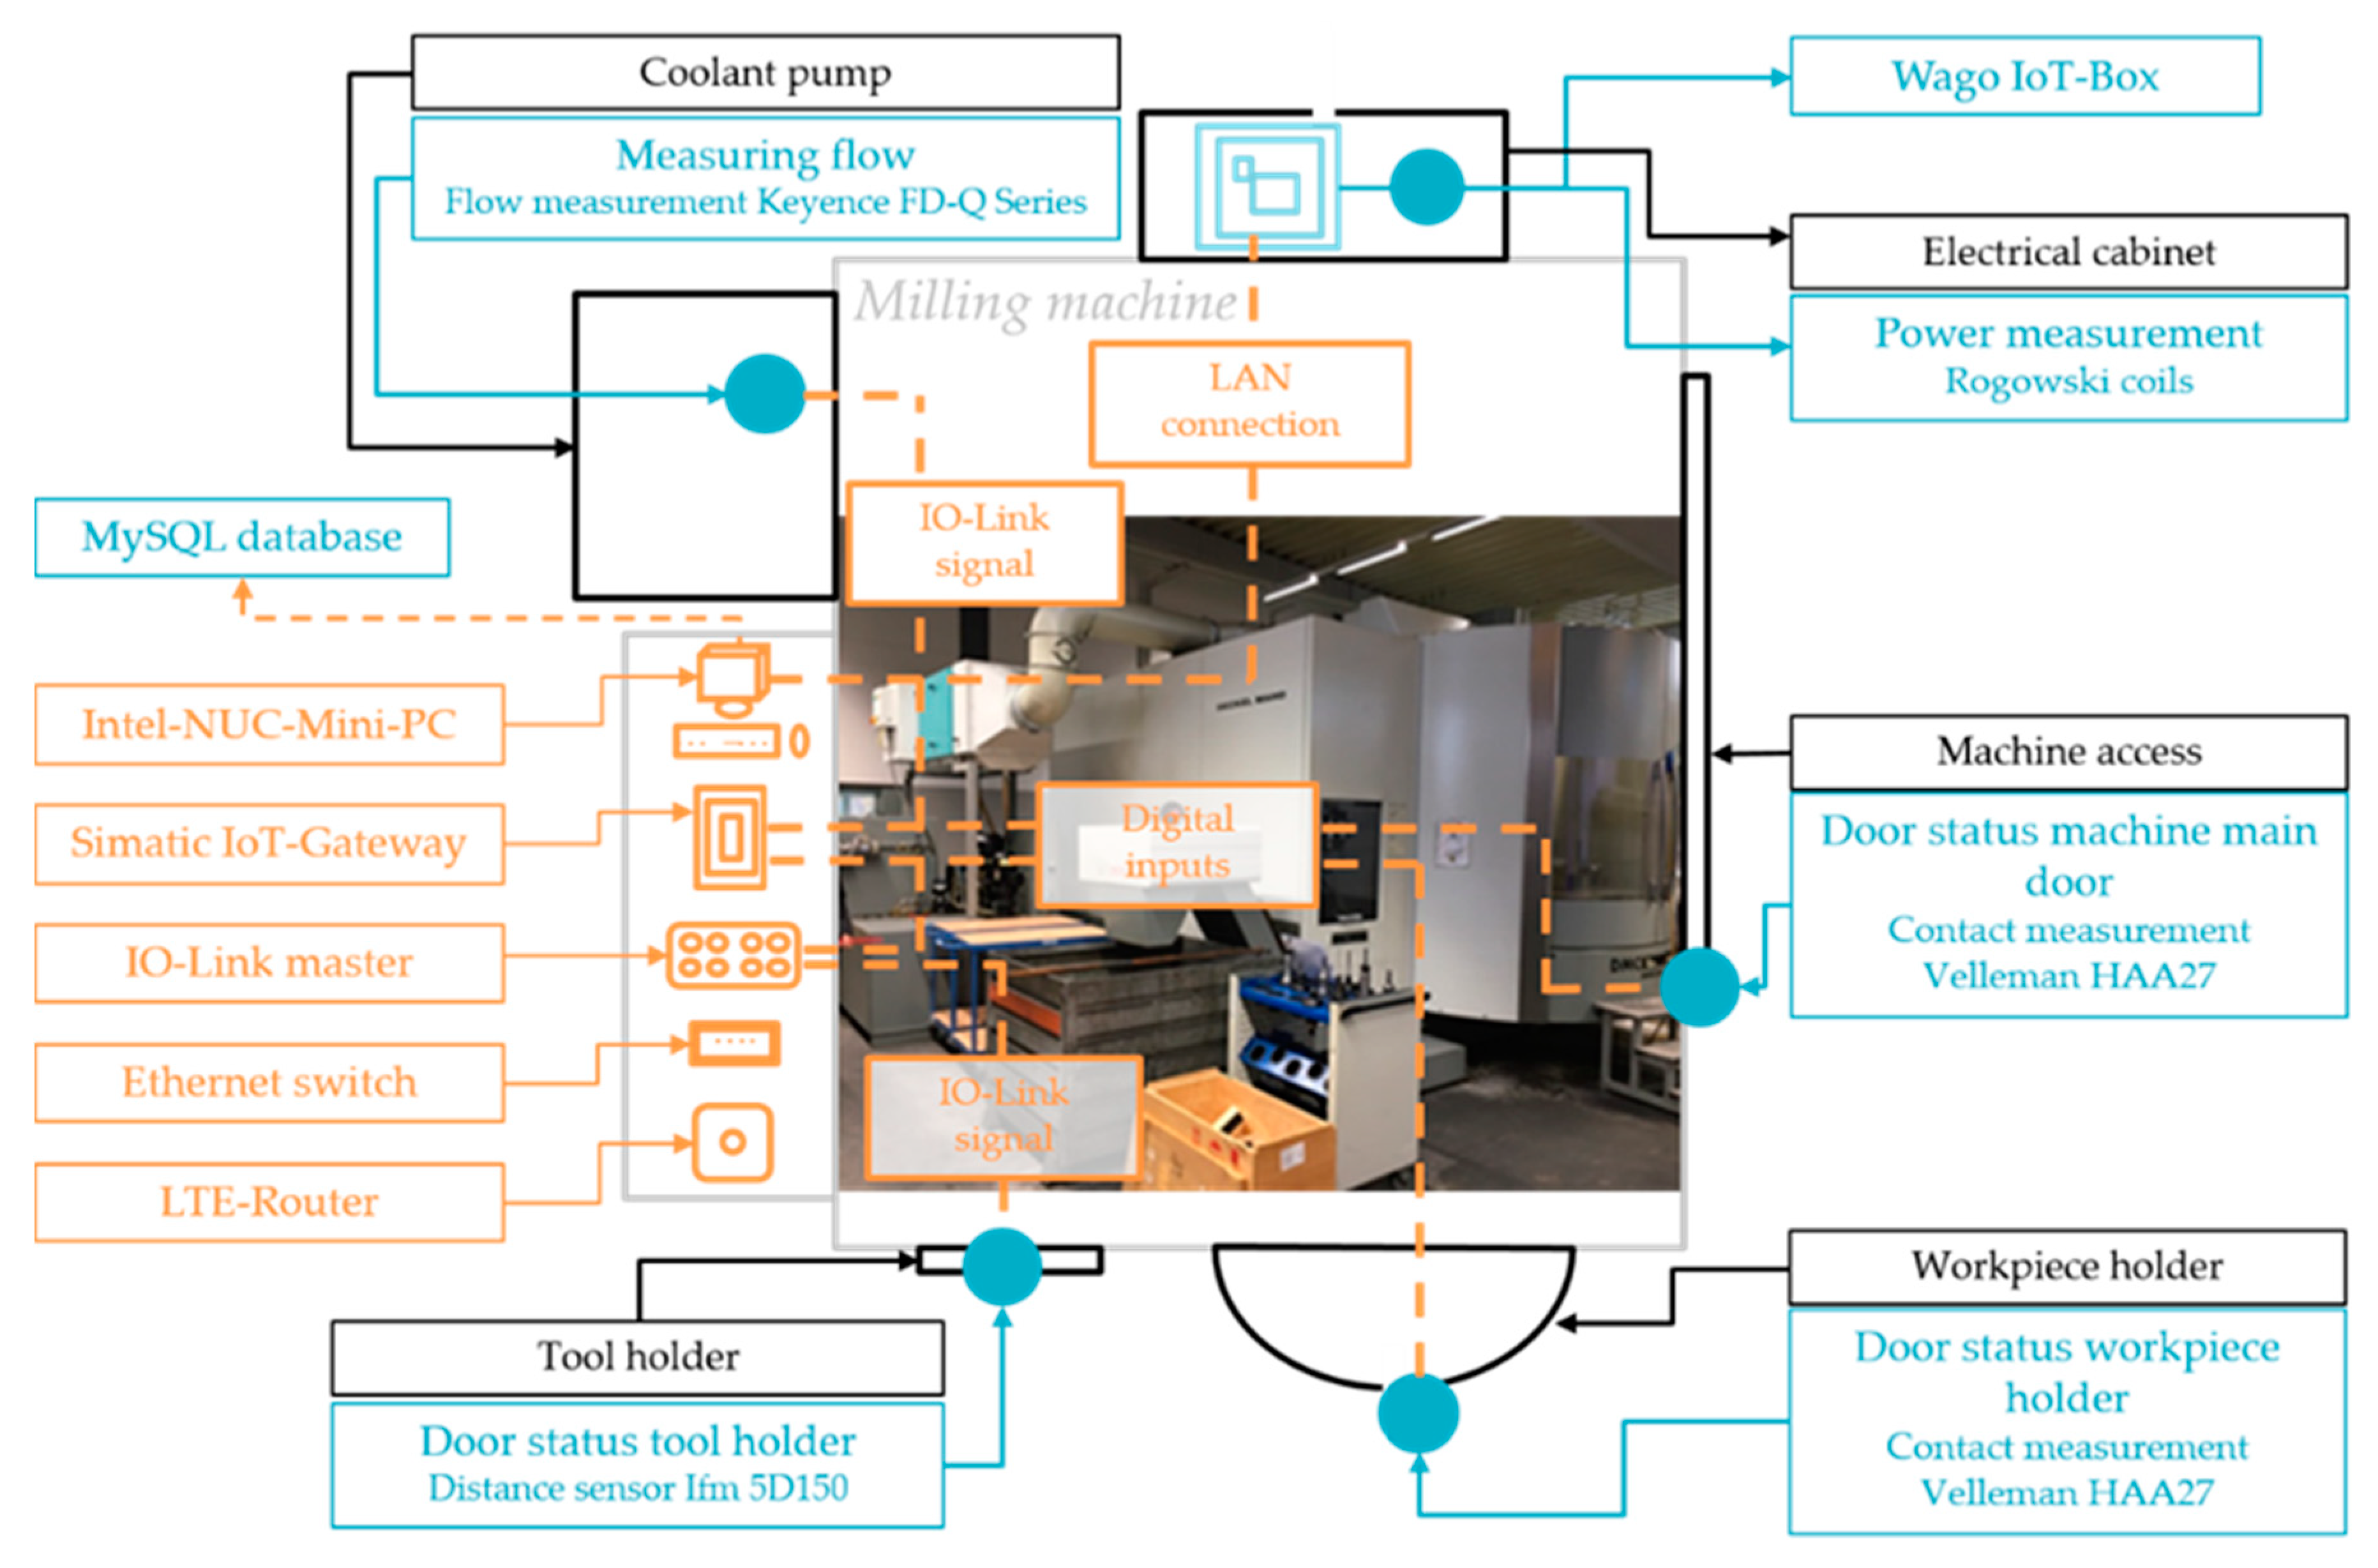
9] creates a simulation model to pre-analyze potential OEE improvements, before implementing them in the lab system. In addition to this research, we want to apply Machine Learning techniques to identify heterogeneous changeover processes (human and machine involvement) as the main research objective in this contribution. In the presented use case, the Pabst GmbH company produces mechanical components by drilling, milling and grinding processes in small lot sizes. In consequence, the machine tools need to be retooled several times a day. Recently, these changeover processes are done manually or hybrid and the changeover interval is not documented. Additionally, different workers are involved to this procedure in different shifts. Hence, this article presents an innovative approach to support the availability management by Machine Learning techniques, which is applied to identify changeover processes out of a big dataset from real production machine.
The methodology of our research is based on the well-known CRISP-DM process. The Cross-Industry Standard Process for Data Mining (CRISP-DM), which was presented in 1996, has established itself in industry as a procedure for data analysis and machine learning problems [
10]. The inherent phases “business understanding” and “data understanding” focus on the project objectives and requirements as well as the initial data collection. In the CRISP-DM phases “data preparation” and “data modeling”, the necessary data structuring is done, before ML modelling techniques are applied. The phase “evaluation” tends to review the model in terms of its performance before it is deployed. The article also faces to the steps of the CRISP-DM process model. In
Section 2, the general topic of availability management is introduced. At this, calculation approaches for availability originated in the maintenance organization of Total Productive Maintenance (TPM) and the VDI guideline 3423 are provided (“business understanding”).
Section 3 shows the main objective of the contribution. Here, the applicability of Machine Learning techniques to support the availability management by detecting changeover processes will be discussed (“data understanding” and “data preparation”). Furthermore, a use case is presented in order to illustrate the application of Machine Learning techniques identifying these changeover processes in a real production scenario (“data modelling”). The use case will focus on a detection of the start and stop point of the quick changeover process with Machine Learning. In
Section 4, the results of the Machine Learning use case are discussed (“data evaluation”). In
Section 5, the article will be summarized and an outlook to the upcoming research activities is given.
2. Availability Management
Machine availability has a strong influence on production planning and control. This is also evident in the study conducted by Schuh et al. in [
4], in which the most frequent causes for deviations from the current production plan were surveyed from 89 study participants from the manufacturing industry in Germany: together with the acceptance of rush orders (63%), equipment failures, and malfunctions (56%) were the main causes for deviations followed by material shortages (39%) and the absence of personnel due to illness (34%)—multiple answers were possible.
To improve production planning and control, availability management must be established. It can be understood as the entirety of all activities and processes for achieving and maintaining demand-oriented availability of the production system, when considering organizational and technical factors [
11]. There are already several strategies and concepts that pursue the goal of increasing and maintaining the availability of plants. The TPM concept has established itself in the field of maintenance organization in industry [
12]. The concept was developed by Nakajima (1988) and adapted to the needs of Western companies by Hartmann (1992) [
13,
14]. For the calculation of availability in the machining production, the VDI guideline 3423 can also be applied [
15]. Although VDI 3423 does not take into account the actually produced quantity per time unit into account [
16], both of the approaches are standardized by ISO and the Association of German Engineers (VDI), which is of importance for the OBerA partners to guarantee comparability and robustness.
2.1. Availability According to TPM
A core element of TPM as an approach for a maintenance organization is the Overall Equipment Effectiveness (OEE), which is a metric for identifying the production losses of a machine or production facility [
17]. The OEE indicator is divided into three sub-indicators: availability, performance, and quality. It represents the unused optimization potential and losses of a machine or production facility [
18]. To increase the OEE indicator, the TPM aims at eliminating the six sources of losses according to Hansen in [
19]:
plant failure due to technical and organizational disturbances,
losses due to setup and changeover,
losses due to idle running and short shutdowns,
losses due to reduced cycle speed,
quality deviations, and
start-up losses.
These system losses cause both time and volume losses, which can be divided into the factors performance, quality, and availability. ISO 22400-2 [
20] defines OEE as the product of availability, effectiveness, and quality rate:
The availability is calculated as the relation of actual production time (APT) to planned busy time (PBT). It also shows the plant capacity used for production in relation to the available plant capacity.
The effectiveness represents the relationship between the optimal cycle time and current cycle time as planned runtime per item (PRI) multiplied by the produced quantity (PQ) divided by APT. The effectiveness shows how effectively a production system works during the production time.
The quality rate indicates the ratio between the quantity of good parts produced (GQ) and PQ.
Table 3 shows how the three OEE factors can be combined with the six sources of loss, as mentioned above. The corresponding causes of loss in the table below support the data selection process for the calculation of the components of OEE calculation. For the successful calculation of OEE, the ability to collect data is of utmost importance, as if data is unreliable, the calculated OEE value does not reflect the utilization of the production unit [
21]. Therefore, the quality of the data determines the accuracy of OEE. For this reason, the plant must first be analyzed, an ideal condition defined, and a possible cause/fault catalog determined. Subsequently, the causes must be evaluated according to their failure effect e.g., by means of a Pareto diagram and appropriate measures must be taken.
At the beginning of establishing the OEE metric, a production facility usually has an OEE between 30% and 60%, whereas companies in the automotive industry reach peak values of over 85%. OEE depends on the type production facility. A single machine has a higher OEE value than an interlinked production chain [
22].
2.2. Availability According to VDI Guideline 3423
Another possibility for calculating an availability of single machines or production systems is the VDI guideline 3423. This guideline serves as a basis for contract negotiations between machine manufacturers and end users, as well as for internal optimization of production environments. The calculation of the availability of technical equipment according to VDI guideline 3423 is based on a past-oriented period calculation [
24].
The technical availability is defined in the following way:
Additionally, the total utilization ratio is defined:
Table 4 shows the variables used in the above equations.
2.3. Comparison of TPM OEE and Availability According to VDI 3423
Both presented approaches of TPM OEE and availability according to VDI 3423 have in common that they relate the current production situation, which is influenced by losses (OEE) or downtimes (VDI 3423) to a planned situation. In particular, the calculation of availability according to VDI 3423 and availability according to the OEE indicator differ in the following aspects:
When calculating the availability according to the OEE indicator, planned downtimes are not included, whereas the VDI guideline allocates planned work according to the maintenance plan (inspection, maintenance, cleaning) to the occupied time. The availability factor of the OEE is higher than the availability level when compared to the VDI guideline due to the non-inclusion of the planned preventive maintenance measures. The TPM concept supports preventive maintenance measures, but, if they were considered, they would have a negative impact on the OEE ratio. From a different perspective, it can be concluded that shortening the duration of preventive maintenance measures does not have a positive effect on availability [
11].
OEE combines organizational with technical downtimes. This is not the case in the VDI guideline.
The VDI guideline also describes the test time during which a system is used for testing. If a production progress is generated by the test, this is assigned to the usage time, otherwise it is to be added to the organizational downtime (DIN 13306:2018-02). The calculation basis OEE does not mention test times. Tests are always planned in advance. For this reason, they are assigned to the planned downtime. As a result, the test time is not included in the calculation of OEE.
VDI 3423 does not define how to deal with breaks or shift change. The utilization time considers a machine in order to produce at full capacity. Therefore, these time-shares are considered as downtimes, as production could have been done during the break. This is intended to create incentives to keep the system running by rotating the employees. According to the availability factor of the OEE, these are also not included in the calculation.
As described, production is carried out at full capacity during the utilization time. VDI 3423 does not explicitly consider the effectiveness losses when compared to OEE. However, a distinction would be useful for internal operational improvement to identify performance deficits [
18].
Setup times are only considered as availability loss in the availability calculation according to OEE if the setup time default values are exceeded, whereas, according to the VDI guideline 3423, they are completely considered in the organizational downtime.
The OEE uses the actual production time as the basis for the calculation of the availability. The VDI guideline does not use the actual production time, but uses the occupied time.
The VDI guideline 3423 ignores the effectiveness and quality losses, although these are helpful for evaluate production performance. These are mentioned in the guideline by notes, but are not included for reasons of operational relevance, as they are strongly product related.
From the comparison above, it can be concluded that the two calculation approaches have different focus points, which results in a different assignment of losses/downtime to calculation elements. To illustrate the outcome of the different calculations, a scenario calculation was carried out with the same input data or each approach to show the effects of the different calculations of OEE and VDI 3423. The underlying data were taken from a consortium partner of the OBerA project.
Table 5 shows the results. Depending upon the calculation approach, different availability values arise. The availability according to OEE is higher compared to the VDI 3423 guideline showing a difference of over 10%. This can be attributed to the short downtimes, which are not included in the availability calculation for OEE.
2.4. Conclusion on Availability Management in Terms of Machine Learning
The previous chapter has shown that, depending on the calculation metric, different numerical results for an availability indicator can occur. Accordingly, before an availability can be forecasted or dedicated, OEE elements are to be calculated by means of Machine Learning, the particular metric needs to be selected and each element of the metric needs to be defined and traced back to available data sources in the related company. It must be clarified where and how this data can be obtained.
The elements needed to calculate OEE and its components, plant availability, effectiveness and quality, are defined in ISO22400-2 [
20]. The standard divides these elements additionally into the subcategories time elements, logistics elements and quality elements. The planned busy time and the planned running time per item can be assigned to the planned times and the actual production time to the actual times. The quantity produced and the quantity of good parts produced are classified as logistics elements. While the plannable time elements can be read from the ERP system, the actual times that are required must be measured directly at the machines or lines. In CPPS, this is done via sensors that record machine and product statuses and store the read-out sensor data in databases or pass them directly to a Manufacturing Execution System (MES) [
25].
Table 6 shows the data sources where OEE elements can be retrieved from. For the planned elements of the calculation, Hwang [
26] locates the Enterprise Resource Planning System (ERP-system) as the data source. Current production information is generally retrieved from sensors.
This is also applicable for the VDI 3423.
Table 7 shows how the main elements can be categorized correspondingly:
The experience from the research project OBerA is that, apart from these theoretical considerations above, the practical situation in SME companies is more complex than to distinguish between ERP and sensors as data sources:
Sensors often are realized manually and not necessarily as CPPS sensor networks in SMEs. Examples range from manual input into computer terminals on the shopfloor, tally sheets with manual transfer into Microsoft Excel, to manually triggered signals in programs of machine controls.
ERP-systems in SMEs can range from fully fledged ERP installations with sub modules for maintenance management and manufacturing execution (MES: manufacturing execution system) to heterogeneous software platforms for individual purposes and production data terminals for manual feedback of manufacturing order statuses.
Table 8 illustrates this situation by giving an overview of the different IT systems which are used in the consortium as ERP system, production planning system, tool management system, and shopfloor data collection system.
The situation is also aggravated by the current development that MES can serve as sensor connection platform, which is synchronized with the ERP, offering the possibility that the MES also directly calculates the indicators as OEE. The MES can serve as an intermittent layer between classical sensors and the ERP. The OEE calculation approach of the MES often remains not transparent.
In conclusion, it must be stated that there are no simple recipes to find data sources for the OEE elements of the calculations. Moreover, a data source plan must be developed with a project team consisting of experts from the machine manufacturers, machine control manufacturers, the enterprise software manufacturers, maintenance, and quality management staff, who have a common and clear understanding of the calculation components and the systems, which deliver the necessary data. A contribution to derive OEE elements or predict the OEE from sensor data is Machine Learning as a part of Cyber Physical Production Systems.
4. Discussion
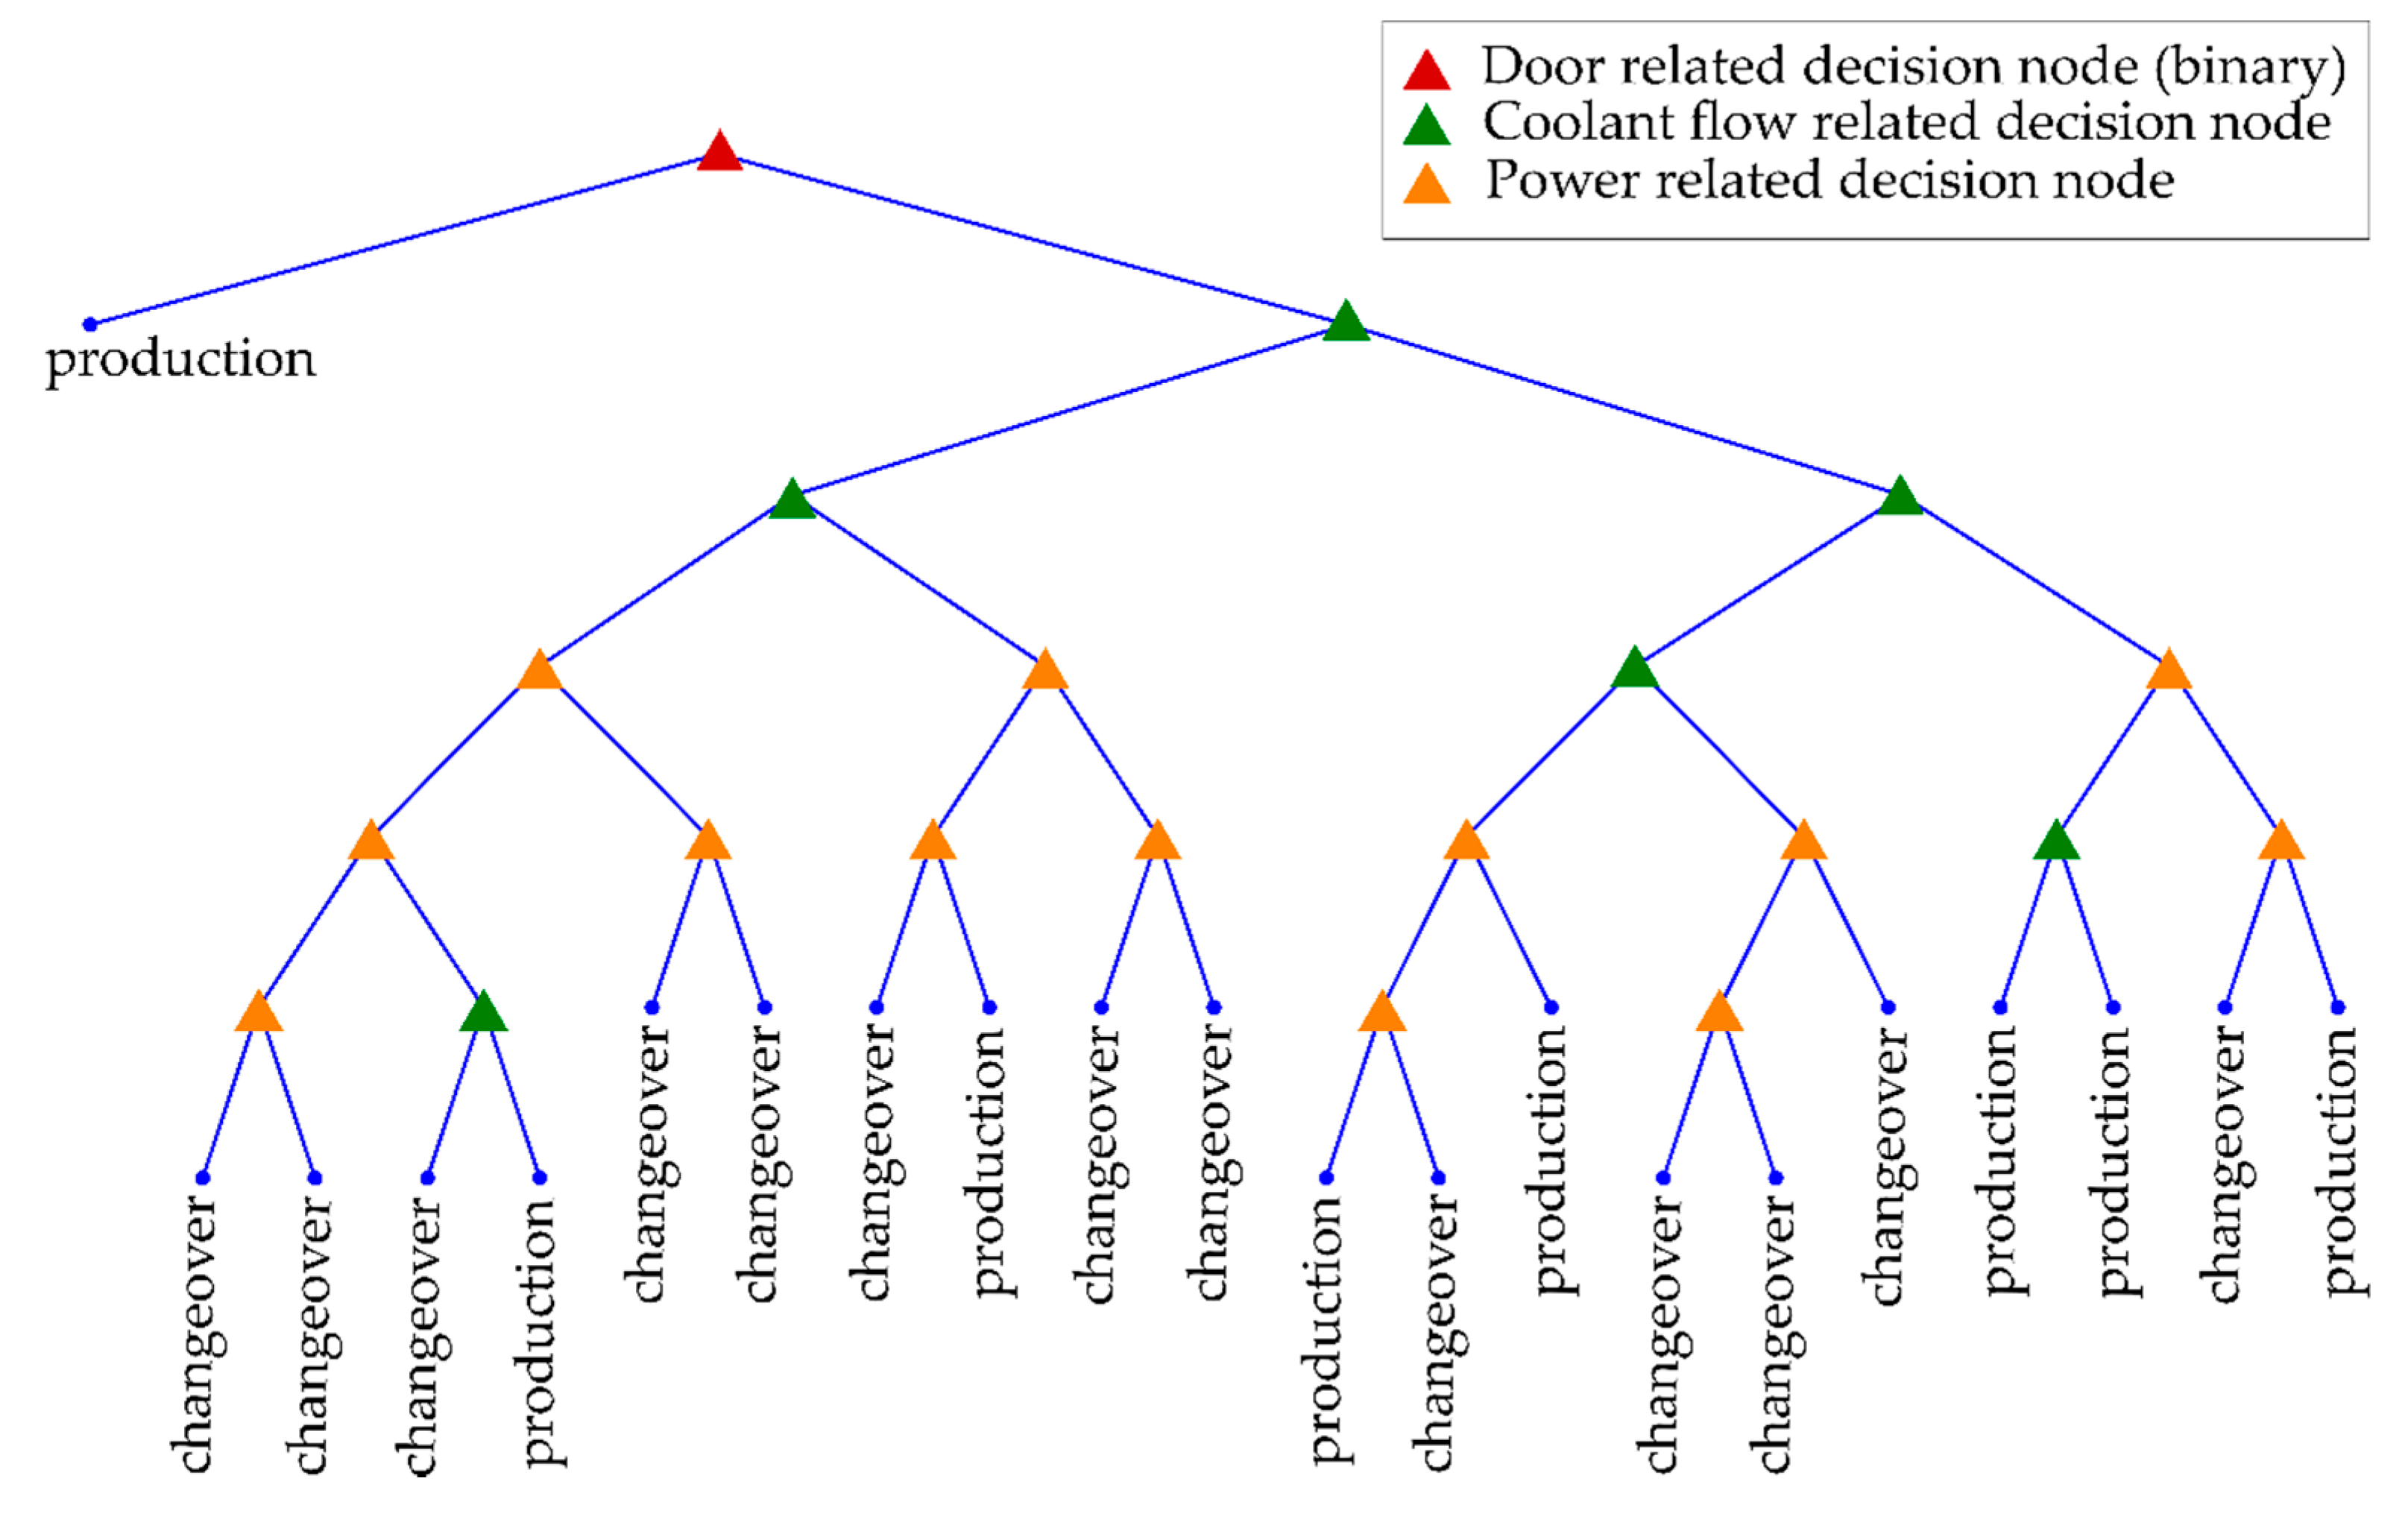
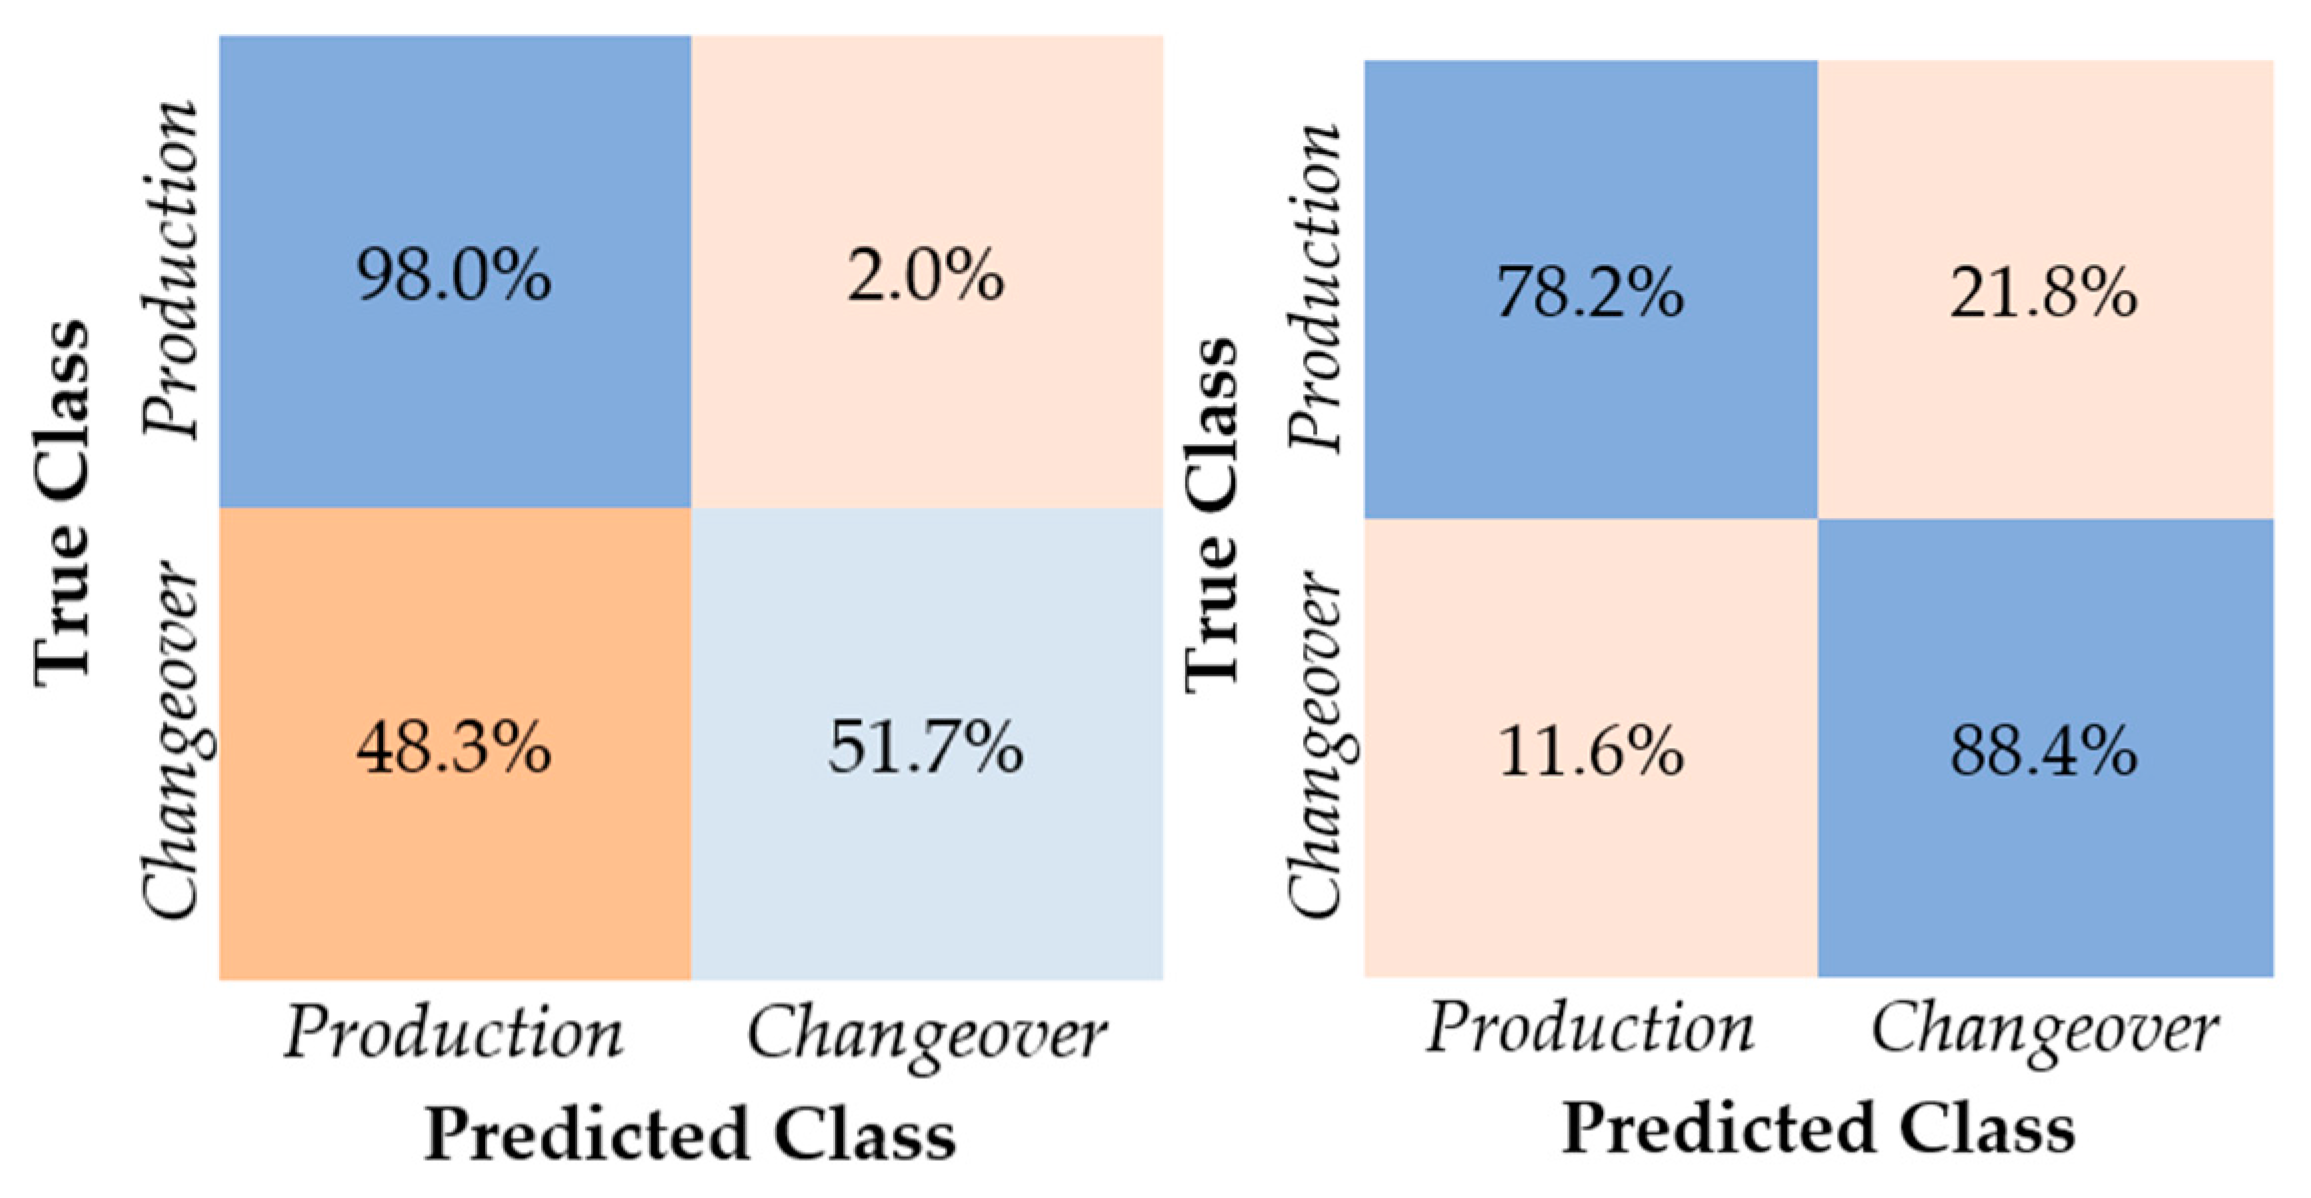
The results of the trained ML model show that it is possible to distinguish “production” and “changeover” phases on a reliable level in a serial production that is based on the presented sensor concept and data preparation method. Nevertheless, changeover processes are very heterogeneous in terms of their technical appearance and manual, worker related procedures, but they have an impact to the OEE and hence to the economic perspective of a company. The presented innovative approach of ML for classifying changeover automatically in the context of CPPS lead to a broader more adaptive functionality of machines, as technical and worker actions are both represented in the datasets. Generally, in CPPS, there is an increased interconnection of production machines. As a result, increasing data from the machines and processes are being collected automatically with the help of sensors. Due to the mass, speed and heterogeneity of the collected data, the industry is increasingly experiencing problems in evaluating this data, for example, in order to determine the performance of the processes precisely, traditional methods and analytical models have reached their limitations in this respect. Data-driven methods that use ML by a means of evaluating the data could be the solution here.
5. Conclusions and Further Research
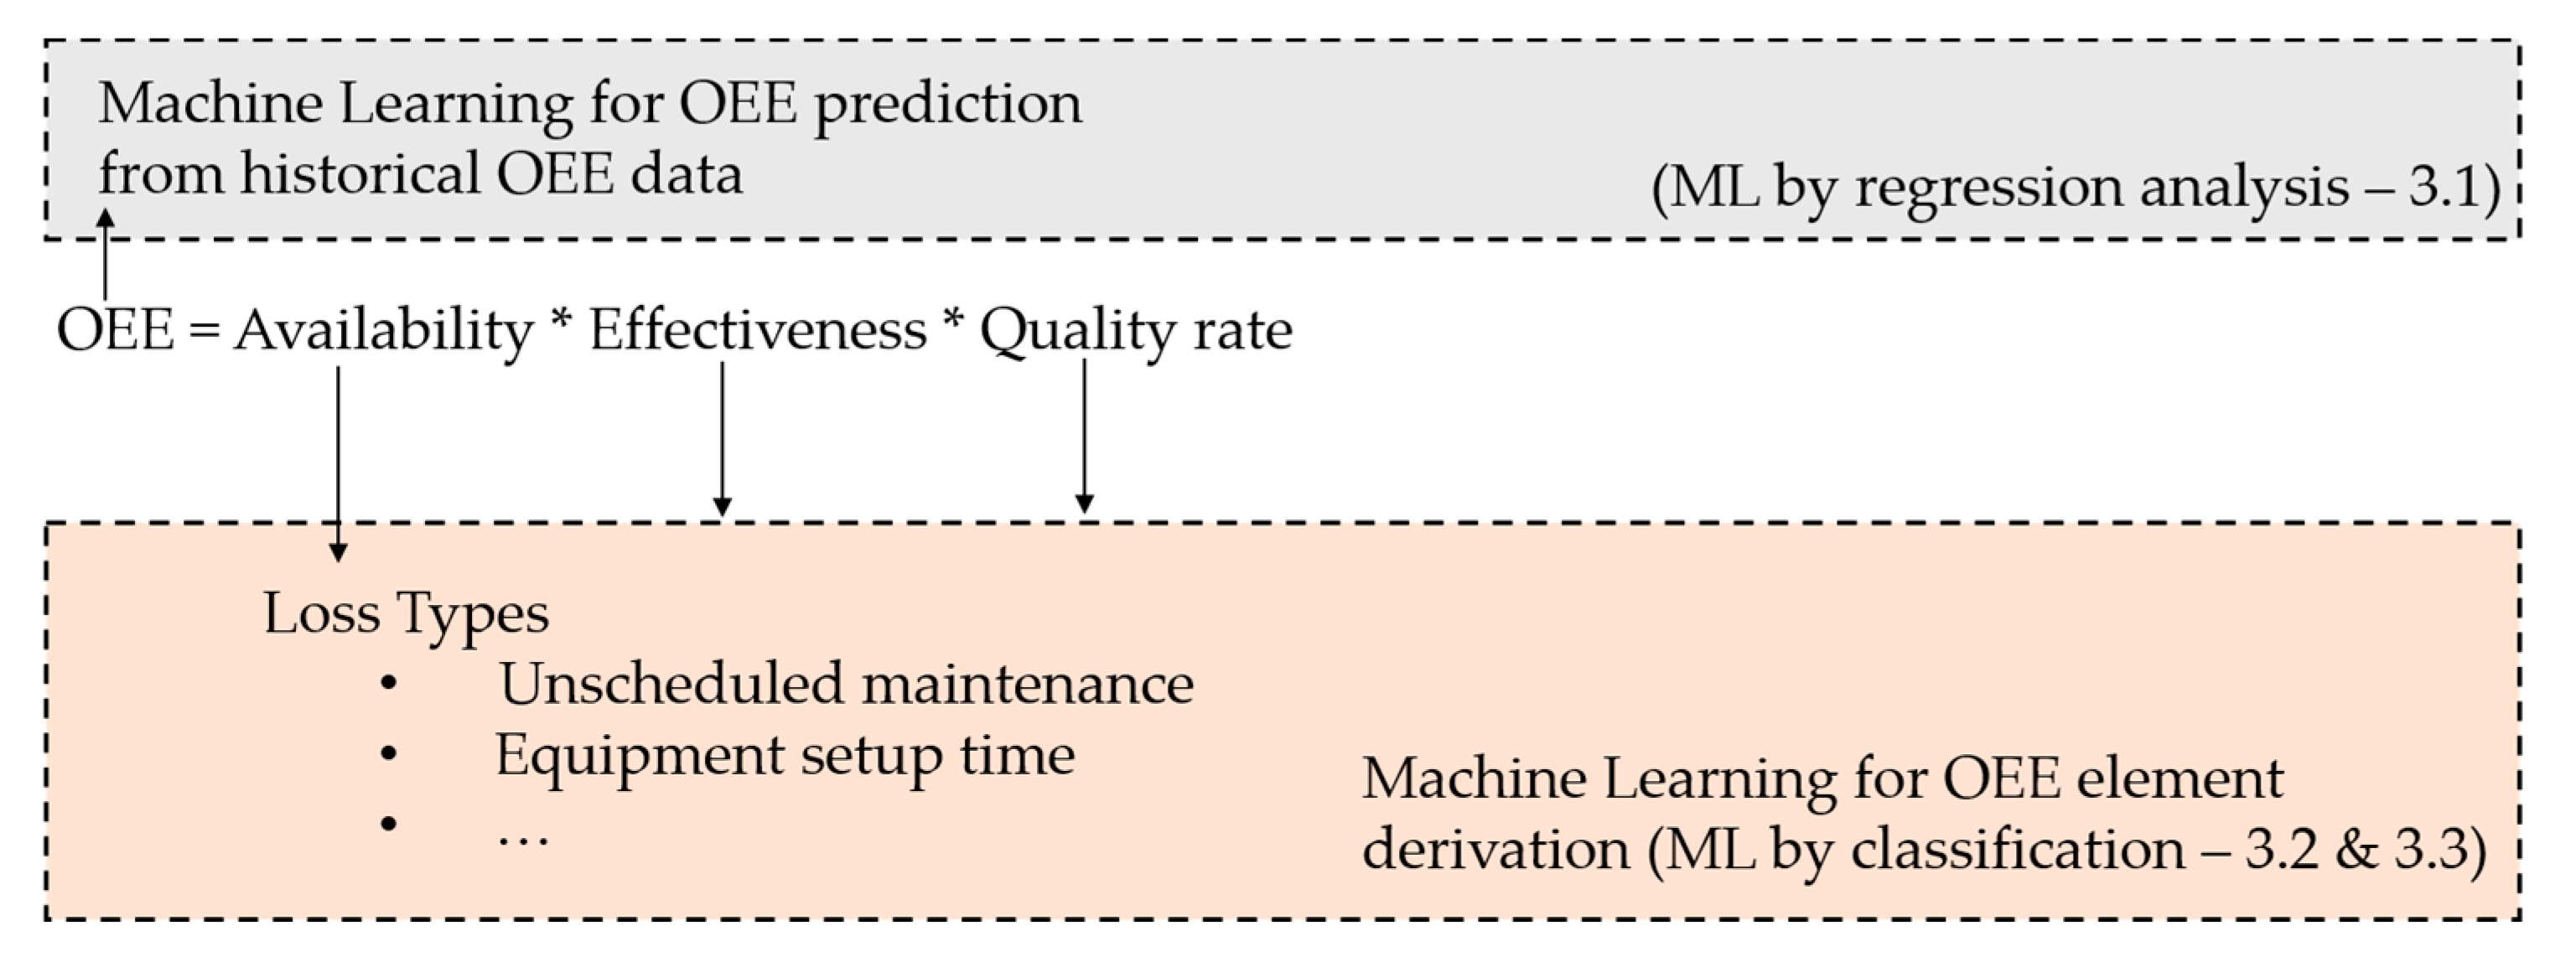
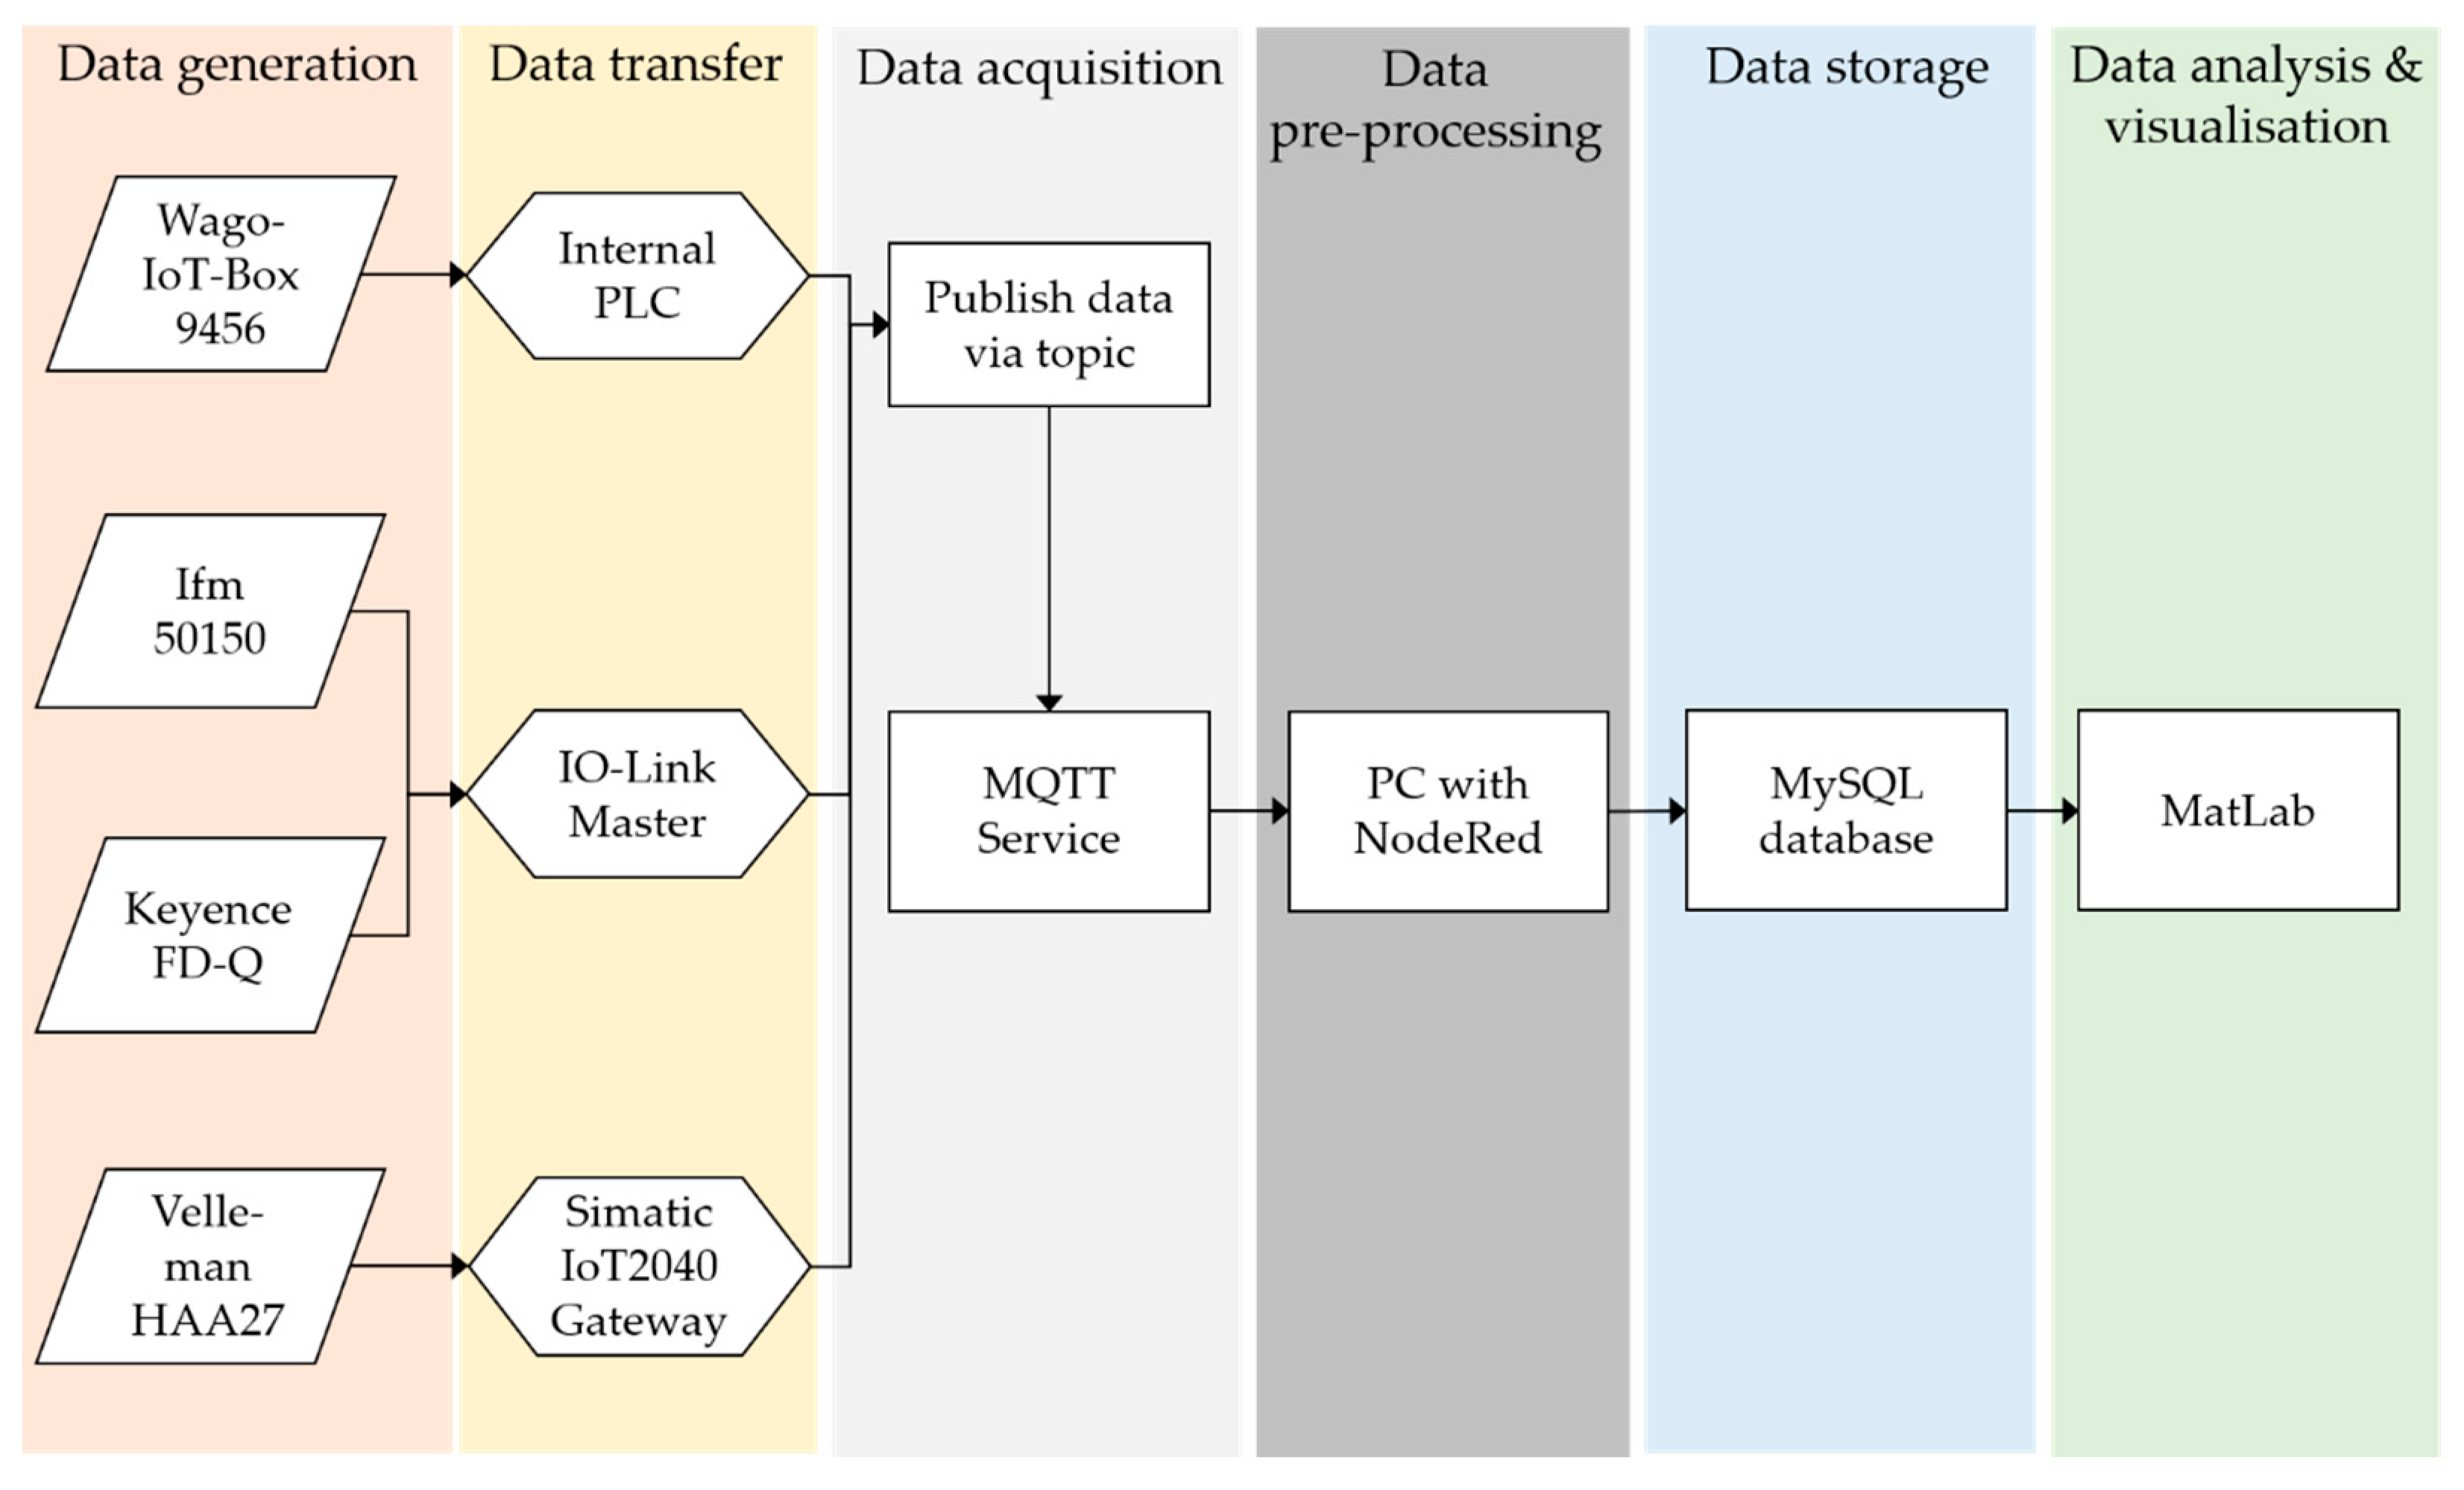
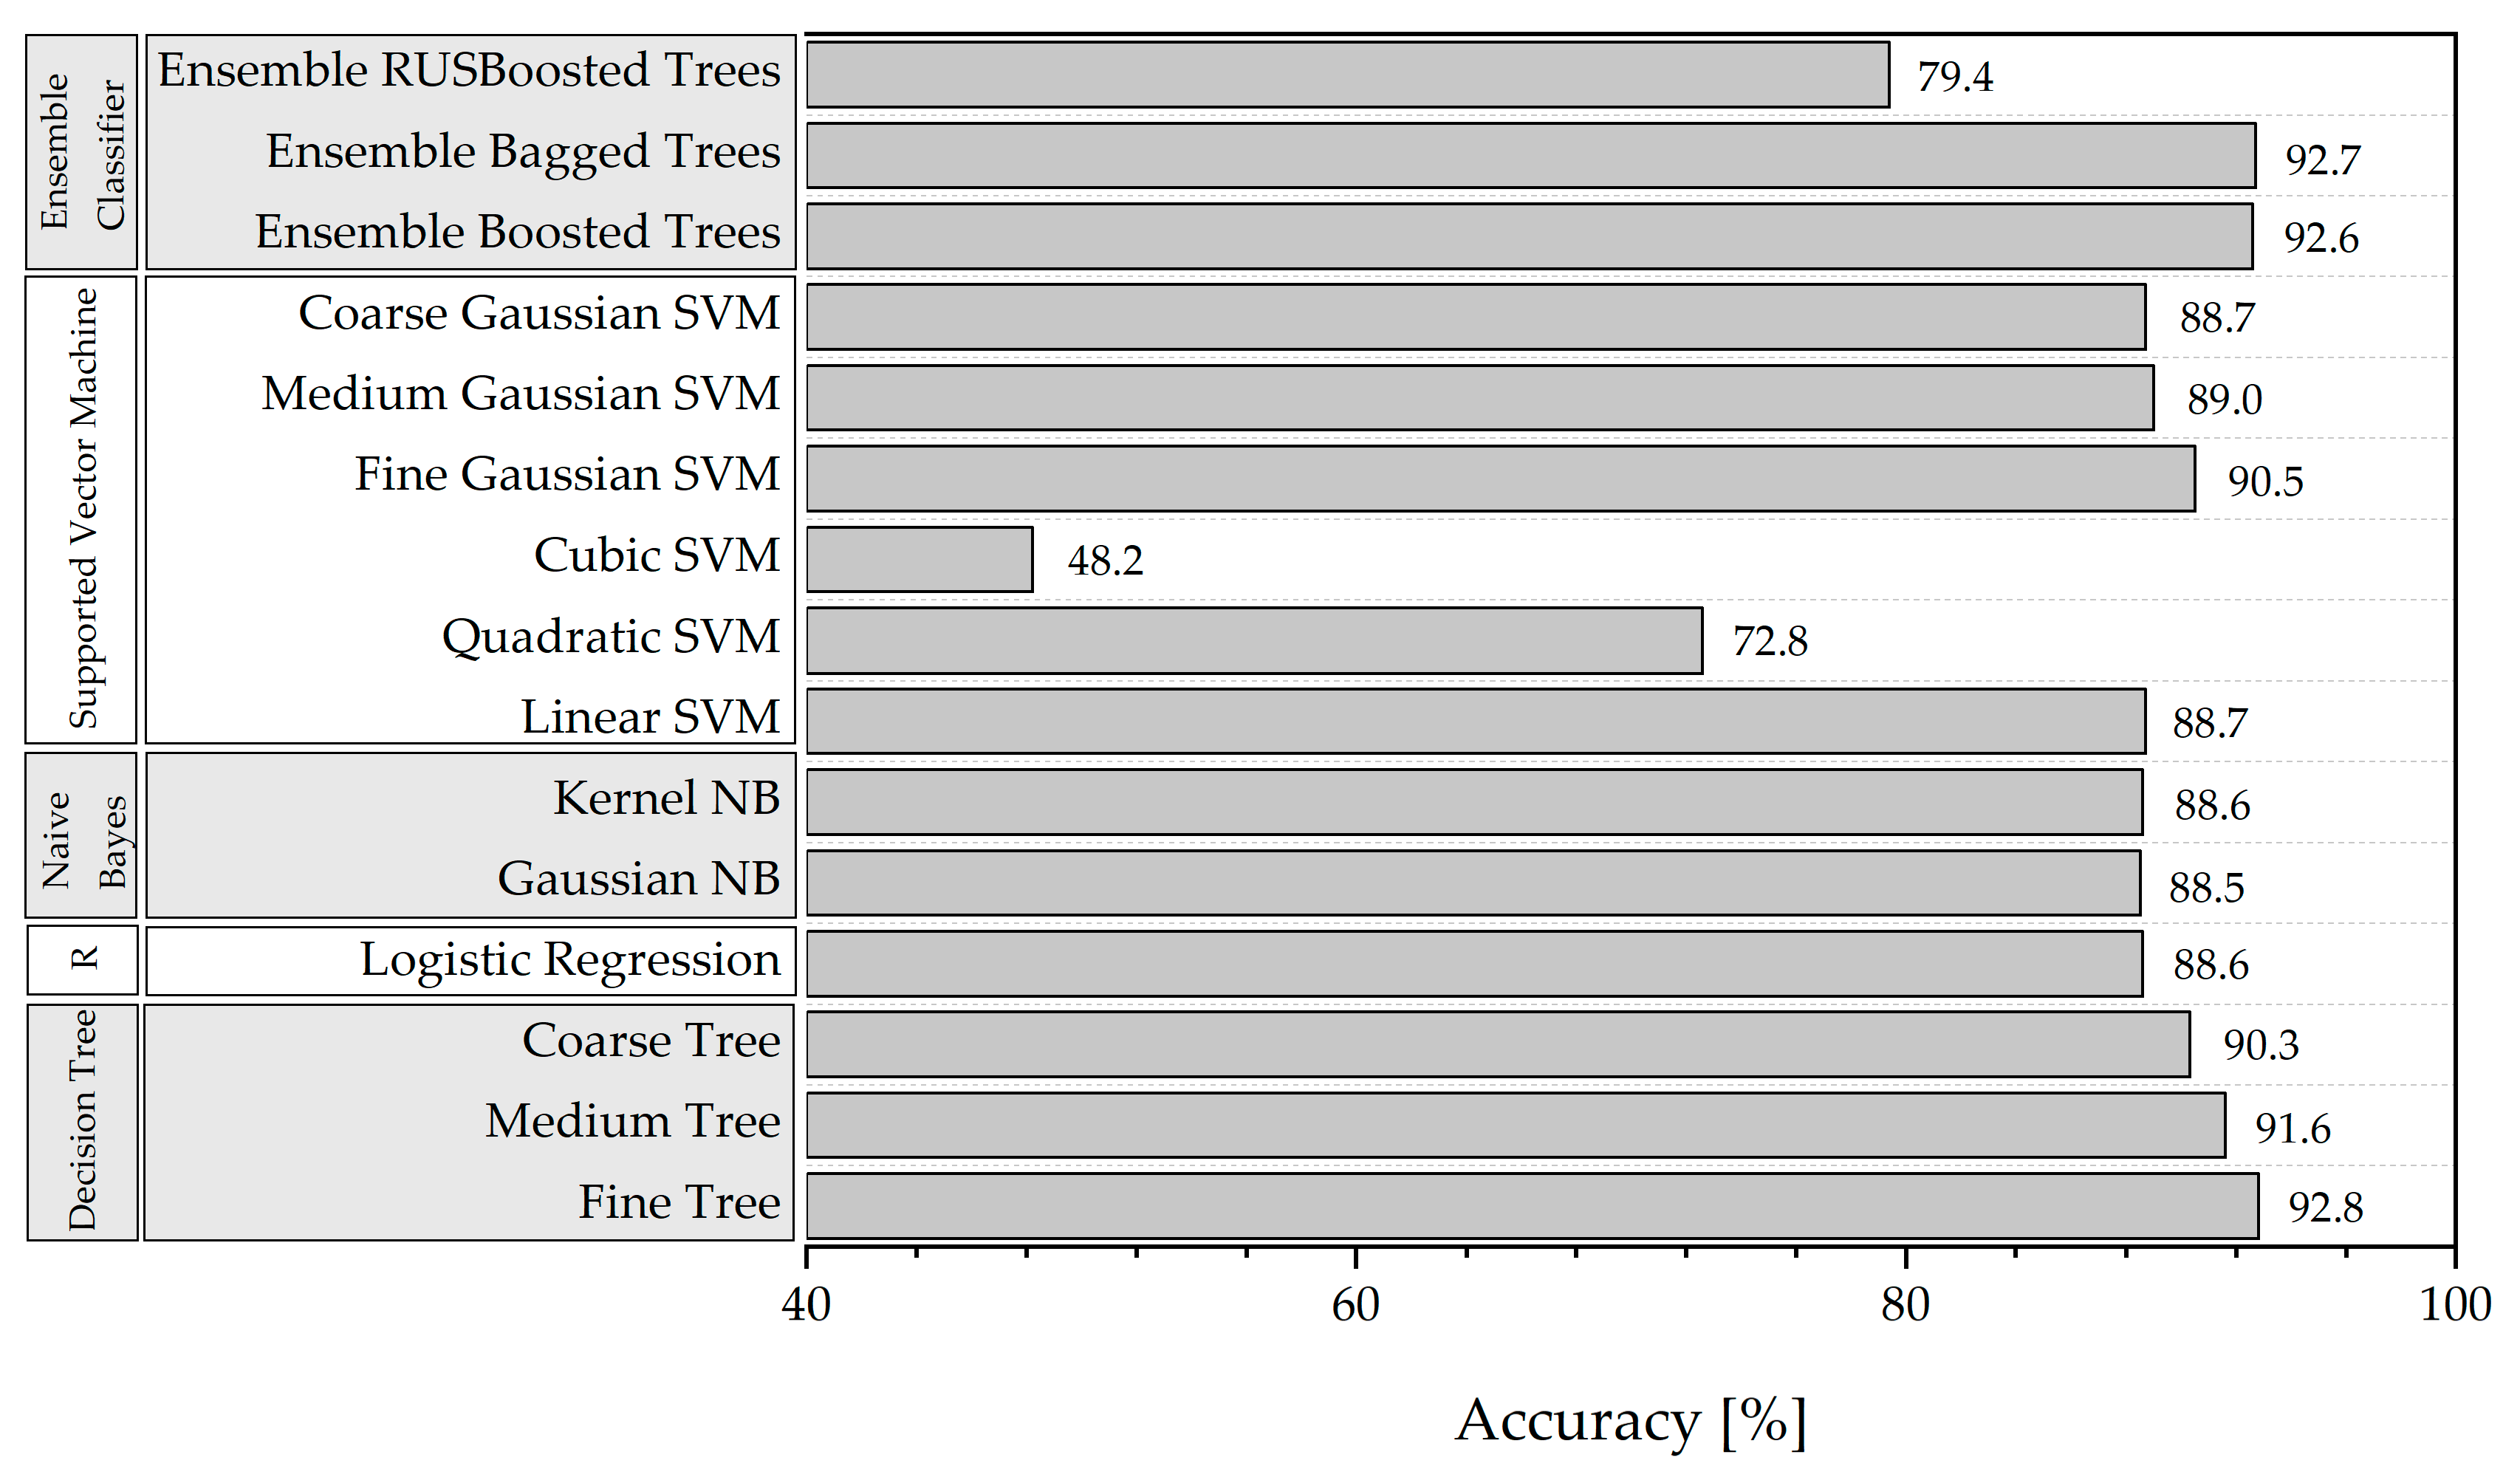
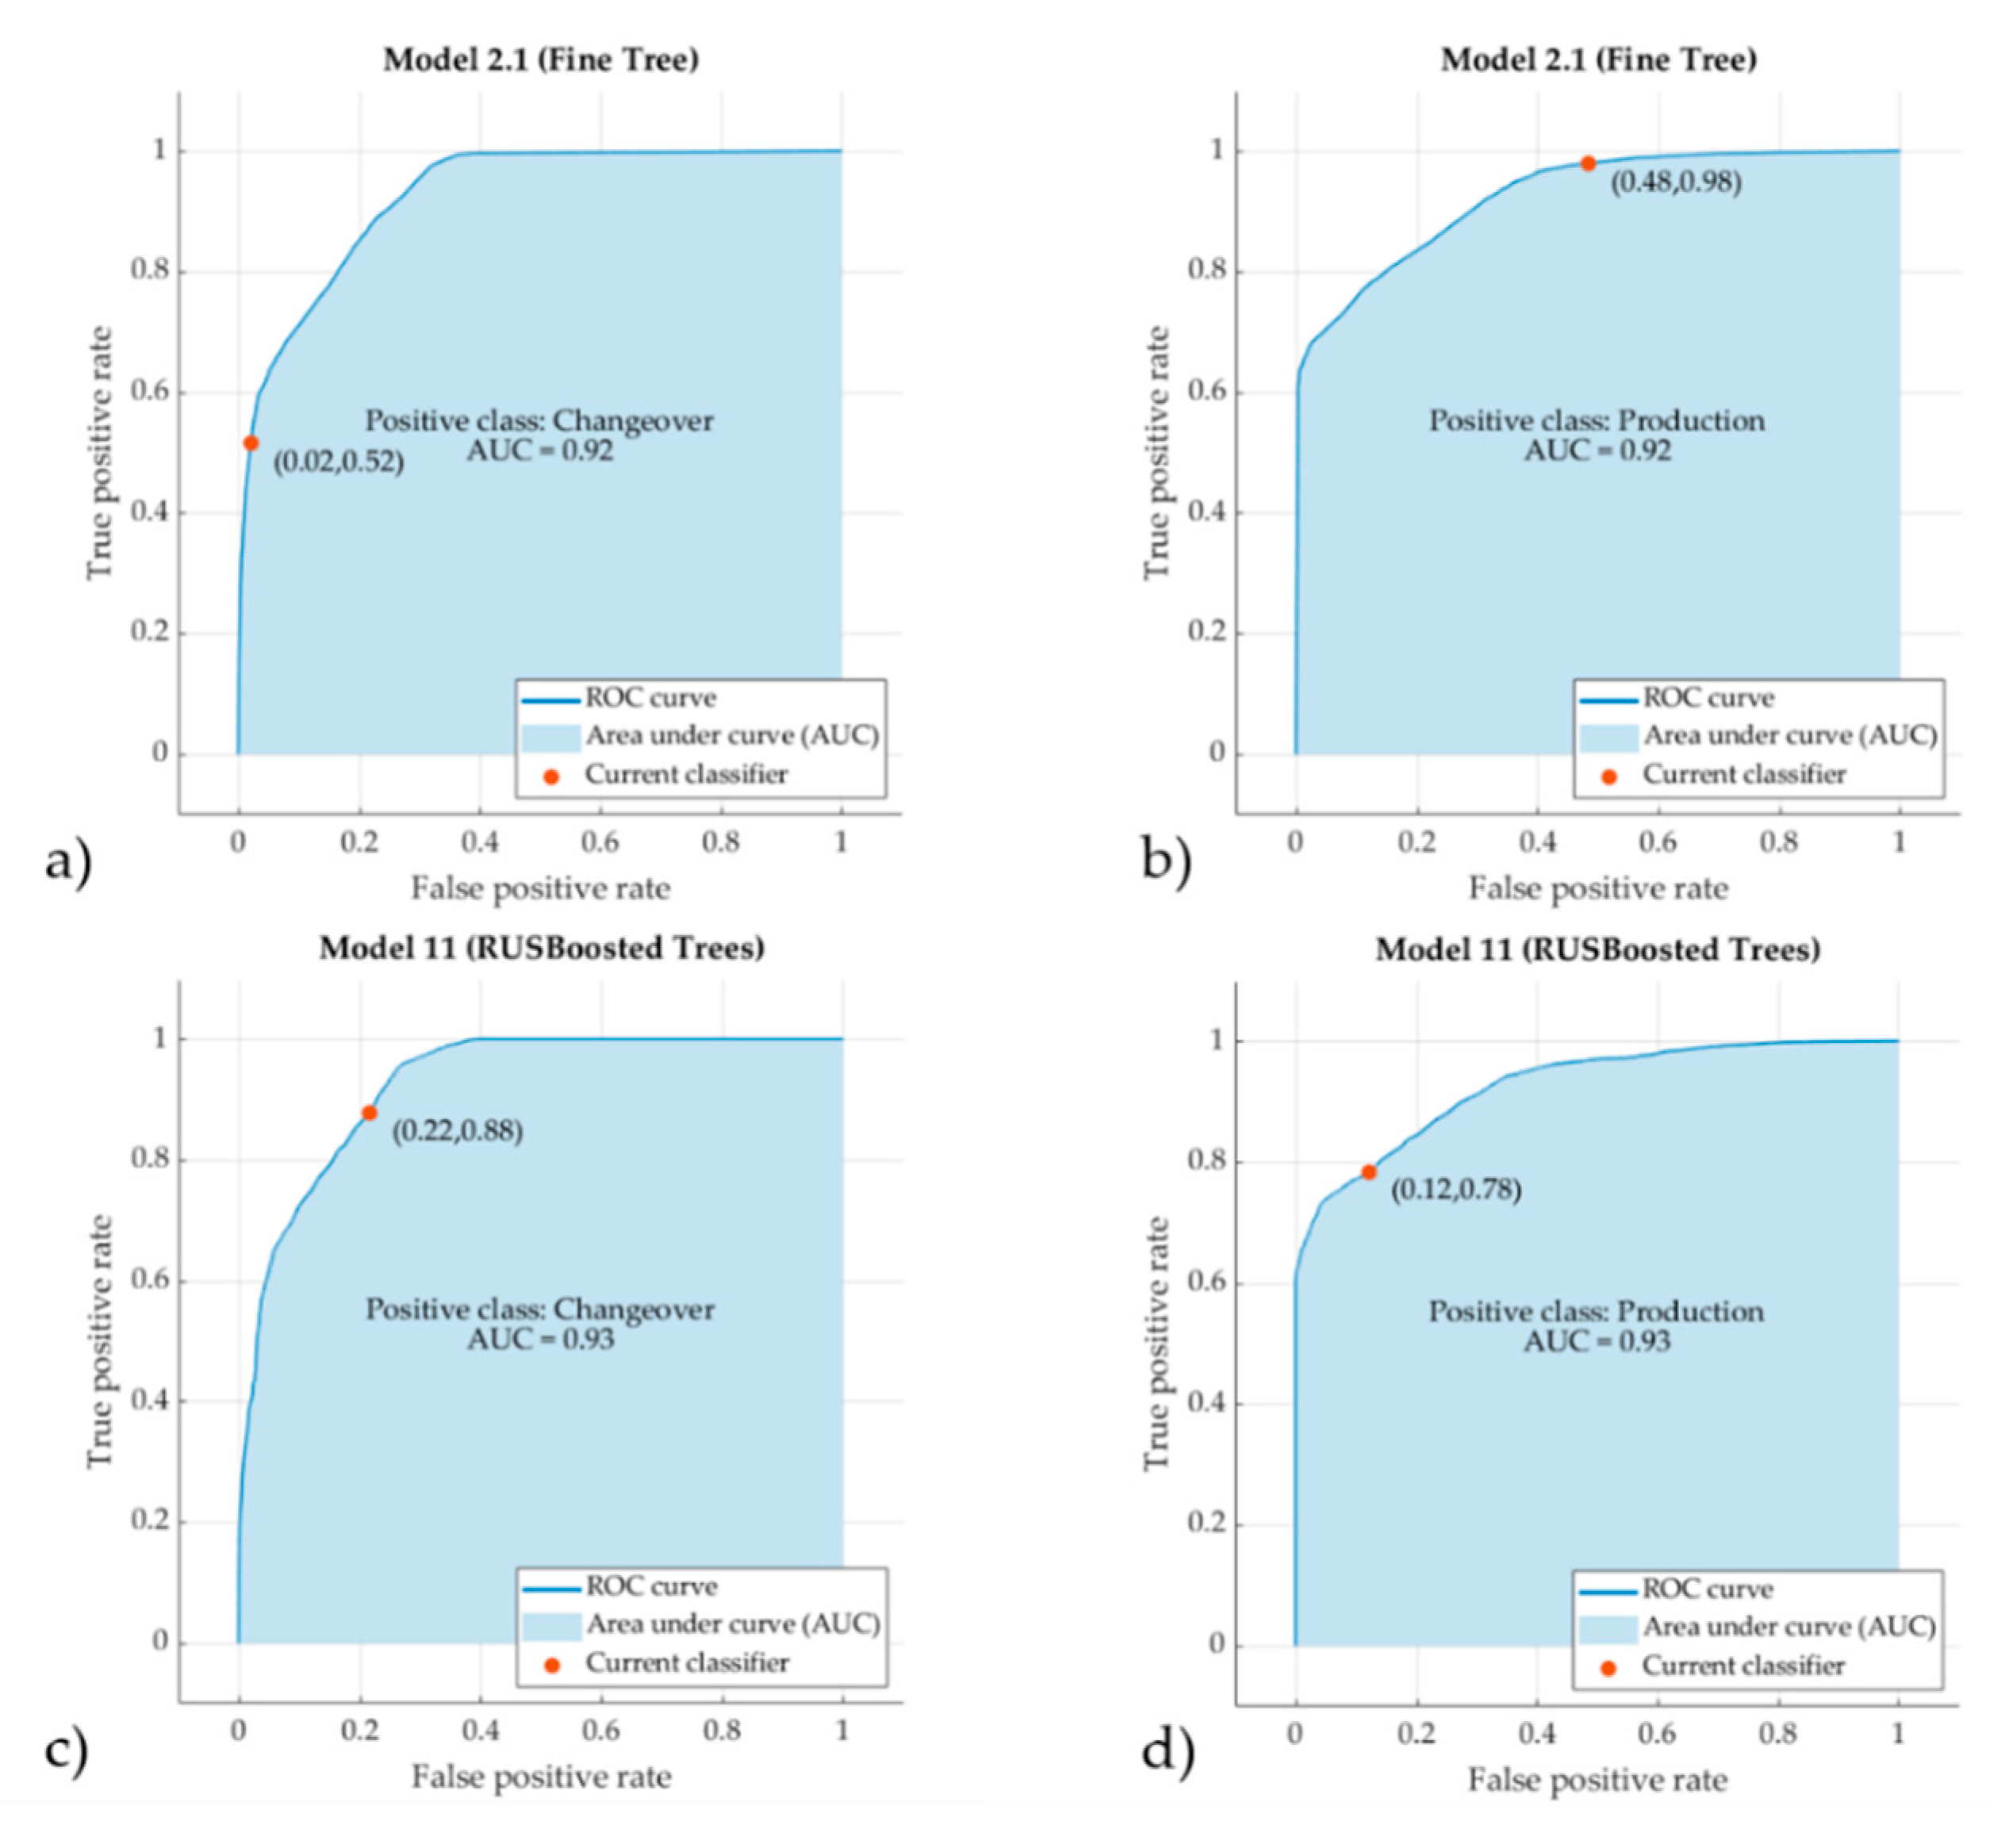
The contribution gives, at first, a theoretical insight into the different standards of availability management and shows the difference of the OEE and VDI 3423 approach. Within this analysis, the elements of both indicators become obvious. Here, the setup or changeover time is a crucial factor of OEE, which needs to be controlled. Furthermore, ML techniques might be suitable for the prediction of the OEE from historical data and the one hand. The paper reviews the state of research in this context. On the other hand, ML can contribute to distinguish changeover and serial production processes by a trained model to determine changeover times as an element of the OEE. This approach is presented more in detail. Thus, a use case scenario in a real production environment of the SME Pabst GmbH is shown. At this, the sensor concept and the data handling procedure is discussed before a huge data set is used in order to train several ML algorithms. The most promising Fine Tree and RUS Boosted Tree are investigated then in detail to find the best solution for the indicated classification problem. Recently, the ML changeover identification is used several times in the Pabst GmbH production for various products to validate the model again and gain more data for enhancing the ML approach.
Further research will be done in refining the classification in between the changeover as well as the production phase. This leads to a more complex multi-classification problem. The opportunity of this enhanced method is that, within production, idle phases of the machine can probably be identified as well as setup-subphases to predict the setup length. Both information can facilitate management decisions in terms of production planning and control. As a vision, the presented approach should automatically distinguish non-value-adding phases and recognize (time-)efficient changeover patters e.g., of different workers, which then serve as recommendations for other employees for their individual setup procedures. This can lead to self-optimizing production systems. Another research topic is the integration of ML methods into a general machine model in order to derive the OEE from heterogeneous data sources with the help of ML models, analytical as well as low-level information such as counters. In this case, the aim is to relocate the OEE calculation from business process level to the shop-floor, where the real value creation takes place. Here, the inter-process control loops need to be short in order to further increase efficiency in manufacturing companies specially for highly flexible SMEs.


