Article

Vacuum Hot Pressing of Oxide Dispersion Strengthened Ferritic Stainless Steels: Effect of Al Addition on the Microstructure and Properties

by
Dharmalingam Ganesan
1,
Prabhukumar Sellamuthu
1 and
Konda Gokuldoss Prashanth
2,3,4,*
1
Department of Mechanical Engineering, Vel Tech Rangarajan Dr. Sagunthala R&D Institute of Science and Technology, Avadi, Chennai 600 062, Tamil Nadu, India
2
Department of Mechanical and Industrial Engineering, Tallinn University of Technology, 19086 Tallinn, Estonia
3
Erich Schmid Institute of Materials Science, Austrian Academy of Sciences, A-8700 Leoben, Austria
4
CBCMT, School of Mechanical Engineering, Vellore Institute of Technology, Vellore 632 014, Tamil Nadu, India
*
Author to whom correspondence should be addressed.
J. Manuf. Mater. Process. 2020, 4(3), 93; https://doi.org/10.3390/jmmp4030093
Submission received: 12 July 2020 / Revised: 7 September 2020 / Accepted: 11 September 2020 / Published: 14 September 2020
(This article belongs to the Special Issue Powder Metallurgy and Additive Manufacturing/3D Printing of Materials)

Abstract

:
The present article investigates the fabrication of oxide dispersion strengthened (ODS) ferritic stainless steel (FSS). Three different ODS alloys with three different Al contents were fabricated, where the presence of Al-based oxides play a crucial role in determining the size of the oxide particles. Due to Ostwald ripening, the samples with Al show coarser oxide particles compared to the alloy without Al, which hampers the density of the fabricated samples and, hence, have reduced hardness levels. The present results suggest that the composition of the oxide present in ODS plays a crucial role in determining the properties of these samples.

1. Introduction

Oxide dispersion strengthened (ODS) ferritic-stainless steel (FSS) is widely used in the advanced fission and fusion reactors because of their excellent high-temperature properties [1,2,3,4,5,6,7]. In addition, the presence of highly rigid nano-sized oxide particles in ferritic ODS steels offers superior resistance to neutron irradiation. The nano-sized oxide particles act as a barrier for the dislocation movement, resisting embrittlement, and resistance to void swelling when compared with conventional ferritic steels [8]. In addition, for heat resistant structural applications (fast breeder reactors and thermal power plants), the high chromium FSS is widely used. Karak et al. and Miller et al. had reported that for elevated temperature applications, the BCC (body-centered cubic crystal) FSS exhibit good resistance to creep with higher thermal conductivity, superior oxidation resistance, excellent resistance to swelling, better tensile and compressive strength, and low coefficient of thermal expansion [9,10]. It has been reported that FSS suffers by embrittlement, known as 475 °C embrittlement when the materials are operated between 400–550 °C, which severely hampers the creep strength and swilling resistance [6]. To overcome such deficiencies, the FSS matrix is reinforced with nanoparticles especially oxides, which improves the strength of the composite and prevents grain boundary sliding both at room and elevated temperatures [11,12,13,14]. When compared to the austenitic stainless steels, the FSS has better swelling resistance and mechanical properties, at elevated temperatures [15,16]. When Al is added to the high chromium steel which activates the coarsening of the oxide particles (due to the formation of Y-Al-O), thereby reducing the elevated temperature strength. In contrast, the addition of Al along with Zr to the ferritic matrix could offer better-elevated temperature resistance to corrosion. Hence, the binding energy of Y-ZrO2 in an iron matrix is higher than that of Y-Al2O3, thus Y-ZrO2 is preferred than Y-Al2O3 particles [17,18,19]. Moreover, the Y-ZrO2 based oxides are easy to form and have higher stability than Y-Al2O3 based oxides [20].
Powder metallurgy (using mechanical milling/alloying), combined with consolidation (hot-pressing, hot-extrusion, sintering, etc.) can be effectively used to produce ODS ferritic steels [21,22,23,24,25]. However, hot-consolidation processes like the sintering process lead to grain growth, which is the major issue in powder metallurgy [26]. However, the addition of ultrafine dispersoids, such as Y2O3, TiO2, and ZrO2, through mechanical milling/alloying, can prevent grain growth at elevated temperatures [27,28,29]. The ultrafine/nano-oxide particles especially Y with Ti added to the ODS alloys refine the oxides particle size at their forming temperature (1000–1150 °C). These non-stoichiometric enriched complex oxides (Y–Ti–O) were found to be attractive to improve irradiation resistance and creep resistance due to oxide formation and size-effects. The addition of Ti especially helps in preventing Ostwald ripening and W was incorporated to promote solid solution strengthening, which, in turn, increases the high-temperature properties and decreases the creep strain rate. Hence, careful selection of oxides is a pre-requisite in the formation of ODS materials containing nano-sized oxides. In the present investigation, the different combinations of the ODS alloy containing 17Cr-0.3 wt.% Y2O3 and 0.5 wt.% ZrO2, 0.1 wt.% Ti, 1 wt.% W and Al (2 wt.% and 4 wt.%) will be fabricated using conventional ball milling and vacuum hot pressing. None of the existing reports deal with the fabrication of ODS alloys (430L-Y2O3-ZrO2-Ti-W-Al) by vacuum hot pressing method and, hence, the present study gains its importance. The structural characteristics, microstructure, and mechanical properties are studied systematically using X-ray diffraction (XRD), optical microscopy (OM), scanning electron microscopy (SEM), differential scanning calorimetry (DSC), transmission electron microscopy-energy dispersive spectroscopy (TEM-EDS), and Vicker’s hardness test and compression test.

2. Materials and Methods

The powder mixtures of 17Cr ferritic ODS steels were prepared from the 430 L pre-alloyed powder by adding requisite amounts of W, Ti, Al, ZrO2, and Y2O3. Three different compositions of the ferritic ODS steel powder mixtures namely Alloy A, Alloy B, and Alloy C were prepared using high-energy ball milling (HEBM) using Fritsch Pulverisette 7, PM400, from Fritsch, Weiman, Germany. The composition of the three alloys was furnished in Table 1. The morphology as well as the mean particle size of the starting powders were introduced in Table 2.
The density of the three alloy compositions was calculated using the rule of the mixture [30]. The mechanical alloying (MA) was carried out using HEBM using stainless steel vial and balls of 10 mm diameter. The HEBM parameters are 300 rpm rotation speed, 20 h milling time, and 10:1 ball to powder ratio. To avoid combustion during MA, toluene was used as a process control reagent [31,32,33]. The MA powders were sampled at different intervals (0 h, 5 h, 10 h, 15 h, and 20 h, respectively) and were subjected to structural characterization using X-ray diffraction (XRD) using a Philips X-pert MPD equipped with Cu-Kα (λ = 1.542 Å) radiation from Philips, Karlsdorf-Neuthard, Germany. The operating voltage and current are 30 kV and 30 mA. The data was scanned from 30 to 90 (2θ degree) with the speed of 4 degrees/minute. The crystallite size was calculated from the XRD patterns using the Debye Scherrer equation [34] and lattice strain was calculated according to the Wilson-Stokes method [35]. The powder morphology was evaluated with a scanning electron microscope (SEM), using a JEOL/EO device with an accelerating voltage of 15 kV and an operating distance of 11.5 mm. The thermal analysis of the 20 h milled powders was carried out using the differential scanning calorimeter (DSC) using Netzsch DSC 404C. DSC from Netzsch, Selb, Germany was carried out between the temperature range 26 °C and 730 °C for the 20 h MA powders. A heating rate of 10 °C/min was used for all three compositions. The 20 h MA powders were consolidated using the vacuum hot pressing (VHP) device using the following parameters: a temperature of 1170 °C, pressure of 60 MPa, and a cooling rate of 50 °C/min. Throughout the VHP process, the vacuum level was maintained at ~10−3 Torr.
The consolidated samples were tested for density levels and subsequently for hardness. Transmission electron microscopy (TEM) analysis was carried out on the consolidated samples, to evaluate the presence of oxides and their distribution using INCA Xsight-JEOL from Jeol, Freising, Germany, JEM-2100 operated at 200 kV. The TEM sample was discs of 3 mm diameter punched from the consolidated samples that were mechanically (polished) reduced to 50 μm in size. The discs were then subjected to twin-jet electro-polishing at −20 °C using 25 mL HNO3 and 75 mL methanol at 20 V. This is followed by dimpling grinding (Gatan model 656) followed by ion milling (Gatan model 691). The energy dispersive X-ray (EDAX-FEI) spectroscopy attached to TEM was used for the elemental spot analysis. To identify the phases present in the alloys, selected area diffraction was conducted. The hardness of the hot-consolidated samples was measured using Vicker’s hardness tester using an FIE Model OMEGA hardness tester from Omega, Deckenpfronn, Germany with a load of 5 kgf and 10 s dwell time. The compressive strength of the samples were tested using Zwick/Roell Z100 compression testing device as per the standard ASTM (American Society for Testing and Materials) E209 with a strain rate of 1 × 10⁻³ s−1.

3. Results and Discussion

3.1. Structural Characterization of the Powders by XRD

The structural analysis of the three alloys considered is shown in Figure 1. All of the three alloys show the presence of individual ferrite peaks-α-Fe (that are sharp and distinct) for the un-milled powder (0 h milled). No other peaks other than the ferrite peaks were observed. With increasing milling time, the ferrite peak broadens and after 20 h milling the identity of the ferrite peaks nearly disappear. This is due to the increase in the internal strain and internal defects and a decrease in the coherent domain size/the crystallite size. With the increase in the milling time from 0 h to 20 h a light peak shift is observed towards lower angles suggesting a complete solubility of the solute (Cr, Ti, and W) in the solvent (Fe) [36]. On the other hand, the peaks of Y2O3, ZrO2, Ti, W, and Al elements/phases are not visible, since only small quantities of these elements/phases were added and they are well below the deductible limits of the XRD. Generally, during the MA process, the particles are exposed to repeated cold welding, fracture [37], and finally form a single-phase solid solution, due to the Gibbs-Thompson effect [38], like in the present case. It has been observed from the XRD patterns (Figure 1) that with increasing MA time, the peaks become broad, due to a decrease in the crystallite size and increase in the internal strain in the powder samples. The changes in the crystallite size and the internal strain in the powders as a function of milling time is furnished in Figure 2. It may be observed that all the three alloys show a similar trend, where the crystallite size decreases. After 20 h, Alloy A, Alloy B, and Alloy C reaches a crystallite size of 3.6 nm, 4.4 nm, and 5.2 nm, respectively. It is obvious from the results that the addition of Al leads to an increased crystallite size (coarsening effect). However, the internal lattice strain in all the three alloys (Alloy A, Alloy B, and Alloy C), after 20 h of MA, remained similar ~1.5%, suggesting that the addition of the minor elements does not have a significant influence on the lattice strain as a function of milling time.

3.2. Morphology of the Mechanically Alloyed Powders

The morphology of the MA alloyed powders (from Alloy A, Alloy B, and Alloy C) as a function of milling time is arranged in Figure 3. Obviously the un-milled (0 h) powders from all three alloys show similar morphology owing to the same spherical shape of the material. The fine size oxides (Y2O3 and ZrO2) are found to disperse unevenly in the matrix. The less number of flaky particles of Al are also observed in Alloys B, and C (Figure 3f,k). As expected, during the MA process, the powder particles underwent repeated welding and fracture events [39]. The particle size decreases for all three alloys after 10 h of MA due to repeated welding sequences (Figure 3c,h,m). Fragmentation of the powder particles is also observed with prolonged MA and after 20 h of MA, powder particle of sizes smaller than the initial un-milled powders are observed (Figure 3e,j,o). The fragmentation of the particles is due to prolonged work-hardening and the repeated cold welding is due to the contact of nascent surfaces after fragmentation. Finally, 20 h of milled powder show considerably reduced crystallite in the nano regime.

3.3. Thermal Effects on MA Milled Powder Alloys

Figure 4 displays the DSC traces of the 20 h MA powders. The DSC traces show an exothermic behavior in all three alloys between 100 and 600 °C, which may be attributed to the revival of the alloys. The temperature of interest was between 400–600 °C because of the possible embrittlement of the material around these temperatures. However, there are no distinct sharp peaks observed in three alloys, confirming no phase changes taking place within the temperatures considered. However, the traces show the presence of a magnetic transition in Fe. A sharp peak with relatively less intensity was observed in Alloy A (~525 °C), corresponding with the recrystallization of the alloy. However, such an event is absent in Alloys B and C because of the presence of Al, which promotes coarsening (Ostwald ripening), and suppresses the recrystallization event. Apart from this event, no other significant changes are observed in the three considered alloys.

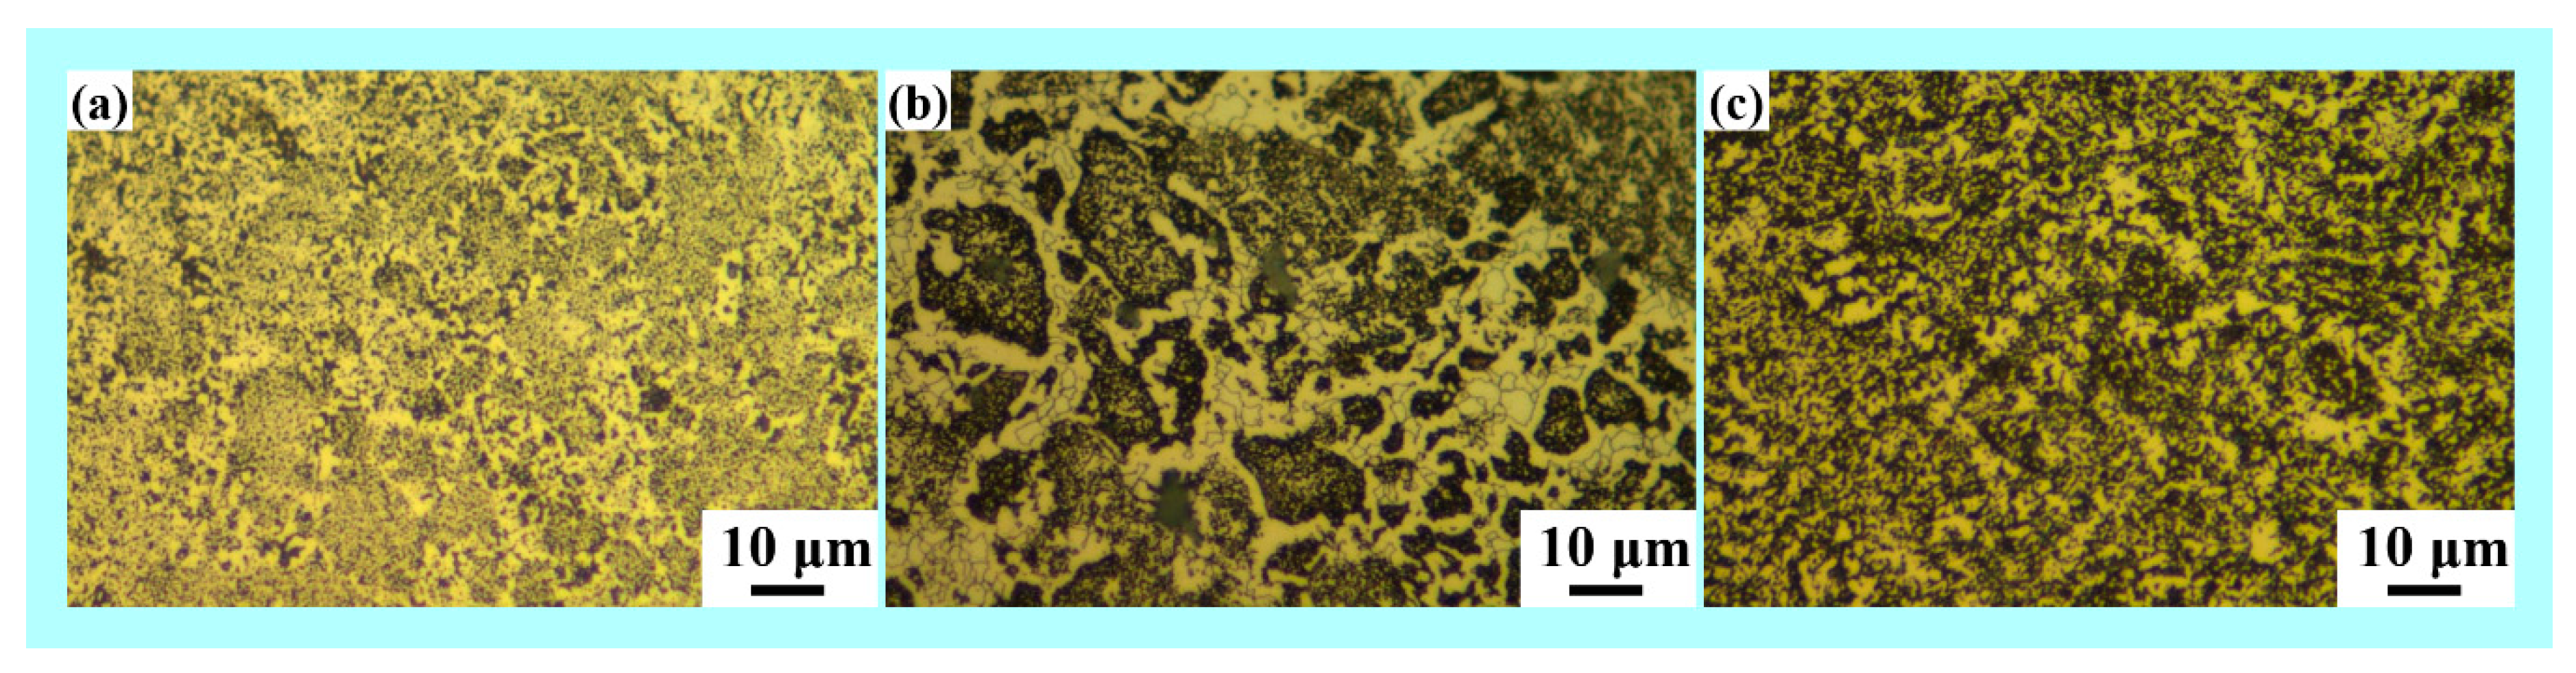
3.4. Density and Microstructure of the Consolidated Samples

The density of the consolidated alloys were calculated using Archimedes method. Accordingly, the density of the matrix (without any ODS reinforcement) was found to be 7.70 g/cc (~99.7%). The alloy without the presence of Al (Alloy A) shows a relative density of ~99%. On the other hand, the alloys with the presence of Al (Alloys B and C) show a relative density of ~98%. The alloys containing Al exhibit a decreased relative density because of the formation of Al-based oxide (Y-Al-Zr-O) in the system, which is very hard compared to the other oxides and, hence, hampers the consolidation process. Hence, Alloys B and C have more porosity than Alloy A. A similar trend was observed by Garcia et al. [40,41] for the 14Cr ferritic steel with and without the addition of Al. In the Alloy A (Al-free), Y-Zr-Ti-based oxides have a higher binding energy in an iron matrix and they can easily precipitate and are more stable than the Al-based oxides in Alloys B and C. The formation of the fine-grained Y-Zr-Ti-based nano-oxides need lower energies than the formation of Al-based oxides in Alloys B and C. Hence, Alloy A shows marginally better relative density than the Alloys B and C.
The microstructure of the hot-pressed alloys A, B, and C are shown in Figure 5. All of the three alloys show the presence of a single-phase microstructure (completely ferritic in nature (Fe, Cr)) as observed in Figure 5. The addition of aluminum to the alloys B and C has led to the formation of coarser grains. The grain size numbers observed from the OM images were tabulated in Table 3, where the grain sizes were measured using the Jeffries planimetric method. The hot pressed ODS alloy B and alloy C have shown an average ASTM grain size number of 6 and 8, respectively. On the other hand, an ASTM grain size number of 16 was observed for the aluminum free alloy A.
Figure 6 shows the TEM-EDS images of the consolidated ODS samples (for all three alloys). Zones I and II marked in the TEM images show the positions at which the I—the EDS spectrum was made (see Figure 6b,d,f) and II—corresponds to the oxide particle, where EDS spectrum was measured and tabulated in Table 4. Figure 6a shows the presence of spherical shaped complex Y-Zr-Ti-O oxides in the Alloy A, which is confirmed by the EDS data shown in Figure 6b and Table 4 (Alloy A). The individual elemental composition of the oxides observed from the EDS data is furnished in Table 4. The elemental composition data in Table 4 for all three alloys corroborates with the initial composition of the elemental powders before milling. In addition, the TEM images show that the oxides (Y2O3 and ZrO2) are distributed uniformly in the Fe-matrix and the average size of the nano oxide particles (Y-Zr-Ti-O) observed in Alloy A is between 15–18 nm (Figure 6a).
However, it may be observed that the nano complex oxide particles (Y-Zr-Ti-Al-O) were uniformly distributed in the Alloys B and C. Their average size increases and are observed in the range of 20–25 nm (Figure 6c,e), which is relatively bigger than the particles observed in Alloy A. The composition of the vacuum hot pressed samples and the nano complex oxide particles (Y-Zr-Ti-Al-O) of Alloys B and C, which is confirmed by the EDS data shown in Figure 6d,f and Table 4 (Alloy B and Alloy C). The increased size of the oxide particles in Alloys B and C may be attributed to the presence of Al, which contributes towards Ostwald ripening, leading to the growth of the oxide particles during the consolidation process. Moreover, alloy A binding energy cluster is much higher than that of the alloys B and C group in the iron matrix. Irrespective of the size and composition of the oxide particles, they are uniformly distributed in the ferritic matrix without significant agglomerations. It may be observed from the chemical composition sheet in Table 4 (for the oxide particles marked in Figure 6) that Alloy A lacks in the presence of Al, whereas Alloys B and C show the existence of Al of about 2.18 wt.% and 3.18 wt.%, respectively. In addition, the oxygen content in the oxide is similar in both Alloys A and B but shows a marginal drop in Alloy C. More over importantly, the Zr content in Alloys B and C decreases marginally as compared to Alloy A [41,42].

3.5. Hardness of the Consolidated ODS Specimens

The Vickers microhardness values of the consolidated specimens (from 20 h milled powders) for all three alloys Alloy A, Alloy B, and Alloy C and the matrix (430L) were observed to be 870 VHN, 791 VHN, 777 VHN, and 280 VHN, respectively. The difference in the hardness values observed between Alloy A and Alloys B and C may be attributed to the presence of Al in Alloys B and C. Alloy A, without the presence of Al, leads to the formation of finer oxides (Y-Zr-Ti-O) that are distributed uniformly in the ferritic matrix. On the other hand, Alloys B and C form relatively coarser oxides (Y-Zr-Ti-Al-O) due to Ostwald ripening (because of the presence of Al that promotes Ostwald ripening). In addition, the Y-Zr-Ti based oxides (Alloy A) are more coherent with the matrix compared to the Y-Zr-Ti-Al based oxides (Alloys B and C). Both the size effect and the coherency of the oxide precipitates in the ODS FSS leads to the differences in the hardness levels in the three compositions considered. The present study demonstrates the importance of choosing the right elements/phases for ODS FSS, where small additions of certain elements like Al can cause significant changes in the microstructure and may hamper the mechanical properties of these ODS alloys.

3.6. Compressive Strength of the Consolidated ODS Specimens

Figure 7 shows the compressive stress-strain curve for the three ODS alloys performed as per the ASTM standards. A compressive strength of 2700 MPa is observed for Alloy A, the strength decreases marginally to 2680 MPa for Alloy B, and it further decreases to 2670 MPa for Alloy C. However all the composite samples (Alloys A, B, and C) show very high compressive strength than the monolithic matrix without reinforced (~660 MPa). However, all the three alloys show better compressive strength than the 17.5Cr ferritic ODS steel (79.0 Fe-17.5Cr-2.0Al-0.5Ti) fabricated via pulse plasma sintering and high pressure sintering by Karak et al. [38]. The improvement in the compressive strength observed in the present alloys compared to the alloys developed by Karak et al. [43] may be corroborated to the presence of nano complex oxides that can arrest the dislocation motion along the grain boundary during deformation.
Considering all the three alloys considered, alloy C with the addition of 4 wt.% Al leads to grain coarsening effect (this might be attributed to the softening of the microstructure which may observed from the hardness values). Whereas Alloys A and B have higher hardness than Alloy C. For the nuclear cladding tube applications, the alloy C is best suitable material, because of the grain coarsening effect and the uniform distribution of nano complex oxides particles (Y-Zr-Ti-Al-O) in the Fe matrix. This effect leads to the prevention of the grain boundary sliding at high temperatures. In addition, the presence of 4 wt.% of Al in Alloy C improves both the oxidation and corrosion resistance at high temperatures.

4. Conclusions

The present investigation suggests that mechanical alloying combined with vacuum hot pressing may be used as a potential technique to fabricate bulk 17Cr ferritic oxide-dispersion strengthened stainless steel. The following observations may be made:
The density and hardness of vacuum hot pressed alloys show increasing trend due to higher sintering temperature of 1170 °C and pressure of 60 MPa than the existing methods.
Nanocrystalline size of the powder particles decrease rapidly with increases in milling time (20 h), whereas the lattice strain increases with increasing milling time.
The microstructure of considered alloys A, B and C shows uniform distribution of nano oxide particles and complex oxides particles of Y-Zr-Ti-O (Alloy A), Y-Zr-Ti-Al-O (Alloy B) and Y-Zr-Ti-Al-O (Alloy C), which is evident from TEM-EDS.
Aluminum free Alloy A has higher density and hardness than the aluminum containing Alloy B and C, due to the presence of a refined microstructure
The results demonstrate that the composition of the material and the distribution of nano complex oxides is crucial for achieving good properties in the oxide dispersion strengthening, based ferritic stainless steels. Based on the observations made in the current study, alloy C is the best-suited alloy for nuclear cladding material due to the presence of a coarse microstructure.

Author Contributions

Conceptualization, D.G., P.S. and K.G.P.; methodology, D.G.; formal analysis, D.G., P.S. and K.G.P.; data curation, D.G.; writing—original draft preparation, D.G.; writing—review and editing, P.S. and K.G.P.; supervision, P.S. All authors have read and agreed to the published version of the manuscript.

Funding

Funding from the European Regional Development Program through grant ASTRA6-6 is acknowledged.

Acknowledgments

The authors would like to express their gratitude to M/s SANDVIK for supplying the 430L ferritic stainless steel powder. We would like to thank R. Mariappan for helping in accomplishing the present work.

Conflicts of Interest

The authors declare no conflict of interest.

References

  1. Masuda, H.; Tobe, H.; Sato, E.; Sugino, Y.; Ukai, S. Transgranular dislocation activities and substructural evolutions accommodating two-dimensional grain boundary sliding in ODF ferritic steel. Acta Mater. 2017, 132, 245–254. [Google Scholar] [CrossRef]
  2. Chen, J.; Jung, P.; Hoffelner, W.; Ullmaier, H. Dislocation loops and bubbles in oxide dispersion strengthened ferritic steel after helium implantation under stress. Acta Mater. 2008, 56, 250–258. [Google Scholar] [CrossRef]
  3. Xu, S.; Zhou, Z.; Long, F.; Jia, H.; Guo, N.; Sun, Y.; Yao, Z.; Daymond, M.R. Influence of Al Addition Strategy on the Microstructure of a Low--Cr Oxide Dispersion--Strengthened Ferritic Steel. Adv. Eng. Mater. 2020, 22, 1900879. [Google Scholar] [CrossRef]
  4. Sanctis, M.D.; Fava, A.; Lovicu, G.; Montanari, R.; Richetta, M.; Testani, C.; Varone, A. Mechanical characterization of a nano-ODS steel prepared by low-energy mechanical alloying. Metals 2017, 7, 283. [Google Scholar] [CrossRef]
  5. Svoboda, J.; Horník, V.; Stratil, L.; Hadraba, H.; Mašek, B.; Khalaj, O.; Jirková, H. Microstructure Evolution in ODS Alloys with a High-Volume Fraction of Nano Oxides. Metals 2018, 8, 1079. [Google Scholar] [CrossRef] [Green Version]
  6. Zhao, Q.; Qiao, Z.; Liu, Y.; Yu, L.; Huang, Y.; Guo, Q.; Li, H. Characterizatino of 14Cr ODS Steel fabricated by spark plasma sintering. Metals 2019, 9, 200. [Google Scholar] [CrossRef] [Green Version]
  7. Zhao, Q.; Ma, Z.; Yu, L.; Li, H.; Wang, Z.; Liu, Y. Inhibition effect of Ti on the formation of martensite lath in 14Cr oxide dispersion strengthened steel. Metals 2018, 8, 802. [Google Scholar] [CrossRef] [Green Version]
  8. Zinkle, S.J.; Was, G.S. Materials challenges in nuclear energy. Acta Mater. 2013, 61, 735–758. [Google Scholar] [CrossRef]
  9. Karak, S.K.; Chudoba, T.; Witczak, Z.; Lojkowski, W.; Manna, I. Development of ultra-high strength nano-Y2O3 dispersed ferritic steel by mechanical alloying and hot isostatic pressing. Mater. Sci. Eng. A 2011, 528, 7475–7483. [Google Scholar] [CrossRef]
  10. Miller, M.K.; Kenik, E.A.; Russell, K.F.; Heatherly, L.; Hoelzer, D.T.; Maziasz, P.J. Atom probe tomography of nanoscale particles in ODS ferritic alloys. Mater. Sci. Eng. A 2003, 353, 140–145. [Google Scholar] [CrossRef]
  11. Kim, H.Y.; Kwon, O.Y.; Jang, J.; Hong, S.H. Modification of anisotripic mechanical properties in recrystallized oxide dispersion strengthened ferritic alloy. Scr. Mater. 2006, 54, 1703–1707. [Google Scholar] [CrossRef]
  12. Xu, S.; Zhou, Z.; Zheng, W.; Jia, H. Mechanical properties evaluation and plastic instabilities of Fe-9%Cr ODS steels. Fusion Eng. Des. 2019, 149, 111335. [Google Scholar] [CrossRef]
  13. Das, A.; Chekhonin, P.; Altstadt, E.; Bergner, F.; Heintze, C.; Lindau, R. Microstructural characterization of inhomogeneity in 9Cr ODS EUROFER steel. J. Nucl. Mater. 2020, 533, 152083. [Google Scholar] [CrossRef]
  14. Song, L.; Yanf, X.; Zhao, Y.; Wang, W.; Mao, X. Si-containing 9Cr ODS steel designed for high temperature application in lead-cooled fast rector. J. Nucl. Mater. 2019, 519, 22–29. [Google Scholar] [CrossRef]
  15. Henry, J.; Averty, X.; Dai, Y.; Pizzanelli, J.; Espinas, J. Tensile properties of ODS-14%Cr ferritic alloy irradiated in a spallation environment. J. Nucl. Mater. 2009, 386, 345–348. [Google Scholar] [CrossRef]
  16. McClintock, D.A.; Sokolov, M.A.; Hoelzer, D.T.; Nanstad, R.K. Mechanical properties of irradiated ODS-EUROFER and nanocluster strengthened 14YWT. J. Nucl. Mater. 2009, 392, 353–359. [Google Scholar] [CrossRef]
  17. Kimura, A.; Kasada, R.; Iwata, N.; Kishimoto, H.; Zhang, C.H.; Isselin, J.; Dou, P.; Lee, J.; Muthukumar, N.; Okuda, T.; et al. Development of Al added high-Cr ODF steels for fuel cladding of next generation nuclear systems. J. Nucl. Mater. 2011, 417, 176–179. [Google Scholar] [CrossRef]
  18. Xia, Y.P.; Wang, X.P.; Zhuang, Z.; Sun, Q.X.; Zhang, T.; Fang, Q.F.; Hao, T.; Liu, C.S. Microstructure and oxidation properties of 16Cr-5Al-ODS steel prepared by sol-gel and spark plasma sintering methods. J. Nucl. Mater. 2013, 432, 198–204. [Google Scholar] [CrossRef]
  19. Liu, T.; Wang, C.; Shen, H.; Chou, W.; Iwata, N.Y.; Kimura, A. The effects of Cr and Al concentrations on the oxidation behavior of oxide dispersion strengthened ferritic alloys. Corr. Sci. 2013, 76, 310–316. [Google Scholar] [CrossRef]
  20. Macía, E.; García-Junceda, A.; Serrano, M.; Hernández-Mayoral, M.; Diaz, L.A.; Campos, M. Effect of the heating rate on the microstructure of a ferritic ODS steel with four oxide formers (Y-Ti-Al-Zr) consolidated by spark plasma sintering (SPS). J. Nucl. Mater. M 2019, 518, 190–201. [Google Scholar] [CrossRef]
  21. Chaubey, A.K.; Scudino, S.; Prashanth, K.G.; Eckert, J. Microstructure and mechanical properties of Mg-Al based alloy modified with cerium. Mater. Sci. Eng. A 2015, 625, 46–49. [Google Scholar] [CrossRef]
  22. Wang, Z.; Tan, J.; Sun, B.A.; Scudino, S.; Prashanth, K.G.; Zhang, W.W.; Li, Y.Y.; Eckert, J. Fabrication and mechanical properties of Al-based metal matrix composites reinforced with Mg65Cu20Zn5Y10 metallic glass particles. Mater. Sci. Eng. A 2014, 600, 53–58. [Google Scholar] [CrossRef]
  23. Chaubey, A.K.; Scudino, S.; Samadi Khoshkhoo, M.; Prashanth, K.G.; Mukhopadhyay, N.K.; Mishra, B.K.; Eckert, J. High-strength ultrafine grain Mg-7.4%Al alloy synthesized by consolidation of mechanically alloyed powders. J. Alloys Compd. 2014, 610, 456–461. [Google Scholar] [CrossRef]
  24. Ali, F.; Scudino, S.; Liu, G.; Srivastava, V.C.; Mukhopadhyay, N.K.; Khoshkhoo, M.S.; Prashanth, K.G.; Uhlenwinkel, V.; Calin, M.; Eckert, J. Modeling the strengthening effect of Al–Cu–Fe quasicrystalline particles in Al-based metal matrix composites. Alloys Compd. 2012, 536, S130–S133. [Google Scholar] [CrossRef]
  25. Marko, D.; Prashanth, K.G.; Scudino, S.; Wang, Z.; Ellendt, N.; Uhlenwinkel, V.; Eckert, J. Al-based metal matrix composites reinforced with Fe49.9Co35.1Nb7.7B4.5Si2.8 glassy powder: Mechanical behavior under tensile loading. J. Alloys Compd. 2014, 615, S382–S385. [Google Scholar] [CrossRef]
  26. Lu, Z.-G.; Wu, J.; Xu, L.; Yang, R. Powder size infouence on tensile properties and porosity for PM Ti2AlNb alloy prepared by hot isostatic pressing. Acta Metal. Sin. 2019, 3, 1329–1336. [Google Scholar] [CrossRef] [Green Version]
  27. Wang, Z.; Tan, J.; Scudino, S.; Sun, B.A.; Qu, R.T.; He, J.; Prashanth, K.G.; Zhang, W.W.; Li, Y.Y.; Eckert, J. Mechanical behavior of Al-based matrix composites reinforced with Mg58Cu28.5Gd11Ag2.5 metallic glasses. Adv. Powder Technol. 2014, 25, 635–659. [Google Scholar] [CrossRef]
  28. Prashanth, K.G.; Murty, B.S. Production, kinetic study and properties of Fe-based glass and its composites. Mater. Manuf. Process. 2010, 25, 592–597. [Google Scholar] [CrossRef]
  29. Prashanth, K.G.; Scudino, S.; Murty, B.S.; Eckert, J. Fabrication, mechanical and tribological properties of Al70Y16Ni10Co4 glass reinforced metal matrix composites. Mater. Manuf. Process. 2011, 26, 1242–1247. [Google Scholar] [CrossRef]
  30. Scudino, S.; Liu, G.; Prashanth, K.G.; Bartusch, B.; Surreddi, K.B.; Murty, B.S.; Eckert, J. Mechanical properties of Al-based metal matrix composites reinforced with Zr-based glassy particles produced by powder metallurgy. Acta Mater. 2009, 57, 2029–2039. [Google Scholar] [CrossRef]
  31. Prashanth, K.G. Influence of mechanical activation on decomposition of titanium hydride. Mater. Manuf. Process. 2010, 25, 974–977. [Google Scholar] [CrossRef]
  32. Prashanth, K.G.; Scudino, S.; Murty, B.S.; Eckert, J. Crystallization kinetics and consolidation of mechanically alloyed Al70Y16Ni10Co4 glassy powders. J. Alloys Compd. 2009, 477, 171–177. [Google Scholar] [CrossRef]
  33. Surreddi, K.B.; Scudino, S.; Sakaliyska, M.; Prashanth, K.G.; Sordelet, D.J.; Eckert, J. Crystallization behavior and consolidation of gas-atomized Al84Gd6Ni7Co3 glassy powder. J. Alloy Compd. 2010, 491, 137–142. [Google Scholar] [CrossRef]
  34. Burton, A.W.; Ong, K.; Rea, T.; Chan, I.Y. On the estimation of average crystallize size of zeolites from the Scherrer equation: A critical evaluation of its application to zeolites with one-dimensional pore systems. Micropor. Mesopor. Mater. 2009, 117, 75–90. [Google Scholar] [CrossRef]
  35. Deb, A.K.; Chatterjee, P. Estimation of lattice strain in alumina-zirconia nanocomposites by X-ray diffraction peak profile analysis. J. Theor. Appl. Phys. 2019, 13, 221–229. [Google Scholar] [CrossRef] [Green Version]
  36. Rajulapati, S.K.; Prakash, U.; Laha, K.; Dabhade, V.V. Studies on alloying process of a ferritic/martensituc oxide dispersion strengthened (ODS) steel prepared by mechanical alloying of elements. Powder Metall. 2016, 59, 350–358. [Google Scholar] [CrossRef]
  37. Karak, S.K.; Majumdar, J.D.; Witczak, Z.; Lojkowski, W.; Manna, I. Microstructure and mechanical properties of nano-Y2O3 dispersed ferritic alloys synthesized by mechanical alloying and consolidated by hydrostatic extrusion. Mater. Sci. Eng. A 2013, 580, 231–241. [Google Scholar] [CrossRef]
  38. Karak, S.K.; Majumdar, J.D.; Witczak, Z.; Lojkowski, W.; Ciupiński, Ł.; Kurzydłowski, K.J.; Manna, I. Evaluation of microstructure and mechanical properties of nano-Y2O3-dispersed ferritic alloy synthesized by mechanical alloying and consolidated by high-pressure sintering. Metall. Mater. Transact. A 2013, 44, 2884–2894. [Google Scholar] [CrossRef]
  39. Suryanarayana, C. Mechanical alloying and milling. Prog. Mater. Sci. 2001, 46, 1–184. [Google Scholar] [CrossRef]
  40. García Junceda, A.; García Rodríguez, N.; Campos, M.; Cartón Cordero, M.; Torralba, J.M. Effect of Zr addition on the microstructure and mechanical properties of an Al-alloyed ODS steel consolidated by FAHP. J. Am. Ceram. Soc. 2015, 98, 3582–3587. [Google Scholar] [CrossRef]
  41. García Junceda, A.; Macía, E.; Garbiec, D.; Serrano, M.; Torralba, J.M.; Campos, M. Effect of small variations in Zr content on the microstructure and properties of ferritic ODS steels consolidated by SPS. Metals 2020, 10, 348. [Google Scholar] [CrossRef] [Green Version]
  42. Li, W.; Xu, H.; Sha, X.; Meng, J.; Wang, Z. Microstructure and mechanical properties of 14Cr-ODS steels with Zr addition. High Temp. Mater. Process. 2019, 38, 404–410. [Google Scholar] [CrossRef]
  43. Karak, S.K.; Majumdar, J.D.; Lojkowski, W.; Michalski, A.; Ciupinski, L.; Kurzydłowski, K.J.; Manna, I. Microstructure and mechanical properties of nano-Y2O3 dispersed ferritic steel synthesized by mechanical alloying and consolidated by pulse plasma sintering. Phil. Mag. 2012, 92, 516–534. [Google Scholar] [CrossRef]
Figure 1. X-ray diffraction (XRD) patterns of the mechanically alloyed powders: (a) Alloy A, (b) Alloy B, and (c) Alloy C as a function of milling time.
Jmmp 04 00093 g001
Figure 2. Crystallite size and lattice strain of the mechanically alloyed powders for the alloys (a) A, (b) B, and (c) C calculated from the XRD patterns as a function of milling time.
Jmmp 04 00093 g002
Figure 3. Scanning electron microscopy images of the mechanically alloyed powders (from (ae) Alloy A, (fj) Alloy B, and (ko) Alloy C) as a function of milling time.
Jmmp 04 00093 g003
Figure 4. Differential scanning calorimetric results obtained from the 20 h mechanically alloyed powders from Alloy A, Alloy B, and Alloy C.
Jmmp 04 00093 g004
Figure 5. Optical microscopy images showing the microstructures of the samples (a) alloy A, (b) alloy B, and (c) alloy C after vacuum hot pressing.
Jmmp 04 00093 g005
Figure 6. Transmission electron microscopy images and subsequent energy dispersive X-ray spectroscopy of the consolidated oxide dispersion strengthened alloys ((a,b) Alloy A, (c,d) Alloy B, and (e,f) Alloy C).
Jmmp 04 00093 g006
Figure 7. Compressive stress-strain curve of the consolidated oxide dispersion strengthened alloys (Alloy A, Alloy B, and Alloy C).
Jmmp 04 00093 g007
Table 1. Chemical composition of the three oxide dispersion strengthened ferritic stainless steel compositions.
SpecificationCr (wt.%)Mn (wt.%)Si (wt.%)C (wt.%)P (Wt.%)S (wt.%)Fe (wt.%)Theoretical Density (g/cc)
430L170.890.890.020.010.01Bal.7.70
Alloy A(430L+0.3Y2O3+0.5ZrO2+0.1Ti) wt.%7.67
Alloy B(430L+0.3Y2O3+0.5ZrO2+0.1Ti+1W+2Al) wt.%7.68
Alloy C(430L+0.3Y2O3+0.5ZrO2+0.1Ti+1W+4Al) wt.%7.59
Table 2. The morphology and mean particle size of the starting materials (powders).
Alloy/ElementMorphologyMean Particle Size
430LPlate shapedApprx. 22 μm (length)
ZrO2Irregular shapedApprx. 12 μm dia.
Y2O3Irregular shapedApprx. 10 μm dia.
WIrregular shapedApprx. 30 μm dia.
AlSpherical67 μm
TiSpherical50 μm
Table 3. ASTM (American Society for Testing and Materials) grain size number and average grain size of the vacuum hot pressed ferritic oxide dispersion strengthened alloys.
CompositionASTM Grain Size NumberAverage Grain Diameter (μm)
Alloy A161.8
Alloy B68
Alloy C810
Table 4. Chemical content of the complex oxide particles—II (from the transmission electron microscopy images) for the alloys: Alloy A, Alloy B, and Alloy C.
SpecificationAlloy AAlloy BAlloy C
Wt. %At. %Wt. %At. %Wt. %At. %
O K44.1380.2045.0680.4243.9678.42
Ti K2.400.242.060.242.080.16
Cr K0.700.450.800.290.800.28
Fe K1.500.471.620.901.640.80
Y K17.205.1518.015.3317.715.41
Zr K34.0713.4930.0310.5830.9410.68
Al K--2.182.253.183.25

