Article

The Dimensional Accuracy of Thin-Walled Parts Manufactured by Laser-Powder Bed Fusion Process

1
Institute for Virtual Product Develeopment, Aalen University of Applied Science, Beethovenstr. 1, 73430 Aalen, Germany
2
Institute of Materials Science and Mechanics of Materials, Technical University of Munich, Boltzmanstr. 15, 85748 Garching, Germany
*
Authors to whom correspondence should be addressed.
J. Manuf. Mater. Process. 2020, 4(3), 91; https://doi.org/10.3390/jmmp4030091
Submission received: 6 August 2020 / Revised: 3 September 2020 / Accepted: 3 September 2020 / Published: 11 September 2020
(This article belongs to the Special Issue Powder Metallurgy and Additive Manufacturing/3D Printing of Materials)

Abstract

:
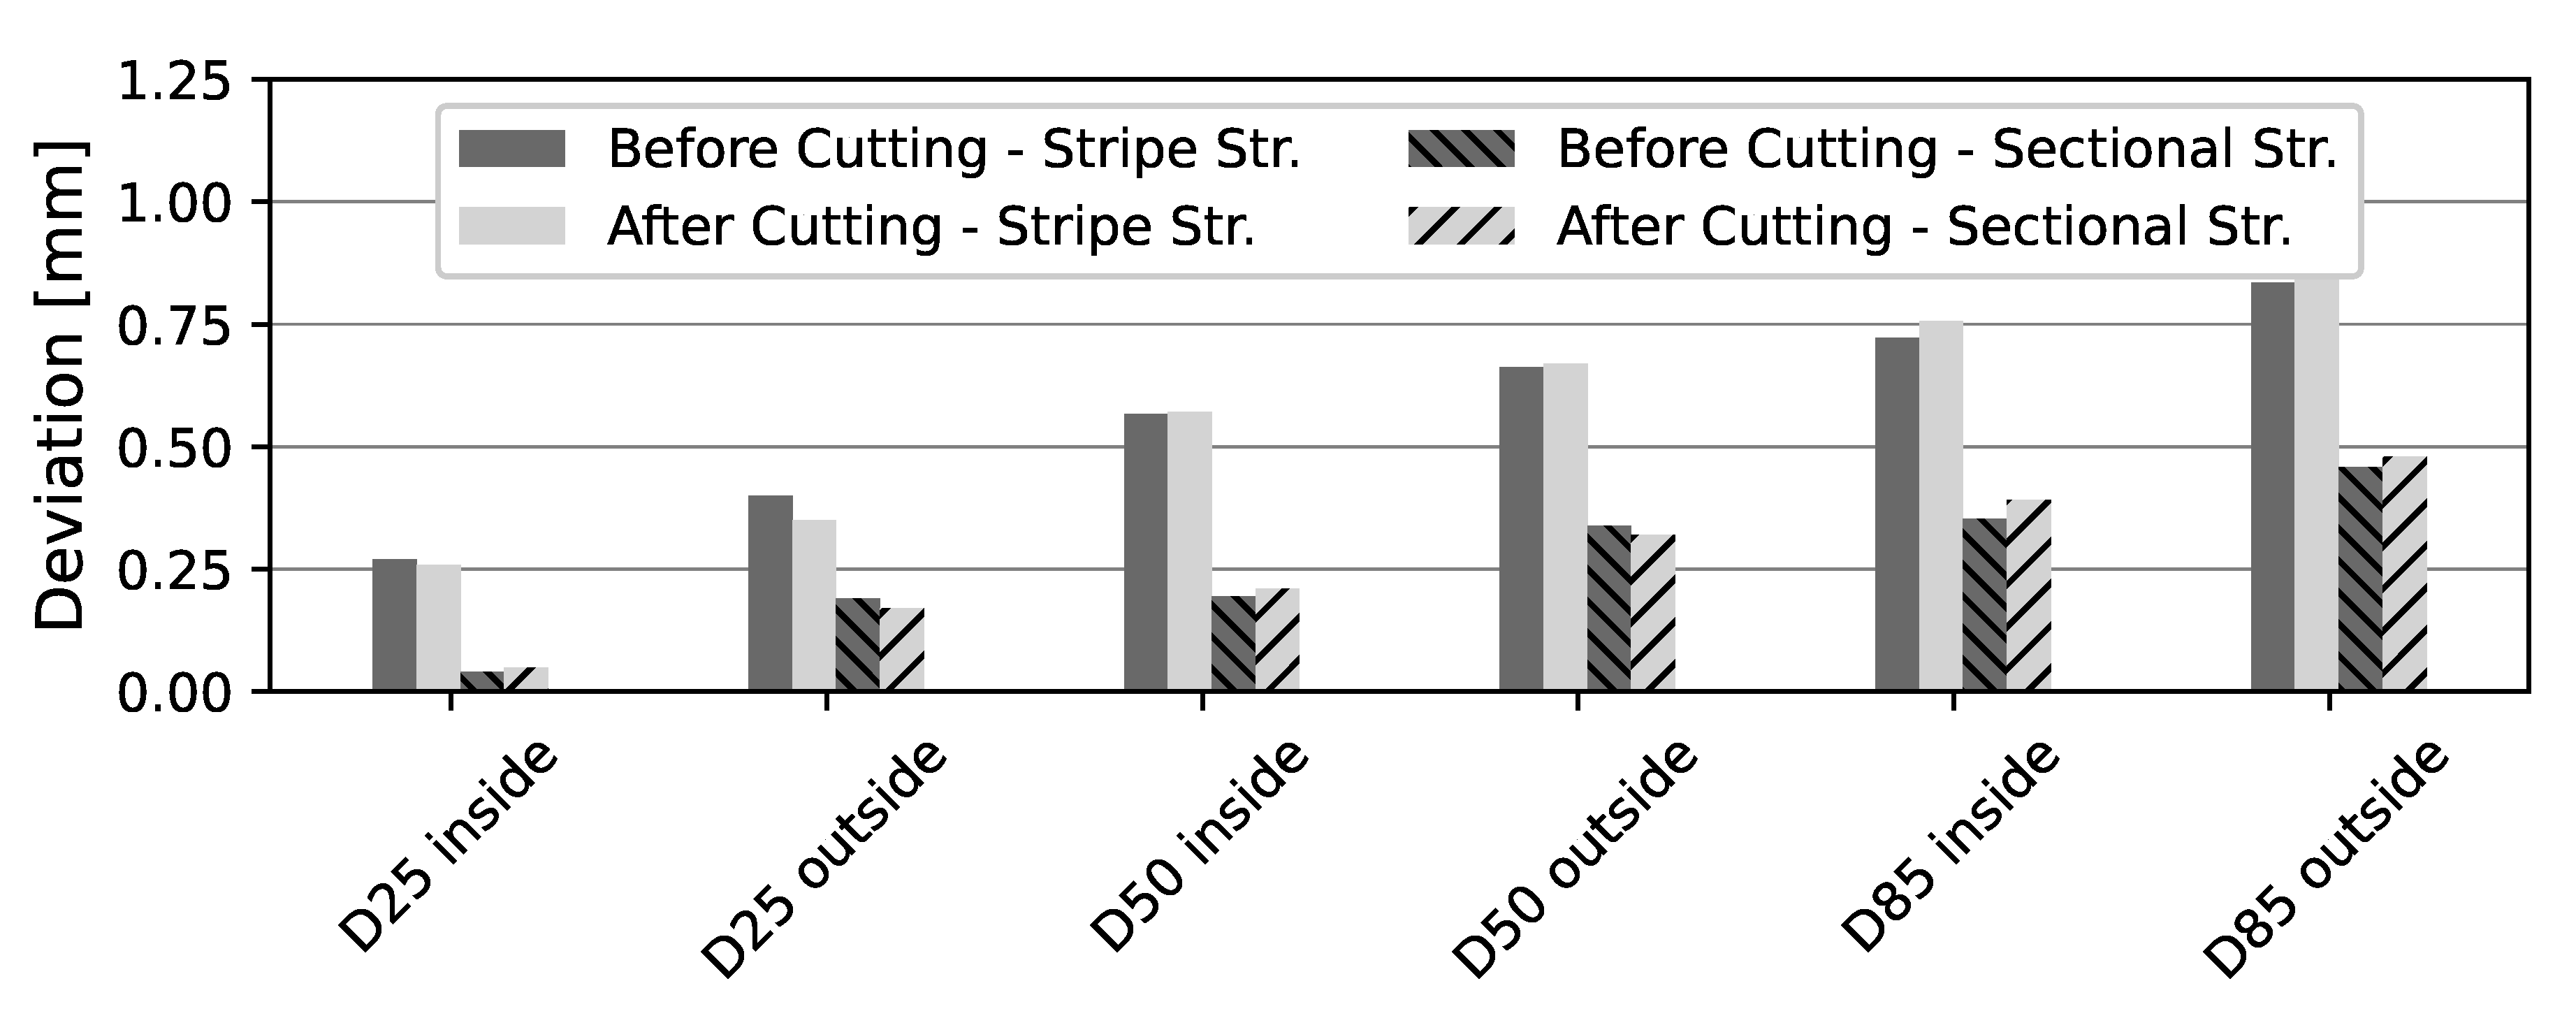
Laser-Powder Bed Fusion brings new possibilities for the design of parts, e.g., cutter shafts with integrated cooling channels close to the contour. However, there are new challenges to dimensional accuracy in the production of thin-walled components, e.g., heat exchangers. High degrees of dimensional accuracy are necessary for the production of functional components. The aim is to already achieve these during the process, to reduce post-processing costs and time. In this work, thin-walled ring specimens of H13 tool steel are produced and used for the analysis of dimensional accuracy and residual stresses. Two different scanning strategies were evaluated. One is a stripe scan strategy, which was automatically generated and provided by the machine manufacturer, and a (manually designed) sectional scan strategy. The ring segment strategy is designed by manually segmenting the geometry, which results in a longer preparation time. The samples were printed in different diameters and analyzed with respect to the degree of accuracy and residual stresses. The dimensional accuracy of ring specimens could be improved by up to 81% with the introduced sectional strategy compared to the standard approach.

1. Introduction

Laser-Powder Bed Fusion (LPBF) is a layer-based technique of 3-dimensional additive manufacturing. One of the major advantages of the LPBF technique is the short production time for individual parts. Applications are for example dental technology, biomedical application or aerospace engineering [1,2]. The goal is to produce components for different industrial fields with high dimensional accuracy. The advantages of the LPBF process are the possibility of lightweight construction by lattice structures [3,4,5], the flexibility of geometry and the integration of functions [6,7]. In order to utilize these advantages, component designed for LPBF tend to have a higher level of complexity, with a significant amount of thin-walled parts. Unlike in conventional fabrication processes, the dimensional accuracy often poses a challenge in LPBF [8].
In the melting process, the locally concentrated energy input of the laser leads to distortion and residual stresses in the part. There are two main theories for the generation of residual stresses, the Temperature Gradient Mechanism (TGM) and the Cool-Down Phase [9,10]. The Temperature Gradient Mechanism describes the generation due to the layered structure of the process, first, a layer is melted and then the following layer. Because of the rapid heating by the laser and the low heat conduction, a high temperature gradient is created. The heat conduction is limited by the thin walls, which results in a small solidified cross-section available for heat transport in the solid, while the powder-bed acts like a thermal insulation. Therefore, stresses arise in the components due to the high temperature gradients [11]. The Cool-Down Phase model describes the formation of the residual stresses by the melting material and the subsequent solidification. During solidification and cooling, the metal shrinks and contracts thereby stresses are generated [10]. The already solidified layers inhibit the shrinkage and tensile stresses occur in the upper layer [9]. Residual stresses are separated into three types: macro-residual stresses, which span several grains (type I), micro-residual stresses within one grain (type II), and sub-micro residual stress of several atomic distances within a grain (type III) [12]. For the dimensional accuracy in the LPBF process residual stresses of type I are relevant [10]. The residual stresses can lead to deformation and even cracks in the parts [9]. Regarding component accuracy, residual stresses should be avoided. The main methods to reduce residual stresses are improving the scan strategy [13,14], using powder bed preheating [15,16,17] and via heat treatments after the fabrication process [18].
With the help of the exposure strategy, the methodology of fusing the individual layers can be changed and thus the residual stresses can be reduced. With a change of the exposure strategy, the temperature profile within the layer is influenced, this can reduce the residual stresses, taking TGM into account. With the standard stripe exposure strategy, the test results vary. Cheng et al. found out in their experiments that a line exposure with a 45 angle for tension measurement gives the best results and exposed from inside to outside [19]. In contrast to this, Kruth et al. reported that the successive island exposure with short vectors are preferable [14]. Dunbar et al. and Ali et al. showed that the rotation of scan vectors lead to a decrease of the deformations [13,20]. In the experiments of Mercelis and Kruth, residual stresses were lower in direction of exposure, compared to the perpendicular in-plane direction [10]. Yu et al. studied the influence of re-melting on porosity and have shown that re-melting with same and opposite directions are the same in central areas of printed parts, the same direction re-melting have better results on porosity at edges [21]. In summary, it can be stated that the experiments yielded different results. Common features in the investigations are that the exposure strategy influences the residual stresses.
In this work, the resulting residual stresses and the dimensional accuracy of specimens manufactured by the stripe and sectional scan strategies were analyzed. According to the models for the creation of residual stresses, which can lead to distortion, a suitable strategy for thin-walled components will be investigated. Lower residual stresses are expected from scan vectors along the component contour [9,10]. The focus of this investigation is to improve the scan strategy with the scope of dimensional accuracy. A sectional scan strategy is developed and results are compared to the stripe scan strategy. With a scanning path orthogonal to the contour is deviations from the nominal dimension of the component width are observed. The best results are obtained with a scanning path along the contour path [22]. The dimensional accuracy of thin-walled geometries before and after separating the part from the base platform will be investigated. To identify the influence of the scanning strategies on the residual stresses, the stresses after separation will be measured.

2. Materials and Methods

A high degree of dimensional accuracy is required for the production of functional components. This is especially true for thin-walled components, which are prone to distortion due to residual stresses created during production. Selection of the process parameters and the process strategy has a significant influence on the quality of the thin-walled components.

2.1. Printing Strategies

Assuming the fact that the scan vectors along the contour lead to a good dimensional accuracy, a sectional strategy has been designed and is compared with the stripe strategy, Figure 1. The arrows represent the scan-vectors and describe the path of the laser. The case of the stripe strategy powder melting is from the inside to the outside, i.e., laser scanning started with the core, followed by the fill and finally the contour region, Figure 1a. Applied stripe pattern had an incremental rotation of 33 between subsequent layers. This led to different lengths of the scan-vectors. Comparing the stripe strategy with the sectional strategy, the area was divided into small segments of equal consecutive lengths of the scan vectors in each layer along the curvature, Figure 1b. In case of the sectional strategy, powder melting occurred from the outside to the inside of the counter and only contour exposure was used.

2.2. Specimens

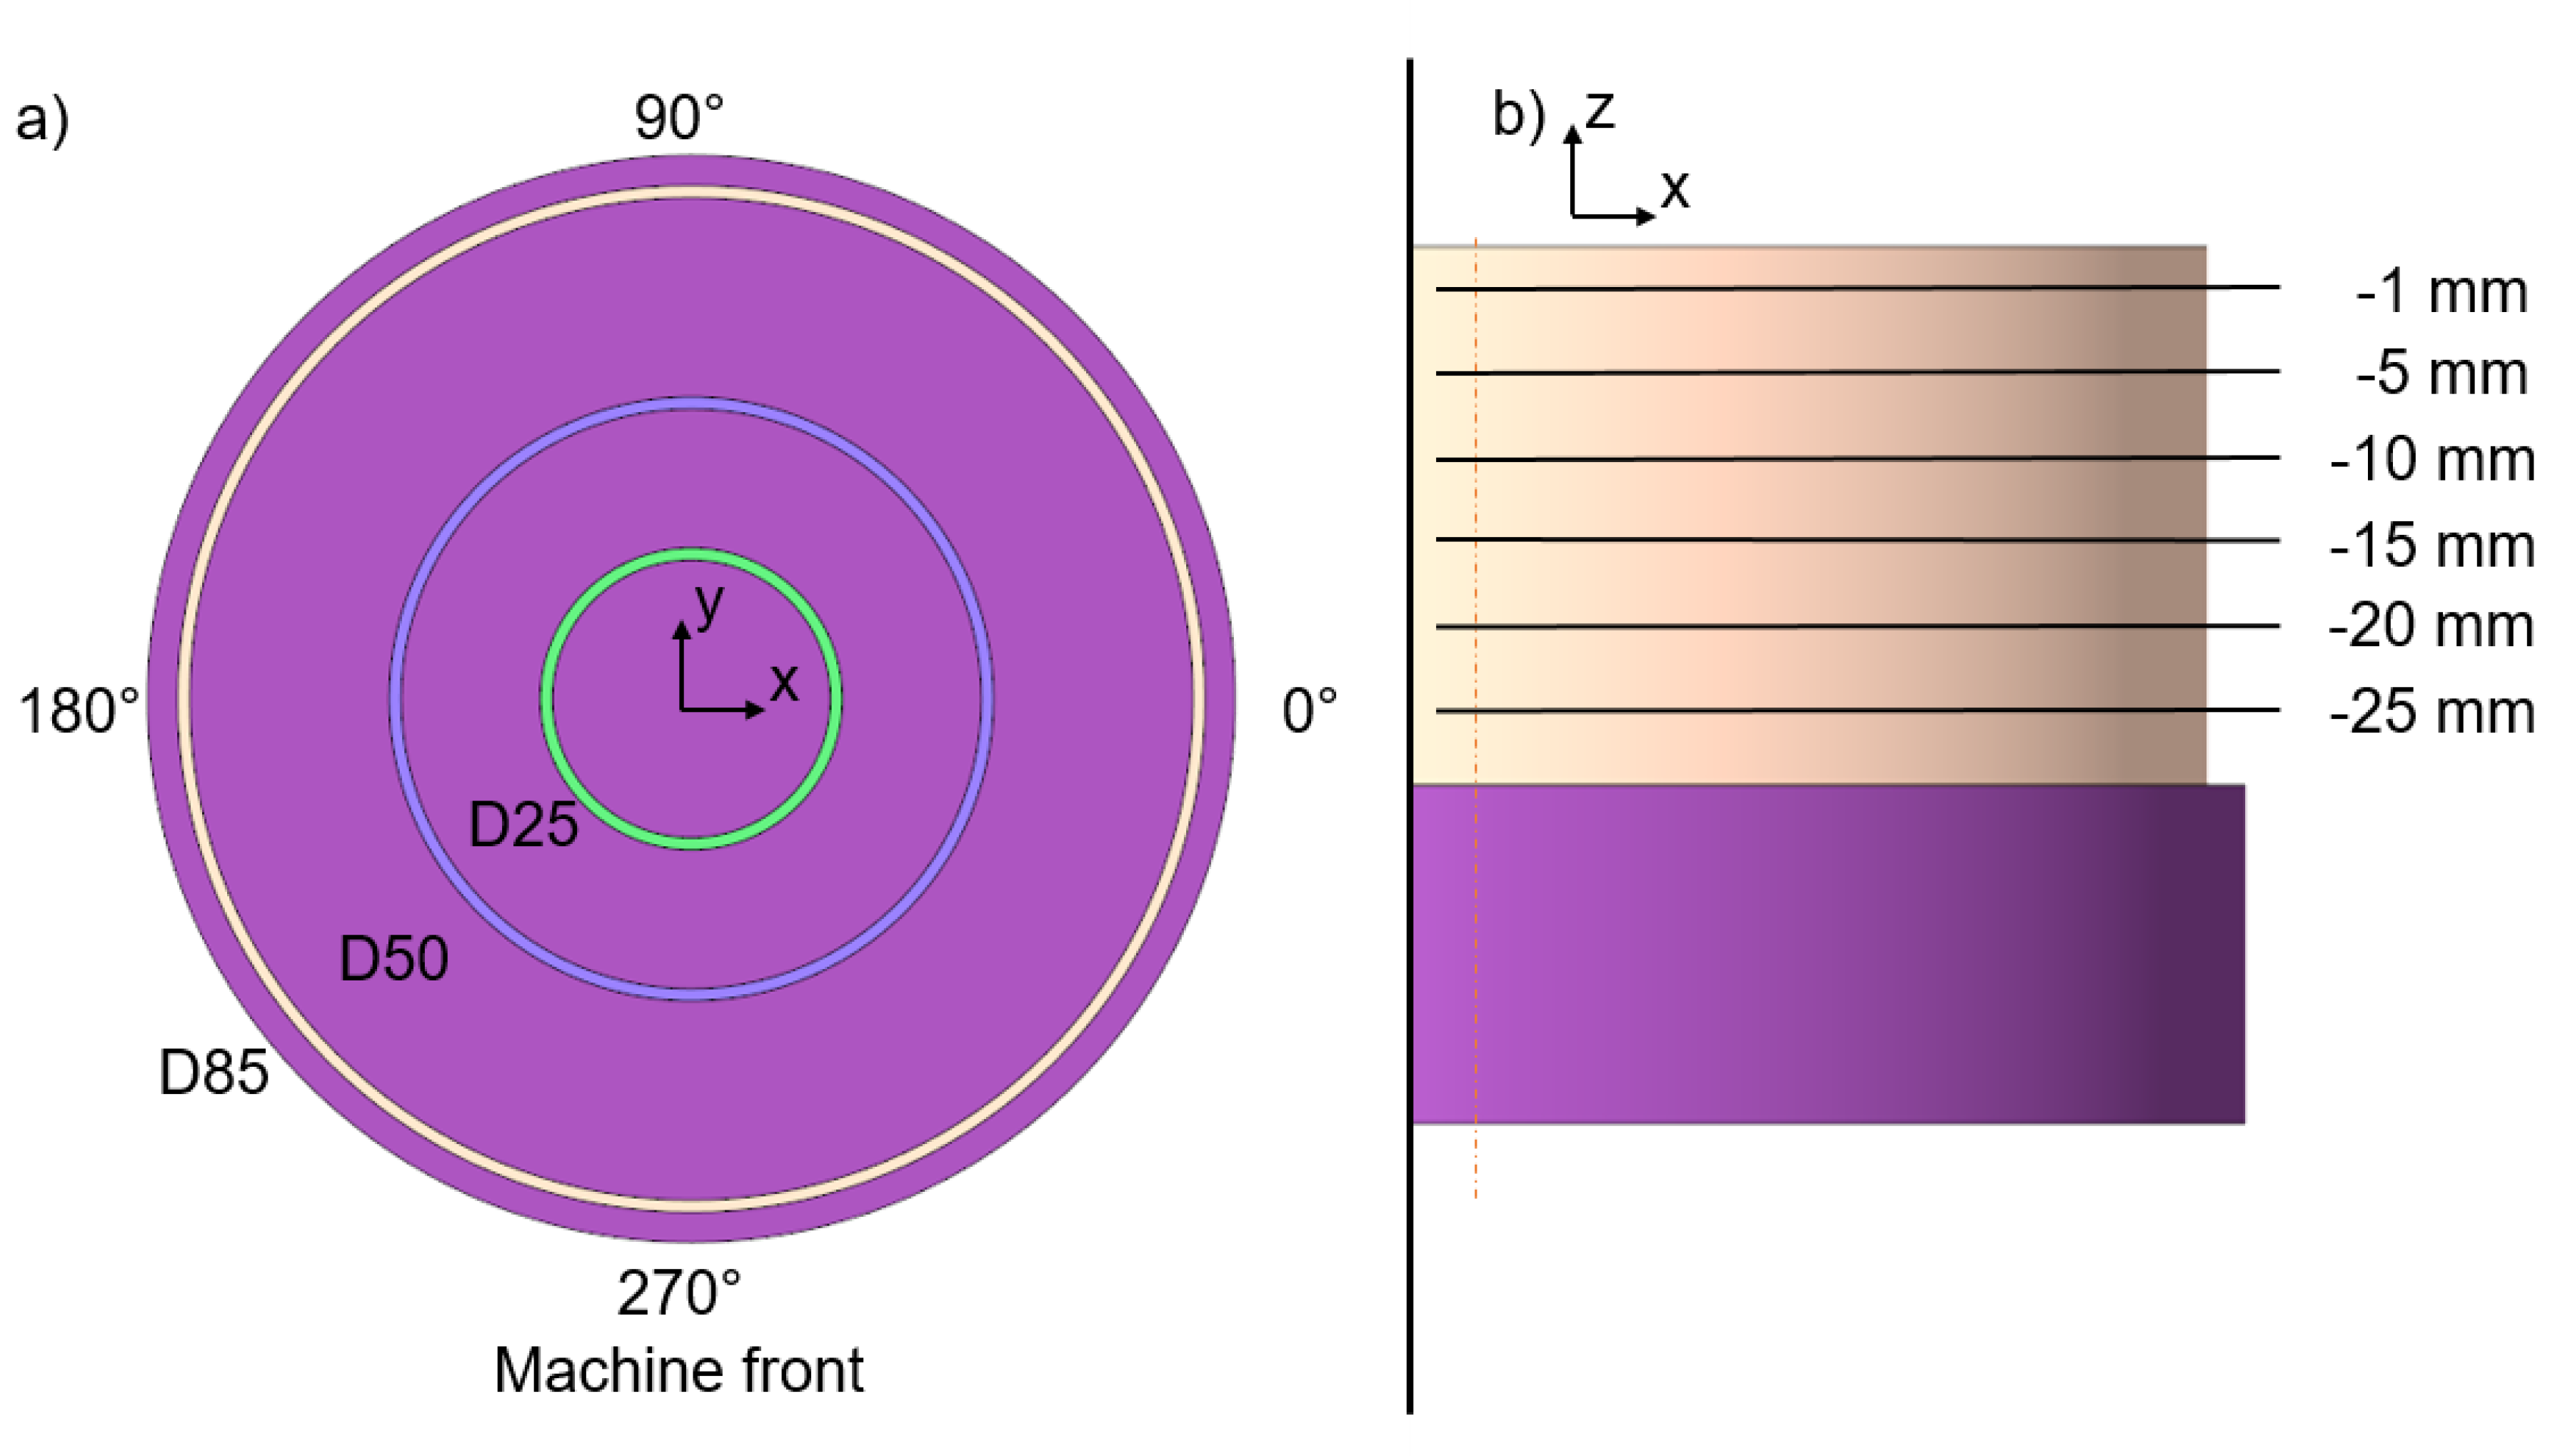
To analyze the influence of the printing strategies on the dimension accuracy thin-walled rings with diameters of 85 mm (D85), 50 mm (D50) and 25 mm (D25), with a thickness of 1 mm and a height of 30 mm were produced. To avoid varying mechanical properties with different positioning, all samples were aligned in the same manner and positioned in the center of the build plate, Figure 2. The specimens were connected to the base plate with solid supports during the printing process. This solid connection was chosen to ensure a good heat transfer during the process and to avoid localized heat accumulation. To avoid heat input and possible deformations during the subsequent cutting procedure, the specimens were carefully separated with a cutting disc form the base plate. The specimens were fabricated from the tool steel (X40CrMoV5 1, 1.2344, H13), Table 1. The characteristics of this material are a high tensile strength and resistance to thermal fatigue. Due to these properties, the material is commonly used in tooling applications, e.g., for injection molds.

2.3. Manufacturing Conditions

A SLM 280HL metal printing machine (SLM Solutions Group AG, Lübeck, Germany) was utilized for the fabrication of the specimens. The machine has an available build space of 280 × 280 × 350 mm and is equipped with a 400 W YLR fiber laser with a spot size between 70 and 80 μm. Argon was used as the inert gas. The volume-based energy density E V (J/mm3) depends on the following variables: P L (W) is the laser power, v s (mm/s) is the scan speed, h s (mm) is the hatch distance and l z (mm) is the layer thickness [23]. The printing parameters were kept constant for all specimens, Table 2.
E v = P L v s * h s * l z

2.4. Experiments

The methods for verifying dimensional accuracy were the measurement of residual stresses and the tactile measurement of geometry.
To discuss the feasibility of performing X-ray diffraction (XRD) measurements to determine the residual stresses, it has to be determined whether a characteristic phase in the present microstructure can be measured and separated from different phases in this material. Therefore, XRD for phase analysis was performed using Copper K- α radiation on a Bruker Advance instrument featuring a VÅNTEC—500 two-dimensional detector on the D25 specimen produced via the stripe strategy. The sample was measured at two positions: one chosen centrally and one 5 mm away from this in the positive z-direction. The samples were oscillated during the measurements, resulting in an effective sample volume of 2.5 × 0.5 mm. Both measurements showed no qualitative differences from each other and were accumulated. To measure the dimensional accuracy, a coordinate measuring machine type Zeiss DuraMax RT was employed. The tolerances of the machine at room temperature for the size of the specimen are specified with 2.9 μm and lead to a good result in the analysis of the samples. For the measurements, six planes in the z-axis were defined, Figure 2. The validation of the dimensional accuracy, the circularity and the deviation in diameter were analyzed. These two values were selected because they are well comparable. The circularity C (mm) is the difference between the maximum radius R m a x (mm) and the minimum radius R m i n (mm) on the measuring plane.
C = R m a x R m i n
The deviation of the diameter Δ D (mm) and the radius Δ R (mm) are calculated as:
Δ D = D m a x D n o m i n a l
Δ R = R m a x R n o m i n a l
They represent the difference of the maximal value of the diameter D m a x (mm) or radius R m a x (mm) and the nominal diameter D n o m i n a l (mm) or radius R n o m i n a l (mm).

3. Results and Discussion

To determine process parameters, the preliminary tests leading to the parameters are presented.

3.1. Preliminary Research

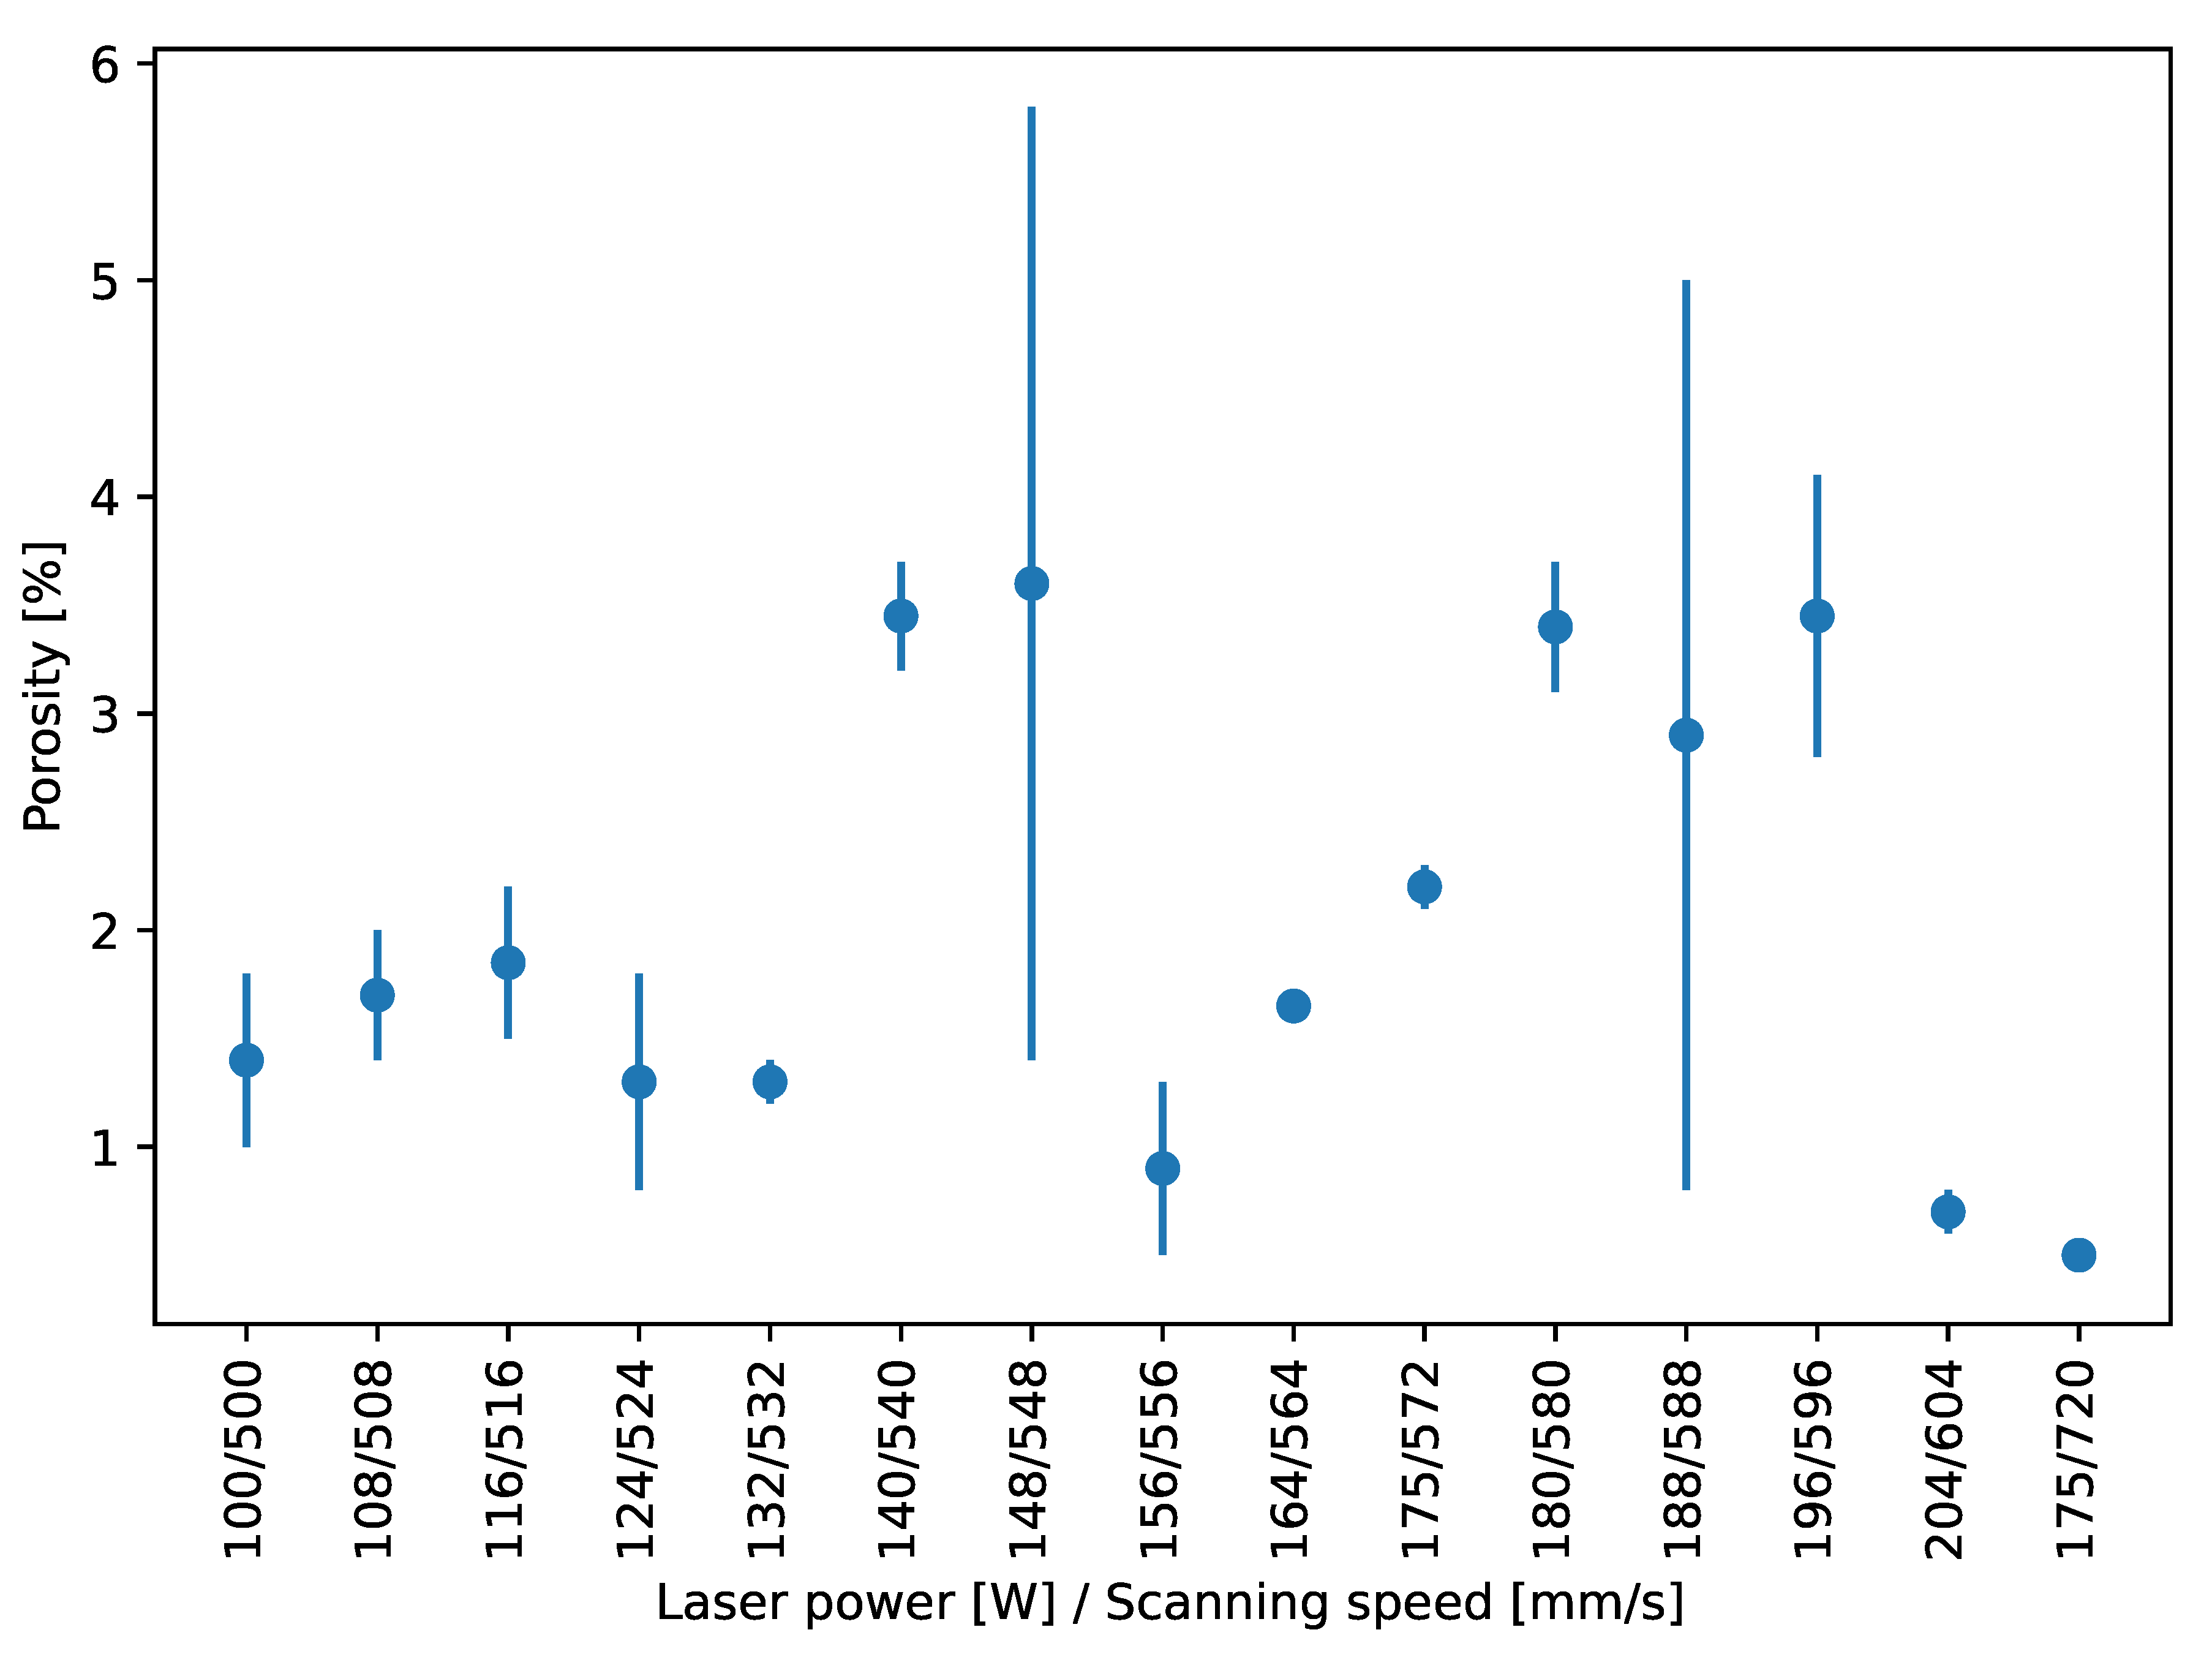
A parameter study was conducted to determine the effects of laser power and scan speed on porosity. Three samples each were printed with the laser power and scan speed combinations and the relative density was measured with Archimedes method, Figure 3. The study shows that some parameter combinations have high standard deviation (e.g., 148 W/548 mm/s); the others show almost no standard deviation from the nominal value. The highest relative density of 99.5% as well as minimum standard deviation was measured for the combination of 175 W laser power and 720 mm/s scan speed.
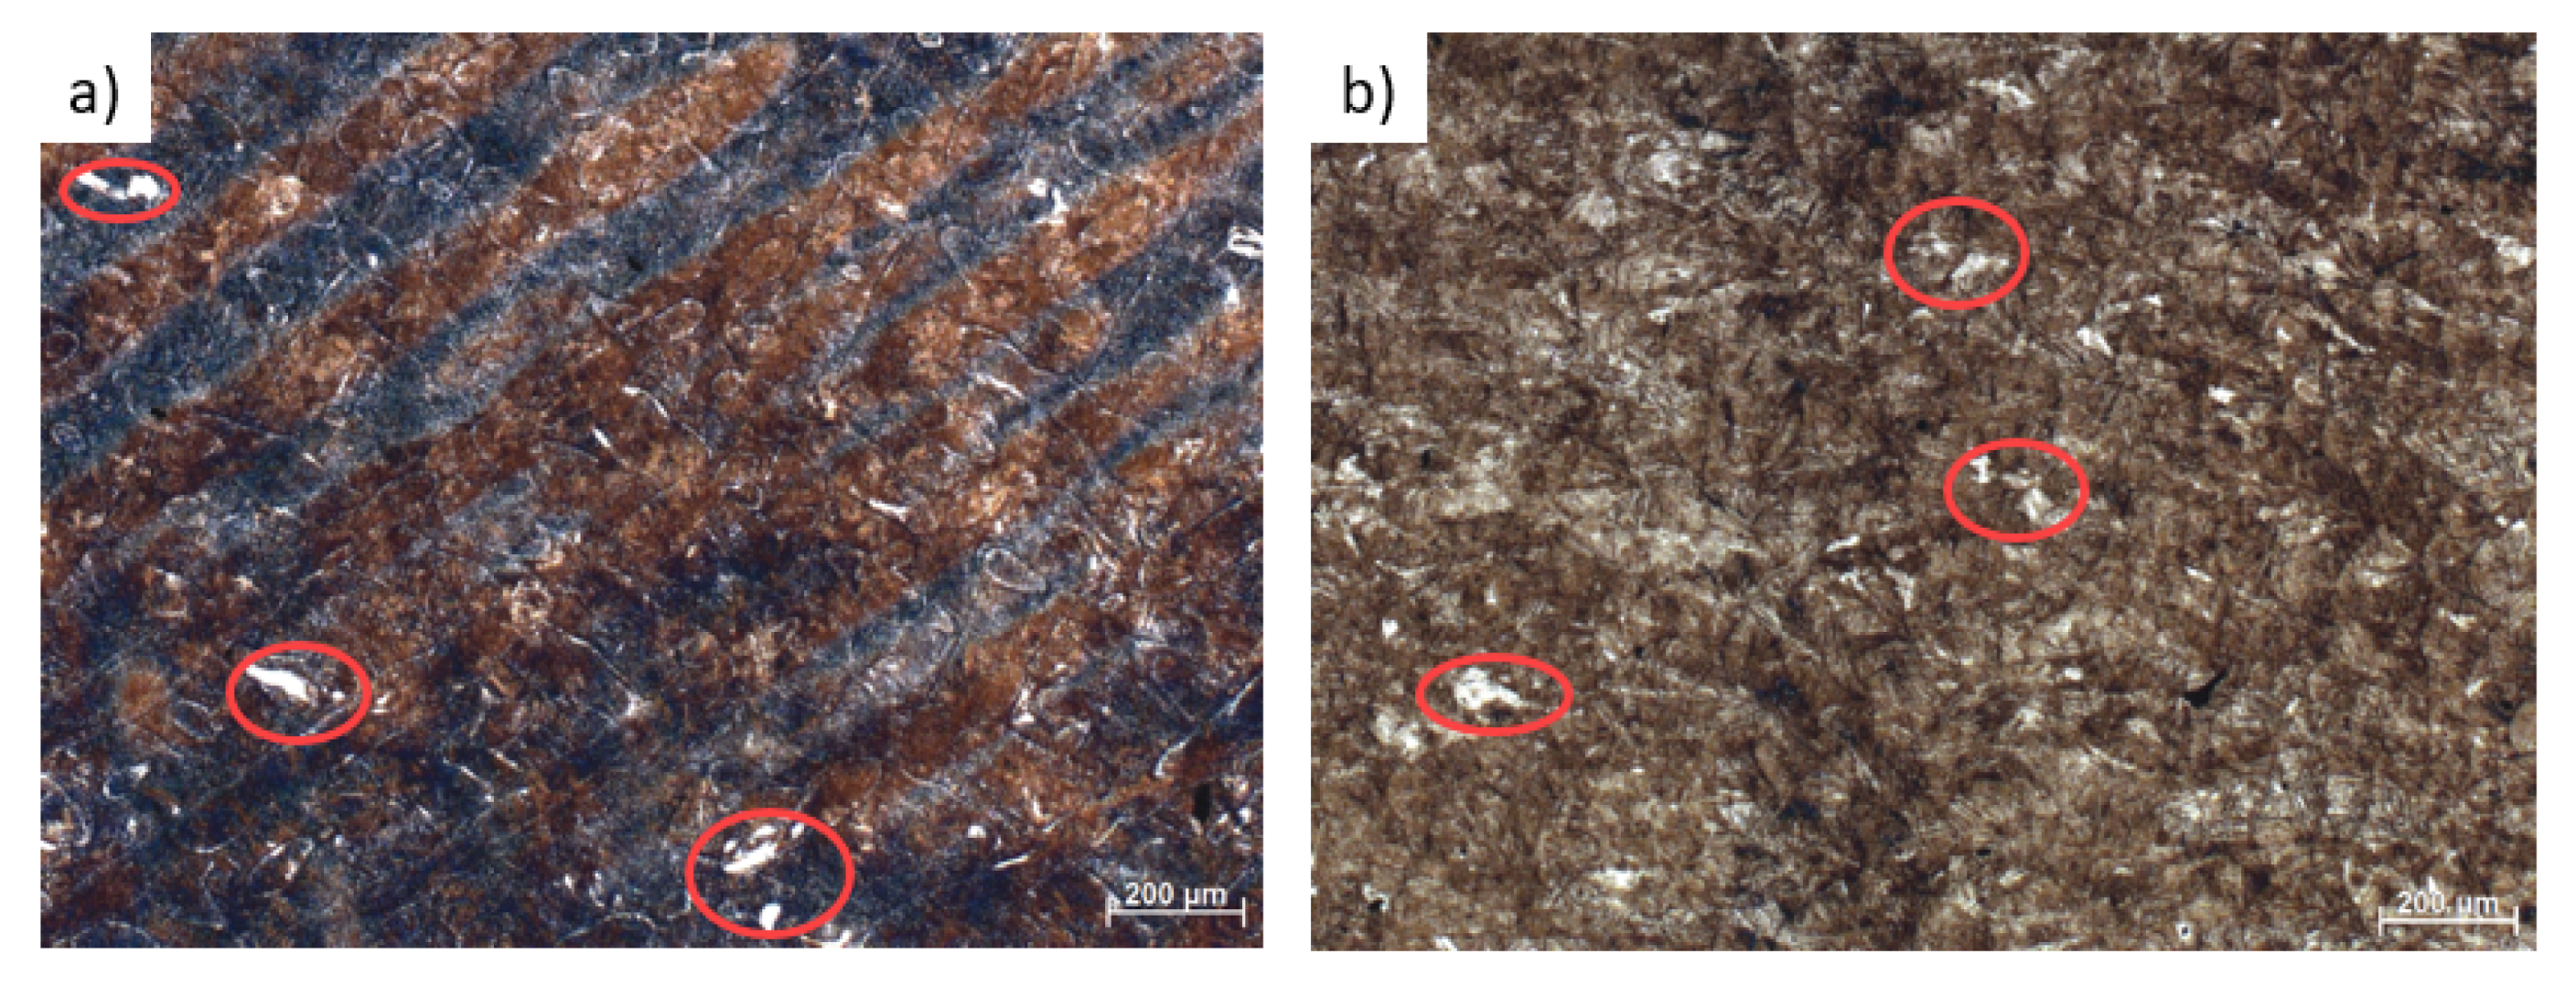
The mechanical properties were tested in destructive tensile tests on round tensile specimens DIN 50125 – A4 × 20 at 200 °C, Table 3. The angle describes the relative position on the substrate plate to the building direction (0°: in z-direction, 90 : parallel to z-direction). The resulting microstructure of additive manufactured H13 tool steel, after processing with the Adler solution, shows a strongly pronounced martensitic structure (brown, acicular texture), which due to rapid cooling and volume change have a low residual austenite content (white spots), Figure 4. The fatigue behavior of additively printed 1.2344 tool steel and the impact of surface conditions were examined [24].

3.2. Residual Stresses

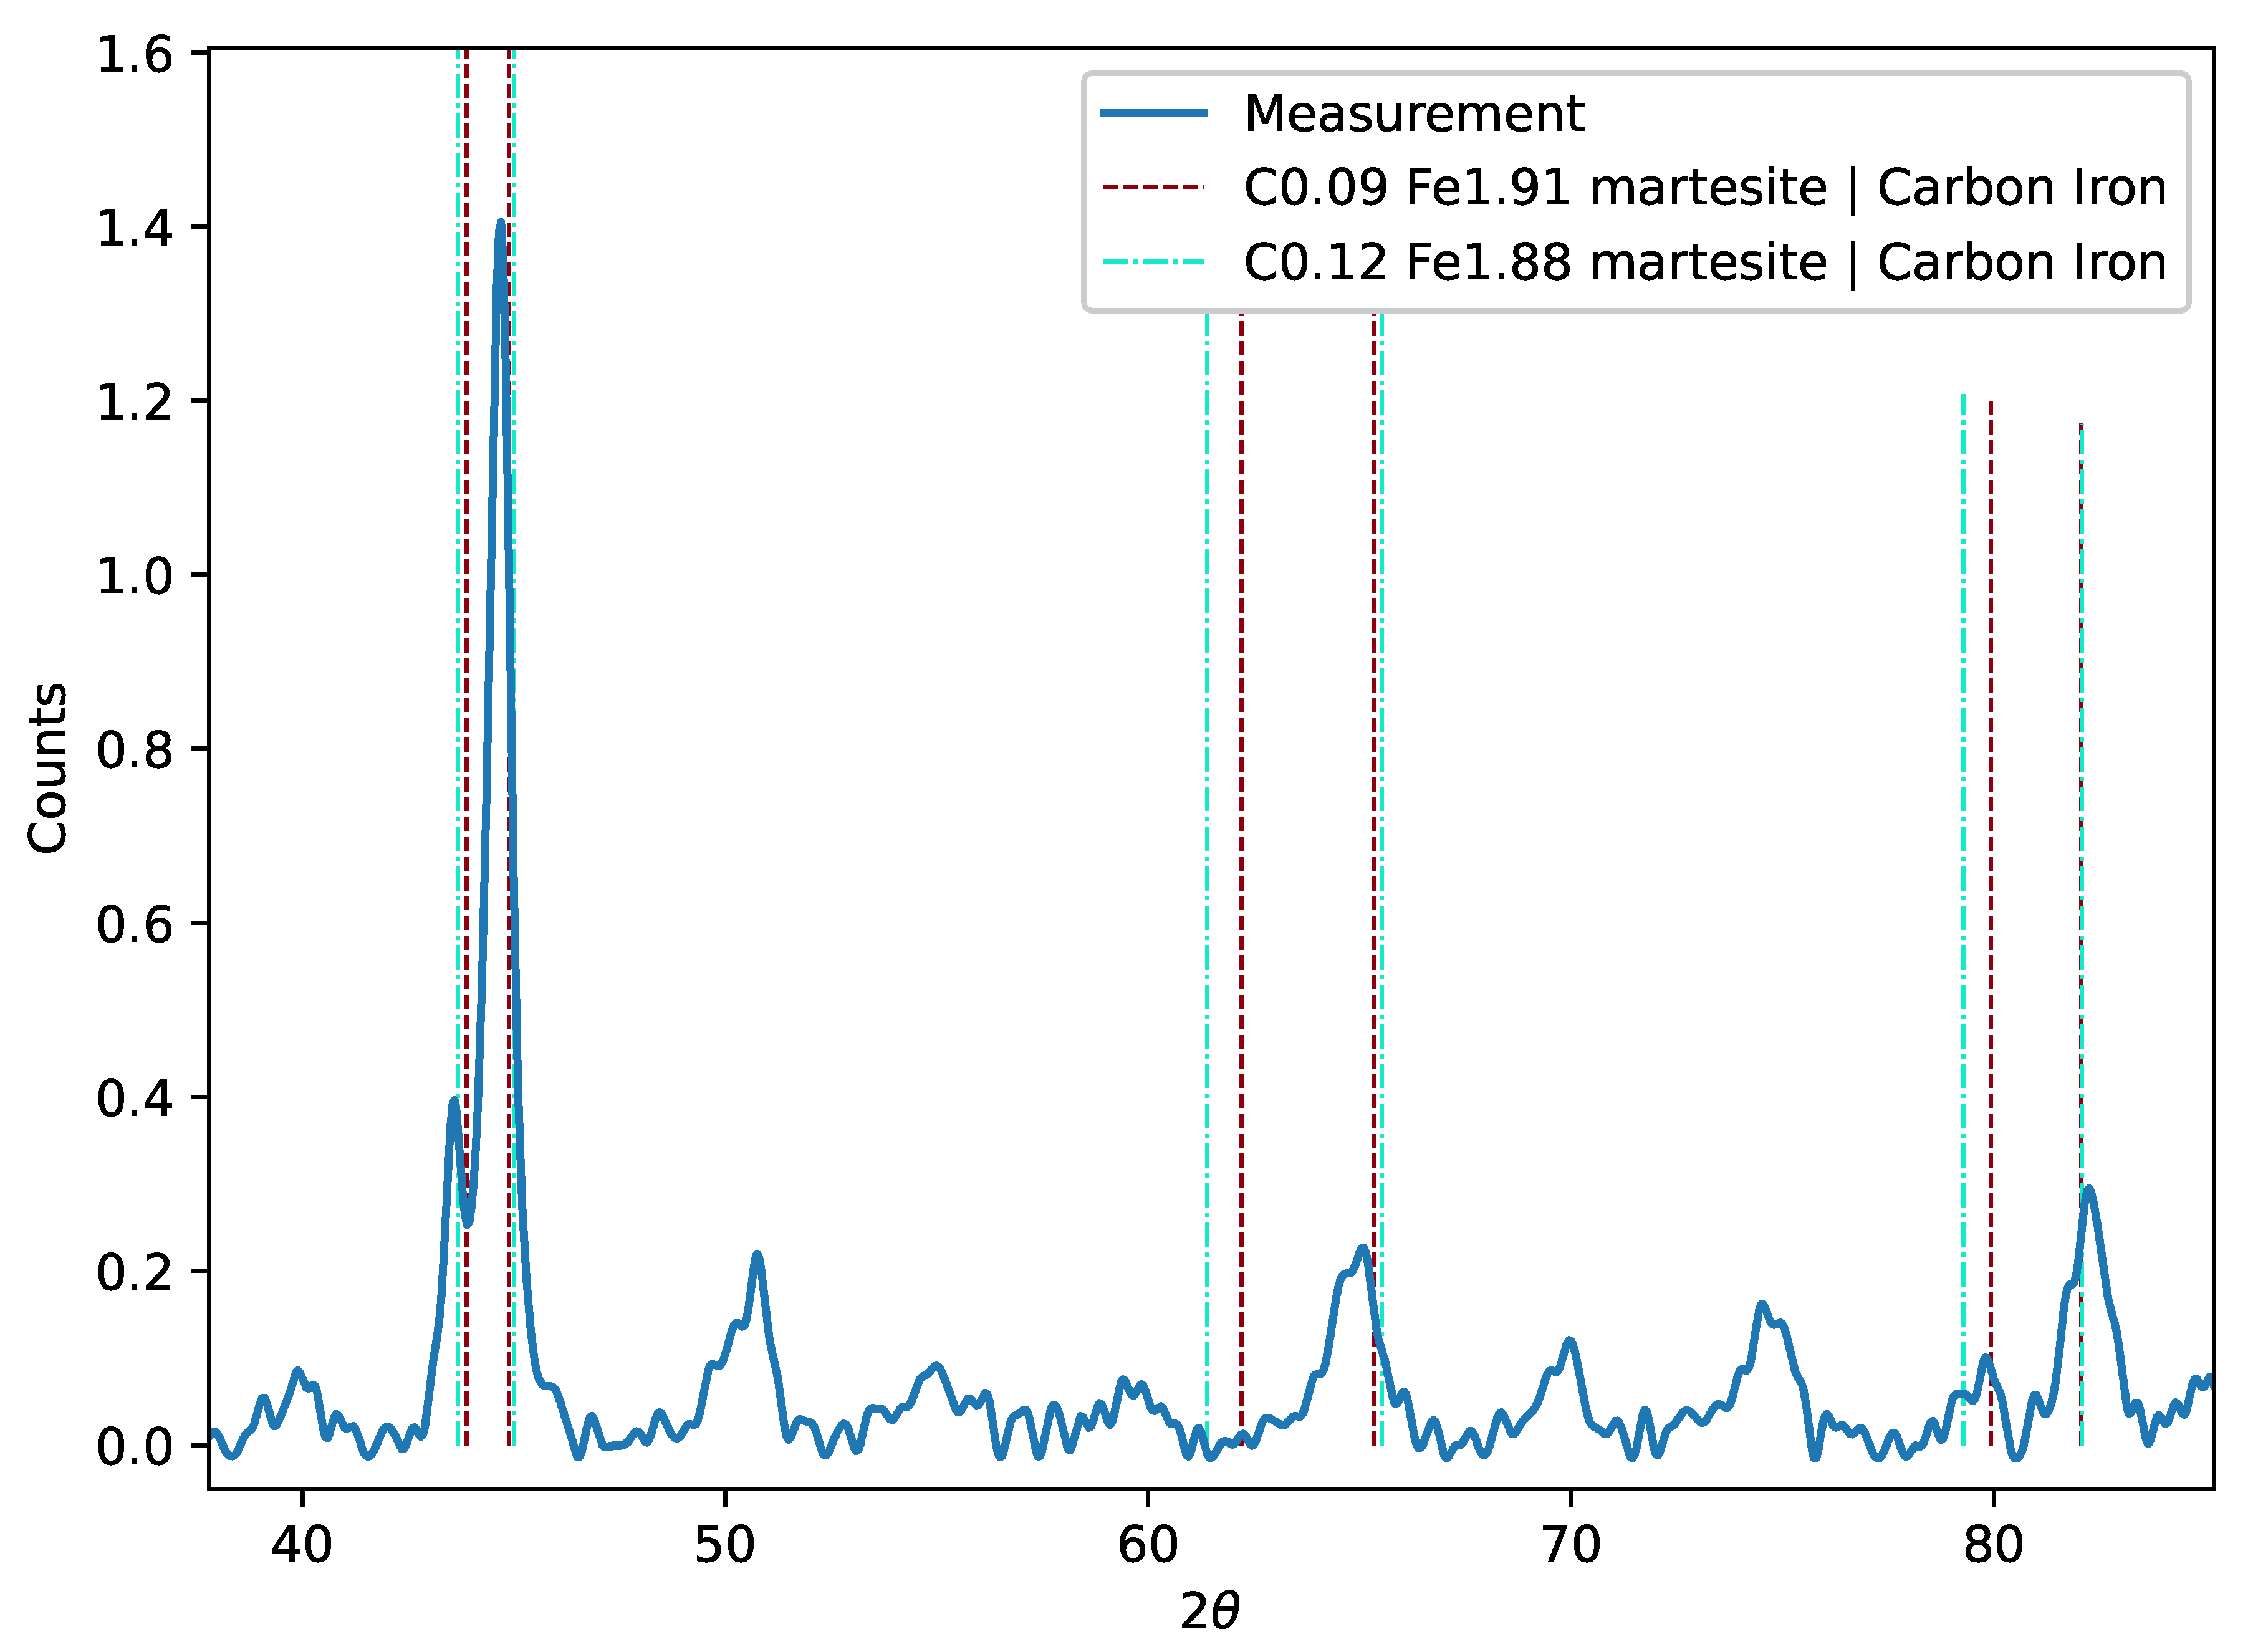
The absence of qualitative differences in this region suggested against a scenario in which tempering over the height led to a shrinkage of martensite, which otherwise might explain some geometry changes in the specimens. Broadened peaks and the abundance of possible phases in this material hindered a complete phase analysis, Figure 5. Residual stresses, which can influence the geometry of Laser-Powder Bed Fusion specimens, were analyzed. Phases that have an influence on residual stress measurements on ferrite (e.g., utilizing the {310} or the {211} reflection) and can cause a detectable reflection in the measuring range were attributed. One type of phase that, due to its crystallographic similarity, can strongly overlap with ferrite peaks is tetragonal martensite. Residual stresses during the LPBF process can cause the stress-induced formation of tetragonal martensite, resulting in strong textures. Depending on martensite texture, additional peaks occur close to all ferrite peaks, which cannot always be discerned from it, resulting in direction-dependent additional peak shifts, which cannot easily be quantified. The feature at 79.6 can be explained by tetragonal martensite, e.g., by variants with a crystal structure similar to C0.09 Fe1.91 martensite or C0.12 Fe1.88 martensite from the ICDD database. The missing peak at 61.6 can be attributed to texture. Both martensite phases have their respective 301-reflections close to the {310}-ferrite peak with a low lattice misfit (0.13% and 0.11%, respectively). The possibility of different XRD studies for residual stress determination focusing on the austenite phase promises to discern the austenitic phase from martensitic ones. However, such studies are expected to be biased towards smaller stresses due to strain-induced phase transformation of mechanically loaded austenite grains.

3.3. Tactile Measurements

Comparing the results for dimensional accuracy before and after the separation of the building plate, as well as with the different scan strategies, the sample showed similar behavior for all diameters. Therefore, the diagrams for the sample, D85, of the outer radius are shown for the following analysis, Figure 6Figure 7. They show the shape of the rings on the six measuring planes and the nominal dimension.
The dimensional accuracy of the stripe strategy before separation showed that all deviations are larger than the nominal size of the radius, which resulted in the sample being larger than expected, Figure 6. The biggest deviation of the radius was 0.438 mm in the highest plane z = –1 mm. The deviations also increased with the increasing height of the plane. This led to the result that the samples revealed a concave outer surface. Besides, the specimen exhibited an elliptical shape on the base plate, with the biggest deviations present in the top measuring plane. Considering the shape of the graph and the position of the maximum deviations, an elliptical characteristic was identified. The characteristic of the ellipse and thus, the deviation decreases in the direction of the base plate with a circularity of 0.104 mm was observed. The cause for this is the increased stiffness of the sample due to the fixed connection to the base plate and their contribution, resulting in fewer deformations. The same specimen after separation showed a change in shape with a clear formation of the ellipse, Figure 6. The circularity changed from 0.104 to 0.131 mm and the deviation of the radius was increased from 0.438 to 0.455 mm.
Before separation, the specimen fabricated with sectional strategy showed a positive deviation and a larger radius than the nominal dimensions, similar to the stripe strategy, Figure 7. The maximum deviation of the radius was improved from 0.438 to 0.252 mm in the highest plane z = –1 mm. All other planes had similar deviations close to 0.077 mm. This showed a significant improvement in the curvature of the outer surface. In addition, the roundness improved to a value of 0.088 mm. After separation, the specimen D85 also showed a slight deformation in the range between 270 and 0 , Figure 7. The deformation led to a circularity from 0.152 to 0.165 mm. The deformations behaved similarly across all the specimens, with the measuring planes still lying on top of each other.
Comparing the deviations of diameters for all specimen, two things were visible immediately: the deviations on the inside were smaller than on the outside and the stripe strategy resulted in a higher deviation than the sectional strategy in both cases before and after separation, Figure 8. Considering the relative deviation of the stripe scan strategy, the D85 sample had the lowest deviation with 1.02% and D25 had the highest with 1.40%. The relative deviation of D50 with 1.34% was approximately equal to that of the D25 sample. In comparison to the stripe strategy, the sectional strategy generated a lower relative deviation in the D25 sample (0.68%). This resulted in a relative improvement of about 81% in favor of the sectional scan strategy.

3.4. Causes of Errors in 3D Printing

In summary, the deviations of the specimens could be classified into three errors: oversize, concave outer surface and elliptical shape.

3.4.1. Oversize

During the process, the metal powder is melted and solidifies as a scan track. When the melt solidifies and phase transition occurs, the scan track shrinks, followed by further shrinking during cool down. In addition, various phase transformations in the solid occur during rapid cooldown. The quenching-like cooling promotes the creation of tetragonal and cubic martensite. In addition, residual stresses promote the stress-induced transformation of austenite to martensite. Tetragonal martensite and significant residual stresses (observable from the corresponding peaks and peak broadenings, Figure 5) are both verified within the present thin structures and indicate fast cooling during the Laser-Powder Bed Fusion process. Both tempering of tetragonal martensite and annealing of plastically deformed material are microscopic effects at elevated temperatures that, along with the present residual stresses, can further affect the dimensional accuracies.
These phase transformations are driven by rapid quenching and/or stress-induced and allow plastic deformation to occur. With the present residual stresses in the considered top layer being tension residual stresses, any occurring deformation promotes deviations to larger diameters as it can be seen in Figure 6a and Figure 7a that the measured value are bigger than the nominal value.

3.4.2. Concave Outer Surface

The reason for the outward curvature can be described by the two following causes. During the cool down of the component, several layers shrink. Because of the fixed connection in the area of the building plate, the contraction is suppressed [25]. Thus, the first layers are defined with the dimension of the component geometry. With increasing height, the influence of the stiffness of the building plate decreases, and the layer is only supported by the underlying layers [26]. By generating the next layer, the underlying layer already shrunk. The current layer is melted with the nominal size, shrinks, and causes the layer underneath to contract further. With increasing layers, the shrinkage decreases until the last layer, which is only influenced by its shrinkage (Figure 6a and Figure 7a: the lower layers are closer to the nominal values than the higher layers).
The second cause is temperature-dependent material behavior. According to the temperature profile during the process, the layers near the building plate, as well as the last layers, cool down faster. Taking the time-temperature-transformation diagram of the H13 into account, a martensitic microstructure is formed, which could lead to an increase in the volume of up to 4% [16,26]. These two causes are leading to a concave surface during the process.

3.4.3. Elliptical Shape

The characteristic of the elliptical shape is mainly caused by residual stresses and temperature-dependent material behavior. During the process, the samples are fixed in the lower area by the building plate. After separation, the residual stresses are reduced by the deformation of the specimens (Figure 6b and Figure 7b). Another reason for the elliptical shape is the anisotropic properties of the material, caused by the layer-wise generation in the Laser-Powder Bed Fusion process. Because of the direction-dependent stiffness, it can lead to the shape of an ellipse during the process [27].

4. Conclusions

Two topics were discussed, the general result of the stripe strategy and the comparison with the sectional strategy. For thin-walled parts, the standard stripe scan strategy led to large deviations. X-ray diffraction results showed a formation of tetragonal martensite in these thin-walled specimens, which had no significant height dependence, which speaks against martensite shrinkage due to tempering processes. This led to a difficulty to quantify signal contributions to X-ray diffraction measurements of residual stresses. However, concerning dimensional accuracy, the investigation of the sectional strategy showed significantly better results with concern to the concavity of the outer surface and improvement of the diameter deviation of up to 81% compared to the stripe strategy. To improve the dimensional accuracy, the scaling should be adjusted to thin-walled components. For this purpose, the axis specific scaling has to be adapted to other aspects, such as geometry and machine parameters.
From an application point of view, the acceptance of additive manufacturing of metal components is growing with geometric accuracy. The required accuracy for the application is already achieved for several components. With the increasing functionality of the additively manufactured components, the requirements for dimensional accuracy increase. To date, this can only be achieved within limitations and often results in the necessity of mechanical post-processing.

Author Contributions

Conceptualization, J.T., L.H., M.K. and M.M.; methodology, M.K. and M.S.; validation, J.T., L.H., M.K. and J.v.K.; formal analysis, J.T., L.H., M.K., M.S. and J.v.K.; investigations, M.K. and J.v.K.; resources, E.W. and M.M.; writing—original draft and preparation, J.T., L.H., M.K., J.v.K. and M.S.; writing—review and editing, E.W. and M.M.; visualization, J.T., M.K., J.v.K. and M.S.; supervision, E.W. and M.M.; project administration, J.T., L.H. and M.M. All authors have read and agreed to the published version of the manuscript.

Funding

This research was funded by DFG grant number 280883331.

Acknowledgments

The authors acknowledged the support of the tactile measures to Eckehard Kalhöfer, Aalen University of Applied Science.

Conflicts of Interest

The authors declare no conflict of interest.

Abbreviations

The following abbreviations are used in this manuscript:
LPBFLaser-Powder Bed Fusion
TGMTemperature Gradient Mechanism
XRDX-Ray Diffraction
ICDDInternational Centre for Diffraction Data
DFGDeutsche Forschungsgemeinschaft (German Research Foundation)

References

  1. Wohlers, T.; Campbell, R.I.; Diegel, O.; Huff, R.; Kowen, J. Wohlers Report 2020: 3D Printing and Additive Manufacturing State of the Industry; Wohlers Associates: Fort Collins, CO, USA, 2020. [Google Scholar]
  2. Hitzler, L.; Merkel, M.; Hall, W.; Öchsner, A. A Review of Metal Fabricated with Laser- and Powder-Bed Based Additive Manufacturing Techniques: Process, Nomenclature, Materials, Achievable Properties, and its Utilization in the Medical Sector. Adv. Eng. Mater. 2018, 20, 1700658. [Google Scholar] [CrossRef] [Green Version]
  3. Gan, M.X.; Wong, C.H. Practical support structures for selective laser melting. J. Mater. Process. Technol. 2016, 238, 474–484. [Google Scholar] [CrossRef]
  4. Mazur, M.; Leary, M.; McMillan, M.; Elambasseril, J.; Brandt, M. SLM additive manufacture of H13 tool steel with conformal cooling and structural lattices. Rapid Prototyp. J. 2016, 504–518. [Google Scholar] [CrossRef]
  5. Yan, C.; Hao, L.; Hussein, A.; Young, P.; Raymont, D. Advanced lightweight 316L stainless steel cellular lattice structures fabricated via selective laser melting. Mater. Des. 2014, 55, 533–541. [Google Scholar] [CrossRef] [Green Version]
  6. Tomas, J.; Schubert, T.; Bernthaler, T.; Merkel, M.; Schneider, G.; Sellmer, D. Laser sintering of tungsten carbide cutter shafts with intergrated cooling channels. In Pro-AM 2018; Nanyang Technological University: Singapore, 2018; pp. 297–302. [Google Scholar] [CrossRef]
  7. Yadroitsev, I.; Bertrand, P.; Smurov, I. Parametric analysis of the selective laser melting process. Appl. Surf. Sci. 2007, 8064–8069. [Google Scholar] [CrossRef]
  8. Lee, P.H.; Chung, H.; Lee, S.W.; Yoo, J.; Ko, J. Review: Dimensional Accuracy in Additive Manufacturing Processes. In Proceedings of the ASME 9th International Manufacturing Science and Engineering Conference—2014, Detroit, MI, USA, 9–13 June 2014; Ragai, I., Ed.; ASME: New York, NY, USA, 2014. [Google Scholar] [CrossRef]
  9. Kruth, J.P.; Deckers, J.; Yasa, E.; Wauthlé, R. Assessing and comparing influencing factors of residual stresses in selective laser melting using a novel analysis method. Proc. Inst. Mech. Eng. Part B J. Eng. Manuf. 2012, 226, 980–991. [Google Scholar] [CrossRef]
  10. Mercelis, P.; Kruth, J.P. Residual stresses in selective laser sintering and selective laser melting. Rapid Prototyp. J. 2006, 254–265. [Google Scholar] [CrossRef]
  11. Alkahari, M.R.; Furumoto, T.; Ueda, T.; Hosokawa, A.; Tanaka, R.; Abdul Aziz, M.S. Thermal Conductivity of Metal Powder and Consolidated Material Fabricated via Selective Laser Melting. Key Eng. Mater. 2012, 523–524, 244–249. [Google Scholar] [CrossRef] [Green Version]
  12. Eigenmann, B.; Macherauch, E. Röntgenographische Untersuchung von Spannungszuständen in Werkstoffen. Mater. Und Werkst. 1995, 148–160. [Google Scholar] [CrossRef]
  13. Ali, H.; Ghadbeigi, H.; Mumtaz, K. Effect of scanning strategies on residual stress and mechanical properties of Selective Laser Melted Ti6Al4V. Mater. Sci. Eng. A 2018, 175–187. [Google Scholar] [CrossRef]
  14. Kruth, J.P.; Froyen, L.; van Vaerenbergh, J.; Mercelis, P.; Rombouts, M.; Lauwers, B. Selective laser melting of iron-based powder. J. Mater. Process. Technol. 2004, 616–622. [Google Scholar] [CrossRef]
  15. Berger, U.; Merkel, M.; Liebisch, A. The Influence of Preheating on Laser Beam Melting. In Pro-AM 2016; Research Publishing: Singapore, 2016; pp. 306–311. [Google Scholar]
  16. Mertens, R.; Vrancken, B.; Holmstock, N.; Kinds, Y.; Kruth, J.P.; van Humbeeck, J. Influence of Powder Bed Preheating on Microstructure and Mechanical Properties of H13 Tool Steel SLM Parts. Phys. Procedia 2016, 882–890. [Google Scholar] [CrossRef] [Green Version]
  17. Zhang, K.; Wang, S.; Liu, W.; Long, R. Effects of substrate preheating on the thin-wall part built by laser metal deposition shaping. Appl. Surf. Sci. 2014, 839–855. [Google Scholar] [CrossRef]
  18. VDI-2221. Blatt 2. VDI-Gesellschaft Entwicklung Konstruktion Vertrieb. Methodik zum Entwickeln und Konstruieren technischer Systeme und Produkte Qualifizierung Qualitätssicherung und Nachbearbeitung, Mai; VDI-Verlag: Berlin/Heidelberg, Germany, 1993. [Google Scholar]
  19. Cheng, B.; Shrestha, S.; Chou, K. Stress and deformation evaluations of scanning strategy effect in selective laser melting. Addit. Manuf. 2016, 12, 240–251. [Google Scholar] [CrossRef]
  20. Dunbar, A.; Denlinger, E.; Heigel, J.; Michaleris, P.; Guerrier, P.; Martukanitz, R.; Simpson, T. Development of experimental method for in situ distortion and temperature measurements during the laser powder bed fusion additive manufacturing process. Addit. Manuf. 2016, 12, 25–30. [Google Scholar] [CrossRef]
  21. Yu, W.; Sing, S.L.; Chua, C.K.; Tian, X. Influence of re-melting on surface roughness and porosity of AlSi10Mg parts fabricated by selective laser melting. J. Alloys Compd. 2019, 792, 574–581. [Google Scholar] [CrossRef]
  22. Yadroitsev, I.; Thivillon, L.; Bertrand, P.; Smurov, I. Strategy of manufacturing components with designed internal structure by selective laser melting of metallic powder. Appl. Surf. Sci. 2007, 254, 980–983. [Google Scholar] [CrossRef]
  23. VDI-3405. Blatt 2 VDI-Gesellschaft Produktion und Logistik (GPL)—Additive Fertigungsverfahren Strahlschmelzen Metallischer Bauteile; Verlag des Vereins Deutscher Ingenieure: Düsseldorf, Germany, August 2013. [Google Scholar]
  24. Steinhauser, M.; Sert, E.; Hitzler, L.; Öchsner, A.; Merkel, M. Fatigue Behavior of the Additively Manufactured Tool Steel H13 after Surface Treatment using Different Post-Processing Methods. Pract. Metallogr. 2020, 57, 140–167. [Google Scholar] [CrossRef]
  25. Meiners, W. Direktes Selektives Laser Sintern Einkomponentiger Metallischer Werkstoffe. Ph.D. Thesis, RWTH Aachen University, Aachen, Germany, 15 April 1999. [Google Scholar]
  26. Gu, D.D.; Meiners, W.; Wissenbach, K.; Poprawe, R. Laser additive manufacturing of metallic components: Materials, processes and mechanisms. Int. Mater. Rev. 2012, 133–164. [Google Scholar] [CrossRef]
  27. Hitzler, L.; Hirsch, J.; Heine, B.; Merkel, M.; Hall, W.; Öchsner, A. On the Anisotropic Mechanical Properties of Selective Laser-Melted Stainless Steel. Materials 2017, 10, 1136. [Google Scholar] [CrossRef] [PubMed] [Green Version]
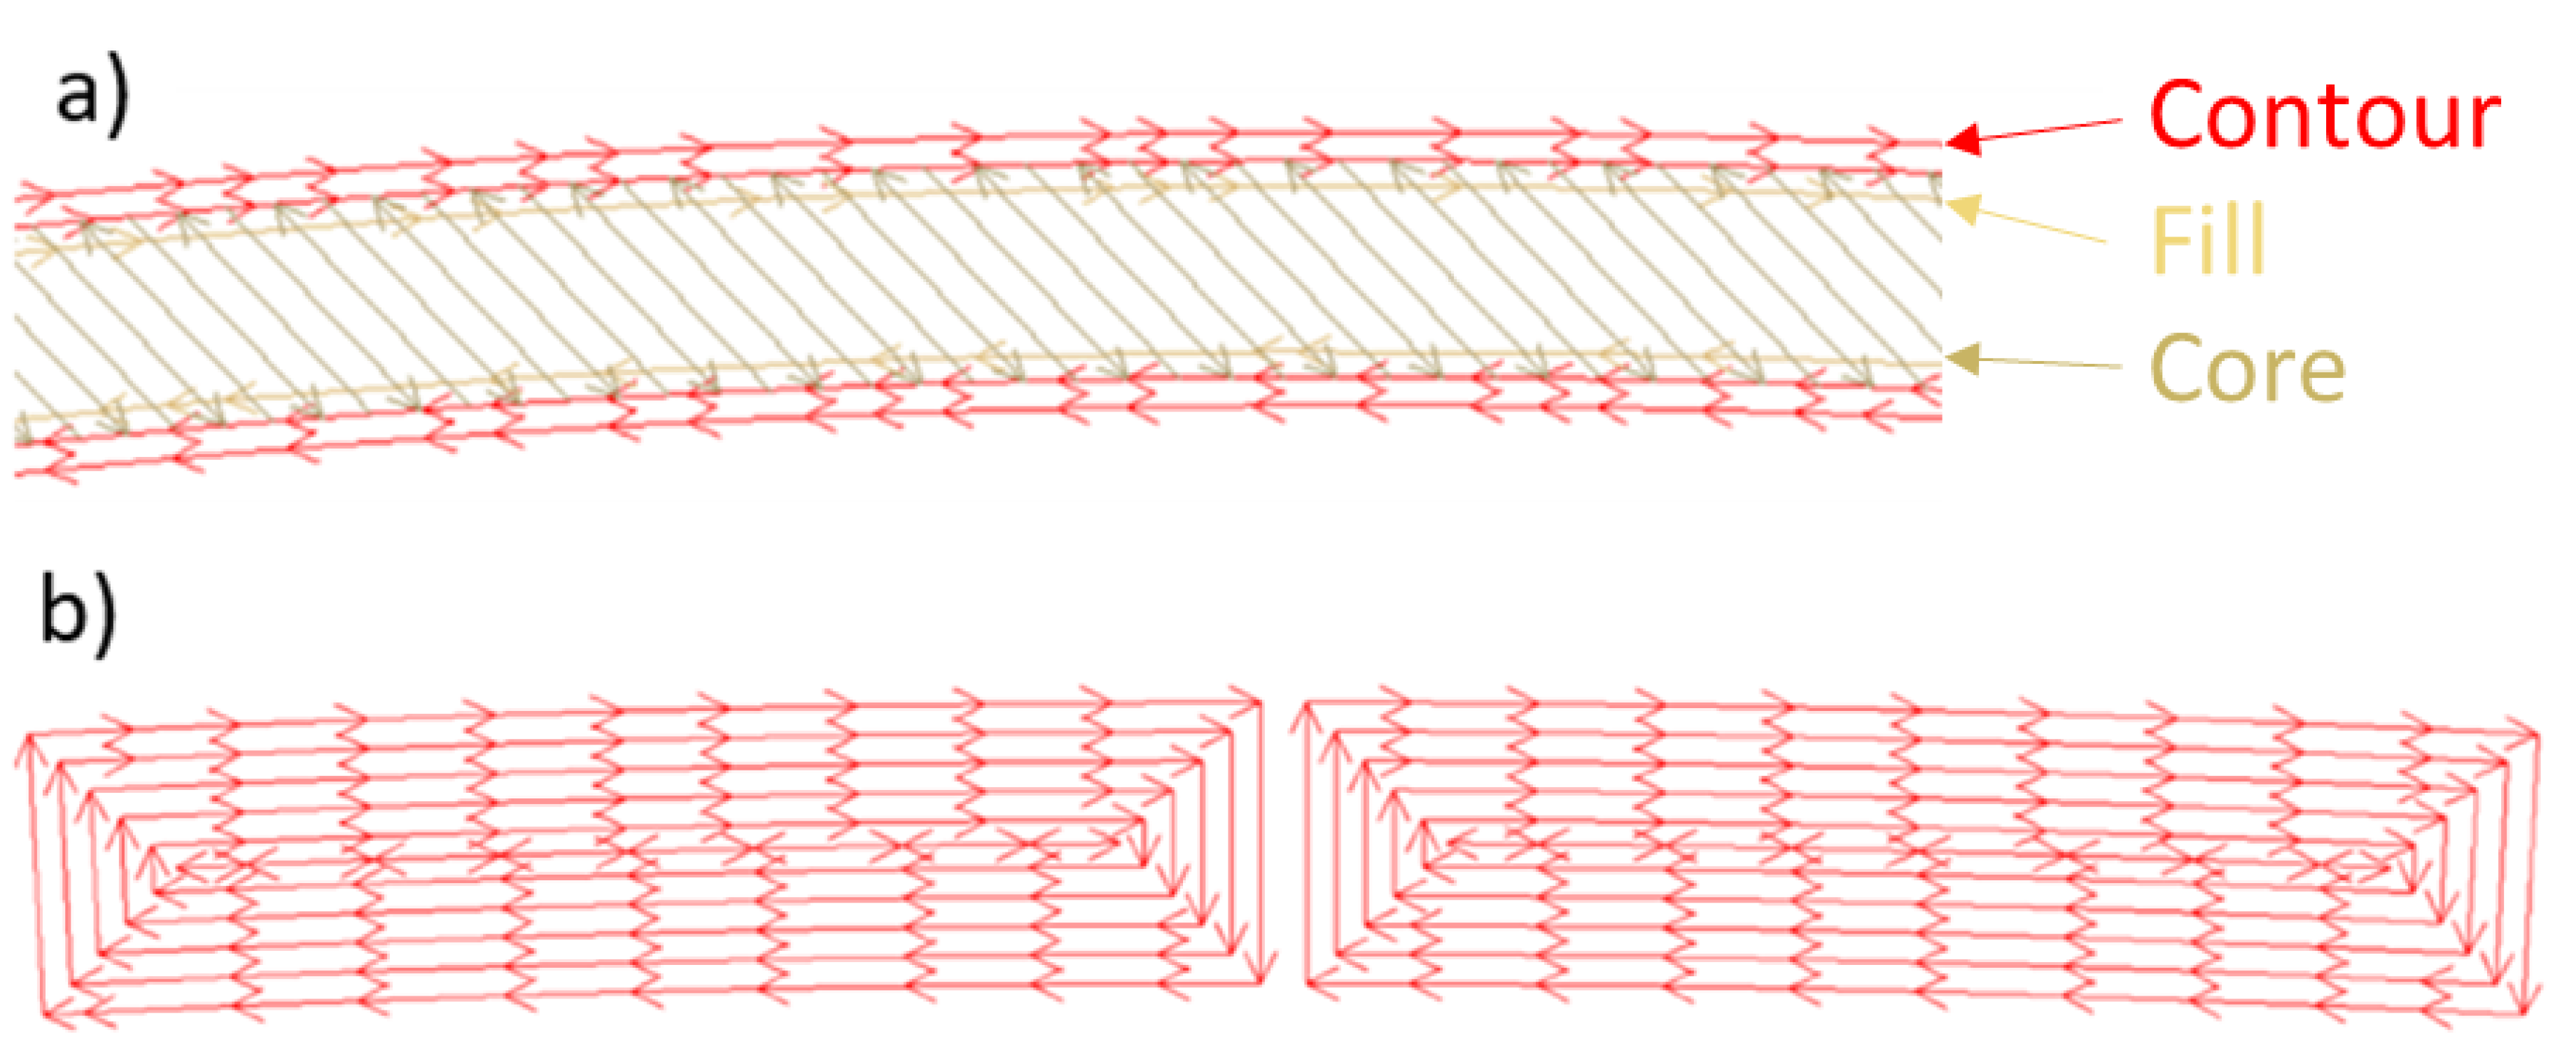
Figure 1. Magnified views of ring section to illustrate different irradiation strategies for laser scan paths: (a) stripes (b) sectional.
Jmmp 04 00091 g001
Figure 2. Two-dimensional views of (a) specimen position on building plate with angles and (b) dimensions for tactile measurements of distortion.
Jmmp 04 00091 g002
Figure 3. Porosity of printed H13 in dependency of laser power and scanning speed.
Jmmp 04 00091 g003
Figure 4. Microstructure of additive manufactured H13 tool steel show martensite structure with retained austenite (red circles): (a) perpendicular to built direction, (b) parallel to built direction.
Jmmp 04 00091 g004
Figure 5. Intensity over 2 θ acquired via XRD measurements from additive manufactured H13 tool steel.
Jmmp 04 00091 g005
Figure 6. Dependence of the outer radius on height and angle, measured from specimen D85 stripe strategy: (a) before and (b) after separation.
Jmmp 04 00091 g006
Figure 7. Dependence of the outer radius on height and angle, measured from specimen D85 sectional strategy: (a) before and (b) after separation.
Jmmp 04 00091 g007
Figure 8. Comparison of maximum deviations for all samples.
Jmmp 04 00091 g008
Table 1. Chemical composition of H13 tool steel metal powder, all values in percentage by weight [wt%].
FeCCrMnMoNi + CuPSSiV
Bal.0.32–0.454.75–5.500.20–0.601.10–1.750.750.030.030.80–1.250.80–1.20
Table 2. Parameters used in this work for additive manufacturing of H13 tool steel.
Laser Power [W]Scan Speed [mm/s]Hatch Distance [mm]Energy Density [J/mm3]
Contour100400 0.09 92.6
Fill150450 0.08 138.9
Core175720 0.12 67.5
Layer thickness of 30 μm
Mounting plate temperature 200 °C
Table 3. Mechanical properties of additive manufactured H13 tool steel.
Yield Strength [MPa]Tensile Strength [MPa]Elongation at Fracture [%]
As built 0 851 ± 49 1359 ± 5 1.19 ± 0.4
As built 90 551 ± 5 1235 ± 71 1.35 ± 0.16
As built 0 soft annealed 418 ± 97 675 ± 77 13.9 ± 1.2
As built 90 soft annealed 444 ± 76 697 ± 5 11.7 ± 2.5