Article

Multi-Objective Optimization of Turning Operation of Stainless Steel Using a Hybrid Whale Optimization Algorithm

by
Mahamudul Hasan Tanvir
1,
Afzal Hussain
2,
M. M. Towfiqur Rahman
2,
Sakib Ishraq
2,
Khandoker Zishan
2,
SK Tashowar Tanzim Rahul
1 and
Mohammad Ahsan Habib
2,*
1
Department of Mechanical Engineering and Management, Hamburg University of Technology (TUHH), 21071 Hamburg, Germany
2
Department of Mechanical and Production Engineering, Islamic University of Technology (IUT), Gazipur 1704, Bangladesh
*
Author to whom correspondence should be addressed.
J. Manuf. Mater. Process. 2020, 4(3), 64; https://doi.org/10.3390/jmmp4030064
Submission received: 6 June 2020 / Revised: 24 June 2020 / Accepted: 1 July 2020 / Published: 3 July 2020

Abstract

:
In manufacturing industries, selecting the appropriate cutting parameters is essential to improve the product quality. As a result, the applications of optimization techniques in metal cutting processes is vital for a quality product. Due to the complex nature of the machining processes, single objective optimization approaches have limitations, since several different and contradictory objectives must be simultaneously optimized. Multi-objective optimization method is introduced to find the optimum cutting parameters to avoid this dilemma. The main objective of this paper is to develop a multi-objective optimization algorithm using the hybrid Whale Optimization Algorithm (WOA). In order to perform the multi-objective optimization, grey analysis is integrated with the WOA algorithm. In this paper, Stainless Steel 304 is utilized for turning operation to study the effect of machining parameters such as cutting speed, feed rate and depth of cut on surface roughness, cutting forces, power, peak tool temperature, material removal rate and heat rate. The output parameters are obtained through series of simulations and experiments. Then by using this hybrid optimization algorithm the optimum machining conditions for turning operation is achieved by considering unit cost and quality of production. It is also found that with the change of output parameter weightage, the optimum cutting condition varies. In addition to that, the effects of different cutting parameters on surface roughness and power consumption are analysed.

1. Introduction

Modern day manufacturing industries operate in a demanding environment of constant competition, requiring them to focus heavily on ways in which they could improve their processes. The performance of metal removing processes, as well as the quality of the finished product greatly rely on the numerous input parameters such as cutting speed, depth of cut, feed rate, and so on [1]. It is therefore extremely important that these input parameters are chosen wisely so to ensure that the factory secures an upper hand with respect to productivity, final product quality, manufacturing costs, etc. The choice is ever more important as the cutting parameters tend to be quite extensive, since slight variations in them can lead to significant improvements in the output quality characteristics.
Relying solely on experience or machine tool manuals for choosing the input parameters does not necessarily guarantee the best selection [2]. This is because the impact of each parameter tends to depend on the particular machining environment of the production line. This justifies the need for effective optimization techniques, many of which have been proposed and demonstrated in past studies [3]. Rao and Pawar utilized optimization algorithms, namely artificial bee colony (ABC), particle swarm optimization (PSO) and simulated annealing (SA) to assess optimal cutting parameters with respect to production time (i.e., productivity) [4]. Other population-based optimization algorithms include the dragonfly algorithm and the Harmony Search algorithm that were also employed to study the relationship between cutting parameters and machining performances [5,6]. Pardo et al. used artificial neural networks in conjunction with genetic algorithm (GA) to investigate cutting parameters resulting in optimum cutting insert and cutting parameters during turning operation [7]. GA also appeared on numerous occasions in literature where it was employed to study the effects of cutting parameters on other output characteristics such as surface roughness and energy efficiency [8,9,10].
Nonetheless, optimizing machining processes in terms of a single quality measure is never adequate. Manufacturers generally have to consider the impacts of cutting parameters on several factors simultaneously [11], such as the productivity, production cost and finished product quality, while even taking into account the environmental consequences of the machining processes. The latter is mainly governed by the emissions from the machine tools during operation, which in turn depend on the energy consumption. The situation becomes more complex owing to the fact that the output quality characteristics often exist in contradicting terms; for example, increasing the material removal rate usually acts against improving surface finish [11], or that higher energy efficiency requires lower cutting speed (which means lower MRR) [12]. To overcome this issue, an effective multi-objective optimization approach is required that would take into account all the output characteristics, and their contradictions (if any) while establishing the optima of input parameters.
Dhabale et al. [13] used the genetic algorithm to solve the multi-objective problem in turning operation, whereas Prasad and Bharathi [11] demonstrated the use of a modified multi-objective genetic algorithm approach to optimize the machining parameters. Another popular approach in literature is the use of the noteworthy Grey Relational Analysis (GRA) introduced by Deng [14]. Gupta et al. [15] used GRA along with principal component analysis to optimize turning parameters with respect to MRR and surface roughness. GRA was coupled with Taguchi method by Ramu et al. [16] to investigate the optimization of cutting parameters for the turning of stainless steel, considering both surface finish as well as material removal rate. Yang and Trang [17] conveyed a multi-objective optimization scenario of turning process based on Taguchi method. They studied the effect of cutting parameters on several contradicting performance indexes such as tool life, and surface roughness. GRA computes relational coefficients for each of the multiple objective functions taken into account, and the weighted average of these coefficients generates the Grey Relational Grade (GRG). The GRG therefore represents all of the multiple output characteristics considered, hence, optimizing in terms of this grade would result in optimizing with respect to all of the objective functions considered. GRA allows different weighting factors to be assigned to each of the performance measures, as per the optimizing priority of the manufacturer.
The aim of this study is the optimization of cutting parameters for the turning process of stainless steel-304. The choice of material was made on the grounds of its extensive use in construction of automotive parts (e.g., exhaust manifolds), jet engine parts, heat exchanger and furnace parts, etc. The fabrication of many such parts involves turning operation, which is one of the most commonly used for rough cutting operations. The cutting parameters taken into account are the cutting speed, feed rate and depth of cut. The performance measures analyzed are the Material Removal Rate, peak tool temperature, heat rate, power, the cutting forces in x and y directions and surface roughness. The optimization is achieved by Grey Relational Analysis coupled with the meta-heuristic Whale Optimization Algorithm (WOA) introduced by Mirjalili and Lewis [18]. According to the knowledge of the authors, such an approach has not been used previously by researchers in this field. The reason behind this integration (as shown in Figure 1) is due to the fact that WOA can only optimize with respect to a single performance measure [18]. Therefore, the incorporation with GRA allows us to overcome the single-objective nature of WOA, and fulfil the requirement of multi-objective optimization. Further details on the hybridization of the two algorithms are provided in the following section.
Regression Modelling is employed to create analytical equations for each of the output parameters in terms of the cutting parameters. To realize this purpose, a series of experiments were done as well as simulations are performed on AdvantEdge (Third Wave System) to find the values of the output parameters for different cutting parameter combinations. This Finite Element Analysis platform, which also happens to be commercially popular, has been widely used in past studies to numerically investigate various aspects of machining processes [19,20,21,22], where it has produced results that closely agree with their experimental counterparts with satisfactory accuracy. Hence, the numerical approach is considered to be reliable, while at the same time being less laborious and time-consuming than the physical conduction of experiments. The results show anticipated trends supporting previous studies, and it is further shown that changing the weightage factors assigned to each output parameter may change the optimal combination of parameters entirely.

2. Development of the Hybrid Algorithm

The Whale Optimization Algorithm (WOA) is single-objective in nature, in contrast to the Grey Relational Analysis (GRA), which has the capacity to work with multiple output performance indexes. However, one notable disadvantage of GRA is its limited scope as it can only analyze the set of data it is provided with, unlike the WOA which has the capacity to explore and exploit the defined search area on its own to look for the optimum solution. Hence the purpose of integrating the two above mentioned approaches is to extract the sense of generality and hence greater scope from WOA, while also fulfilling the requirement of multi-objective analysis (from GRA). The modus operandi associated with such a hybridization is as follows:
The initial parameters of WOA have to be defined which include the Population Number (PN) and the Maximum Cycle Number (MCN), that marks the termination of the algorithm. Each of the parameters analyzed is also assigned upper and lower limits to represent the range in which the WOA would search for the solution. The simulations are performed based on the design of experiment generated by central composite design (CCD) in order to collect the data on the output parameters. According to fit and summary test, it is seen that quadratic models are best fits for the response variables, and it is further asserted by ANOVA test that the quadratic models are indeed significant. Mathematical models are then created for each of the output variables that represent how they respond to changes in the cutting parameters.
The Grey Relational Analysis is introduced at this point. The purpose of GRA here is to compute the Grey Relational Grade (GRG), based on the previously defined mathematical models for each of the output parameters. However, before it can do so, the empirical data have to be pre-processed. This is due to the fact that each output parameter usually has distinct units of measurements as well as defined range. Furthermore, the output parameters may have contradicting desirable levels, or in other words being either “higher-the-better” or “lower-the-better” quality characteristics. The data are hence normalized as per the equations shown in Figure 1. The grey relational coefficients are then computed as shown in Figure 1 and since each output can be assigned a different weightage factor (e.g., as per the priority of the manufacturer), the weighted average of the relational coefficients are taken to be the Grey Relational Grade.
The calculated GRG is now fed into the WOA. As the cycle starts, the location of the optimum point is not specified to the WOA initially. It assumes the position of the current best search agent to be in the vicinity of the optimum solution. Following this, the remaining search agents constantly update their respective positions in attempt to move towards the best search agent, as governed by the equations shown in Figure 1. There are two approaches for the search agents to update their positions and hunt down the optimum solution, namely spiral updating position and shrinking encircling mechanism. A spiral equation is created to govern the successive modifications of the search agent positions in order to obtain the best solution. This approach is followed when the probability of finding the best solution is greater than or equal to 50% (p ≥ 0.5). On the contrary if the probability is less than 50% (p < 0.5) and the vector co-efficient A is less than 1, the updated position of a search agent may lie anywhere in between its current position and the position of the current best search agent. As the WOA optimizes with respect to the GRG, which in turn accounts for all the output parameters considered, the requirement of multi-objective optimization is fulfilled.

3. Methodology

3.1. Design of Experiment

In this study, three different cutting parameters which are cutting speed, feed rate and depth of cut are used. Pilot experiments were performed within the working range of the lathe machine that has been used for the experiments and the results of the pilot experiments were used for deciding the levels of parameters for cutting speed, feed and depth of cut for conducting design of experiments. Similar type of cutting parameter range was previously used by other researchers in this field [23]. For all parameters, 5 levels of data are used by using central composite design (CCD) where the star point α is face centered ( α = 2 ) (Table 1).

3.2. Workpiece Material and Tool Geometry

The work piece material used in this study is stainless steel 304. The chemical composition as well as the mechanical properties of Stainless steel 304 are shown in Table 2 and Table 3, respectively. The experiments were performed on the cylindrical job piece of this material having a length of 300 mm and diameter of 25 mm. The turning experiments were conducted with a High-Speed Steel single point cutting tool with the parameters: Cutting Edge Radius 0.2 mm, Rake Angle 10°, Relief Angle10°. The coolant that was used in the experiment was a composition of 10% chrysan, C225 soluble oil and the initial temperature of the coolant was used was 20 °C. The heat transfer co-efficient of the coolant was 9933 W / m 2 · k   [24] and the density was 981 kg / m 3 . The surface roughness value was measured by Mitutoyo Surftest SJ-210 portable surface roughness tester.

3.3. Output Parameters and Simulation Conditions

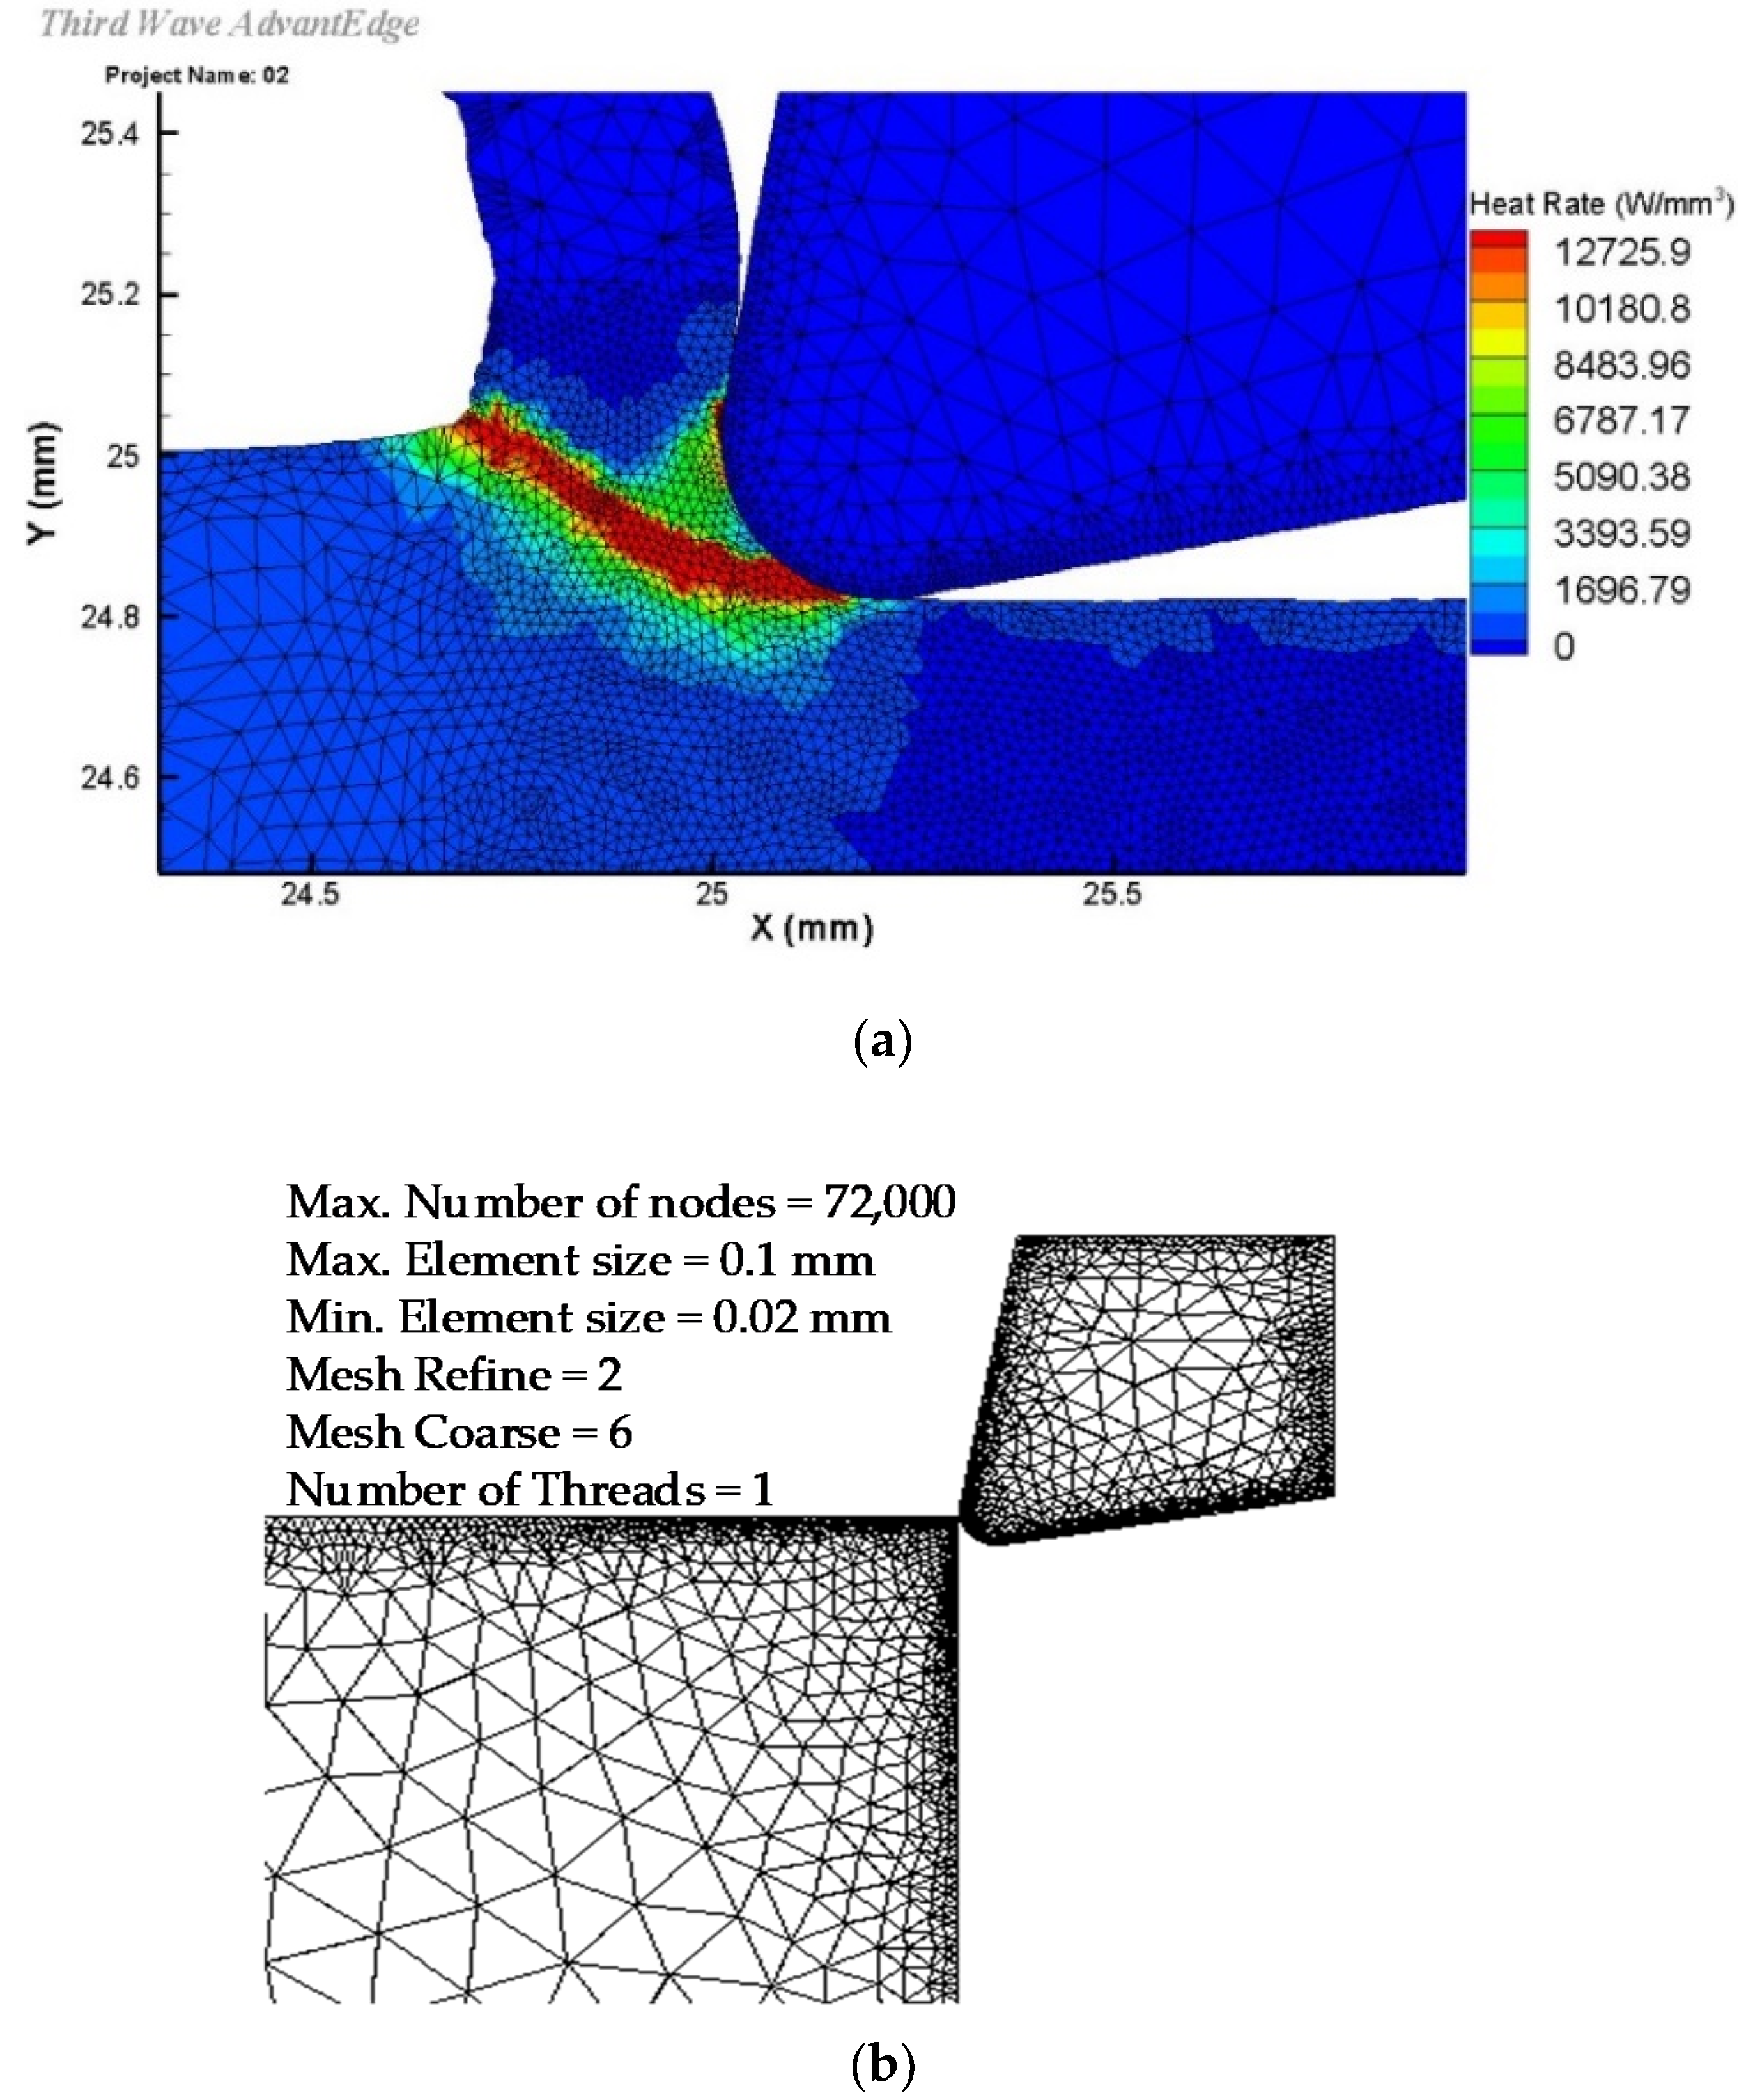
The numerical analysis was performed with the AdvantEdge (provided by Third Wave Systems) software that simulates the turning process according to the given parameters and conditions. The main purpose of using Simulating software is to collect accurate results of the cutting process and reduce the number of experiments. This software allows simulation of different machining operations in two or three dimensions. AdvantEdge FEM software does not give the user much flexibility in configuring the controls of the mesh. It has auto generated adaptive meshing system which helps to improve the precision of the results. An example of 2D mesh of tool and workpiece is shown in Figure 2a,b. Data values of the cutting forces, power, peak tool temperature and heat rate were computed from the simulation results. The initial temperature for the simulations was set at 20 °C, as per standard room temperature. Furthermore, the coolant temperature was used as 20 °C. The properties of the coolant that was used for the experiments was provided during the simulations. The heat transfer co-efficient of the coolant was set as 9933   W / m 2 · k   [23] and the density was 981 kg / m 3 . Standard simulation mode was used to ensure the accuracy of the results. The values of surface roughness were measured experimentally. All the experiments were repeated five times to get an average roughness and also for avoiding errors. The material removal rate (MRR) was calculated by using the weight loss method. Machining time needed to reduce the diameter of the workpiece from 25 mm to 22 mm for each experiment was observed and the removed material were weighted to determine the weight difference. The material removal rate (MRR) is calculated using the following equation (Equation (1)):
M R R = ( W i W f ) / ( ρ s s × t )   mm 3 / min  
where, W i   = Initial weight of workpiece in grams, W f = Final weight of workpiece in grams, t = Machining time in minutes, ρ s s = Density =   8.03 × 10 3   gm / mm 3   .

4. Results and Discussion

4.1. Results of the Output Parametres

The results of the experiments and simulations performed according to the design of experiment, which show how the output parameters vary with the different combinations of the cutting parameters are presented in Table 4. MRR is calculated for each set of data using Equation (1). The values of PTT, P, H and the cutting forces are extracted from the graphs produced by the simulations. The maximum values of these parameters generated over the length of cut are taken into account. An example of such an extraction is shown for cutting condition 2 (cutting speed 137.40 m/min, feed 0.18 mm/rev and depth of cut 0.4 mm) in Figure 3a–c.

4.2. Generating Objective Functions

Based on the simulation results, the fit and summary test suggests quadratic models to best fit the pattern of how the output parameters change with the cutting parameters. In this context, multiple regression models are used to produce the mathematical relations between the output and input parameters. In ANOVA test, p value indicates the results observed in a study could be faulty. If p value is less than 0.05 the model is considered to be statistically significant. Furthermore, the more the determination coefficient R2 approaches towards 1, the better the response model is said to fit the simulation data. For this reason, in this study, the p and R2 values for the quadratic models adopted <0.0001 and >0.99, respectively. On the basis of the derived equations, the values of the output parameters are calculated again to generate the empirical data, as shown in Table 5. Compared with Table 4, we can see that the deviation between the simulation results and the empirical data is well within acceptable terms, hence confirming the fact that the quadratic models were indeed a good fit.
The derived mathematical models (Equations (2)–(8)) that serve as the objective functions for the optimization process are given below:
M R R = exp ( 4.77 + 0.023 V + 8.22 f + 3.39 d 0.0014 V f 0.00071 V d 0.053 f d 5.70 × 10 5 V 2 7.58 f 2 1.29 d 2 ) ,
P T T = exp ( 2.39 + 0.016 V + 4.84 f + 3.31 d 0.0035 V f 0.0025 V d 0.61 f d 2.1 × 10 5 V 2 2.47 f 2 0.65 d 2 )
H = exp ( 8.72 + 0.022 V 8.53 f + 0.031 d 1.30 × 10 5 V f 3.32 e 6 V d 2.0 × 10 5 f d 5.8 × 10 5 V 2 + 8.56 f 2 + 0.0082 d 2 )
P = exp ( 6.18 0.0044 V 0.057 f + 0.85 d 0.0021 V f 0.0011 V d 1.14 f d + 3.9 × 10 5 V 2 + 3.35 f 2 0.038 d 2 )
F x = exp ( 3.77 0.0082 V + 4.33 f + 3.06 d 0.0035 V f 0.0011 V d 0.066 f d + 4.5 × 10 5 V 2 2.15 f 2 0.67 d 2 )
F y = exp ( 3.40 0.00064 V + 3.56 f + 3.46 d 0.0071 V f 0.0023 V d 0.75 f d + 1.6 × 10 5 V 2 2.65 f 2 0.91 d 2 )
R a = exp ( 1.34 + 0.0035 V + 7.95 f + 1.83 d + 0.014 V f + 0.00087 V d + 0.48 f d 6.17 e 5 V 2 12.39 f 2 1.42 d 2 )

4.3. Optimization Process

The empirical data are normalized using the equations shown in Figure 1, followed by the calculation of the grey relational coefficients. The results of this pre-processing, and the eventual calculation of the GRG for Trial 1, presented in Table 6 and Table 7.

4.4. Optimization Results

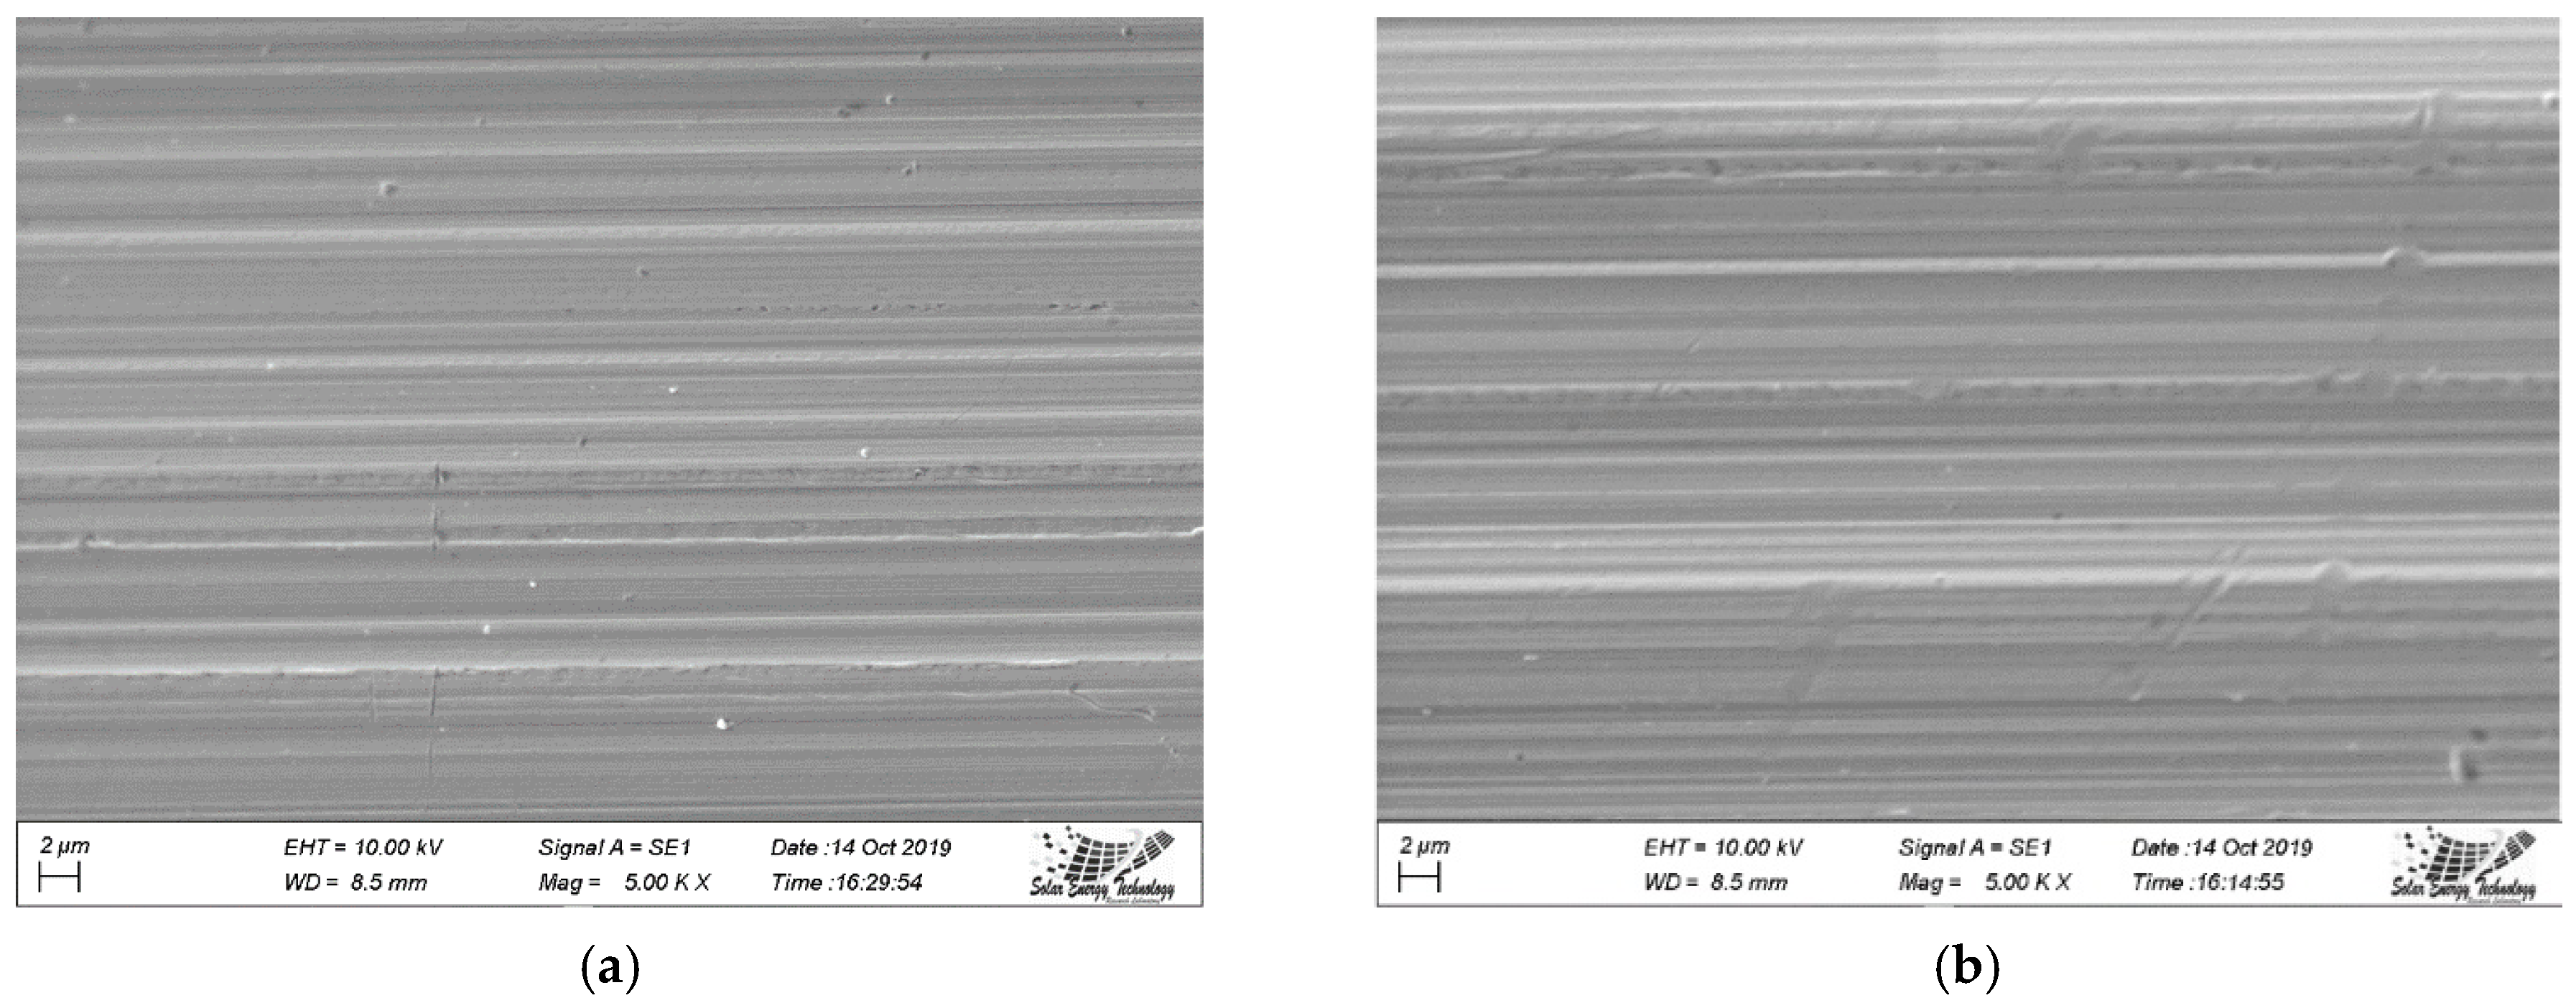
The derived objective functions are imported into MATLAB where the WOA is to be executed. The objective function values are obtained for maximizing MRR and minimization of peak tool temperature, roughness, power, heat rate and cutting forces. Upper and lower bounds were specified as per the levels of the machining parameters. The initial population size was taken as 30 to carry out the optimization process. Using this algorithm, the optimum parameter for the given range is shown in Table 8. It can be seen that, for equal weightage (Trial 1) the optimize value of V, f and d are 42.62   m / min , 0.14   mm / rev and 0.32   mm , respectively. However, if the weightage of MRR is increased (Trial 2) for maximizing the production rate then the optimize value of V, f and d are changed to   153.71   m / min , 0.4   mm / rev and 0.88   mm , respectively. At optimum cutting conditions, 1 and 2 (Table 3) machined surface is observed through scanning electron microscope (SEM) images which are shown in Figure 4a,b. In both of the images, the working distance (WD) between the sample surface and the low portion of the lens was 8.5 mm. The value for electron high tension (ETH) was 10 KV. This accelerating voltage was used for imaging and the magnification was 5000 times for the images.
The hybridized WOA is used to establish the optimum cutting condition for the turning process, which is found to be the combination of cutting speed 42.64 m/min, feed rate 0.14 mm/rev, and depth of cut 0.32 mm for trail 1. It is evident from this result that the hybridized WOA, when optimizing with respect to MRR, PTT, Cutting forces, Power or surface finish altogether, positioned the optimum condition towards low levels of cutting speed and depth of cut. Even though higher depth of cut and cutting speeds would favor MRR, multi-objective optimization leads to a compromised combination since lower cutting speeds and depth of cuts would alternatively favor lower cutting forces, power consumption, heat generation, as well as surface finish. Numerous studies on optimizing turning processes were conducted using different algorithms and they have all produced similar kinds of optimum results [7,8,9,15,17,25]. This conformity suggests that the hybridized WOA delivers a reliable optimization process.

4.5. Effect of Cutting Parameters on Surface Roughness

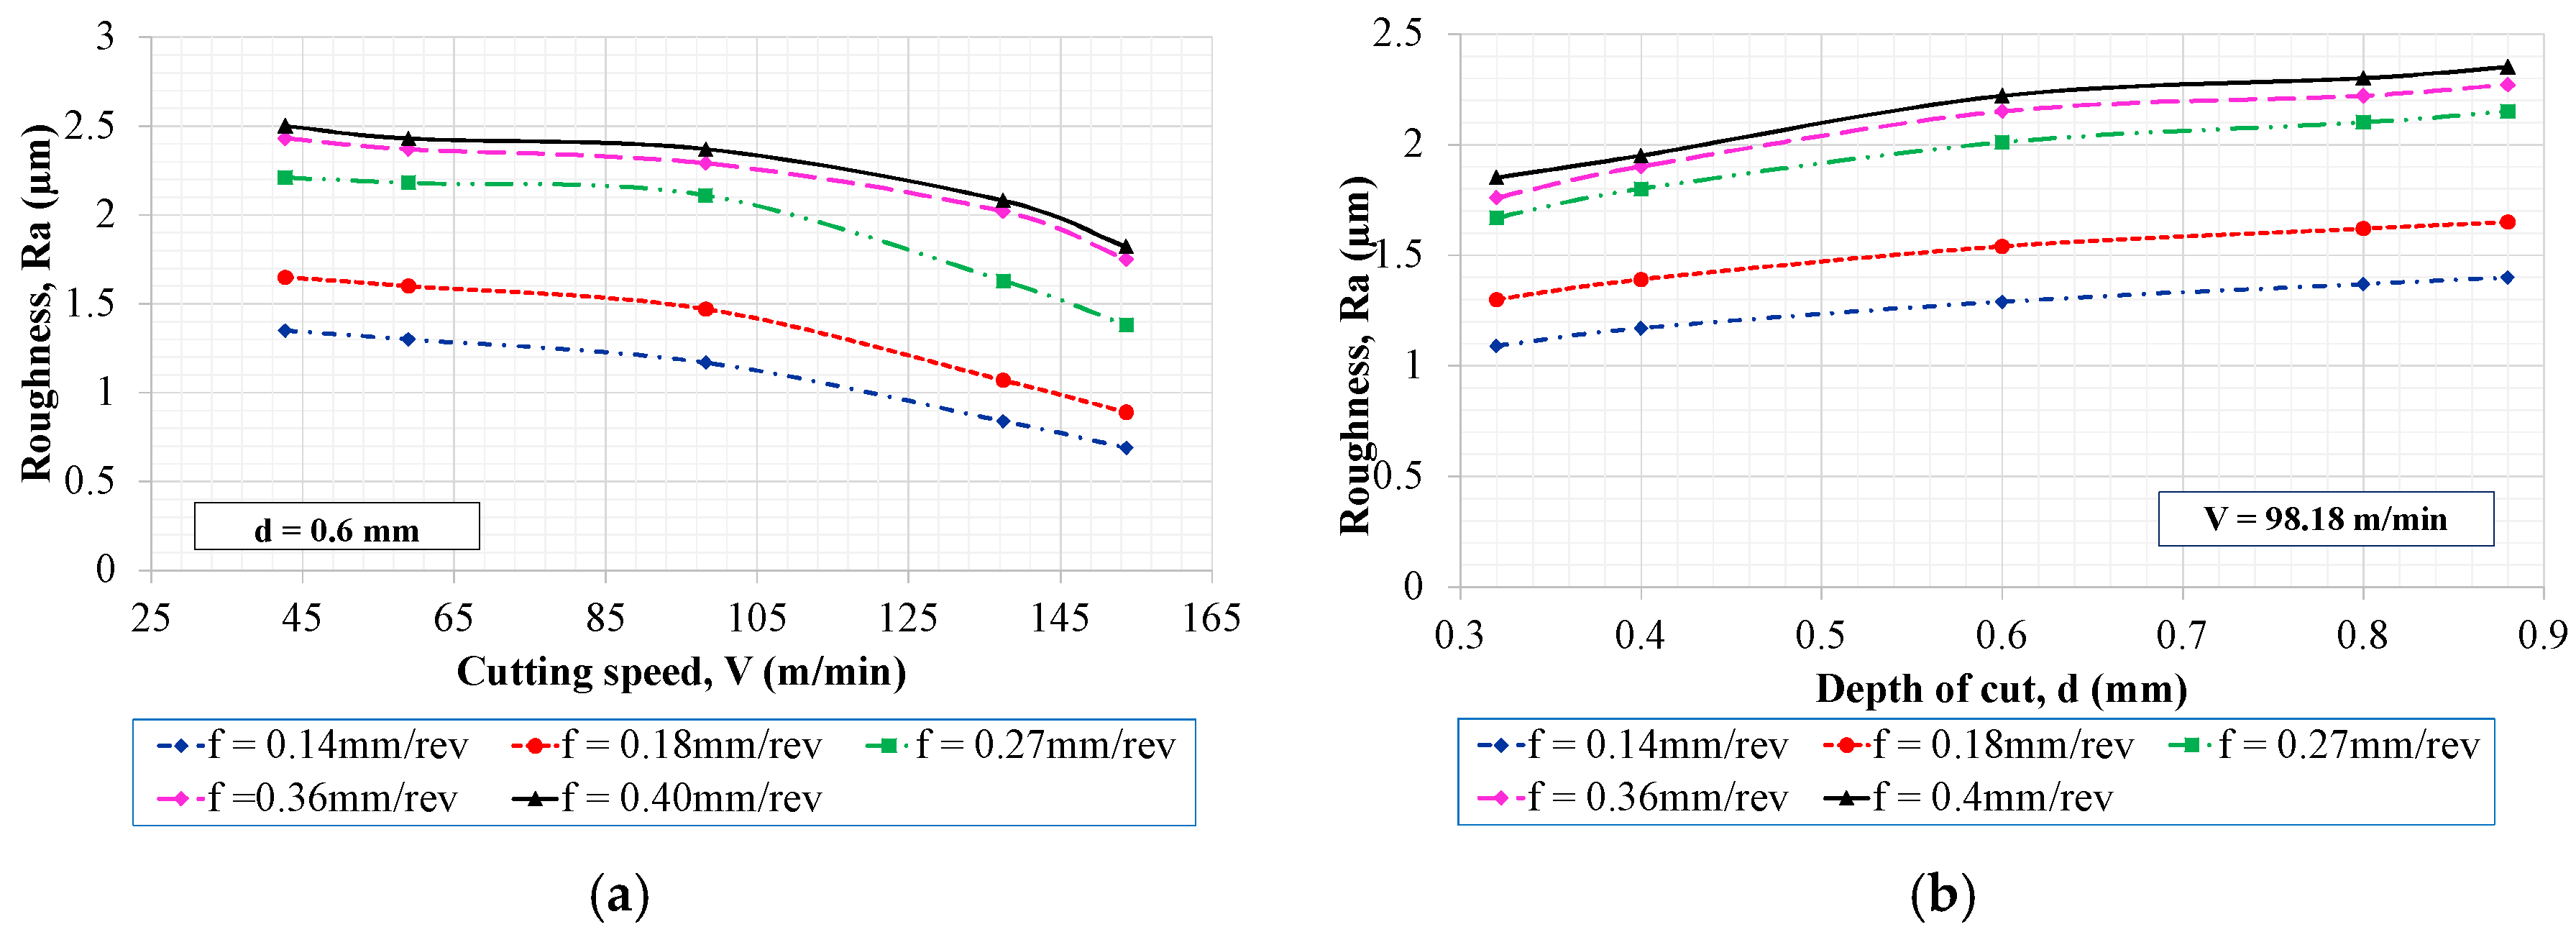
The surface roughness obtained for different cutting speeds by varying the feed with constant depth of cut is shown in Figure 5a. With the increment of the cutting speed, surface roughness decreases. Moreover, increasing the feed from 0.14 to 0.40 mm/rev causes the magnitude of the surface roughness to increases too. In Figure 5b, surface roughness for different depth of cut is shown by varying the feed with constant cutting speed. As the depth of cut increases, the surface roughness also increases. Here, with the increase in feed the magnitude of the surface roughness increases. From the graphs it can be realized that surface roughness increases with increasing feed and depth of cut but falls with increasing cutting speed. A similar trend is observed for most of the other metals and alloys [26,27,28]. It can be seen that in order to obtain a lower surface roughness of less than 1   μ m , the cutting speed can be set 153.70 m/min with depth of cut 0.32 to 0.6 mm and feed 0.14 to 0.18 mm/rev.

4.6. Effect on Cutting Force (X Direction)

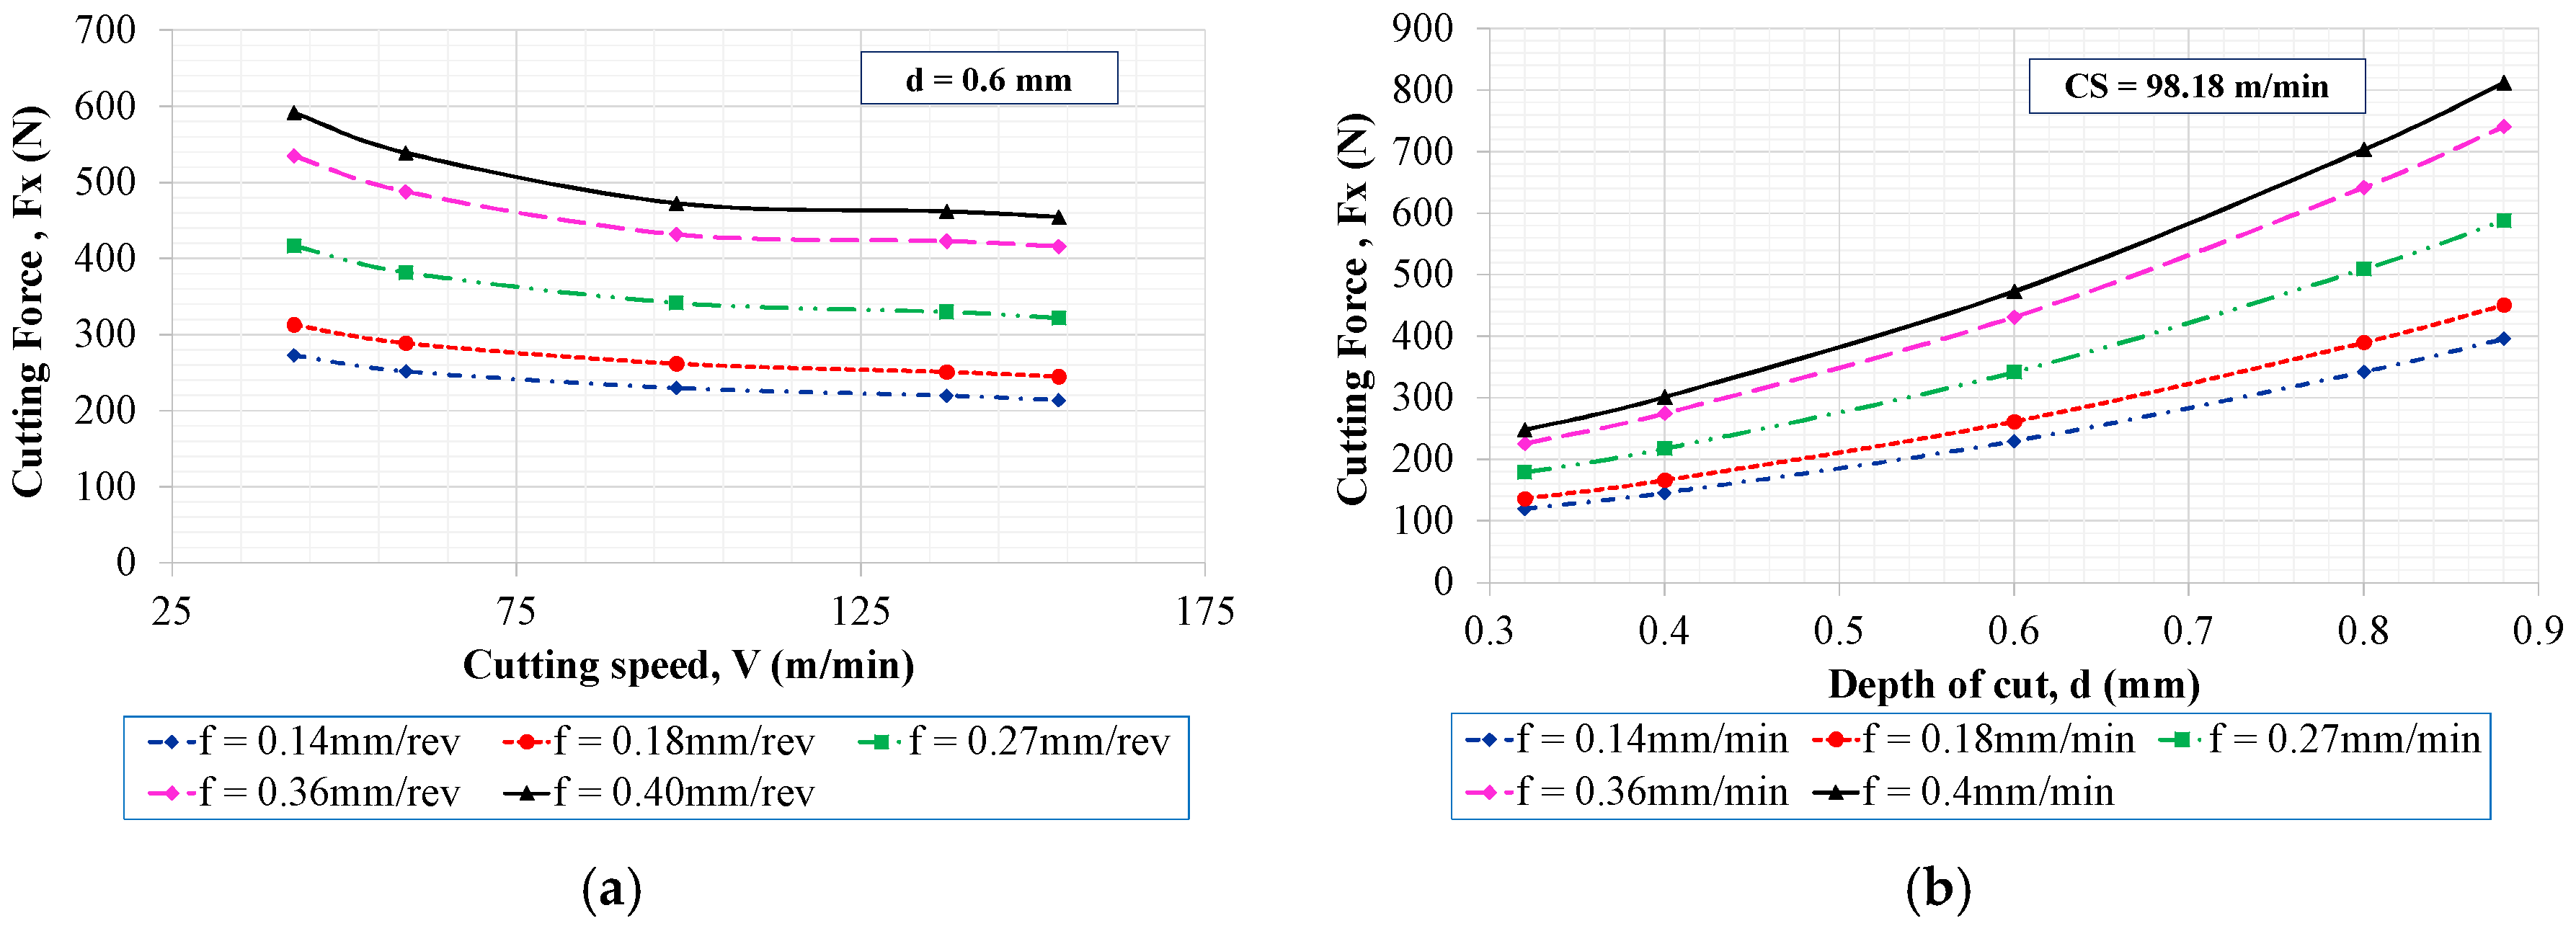
Cutting parameters have similar effects on cutting force which are shown in Figure 6a,b. There is an agreement with the earlier findings that a reduction in cutting forces occurs with increasing cutting speed, and the cutting forces increase with increasing feed and depth of cut during turning operation, a common experience observed with most metals and alloys [29,30,31].

5. Conclusions

In this study, a hybrid WOA algorithm is used to obtain an optimal parametric combination that provides maximum material removal rate and minimum surface roughness, heat rate, power consumption, force generation and peak tool temperature in turning operation. By applying this hybrid algorithm, the number of experiments is drastically reduced. Based on multi-objective optimization using the hybrid WOA algorithm, the optimal parameter combination for turning of the AISI 304 stainless steel was the cutting speed 42.64 m/min, feed of 0.14 mm/rev, and depth of cut of 0.32 mm. This is realistic because using a lower cutting speed and depth of cut produces less stress on the cutting tool, thus generating a smaller temperature rise and requiring less power. Usually, a higher cutting speed gives a lower surface roughness, but here, as multiple parameters are being optimized simultaneously, the optimum combination ends up with a lower cutting speed rather than high. The results also show that, in order to increase the productivity, if the MRR weightage is increased from 20% to 40%, then the optimized results of V, f and d change from 42.64 m/min to 153.70 m/min, 0.14 mm/rev to 0.40 mm/rev, and 0.32 mm to 0.88 mm, respectively. This suggests that by using this hybrid algorithm, the optimum cutting condition for different weightage factors for the output parameters can be analyzed. Manufacturers may choose, among an infinite possibility of weightage factors, on the output parameters as influenced by their business aims, economic constraints or environmental regulations. This method therefore proves to be a suitable approach in analyzing the optimal conditions pertaining to multi-objective optimization having different weightage factors for each output.

Author Contributions

Conceptualization—M.A.H., M.H.T., A.H.; methodology—M.A.H., M.H.T., M.M.T.R.; software—S.I., K.Z., M.H.T.; Experimentation—M.M.T.R., S.I., K.Z.; formal analysis—A.H., M.M.T.R., S.T.T.R.; investigation—S.I., A.H., K.Z.; resources—M.M.T.R., K.Z.; data curation—M.H.T., M.M.T.R.; writing—original draft preparation—M.H.T.; writing—review and editing—M.A.H., S.I., S.T.T.R.; visualization—A.H., S.I., M.H.T.; supervision—M.A.H. All authors have read and agreed to the published version of the manuscript.

Funding

This research received no external funding.

Conflicts of Interest

The authors declare no conflict of interest.

Nomenclature

MRRMetal Removal Rate (mm3/min)
PTTPeak Tool Temperature (°C)
HHeat rate ( W / mm 3 )
PPower (W)
FxForce in x direction (N)
FyForce in y direction (N)
fFeed rate (mm/rev)
VCutting Speed ( m / min )
dDepth of Cut (mm)

References

  1. Dikshit, M.K.; Puri, A.B.; Maity, A.; Banerjee, A.J. Analysis of Cutting Forces and Optimization of Cutting Parameters in High Speed Ball-end Milling Using Response Surface Methodology and Genetic Algorithm. Procedia Mater. Sci. 2014, 5, 1623–1632. [Google Scholar] [CrossRef] [Green Version]
  2. Abhang, L.; Hameedullah, M. Optimization of Machining Parameters in Steel Turning Operation by Taguchi Method. Procedia Eng. 2012, 38, 40–48. [Google Scholar] [CrossRef] [Green Version]
  3. Mukherjee, I.; Ray, P.K. A review of optimization techniques in metal cutting processes. Comput. Ind. Eng. 2006, 50, 15–34. [Google Scholar] [CrossRef]
  4. Rao, R.V.; Pawar, P.J. Parameter optimization of a multi-pass milling process using non-traditional optimization algorithms. Appl. Soft. Comput. 2010, 10, 445–456. [Google Scholar] [CrossRef]
  5. Mirjalili, S. Dragonfly algorithm: A new meta-heuristic optimization technique for solving single-objective, discrete, and multi-objective problems. Neural Comput. Appl. 2015, 27, 1053–1073. [Google Scholar] [CrossRef]
  6. Habib, M.A.; Patwari, M.A.; Jabed, A.; Bhuiyan, M.N. Optimization of Surface Roughness in Drilling of GFRP Composite Using Harmony Search Algorithm. Int. J. Mech. Eng. Robot. Res. 2016, 5, 311–316. [Google Scholar] [CrossRef]
  7. Solarte-Pardo, B.; Hidalgo, D.; Yeh, S. Cutting Insert and Parameter Optimization for Turning Based on Artificial Neural Networks and a Genetic Algorithm. Appl. Sci. 2019, 9, 479. [Google Scholar] [CrossRef] [Green Version]
  8. Petkovic, D.; Radovanovic, M. Using Genetic Algorithms for Optimization of Turning Machining Process. J. Eng. Stud. Res. 2016, 19, 47–55. [Google Scholar] [CrossRef]
  9. Teti, R.; D’Addona, D. Genetic Algorithm-based Optimization of Cutting Parameters in Turning Processes. Procedia CIRP 2013, 7, 323–328. [Google Scholar] [CrossRef] [Green Version]
  10. Sangwan, K.S.; Kant, G. Optimization of Machining Parameters for Improving Energy Efficiency using Integrated Response Surface Methodology and Genetic Algorithm Approach. Procedia CIRP 2017, 61, 517–522. [Google Scholar] [CrossRef]
  11. Prasad, D.V.V.K.; Bharathi, K. Multi-Objective Optimization of Milling Parameters for Machining Cast Iron on Machining Centre. Res. J. Eng. Sci. 2013, 2, 2278–9472. [Google Scholar]
  12. Yan, J.; Li, L. Multi-objective optimization of milling parameters—The trade-offs between energy, production rate and cutting quality. J. Clean. Prod. 2013, 52, 462–471. [Google Scholar] [CrossRef]
  13. Dhabale, R.; Jatti, V.S.; Singh, T.P. Multi-objective Optimization of Turning Process During Machining of AlMg1SiCu Using Non-dominated Sorted Genetic Algorithm. Procedia Mater. Sci. 2014, 6, 961–966. [Google Scholar] [CrossRef] [Green Version]
  14. Deng, J. Introduction to grey system. J. Grey Syst. 1989, 1, 1–24. [Google Scholar]
  15. Gupta, M.; Kumar, S. Multi-objective optimization of cutting parameters in turning using grey relational analysis. Int. J. Ind. Eng. Comput. 2013, 4, 547–558. [Google Scholar] [CrossRef]
  16. Ramu, I.; Srinivas, P.; Vekatesh, K. Taguchi based grey relational analysis for optimization of machining parameters of CNC turning steel 316. IOP Conf. Ser. Mater. Sci. Eng. 2018, 377, 012078. [Google Scholar] [CrossRef]
  17. Yang, W.H.; Tarng, Y.S. Design optimization of cutting parameters for turning operations based on the Taguchi method. J. Mater. Process. Technol. 1998, 84, 122–129. [Google Scholar] [CrossRef]
  18. Mirjalili, S.; Lewis, A. The Whale Optimization Algorithm. Adv. Eng. Softw. 2016, 95, 51–67. [Google Scholar] [CrossRef]
  19. Mamalis, A.G.; Kundrak, J.; Markopoulos, A.; Manolakos, D.E. On the finite element modelling of high speed hard turning. Int. J. Adv. Manuf. Technol. 2007, 38, 441–446. [Google Scholar] [CrossRef]
  20. Qian, L.; Hossan, M.R. Effect on cutting force in turning hardened tool steels with cubic boron nitride inserts. J. Mater. Process. Technol. 2007, 191, 274–278. [Google Scholar] [CrossRef]
  21. Jiang, F.; Li, J.; Sun, J.; Zhang, S.; Wang, Z.; Yan, L. Al7050-T7451 turning simulation based on the modified power-law material model. Int. J. Adv. Manuf. Technol. 2009, 48, 871–880. [Google Scholar] [CrossRef]
  22. Thakare, A.; Nordgren, A. Experimental Study and Modeling of Steady State Temperature Distributions in Coated Cemented Carbide Tools in Turning. Procedia CIRP 2015, 31, 234–239. [Google Scholar] [CrossRef] [Green Version]
  23. Yousefi, S.; Zohoor, M. Effect of cutting parameters on the dimensional accuracy and surface finish in the hard turning of MDN250 steel with cubic boron nitride tool, for developing a knowledged base expert system. Int. J. Mech. Mater. Eng. 2019, 14, 1. [Google Scholar] [CrossRef]
  24. Danieel, C.; Rao, K.V.; Olson, W.W.; Sutherland, J.W. Effect of cutting fluid properties and application variables on heat transfer in turning and boring operations. Proc. Jpn. USA Symp. Flex. Autom. 1966, 7, 1119–1126. [Google Scholar]
  25. Makadia, A.J.; Nanavati, J.I. Optimisation of machining parameters for turning operations based on response surface methodology. Meas. J. Int. Meas. Confed. 2013, 46, 1521–1529. [Google Scholar] [CrossRef]
  26. Kumar, N.S.; Shetty, A.; Shetty, A.; Ananth, K.; Shetty, H. Effect of Spindle Speed and Feed Rate on Surface Roughness of Carbon Steels in CNC Turning. Procedia Eng. 2012, 38, 691–697. [Google Scholar] [CrossRef] [Green Version]
  27. Ndaruhadi, P.Y.M.W.; Sharif, S.; Noordin, M.Y.; Kurniawan, D. Effect of Cutting Parameters on Surface Roughness in Turning of Bone. Adv. Mater. Res. 2014, 845, 708–712. [Google Scholar] [CrossRef]
  28. Sumardiyanto, D.; Susilowati, S.E.; Cahyo, A. Effect of Cutting Parameter on Surface Roughness Carbon Steel S45C. J. Mech. Eng. Autom. 2018, 8, 1–6. [Google Scholar]
  29. Lalwani, D.I.; Mehta, N.K.; Jain, P.K. Experimental investigations of cutting parameters influence on cutting forces and surface roughness in finish hard turning of MDN250 steel. J. Mater. Process. Technol. 2008, 206, 167–179. [Google Scholar] [CrossRef]
  30. Huang, Y.; Liang, S.Y. Modeling of Cutting Forces under Hard Turning Conditions Considering Tool Wear Effect. J. Manuf. Sci. Eng. 2005, 127, 262–270. [Google Scholar] [CrossRef]
  31. Sivaraman, V.; Sankaran, S.; Vijayaraghavan, L. The Effect of Cutting Parameters on Cutting Force during Turning Multiphase Microalloyed Steel. Procedia CIRP 2012, 4, 157–160. [Google Scholar] [CrossRef] [Green Version]
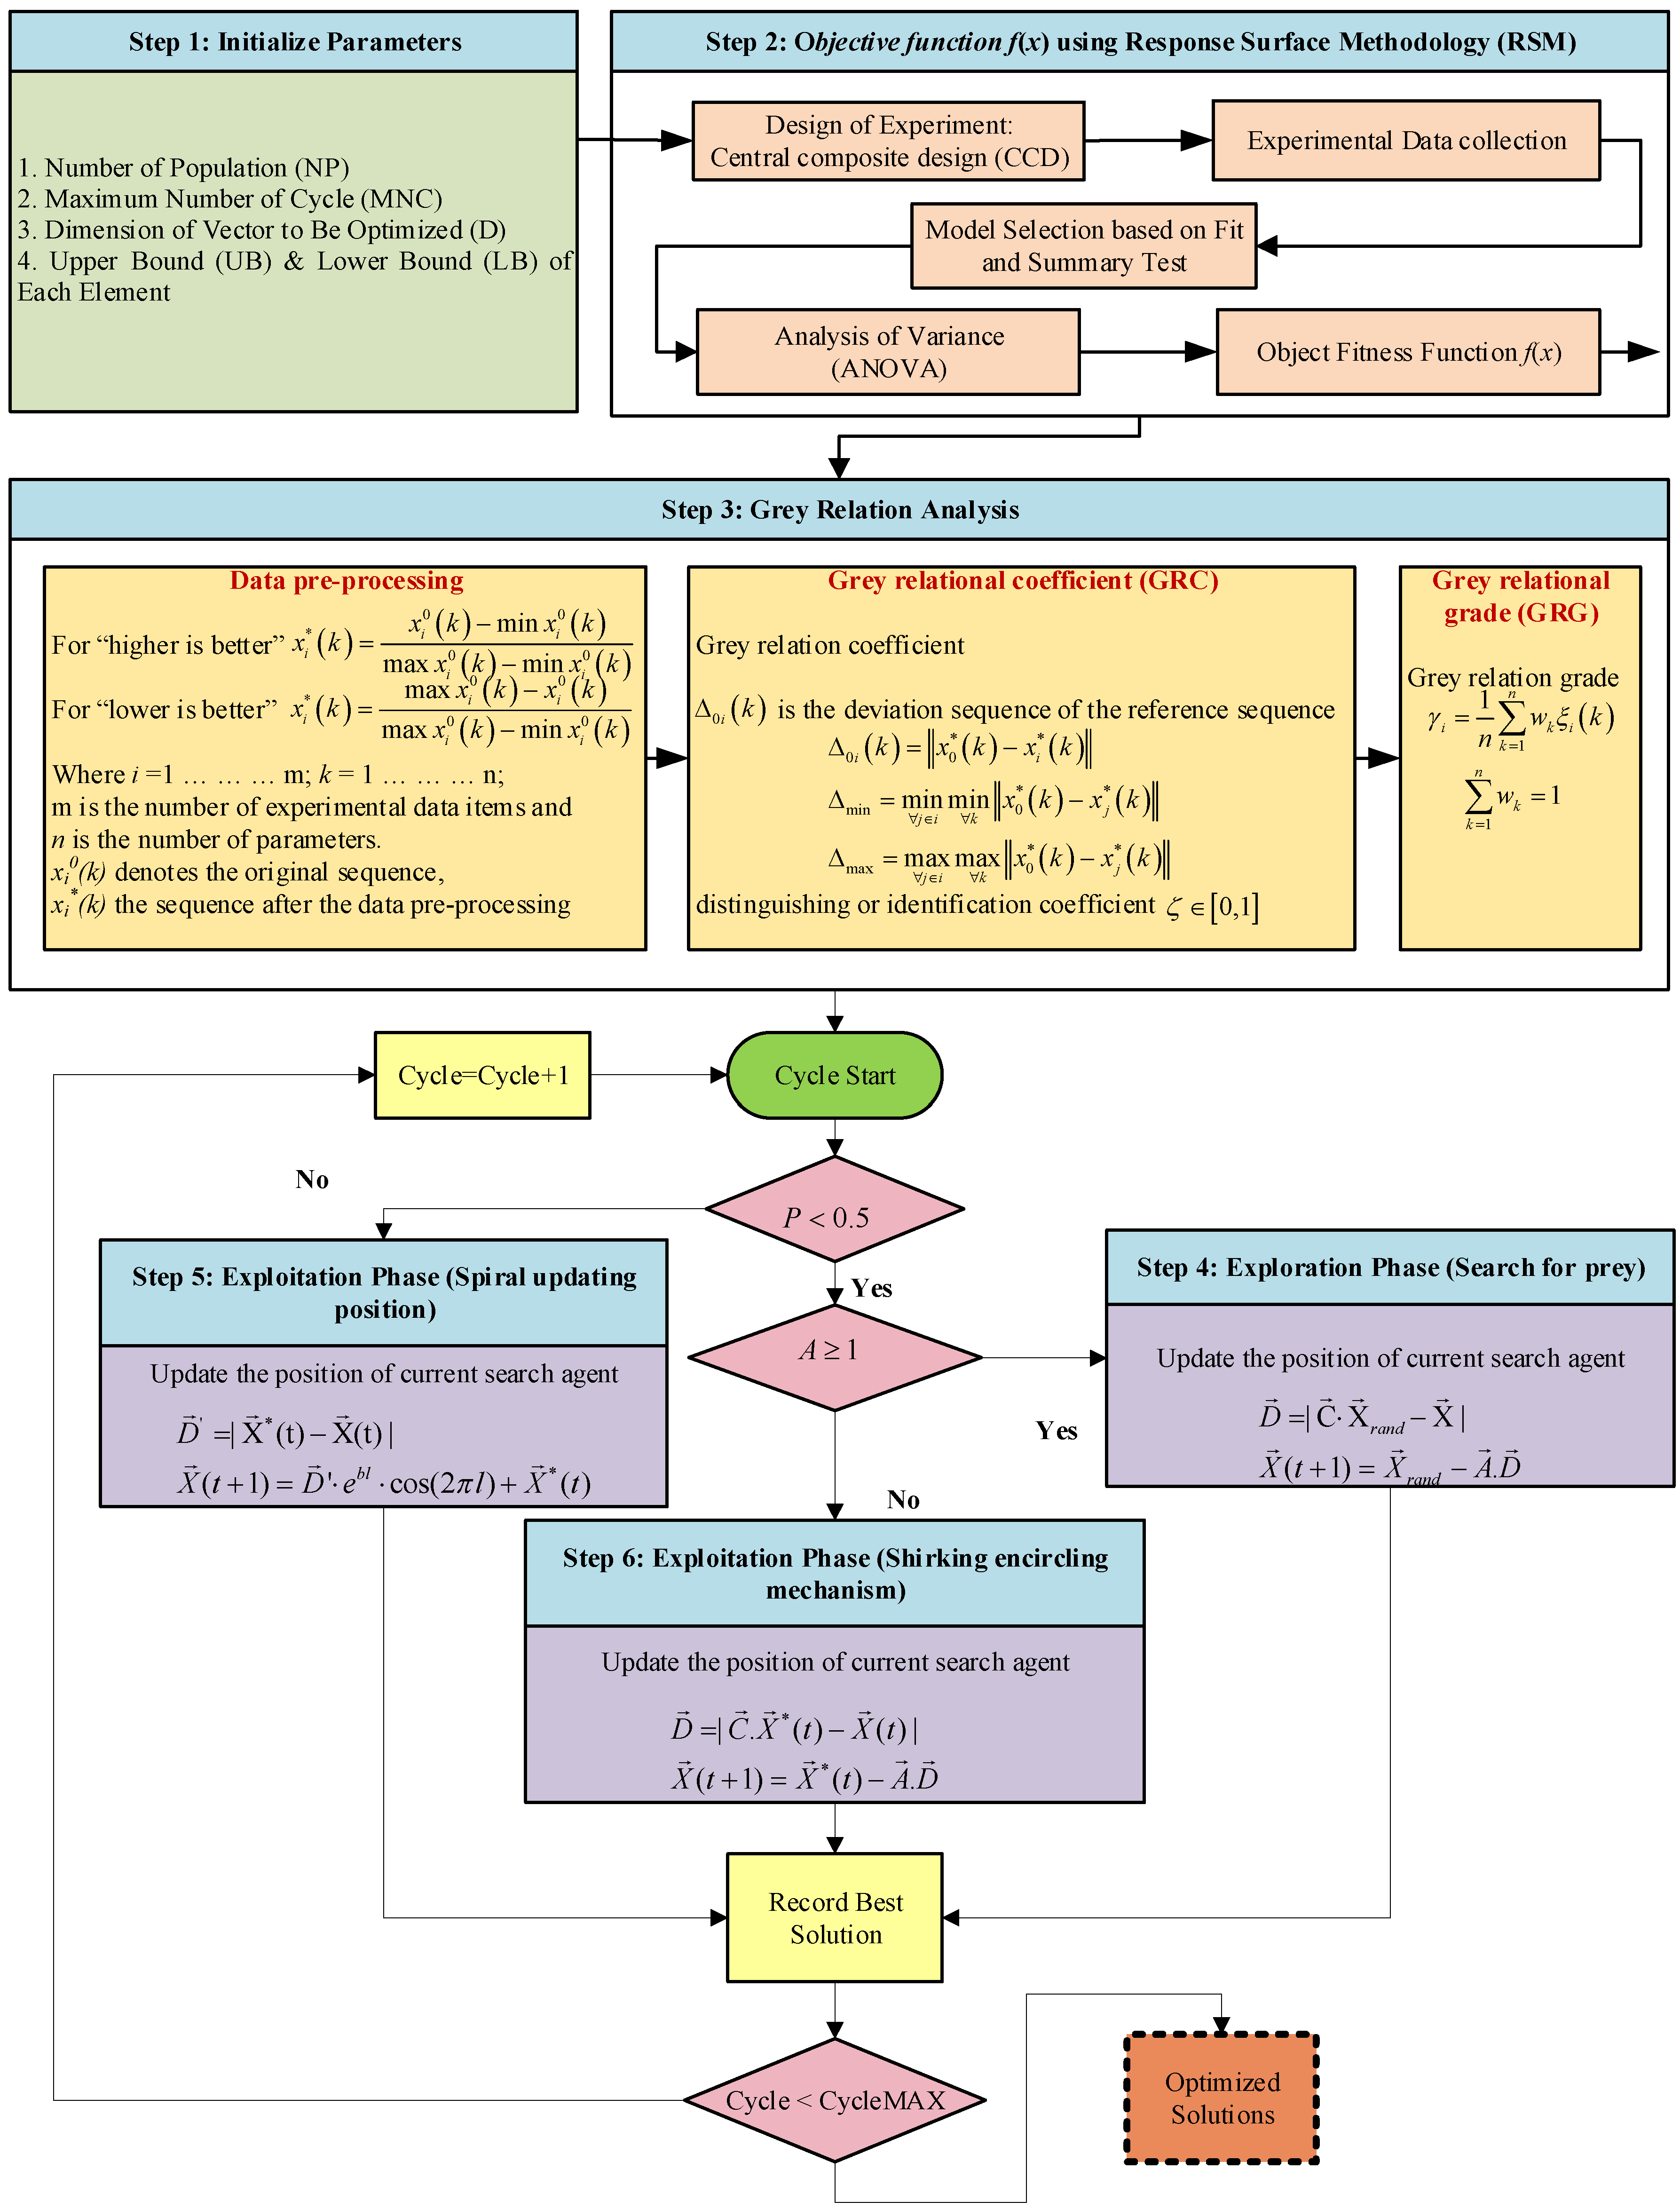
Figure 1. Flow Diagram of the hybridized whale-grey, multi-objective algorithm.
Jmmp 04 00064 g001
Figure 2. (a) Example of mesh in tool, chip and work piece during simulation; (b) Example of mesh in tool and work piece.
Jmmp 04 00064 g002
Figure 3. (a) Power (b) Temperature (c) Force X and Y results of simulation for cutting condition 2, cutting speed 137.40 m/min, feed 0.18 mm/rev and depth of cut 0.4 mm.
Jmmp 04 00064 g003
Figure 4. SEM image at optimum cutting condition ×5000 magnification at optimization in (a) Trail 1 (b) Trial 2.
Jmmp 04 00064 g004
Figure 5. The effect of (a) cutting speed (b) depth of cut on surface roughness for different feed.
Jmmp 04 00064 g005
Figure 6. The effect of (a) cutting speed (b) depth of cut on cutting forces (x-direction) for different feed.
Jmmp 04 00064 g006
Table 1. Process parameters with their values at different levels.
Parameters 2 1 0 + 1 + 2
V   ( m / min ) 42.6458.9198.18137.45153.71
f   ( mm / rev ) 0.140.180.270.360.4
d   ( mm ) 0.320.40.60.80.88
Table 2. Chemical composition (%) of the work piece material (Stainless Steel 304).
CCrMnNiPSSi
0.03192100.0450.030.75
Table 3. Mechanical composition of the work piece material (Stainless Steel 304).
Hardness, BrinellHardness, Rockwell BTensile Strength, UltimateTensile Strength, YieldElongation at BreakModulus of ElasticityCharpy ImpactShear Modulus
12370505 MPa215 MPa70%193–200 GPa325 J86 GPa
Table 4. Experimental and simulation results.
No.Input ParametersOutput Parameters
V
( m min )
f
( mm rev )
d
( mm )
MRR
( m m 3 min )
PTT,
T T o o l
( )  
Heat Rate,
H
( W / m m 3 )
Power,
P
( W )
Force
X,
F X ( N )
Force
Y,
F Y ( N )
Roughness,
R a
( µ m )
158.900.180.404048.605405453170175.0150.01.48
2137.400.180.409993.0867512,726400178.0160.00.95
358.900.360.408352.326822727282290.0190.02.24
4137.400.360.4019,672.088206363660286.0185.01.76
558.900.180.808386.327205541440440.0355.01.65
6137.400.180.8019,722.0886012,9301000440.0355.01.08
758.900.360.8016,794.648302771730740.0430.02.57
8137.400.360.8039,686.1697064651510690.0385.02.07
942.600.270.606999.587402674320445.0300.02.21
10153.700.270.6024,981.258309640850330.0235.01.38
1198.200.140.608146.7067511,875360220.0210.01.17
1298.200.400.6023,662.008004156790470.0279.02.52
1398.200.270.328682.326856010320190.0142.01.72
1498.200.270.8823,426.387006157870525.0390.02.08
1598.200.270.6015,704.356906062570345.0262.02.11
1698.200.270.6015,704.356906062570345.0262.02.11
1798.200.270.6015,704.356906062570345.0262.02.11
1898.200.270.6015,704.356906062570345.0262.02.11
1998.200.270.6015,704.356906062570345.0262.02.11
2098.200.270.6015,704.356906062570345.0262.02.11
Table 5. Empirical Data based on the quadratic objective functions.
No.Output Parameters
MRR
( m m 3 min )
T T o o l
( )
H
( W / m m 3 )
P
( W )
F X  
( N )
F Y  
( N )
R a  
( µ m )
14029.84576.65435.1173.7181.8152.71.48
29920.53693.212,938.1401.1175.0155.40.95
38318.46711.62686.8301.0308.3196.52.24
420,052.02829.96394.5661.3282.2180.91.76
58259.00714.95525.2430.7434.4353.61.65
619,878.37828.313,151.1919.1403.1334.21.08
716,982.40812.22731.3714.2733.0431.12.57
840,023.97912.96499.81449.9646.8368.42.07
97074.88701.12744.2307.9416.8286.52.21
1024,526.73867.59354.1918.1371.4259.61.38
118269.97654.511,662.7377.8229.8218.81.17
1223,138.70817.34214.7781.1473.4281.82.52
138676.45618.16000.9297.5178.9140.51.72
1423,259.65768.16140.1973.3588.3416.22.08
1515,724.00691.16066.1566.4342.0259.72.11
1615,724.00691.16066.1566.4342.0259.72.11
1715,724.00691.16066.1566.4342.0259.72.11
1815,724.00691.16066.1566.4342.0259.72.11
1915,724.00691.16066.1566.4342.0259.72.11
2015,724.00691.16066.1566.4342.0259.72.11
Table 6. Data pre-processing for Trial 1.
No.Data Pre-Processing
MRR T T o o l HP F X F Y R a
10.040.950.740.960.940.880.67
20.160.720.020.840.950.881
30.130.6810.890.760.750.21
40.360.450.650.70.80.790.5
50.120.680.730.820.580.250.57
60.360.4500.570.630.310.92
70.30.4810.680.1600
80.760.280.640.290.280.20.31
90.10.70.990.890.610.460.23
100.450.370.360.570.670.540.73
110.130.80.140.850.870.670.87
120.420.470.850.640.530.470.04
130.130.870.680.90.940.920.53
140.420.570.670.540.360.050.31
150.270.720.680.750.710.540.28
160.270.720.680.750.710.540.28
170.270.720.680.750.710.540.28
180.270.720.680.750.710.540.28
190.270.720.680.750.710.540.28
200.270.720.680.750.710.540.28
Table 7. GRG for Trial 1.
No.Grey Relational Coefficient (GRC)Grade
(GRG)
MRR T T o o l HP F X F Y R a
10.510.6610.980.940.60.78
20.550.640.340.7710.9210.74
30.530.6110.860.710.760.390.64
40.640.450.590.610.760.820.50.6
50.530.60.650.740.560.460.540.58
60.640.450.330.50.590.480.860.57
70.610.470.990.580.370.380.330.52
810.380.580.370.410.440.420.54
90.520.620.990.850.580.550.390.61
100.70.420.440.50.630.60.650.57
110.530.730.370.790.860.70.790.67
120.680.460.770.550.530.560.340.54
130.540.830.610.860.9910.510.72
140.680.520.60.480.450.40.420.52
150.60.640.610.660.670.60.410.58
160.60.640.610.660.670.60.410.58
170.60.640.610.660.670.60.410.58
180.60.640.610.660.670.60.410.58
190.60.640.610.660.670.60.410.58
200.60.640.610.660.670.60.410.58
Table 8. Optimization results for different weightage of output parameters.
Trail No.Weightage of Output ParametersOptimize ResultsOutput Parameters Values for Optimum Conditions
1 T T o o l = 20 % ,
M R R = 20 % ,
R a = 20 % , P = 10 % ,
F X = 10 % , F Y = 10 % ,
H R = 10 %
V = 42.64 m / min
f = 0.14   mm / rev
d = 0.32   mm
T T o o l = 550.7   , M R R = 2004.85   mm 3 / min  
P = 98.9   W , H = 5218.5 W / mm 3 ,
R a = 1.14   μ m , F X = 139.8   N
F Y = 116.3   N
2 T T o o l = 10 % ,
M R R = 40 % ,
R a = 10 % , P = 10 % ,
F X = 10 % , F Y = 10 % ,
H R = 10 %
V = 153.71 m / min
f = 0.40   mm / rev
d = 0.88   mm
T T o o l = 1057.2   , M R R = 52130.32 mm 3 / min
P = 1994.4   W , H = 6577.4 W / mm 3
R a = 1.85   μ m , F X = 844   N
F Y = 401.9   N