Article

An Iterative Size Effect Model of Surface Generation in Finish Machining

1
Department of Mechanical Engineering, University of Kentucky, Lexington, KY 40506, USA
2
Institute for Sustainable Manufacturing, University of Kentucky, Lexington, KY 40506, USA
*
Author to whom correspondence should be addressed.
J. Manuf. Mater. Process. 2020, 4(3), 63; https://doi.org/10.3390/jmmp4030063
Submission received: 9 June 2020 / Revised: 28 June 2020 / Accepted: 30 June 2020 / Published: 2 July 2020
(This article belongs to the Special Issue Advanced Manufacturing and Machining Processes)

Abstract

:
In this work, a geometric model for surface generation of finish machining was developed in MATLAB, and subsequently verified by experimental surface roughness data gathered from turning tests in Ti-6Al4V. The present model predicts the behavior of surface roughness at multiple length scales, depending on feed, nose radius, tool edge radius, machine tool error, and material-dependent parameters—in particular, the minimum effective rake angle. Experimental tests were conducted on a commercial lathe with slightly modified conventional tooling to provide relevant results. Additionally, the model-predicted roughness was compared against pedigreed surface roughness data from previous efforts that included materials 51CrV4 and AL 1075. Previously obscure machine tool error effects have been identified and can be modeled within the proposed framework. Preliminary findings of the model’s relevance to subsurface properties have also been presented. The proposed model has been shown to accurately predict roughness values for both long and short surface roughness evaluation lengths, which implies its utility not only as a surface roughness prediction tool, but as a basis for understanding three-dimensional surface generation in ductile-machining materials, and the properties derived therefrom.

1. Introduction

The roles of minimum uncut chip thickness and side flow on increasing surface roughness in finish turning have been acknowledged for some time. However, these two phenomena are not often considered to be related. Moll [1] was perhaps the first to record the discrepancy between actual and kinematically predicted surface roughness values at low feeds. Sokolowski [2] introduced the premise of a minimum uncut chip thickness (hmin), defined formally as the chip thickness required to remove material from the workpiece. The hmin effect is now widely recognized as resulting from the finite sharpness of the cutting edge (cutting edge radius, re), and Albrecht [3] was among the first to demonstrate the relevance of the cutting edge radius to process forces, as well as surface generation. Analytically determining the exact behavior of hmin has proven difficult, but it is generally understood to increase with edge radius [4]. Brammertz [5] applied the idea of hmin to turning, theorizing that, due to this phenomenon, there must be some part of the uncut chip thickness left on the surface of the workpiece, at the location where the chip thickness approaches zero on the secondary edge; Brammertz famously termed this area of uncut workpiece material the ”Spanzipfel”. In many subsequent studies, this material is assumed to behave elastically (spring back), which implies significant surface roughness increase at low-feed rate, high-nose radius conditions (i.e., low kinematic roughness) [6,7]. The kinematic roughness equation was modified by Brammertz [5], as shown in the following equation, to account for the roughness increase caused by the Spanzipfel material left on the machined surface.
B r a m m e r t z   R t / R z = f 2 8 r c + h m i n 2 · ( 1 + h m i n · r c f 2 )
where f is feed, rc is tool nose corner radius, and hmin represents the minimum uncut chip thickness. Note that the leftmost term in Equation (1) is the kinematic roughness equation, which predicts the roughness of a surface created by assuming perfect material removal, as shown in Figure 1a. While Equation (1) does predict the commonly observed discrepancy in actual and kinematically predicted surface roughness at low-feed rates, studies show that actual roughness values tend to be substantially smaller than those predicted by this equation at low kinematic roughness [8,9]. Indeed, this discrepancy can be traced back to Brammertz’s underlying assumption that any material within the Spanzipfel region will spring back elastically, as indicated in Figure 1b. In reality, it is clear that some plastic deformation will occur to the uncut material, which is subject to significant deformation during movement underneath the cutting tool and/or side flow. Shaw and Cookson [10] hypothesized later that the hmin material will be plastically deformed when it is pulled under the tool, and should not account for the roughness discrepancy at small feeds. However, an early (1961), almost forgotten landmark work by Lambert [11] ingeniously demonstrates that the material that is left behind due to Sokolowski’s hmin effect is not confined to Brammertz’s Spanzipfel region. Rather, Lambert found the material under hmin is left behind over the entire engaged cutting edge. Therefore, the commonly used surface generation assumptions used to arrive at the Brammertz-type models are not valid for workpiece materials responding in a plastic manner (i.e., most metals and plastics).
As an alternative cause for increased roughness at small feeds, material side flow (MSF) has been investigated to some extent. Sata [12] investigated MSF’s influence on roughness for different materials and found it to be more relevant in the machining of ductile materials. A few studies have noted that observed MSF is responsible for surface roughness deterioration in finish turning [13,14,15,16]. Finish turning conditions (high cutting speeds, low feeds and depth of cut) lead to high temperatures at the tool/workpiece interface, causing severe workpiece material plasticization, which then encourages MSF. Typical surface geometry indicative of MSF is shown below in Figure 2.
Kishawy and Elbestawi [17] investigated the MSF phenomenon and noted that roughness was significantly influenced by cutting tool edge preparation, which in turn directly influences the value of hmin. However, Kishawy et al. did not include a cutting edge radius parameter when developing the FEA model presented in [16]. Liu and Melkote. [18] developed a model for surface roughness prediction that accounts for side flow in diamond turned surfaces, but considered edge radius to be negligible (a reasonable assumption for single crystal diamond tools at practical feeds). El-Wardany and Elbestawi [14] thoroughly investigated the occurrence of MSF and noted that it was influenced by tool nose radius, feed, tool wear, and hmin, mentioning that edge radius has a direct effect on hmin, and therefore MSF. Many similar studies look to tool edge surface roughness and tool wear to account for side flow. While these parameters are certainly relevant, little work has sought to define the evident relationship between roughness due to side flow, in light of hmin. The work presented in this paper seeks to establish this relationship explicitly.
Recent contributions in the study of machined roughness have focused some on this relationship. Ozel et al. [19] showed the condition of the edge is a relevant roughness parameter in the hard turning of H13 steel. Ozel and Karpat [20] subsequently demonstrated the effectiveness of an ANN model for predicting roughness within a single dataset. This model considered tool edge geometry on a limited basis. Thiele and Melkote [21] studied edge geometries in hard turning of AISI 52100 steel and concluded that larger tool edge radii increased roughness by ploughing phenomena. Zhao et al. [22] presented a limited investigation on the effect of tool edge radius on surface roughness in AISI 52100 steel. Childs et al. [8,23] have experimentally investigated the effect of cutting edge radii on surface roughness in finish turning in multiple materials, and found that machine tool error can be a more dominating factor of finish turning roughness on conventional machines. Geometric modeling of surface roughness that accounts for tool edge geometry was performed in [24], but lacks significant validation and makes quite different assumptions than the model presented in this work. Schultheiss et al. [25] presented an analytical roughness model that takes into account hmin, but their definition and determination of hmin relies on questionable assumptions. Kountanya [26] developed a three dimensional model that accounted for tool edge radius and roughness effects, and showed similar trends as previous two dimensional efforts. Knuefermann [9] developed a geometric model to predict surface roughness based on tool geometry, edge defects and asynchronous error, yet ultimately does not consider side flow effects due to tool edge radius. Furthermore, many recent optimization studies of finish turning do not consider the effect of tool edge radius [27,28,29]. Hence, the relationship of roughness increase due to side flow (in light of tool edge radius) has been demonstrated to be relevant, yet is not commonly considered in recent works, and requires clarifying.
Roughness models that do consider the effect of hmin are often concerned with microcutting or diamond turning, where edge chamfers/radii are so small (on the scale of nanometers, rather than micrometers) they may nearly be neglected at reasonable feeds, as stated in [15]. Zong et al. [30] developed a model to predict roughness in diamond turning and gave consideration to MSF. Chen and Zhao [31] established a roughness prediction model that demonstrated an increase in roughness due to side flow. He et al. [32] has developed a model for diamond turning that incorporates plastic side flow based on a minimum chip thickness value. However, the incorporation of side flow is rather simple and relies upon multiple fitting of constants for calibration. In diamond turning, edge roughness is often a more relevant parameter than the minute value of hmin found on diamond tools, yet is not highly relevant in the comparatively duller tooling of precision and conventional machining. Additionally, these previous works have been primarily concerned with mathematically investigating surface roughness phenomena, and generally do not approach the understanding of the geometry of surface generation mechanics.
Little published work exists on the influence of tool edge radius on roughness due to process damping in turning. Alternatively, many studies have studied the evident link between observed vibration and surface roughness [9,33,34]. However, predicting this small-scale vibrational error in industrial applications is not trivial. Chatter prediction has been studied in depth as noted by Altintas and Weck [35]. However, chatter is deemed outside the scope of this work, as it is generally not acceptable in finish machining. Recently, observations were made by Biermann and Baschin [36] in micromilling surfaces regarding improved roughness due to process damping related to tool edge radius. Yusoff et al. [37] remarked that the role of edge geometry was significant in the damping of ‘macroscopic’ milling. Budak and Tunc. [38] present an excellent approach to modeling process damping in turning. However, the effort is still primarily concerned with chatter. Generally, previous efforts have not considered tool edge geometry’s effects on small positional errors of the tool that lead to surface roughness increase in very fine finishing.
This article outlines an iterative geometric model which is based on novel assumptions, intended to more accurately capture surface generation in finish machining (using finish turning as a representative process to demonstrate the methodology). This effort will be concentrated on examining the surface roughness prediction capabilities of a new iterative modeling approach, which is an indication of valid surface generation assumptions. It is worth mentioning that the same assumptions that give rise to surface finish also have significant implications for subsurface characteristics as well. While such surface integrity characteristics are outside the scope of the current manuscript, subsequent work will illustrate the intimate connection between the present (geometric) work, and surface integrity (thermomechanical material property) evolution.

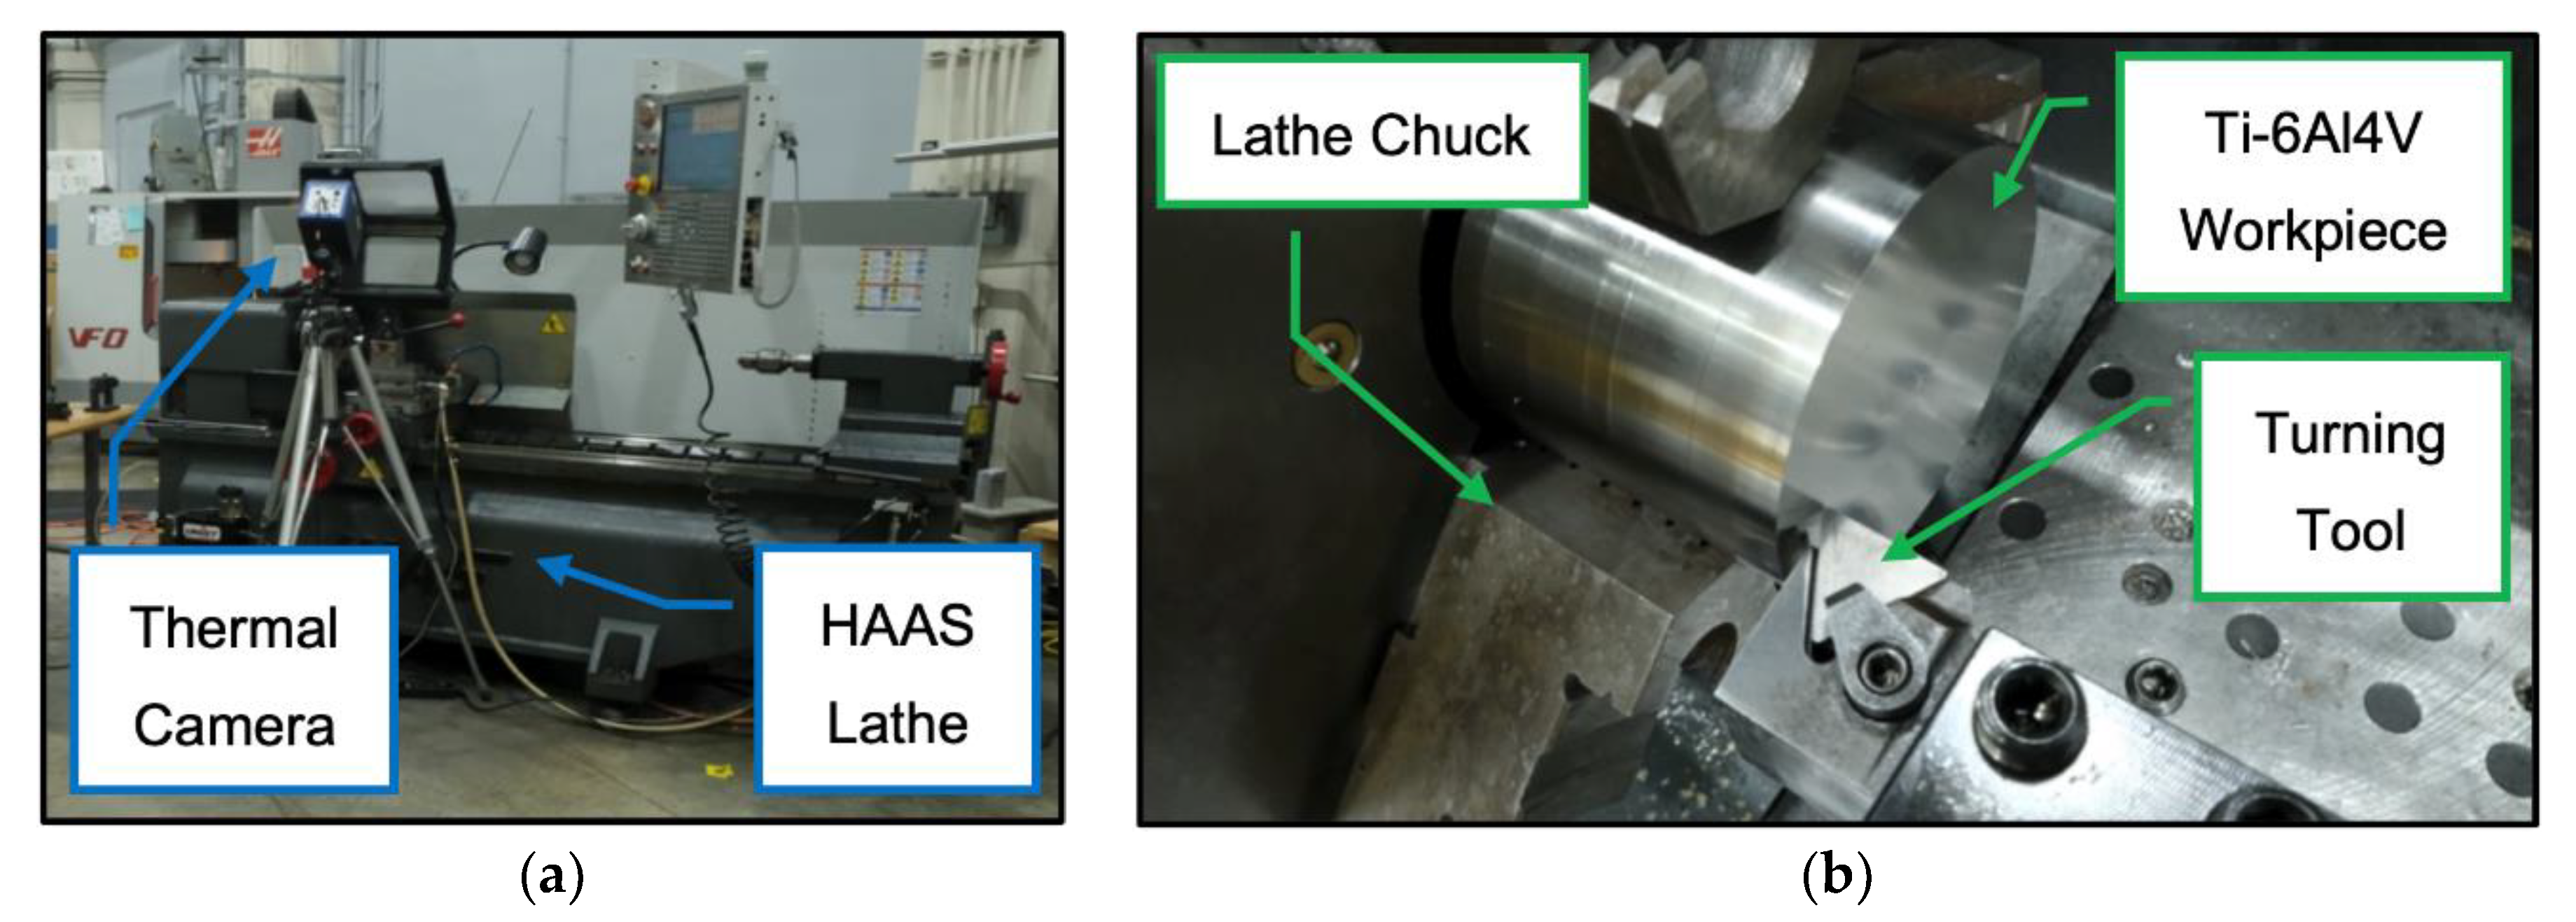
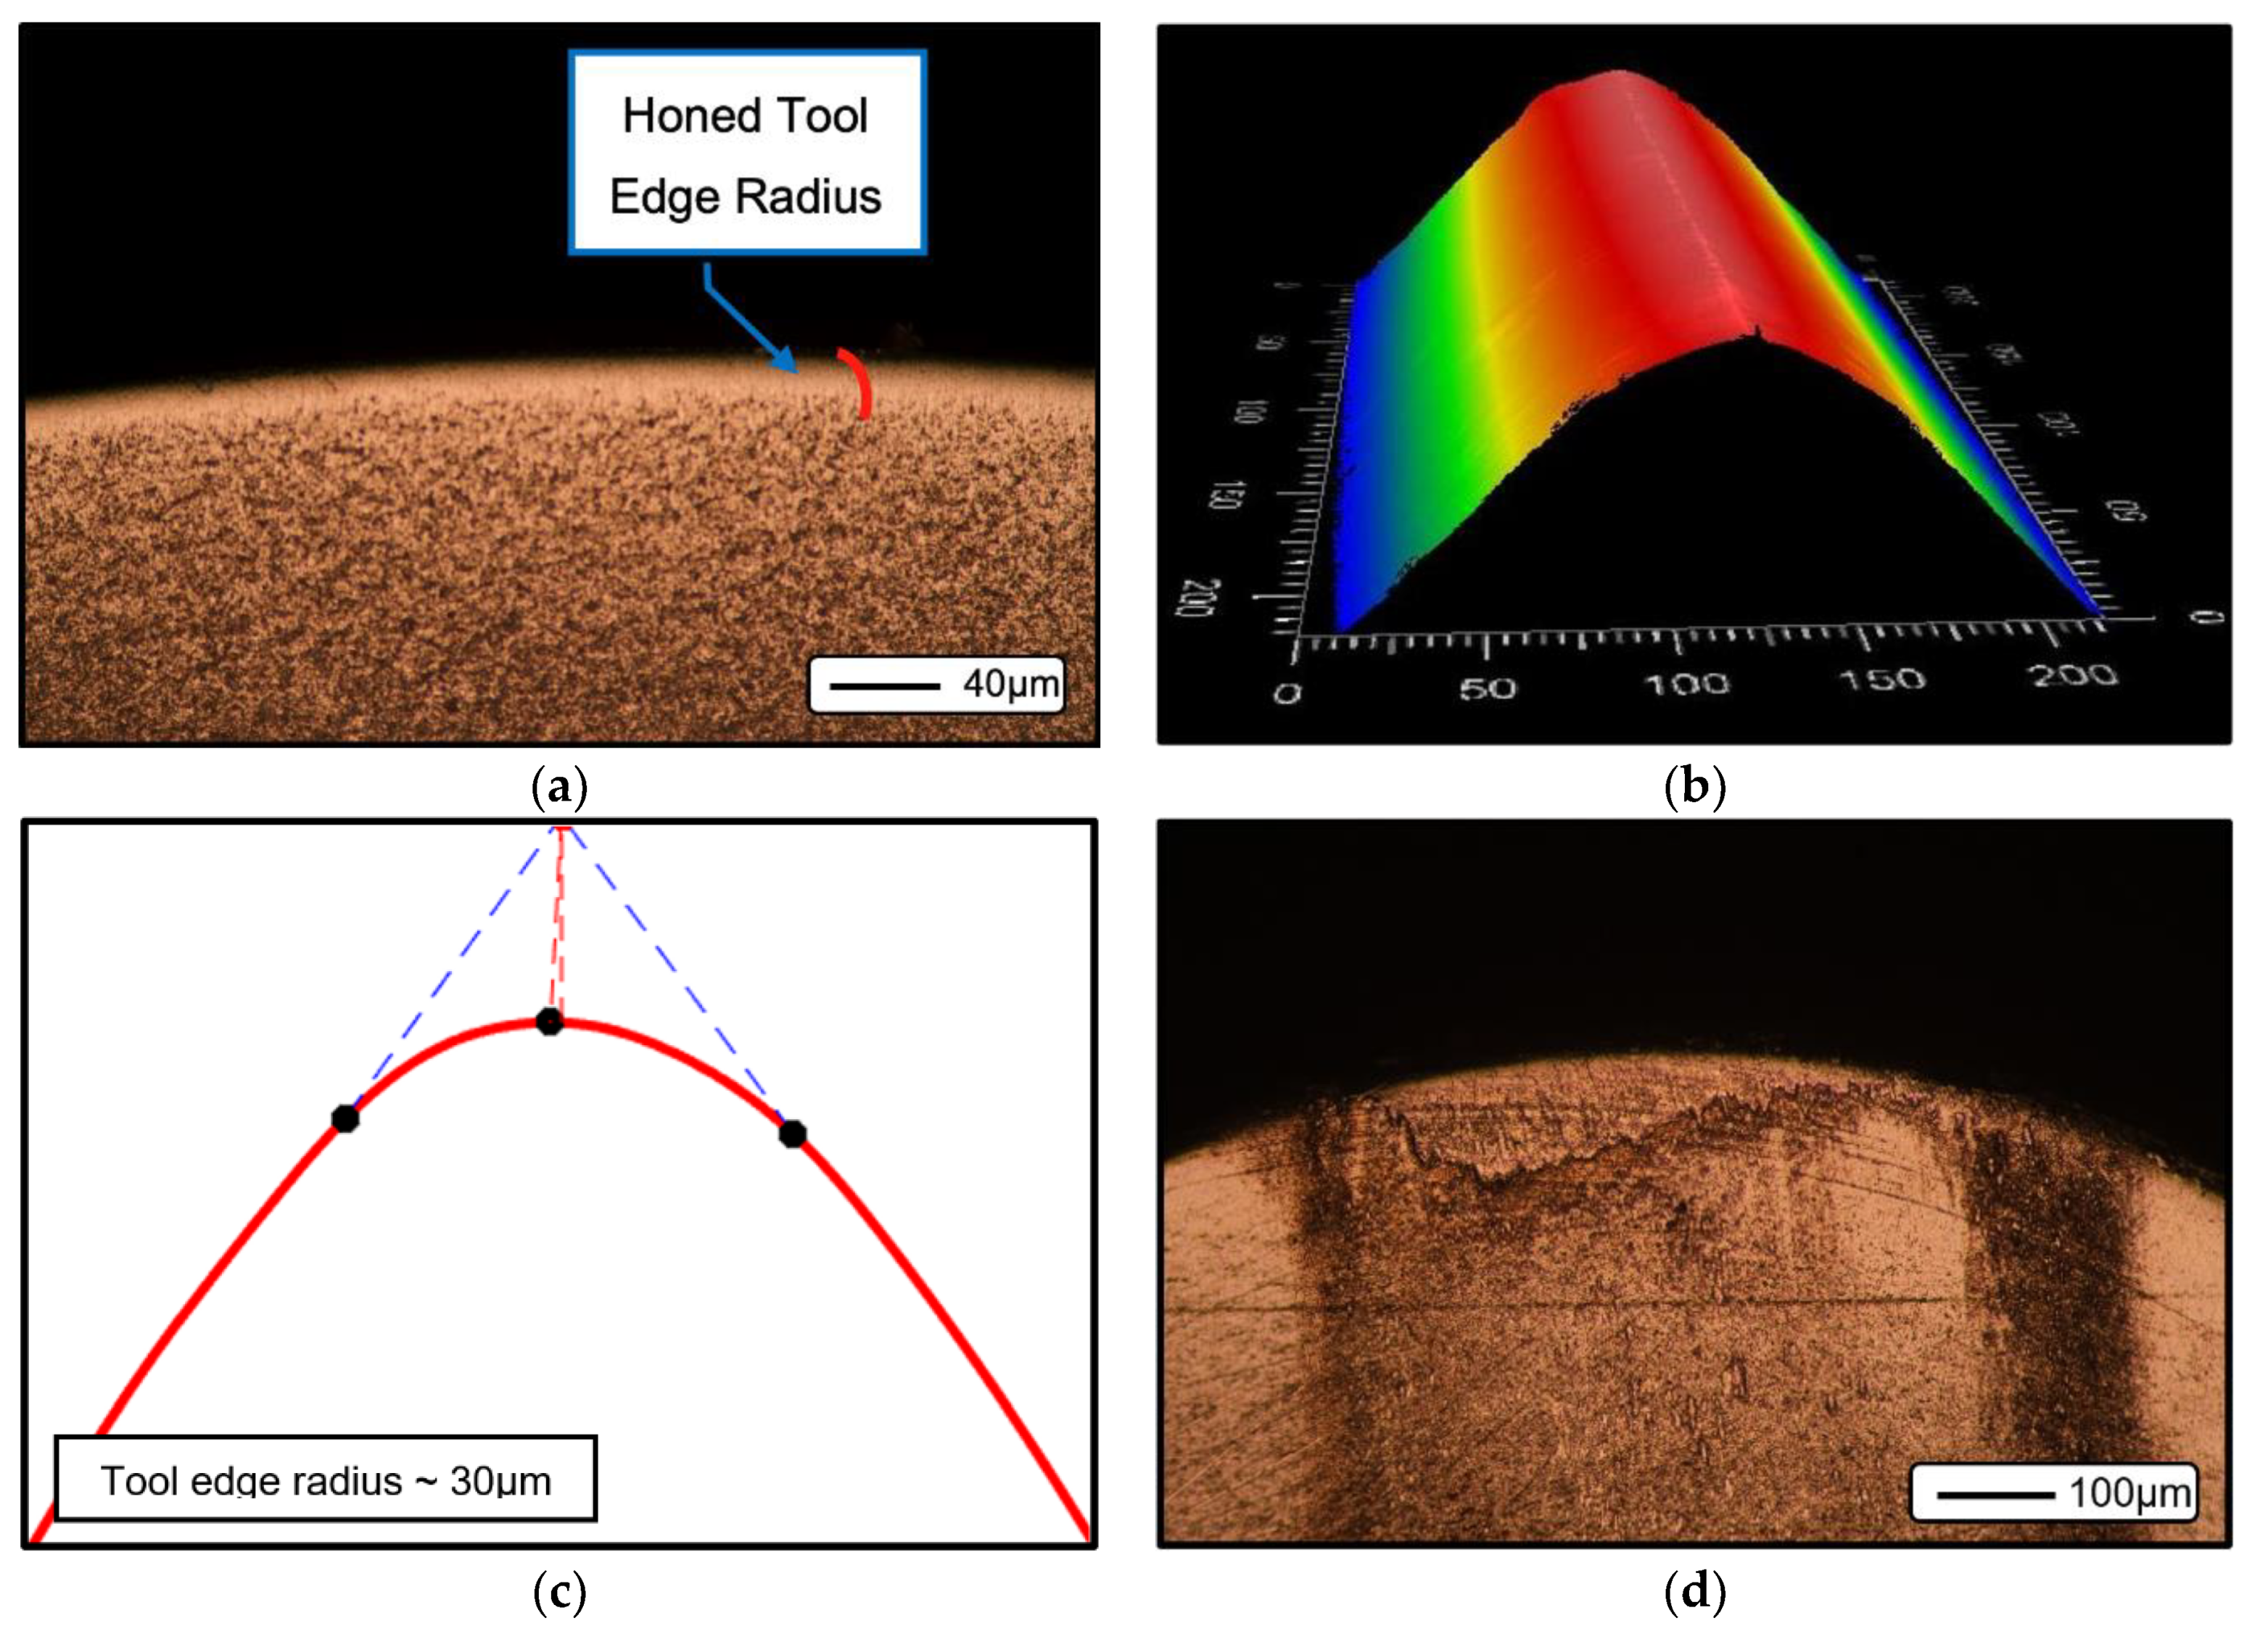
2. Materials and Methods

The following model was developed on a Dell Precision 3630 Desktop, with an Intel i9-9900 CPU. The model was developed in MATLAB, version 2019b. No toolboxes or third-party functions were used in any part of development.
The experimental work to calibrate the proposed model was conducted by means of face turning trials on a HAAS TL2 CNC lathe, as shown in Figure 3. Modified Kennametal TPGN (triangle) geometries of the uncoated, fine-grained carbide grade K-68 were used. The workpiece material was a cylindrical bar of Ti-6Al4V (60 mm diameter, annealed condition, 35 HRC).
A range of feeds and nose radii, outlined in Table 1 below, was selected to provide various combinations of uncut chip geometry and kinematic roughness. Beyond this table, differing conditions of nose radius and feed will be merged and often referred to as one factor: predicted kinematic roughness Rt/Rz and Ra, the equations for which are shown below. All other variable parameters were held constant during these trials. Constant parameters of some consequence include cutting speed (vc), held at 288 m/min, depth of cut (ap), held at 0.25 mm, and coolant/lubrication, which was not present.
R t / R z = f 2 8 r c
R a = f 2 32 r c
The preparation of experimental cutting tool edges was accomplished by a novel honing method developed by the authors that creates tool edge radii with final geometry accuracy variance of less than 20%. This method relies upon the use of a HAAS VF-2 CNC milling machine equipped with a diamond paste-impregnated buffing wheel. An example of the tool edge radii generated by this methodology is shown in Figure 4. The tools honed by this method exhibit very low edge roughness.
Prior to each test condition, the workpiece face was prepared for the next condition by chamfering the sharp edge and cleaned up with an unworn sharp tool in order to standardize initial conditions. After each condition, the machined surface was parted from the main bar for subsequent analysis. In total, 15 surface specimens were generated. Each condition and associated tool edge was utilized for the production of a single sample. Each edge was subsequently checked for tool wear to ensure the surface was not affected by wear artifacts, as shown in Figure 4d. The subsequent surface roughness measurements were conducted on a Zygo NewView 7300 scanning white light interferometer with a spatial resolution of approximately 2 nm (manufactured by AMETEK Inc., Berwyn, PA, USA). Three scans were completed on each sample at different locations to ensure significant values.

3. Results and Discussion

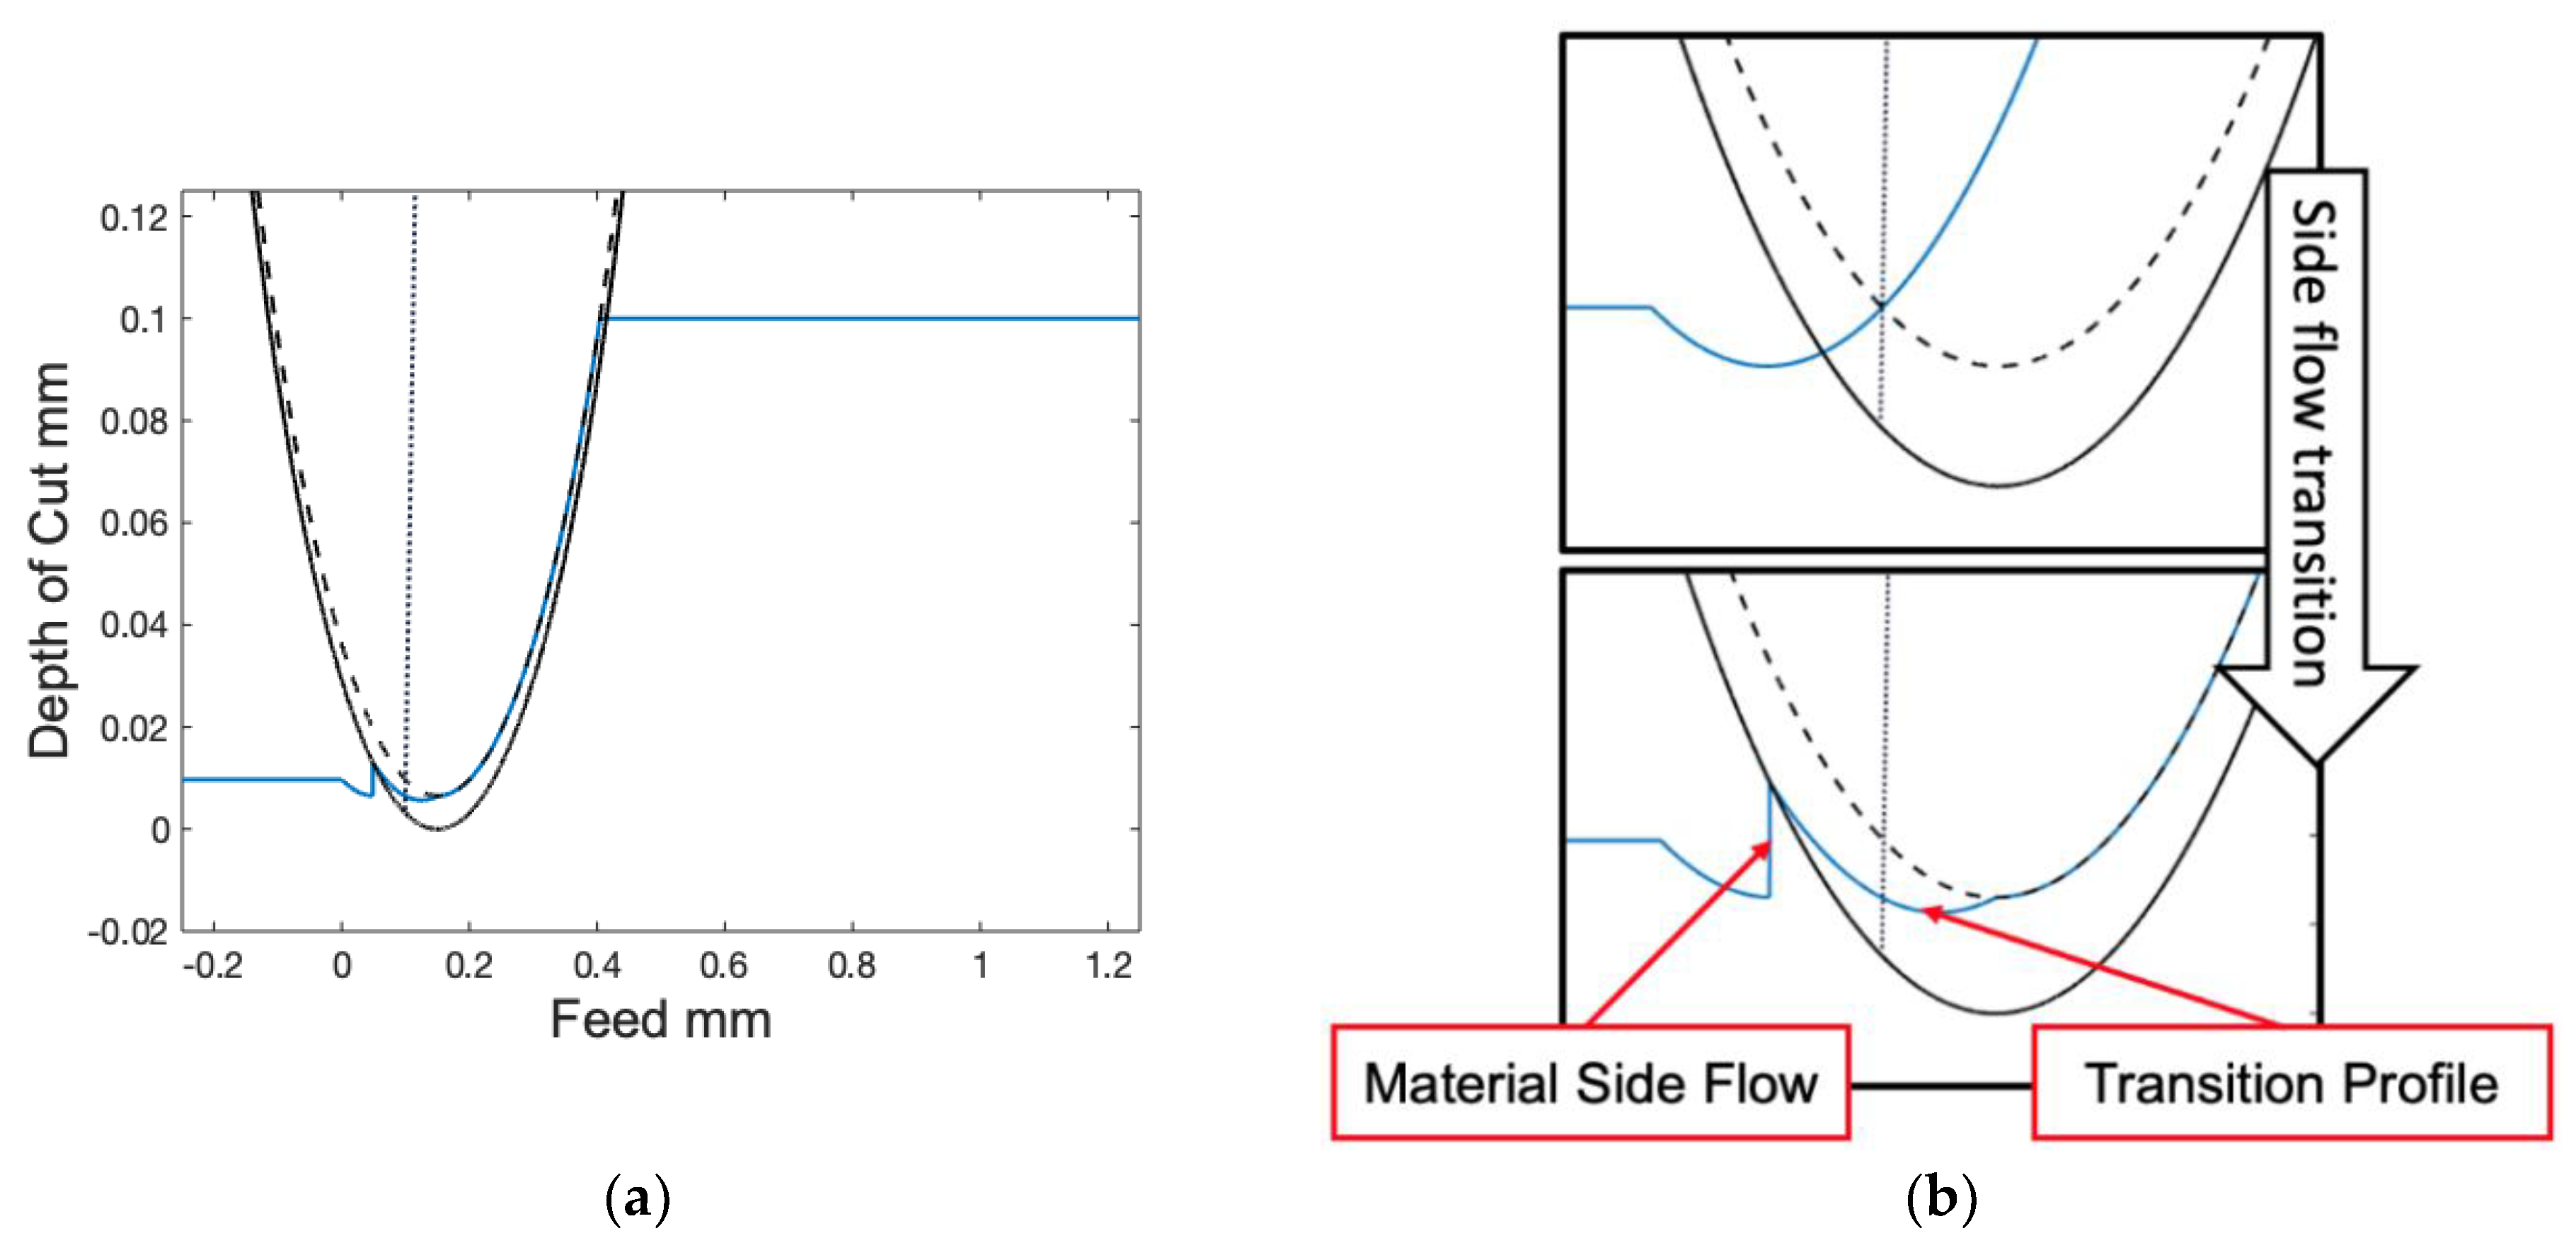
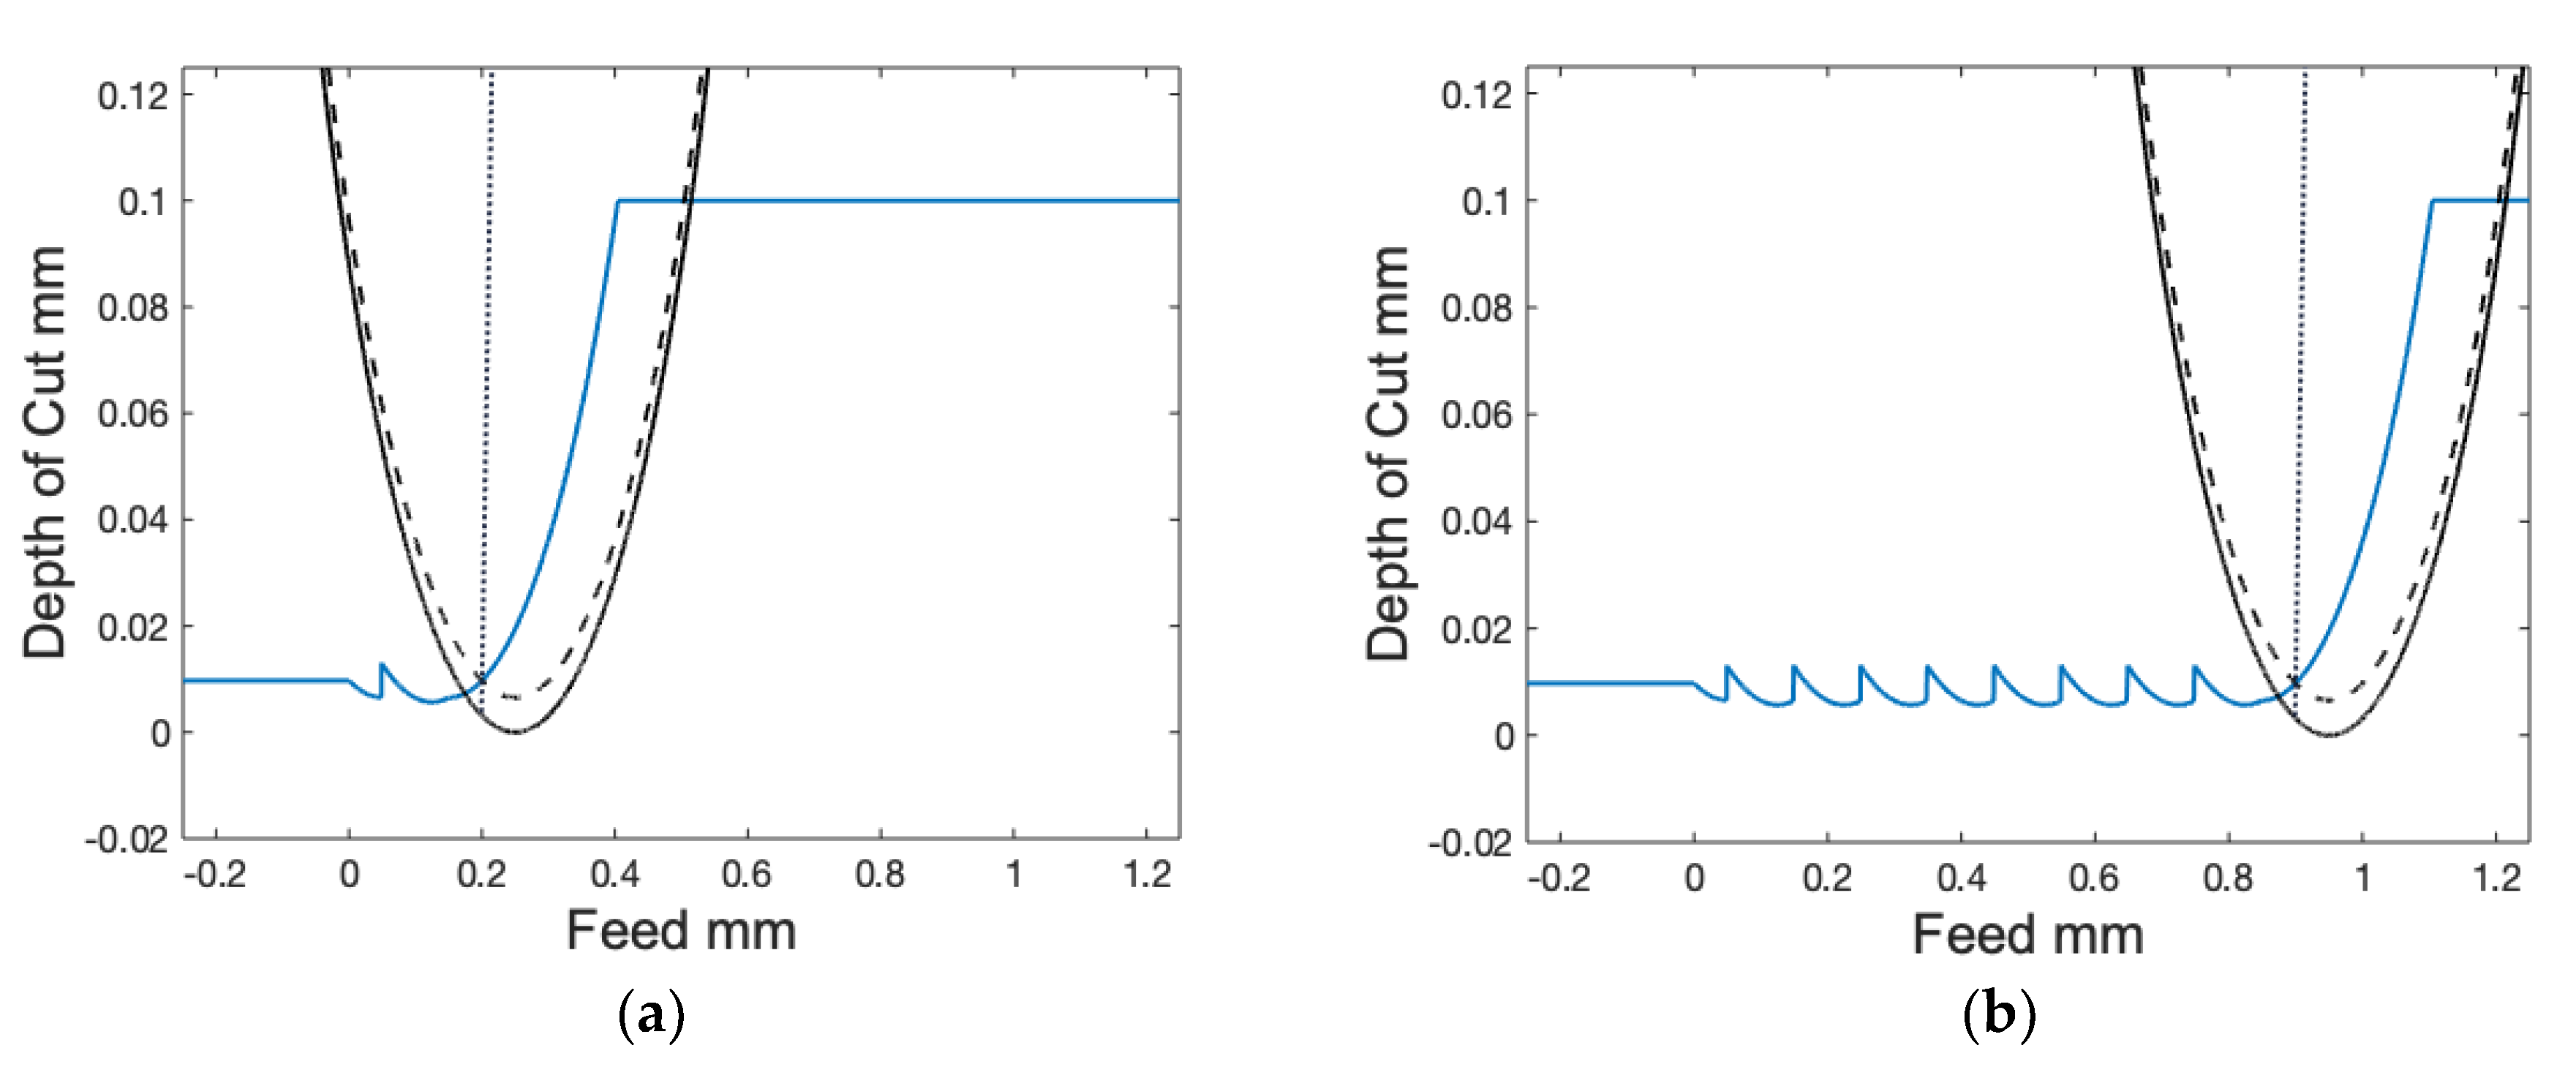
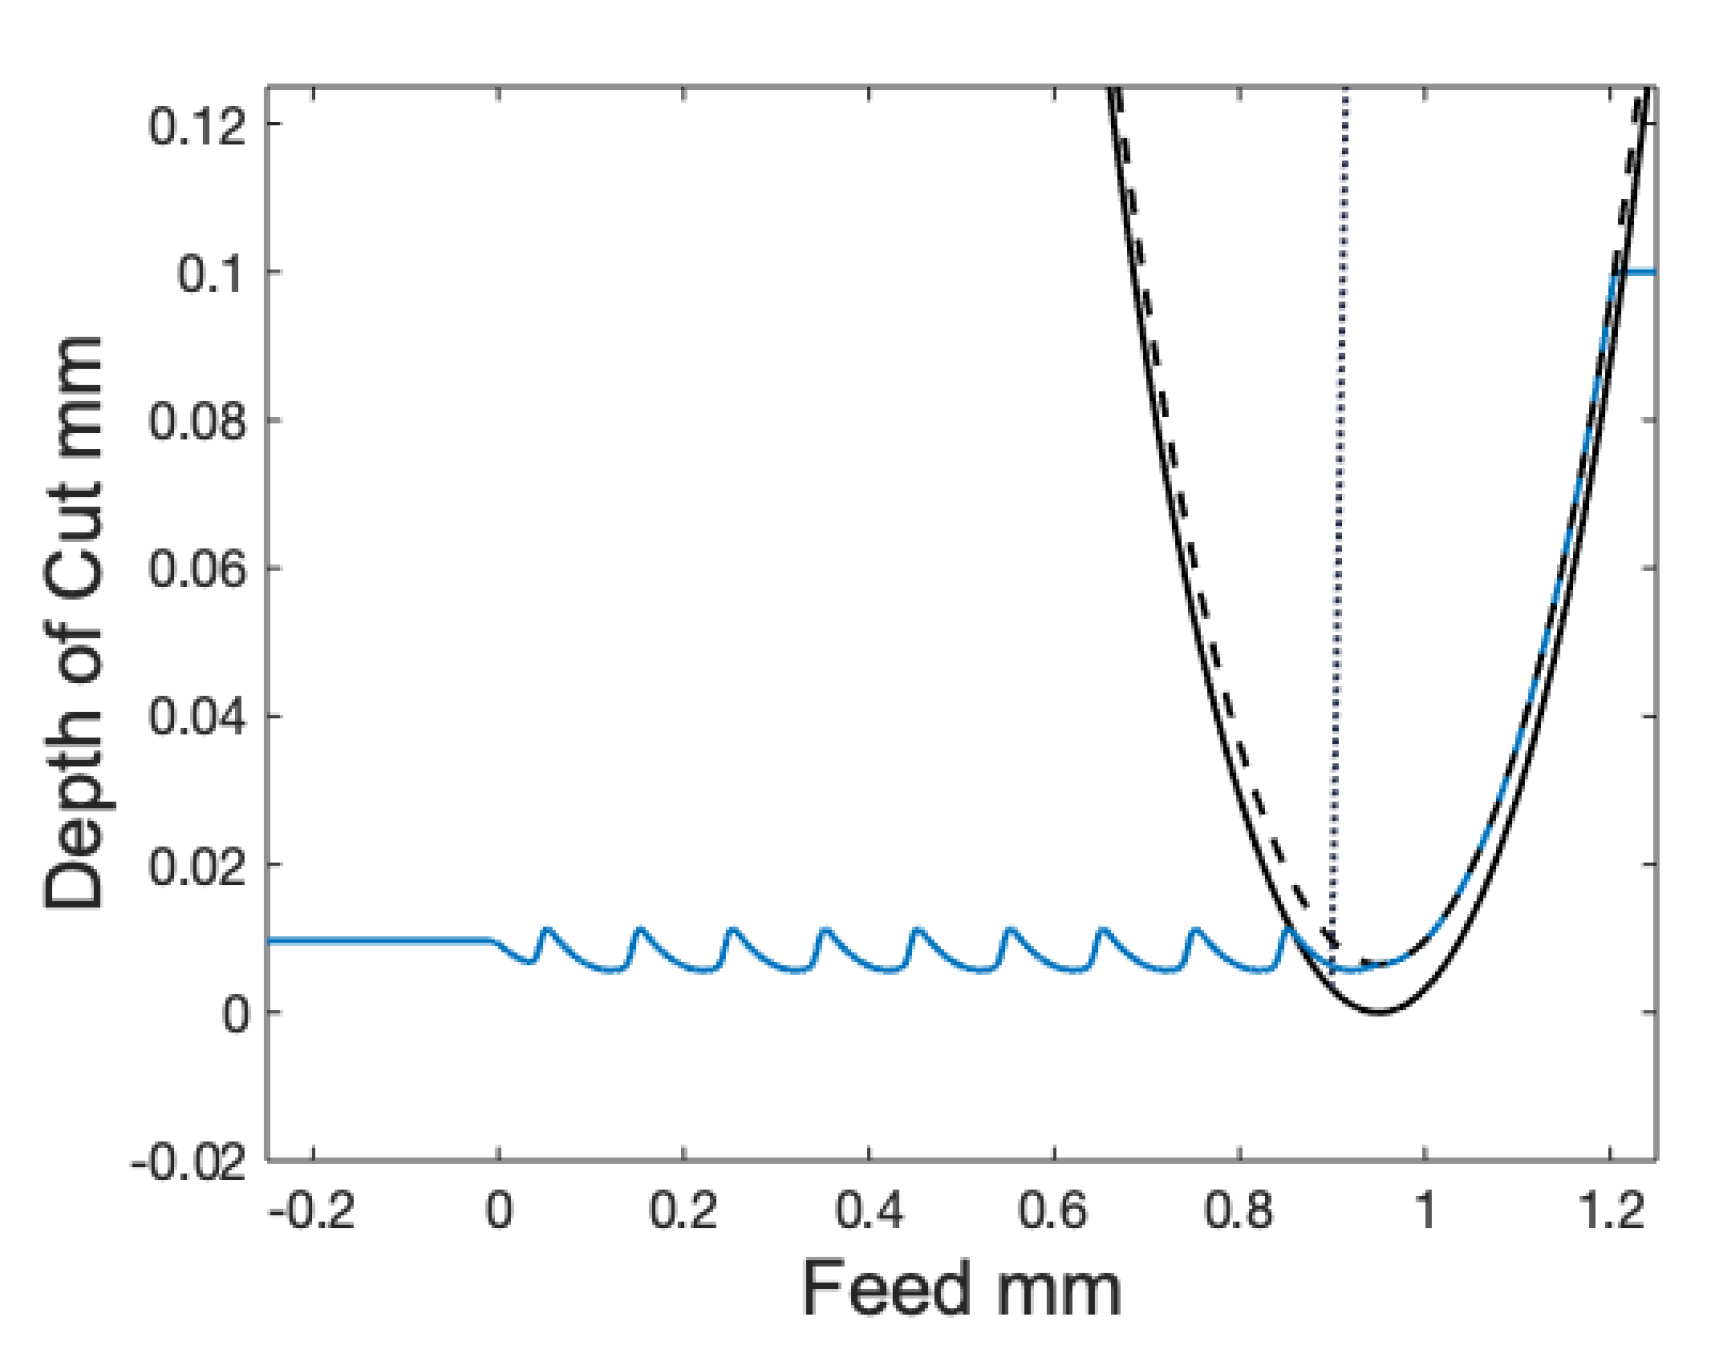
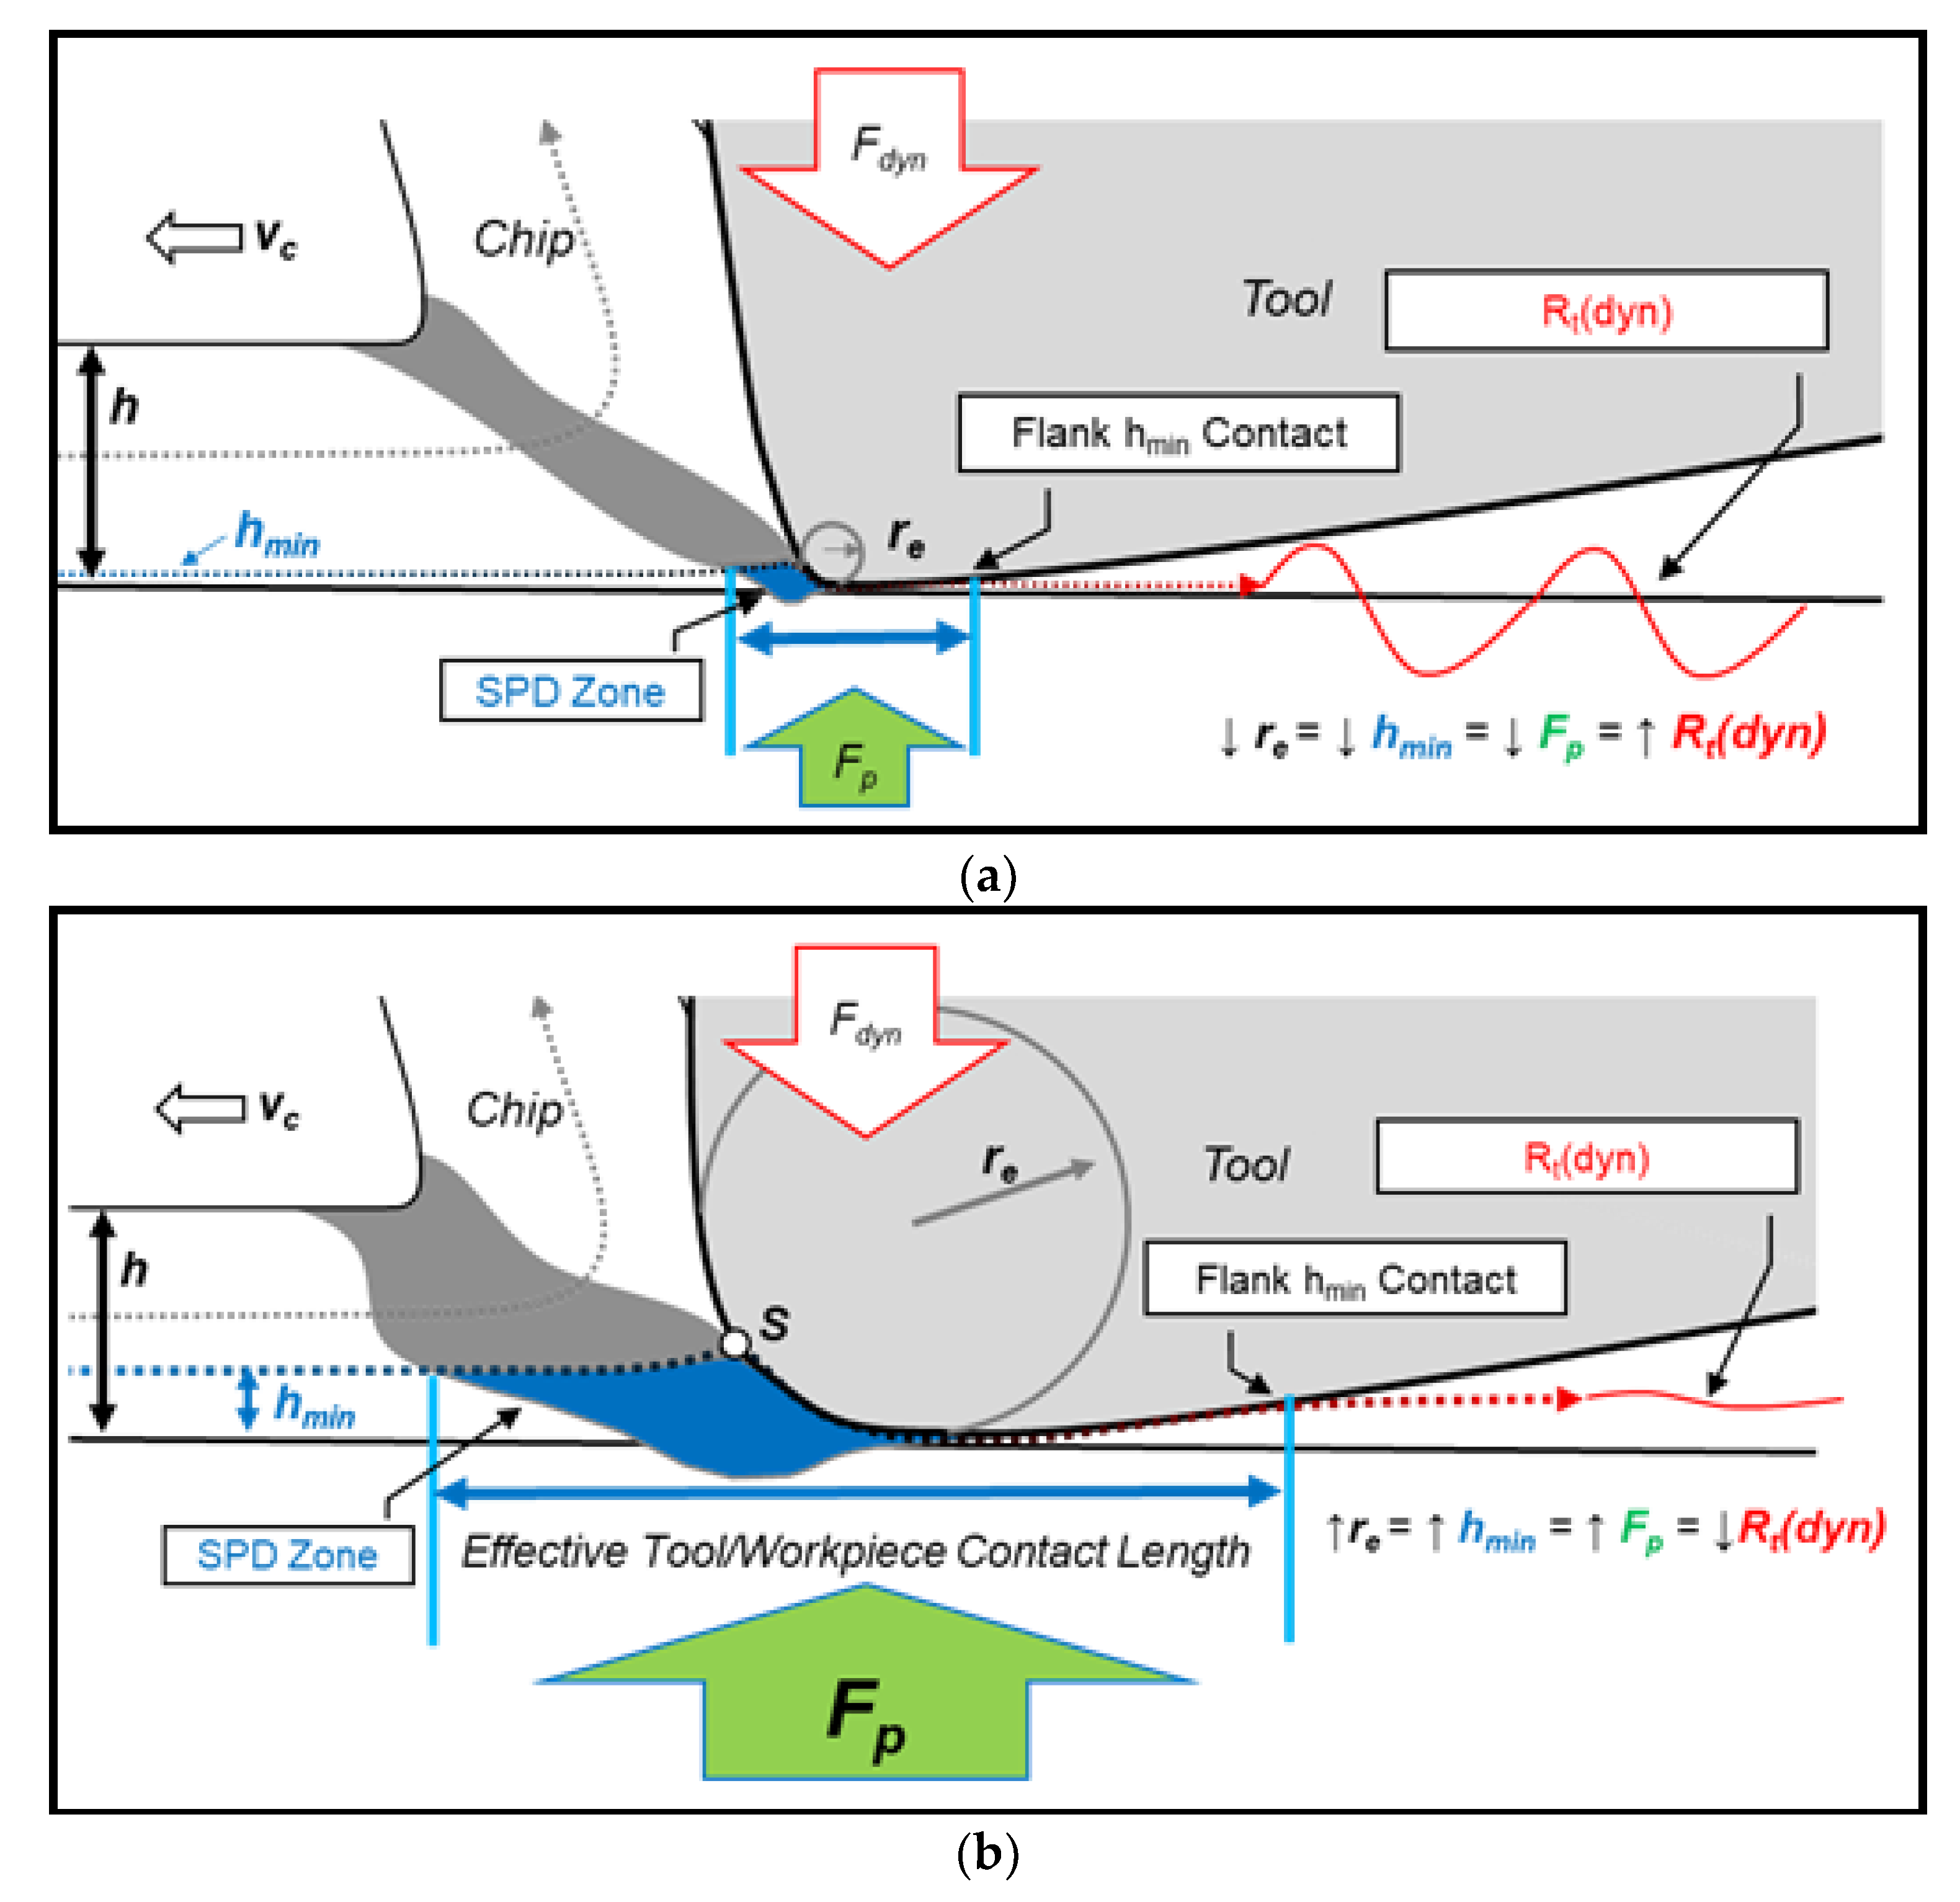
3.1. Model Assumptions

In order to develop a more accurate model, more appropriate assumptions must be made. One key assumption relates to the behavior of material along the cutting edge under hmin, i.e., the Spanzipfel region. Indeed, much of the current understanding is based on Brammertz’s Spanzipfel assumption, where material of chip thickness below hmin flows underneath the tool, while material of chip thickness above hmin is evacuated entirely from the workpiece. This represents an on/off transition between ploughing and cutting, and in turn implies the creation of a perfect copy of the tool profile on the workpiece for all points along the tool edge where material is above hmin. These assumptions give rise to the pointed Spanzipfel region of material (as can be seen in Figure 1b), which is not generally observed on real machined surfaces. In order to realize more accurate modeling of surface roughness, it is imperative to (at least qualitatively) match the model mechanics to the reality of the cutting process. This includes the fact that some material does indeed flow under the tool, with spring back subsequently occurring along the flank/clearance face of the tool, as well as the occurrence of side flow of some magnitude—both phenomena having been qualitatively established by Lambert [11].
Arcona and Dow [39] have calculated the spring back of machined material to be a linear function of the tool edge radius for a given material, which follows logically from the hmin and conservation of volume considerations. Work to quantify this spring back has been done. However, more experimental understanding of the effect of material properties and tool parameters on the size of this spring back is required for full understanding of its nature [4,40,41]. At this point, it seems clear that material less than the hmin flows and is deformed under the cutting edge, to be recovered after the tool passes over it. This recovery is often assumed to be largely due to the elastic properties of the bulk material. However, much of the material near the surface is plastically deformed due to ploughing and shear deformation, as illustrated by Oxley and Challen’s [42] foundational work on the nature of polishing and wear mechanisms. Nevertheless, the work presented here shall assume that full spring back will occur for any section of the tool edge where material in this region is well supported from either side to prevent side flow, i.e., plane strain may be assumed.
Material at the two extreme ends of the uncut chip region, i.e., near the free surfaces of the cut on the primary and the secondary cutting edges, is not under plane strain constraint, and will therefore be susceptible to being “squeezed” out sideways from in between the flank and workpiece, as mentioned in Pekelharing and Gieszen’s work [13]. As a result, the Spanzipfel region, which is located at the extreme (secondary) edge of the uncut chip region, does not form. Rather, some material in this region is displaced sideways by the advancing tool edge, due to the high stresses and lack of plane stress. In the presented model, we assume that the amount of material which is displaced as side flow is directly related to the geometric area of the Spanzipfel.
These assumptions lead to a side flow region which is dependent upon feed, nose radius, and edge radius, as well as a raised part surface that is established by the elastic spring back of hmin. Notably, side flow occurs due to hmin in a similar manner as the Brammertz effect is assumed to occur. However, the occurrence and transition between flow underneath the tool (not technically the Brammertz effect, but ploughing/severe plastic deformation akin to the mechanics of polishing and burnishing) and side flow is affected by the ‘boundary conditions’ of the deformation (i.e., presence or absence of rigid material constraints due to adjacent material in the uncut chip), as stated previously.

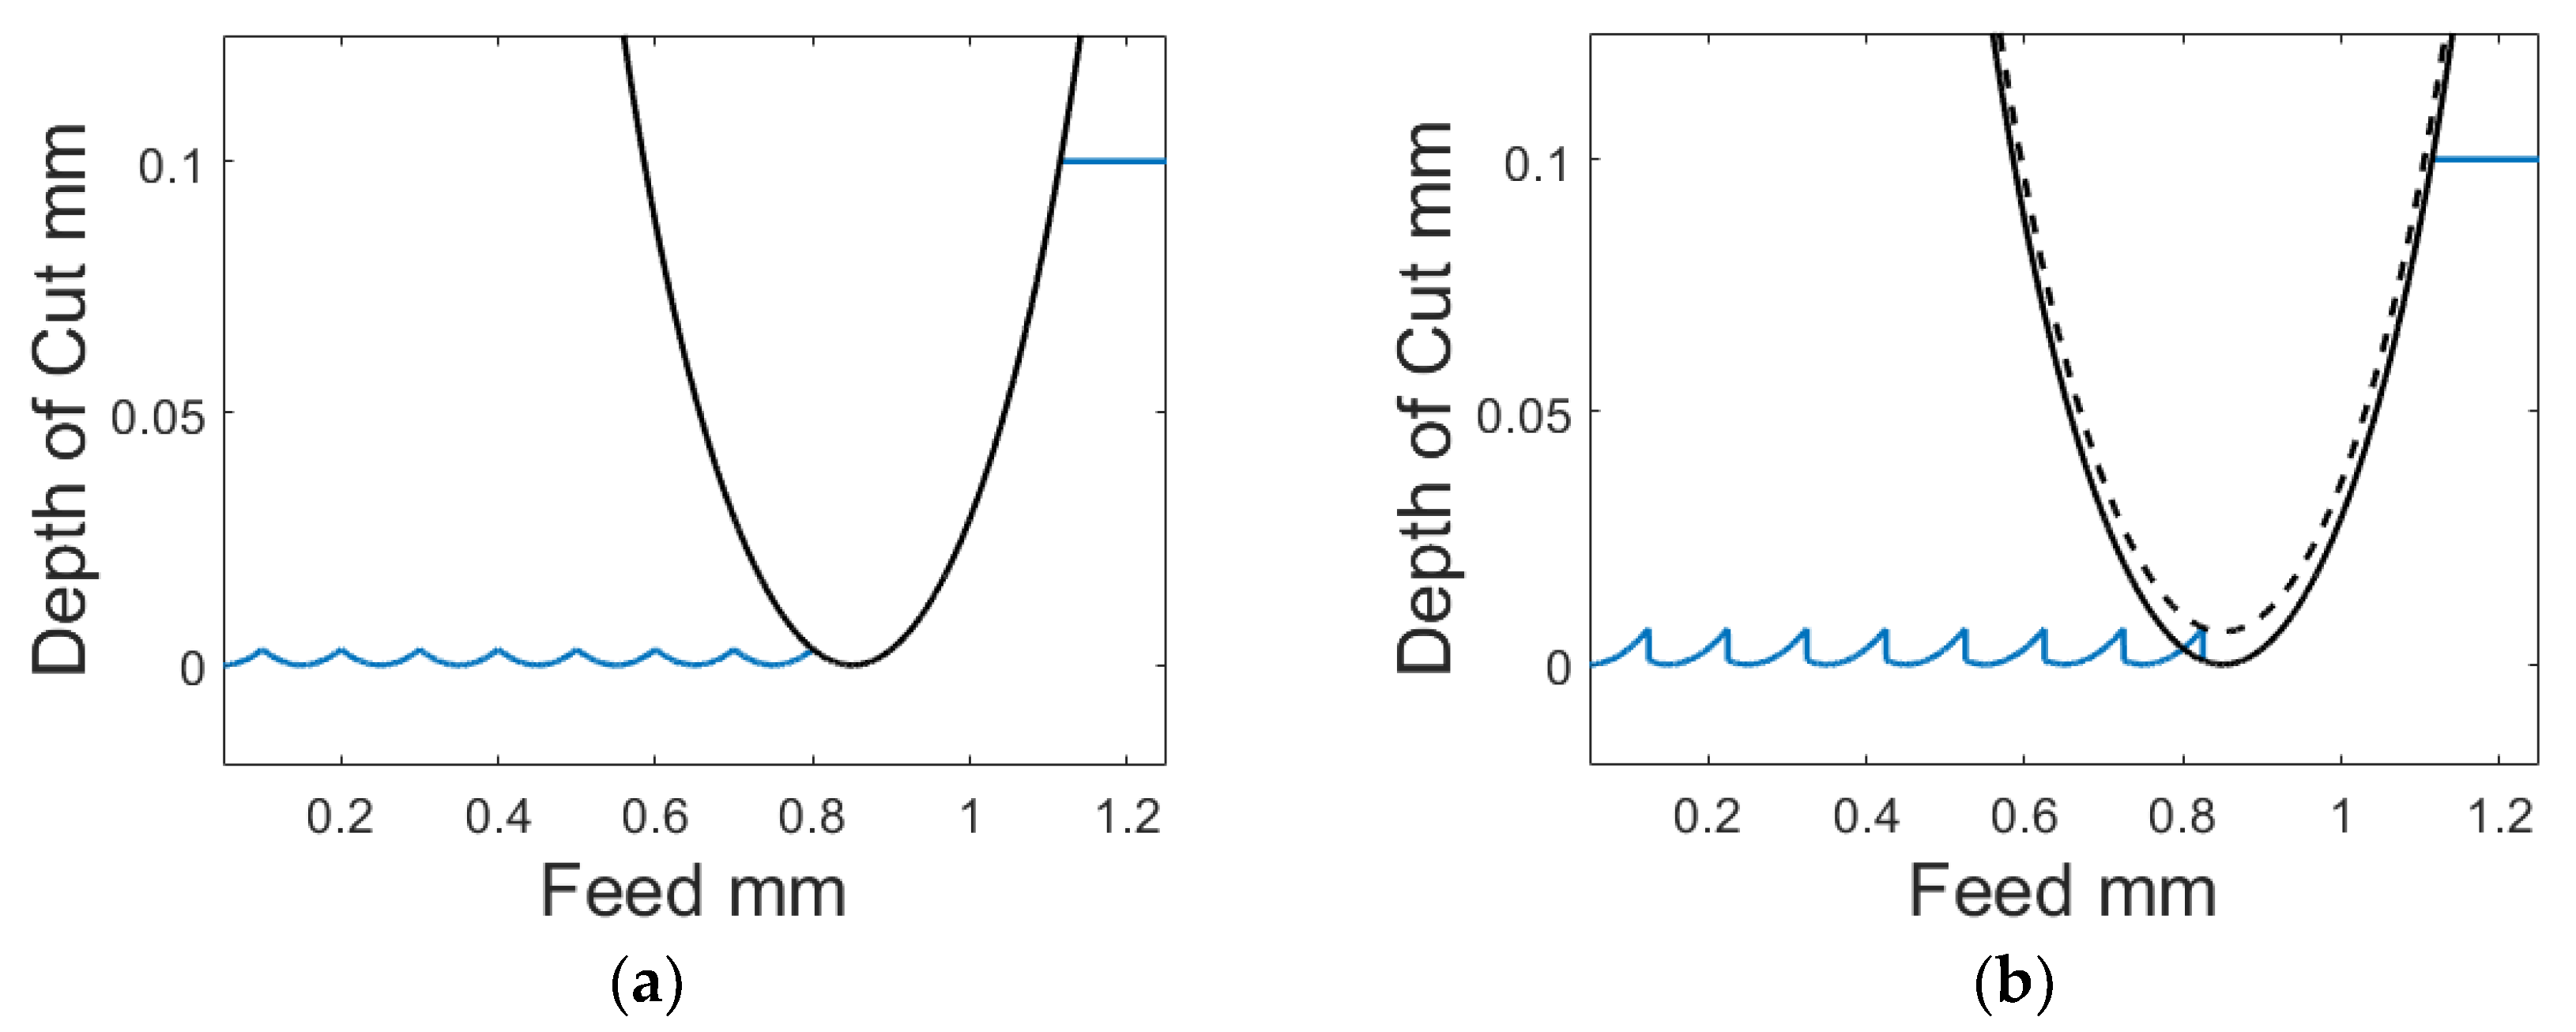
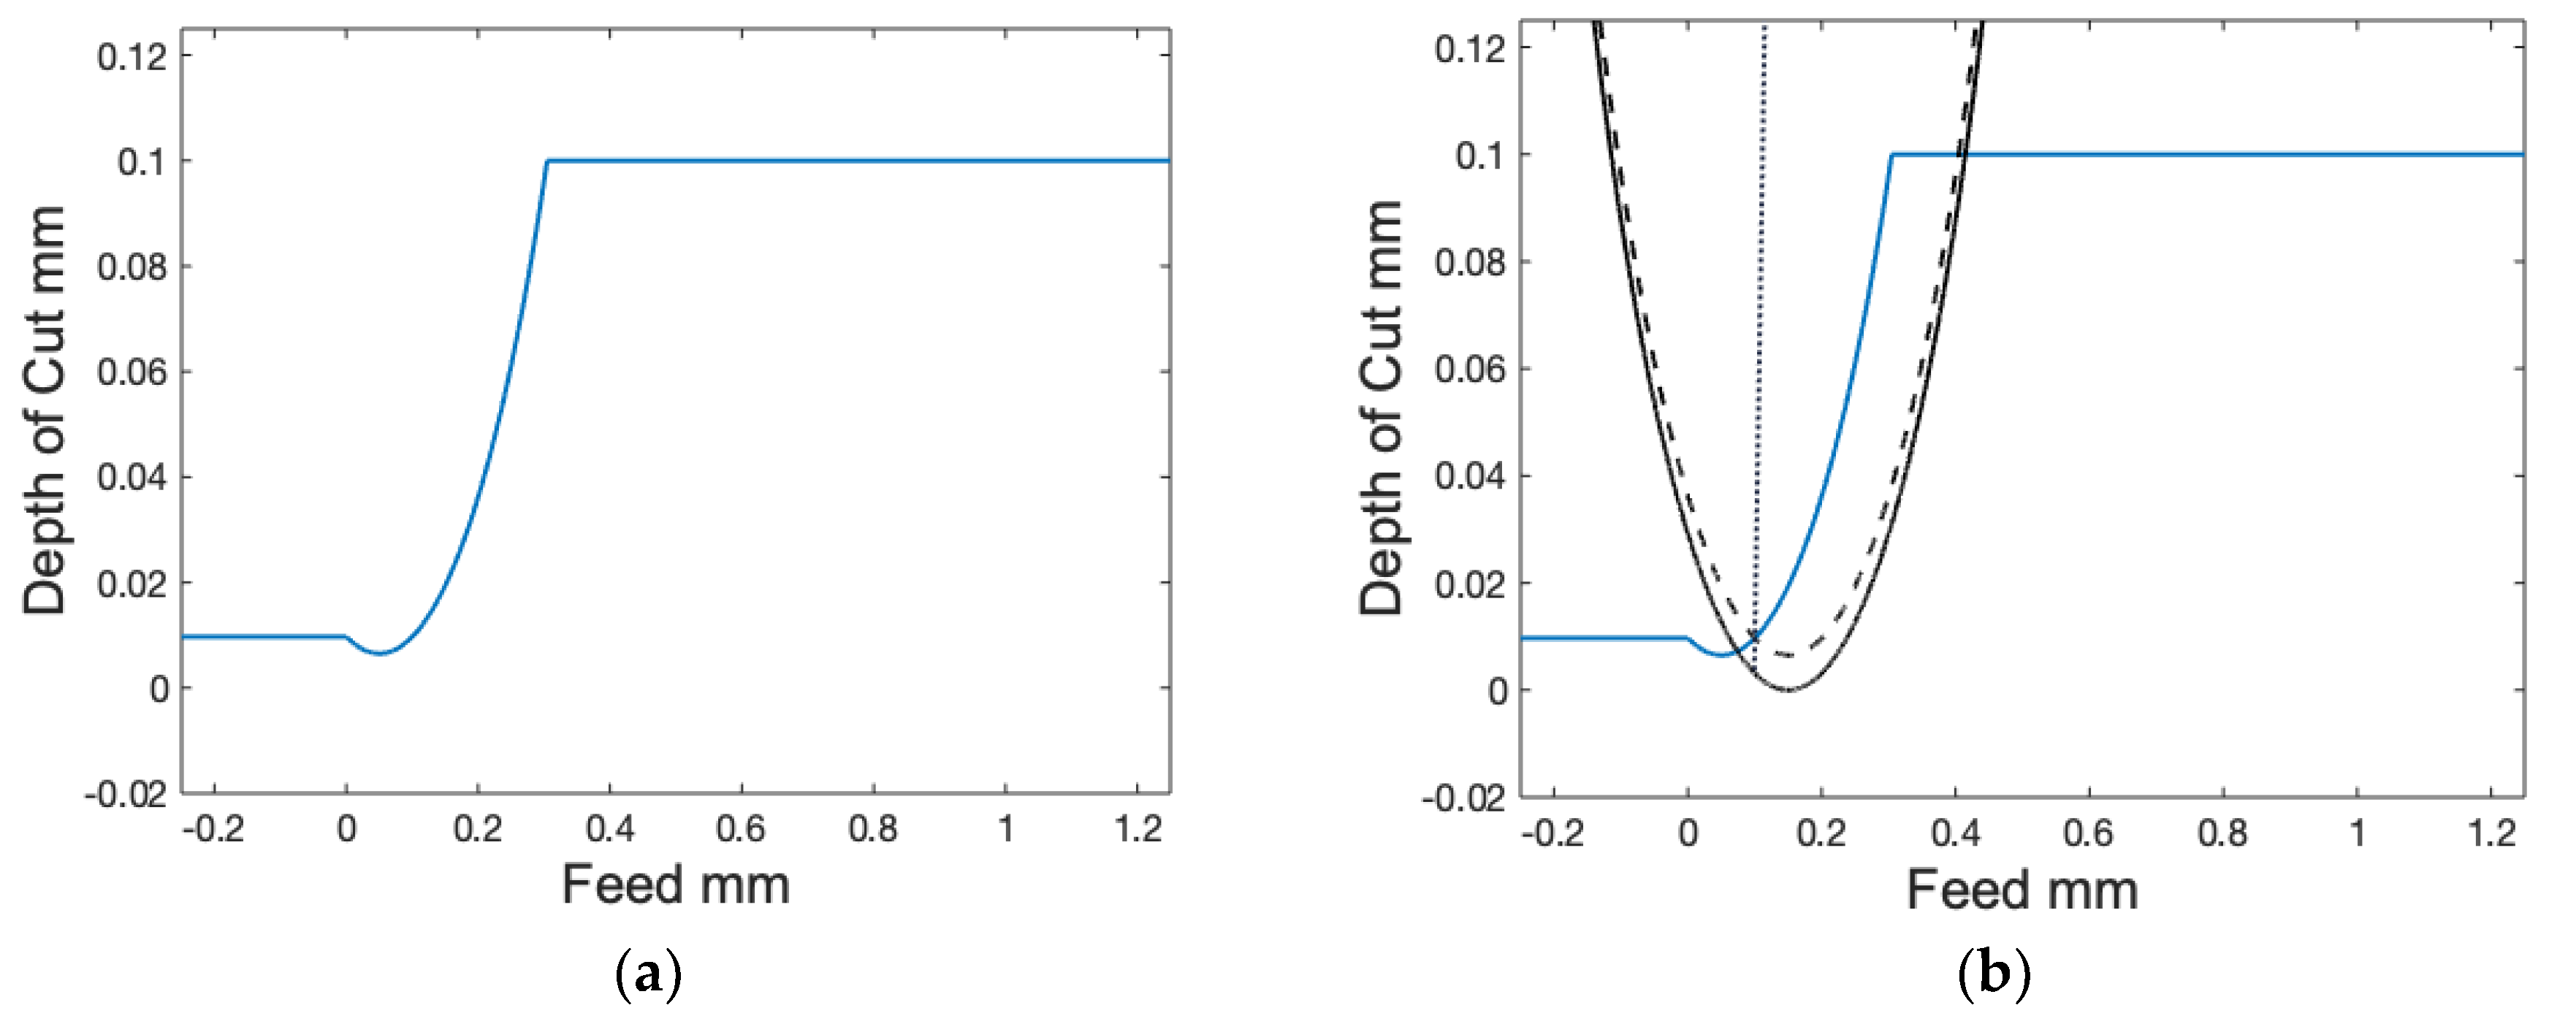
3.2. Model Development

The proposed iterative geometric model initializes by assuming some starting workpiece surface geometry after a single workpiece revolution, as shown below in Figure 5a. Any tool geometry and feed may be defined for this model. However, to clearly represent the process in the following figures, the following parameters have been selected: rc = 0.4 mm, hmin = 6.5 µm, and f = 0.1 mm.
The curved region in the middle of Figure 5a is the ideal tool projection copied onto the workpiece surface, offset to the interior by hmin to account for the assumption that the material less than hmin will recover on the other side of the tool. It should be noted that the curved section in this and subsequent figures is represented as a circle in the model, yet appears to be elliptical here due to the scaling differential of the x and y axes. The lower linear region is somewhat arbitrary, but it is included as an initial condition necessary to simplify the computation of future iterations. The height of this linear region is again, arbitrary, but set equal to the value of kinematically predicted roughness Rt/Rz in order to approximate the geometry of any previously generated surface. The upper linear region is the existing material surface, to be machined. This will move vertically relative to the other geometry depending on the depth of cut.
Once initial surface geometry has been created, the tool geometry is imposed on the workpiece geometry for the upcoming tool path segment, as shown in Figure 5b. The tool geometry is composed of two profiles, shown here as solid black and dashed black. The exterior solid profile represents the true tool profile, while the interior dashed profile represents the tool profile shape, offset by hmin. A profile has been added to this image to show where the uncut chip thickness drops below hmin, creating the Spanzipfel geometry discussed previously. The plane stress region which occurs at the opposing end of the uncut chip (on the primary edge) is not typically considered relevant to the final surface geometry, and therefore is not considered in this model.
In order to model the surface profile created by this new tool path segment, this Spanzipfel region is then transposed into the open space between the workpiece and tool, as shown in Figure 6. A transition surface profile is computed that begins at the peak of this transposed MSF area and gradually approaches the dashed hmin profile. This profile is formulated so that volume is conserved in this region, accounting for the displaced side flow volume. Once this profile reaches hmin, the newly generated surface will be found at the hmin profile (dashed black) over the remainder of the tool edge, not the full tool profile (solid black).
These profiles are then consolidated to form the new surface profile, and the tool geometry is translated by the feed to begin this process for the next path, shown in Figure 7a. This iterative process is repeated until the altered surface profile reaches an adequate length and equilibrium is established, as shown below in Figure 7b. This figure also shows the inclusion of the assumption that material spring back will alter the surface profiles generated by the model, as can be seen in the workpiece model’s final surface being substantially higher than the tool nose minima at all points.
It was found, through comparison to experimental data, that the surface profiles overpredicted roughness. This follows logically from observation of machined studies as noted in previous efforts; roughness peaks are generally round, not sharp, as portrayed in Figure 7b. To address this, profiles were subsequently filtered with a Gaussian filter—the window size of which was adjusted according to the square root of the feed at each condition. The result of this Gaussian filtering on the current profile is shown in Figure 8 below.
The model then calculates roughness values Rt/Rz and Ra for the profiles under different conditions of nose radius, edge radius and feed. The modeled roughness values are then plotted against predicted kinematic roughness to show the relationship between tool edge radius and kinematically predicted surface roughness on the model predicted values of Ra and Rt/Rz.

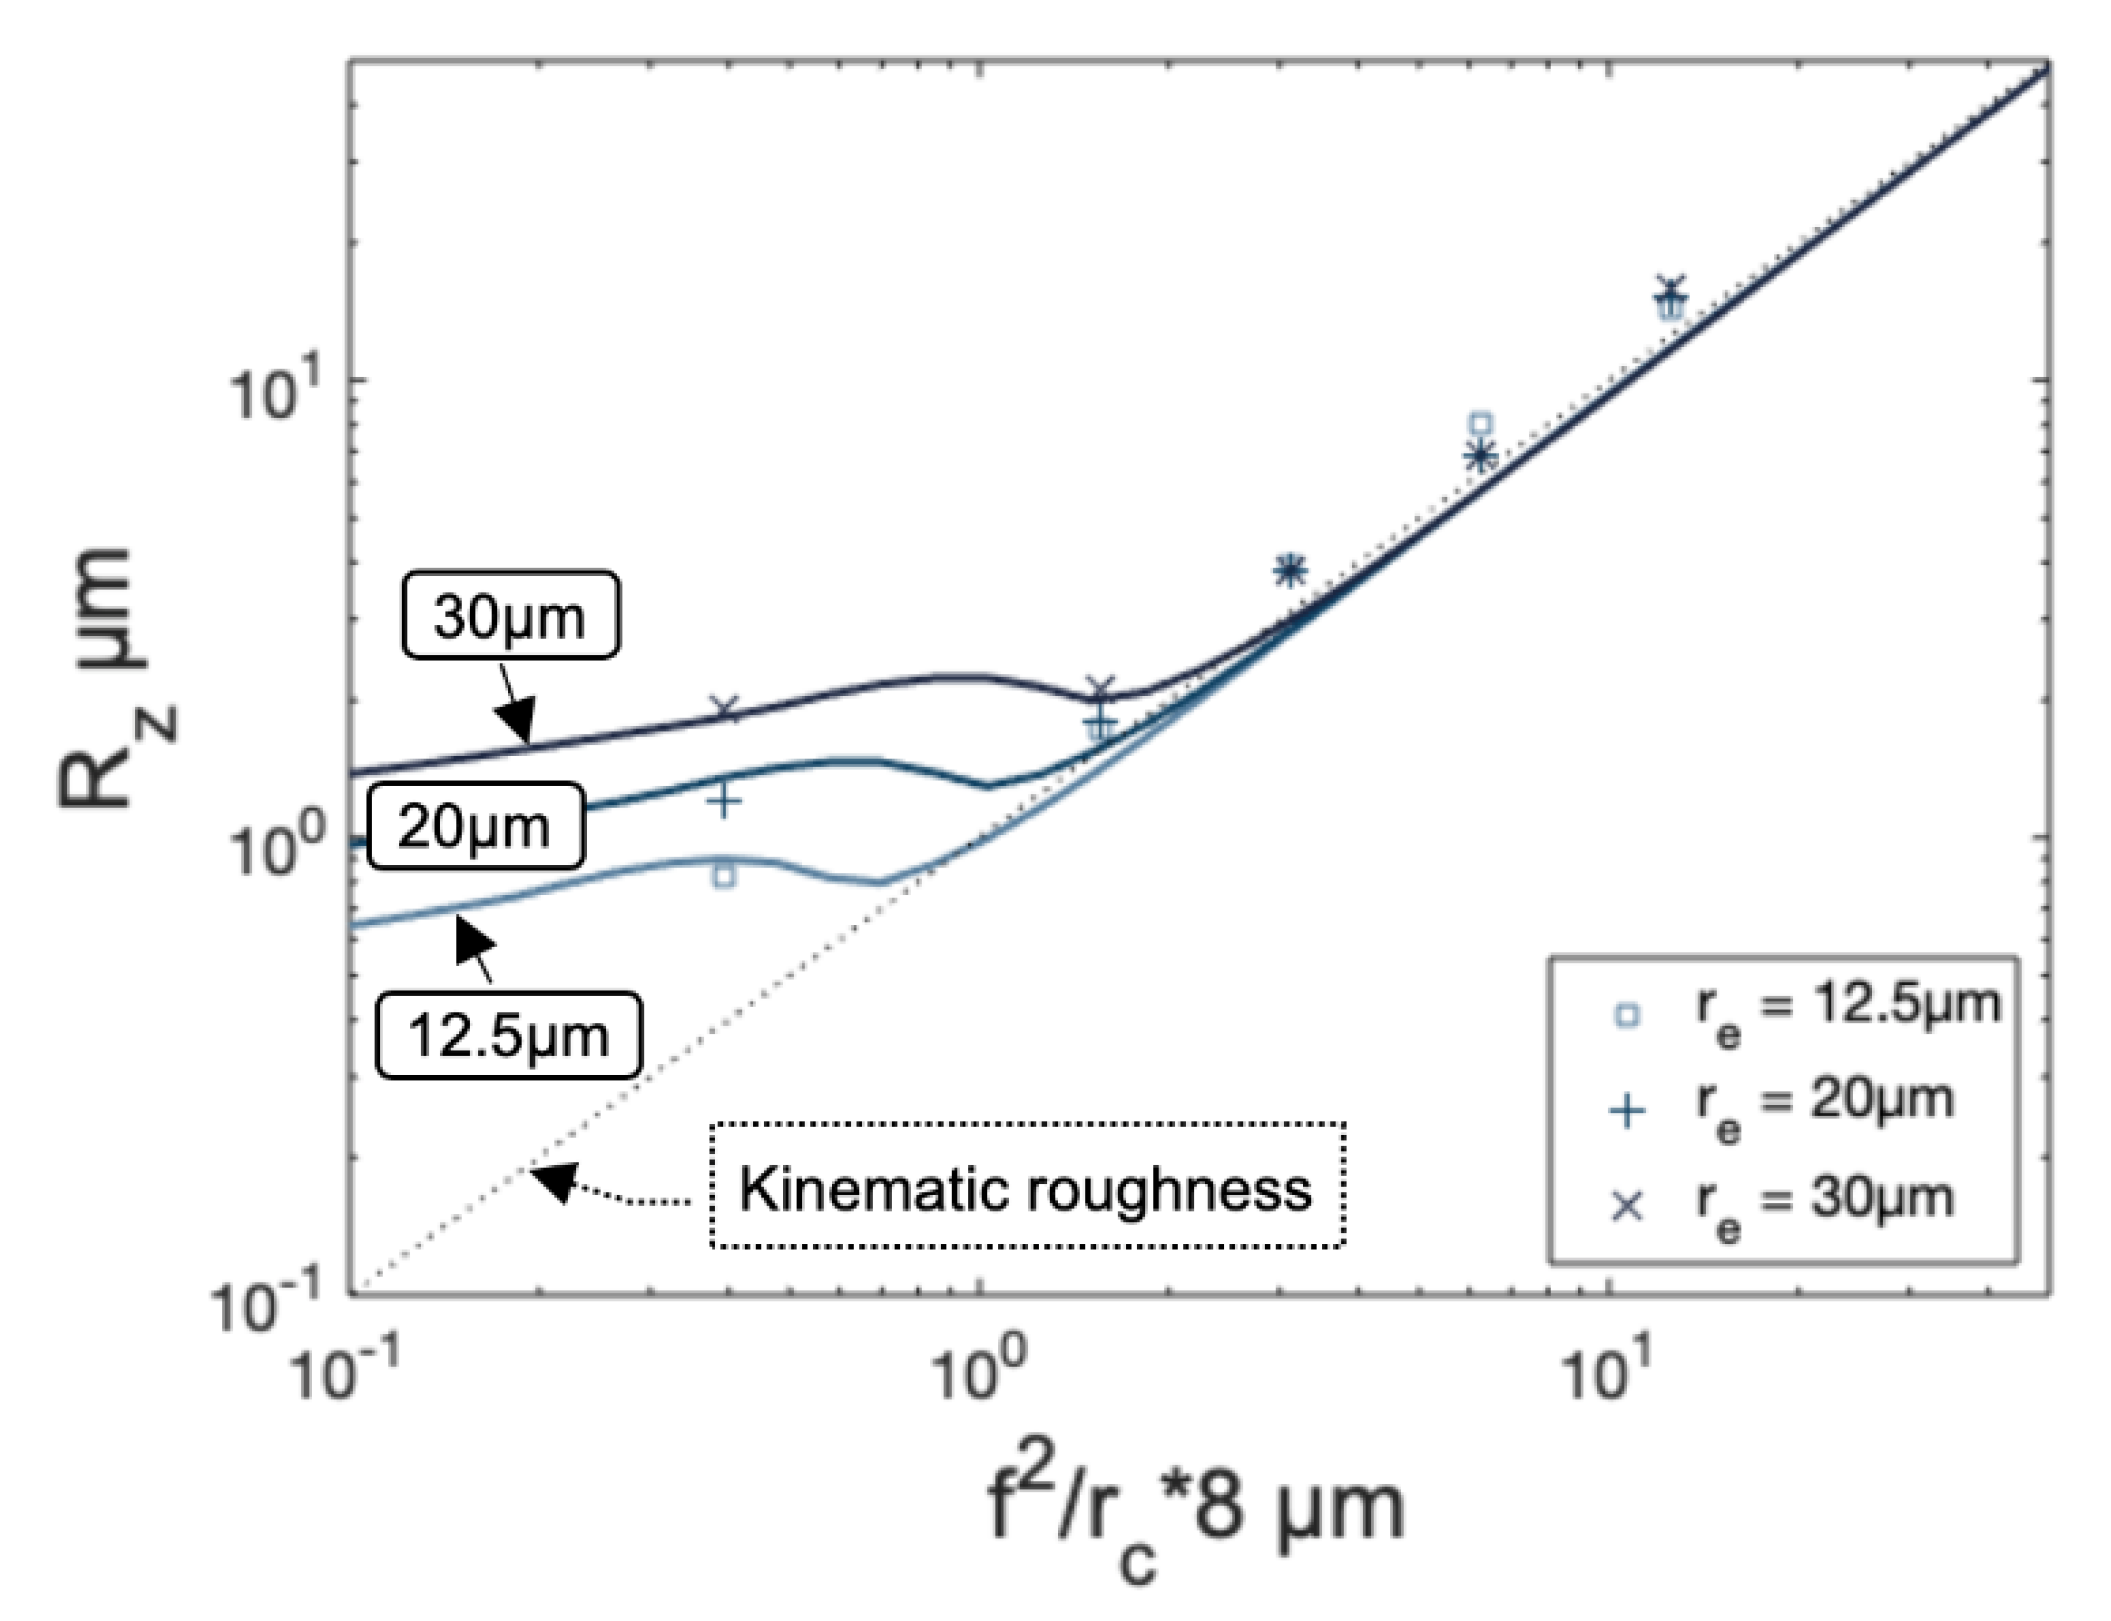
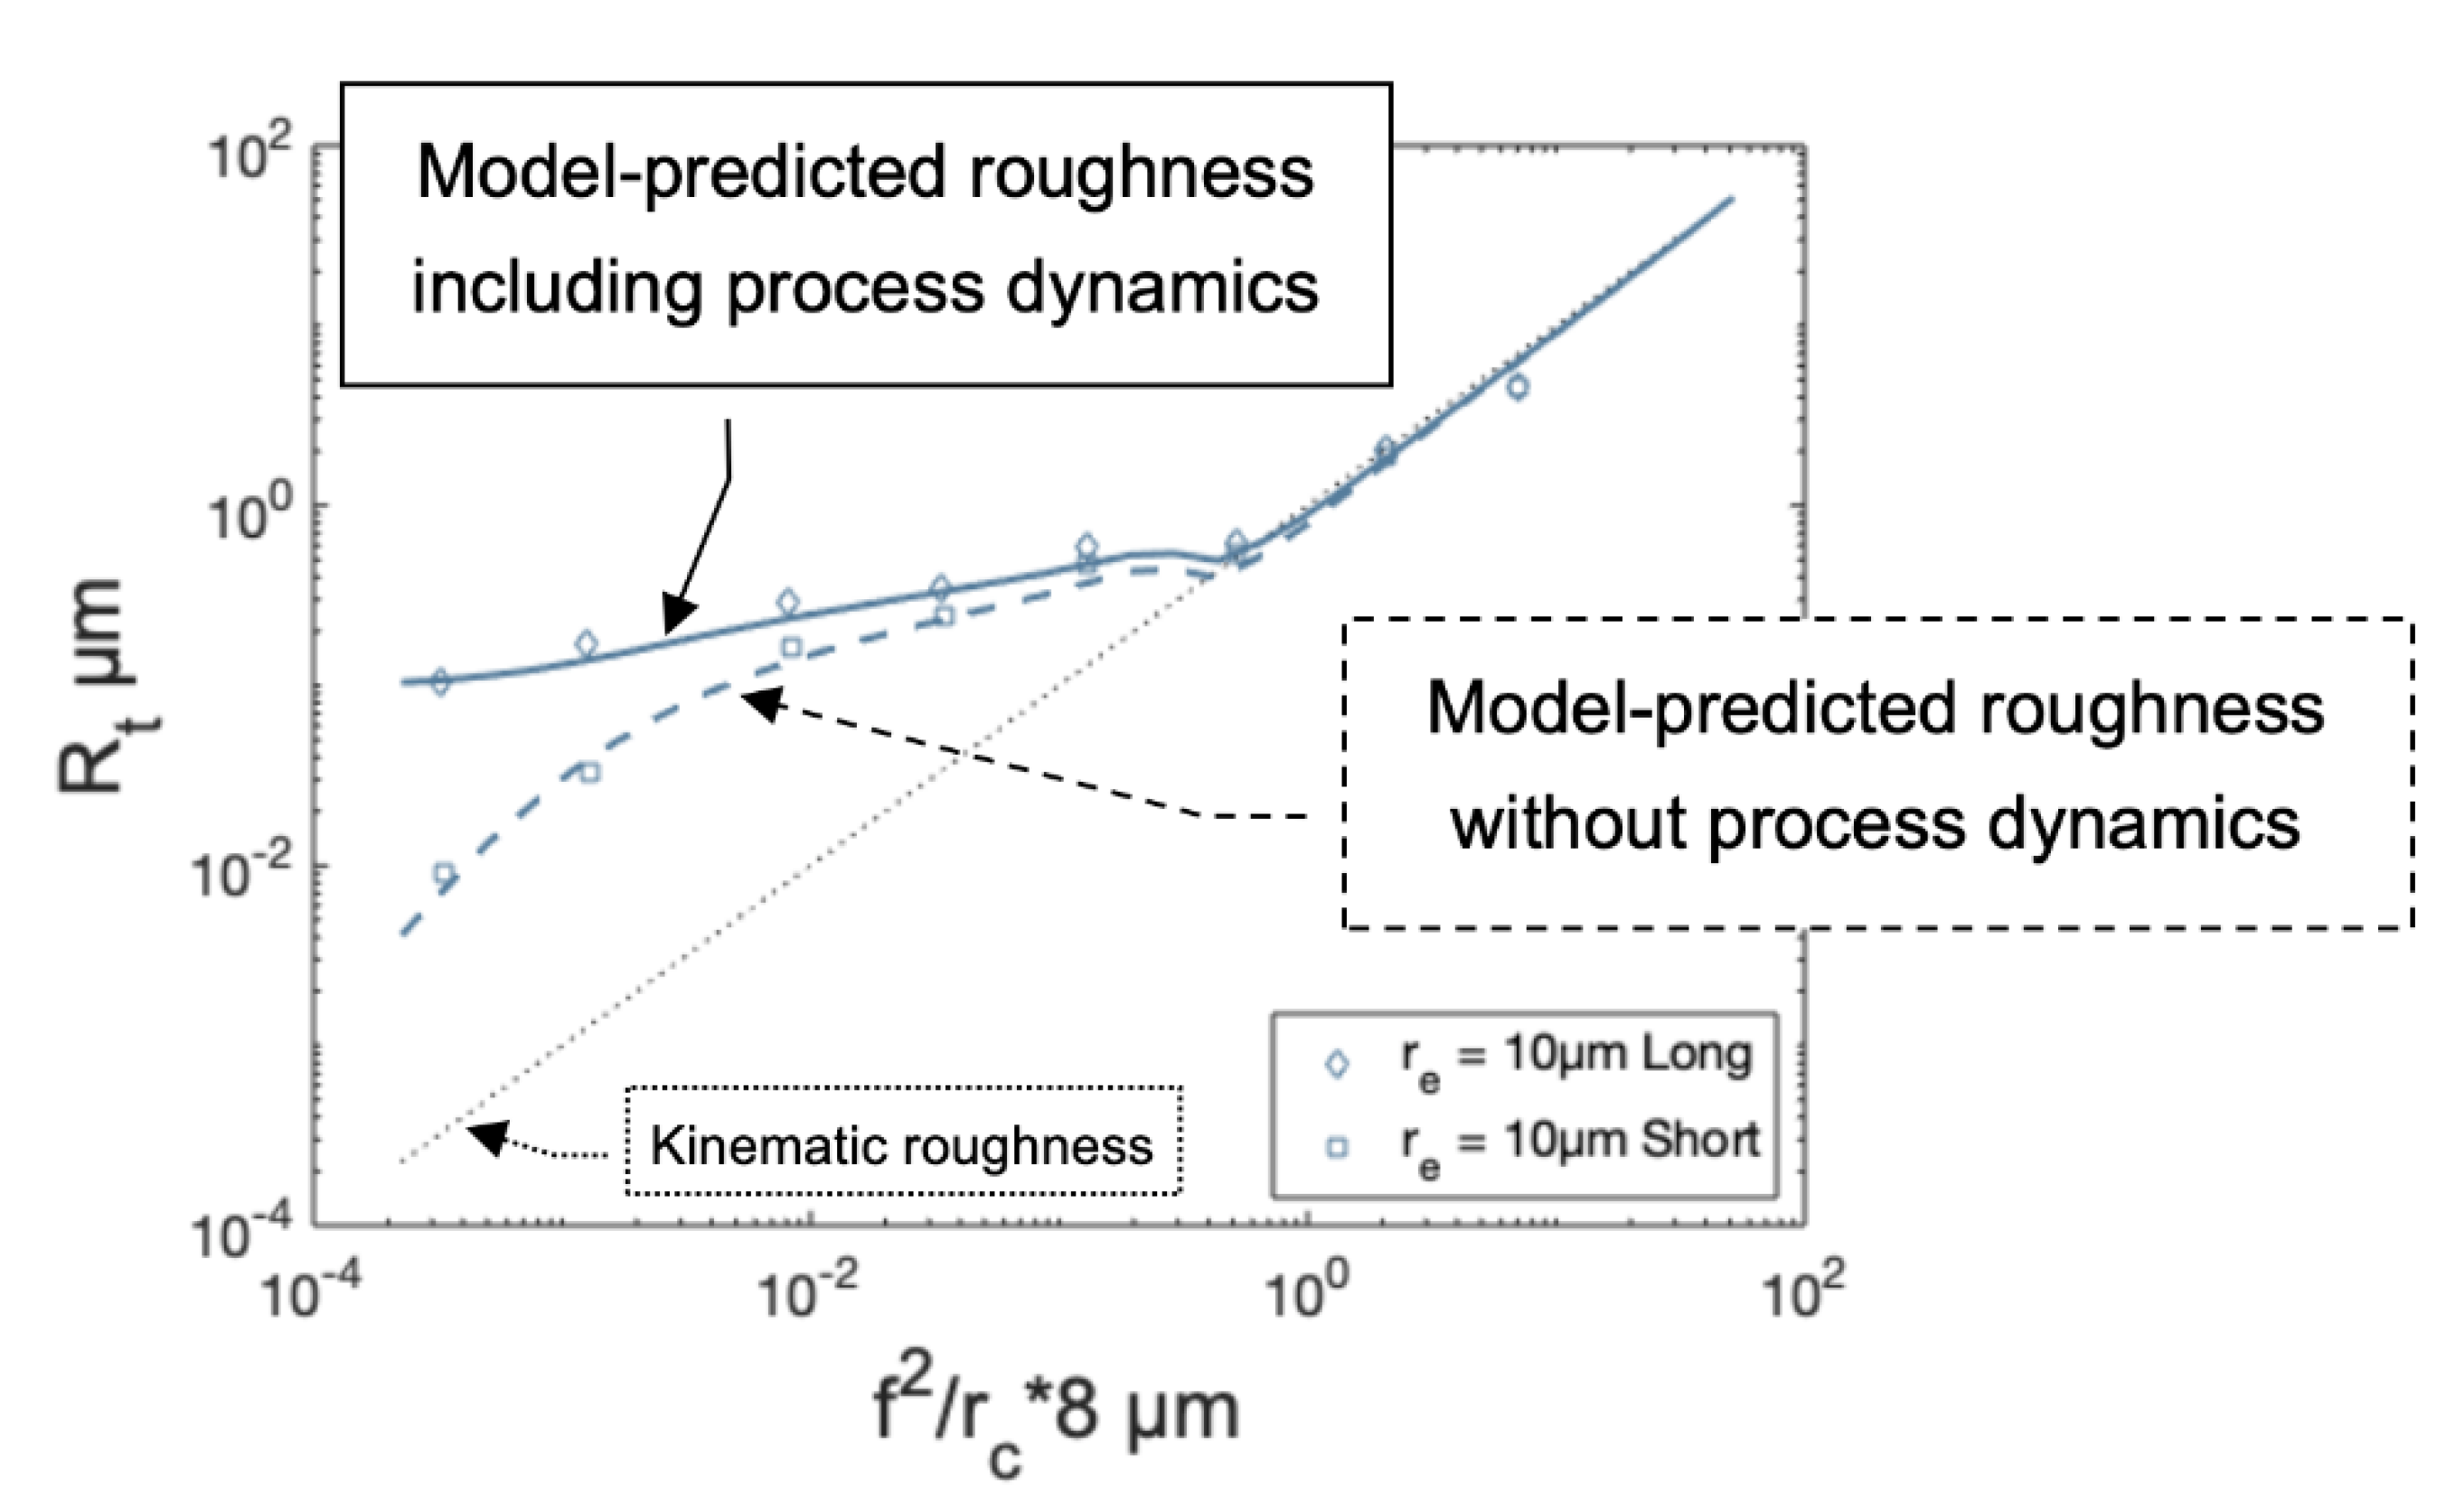
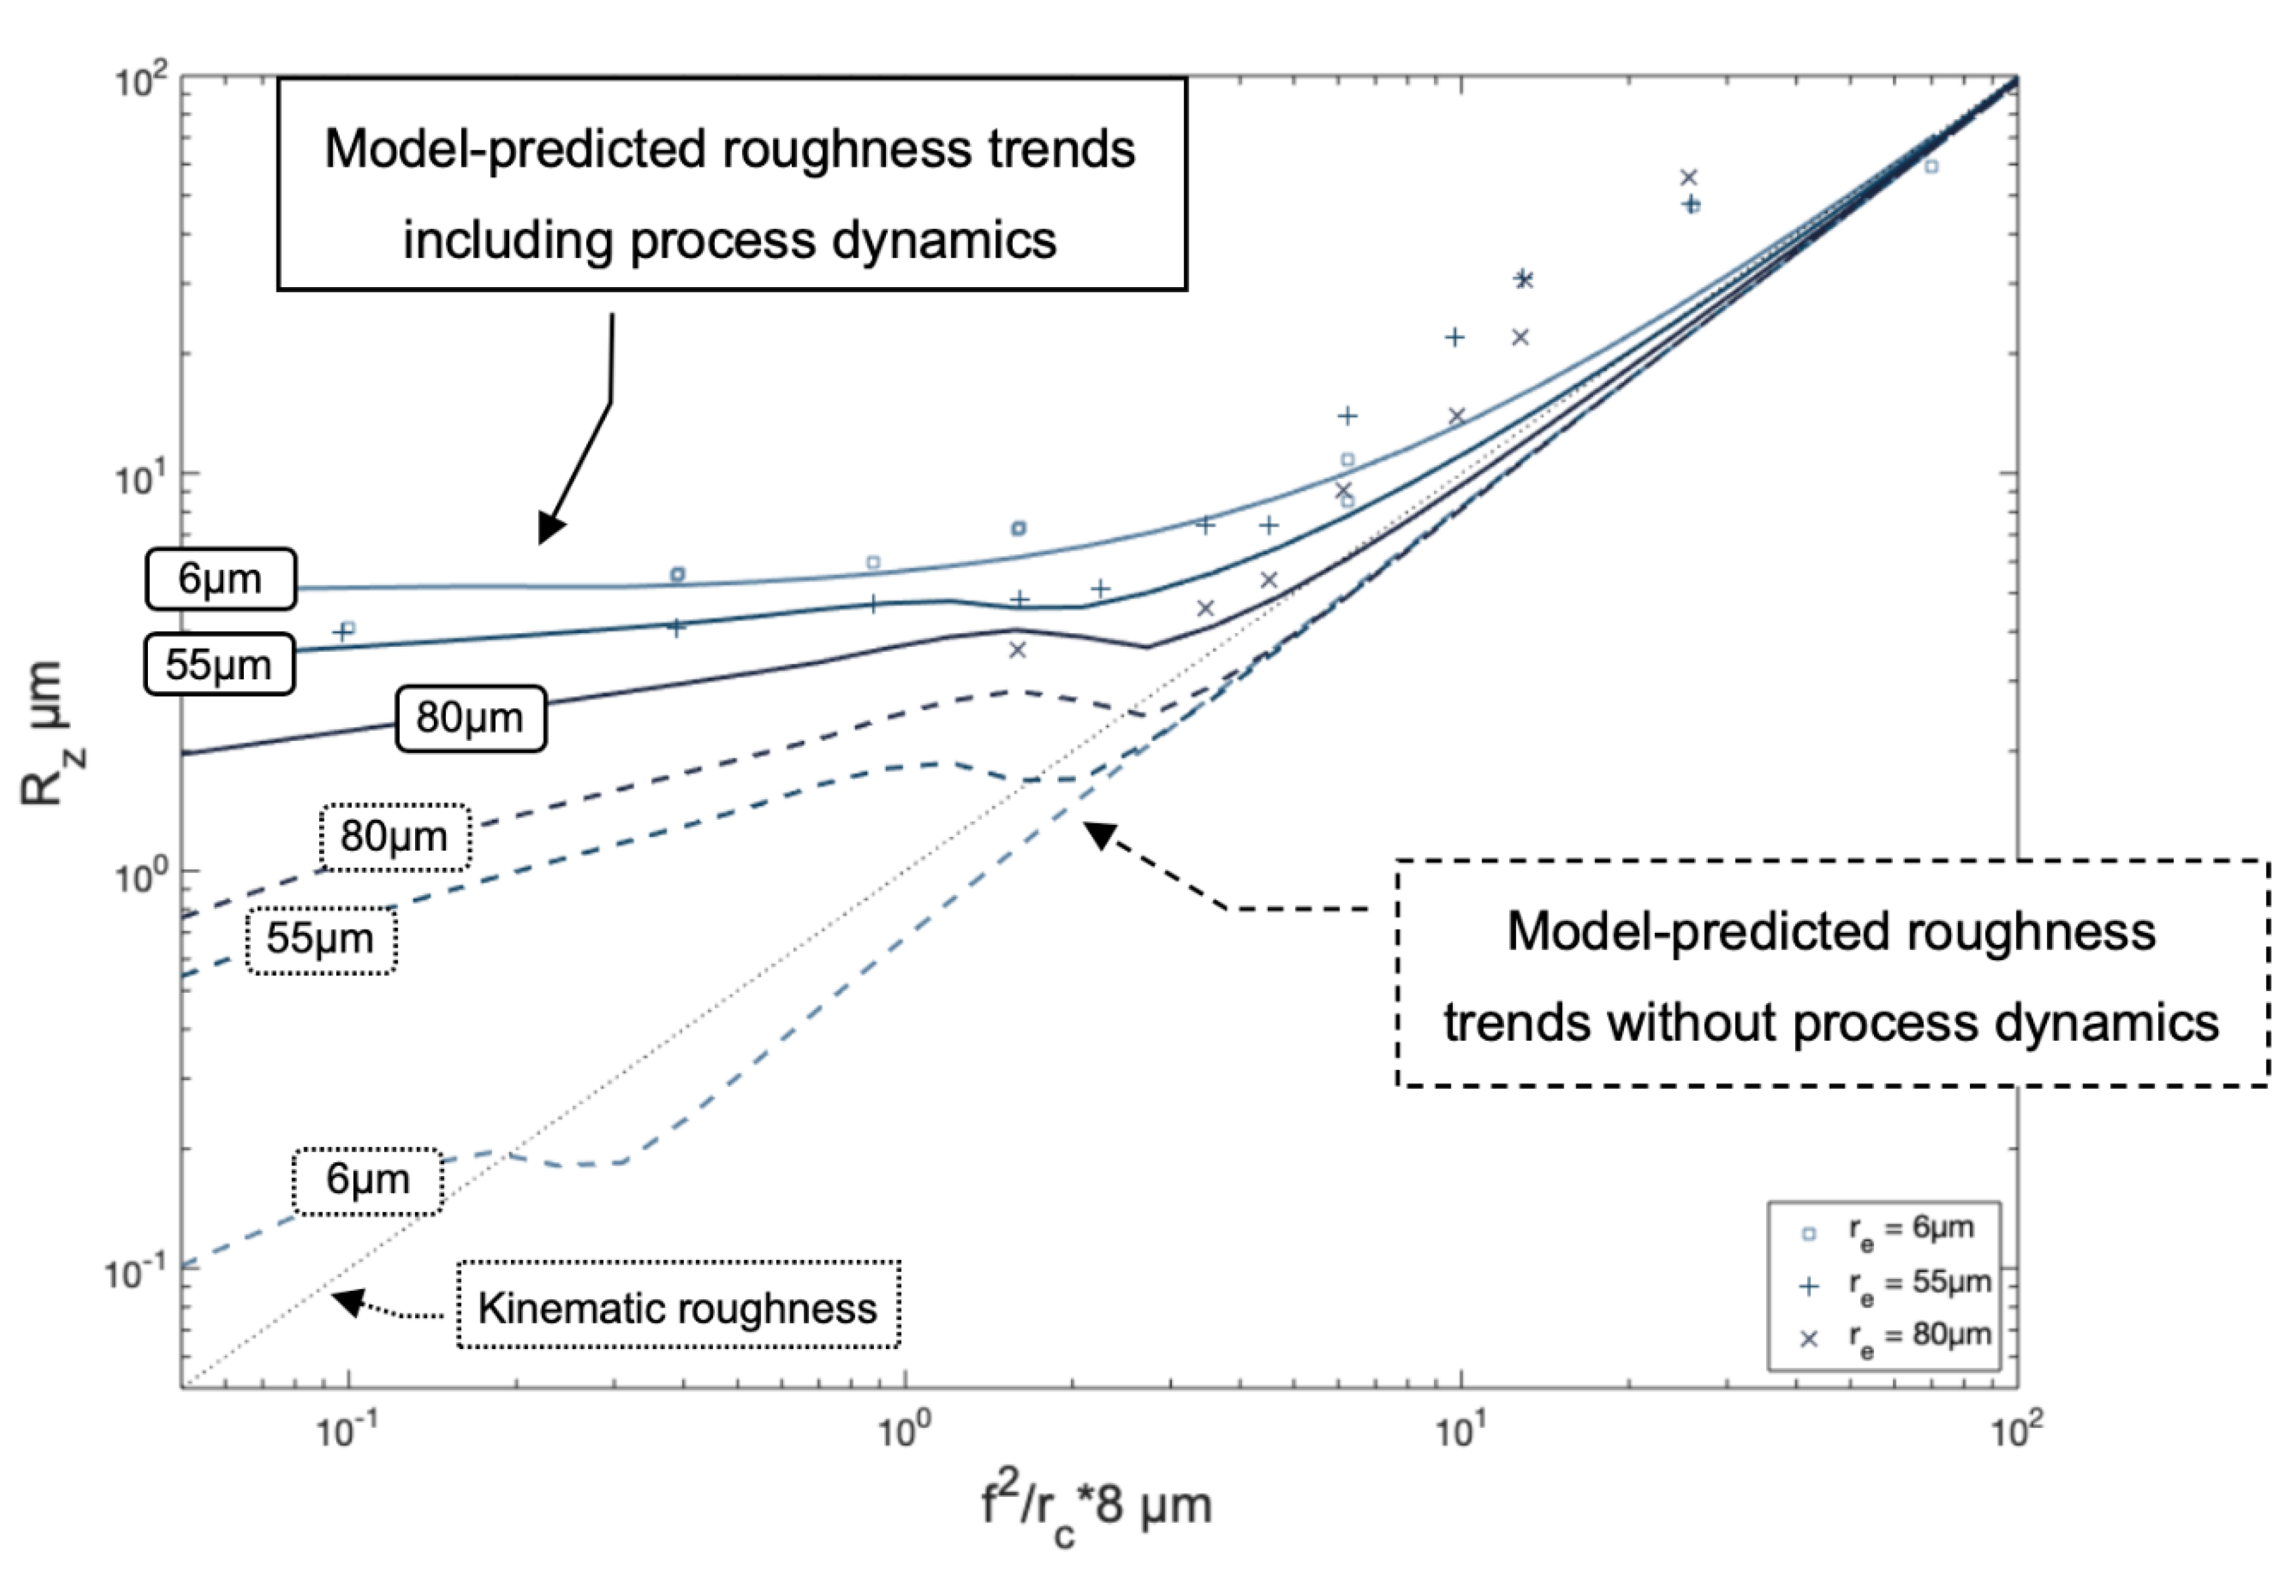
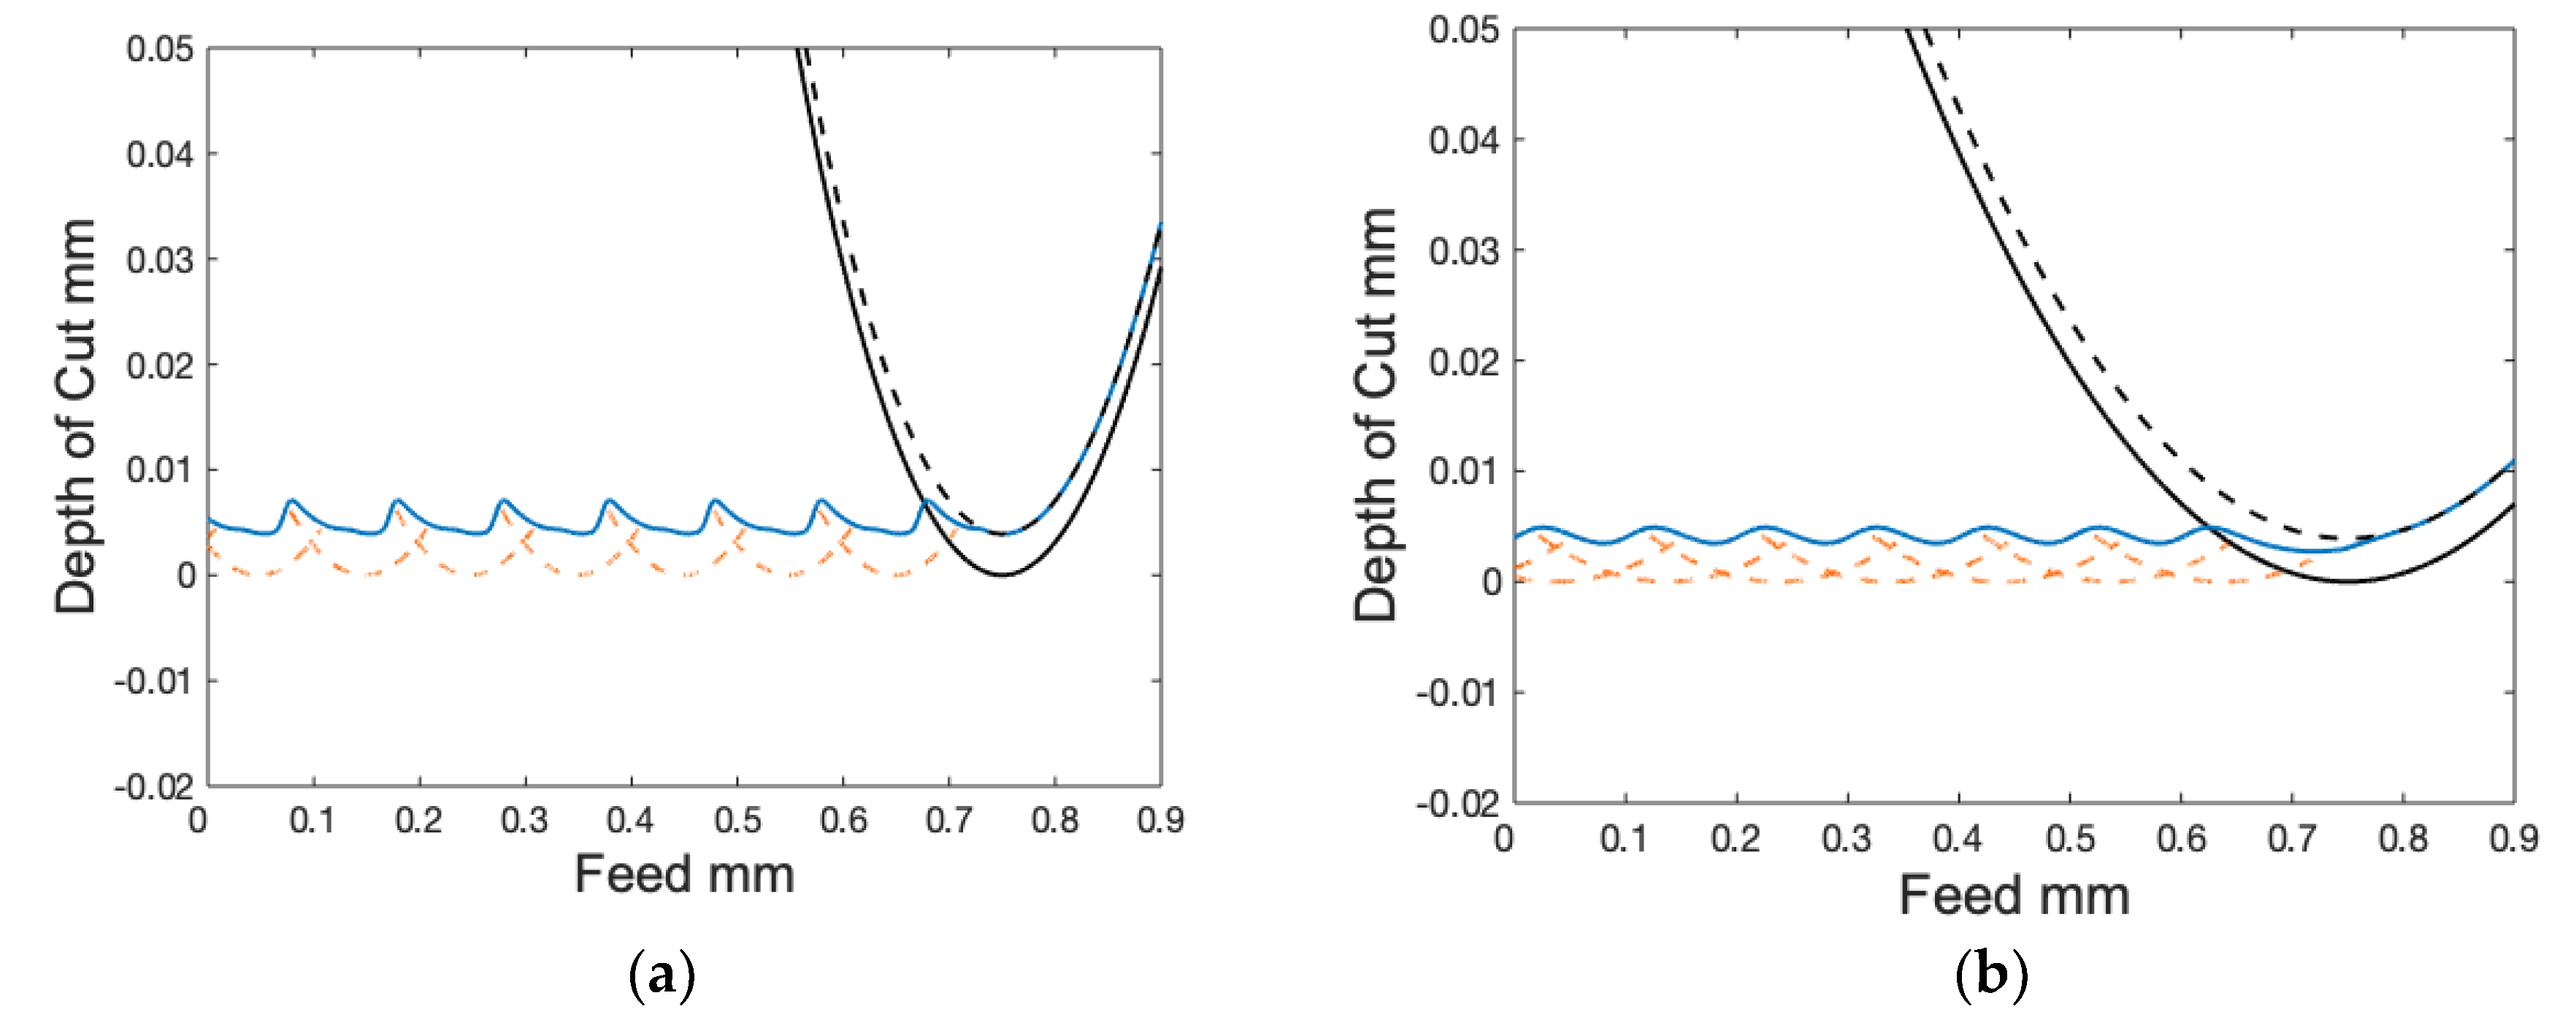
3.3. Model Validation

While two of the parameters utilized in this model are easily determined, hmin is dependent upon thermomechanical variables and difficult to predict for a given condition. Empirical measurement of hmin is most directly achieved by measuring the workpiece spring back on the flank face under plane strain conditions, i.e., orthogonal turning or shaping cuts. Ongoing efforts of in situ characterization are carried out by the authors to further improve the accuracy of the hmin characterization for different workpiece materials. From such observations, there seems to exist a minimum effective rake angle (yeff) that remains constant as edge radius is varied for a given machining condition. This phenomena has been previously investigated in recent literature [43], and has often been termed as a ratio of hmin/re, rather than yeff [44,45]. From the authors’ investigations, as well as inverse determination of hmin from pedigreed surface roughness data, e.g., the Knuefermann and Childs data, yeff values and corresponding hmin/re values, shown in Table 2, were determined. It should be noted that these values are not purely material constants, as they largely vary with cutting interface temperature, which depends on a few variables—of which, material properties and cutting speed are typically deemed most relevant. The cutting speeds used with the materials Al 1075, 51CrV4, and Ti-6Al4V are 200, 200, and 288 m/min, respectively.
The measured roughness values from cutting trials described in Section 2 are shown below in Figure 9. The model was found to be in good agreement with the experimental results for the given range of tool edge radii, with initial deviation from kinematic roughness occurring between 0.8 and 2 µm Rz. Surface finish in all samples was free of major defects when observed optically at up to 50× magnification. As has often been reported by other efforts, larger tool edge radii produced a higher surface roughness at low feeds than small tool edge radii, while generating essentially the same roughness when the measured values approached the predicted kinematic values. It may be noted that the model slightly underpredicts roughness values across the board, especially as feed increases. This is most likely due to process instability found at higher chip thicknesses.
As mentioned above, a key finding of the proposed model is its deviation from the predicted kinematic roughness at a point very near to where actual (measured) roughness values deviate, as shown in Figure 9. However, when compared to the data in Figure 10, the as-developed model (dashed line) begins to predict values below what is measured, at least when proper ISO surface roughness measurement standards are maintained (i.e., using long evaluation lengths). The causes of this discrepancy are twofold: edge roughness and machine tool error. The large roughness deviation found by the data from longer evaluation lengths in Figure 10 can be attributed to machine tool error that plays a significant role at low predicted kinematic roughness. While the as-developed, unadjusted surface generation model developed here is still valid for short roughness evaluation lengths (that eliminate the effect of machine tool error/waviness) at these feed rates, the additional (machine/dynamic) error introduces waviness among other artifacts to the standard measurement of Rt/Rz and Ra. This discrepancy is relevant, but not resolved without considering machine dynamics.
The use of shorter roughness evaluation lengths is more relevant when evaluating surface generation phenomena (rather than strictly roughness), as the model assumes perfectly spaced, planar toolpaths, unlike those that occur under a dynamically oscillating machine tool/workpiece interface. In comparing the unadjusted model output to the data found by the short evaluation length measurement data in Figure 10, it is apparent that some discrepancy still exists at extremely small feed rates (lower than those typically adopted in ‘macroscopic’ finish machining of metals). The authors hypothesize this is due to the lack of edge roughness incorporated in the surface profiles generated by the proposed model. This tool edge roughness will cause a relative increase in short evaluation roughness as the actual roughness reduces past some level. However, as the short evaluation length data in Figure 10 shows, the point at which the roughness begins to deviate is at an extremely low feed, leading to the conclusion that the presented model is likely valid for most new tools of commercial quality. Tool edge roughness does not seem to be a significant factor at the parameter levels found in this work.
Moreover, Knuefermann [9] showed that turning is often capable of creating surfaces that have lower roughness than the tool edge itself. The authors posit this effect is due to the tool becoming approximately smooth when cutting. Upon the entrance of the tool to the cut, small tool defects (typical of new or slightly worn tools) will act as small cutting edges themselves. The material cut by these small edges will be displaced into the defect, promptly filling this region, leading to a much smoother tool edge.
It follows that this unadjusted model is accurate for surfaces generated by tools in even slightly worn condition, when evaluated by short evaluation length roughness methods. It should be noted that while tool edge roughness will play a role in surface roughness generation, it will not be a significant factor until the roughness caused by the tool edge itself is of the same magnitude as the roughness generated by kinematic and side flow effects. Due to machine tool error and side flow effects, it is unlikely that this roughness (under benign tool edge roughness conditions) would contribute significantly to standard roughness measurements of long evaluation length in non-precision applications due to the other effects’ dwarfing the height of the small surface variations caused by the tool edge roughness.

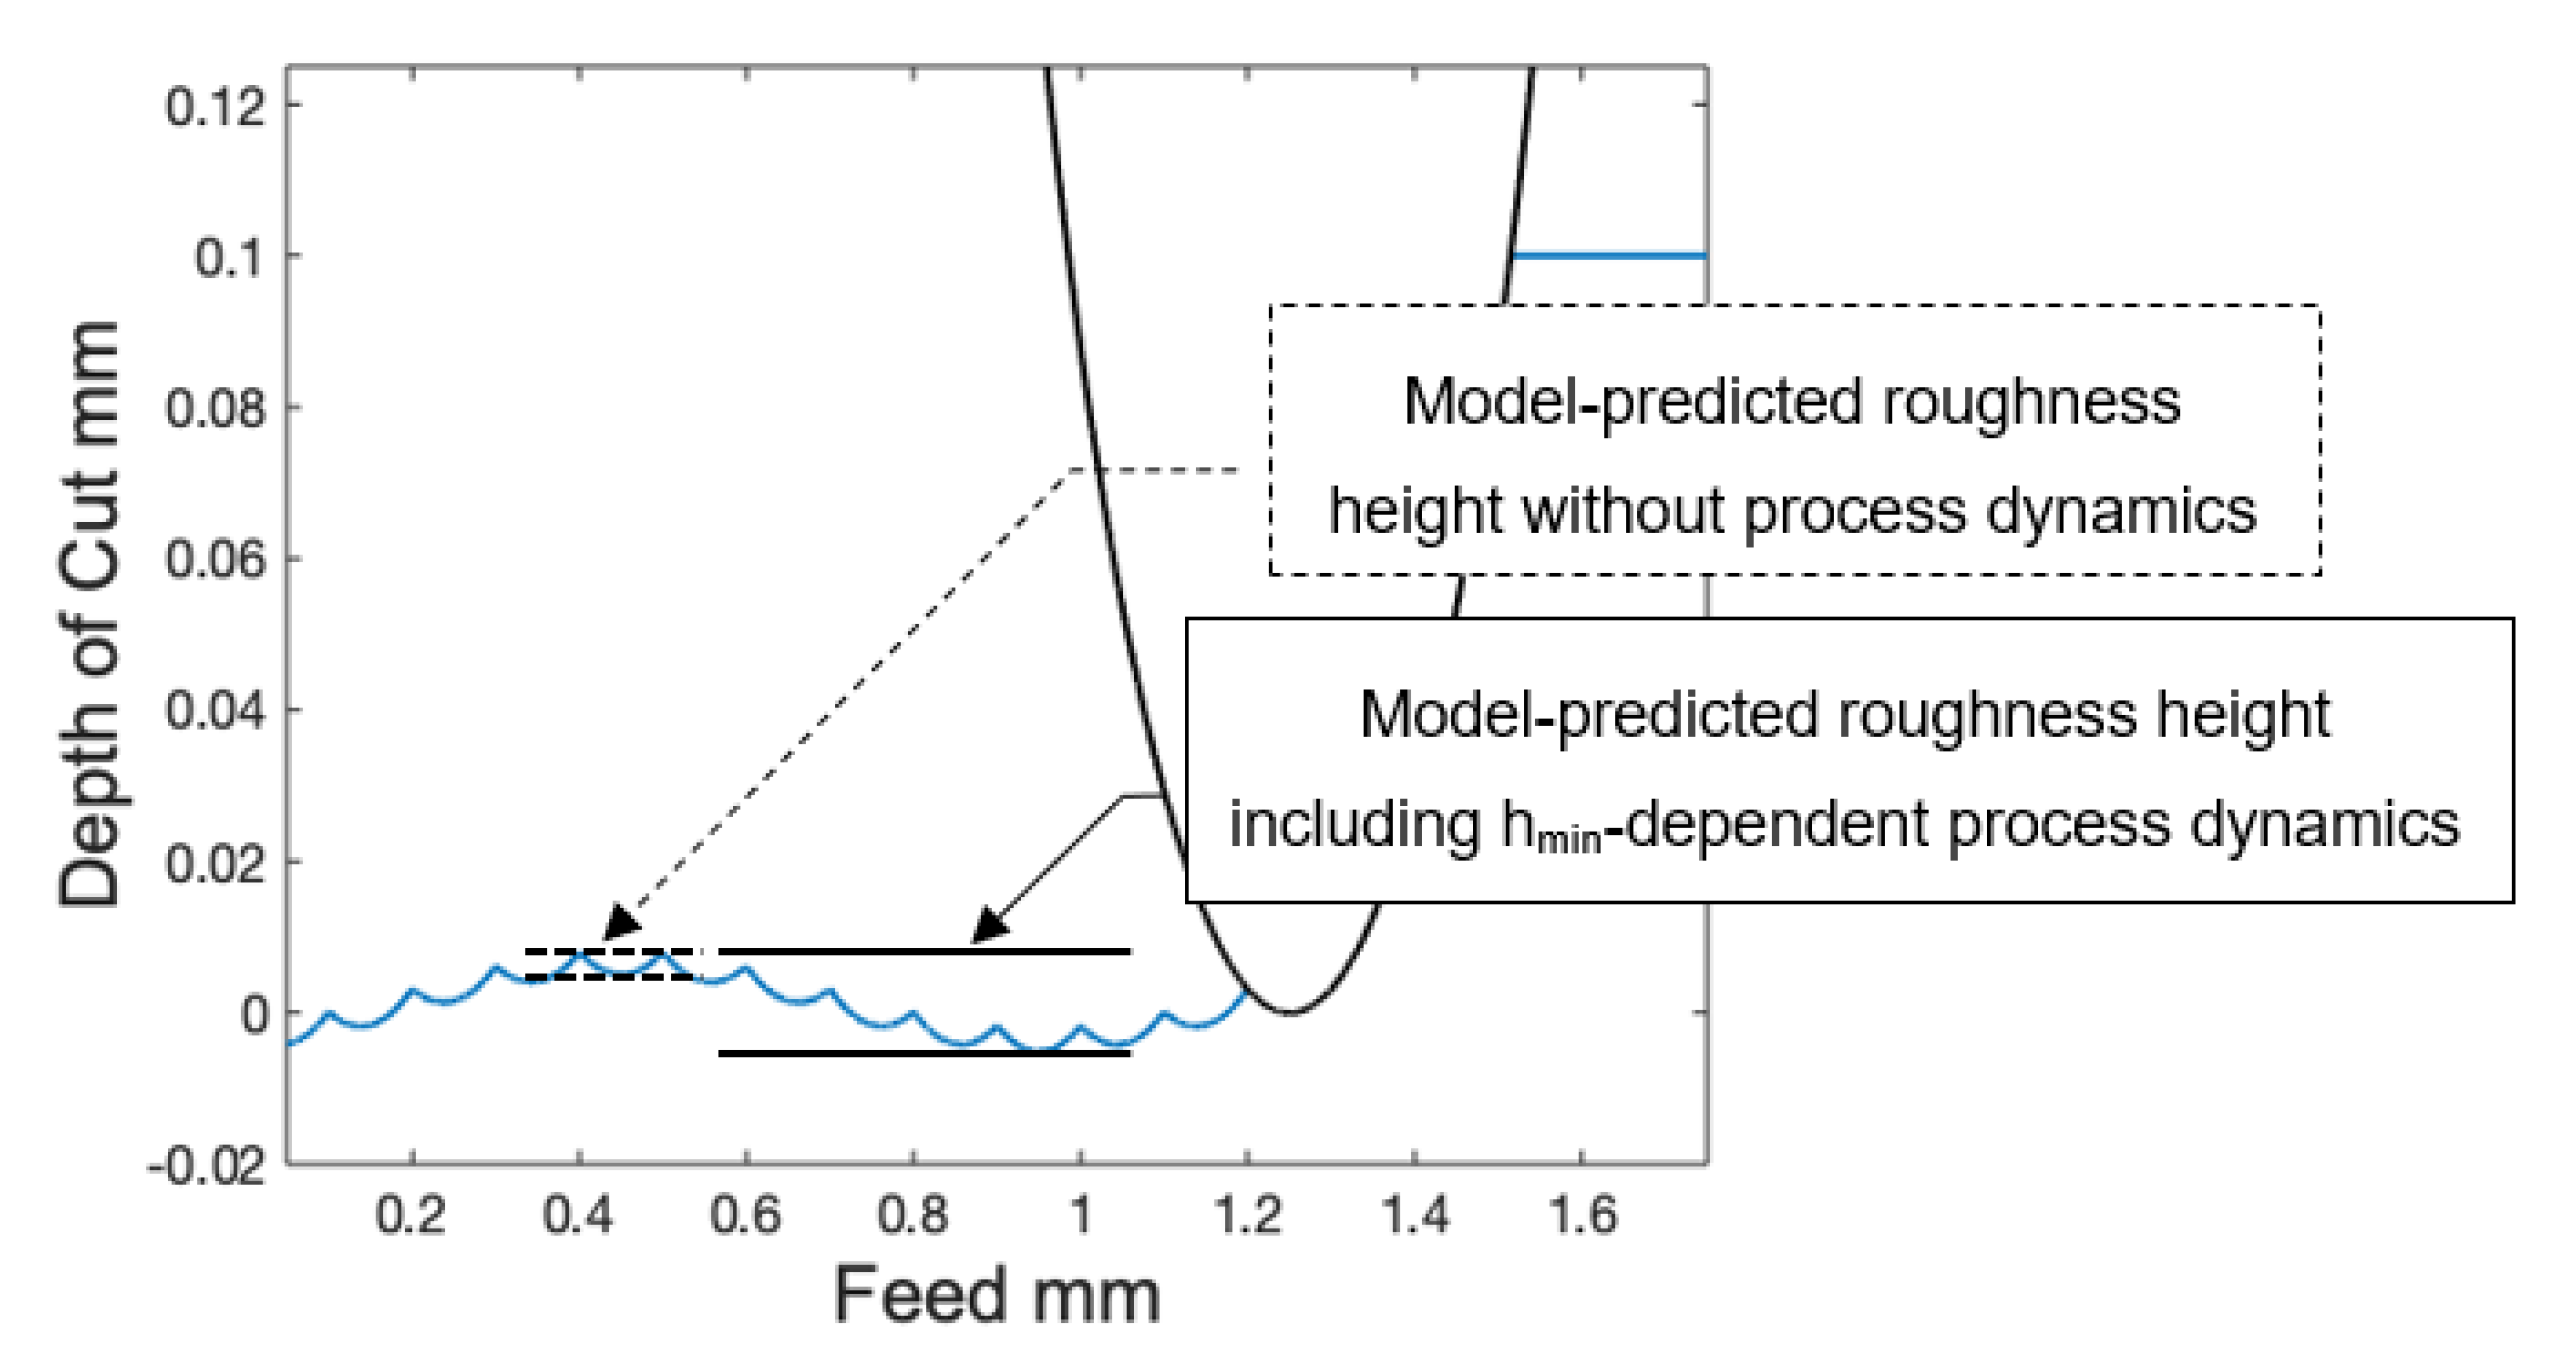
3.4. Machine Tool Error Incorporation

In comparison to the data gathered by the finish machining of aluminum in [8], the present model’s raw output predicts significantly lower surface roughness at low kinematic roughness. As hypothesized by Childs et al., this relative rise in roughness for this dataset is again most likely due to machine tool/vibrational error. Indeed, this data mirrors the roughness trends due to machine tool error (MTE) found over longer evaluation lengths in similar work performed by Knuefermann [9]. Childs et al. [8,23] utilized rather long evaluation lengths, similar to the length used in the long assessments in Figure 10. Over such an interval, waviness caused by MTE will contribute a substantially to the overall surface roughness measurement. Had these roughness measurements been analyzed with a shorter evaluation length to eliminate waviness components, it is likely the data would be more significantly related to the surface generation-induced roughness, rather than MTE. Visualization of the influence of MTE over low kinematic roughness conditions is seen below in Figure 11.
Inspection of the difference between short and long evaluation length roughness values reveals that MTE (over a given evaluation length) causes a constant offset value of roughness deviation for a given tool/machine combination, as shown in [9]. To correct for this discrepancy, MTE was quantified by taking the difference between the model and measured roughness values at low kinematic roughness (where the magnitude of MTE is highest), and added to the model’s roughness at every point. This calibration methodology enables the model to approximate roughness deviation for a given machine, tool, and workpiece in light of asynchronous spindle error, way travel error, servo instability, hydraulic vibration, etc. Previous methodologies have performed this calibration by utilizing a vibration sensor placed somewhere near the tool/workpiece interface. This presented method eliminates the need for such measurement by utilizing retroactive surface roughness measurement instead. However, this necessary calibration reduces the efficiency of the roughness model in cases affected by MTE, yet no accessible technique exists for predicting roughness increased caused by MTE for a given machine, tool, and workpiece combination. All such parameter combinations would necessitate independent calibrations.
Upon inspection of different MTE constants for various tool edge radii, a logarithmic trend of MTE-induced roughness with respect to re was revealed, whereby increasing re leads to less MTE-induced roughness in the affected machining regimes. The authors hypothesize that the reason for this trend is that of positional error damping caused by increased ploughing forces and vibrational error damping caused by viscoelastic shear-damping behavior, as depicted below in Figure 12. A roughness-reducing effect similar to this has also been noted in milling [36].
The mechanism of ploughing forces in the damping of MTE-induced roughness is thought to be due to the reaction of the machine tool to the revolving workpiece, and induced via cyclical cutting force variation. Commonly, MTE is found in the spindle or ways. When cutting with these imperfect tools, the engagement of the tool and workpiece in the cut will vary by some amount. When utilizing a small tool edge radius, this engagement variance does not change the ploughing forces appreciably due to the small area where ploughing forces can be developed. The negligible increase in ploughing force causes very little deflection in the machine tool when this small engagement variance is encountered. Therefore, the position of the tool is accurate to the ways and spindle of the machine, and whatever error exists in these elements is “copied” to the workpiece.
Alternatively, when a tool of larger edge radius is utilized on the same machine, an increase in engagement between the tool and workpiece (caused by MTE) will cause more ploughing force, due to the increased amount of material being required to flow under the tool edge. The increased ploughing force will in turn present substantial resistance to dynamic force variations associated with the machine tool and workpiece (Fdyn). As the engagement variance is caused by imperfections within the machine tool, deflection response to these engagement variances shall lead to a surface that is a slightly smoother “copy” of the instrument’s axes. Additionally, viscoelastic shear-damping behavior caused by the increased amount of material being plasticly deformed under the tool will substantially dampen sudden positional changes or vibration, such as machine tool harmonic frequencies or asynchronous spindle error. Increased shear damping can eliminate chatter by inhibiting the progression of vibrational excitation. After this damping trend was incorporated into the model, it was found that it was in good agreement with results from [23], as shown below in Figure 13.
These results verify the suggested damping phenomena described previously. The often-noted trend of a large edge radius to increase surface roughness relative to a small tool edge radius is shown to be inaccurate for machining processes heavily affected by MTE. The damping of MTE by edge radii is shown in Figure 13 by the relative difference between the (dashed) unadjusted model values and the (solid) adjusted model values. Smaller edge radii show a significant increase in roughness when adjusted for MTE-induced roughness, while larger radii exhibit a lesser increase when adjusted for MTE-induced roughness. These findings demonstrate that in some cases, surface roughness may actually be improved by a larger edge radius. While this model appears to capture the data well on the lower end of the kinematic roughness scale displayed here, there is some considerable discrepancy at higher kinematic roughness. This is also likely caused by MTE as well as some additional instability due to larger uncut chip thickness generally encountered at these conditions. Notwithstanding these small discrepancies, the model put forth in this text has been shown to approximate the deviation of surface roughness at low kinematic roughness in 51CrV4 steel, AL 1075, and Ti-6Al4V.
A major advantage of this model lies in that it may be calibrated to any machine in a trivial manner. This may be achieved by performing a single finish cut with a tool of known edge radius (preferably approximately 10–20 µm, so that the MTE-induced roughness is of a higher amplitude) and subsequently measuring the long evaluation length surface roughness of the generated surface. Comparing this measured surface roughness to the value predicted by the unadjusted model will reveal the MTE-induced roughness for this tool edge radius, whereby all other surface roughness values may be predicted for varying finishing parameters, outside of excessive chatter or roughness increasing effects such as inclusions or grain pullout.
Additionally, further investigation of this geometric model enabled the discovery of geometrically defined multi-path (adjacent feed-direction passes) effects. In Figure 14 below, it may be observed that for a given edge radius, different kinematic roughness values lead to quite different surface conditions. Figure 14a shows a surface that has very little overlap between the ploughing areas, indicated by the dashed profiles in the subsurface; most of the surface is comprised of material that has only been ploughed once, indicating a surface that has been machined efficiently, i.e., with relatively limited ploughing. In Figure 14b, the model geometry exhibits a subsurface that has been heavily ploughed. The entire surface is shown to have been ploughed multiple times as evidenced by the coincident dashed line profiles. While the surface appears to be smoother due to the larger nose radius, this surface has been ploughed to a much greater extent, which is known to generate additional heat, and may lead to altered subsurface characteristics. Further analysis should investigate subsurface integrity correlations and mechanisms related to these size effects, e.g., residual stresses and strain hardening.

4. Conclusions and Outlook

This work presents an iterative geometric model for the prediction of surface roughness in finish machining, built upon unique assumptions about the size effect in machining. The present model establishes a novel method for modeling relatively complex, MTE-influenced surface roughness values that are dependent on tool edge radius. Complex surface integrity effects, such as strain hardening, thermal softening, recrystallization and residual stress evolution are intimately tied to the surface generation mechanics which the present model appears to accurately capture. In a preliminary effort to consider these effects, the multi-path geometry present within the model has been identified.
The proposed model considers the engagement and geometry of the tool and workpiece in light of complex ploughing mechanisms that give rise to side flow and material spring back. In this sense, it is fitting to consider this model qualitatively ‘physics based’, as it incorporates the dominating physical phenomena which lead to the generation of the machined surface. Future work to consider complex thermomechanical workpiece material response will, however, be necessary to yield a more comprehensive model. Within the cutting speed range under investigation, comparisons with experimental data show that this model predicts the deviation of surface roughness from the kinematically predicted roughness very well under most finish machining conditions.
The authors envision semi-analytical (physics-based) models, such as the one presented in this present work, to offer a solid foundation for implementing data-based approaches (e.g., machine learning) more efficiently. In practice, initial process planning in industry could be carried out using fast-acting, semi-analytical models. As production data, e.g., actual surface and subsurface quality metrics, are collected over time, the semi-analytical model can be further refined, yielding a ‘smart,’ increasingly accurate model for future process modeling and optimization.
As finish machining typically determines the final workpiece quality in terms of dimensional tolerances, surface roughness and surface integrity, the authors propose that tool edge radius/wear limits need to be set in such a manner as to maintain acceptable quality. This is the common practice in industry, although typically with respect to dimensional tolerances and surface roughness, and not with difficult-to-measure surface integrity parameters, such as residual stresses, subsurface microstructure and strain hardening. While analysis of such parameters lies outside the scope of the present study, the geometric ‘boundary conditions’ of the tool/workpiece engagement are predicted quite well with the proposed geometric model. Therefore, subsequent work will focus on expanding the current model to provide inputs to the authors’ concurrently developed surface integrity models, which require knowledge of multi-path effects and full-surface ploughing insight identified in this foundational work.

Author Contributions

Conceptualization, I.B. and J.S.; Investigation, I.B.; Software, I.B.; Supervision, J.S.; Validation, I.B.; Writ—original draft, I.B. and J.S.; Writing—review & editing, I.B. and J.S. All authors have read and agreed to the published version of the manuscript.

Funding

This research received no external funding.

Conflicts of Interest

The authors declare no conflicts of interest.

References

  1. Moll, H. Die Herstellung Hochwertiger Drehflächen: Einfluß der Schnittbedingungen auf die Oberflächengüte beim Drehen, Schlichten und Feinschlichten; VDI-Verl.: Berlin, Germany, 1940. [Google Scholar]
  2. Sokolowski, A. Präzision in der Metallbearbeitung; VEB-Verlag Technik: Berlin, Germany, 1955. [Google Scholar]
  3. Albrecht, P. New Developments in the Theory of the Metal-Cutting Process: Part I. The Ploughing Process in Metal Cutting. J. Eng. Ind. 1960, 82, 348–357. [Google Scholar] [CrossRef]
  4. Ikawa, N.; Shimada, S.; Tanaka, H. Minimum thickness of cut in micromachining. Nanotechnology 1992, 3, 6–9. [Google Scholar] [CrossRef]
  5. Brammertz, P. Die entstehung der oberflächenrauheit beim feindrehen. Ind. Anz. 1961, 2, 25–32. [Google Scholar]
  6. Yuan, Y.; Jing, X.; Ehmann, K.F.; Zhang, D. Surface roughness modeling in micro end-milling. Int. J. Adv. Manuf. Technol. 2017, 95, 1655–1664. [Google Scholar] [CrossRef]
  7. Grzesik, W. A revised model for predicting surface roughness in turning. Wear 1996, 194, 143–148. [Google Scholar] [CrossRef]
  8. Childs, T.H.C.; Sekiya, K.; Tezuka, R.; Yamane, Y.; Dornfeld, D.; Lee, D.-E.; Min, S.; Wright, P. Surface finishes from turning and facing with round nosed tools. CIRP Ann. 2008, 57, 89–92. [Google Scholar] [CrossRef] [Green Version]
  9. Knuefermann, M.M. Machining Surfaces of Optical Quality by Hard Turning. Ph.D. Thesis, Cranfield University, Cranfield, UK, 2003. [Google Scholar]
  10. Shaw, M.C.; Cookson, J. Metal Cutting Principles; Oxford university press New York: New York, NY, USA, 2005; Volume 2. [Google Scholar]
  11. Lambert, H. Two years of finish-turning research at the Technological University, Delft. Ann. CIRP 1961, 10, 246–255. [Google Scholar]
  12. Sata, T. Surface finish in metal cutting. Ann. CIRP 1964, 13, 190–197. [Google Scholar]
  13. Pekelharing, A.; Gieszen, C. Material side flow in finish turning. Ann. CIRP 1971, 20, 21–22. [Google Scholar]
  14. El-Wardany, T.; Elbestawi, M. Phenomenological analysis of material side flow in hard turning: Causes, modeling, and elimination. Mach. Sci. Technol. 1998, 2, 239–251. [Google Scholar] [CrossRef]
  15. Liu, K. Process Modeling of Micro-Cutting Including Strain Gradient Effects; Melkote, S.N., Ed.; ProQuest Dissertations Publishing: Ann Arbor, MI, USA, 2005. [Google Scholar]
  16. Kishawy, H.; Haglund, A.; Balazinski, M. Modelling of Material Side Flow in Hard Turning. CIRP Ann. 2006, 55, 85–88. [Google Scholar] [CrossRef]
  17. Kishawy, H.; Elbestawi, M. Effects of process parameters on material side flow during hard turning. Int. J. Mach. Tools Manuf. 1999, 39, 1017–1030. [Google Scholar] [CrossRef]
  18. Liu, K.; Melkote, S.N. Effect of plastic side flow on surface roughness in micro-turning process. Int. J. Mach. Tools Manuf. 2006, 46, 1778–1785. [Google Scholar] [CrossRef]
  19. Özel, T.; Hsu, T.-K.; Zeren, E. Effects of cutting edge geometry, workpiece hardness, feed rate and cutting speed on surface roughness and forces in finish turning of hardened AISI H13 steel. Int. J. Adv. Manuf. Technol. 2004, 25, 262–269. [Google Scholar] [CrossRef]
  20. Özel, T.; Karpat, Y. Predictive modeling of surface roughness and tool wear in hard turning using regression and neural networks. Int. J. Mach. Tools Manuf. 2005, 45, 467–479. [Google Scholar] [CrossRef]
  21. Thiele, J.D.; Melkote, S.N. Effect of cutting edge geometry and workpiece hardness on surface generation in the finish hard turning of AISI 52100 steel. J. Mater. Process. Technol. 1999, 94, 216–226. [Google Scholar] [CrossRef]
  22. Zhao, T.; Zhou, J.M.; Bushlya, V.; Ståhl, J.E. Effect of cutting edge radius on surface roughness and tool wear in hard turning of AISI 52100 steel. Int. J. Adv. Manuf. Technol. 2017, 91, 3611–3618. [Google Scholar] [CrossRef] [Green Version]
  23. Childs, T.H.C.; Dornfeld, D.; Lee, D.-E.; Min, S.; Sekiya, K.; Tezuka, R.; Yamane, Y. The influence of cutting edge sharpness on surface finish in facing with round nosed cutting tools. CIRP J. Manuf. Sci. Technol. 2008, 1, 70–75. [Google Scholar] [CrossRef] [Green Version]
  24. Mai, Q.; Quan, Y.; Liu, P.; Ding, G. A new geometrical model of the formation of machined surface. Int. J. Adv. Manuf. Technol. 2017, 91, 3493–3502. [Google Scholar] [CrossRef]
  25. Schultheiss, F.; Hägglund, S.; Bushlya, V.; Zhou, J.; Ståhl, J.-E. Influence of the Minimum Chip Thickness on the Obtained Surface Roughness during Turning Operations. Procedia CIRP 2014, 13, 67–71. [Google Scholar] [CrossRef] [Green Version]
  26. Kountanya, R. Surface finish and tool wear characterization in hard turning using a mathematical cutting tool representation. Mach. Sci. Technol. 2011, 15, 429–452. [Google Scholar] [CrossRef]
  27. Aouici, H.; Yallese, M.A.; Chaoui, K.; Mabrouki, T.; Rigal, J.-F. Analysis of surface roughness and cutting force components in hard turning with CBN tool: Prediction model and cutting conditions optimization. Measurement 2012, 45, 344–353. [Google Scholar] [CrossRef]
  28. Abbas, A.T.; Pimenov, D.Y.; Erdakov, I.N.; Taha, M.A.; El Rayes, M.M.; Soliman, M.S. Artificial Intelligence Monitoring of Hardening Methods and Cutting Conditions and Their Effects on Surface Roughness, Performance, and Finish Turning Costs of Solid-State Recycled Aluminum Alloy 6061 Сhips. Metals 2018, 8, 394. [Google Scholar] [CrossRef] [Green Version]
  29. Yang, A.; Han, Y.; Pan, Y.; Xing, H.; Li, J. Optimum surface roughness prediction for titanium alloy by adopting response surface methodology. Results Phys. 2017, 7, 1046–1050. [Google Scholar] [CrossRef]
  30. Zong, W.; Huang, Y.; Zhang, Y.; Sun, T. Conservation law of surface roughness in single point diamond turning. Int. J. Mach. Tools Manuf. 2014, 84, 58–63. [Google Scholar] [CrossRef] [Green Version]
  31. Chen, J.; Zhao, Q. A model for predicting surface roughness in single-point diamond turning. Measurement 2015, 69, 20–30. [Google Scholar] [CrossRef]
  32. He, C.; Zong, W.; Sun, T. Origins for the size effect of surface roughness in diamond turning. Int. J. Mach. Tools Manuf. 2016, 106, 22–42. [Google Scholar] [CrossRef]
  33. Lin, S.; Chang, M. A study on the effects of vibrations on the surface finish using a surface topography simulation model for turning. Int. J. Mach. Tools Manuf. 1998, 38, 763–782. [Google Scholar] [CrossRef]
  34. Zhang, S.; To, S.; Zhang, G.; Zhu, Z. A review of machine-tool vibration and its influence upon surface generation in ultra-precision machining. Int. J. Mach. Tools Manuf. 2015, 91, 34–42. [Google Scholar] [CrossRef]
  35. Altintas, Y.; Weck, M. Chatter Stability of Metal Cutting and Grinding. CIRP Ann. 2004, 53, 619–642. [Google Scholar] [CrossRef]
  36. Biermann, D.; Baschin, A. Influence of cutting edge geometry and cutting edge radius on the stability of micromilling processes. Prod. Eng. 2009, 3, 375–380. [Google Scholar] [CrossRef]
  37. Yusoff, A.R.; Turner, S.; Taylor, C.M.; Sims, N. The role of tool geometry in process damped milling. Int. J. Adv. Manuf. Technol. 2010, 50, 883–895. [Google Scholar] [CrossRef] [Green Version]
  38. Budak, E.; Tunc, L. Identification and modeling of process damping in turning and milling using a new approach. CIRP Ann. 2010, 59, 403–408. [Google Scholar] [CrossRef]
  39. Arcona, C.; Dow, T.A. An Empirical Tool Force Model for Precision Machining. J. Manuf. Sci. Eng. 1998, 120, 700–707. [Google Scholar] [CrossRef]
  40. Maiss, O.; Grove, T.; Denkena, B. Influence of asymmetric cutting edge roundings on surface topography. Prod. Eng. 2017, 11, 383–388. [Google Scholar] [CrossRef]
  41. De Oliveira, F.B.; Rodrigues, A.R.; Coelho, R.T.; De Souza, A.F. Size effect and minimum chip thickness in micromilling. Int. J. Mach. Tools Manuf. 2015, 89, 39–54. [Google Scholar] [CrossRef]
  42. Challen, J.; Oxley, P. Slip-line fields for explaining the mechanics of polishing and related processes. Int. J. Mech. Sci. 1984, 26, 403–418. [Google Scholar] [CrossRef]
  43. Malekian, M.; Mostofa, M.; Park, S.S.; Jun, M. Modeling of minimum uncut chip thickness in micro machining of aluminum. J. Mater. Process. Technol. 2012, 212, 553–559. [Google Scholar] [CrossRef]
  44. Outeiro, J.C. Influence of tool sharpness on the thermal and mechanical phenomena generated during machining operations. Int. J. Mach. Mach. Mater. 2007, 2, 413–432. [Google Scholar] [CrossRef]
  45. Ducobu, F.; Filippi, E.; Riviére-Lorphévre, E. Modélisation de l’influence de la profondeur de coupe en micro-coupe orthogonale. In Proceedings of the Congrès français de mécanique, Marseille, France, 24–28 August 2009; pp. 24–28. [Google Scholar]
Figure 1. (a) Simulated surface from turning, created assuming perfect chip removal; (b) Simulated surface created by assuming material in the Spanzipfel region is left on the surface and behaves elastically.
Jmmp 04 00063 g001
Figure 2. Simulated surface created by assuming some constant amount of material is pushed to the side during each workpiece revolution.
Jmmp 04 00063 g002
Figure 3. (a) HAAS TL2 CNC lathe used to perform cutting tests; (b) Kennametal TPGN K-68 tool of rc = 0.8 mm tool being touched off the Ti-6Al4V workpiece.
Jmmp 04 00063 g003
Figure 4. (a) Rake face view of the modified edge of a Kennametal TPGN K-68 tool of rc = 3.2 mm, re = 30 µm; (b); tool cloudmap produced via scanning white light interferometer; (c) subsequent analysis of tool cloudmap via MATLAB; (d) used tool exhibiting tool/workpiece contact discoloration and limited adhesion, but no tool (edge or nose) wear.
Jmmp 04 00063 g004
Figure 5. (a) Initial model workpiece geometry; (b) tool geometry imposed on the previously defined workpiece geometry.
Jmmp 04 00063 g005
Figure 6. (a) Tool geometry imposed on new surface profile, altered by the current tool path segment; (b) magnified examples of the model geometry that clarify the side flow transition and surface profile construction.
Jmmp 04 00063 g006
Figure 7. (a) Tool geometry in the new path position imposed on the surface profile generated by the previous path; (b) surface profile created by the iterative model, shown at equilibrium.
Jmmp 04 00063 g007
Figure 8. Surface profile created by the iterative model, shown at equilibrium after Gaussian filtering.
Jmmp 04 00063 g008
Figure 9. Roughness (Rz) model (lines) compared to data gathered through experimental investigation in Ti-6Al4V.
Jmmp 04 00063 g009
Figure 10. Roughness (Rt) model (lines) compared to data adapted from Knuefermann [9]; roughness measurements were taken in both long and short lengths to show the influence of waviness on the roughness obtained with ISO-standard (long) roughness evaluation lengths. Material: 51CrV4.
Jmmp 04 00063 g010
Figure 11. Surface profile altered by MTE (MTE), typical of way axis-induced error.
Jmmp 04 00063 g011
Figure 12. (a) Tool/workpiece interface model depicting the tendency of a small edge radius to promote less MTE damping; (b) tool/workpiece interface model depicting the tendency of a large edge radius to result in more MTE damping, proportional to the increase in hmin.
Jmmp 04 00063 g012
Figure 13. Roughness (Rz) model (lines) compared to roughness data adapted from Childs et al. [23]. The MTE-affected roughness is shown to be predicted by the adjusted model with some accuracy. Material: Al 1075.
Jmmp 04 00063 g013
Figure 14. (a) Model-generated surface geometry showing the tool profile projection path and light overlapping of previous tool paths, modeled with rc = 0.4 mm, hmin = 5 µm, and f = 0.1 mm; (b) model-generated surface geometry showing heavy overlapping of previous paths (multi-path condition), modeled with rc = 1.6 mm, hmin = 5 µm, and f = 0.1 mm.
Jmmp 04 00063 g014
Table 1. Experimental parameters.
Feed fNose Radius rcTheoretical/Kinematic Roughness RtEdge Radius re
0.1 mm3.2 mm0.39 µm12.5 µm
0.1 mm0.8 mm1.56 µm20 µm
0.1 mm0.4 mm3.13 µm30 µm
0.2 mm0.8 mm6.25 µm
0.2 mm0.4 mm12.5 µm
Table 2. Material properties, and empirically determined material-specific yeff and hmin/re values for the relevant workpieces studied.
Materialyeffhmin/re (+/−0.05)Ultimate Tensile StrengthYoung’s ModulusThermal Conductivity
AL 1075−71 ° 0.0690 MPa69 GPa236 W/mK
51CrV4−68 ° 0.071950 MPa190 GPa46.6 W/mK
Ti-6Al4V−67 ° 0.081100 MPa115 GPa7.2 W/mK

