Abstract
In semi-solid metal high pressure die casting and in conventional high pressure die casting, it is common to find a defect band just below the surface of the component. The formation of these bands is not fully understood. However, there are several theories as how they occur, and it has been suggested that segregation is caused by the migration of aluminium-rich externally solidified crystals. In the present work the formation of these bands is investigated theoretically by reviewing suitable potential mechanisms for the migration of such crystals. Two mechanisms are identified as the most probable: Saffman lift force and the Mukai-Lin-Laplace effect. However, it was not possible to identify which of these two mechanisms acted in the case studies. Further testing is required to identify the mechanism that is causing the migration of the aluminium globules and suitable tests are proposed.
1. Introduction
High pressure die casting (HPDC) is a common manufacturing process used to produce high integrity castings for, among others, the automotive industry. To address the ever-increasing demands of lightweighting and improved mechanical properties, concurrent developments of material and process are necessary to avoid compromising the integrity of the component. One phenomenon that can affect both the material and process is defect banding, which has been observed in HPDC in previous studies and possible origins of band formation have been discussed [1,2,3]. The defect band exhibits a microstructure that consists mostly of a macrosegregated eutectic phase (Figure 1). Previous research by the lead author suggested that aluminium globules migrate toward the centre of the component, leaving a band behind [3,4]. The present study utilises and extends upon experiments from these previous trials on the possible correlation between plunger velocities and the formation of the defect bands in HPDC semi-solid aluminium-silicon alloy (Al-6 wt% Si-2.5 wt%Cu-0.3 wt% Mg), which is also the subject of the current study.

Figure 1.
Image showing a typical defect band near the surface as a thin grey band highlighted by the arrow. The band consists mainly of eutectic Al-12%Si. The white area is pre-eutectic aluminium.
In the previous trials, all process parameters were held constant except for plunger velocity. Subsequent analysis showed a measurable elevation of copper and silicon contents in the bands and a corresponding reduction in the aluminium content [4]. From this, it was deduced that primary aluminium globules migrate toward the centre of the casting and that the bands are formed by the remaining liquid from the semi-solid slurry. These bands have been associated with material failure in tensile test trials in previous research and, therefore, pose a liability for critical parts, for example in the automotive industry [5].
The focus of the present paper is a theoretical review of the potential mechanisms of the particle migration [6,7,8,9,10,11,12,13,14,15,16,17]. Each mechanism will be critically reviewed and the magnitude of the force of velocity of the globules will be derived using relevant quantities from literature and calculations. The mechanism(s) that is (are) most likely to be responsible for the migration of the globules will be established. Mechanisms identified in literature fall into two groups: Those driven by fluid flow and those driven by surface tension. Those that are caused by fluid flow are the Saffman lift force, the Magnus lift force, wall effects, hydrodynamic diffusion and shear-induced dilatant shear banding. Mechanisms driven by differences in the surface tension are quantified by the Mukai-Lin-Laplace (MLL) effect [12,13,14]. The Saffman lift force arises when there is a difference in relative velocity across a particle in a moving fluid. This causes a change in pressure exerted by the fluid on either side of the particle and leads to a net force. It has been observed in saltation of sand grains [18] and in blood vessels [19]. The Magnus lift force is a similar effect arising because of a relative rotation of a particle in a fluid. It has been observed in different sports that use a (near-)spherical ball, such as baseball, where the ability to curve the ball mid-air is desirable [20]. Wall effects occur predominately in narrow pipes in which a lubricating layer of liquid close to the wall is created. This leads to a difference in viscosity between the layers of particle-deficient and particle-rich slurry near the wall [10]. It has been observed in water treatment plants that use flocculants [21]. Hydrodynamic diffusion accounts for a net flux of densely packed particles because of collisions between those particles, which causes them to move toward areas of low particle concentration. This accounts for observed migration of particles in slurries for industry and red blood cells in the cardiovascular system [22]. Dilatant shear banding in seen in saturated granular materials, such as water-saturated sand, where strain is concentrated in the slip-bands because of the localised expulsion of fluid between particles that lock together, creating regions of high particle concentration and others of high liquid concentration. It is known from flow conditions in hoppers and silos [23]. The Mukai-Lin-Laplace effect acts due to a concentration gradient ahead of a moving solidification front, which leads to a difference in surface tension from one side of a particle or bubble to another. Examples of such effects are found in continuous casting processes [24].
In present work, a comprehensive literature survey was undertaken to identify plausible mechanisms that could account for the migration of the aluminium globules. The potency of each mechanism was evaluated with known data collected from the initial HPDC trials of semi-solid metal, known material constants and values reported in published literature. The potency of each mechanism is then compared to find those mechanisms that are capable of causing migration of the externally solidified aluminium crystals (globules) ahead of the solidification front necessary to form the banding that was observed.
2. Materials and Methods
The alloy studied is Al-6 wt% Si-2.5 wt%Cu-0.3 wt% Mg. All materials parameters are taken for this alloy where available, or for similar alloys where necessary. Potential mechanisms that were identified from previous studies as being responsible for particle migration in die casting will be examined in turn. First, key parameters about the casting slurry and the fluid flow will be defined and/or calculated. Theoretical calculations are made with the assumption of fluid flow within a pipe of circular cross-section, which is a reasonable approximation to the design of the component and ingate system.
All the flow related mechanisms of particle migration depend on flow being non-uniform and on the fluid properties, which are conveniently represented by the generalised Reynolds number, (Equation (1) [25,26,27]). In Equation (1), is an exponent determined by rheological properties of flow and where and are the generalised consistency index, and consistency index, respectively [26]. Both and have units of and are analogous to viscosity for non-Newtonian fluids. For typical semi-solid die castings, , while for a Newtonian fluid [25]). When , , Equation (1) becomes the classical expression for the (dimensionless) Reynolds number, . For other values of , the generalised Reynolds number is not dimensionless. It is generally said that for flow in circular tubes, flow is laminar if (“low”), while turbulent flow occurs if (“high”) [28]. If the semi-solid slurry is treated as a homogeneous fluid, which flows across the diameter of the pipe, the largest possible characteristic length of flow is the diameter of the shot sleeve, which is 80 mm. It is common for semi-solid aluminium-based die casting alloys to be injected with a volume fraction of solid of ∼0.30 at a temperature of ~600 °C. This gives a generalised Reynolds number of 24, which falls in the regime of “low” and implies that flow is laminar (Table 1). It is also reasonable to consider the fluid to be a Newtonian melt flowing between the globules. In this case, the authors suggest that the characteristic length is taken to be the approximate diameter of a globule, namely (Figure 2). If it is assumed that the globules occupy a regular cubic array in the fluid and occupy 30% of the total volume, this is very similar to the distance between globules across the body diagonal of one cube. Taking the viscosity and density to be those of eutectic aluminium-silicon alloy instead of the slurry ([29], Table 1), . In all conceivable situations, the generalised and conventional Reynolds numbers are within the range of laminar flow and therefore, turbulence is not considered.

Table 1.
Values of flow variables used in the calculations of particle force and velocity. The characteristic flow velocity of the slurry is the injection velocity, while that of the liquid Al-12wt%Si is derived in Section 3.

Figure 2.
Scanning electron micrograph of the alloy under consideration in the as-cast condition. The globules (white) are of the order of in diameter.
Some of the variations in fluid flow are due to a boundary layer in which some quantity of interest changes from an initial value to a constant far-field value. The relevant boundary layers in this study are for velocity and concentration. In the case of velocity, the flow velocity is assumed to be zero at the wall of the mould (i.e., a no slip condition that is common in fluid mechanics) and rises to a far-field maximum velocity away from the wall (Figure 3). For concentration, the boundary layer arises because solute rejected by the solid as it forms leads to a peak in solute concentration immediately ahead of the solid/liquid interface, causing a peak in concentration, compared to the far-field concentration (Figure 4).

Figure 3.
Schematic representation of the velocity profile boundary layer in the slurry during injection. For simplicity, the velocity is assumed to vary linearly within the boundary layer.
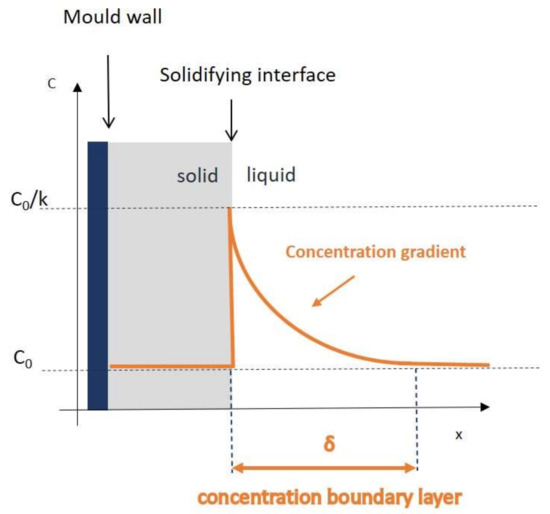
Figure 4.
Schematic image of the concentration gradient ahead of the solidifying front.
Fluid mechanics states that the thickness of a velocity boundary layer, , depends on the far-field (i.e., maximum) velocity of the fluid, , its density, , its viscosity, and the distance from the start of the flow, (Equation (2) [31]). As well as a no slip condition, Equation (2).
To establish how large and significant the migration of particles is, a value of must be determined. This was estimated using a computational fluid dynamics (CFD) simulation, which will also provide an independent estimation of boundary layer thickness. A multiphase computational fluid dynamics simulation was performed using Ansys FLUENT 2019R1 and included both air and a fluid phase to represent the slurry. The surface tension of the fluid in air was set to [32]. The calculation used the turbulence model, a velocity inlet with fluid entering the simulation domain at and an outflow outlet condition. It was assumed for simplicity that the fluid had the density of aluminium-silicon eutectic (Table 1) and that viscosity could be described by a Herschel-Bulkley model for viscosity available in ANSYS Fluent. Parameters for the Herschel-Bulkley model were retrieved from previously published literature for a similar alloy at a similar temperature to the current case [30]). This is a reasonable approach, since the Herschel-Bulkley model is widely used to account for the non-Newtonian behaviour in semi-solid die casting and the input data are measured for an alloy that is similar to the current alloy and close to the current casting conditions. It is assumed that flow occurs at a constant temperature in the simulation. By permitting both non-Newtonian flow and turbulence, no prior assumptions are made regarding the nature of the flow in the simulation and the simulation may act to validate (or otherwise) simplifications made at other stages of the analysis.
The design of the cast component is shown in Figure 5. To reduce the computational expense of the CFD simulation, the domain was reduced by utilising the axis of symmetry through the ingate and component. Furthermore, the simulation was restricted to the inlet, ingate and a portion of the component that includes all the locations investigated in the previous work by the lead author, where banding was observed [3]. The mesh included 167,000 adaptively sized elements, with a minimum characteristic length of around the complex features in the component, a maximum of near the inlet and a mean of . The simulation began with the die filled with air and allowed the slurry to fill the die in timesteps of . Flow patterns were found to become stable after approximately of simulated time, as soon as the slurry completely filled the simulation domain.
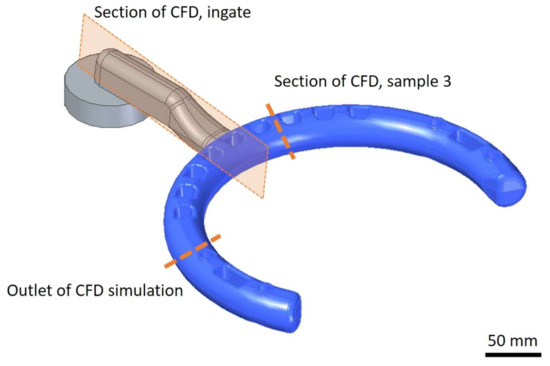
Figure 5.
CAD representation of the casting geometry. The blue semi-circle is the final component, and the grey region is the ingate system.
The CFD simulation predicts that there will be a flow velocity boundary layer with a thickness of approximately , a velocity at the edge of the boundary layer of which then increased slowly to a maximum far field flow velocity of in the shoulder of the ingate (Figure 6). Within the component, the velocity was maximum close to the edge of the boundary layer at (Figure 7). These locations are where banding has been observed and are, therefore, the values of interest in the present study [3]. Using a far-field velocity of , with the values of other parameters for the eutectic liquid that will be present in the slurry (, , ), Equation (1) predicts a value for boundary layer thickness, , in good agreement with the CFD prediction. Using the velocity at the edge of the boundary layer in Equation (1) gives a boundary layer thickness, , which is also in good agreement with the CFD prediction. With such values, the velocity boundary layer is significant in the current flow situation. Thus, mechanisms that rely on a velocity boundary layer must be considered.

Figure 6.
CFD results of the velocity magnitude at the plane of symmetry through the ingate and component marked in Figure 5 and including location 1 from [3].

Figure 7.
CFD results of velocity magnitude in the component, near the ingate, approximately at position 3 in [3] and marked in Figure 5.
During solidification of the current alloy, all alloying elements are rejected into the solute. This gives rise to a negative concentration gradient ahead of the solidification front. The defect bands that inspired this study are detectable as a decrease in the aluminium concentration and a corresponding increase of the concentrations of both silicon and copper. It is reported that silicon does not affect [33] or has a weak effect [34] on the surface tension of aluminium alloys. The total concentration of aluminium is considered to have no significant effect [33]. Mukai and Lin [12,13] have stated that a concentration gradient in front of the solidifying front propels a foreign particle in the direction of decreasing the interfacial surface tension. This gradient is caused by a solute enrichment (or depletion) of the liquid [35]. In the current solidification process, it is assumed that there is no diffusion in the solid phase, with diffusion and no mixing in the liquid close to the solidification front and that a steady state is reached. Then, the classic equation for the concentration profile is valid and can be solved in terms of distance ahead of the solid/liquid interface, (Equation (3) [36]).
where is the concentration of the melt at a distance, , ahead of the solidification front, is the concentration of the bulk material, is the partitioning coefficient, is the diffusion coefficient of the solute in the liquid and is the velocity of the solidification front. Assuming that the boundary layer is defined as the region in which there is at least a solute concentration increase of 1%, , and [37] which applies for the diffusion of copper in liquid aluminium and an estimated average velocity of solidification front, gives a boundary layer thickness of . This is much smaller than the typical size of the primary aluminium globules (), and so it is extremely unlikely that this effect can be the reason for their migration.
3. Results
3.1. Solidification Front
In the vast majority of casting processes, solidification starts at mould wall, were the liquid is coldest, and proceeds toward the centre of the cast. As the solidification front moves, it can cause entrapment of particles by engulfing them or it can reject them further into the liquid [15,16]. In our case, the particles are the rounded externally solidified crystals of pure aluminium. These crystals are assumed to be evenly distributed in the slurry, which is injected at 604 °C, and consists of liquid enriched in alloying elements. As an approximation, the liquid is taken to include silicon: the eutectic composition. The crystal diameter, , is ~50 ≤ d/μm ≤ ~150 (Figure 2). In previous research regarding metal matrix materials, it is stated that a critical velocity of the solidification front determines if a particle is engulfed by the solid phase [15,16]. The critical velocity depends on particle size and viscosity of the liquid. The thermal conductivities of the liquid, and particle, , determine whether or not solid particles are engulfed by the advancing solidification front [16,38]. This is true even at low front velocities. If , the particle is captured in the advancing solidification front. In the case at hand, and [29], suggesting that any particles at the solid/liquid interface would be incorporated into the newly formed solid. Therefore, some other mechanism causes particles that existed in the banded region to move ahead of the interface and this mechanism shall not be discussed any further.
3.2. Saffman Lift Force
In a linear velocity gradient profile, a particle can be influenced and lifted by a force perpendicular to the flow direction. This is the Saffman effect [7,8] (Equation (4), where is the radius of a spherical object that experiences the lift force, is the magnitude of the velocity gradient, is the relative velocity of particle and fluid measured at the streamline through the centre, is the dynamic (regular) viscosity and is the kinematic viscosity).
To calculate the velocity gradient, a linear profile was assumed for the boundary layer, starting from at the die wall and rising to at the edge of the boundary layer. The boundary layer thickness was taken from computational fluid dynamics simulations to be approximately and the velocity at the edge of the boundary layer was also taken from CFD results. This gives a velocity gradient of and a Saffman lift force of (Equation (4)).
3.3. Magnus Lift Force
Particle rotation relative to a fluid can result in a lift force brought by a pressure difference of either side of the particle (Equation (5), where is the particle diameter, is the particle density and is the particle mass, is the vector of local fluid rotation, is the vector of particle rotation, is the particle velocity vector and is that of the fluid [9]). The relative rotation could be the result of a rapid change of fluid flow direction, turbulence, the collision of the particle with other particles or with the wall.
To get an estimate of the Magnus lift force, , the fluid rotation was found from CFD simulations to change gradually to approximately in the regions where banding has been observed previously. The simulations also predicted negligible turbulent kinetic energy, which is consistent with the laminar flow indicated by the generalised Reynolds numbers (Table 1). However, since the rotational velocity is predicted to changed gradually and the particles and fluid have similar density (which implies efficient transfer of momentum), it is very likely that the particles will rotate with a similar velocity to the liquid. Therefore, the difference between the fluid rotational velocity and particle rotational velocity was assumed to be . The net velocity was assumed as , which is the case of a stationary particle in the flowing fluid and is a reasonable approximation for the maximum relative velocity that is likely to be found. This gives .
3.4. Wall Effects
It has been seen that a lubricating layer forms at the tube wall when carrying a liquid suspension. This is mainly seen at higher ratios of tube to sphere diameter, . It has been observed in experiments that the lubricating layer is not significant if [10]. In the current case, . This is well above the set criterion and so this mechanism is unlikely to be active in the current case.
3.5. Hydrodynamic Diffusion
Collisions between particles can lead to a net flux of particles, , which has units of (Equation (6), where is a dimensionless parameter depending on concentration (set to 1), is the fraction solid of particles (0.30), is the local shear stress, the distance from the tube wall (1.5 mm), the shear rate and is the particle diameter (100 µm)). This mechanism operates when the solid fraction is sufficiently high () and the Reynolds number [11].
may be taken as [11], and are unknown, but could be assigned approximative values found in literature [25,30,31] and needs to be derived (Appendix A). The shear stress,, is found through a Herschel-Bulkley fitting which is known to be suitable for non-Newtonian fluids like semi-solid slurries (Equation (7), where , and [30]).
The model from [30] is based on A356 (Al-6 wt% Si-3.5 wt% Mg), with a fraction of solid, . This is very close to the current case (Al-6 wt% Si-2.5 wt% Cu-0.3 wt% Mg, ) and so the same constants are assumed for the current calculation. The shear rate, could be approximated by the known velocity of flow and diameter in the inlet. There are two expressions for strain rate that may be found in literature [25,26]. Here, we use that presented by Hu et al. (Equation (8), where is the far field velocity of the flow, is the instantaneous diameter of the pipe, is the radial distance from the centreline of the pipeline to the point of interest and is an exponent determined by the rheological properties of the flow) [25].
[25], which gives a shear rate at the wall () of . In turn, this gives a shear stress of (Equation (7)). The shear rate is likely to be highest at the wall, so these assumptions give the largest conceivable value for this force.
In Equation (6), is the distance from the wall of the pipe, while in Equation (8) is the distance from the centreline of the pipe. Hence, . Using the known values of each coefficient and , i.e., at the edge of the boundary layer identified by CFD (Figure 7), the shear stress gradient is . Using this result in Equation (6), together with the other known values listed above, the hydrodynamic flux is calculated to be .
3.6. Dilatant Shear
A mechanism that is commonly regarded as the most significant is dilatant shear band formation. These bands are due to response of localised deformation [17]. It is observed in cohesionless granular material such as dense sand or glass beads and the mechanism has been adapted to partially solidified metals. A localised deformation comes from volume expansion. It is found that for alloys containing spherical particles with a fraction of solid greater than 0.5, liquid is drawn into the expanding band of concentrated strain and dilatant shear bands form. The width of these bands is found to be in the range , where and are the band width and particle diameter, respectively.
This mechanism requires a fraction of solid that is at least 50%, which is higher than in the early stages of solidification in the current case. Since the bands are observed close to the die wall, it is likely that the local solid fraction is below the level required for this mechanism to act. However, the mechanism could presumably become active in the later stages of solidification, when the fraction of solid is above 50%.
3.7. Mukai-Lin-Laplace Effect
The force, that acts on the particle because of differential surface/interfacial tension acts towards the direction of lowest surface tension (Equation (9), where is the interfacial tension gradient, , and may be expressed as or, , where is the surface tension, is the concentration, is the temperature, is the distance between the solidifying interface and the centre of the particle and is the is the radius of the particle) [12,13].
Further, the velocity may be derived (Equation (10), where is the viscosity of the liquid, and are the density of the liquid and particle, respectively and is the time from when the particle starts moving) [12,13].
A value of is required to estimate the velocity and force acting on the externally solidified crystals. The concentration boundary layer is too narrow to result in a surface tension gradient across the externally solidified crystals. However, a temperature gradient could still be acting across the crystals and the effect of such a gradient is quantified from published literature to be [39]. To reach this value, a mean value of the surface tension temperature coefficient of pure Al and Al-12%Si [39] was calculated to . It is known that the liquid is injected at 604 °C and that solid will start to form at 615 °C, according to thermodynamic calculations performed using Thermo-Calc 2019a with the TCAL5 database and permitting the default phases. Cao et al. [40], states that the interfacial heat transfer coefficient between a similar alloy (B390, Al-18wt% Si) and the H13 steel die wall, . Since the current alloy contains a lower level of silicon, a lower value is more appropriate, such as , given the same type of steel die is used. This will give a Biot number, (, where is the heat transfer coefficient between the metal and the mould, is the thermal conductivity of the liquid [29] and is the characteristic length of the casting direction of the heat flow), , which implies that a temperature gradient will be established in the liquid, but that heat is lost quickly at the die walls (Figure 8). Therefore, a lower bound for the temperature gradient may be estimated by assuming a linear temperature profile from the solidification temperature at the mould wall to the injection temperature at the centreline. This results in a gradient of .

Figure 8.
Schematic representation of the temperature profile assumed in calculations.
The externally solidified crystals are assumed to be pure aluminium and the liquid is assumed to be eutectic Al- 12wt% Si. Together with the following values, the resultant terminal velocity may be calculated to be (Equation (10)): particle radius, , liquid viscosity, , liquid density, and solid crystal density, . This terminal velocity is reached within . The corresponding calculation for the accelerating force (Equation (9)) gives a value of .
4. Discussion
From the different mechanisms considered, the results found at the location in the ingate where banding has been observed [3] are summarised in Table 2, using the fluid behaviour and properties at that location (flow velocity of , other properties discussed in Section 3). For completeness and reference, the equivalent results for the place in the component where banding was observed are summarised in Table 3 (flow velocity of , other properties discussed in Section 3). The key values of all variables used in this article are summarised in Appendix B. Given the simplifications and assumption made in the theoretical consideration of each mechanism, it is unlikely that the values are accurate. Furthermore, changes to the fluid properties, HPDC process parameters and/or component geometry will affect each result. However, the magnitude of each result is likely to be indicative of the relative importance of each mechanism. In order to compare the values attained, Stokes’ law was used to convert force to velocity and vice versa, where needed (Equation (11), where is the viscous drag force between the fluid and the particle, is the dynamic (regular) viscosity of the liquid, is the radius of the particle, is the relative flow velocity between the fluid and the particle) [41].
Table 2.
Force and velocity of particles in fluid for the flow behaviour determined at the ingate, using parameters derived for the alloy and injection conditions. An asterisk (*) denotes that the value is determined using Stokes’ law. Other values are calculated directly from published equations.
Table 3.
Force and velocity of particles in fluid for the flow behaviour determined at the location where banding was observed in the component, using parameters derived for the alloy and injection conditions. An asterisk (*) denotes that that the value is determined using Stokes’ law. Other values are calculated directly from published equations.
Here, the assumptions made by using Stokes’ law are deemed to be reasonable in the regions of interest in the current scenario: laminar flow (supported by the results of the CFD simulations), smooth, spherical, non-interfering particles and a homogeneous liquid. Since this physical scenario is of individual globules moving through the eutectic melt on the microscopic scale, the fluid properties of the eutectic melt are used in these calculations (Table 1), not those of the slurry.
Previous published results show that the bands are found in all sections of the cast component that were examined [3]. As the metal slurry flows through the cast mould, the flow-related mechanisms can act at all times. However, the temperature gradient subsides as the metal travel the distance from the ingate to the overflow region due to heat losses. This could reduce the steepness of the temperature gradient, and consequently the surface tension gradient in the MLL effect. However, the initial assumption of temperature gradient is likely to be a significant underestimate of the gradient during early stages of the casting process and so the finding that temperature can have a significant effect on the globules is likely to be valid a significant distance into the component.
4.1. Saffman Lift Force
According to a numerical simulation by Laukli, spherical crystals of diameter flowing through a diameter led to no Saffman-force-induced effects [6]. Furthermore, Wang et al. discounted the Saffman mechanism since they were unable to produce the effect in experiments that matched their calculations [24]. Since the current case is similar to both previous studies mentioned, it is unlikely that the Saffman mechanism is ultimately responsible for the observed segregation. However, the current calculations suggest it is the most potent mechanism and this possibility cannot be discounted. There is no obvious reason why the Saffman mechanism is so much more powerful than the alternatives in the current calculations, but previous findings suggest that it should be discounted. It is possible that one of the physical assumptions made to calculate the magnitude of the Saffman lift force is not correct. This must be investigated in future studies to determine if the Saffman force acts in this case and, if not, why the current calculations are not representative of experiments.
4.2. Magnus Lift Force
It is not possible to determine or predict the particle rotation with certainty. Such values must be measured, if they are to be found accurately. However, the generalised Reynolds numbers calculated for the slurry and for the liquid between particles indicate that the flow is not likely to consist of a high level of turbulence and so the rotational velocity of the fluid is likely to change gradually (Table 1). This is consistent with the CFD results. Similarly, it is unlikely that the particles will rotate more rapidly than the fluid, as there is no source of this rotational kinetic energy. Therefore, it is unlikely that the relative rotational velocity between the particle and the liquid is hundreds of revolutions per second, which is required to make the Magnus lift force comparable in magnitude to other mechanisms. Even if the particles are assumed to not rotate or move, which is extremely unlikely, the Magnus lift force has a magnitude of . This is only slightly below the magnitude of the force derived from the Mukai-Lin-Laplace effect. However, the physical situation required to achieve this is extremely unlikely and the relative rotational and translational velocities are likely to be significantly lower. This is especially clear when it is remembered that the particles and the liquid have similar densities, which allow the efficient transfer of momentum from the liquid to the particles. The Magnus lift force is therefore rejected as the mechanism responsible for the banding observed.
4.3. Hydrodynamic Diffusion
The force derived from this mechanism is orders of magnitude smaller than all other mechanisms considered. Although the equation is valid for slurries with fraction solid it also requires a very low Reynolds number, in the region of [9]. Our calculations of generalised Reynolds number are in the range and are much too high for this mechanism to act. Therefore, it is reasonable to say that this mechanism is not a major contributor of the migration of particles under these circumstances.
4.4. Mukai-Lin-Laplace Effect
The calculations show that a particle (or bubble) would migrate up the temperature gradient—down the surface tension gradient—and would outrun the solidification front. However, in the very rapid process of high pressure die casting, it is conceivable that this is not the only mechanism for the migration of particles. The typical mould filling time, , in high pressure die casting is [42], by which time frame the Mukai-Lin-Laplace effect predicts that the particle may not have reached its terminal velocity. However, in semi-solid HPDC processes the filling time is longer to compensate for the higher viscosity: . This is much greater than the time required to reach the terminal velocity (), which is plausible in the current work. Therefore, it is concluded that it is plausible that this mechanism is responsible for the particle migration that leads to the observed banding.
4.5. Future Work
The current calculations represent an advanced theoretical treatment. To advance the field further, it is recommended that experiments are performed to test each mechanism and measure the effects experimentally. Water or another transparent liquid may be used as the fluid, with nonreactive particles entrained in the flow. A high-speed camera may be used to record the exact behaviour. Flow velocities and geometries may be selected to promote one mechanism over the others to see if it leads to segregation of the particles. This is especially important in the case of the Saffman lift force, which previous studies have indicated does not act in similar situations to that in the current study, but which the current calculations predict to be the most potent force. More sophisticated simulations could also be used to advance the current work, such as computational fluid dynamics with temperature-dependent viscosity and coupled heat transfer calculations.
5. Conclusions
- It is not possible to positively identify a single mechanism that is responsible for the banding observed in the previous high pressure die casting experiments using theoretical considerations alone.
- Of all mechanisms investigated in this paper, two are considered most likely to be responsible for the migration of the particles found: Saffman lift force and/or the Mukai-Lin-Laplace effect.
- Calculations and literature results suggest that the effect of a temperature gradient leads to a difference in surface/interfacial tension across the externally solidified crystals of aluminium, which leads to a net force according to the Mukai-Lin-Laplace effect.
- This force is capable of moving the particles ahead of the solidification front.
- The velocity gradient in the boundary layer is sufficient to lead to particle migration via the Saffman lift force.
- More sophisticated simulations, such as computational fluid dynamics with coupled heat transfer, could help advance the current work.
- More exact fluid properties would also improve the accuracy of any future simulations.
- It is very likely that experiments are necessary to find the mechanism responsible for particle migration with confidence.
Author Contributions
Conceptualization, C.N.H.-S.; methodology, M.L. and C.N.H.-S.; software, C.N.H.-S.; investigation, M.L.; resources, C.N.H.-S. and P.G.J.; data curation, M.L. and C.N.H.-S.; validation, C.N.H.-S.; writing—original draft preparation, M.L.; writing—review and editing, C.N.H.-S., T.M. and P.J.; visualization, M.L. and C.N.H.-S.; supervision, C.N.H.-S. and P.G.J.; project administration, P.J.; funding acquisition, M.L. and P.G.J. All authors have read and agreed to the published version of the manuscript.
Funding
This research was funded by Grants from Jernkontoret Forskningsstiftelser, Stiftelsen A. H. Göranssons and Yngströms Stiftelse.
Acknowledgments
M.L. would like to express gratitude to Magnus Wessén for material and Olof Granath for contributing CAD files used in the CFD simulation. All authors express their gratitude to Andrey Karasev for the image analysis that motivated this work.
Conflicts of Interest
The authors declare no conflict of interest
Appendix A
For the sake of clarity, the authors present their derivation of the local shear stress from expressions retrieved from references [25,26].
Reference [26] presents the following expression, where is the diameter of the tube within which fluid is flowing and is the far-field flow velocity, is a constant and is the pressure drop across the length, , within the fluid.
Reference [25] presents the following expression as its Equation (11), where is the diameter of the tube in which fluid is flowing and is the far-field velocity of the flow. is the shear strain rate in the fluid and is the radial distance from the centre of the pipe.
Rearranging Equation (A1) by dividing by K:
Rearranging Equation (A2) to the power of and multiplying the result by :
Noting that and , the right-hand sides of Equations (A3) and (A4) are identical. This allows the two left hand sides to be equated:
Simplifying and rearranging Equation (A5):
The left-hand side of Equation (A5) is the shear stress, according to the Herschel-Bulkley power-law equation for a fully developed laminar flow, simplified for a Newtonian fluid [43], which was shown to be a reasonable approximation in the regions of interest, where banding has been observed. The right-hand side of Equation (A5) is the shear stress due to a pressure drop that drives the fluid flow [26,44]. From here on in, the derivation uses the conventions of reference [25].
From the Herschel-Bulkley (Equations (7) and (A6) where is the Herschel-Bulkley constant and is a constant equivalent to in this treatment [30]), the derivative of shear stress as a function of position form the pipe wall, , can be determined (Equation (A7)).
Substituting for using Equation (A2) and noting that both and are constants:
In Equation (6), is the at the centre line of a couette rotating gap [11]. This implies that the shear rate at the centre of the couette rheometer is zero and at its maximum at the walls. However, in Equation (8) is the distance from the centreline of a pipe to the wall, with the shear rate at its maximum at the wall [25]. Thence, distance is defined in opposite directions and . Substituting to remove these discrepancies:
Values have been published for similar alloys than the one under consideration here: , and . Values for the other variables may be taken from consideration of the current die casting operation: , and . Using these values and assuming a value of , which is where the bands are observed, the shear stress gradient is calculated to be .
The equation for hydrodynamic flux (Equation (6) in the article, also (A9) here) may now be calculated:
where is a constant which is taken to be 1 [11], is the volume fraction of solids in the die casting slurry, which is 0.3 in this study and is the particle diameter, which is approximately in the slurry used. is calculated using Equation (A6). This gives a hydrodynamic flux, towards the centre of the cast component.
Appendix B
Table A1.
List of all variables used in the calculations presented in this article, together with sources.
Table A1.
List of all variables used in the calculations presented in this article, together with sources.
| Quantity | Symbol | Value | Source | Calculations Where the Value is Used |
|---|---|---|---|---|
| Liquid alloy density | [29] | 1 | ||
| Distance from start of flow | Experiment | 1 | ||
| Liquid viscosity (Al-12wt%Si) | [29] | 1, 3 | ||
| Kinematic viscosity | Calculated [29] | 4 | ||
| Slurry density (Al-6wt%Si) | [29] | 3 | ||
| Liquid density (Al-12wt%Si) | [29] | 10 | ||
| Maximum velocity | CFD | 1, 8 | ||
| Al-Si eutectic surface tension | [32] | CFD | ||
| Solute concentration at which the boundary layer ends | 1.01 | Assertion | 2 | |
| Partitioning coefficient | 0.13 | [36] | 2 | |
| Diffusion coefficient | [37] | 2 | ||
| Solidification fronts average velocity | Approximation | 2 | ||
| characteristic length | Experiment | 3 | ||
| characteristic length | Experiment | 3 | ||
| Average velocity of fluid (plunger velocity) | Experiment | 3 | ||
| Average velocity of fluid | Experiment | 3 | ||
| Exponent of rheology | 0.4 | [25] | 3 | |
| Spherical radius | Experiment | 4, 9, 10 | ||
| Relative velocity of particle | CFD | 4 | ||
| Magnitude of velocity gradient | Calculated | 4 | ||
| Rotational velocity of particles | Approximation | 5 | ||
| Spherical diameter | Experiment | 5 | ||
| Net velocity | CFD | 5 | ||
| Dimensionless parameter | 1 | [11] | 6 | |
| Fraction solid (volume) | 0.30 | Experiment | 6 | |
| Shear stress | Calculated, [25,30] | 6, 7 | ||
| Shear rate | Experiment, [25] | 7, 8, A2, A9 | ||
| Local shear stress | Experiment, [30] | 6, A9 | ||
| Herschel-Bulkley yield stress | [30] | 7, A6 | ||
| Consistency index | [30] | 7, A6, A8 | ||
| Constant | [30] | 7, A6, A8 | ||
| Generalised consistency index | Calculated [26] | 1 | ||
| Tube radius | Experiment | 8 | ||
| Tube diameter | Experiment | 8 | ||
| Rheological properties exponent | [25] | 8 | ||
| Distance from tube wall | Experiment, CFD | 8 | ||
| Interfacial tension gradient | Calculated [39] | 9, 10 | ||
| Surface tension | Calculated [39] | 9, 10 | ||
| Temperature gradient | 30,900 | Experiment | 9, 10 | |
| [29] | 4, 10 | |||
| Density of the liquid | [29] | 10 | ||
| Density of the particle | [29] | 5, 10 |
References
- Fan, Z.; Liu, G.; Wang, Y. Microstructure and mechanical properties of rheo-diecast AZ91D magnesium alloy. J. Mater. Sci. 2006, 41, 3631–3644. [Google Scholar] [CrossRef]
- Möller, H.; Curle, U.A.; Masuku, E.P. Characterization of surface liquid segregation in SSM-HPDC aluminium alloys 7075, 2024, 6082 and A201. Trans. Nonferrous Met. Soc. China 2010, 20, 847–851. [Google Scholar] [CrossRef]
- Bladh, M.; Wessén, M.; Dahle, A.K. Shear Band Formation in a Shaped Rheocast Aluminium Component at Various Plunger Velocities. Trans. Nonferrous Met. Soc. China 2010, 20, 1749–1755. [Google Scholar] [CrossRef]
- Law, M. Investigations on the Formation of Defect Bands in Semi-Solid High Pressure Die Cast Aluminium-Silicon Alloys. Master’s Thesis, KTH Royal Institute of Technology, Stockholm, Sweden, 8 May 2020. Available online: http://urn.kb.se/resolve?urn=urn%3Anbn%3Ase%3Akth%3Adiva-272086 (accessed on 8 May 2020).
- Li, X.; Xiong, S.M.; Guo, Z. On the tensile failure induced by defect band in high pressure die casting of AM60B magnesium alloy. Mater. Sci. Eng. A 2016, 674, 687–695. [Google Scholar] [CrossRef]
- Laukli, H.I.; Gourlay, C.M.; Dahle, A.K. Migration of Crystals during Filling of Semi-Solid Castings. Met. Trans. A 2005, 36, 805–818. [Google Scholar] [CrossRef]
- Saffman, P.G. The lift on a Small Sphere in a Slow Shear Flow. J. Fluid Mech. 1965, 22, 385–400. [Google Scholar] [CrossRef]
- Saffman, P.G. Corrigendum. J. Fluid Mech. 1968, 31, 624. [Google Scholar] [CrossRef]
- Crowe, C.; Sommerfeld, M.; Tsuji, Y. Multiphase Flows with Droplets and Particles; CRC Press: Boca Raton, FL, USA, 1998; pp. 95–99. [Google Scholar]
- Seshadri, V.; Sutera, S.P. Concentration changes of suspension of rigid spheres flowing through tubes. J. Colloid Interface Sci. 1968, 27, 101–110. [Google Scholar] [CrossRef]
- Leighton, D.; Acrivos, A. The shear-induced migration of particles in concentrated suspensions. J. Fluid Mech. 1987, 181, 415–439. [Google Scholar] [CrossRef]
- Mukai, K.; Lin, W. Motion of Small Particles in Solution with a Interfacial Tension Gradient and Engulfment of the Particles by Solidifying Interface. Tetsu Hagané 1994, 80, 527–532. [Google Scholar] [CrossRef][Green Version]
- Mukai, K.; Lin, W. Behavior of Non-metallic Inclusions and Bubbles in Front of Solidifying Interface of Liquid Iron. Tetsu Hagané 1994, 80, 533–538. [Google Scholar] [CrossRef]
- Mukai, K.; Matsushita, T. Interfacial Physical Chemistry of High. Temperature Melts; CRC Press: Boca Raton, FL, USA, 2019; p. 104. [Google Scholar]
- Garvin, J.W.; Udaykumar, H.S. Drag on a particle being pushed by a solidification front and its dependence on thermal conductivities. J. Cryst. Growth 2004, 267, 724–737. [Google Scholar] [CrossRef]
- Mortensen, A.; Jin, I. Solidification processing of metal matrix composites. Int. Mater. Rev. 1992, 37, 101–128. [Google Scholar] [CrossRef]
- Gourlay, C.M.; Dahle, A.K. Dilatant shear bands in solidifying metals. Nature 2007, 445, 70–73. [Google Scholar] [CrossRef] [PubMed]
- Zou, X.; Cheng, H.; Zhang, C.; Zhao, Y. Effects of the Magnus and Saffman forces on the saltation trajectories of sand grain. Geomorphology 2007, 90, 11–22. [Google Scholar] [CrossRef]
- Stone, H. Philip Saffman and viscous flow theory. J. Fluid Mech. 2000, 409, 165–183. [Google Scholar] [CrossRef]
- Briggs, L.; Lyman, J. Effect of Spin and Speed on the Lateral Deflection (Curve) of a Baseball; and the Magnus Effect for Smooth Spheres. Am. J. Phys. 1959, 27, 589–596. [Google Scholar] [CrossRef]
- Zhao, Y. Settling behaviour of polymer flocculated water-treatment sludge I: Analyses of settling curves. Sep. Purif. Technol. 2004, 35, 71–80. [Google Scholar] [CrossRef][Green Version]
- Tan, M.; Le, D.; Chiam, K. Hydrodynamic diffusion of a suspension of elastic capsules in bounded simple shear flow. Soft Matter 2012, 8, 2243–2251. [Google Scholar] [CrossRef]
- Duran, J. Sands, Powders, and Grains: An Introduction to the Physics of Granular Materials (Partially Ordered Systems); Springer: New York, NY, USA, 2000. [Google Scholar]
- Wang, Z.; Mukai, K.; Lee, I.J. Behavior of Fine Bubbles in Front of the Solidifying Interface. ISIJ Int. 1999, 39, 553–562. [Google Scholar] [CrossRef]
- Hu, X.; Zhu, Q.; Atkinson, H.; Lu, H.; Zhang, F.; Dong, H.; Kang, Y. A time-dependent power law viscosity model and its application in modelling semi-solid die casting of 319s alloy. Acta Mater. 2017, 124, 410–420. [Google Scholar] [CrossRef]
- Hartnett, J.; Cho, Y. Handbook of Heat Transfer, 3rd ed.; Rohsenow, W., Hartnett, J., Cho, Y., Eds.; McGraw-Hill: New York, NY, USA, 1998. [Google Scholar]
- Metzner, A.B.; Reed, J.C. Flow of non-Newtonian fluids—Correlation of the laminar, transition, and turbulent-flow regions. AIChE J. 1955, 1, 434–440. [Google Scholar] [CrossRef]
- Bird, R.; Lightfoot, E.; Stewart, W. Transport Phenomena, 2nd ed.; Wiley: New York, NY, USA, 2007. [Google Scholar]
- Mills, K.C. Recommended Values of Thermophysical Properties for Selected Commercial Alloys; Woodhead Publishing: Cambridge, UK, 2002. [Google Scholar]
- Tonmukayakul, N.; Pan, Q.Y.; Alexandrou, A.N.; Apelian, D. Transient Flow Characteristics and Properties of Semi-Solid Aluminium Alloy A365. Proceedings of 8th International Conference of Semi-Solid Processing of Alloys and Composites S2P, Limassol, Cyprus, 21–23 September 2004; pp. 167–172. [Google Scholar]
- Massey, B.S. Mechanics of Fluids, 6th ed.; Van Nostrand Reinhold: London, UK, 1989. [Google Scholar]
- Davies, V.L.; West, J.M. Factors affecting modification of aluminium-silicon eutectic. J. Inst. Met. 1964, 92, 208. [Google Scholar]
- Hur, B.; Park, S.; Hiroshi, A. Viscosity and surface tension of Al and effects of additional element. Mater. Sci. Forum 2003, 439, 51–56. [Google Scholar] [CrossRef]
- Goicoechea, J.; Garcia-Cordovilla, C.; Louis, E.; Pamies, A. Surface tension of binary and ternary aluminium alloys of the systems Al-Si-Mg and Al-Zn-Mg. J. Mater. Sci. 1992, 27, 5247–5252. [Google Scholar] [CrossRef]
- Zeze, M.; Mukai, K. Effect of Solute Contents on the Entrapment of Gas Bubbles and Non-Metallic Inclusions by the Solidifying Shell in Continuous Casting of Steel. ICS. In Proceedings of the 3rd International Congress on the Science and Technology of Steelmaking, Charlotte, NC, USA, 9–12 May 2005; pp. 873–880. [Google Scholar]
- DoITPoMS Teaching and Learning Package on Solidification of Alloys. Available online: https://www.doitpoms.ac.uk/tlplib/solidification_alloys/printall.php (accessed on 18 August 2019).
- Du, Y.; Chang, Y.; Huang, B.; Gong, W.; Jin, Z.; Xu, H.; Yuan, Z.; Liu, Y.; He, Y.; Xie, F.-Y. Diffusion coefficients of some solutes in fcc and liquid Al: Critical evaluation and correlation. Mater. Sci. Eng. A 2003, 363, 140–151. [Google Scholar] [CrossRef]
- Zubko, A.M.; Lobanov, V.G.; Nikonova, V.V. Reaction of Foreign Particles with a Crystallization Front. Sov. Phys. Crystallogr. 1973, 18, 239–245. [Google Scholar]
- Kobatake, H.; Brillo, J.; Schmitz, J.; Pichon, P. Surface tension of binary Al—Si liquid alloys. J. Mater. Sci. 2015, 50, 3351–3360. [Google Scholar] [CrossRef]
- Cao, Y.; Guo, Z.; Xiong, S. Determination of the metal/die interfacial heat transfer coefficient of high pressure die cast B390 alloy. IOP Conf. Ser. Mater. Sci. Eng. 2012, 33, 012010. [Google Scholar] [CrossRef]
- Stokes’ law. Available online: https://en.wikipedia.org/wiki/Stokes%27_law (accessed on 12 May 2020).
- The Benefits of Semi-Solid Casting for Aluminum Alloys. Available online: https://www.foundrymag.com/melt-pour/article/21928694/the-benefits-of-semisolid-casting-for-aluminum-alloys (accessed on 6 March 2020).
- Herschel, W.H.; Bulkley, R. Konsistenzmessungen von Gummi-Benzollösungen. Colloid Polym. Sci. 1926, 39, 291–300. [Google Scholar] [CrossRef]
- Fluid Mechanics. Available online: https://acikders.ankara.edu.tr/pluginfile.php/16644/mod_resource/content/1/WEEK%2012%20OF%20AQS110%20FLUID%20MECHANICS.pdf (accessed on 6 March 2020).
© 2020 by the authors. Licensee MDPI, Basel, Switzerland. This article is an open access article distributed under the terms and conditions of the Creative Commons Attribution (CC BY) license (http://creativecommons.org/licenses/by/4.0/).