Article

Lateral Vibrations in Deep Hole Drilling Due to Land Width Variation

Institute of Production Management, Technology and Machine Tools (PTW), Otto-Berndt-Str. 2, 64287 Darmstadt, Germany
*
Author to whom correspondence should be addressed.
J. Manuf. Mater. Process. 2020, 4(2), 28; https://doi.org/10.3390/jmmp4020028
Submission received: 12 February 2020 / Revised: 20 March 2020 / Accepted: 24 March 2020 / Published: 26 March 2020

Abstract

:
In drilling processes, self-excited vibrations have a negative influence on the achievable drilling qualities and tool life. Low-frequency radial vibrations are characterised by oscillating movements of the tool tip and the generation of lobed holes in drilling. This study focuses on the participation and influence of the land widths of twisted drilling tools on these vibrations. Therefore, drilling tools with different land widths and a length-to-diameter ratio of 12 are used, and different parameters, such as feed rate, cutting speed, coolant pressure, pre-hole diameter, and chuck selection, are varied in a drill-out process. The results show that the land widths have a statistically significant influence on the formation of lateral vibrations and the generation of lobed holes.

1. Introduction

Drilling with twist drills is the most commonly used machining process in various industries, such as the automotive, aerospace, dies/molds, home appliance, medical, and electronic equipment industries [1]. The increasing demands on the productivity of industry require shorter cycle times with increasing quality requirements on the bores. Vibrations during the drilling process are generally undesirable as they produce a poor surface quality and have a negative effect on tool life. An exception is vibration-assisted drilling, in which the formation of short chips is promoted by a cyclic axial movement of the tool cutting edge [2]. Vibration phenomena in drilling processes were first investigated by Tobias et al. [3] using stability maps to visualize the dependence of the vibration occurrence on the cutting speed in orthogonal cutting for a given system. Vibration during drilling can be divided into two types, low frequency lateral vibrations (also known as radial vibrations) with lobed holes and torsional vibrations with a profiled hole bottom. Galloway [4] investigated the hole qualities that could be produced using twist drills. He varied the tool geometries and technology parameters and investigated their effect on the hole quality and the formation of lateral vibrations. In this study, it was shown that the drilling tool moves sideways away from the drilling axis when it touches the workpiece surface and starts to cut in the deflected position. Subsequent investigations, which measure the movement of the tool during workpiece contact, confirm the relation between the deflection of the tool to the spindle rotation axis and the resulting circularity of the hole. [5] The resulting deflection of the drilling tool and the radial force are considered to cause lateral vibrations. Deep-hole drilling tools with large aspect ratios are especially susceptible to such vibrations, which influence the hole quality. [6] Another cause is the offset of cutting edge height, which causes different chip thicknesses to be removed and thus results in an asymmetrical tool load. [7] Existing mathematical models describe the oscillating motion mechanisms of the tool tip and their effects on the circularity. In most cases, these models consist of a dynamic partial model which characterizes the vibrating tool-workpiece system. [7,8,9,10,11] With an extension from a straight cutting edge to complex cutting edge geometry, a multitude of tool geometries can be taken into account [12]. For an insert drill, Parsian et al. [13] first developed a force model to describe the forces on asymmetrically arranged inserts. With the integration of a dynamic model, the authors extend the model for the description of vibrations. [14,15,16] Although existing models can describe the cause of the lateral vibrations and its influence on the hole quality, the aim is still to reduce, if not prevent, these vibrations. Therefore, tool damping was also taken into account in the models, even if some of the models are based on a stationary tool and a rotating workpiece [17,18,19,20]. In experimental investigations by Tschannerl et al. [21], tools with different geometric characteristics were examined for their tendency to produce lateral vibrations. He concluded that tools with a reduced clearance angle, an increased cross cutting width, a negative rake angle, as well as a design with four lands, increase the damping in drilling processes and improve the circularity. It seems that the damping effect in drilling processes is an essential factor in influencing the tendency to vibrate. Ahmadi et al. [22] investigated vibration phenomena during drilling with tools with different wear conditions. While the sharp tool (flank wear of 30 µm) tends mainly to torsional axial vibrations, the worn tool (flank wear of 100 µm) tends mainly to lateral vibrations. The authors justified this effect with the increased damping of the worn drilling tool. It can be deduced that damping in form of friction at the main cutting edges as a result of wear does not lead to avoid lateral vibrations. Biermann et al. [23,24] investigated the damping during Boring and Trepanning Association (BTA) drilling, in which the authors varied the geometry of the guide pads on the tool, including the coating. The results led to a reduction in abrasive wear and to improve the surface of the bore wall. Dilley et al. [25] already investigated the influence of the interaction of the land with the borehole wall during drilling and extended existing models. The interaction was modelled as forces that interpret the elastic deflection of the land as springs.

2. Research Objective

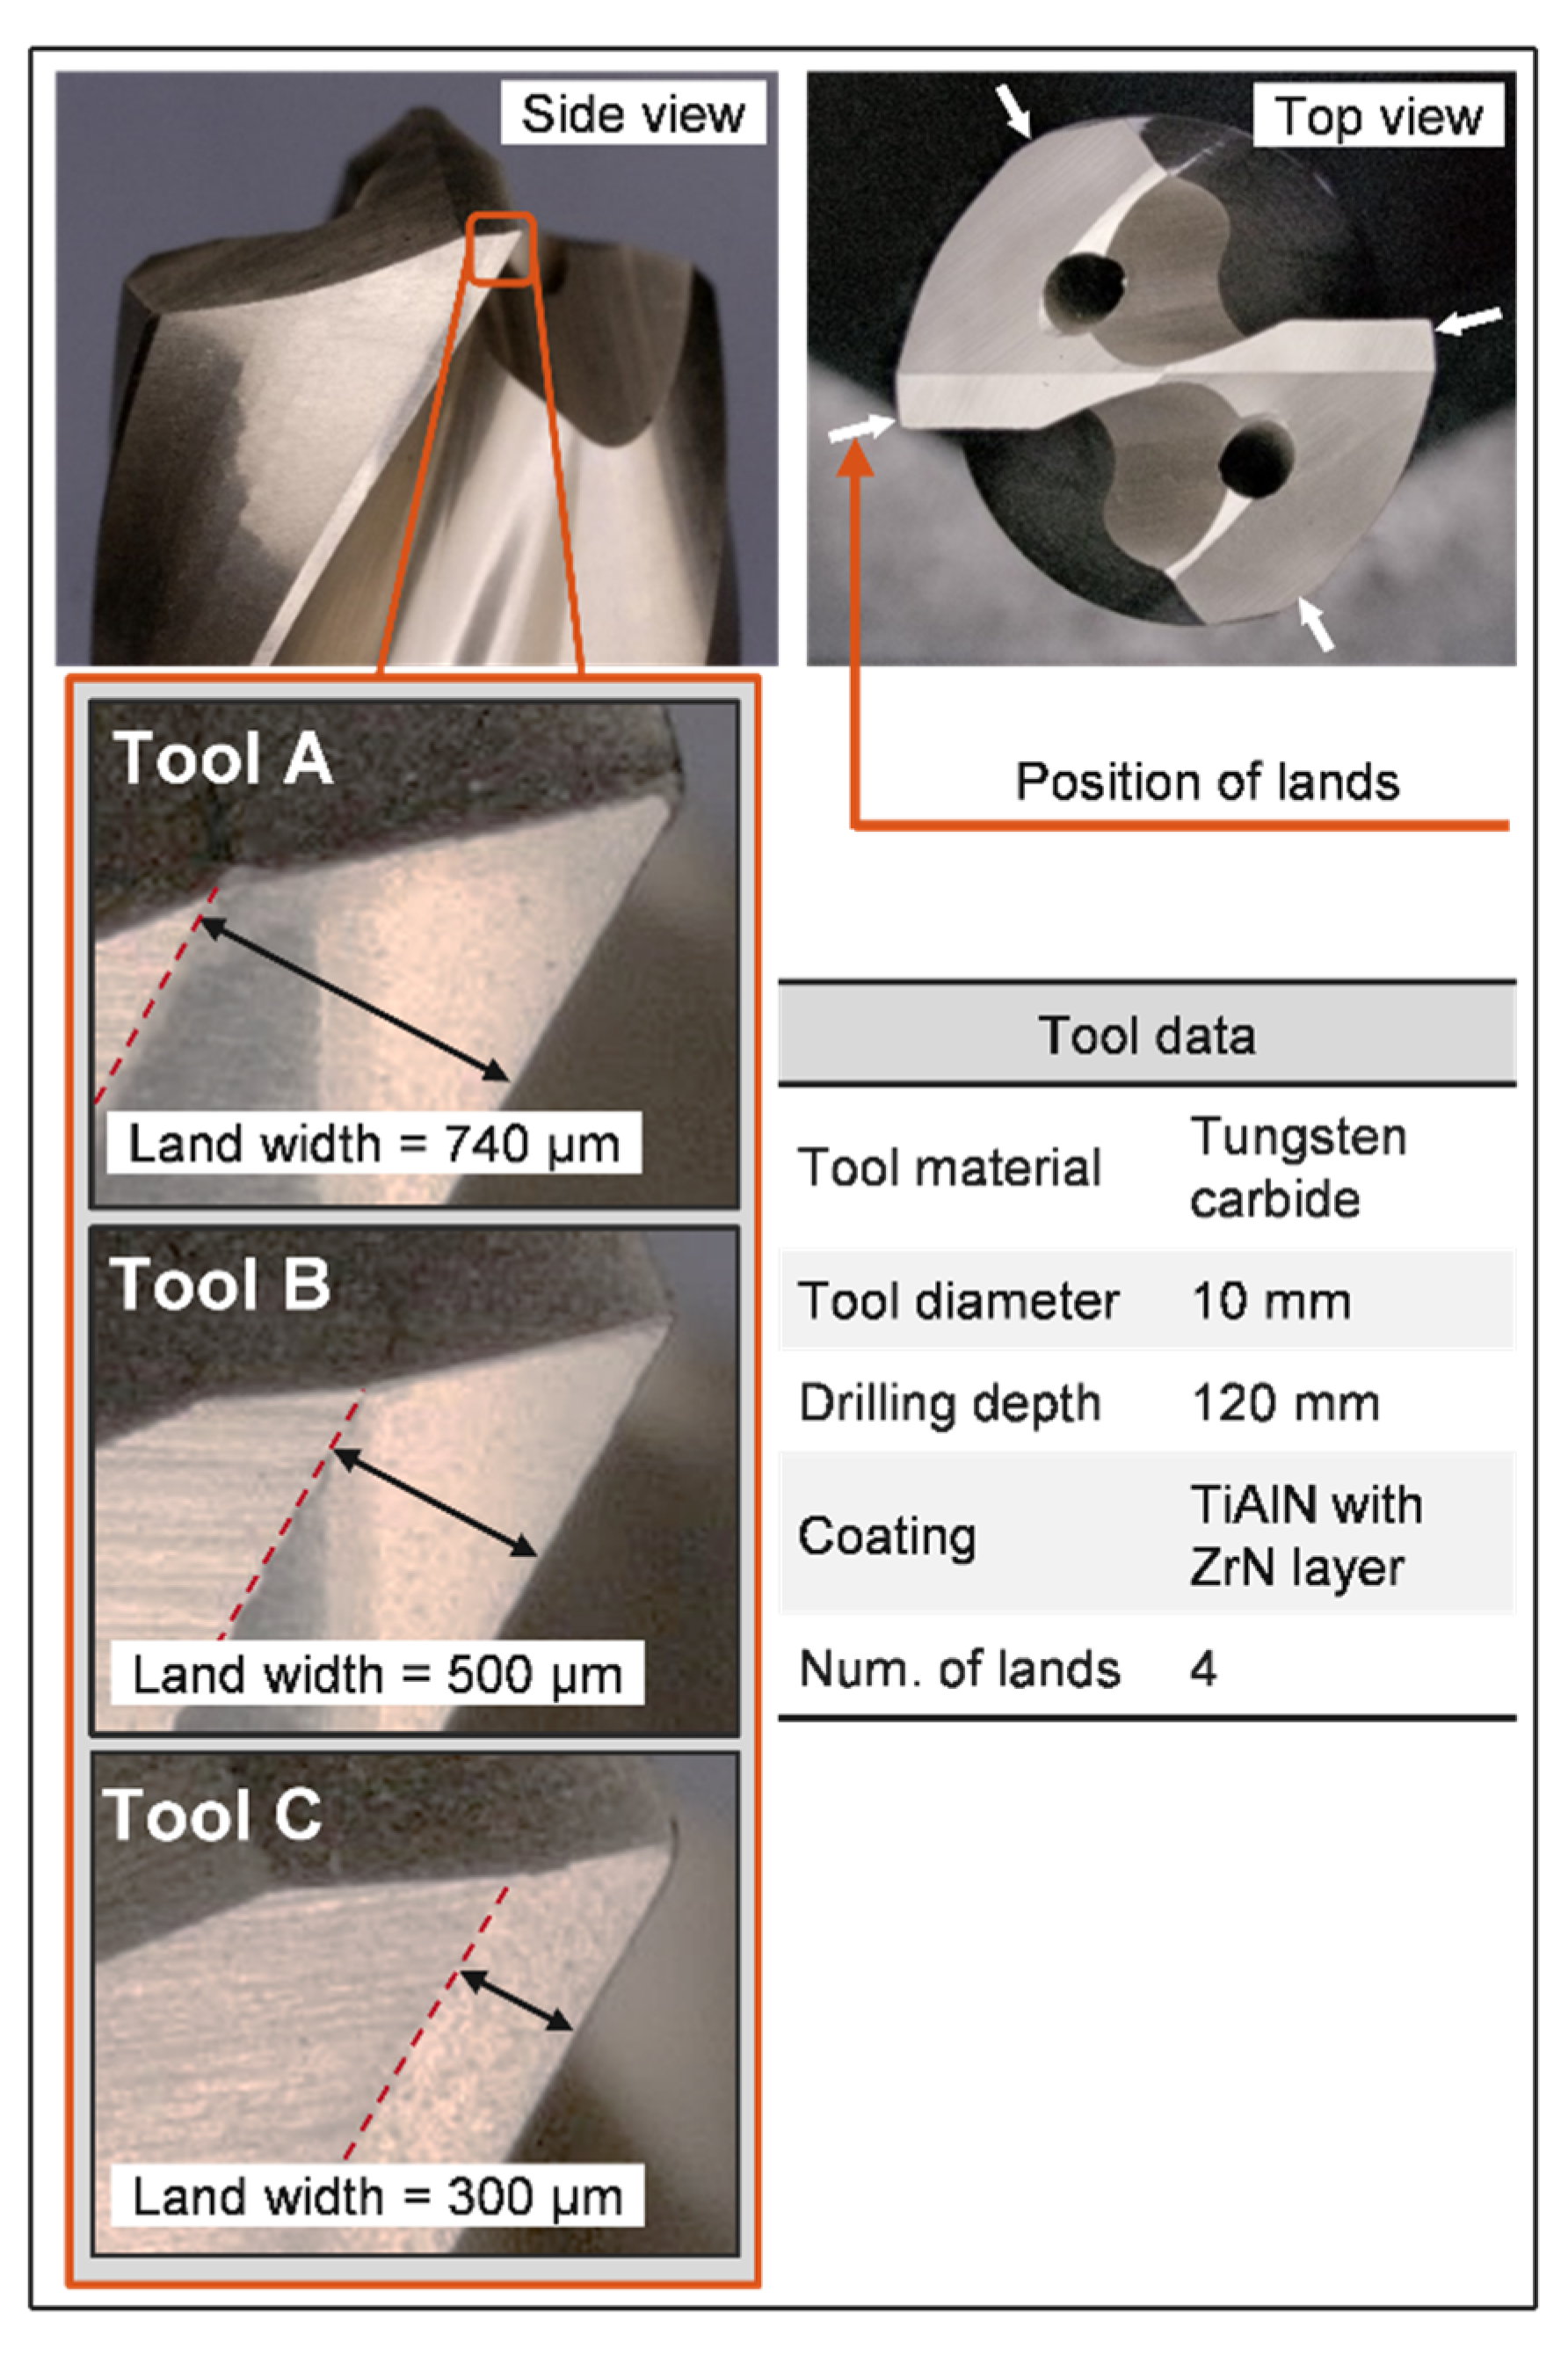
Different studies showed, that it is possible to adjust the damping of the drilling process by adjusting the land width [22,23,24]. Previous investigations have insufficiently dealt with the influence of the land width on the vibration of twist drills. The lands are arranged around the circumference of the drilling tool (ref. Figure 1) and are therefore in permanent contact with the bore wall during the drilling process. Depending on the size of this contact area, process damping and tool guidance can be adjusted by varying land width. For this reason, in this paper, an extensive experimental study is carried out to identify the influence of the land width of a twist drill on the generation of lateral vibrations. As the generation of such vibrations depends on numerous technology parameters, the feed rate, cutting speed, cooling lubricant pressure, pre-hole diameter, and three types of chucks are varied. The objectives of the measurements are the hole diameter, the circularity, and the roughness of the bores with respect to the lateral vibrations during the process. By means of the analysis of variance, the essential influencing factors for the generation of lobed holes will be identified using a full factorial experimental matrix.

3. Methodology

3.1. Experimental Setup and Process Chain

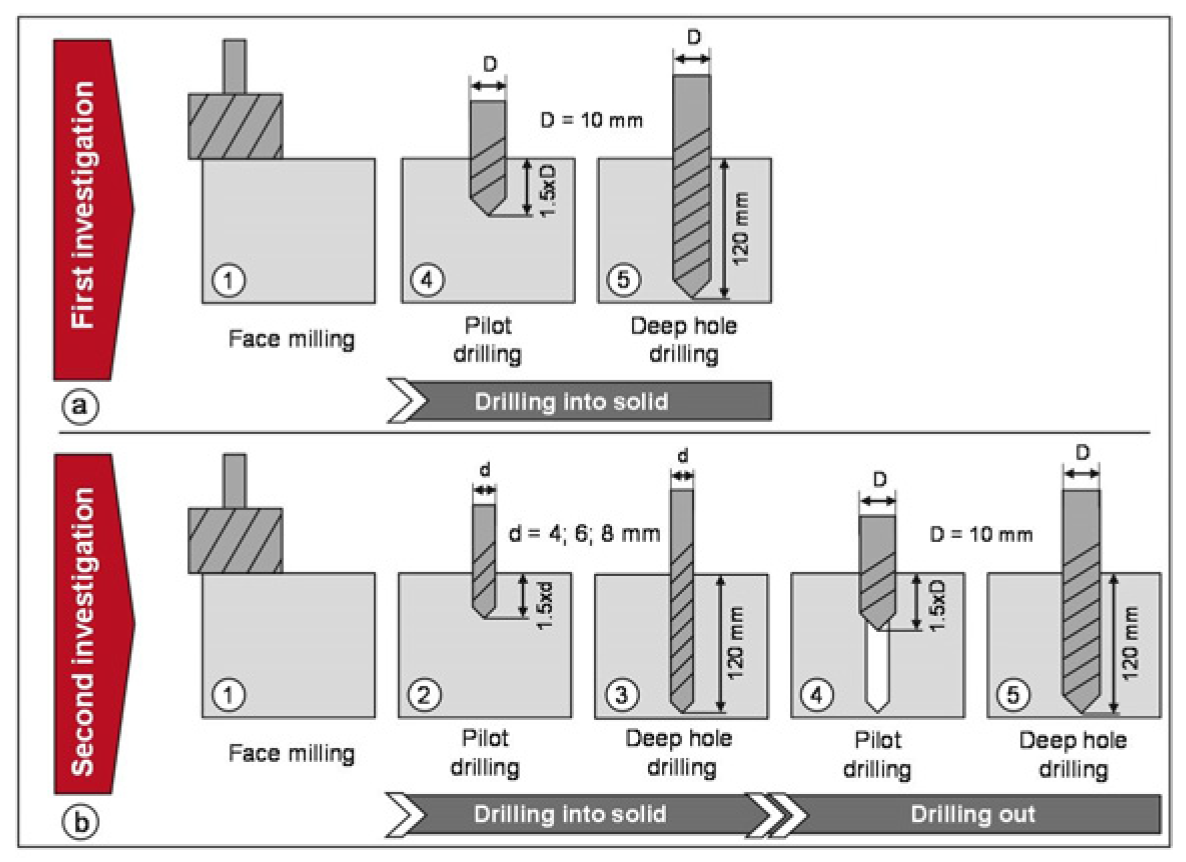
The experimental study was conducted using solid carbide drilling tools with a total drilling depth of 120 mm, a drill diameter of 10 mm and a TiAlN top coating with a ZrN deck layer. The tool geometry with the different land widths are shown in Figure 2. Tools with different land widths (300, 500, and 740 µm) are used, and other geometry parameters, such as the rake angle, relief angle, etc., are kept constant. The lands are designed in axial direction with a length of 70 mm. After the 70 mm, the lands merge into a cylindrical spiral body due to the back taper of the tool profile. The experimental investigations were carried out on a five-axis vertical machining centre of the manufacturer Maschinenfabrik Berthold Hermle AG (Gosheim, Germany, typ C32U) with a machine control system from Siemens Aktiengesellschaft (Berlin, Germany, typ Sinumerik 840d). The material used was blocks of cast aluminium alloy AlSi7Mg0.3, which is used, for example, in the automotive industry for the manufacture of cylinder heads and aluminium wheels [26]. In a first investigation, the influence of land width is determined in standard drilling process, and the process chain is illustrated in Figure 3a. Therefore, the drill-hole qualities of the different land widths are determined in a standard drilling process with only variation in chuck selection. The reference holes are made with the mean parameters of feed rate, cutting speed, and a high-pressure coolant condition (see Table 1). In a second investigation, lateral vibrations are specifically caused by a drilling-out process. Due to the lack of centring of the tool tip in drilling out, the vibrations that occur are mainly absorbed by the lands. This identifies the influence of the land on the vibration behaviour. The viability of this method to generate lateral vibrations has been established in previous work [21]. In addition to the land widths, there are further process parameters, which were also varied (see Table 1). The experiments have been performed full factorially in triplicate resulting in a total of 2187 drilled holes. In order to keep the influence of tool wear as low as possible, the drilling tool was replaced by a new one after 81 holes. This interval was chosen because, in previous investigations, no significant flank wear on the tool or an impairment of the hole roundness was detected for a number of 100 holes. Thus, experiments with variation in feed rate, cutting speed, and coolant pressure were performed with the same drilling tool. The entire process chain for the drill out investigation is subdivided into five sub steps and is illustrated in Figure 3b. At first, the workpiece is face milled (1), after that, pilot holes with a drilling depth of one and a half of the pilot tool diameter (d) were produced (2). In the third sub step, the pre-hole is produced by a deep-hole drilling process into solid (3). After that, a pilot hole for the final deep-hole drilling process is drilled by means of drilling out (4). The pilot tool diameter (D) is 10 mm and a drilling depth is one and a half times larger than the tool diameter. In the final deep-hole drilling process, the pre-holes with diameters of 4, 6, or 8 mm are drilled out to the final contour to a diameter of 10 mm (5).

3.2. Analysis of Variance (ANOVA)

To evaluate the large number of results from the 2187 drill holes at the second investigation, variance analysis is used to identify the parameters with significant influence, as shown in Table 1. In a further step, the quantitative influence of the variation of the respective parameter on the mean circularity is to be identified by using multivariat regression. The analysis models are implemented with the software MATLAB® (R2018b). The method is based on the decomposition of the sum of square ( S S ) between observed values and the total mean value. The advantage of this method is the use of nominal scaling for the independent variables, as shown in Table 1. This allows us to interpret the different chucks in the form of chucks A, B, and C as parameters. The dependent variable must be present as a metric scale level and is represented in the further course by the measured mean circularity of the holes. In order to identify the influence of the varied parameters on the measured circularity, the total scatter is separated. The total sum of squares S S t of the considered investigation can be divided into a declared sum of squares S S b and an unexplained sum of squares S S w (see Equation (1)). The declared sum of squares can also be subdivided into the sum of squares of the individual independent variables (see Equation (2)). [27,28]
S S t = S S b + S S w
S S b = S S f e e d   r a t e + S S c u t t i n g   s p e e d   + S S c o o l a n t   p r e s s u r e + S S p r e h o l e   d i a m e t e r + S S l a n d   w i d t h + S S c h u c k   s e l e c t i o n + S S i n t
S S i n t represents the sum of squares of all interaction effects between the independent variables. The S S t and S S w are calculated as follows (Equations (3) and (4)):
S S t = i = 1 R   ·   M N ( y i y ¯ ) 2
S S w = i = 1 R   ·   M N ( y i y ¯ P ) 2
The individual measured values of the circularity are described by y i , whereas, y ¯ represents the mean value of the circularities from all measurements. The index i is a continuous counter of the test series, whose maximum value of 2187 results from the permutation of the number of independent variables ( N = 6 ) and their varied levels ( M = 3 ) as well as the number of repetitions ( R = 3 ) . The value for y ¯ P describes the mean value of the circularities of the repetitions per permutation. The dispersion of the individual independent variables S S v a r is calculated according to Equation (5):
S S v a r = R · M ( N 1 ) m = 1 M ( y ¯ v a r ( m ) y ¯ ) 2
The values for y ¯ v a r ( m ) are the mean values of all measured circularities generated with the corresponding level ( m ) of the independent variable ( v a r ) . The S S i n t can finally be calculated according to Equation (6):
S S i n t = S S t S S w S S v a r
Finally, with the calculated sum of squares, empirical F-values can be calculated to test the null hypothesis. An empirical F-value ( F e m p ) is calculated and compared with a critical table value ( F t a b ). If the empirical F-value exceeds the critical F-value, the null hypothesis can be rejected and there is a statistical correlation between the examined parameters and the measurement results. The F-values are calculated with the degrees of freedom for the total scatter df = (M-1) according to Equation (7) as follows:
F e m p = M S v a r M S w = S S v a r / ( M 1 ) S S w / ( R · M N M N )

4. First Investigation: Drilling in Solid

In the first investigation, standard deep-drilling processes (face milling, piloting, deep drilling) were executed. Thus, the influence of different land widths in the standard drilling process can be shown. The produced samples were first subjected to a cleaning process in order to remove lubricant and chips from the holes, then measured on a coordinate measuring machine from Hexagon Metrology GmbH (Wetzlar, Germany, typ Leitz PMM 864). The contour of each hole was measured over ten measuring planes with a point density of 30 points/mm, distributed equidistantly between 10 and 110 mm along the drilling depth. The first measuring circuit is located within the pilot hole in order to consider its influence on the deep-drilling process. The target values of the measurement were the deviation of the hole diameter and the mean circularity of the hole. The results of the experimental investigation are presented below.

Results and Discussion

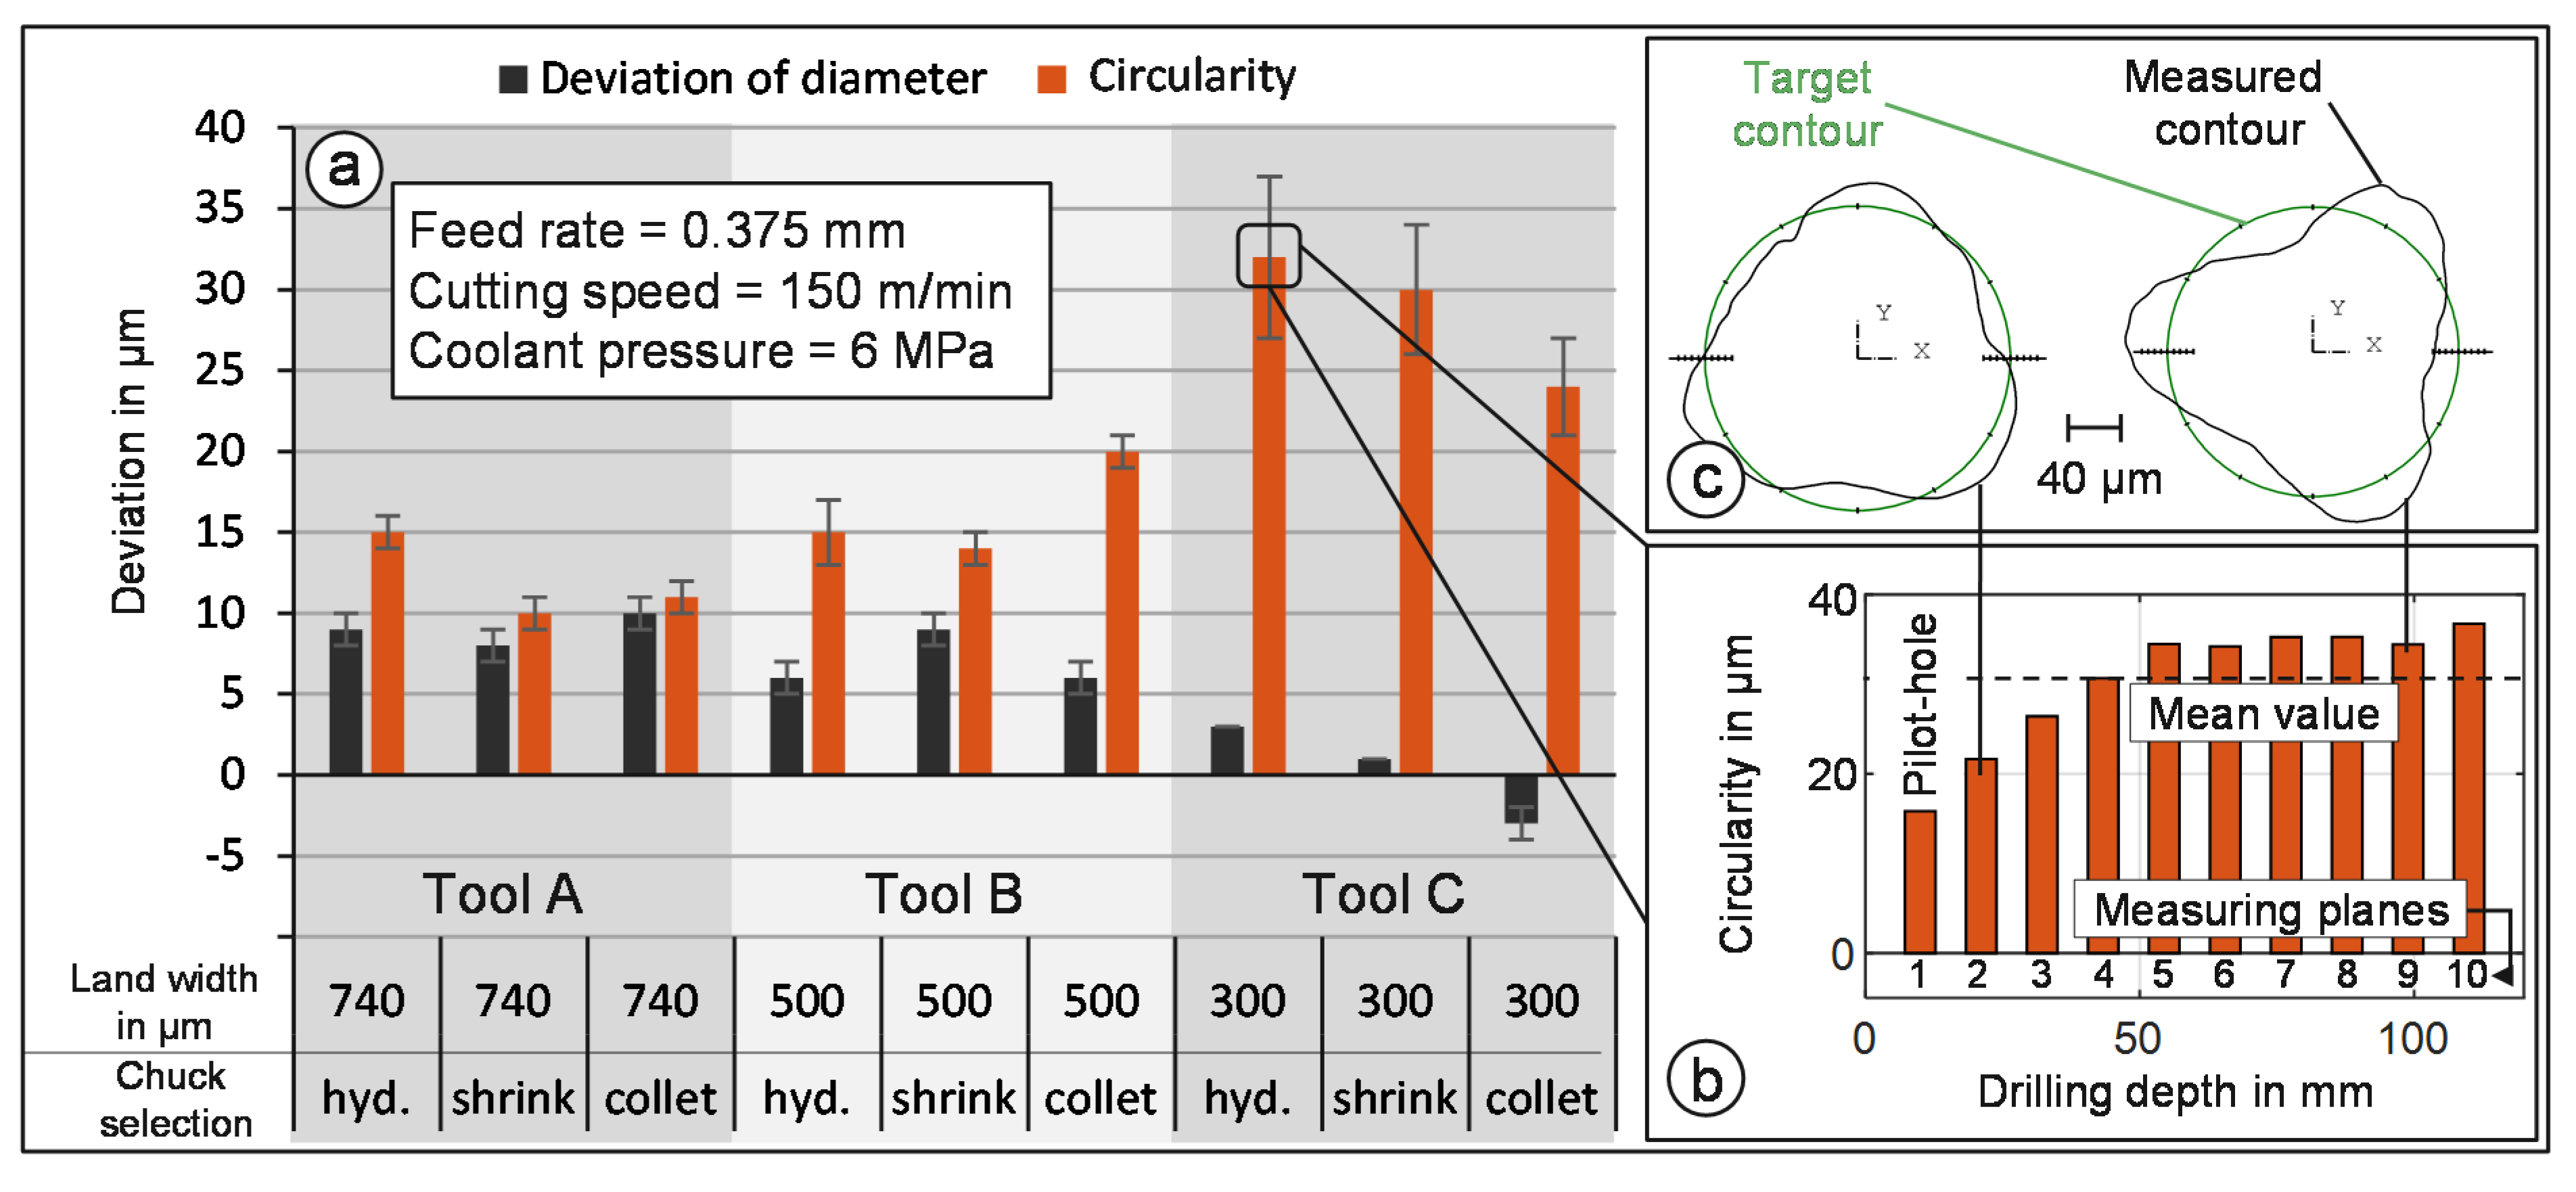
Figure 4a shows the mean diameter deviation (black) and circularity (orange) from 27 holes and 10 measuring planes of the reference holes. The diameter deviation is positive for values where the hole diameter produced is greater than the target diameter. As the land width decreases, the mean diameter deviations also decrease. While Tool A and B were still producing positive diameter deviations, these could be negative in the case of Tool C. There is no statistically significant influence of the chuck selection on the diameter deviation. In principle, the reduced land width reduces the contact area between the drilling tool and the bore wall, which also reduces the resulting friction. Due to the higher friction, the lands lead to material abrasion, which increases the diameter of the hole. This is the reason for the decreasing diameter in connection with the decreasing land width. However, this also leads to a reduction in the supporting effect of the drilling tool in the hole and thus to a reduction in the ability to withstand lateral vibrations. By comparing the circularity values, it can be seen that the land width has a statistically significant influence on it. While the holes produced with Tool A have a circularity tolerance of approx. 12 µm, those with Tool B increase slightly. Tool C, with the lowest land width, produces higher circularity tolerance with an average maximum value of 32 µm when drilling into the solid. The influence of the chuck selection on the circularity is greatest with Tool C, with the addition that the dispersion of the results is also greater. If the mean values of the circularities are considered along the drilling depth (Figure 4b), it can be seen that the circularity in the first measuring planes, that of the pilot hole, has the smallest circularity. Already in this measuring plane are to be the recognized first signs of lateral oscillations. As the drilling depth increases, the circularity tolerance becomes larger until, from a drilling depth of approx. 50 mm, an equilibrium is achieved between the deflection of the tool tip and the restoring force by the land and the circularity stagnate. A closer look at individual circularities (Figure 4c) shows that, even at low drilling depths, non-circular holes occur and continue to increase and a convergence in the circularity is observed after about 50 mm of bore depth. Such lobed hole contours occur during oscillating movements of the tool tip with an oscillating frequency of twice the tool rotation frequency [9].
From the reference results, it can be concluded that the land width has a statistically significant influence on the development of lateral vibrations. If the land width is reduced and thus the guidance of the tool in the hole, the effects of different chucks have a greater effect on lateral vibrations than with sufficient guidance.

5. Second Investigation: Drilling Out

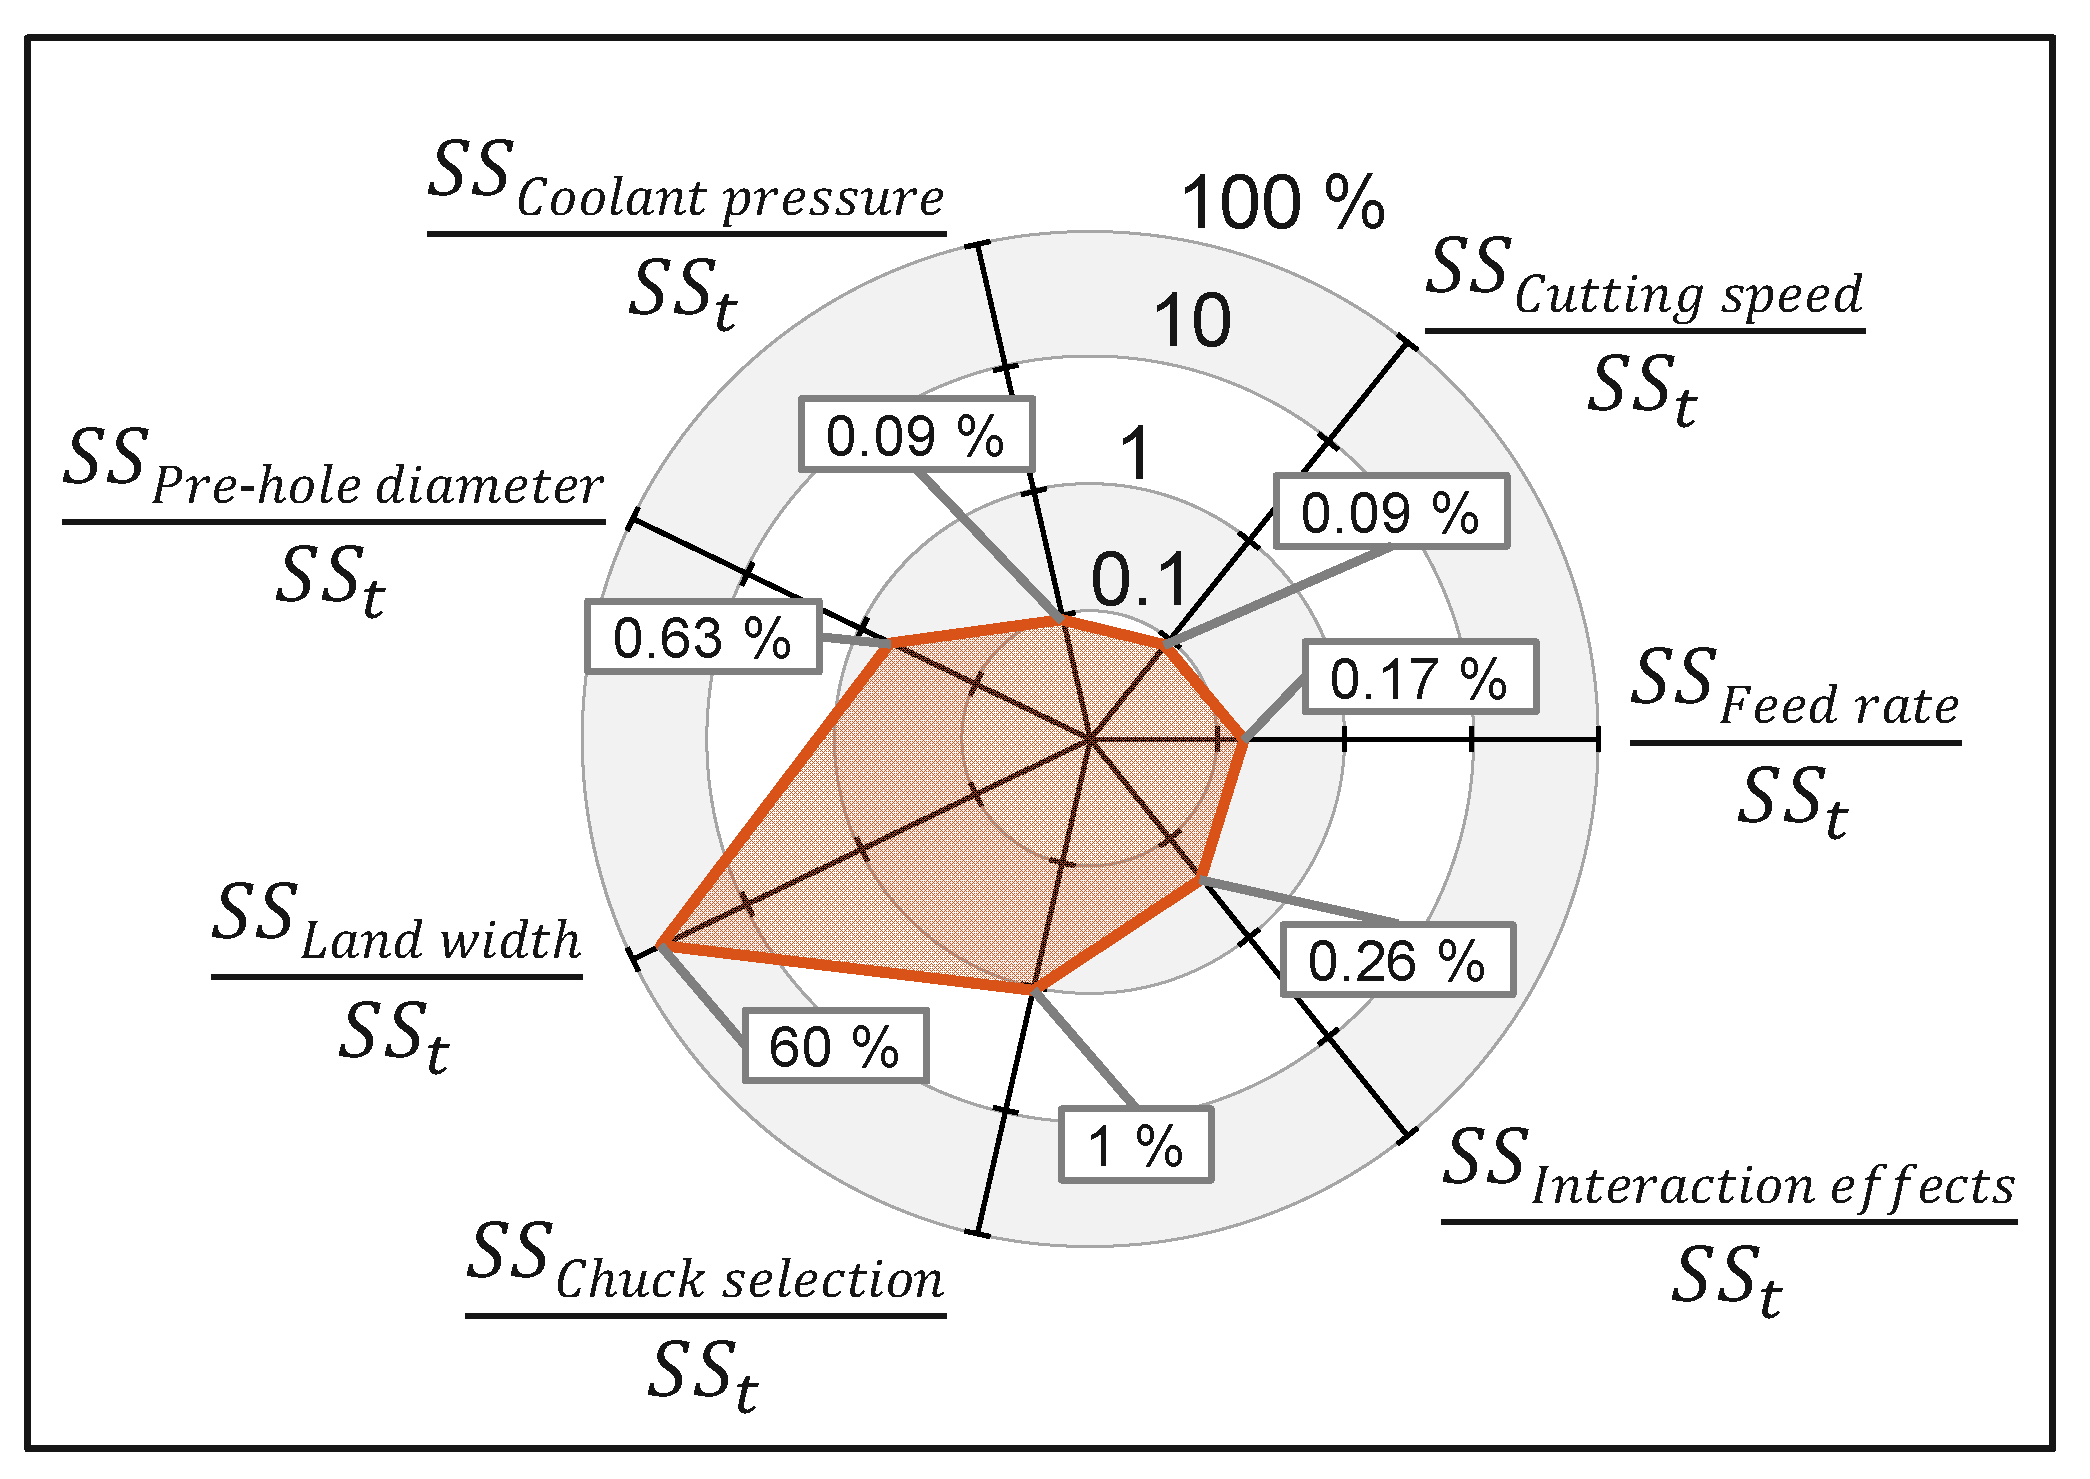
The aim of the second investigation was to identify the significant parameters on the generation of lateral vibrations. The sum of the square ( S S ) values of the individual parameters indicates its influence on the measured circularity. In Table 2, the results of the ANOVA evaluation are shown. The ratio of the sum of squares of each parameter ( S S v a r i a b l e ) to the total sum of squares ( S S t ) identifies how much the total scatter can be explained by the variation in the individual parameter. Figure 5 shows the corresponding ratios in a radar chart with logarithmic axis scaling. It shows that the variation of the land width is responsible for 60% of the total scatter. The selection of chuck can be identified as the second largest influencing factor with an influence of only 1%, whereas only 0.6% of the scatter can be attributed to the pre-drilling diameter. The feed rate and the sum of all interactions between the parameters can be classified as a mean influence. Due to the variation in the coolant pressure and the cutting speed, only a very small dependency can be detected, which is why their influences can be classified as small. Table 2 compares the empirical F-values ( F e m p ) calculated according to Equation (7) and the table values for the critical F-value ( F t a b ) with a 95% probability. It can be seen that the critical F-values are lower than the table values only for the parameters cutting speed and coolant lubricant pressure. This means that the null hypothesis cannot be rejected for the two parameters and that there is no statistical correlation between these and the circularity. All other parameters are statistically significant, so that the null hypothesis is rejected and its dependence is confirmed, as shown in Figure 5. The p-value is another statistical key figure and indicates the probability or significance of a parameter. In Table 2, all parameters have a p-value of less than 1%, so it can be assumed that the results are not random. The key figure eta-square ( E t a 2) is the quotient of the declared sum of squares ( S S b ) and the total sum of squares ( S S t ). The ratio thus indicates how the total variance is explained by the variation of the parameters. With a value of Eta2 = 0.62, 38% of the variance can be attributed to further disturbances or anomalies in the process.

5.1. Discussion of the Influence of Parameter Variation on the Generation of Lateral Vibrations

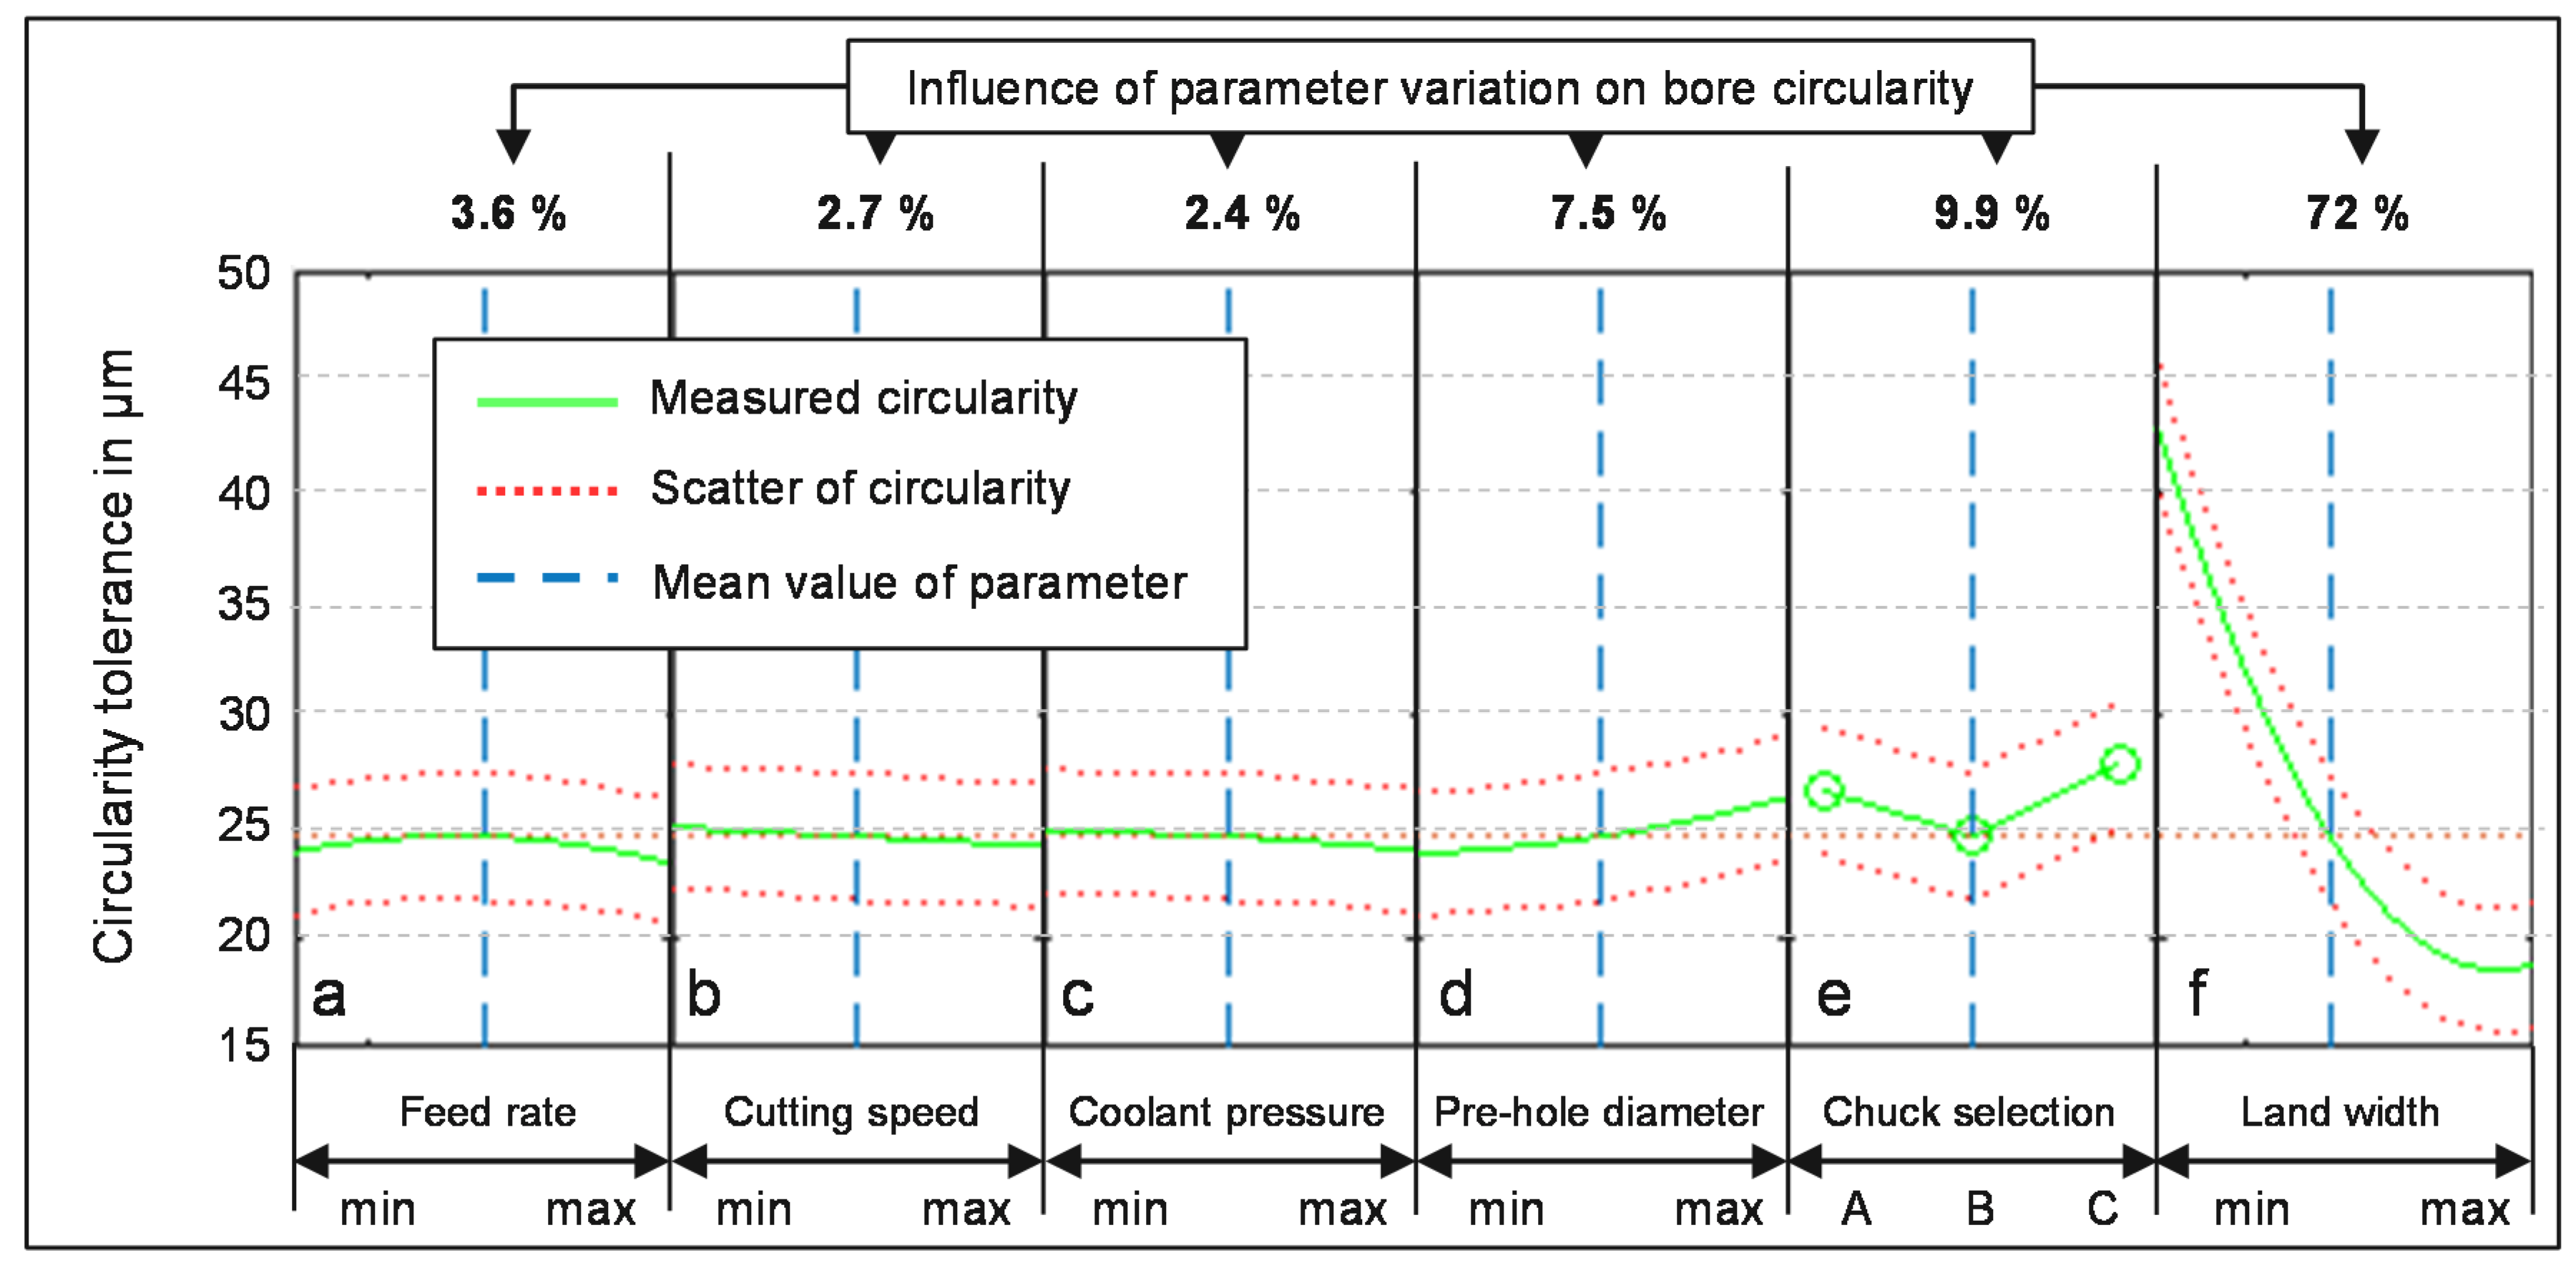
In the following, the relationship between the variation of the individual parameters and the generated mean circularity is addressed. The trend dependencies are illustrated in an effect diagram in Figure 6. Their influence on the circularity is indicated in percent, whereby these values are dependent on the state of the other parameters due to the interactions. The specifications and subsequent discussion of each parameter always refers to the mean values of all other parameters (blue dashed line). The green line describes the trend of how much the circularity can be influenced by variation in the respective parameter. The red dotted line indicates the scatter within the repeat tests, which has a value of approximately ±2.5 µm. In the course of the investigations, a mean roundness in the total range of 15.7 to 48.9 µm was identified, which is considered to be 100% of the total influence. The percentage influence of the individual parameters is shown in Figure 6 above the effect diagrams. The difference between the sum of the percentage influences of the parameters and the 100% is due to the interactions of the examined parameters. These have a share of 1.5% on the mean value of the measured circularity and were determined between the parameters pre-bore diameter, chuck selection, and land width.

5.1.1. Influence of Feed Rate on Circularity

The feed rate was varied in the investigations between 0.25 and 0.5 mm/rev. In Figure 5, the analysis of variance only showed, if at all, a small influence on circularity. Even taking into account the mean values of the circularities, only an influence of 3.6% can be determined. During drilling, the axial forces predominantly occur in the centre of the drilling tool and are largely determined by the feed rate. As the centre of the cutting edge does not engage during drilling out, only small axial forces are generated, which explains the small influence of the feed rate. The measured roundness fluctuates between 23.3 and 24.5 µm, whereby the change is within the scatter and thus does not allow a statement of a significant influence of the parameter.

5.1.2. Influence of Cutting Speed on Circularity

The cutting speed was examined in the range from 120 to 180 m/min. The variation of this parameter has no influence on the variance or on the mean value of the measured circularity. Hence, the influence of the cutting speed can be neglected. Although the cutting speed has a decisive influence on the development of lateral vibrations, this could not be shown in the investigations. One reason for this can be the combination of the selected cutting speed, L/D ratio and work piece material selection, which do not sufficiently provoke the vibration mode. The choice of parameters was made according to the tool manufacturer’s specifications. The variation of the cutting speed could vary the circularity tolerance in the range of 24.0 to 24.9 µm, which amounts to an influence of 2.7%.

5.1.3. Influence of Coolant Pressure on Circularity

The coolant pressure was varied in the range of 4 to 8 MPa. With an influence of 2.4% on the mean value of the circularity, this influence can be classified as low. The aim of the variation of the cooling lubricant pressure is to determine its influence on the vibration behaviour. The coolant exiting at the drill tip flows around the circumference of the tool and thus reduces the friction between the lands and the bore wall. However, most of the volume flow is dissipated together with the chips via the flutes of the tool. Therefore, the variation in the coolant pressure did not have a significant effect on the friction and thus on the vibration behaviour of the tool. Due to the small influence of this parameter on the circularity that can be generated, this effect, if it exists, can only be classified as negligible. With this parameter, circularities were produced in a range from 23.9 to 24.7 µm.

5.1.4. Influence of Pre-Hole Diameter on Circularity

The pre-drilled diameter was changed in the following three stages: 4, 6, and 8 mm. The pilot hole is drilled out with a 10-mm diameter drilling tool, whereby the guiding and centring by the tip angle of the cutting edge is reduced with an increasing pre-hole diameter. With the reduced guidance and centring, vibration-indicating disturbance variables have a faster effect on the drilling process. The evaluation shows that this effect has an influence of only 7.5% on the circularity and deteriorates it with increasing pre-hole diameters. It seems that an existing pre-hole has a greater influence on the tool guidance than the pre-hole diameter. This becomes clear when comparing the two circularities produced in the first (drilling into the solid) and second (drilling out) investigations. The pre-hole leads to a deterioration of the circularity tolerance by approx. 10 µm, and the variation in the pre-drilling diameter only leads to a deterioration by approx. 4 µm. The measured circularity tolerance by different pre-hole diameters varies between the values of 23.8 and 26.3 µm.

5.1.5. Influence of Chuck Selection on Circularity

The variation in the chuck selection does not permit a continuous course in the effect diagram, since the chucks make their own contribution with their properties of stiffness and damping. Therefore, the differences can only be considered individually. By varying the chucks, a total influence of 9.9% on the measured circularity can be explained. The best results could be achieved with the shrink chuck in direct comparison to the hydraulic chuck with the same cantilever length. Although a hydraulic chuck has a lower dynamic compliance [29], it does not seem to have a positive influence on the absorption of lateral vibrations in the drilling process. The collet chuck produced the worst results, probably due to the concentricity error of the non-monolithic chuck. The measured circularities varied the chucks between 24.5 and 27.8 µm.

5.1.6. Influence of Land Width on Circularity

In the investigations, the variation in the land width had the greatest influence on the target size of the circularity. The land widths were examined in the three dimensions 0.74, 0.5, and 0.3 mm. Thus, an influence of 72% on the circularity could be identified. It can be seen from the effect diagram that a reduction in the land width leads to a significant deterioration of the circularity. The narrow land width and the associated reduced friction between them and the bore wall reduce the damping of lateral vibrations. In addition, there is a reduction in the guidance of the drilling tool in the hole, which increases the degrees of freedom for the oscillating movement. Increasing the land width from 0.3 to 0.5 µm improves the circularity by 76.3% based on the total range of influence of the parameter on the circularity tolerance of 24 µm. Increasing the land width to 0.7 mm only improves the circularity by 23.7%. There appears to be a divergent dependence between land width and roundness. There seems to exist a land width, which maximizes the guidance of the tool in the bore, thereby reducing lateral vibrations. A further enlargement of the land width will lead to increased friction, which will have a negative effect on the tool life or bore quality characteristics. With this parameter, the circularity could be varied in the range from 18.8 to 24.8 µm.

5.2. Summary of the Investigation

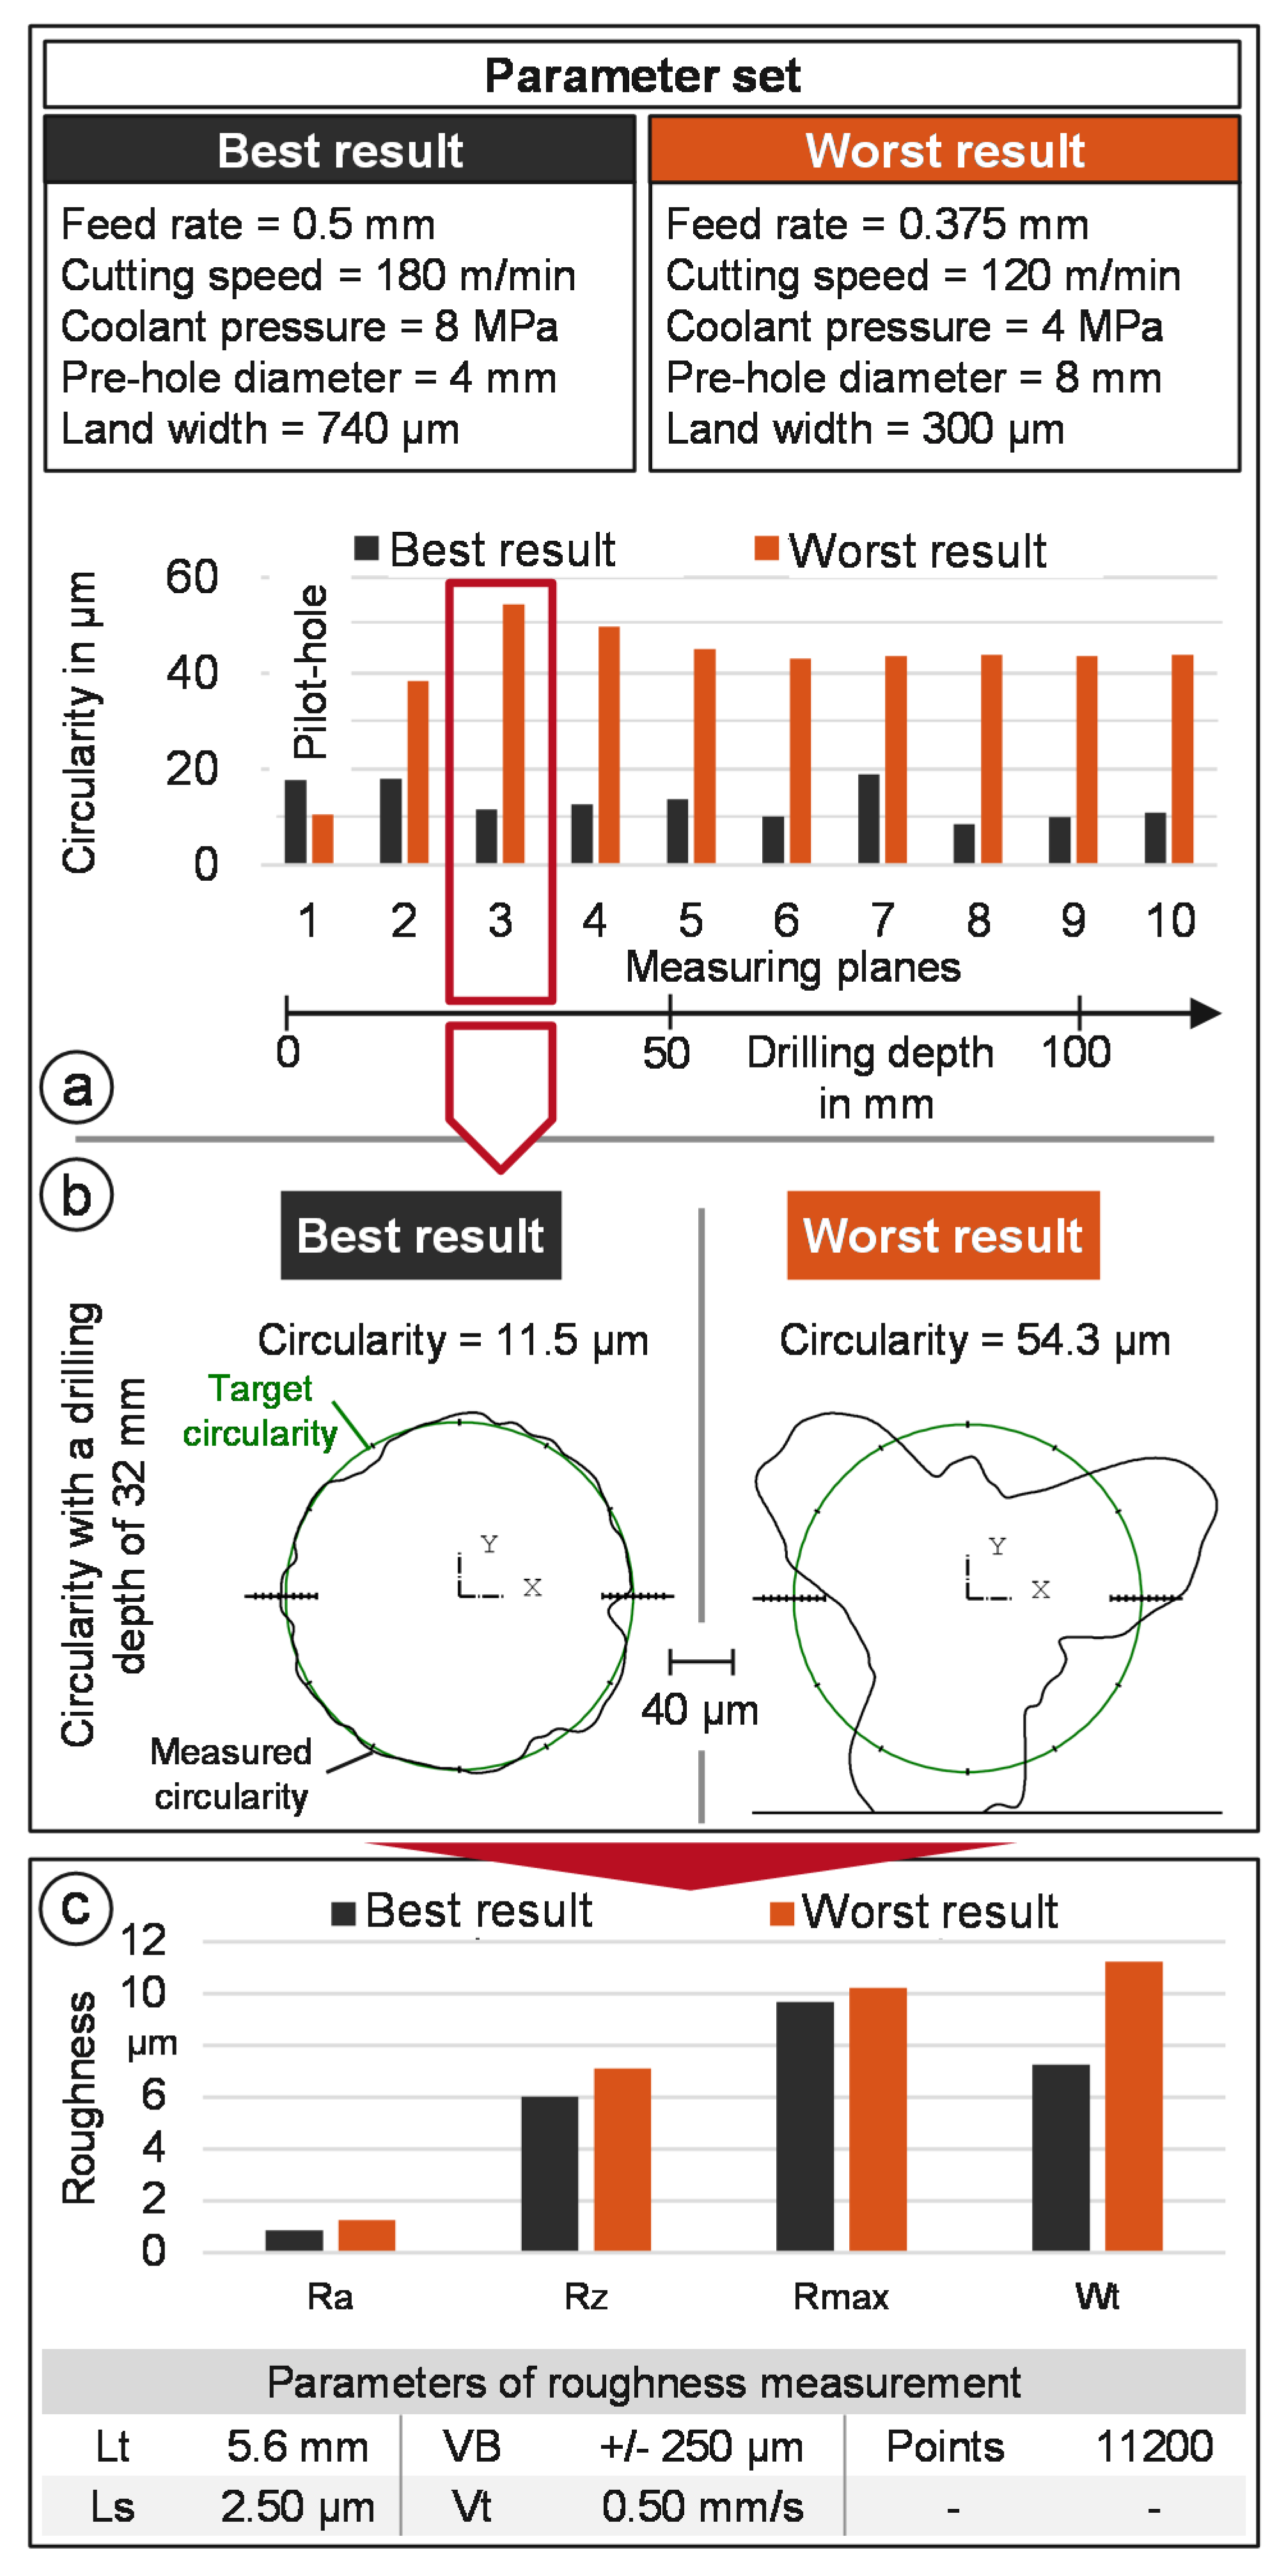
In order to summarize the entire experimental investigation, the choice of parameters for the worst and best practice are compared. Figure 7a shows the circularities along the drilling depth. In the case of the best result, the circularity remains almost constant with the initial increased value, whereas, in the case of worst result, the circularity becomes significantly worse after the pilot hole. At first, the circularity tolerance increases until a maximum value of 54.3 µm is reached with a drilling depth of 32 mm. As the drilling depth continues to increase, the circularity improves, which is due to the increase in process damping due to the friction of the land with the bore wall. If both circularities of the measuring circuits are compared (see Figure 7b), it can be seen that, in the case of the best practice with a circularity tolerance of 11.5 µm, no lateral vibrations can be detected. In a direct comparison of the drilling into solid and drilling-out processes, a bore without signs of lateral vibrations can be produced in both cases with suitable parameter selection. For example, circularity tolerance of approx. 10 µm could be produced when drilling into the solid and 11.5 µm when drilling out. In the case of the worst result, a polygon-shaped bore contour can be clearly recognized, where the number of lobes point to an oscillation frequency of twice the spindle rotation frequency. The circularity tolerance in this case is 54.3 µm.
In a final step, the effects of the lateral vibrations on the surface roughness of the generated hole wall are considered in order to identify their interaction. This was measured 30 mm after the drilling surface (at the depth of the 3rd measuring planes) with a roughness measuring device MarSurf GD 25 from Mahr GmbH (Göttingen, Germany). Figure 7c shows the results of the different characteristics in a bar chart. In best result the roughness of R a , R z , and R m a x are lower than in the worst result. Ultimately, the differences between the two series of measurements are too small, compared with the differences between the circularities. Therefore, the influence of the lateral vibrations on the roughness is classified as low. There is a correlation between waviness ( W t ) and circularity if the oscillation frequency is not exactly twice the spindle rotation frequency. Anomalies in the drilling process can cause a slight deviation of the pendulum frequency. This causes the polygon-shaped bore contour to rotate along the drilling depth with or against the direction of spindle rotation. [30] Correspondingly, the waviness also increases with increasing circularity. This explains the increased value of the waviness of the worst result compared to the best result.

6. Conclusions

In this paper, an experimental investigation was carried out to primarily identify the influence of the land widths on the vibration behaviour of drilling processes. The results of the first investigation clearly showed their influence. In these, the choice of chuck was varied in addition to the land widths. The smallest land widths of 300 µm led, in the investigations, to a clear out-of-round drilling due to lateral vibrations due to the missing supporting effect at the hole wall.
In the second investigations, pilot holes with different diameters were drilled out. In this investigation, the parameters feed rate, cutting speed, cooling lubricant pressure, pre-hole diameter, and chuck selection were varied in addition to the land width. The variance analysis was used to evaluate the 2187 drilling holes in order to identify stochastically significant influences of the varied parameters on the measurement result of circularity. The evaluation shows that the land width has the greatest influence with 60% on the measured scatter. The second largest influence was identified as the selection of chuck and pre-hole diameter. By varying the other parameters, no significant influence on roundness could be determined, because their influence is within the scatter of the repeat test. In a further evaluation, the tendency of the values of the respective parameters to the measured mean value of the circularity was discussed. From this, a comparison of the worst and best practice could be carried out. Under the best conditions of the parameters, holes could be drilled without the sign of lateral vibrations with a mean circularity tolerance of 15.7 µm. In the worst constellation of parameters, the circularity tolerance deteriorated to a mean maximum of 48.9 µm. A statistically significant correlation of a bad circularity to the roughness could not be observed except in the case of waviness, in which it became worse with increasing circularity.
If the standard drilling process is compared with the drill-out process, it can be stated that, with a wide land width of 740 µm, there is sufficient support effect of the drilling tool at the hole wall. Thus, with this and suitable parameter selection, the results when drilling out are equivalent to those obtained when drilling into the solid could be achieved. The tools with the narrow land widths of 300 µm produced significantly less round holes when drilling out than when drilling into solid material due to a deteriorated supporting effect. However, it should be noted that a wide land width improves the roundness of the bore, but they also have negative effects. The wider they are chosen, the higher the contact between the tool and the bore wall. This results in a larger bore diameter due to abrasive abrasion, see Figure 4a. On the other hand, the higher contact can lead to faster wear on the lands. Due to the early tool change after 81 bores, this effect could not be determined, which was also the purpose of this investigation. The collected results form a basis to understand the interaction between the drilling tool with its lands and the bore wall. In a further step, the knowledge is transferred to a dynamic tool and workpiece model in order to carry out further investigations. The aim is to identify process-supporting geometries for lands in order to improve the performance of the tools.

Author Contributions

Funding acquisition, E.A. and M.W.; Investigation, M.V.; Resources, E.A. and M.W.; Writing–original draft, M.V., E.A. and M.W. All authors have read and agreed to the published version of the manuscript.

Funding

This research (“Experimentelle und numerische Untersuchung niederfrequenter Lateralschwingungen beim Bohren unter Berücksichtigung des Führungsfasenkontakts“.) was funded by German Research Foundation (DFG). Grant number: (AB 133/105-1).

Acknowledgments

The authors extend their sincerest gratitude to the German Research Foundation (DFG) for the generous support of the work described in this paper.

Conflicts of Interest

The authors declare no conflict of interest.

References

  1. Astakhov, V.P. Drills: Science and Technology of Advanced Operations. Manufacturing Design and Technology; Taylor and Francis: Hoboken, NJ, USA, 2014. [Google Scholar]
  2. Brehl, D.E.; Dow, T.A. Review of vibration-assisted machining. Precis. Eng. 2008, 32, 153–172. [Google Scholar] [CrossRef]
  3. Tobias, S.A.; Fishwick, W. The Vibrations of Radial-Drilling Machines under Test and Working Conditions. Proc. Inst. Mech. Eng. 1956, 170, 232–264. [Google Scholar] [CrossRef]
  4. Galloway, D.F. Some Experiments on the Infuence of Various Factors on Drill Performance. Trans. ASME 1957, 79, 191–231. [Google Scholar]
  5. Katz, Z.; Poustie, A. On the Hole Quality and Drill Wandering Relationship. AMT 2001, 17, 233–237. [Google Scholar] [CrossRef]
  6. Aized, T.; Amjad, M. Quality improvement of deep-hole drilling process of AISI D2. AMT 2013, 69, 2493–2503. [Google Scholar] [CrossRef]
  7. Pirtini, M.; Lazoglu, I. Forces and hole quality in drilling. Int. J. Mach. Tools Manuf. 2005, 45, 1271–1281. [Google Scholar] [CrossRef]
  8. Bayly, P.V.; Lamar, M.T.; Calvert, S.G. Low-Frequency Regenerative Vibration and the Formation of Lobed Holes in Drilling. J. Manuf. Sci. Eng. 2002, 124, 275. [Google Scholar] [CrossRef]
  9. Roukema, J.C.; Altintas, Y. Generalized modeling of drilling vibrations. Part I: Time domain model of drilling kinematics, dynamics and hole formation. Int. J. Mach. Tools Manuf. 2007, 47, 1455–1473. [Google Scholar] [CrossRef]
  10. Roukema, J.C.; Altintas, Y. Generalized modeling of drilling vibrations. Part II: Chatter stability in frequency domain. Int. J. Mach. Tools Manuf. 2007, 47, 1474–1485. [Google Scholar] [CrossRef]
  11. Gupta, K.; Ozdoganlar, O.B.; Kapoor, S.G.; DeVor, R.E. Modeling and Prediction of Hole Profile in Drilling, Part 2: Modeling Hole Profile. J. Eng. Ind. 2003, 125, 14. [Google Scholar] [CrossRef]
  12. Ahmadi, K.; Savilov, A. Modeling the mechanics and dynamics of arbitrary edge drills. International Int. J. Mach. Tools Manuf. 2015, 89, 208–220. [Google Scholar] [CrossRef]
  13. Parsian, A.; Magnevall, M.; Beno, T.; Eynian, M. A Mechanistic Approach to Model Cutting Forces in Drilling with Indexable Inserts. In Proceedings of the 6th CIRP International Conference on High Performance Cutting, HPC2014, Berkeley, CA, USA, 23–25 June 2014; Volume 24, pp. 74–79. [Google Scholar]
  14. Parsian, A.; Magnevall, M.; Eynian, M.; Beno, T. Time domain simulation of chatter vibrations in indexable drills. Int. J. Adv. Manuf. Technol. 2017, 89, 1209–1221. [Google Scholar] [CrossRef] [Green Version]
  15. Parsian, A. Dynamics of Torsional and Axial Vibrations in Indexable Drills. Ph.D. Thesis, University West, Trollhättan, Sweden, 2015. [Google Scholar]
  16. Parsian, A.; Magnevall, M.; Beno, T.; Eynian, M. Sound Analysis in Drilling, Frequency and Time Domains. Procedia CIRP 2017, 58, 411–415. [Google Scholar] [CrossRef]
  17. Ema, S.; Fujii, H.; Marui, E. Chatter Vibration in Drilling. J. Eng. Industry 1988, 110, 309. [Google Scholar] [CrossRef]
  18. Ema, S.; Fujii, H.; Marui, E. Whirling Vibration in Drilling. Part 3: Vibration Analysis in Drilling Workpiece with a Pilot Hole. J. Eng. Industry 1988, 110, 315. [Google Scholar]
  19. Ema, S.; Marui, E. Theoretical analysis on chatter vibration in drilling and its suppression. J. Mater. Process. Technol. 2003, 138, 572–578. [Google Scholar] [CrossRef]
  20. Mehrabadi, I.M.; Nouri, M.; Madoliat, R. Investigating chatter vibration in deep drilling, including process damping and the gyroscopic effect. Int. J. Mach. Tools Manuf. 2009, 49, 939–946. [Google Scholar] [CrossRef]
  21. Tschannerl, M. Beitrag zur Qualitätssteigerung beim Bohren mit VHM-Spiralbohrern unter Berücksichtigung radialer Schwingungen und Kräfte. In Schriftenreihe des PTW: “Innovation Fertigungstechnik”; Shaker Verlag: Aachen, Germany, 2007. [Google Scholar]
  22. Ahmadi, K.; Altintas, Y. Stability of lateral, torsional and axial vibrations in drilling. Int. J. Mach. Tools Manuf. 2013, 68, 63–74. [Google Scholar] [CrossRef]
  23. Biermann, D.; Abrahams, H.; Goeke, S. Optimization of guide pads for the BTA deep hole drilling of high alloyed steels by microfinishing. Prod. Eng. Res. Devel. 2014, 8, 33–40. [Google Scholar] [CrossRef]
  24. Biermann, D.; Kessler, N.; Upmeier, T.; Stucky, T. Modified DLC-Coated Guide Pads for BTA Deep Hole Drilling Tools. KEM 2010, 438, 195–202. [Google Scholar] [CrossRef]
  25. Dilley, D.N.; Stephenson, D.A.; Bayly, P.V.; Schaut, A.J. Frequency Shift in Drilling due to Margin Engagement. J. Manuf. Sci. Eng. 2005, 127, 271. [Google Scholar] [CrossRef]
  26. Ostermann, F. Anwendungstechnologie Aluminium; Springer: Berlin/Heidelberg, Germany, 2014. [Google Scholar]
  27. Backhaus, K.; Erichson, B.; Plinke, W.; Weiber, R. Multivariate Analysemethoden: Eine Anwendungsorientierte Einführung, 14., Überarbeitete und Aktualisierte Auflage; Springer Gabler: Berlin/Heidelberg, Germany, 2016. [Google Scholar]
  28. Riedwyl, H.; Ambühl, M. Statistische Auswertungen mit Regressionsprogrammen: Lineare Regression und Verwandtes—Multivariate Statistik—Planung und Auswertung von Versuchen. In Lehr—und Handbücher der Statistik; Reprint 2018; Oldenbourg Wissenschaftsverlag: Berlin, Gemany, 2018. [Google Scholar]
  29. Nebeling, P.H. Dynamisches Verhalten von Werkzeugaufnahmen: Vergleich gängiger Werkzeugaufnahmen für Schaftwerkzeuge. Werkstatt Betr. 2014, 9, 90–94. [Google Scholar]
  30. Volz, M.; Abele, E. Spanungsquerschnittsmodell für Bohrprozesse: Auswirkungen von Lateral—Und Torsionsschwingung auf den Spanungsquerschnitt beim Bohren. wt Werkstattstech. 2018, 108, 45–50. [Google Scholar]
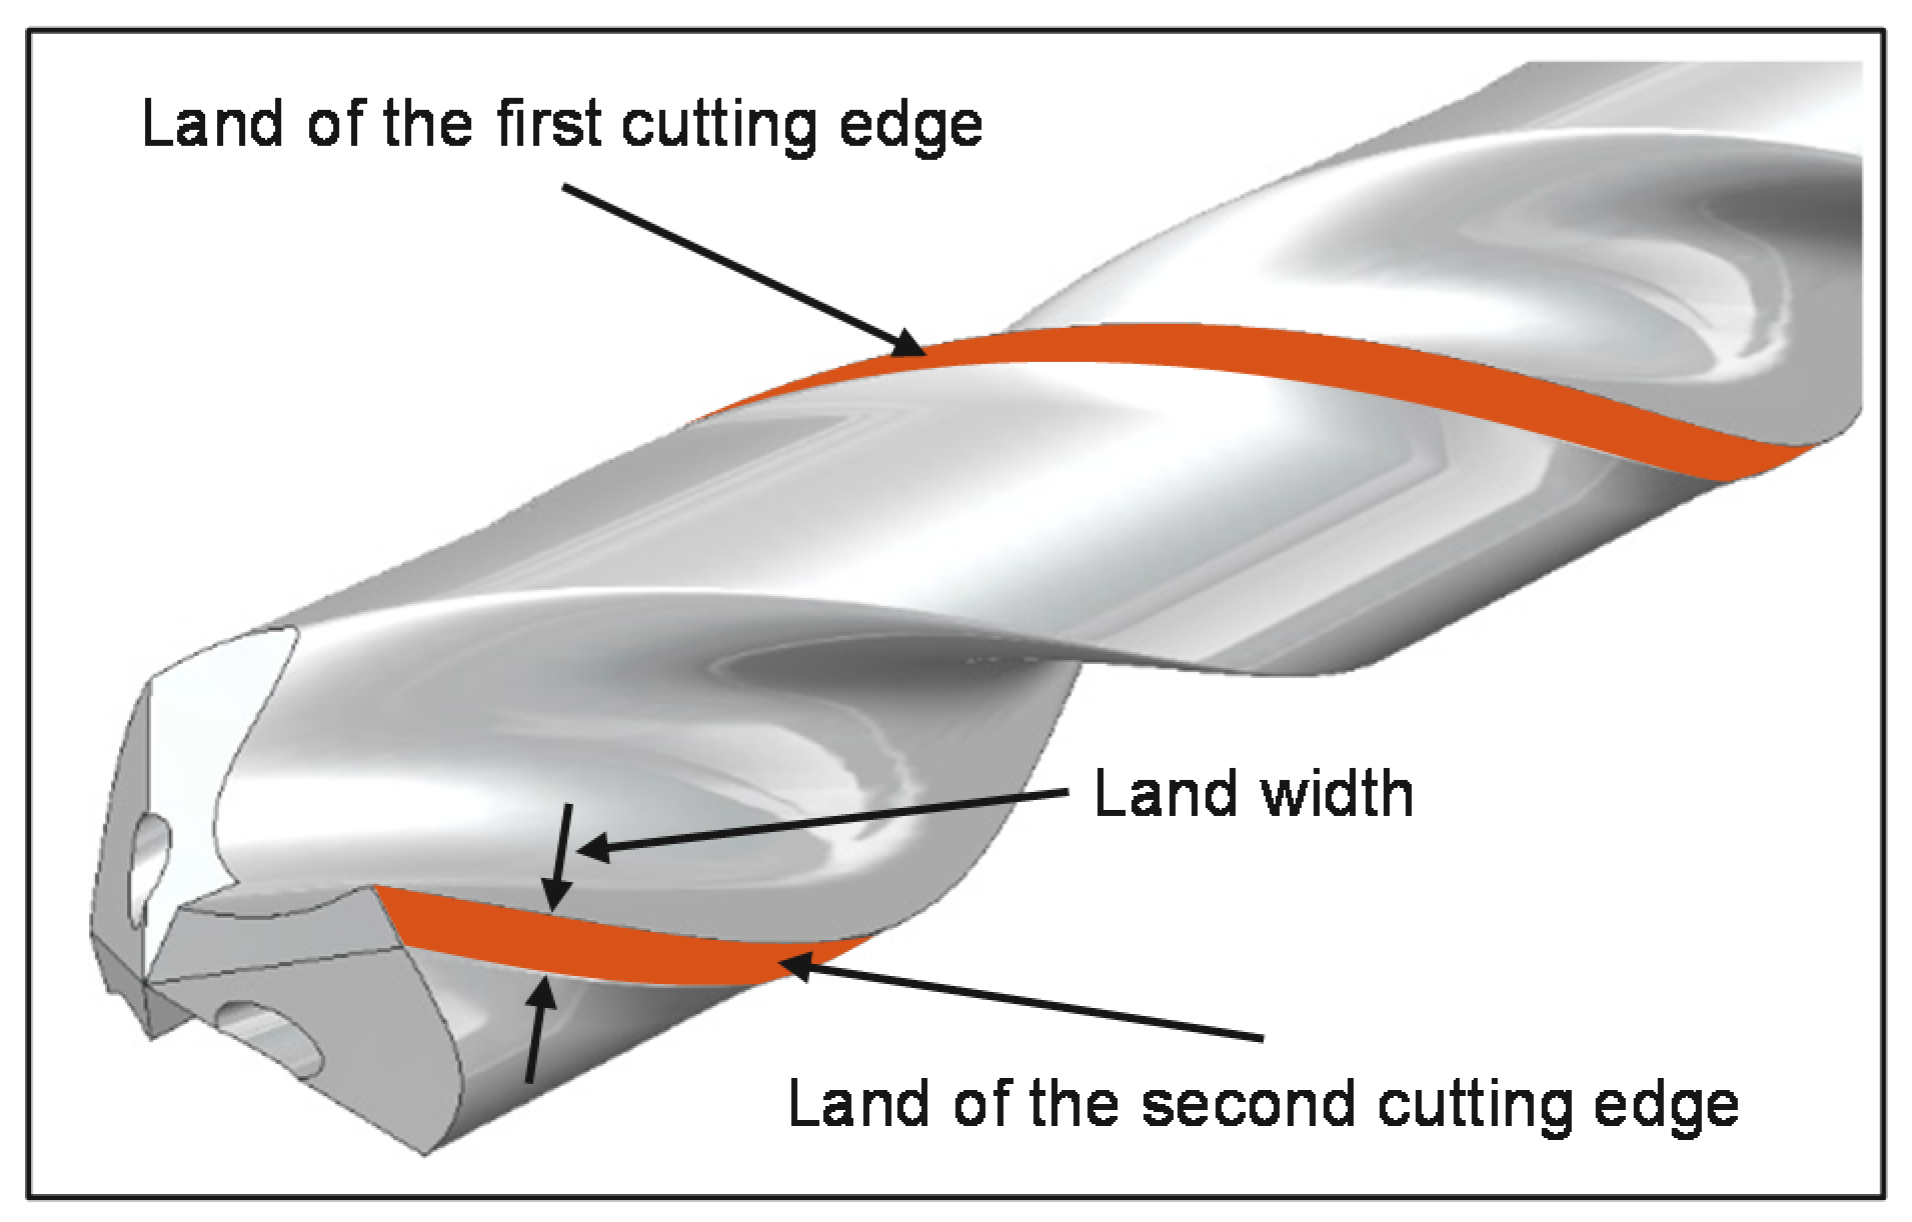
Figure 1. Highlighted lands at the circumference of a twisted drilling tool.
Jmmp 04 00028 g001
Figure 2. Representation of the drilling tool for experimental investigation.
Jmmp 04 00028 g002
Figure 3. Process chain for the second step of the experimental investigation.
Jmmp 04 00028 g003
Figure 4. Results of the first investigation: (a) the mean value from 10 measuring planes and 27 holes, (b) the mean value from 27 holes along the measuring planes, and (c) the exemplary circularities at two different drilling depths.
Jmmp 04 00028 g004
Figure 5. Influence of each varied parameter on total circularity scattering.
Jmmp 04 00028 g005
Figure 6. Representation of the influences of the parameters on circularity in an effect diagram.
Jmmp 04 00028 g006
Figure 7. (a,b) Comparison of the best and worst result by the representation of the circularity and (c) the surface roughness.
Jmmp 04 00028 g007
Table 1. List of varied parameters.
ParameterValueUnit
Feed rate0.25, 0.375, 0.5mm/rev.
Cutting speed120, 150, 180m/min
Coolant high pressure4, 6, 8Mpa
Pre-hole diameter4, 6, 8mm
Land width300, 500, 740µm
Chuck selection
(cantilever lengths)
Hydraulic chuck (80),
Collet chuck (80),
Shrink chuck (85)
- (mm)
Table 2. ANOVA-Table.
SSdfMSFempp-ValueFtab(0.95)Eta2
Feed rate6.6 × 10-423.3 × 10-44.9 × 1007.3 × 10-33.0 × 100
Cutting speed3.6 × 10-421.8 × 10-42.7 × 1006.9 × 10-33.0 × 100
Coolant pressure3.4 × 10-421.7 × 10-42.5 × 1007.9 × 10-33.0 × 100
Pre-hole2.4 × 10-321.2 × 10-31.8 × 1011.5 × 10-83.0 × 100
Land width2.3 × 10-121.2 × 10-11.7 × 103< × 10-203.0 × 100
Chuck selection4.0 × 10-322.0 × 10-33.0 × 1011.3 × 10-133.0 × 100
Interaction effects1.0 × 10-3
Error1.5 × 10-121746.7 × 10-51
Total3.8 × 10-121861.8 × 10-4 0.62