1. Introduction
The recent success of desktop-type machines using polymers as the printing material has made additive manufacturing (AM) a successful and affordable technology for many applications. One of the major bottlenecks in end usability of the AM produced parts for functional prototyping is limited availability of data on the effect of print parameters on mechanical properties. There are many factors that affect these properties; Letcher et al. broadly classifies these factors as vendor related and user related factors. More specifically, the parameters can be grouped in material properties, printer type, printing parameters defined by the user and geometrical complexity of the part [
1].
A survey of literature reveals that although several studies are available on other AM processes, especially on popular processes such as fused deposition modelling (FDM) [
2,
3,
4], there is limited information on the effect of printing parameters or on the mechanical properties of Stereolithography (SLA) printed parts on non-industrial size equipment. SLA printing uses photosensitive resin to create 3D printed parts by curing the liquid resin layer-by-layer through exposure to a UV light source. It has been shown that the printing parameters in an SLA procedure, such as laser power, scan speed or duration of exposure, greatly affect the curing time and printing resolution [
5]. In fact, out of all these parameters, the curing time is critical to control the geometry [
6] and quality of final printed parts [
7]. The main advantage of SLA printing technology is the ability to print parts with high resolution.
The machine used in this study, Form 2 from Formlabs
® is a widely used SLA printer. It uses a single laser beam to polymerize layers of the Formlabs
® Clear Resin. Formlabs
® offers some technical information on these types of machines in the form of a series of white papers on mechanical properties, separately studying post curing effects and printing directions [
8,
9] with limited information on anisotropic effects. A number of studies on FDM and SLA show a clear relationship between the tensile properties and the printing orientation, confirming the high anisotropy of these parts [
10,
11,
12,
13]. These studies, while contradictory, reflect the need for further analysis on SLA printing with the proposed machine and their off-the-shelve resins.
A more recent study on the interaction between the materials and the selected SLA process showed that tailoring the mechanical properties of the 3D-printed part as well as optimal mechanical properties could be obtained with shorter printing times [
14]. Hence, for the machine selected for this study, a similar statistical analysis is required to provide further understanding on this SLA printing procedure, as the material, process and manufacturer are completely different.
To summarize, this paper studies the relationship between printing factors, post curing and the final tensile properties of parts printed using Formlabs’ Clear resin and the Form 2 printer to provide optimal printing procedure to maximize the mechanical properties while minimizing the print time, hence reducing manufacturing costs.
2. Materials and Methodology
The paper utilizes a systemic design of experiments to explore the manufacturing process parameter envelope in terms of responses for characterising the tensile behaviour of the printed test parts. The DoE was based on knowledge obtained during previous printing experiences and pilot experiments to assess the limitations of the printer, testing machine and material.
2.1. Equipment
Printer: the printer selected for this study is the Formlabs’ Form 2. According to the manufacturer, the maximum resolution along the printing surface is 140 μm, given by the width of the laser beam. The Z resolution, given by the layer thickness, ranged between 25 and 100 μm. The printing envelope is 145 × 145 × 175 mm (X, Y, Z). The printer’s firmware version during the duration of the study was rc-1.9.9-43.
Material: The material used for 3D printing was Formlabs standard clear resin. This is an OEM provided standard clear photoreactive resin which is a combination of methacrylic acid esters and photo initiator.
CAD software: All CAD models were created using SOLIDWORKS® 2015 developed by Dassault Systèmes.
Slicing software: The manufacturer’s software, PreForm 2.11.3, was used to create the printing files.
Data analysis software: MATLAB R2016a and Minitab
® 17.3.1 were used to analyze the experimental data. An optical strain sensing system, OSM-Classic, was used to track the tensile strain during the elastic region of the stress-strain curve [
15].
Universal Testing Machine: A Bose ElectroForce 3200 Test Instrument was used to perform the tensile tests. The machine was equipped with a 450 N capacity load cell.
Camera: the Basler acA3800-10gm camera was used to record the elastic part of the tensile tests.
2.2. Methodology
The Form 2 printer was used in the standard mode, in which the only available parameter to modify at the software level was the layer thickness, which could be chosen to be 25, 50 or 100 μm. In addition to this parameter, post curing time, part orientation, part rotation and part position were factors considered for this experiment.
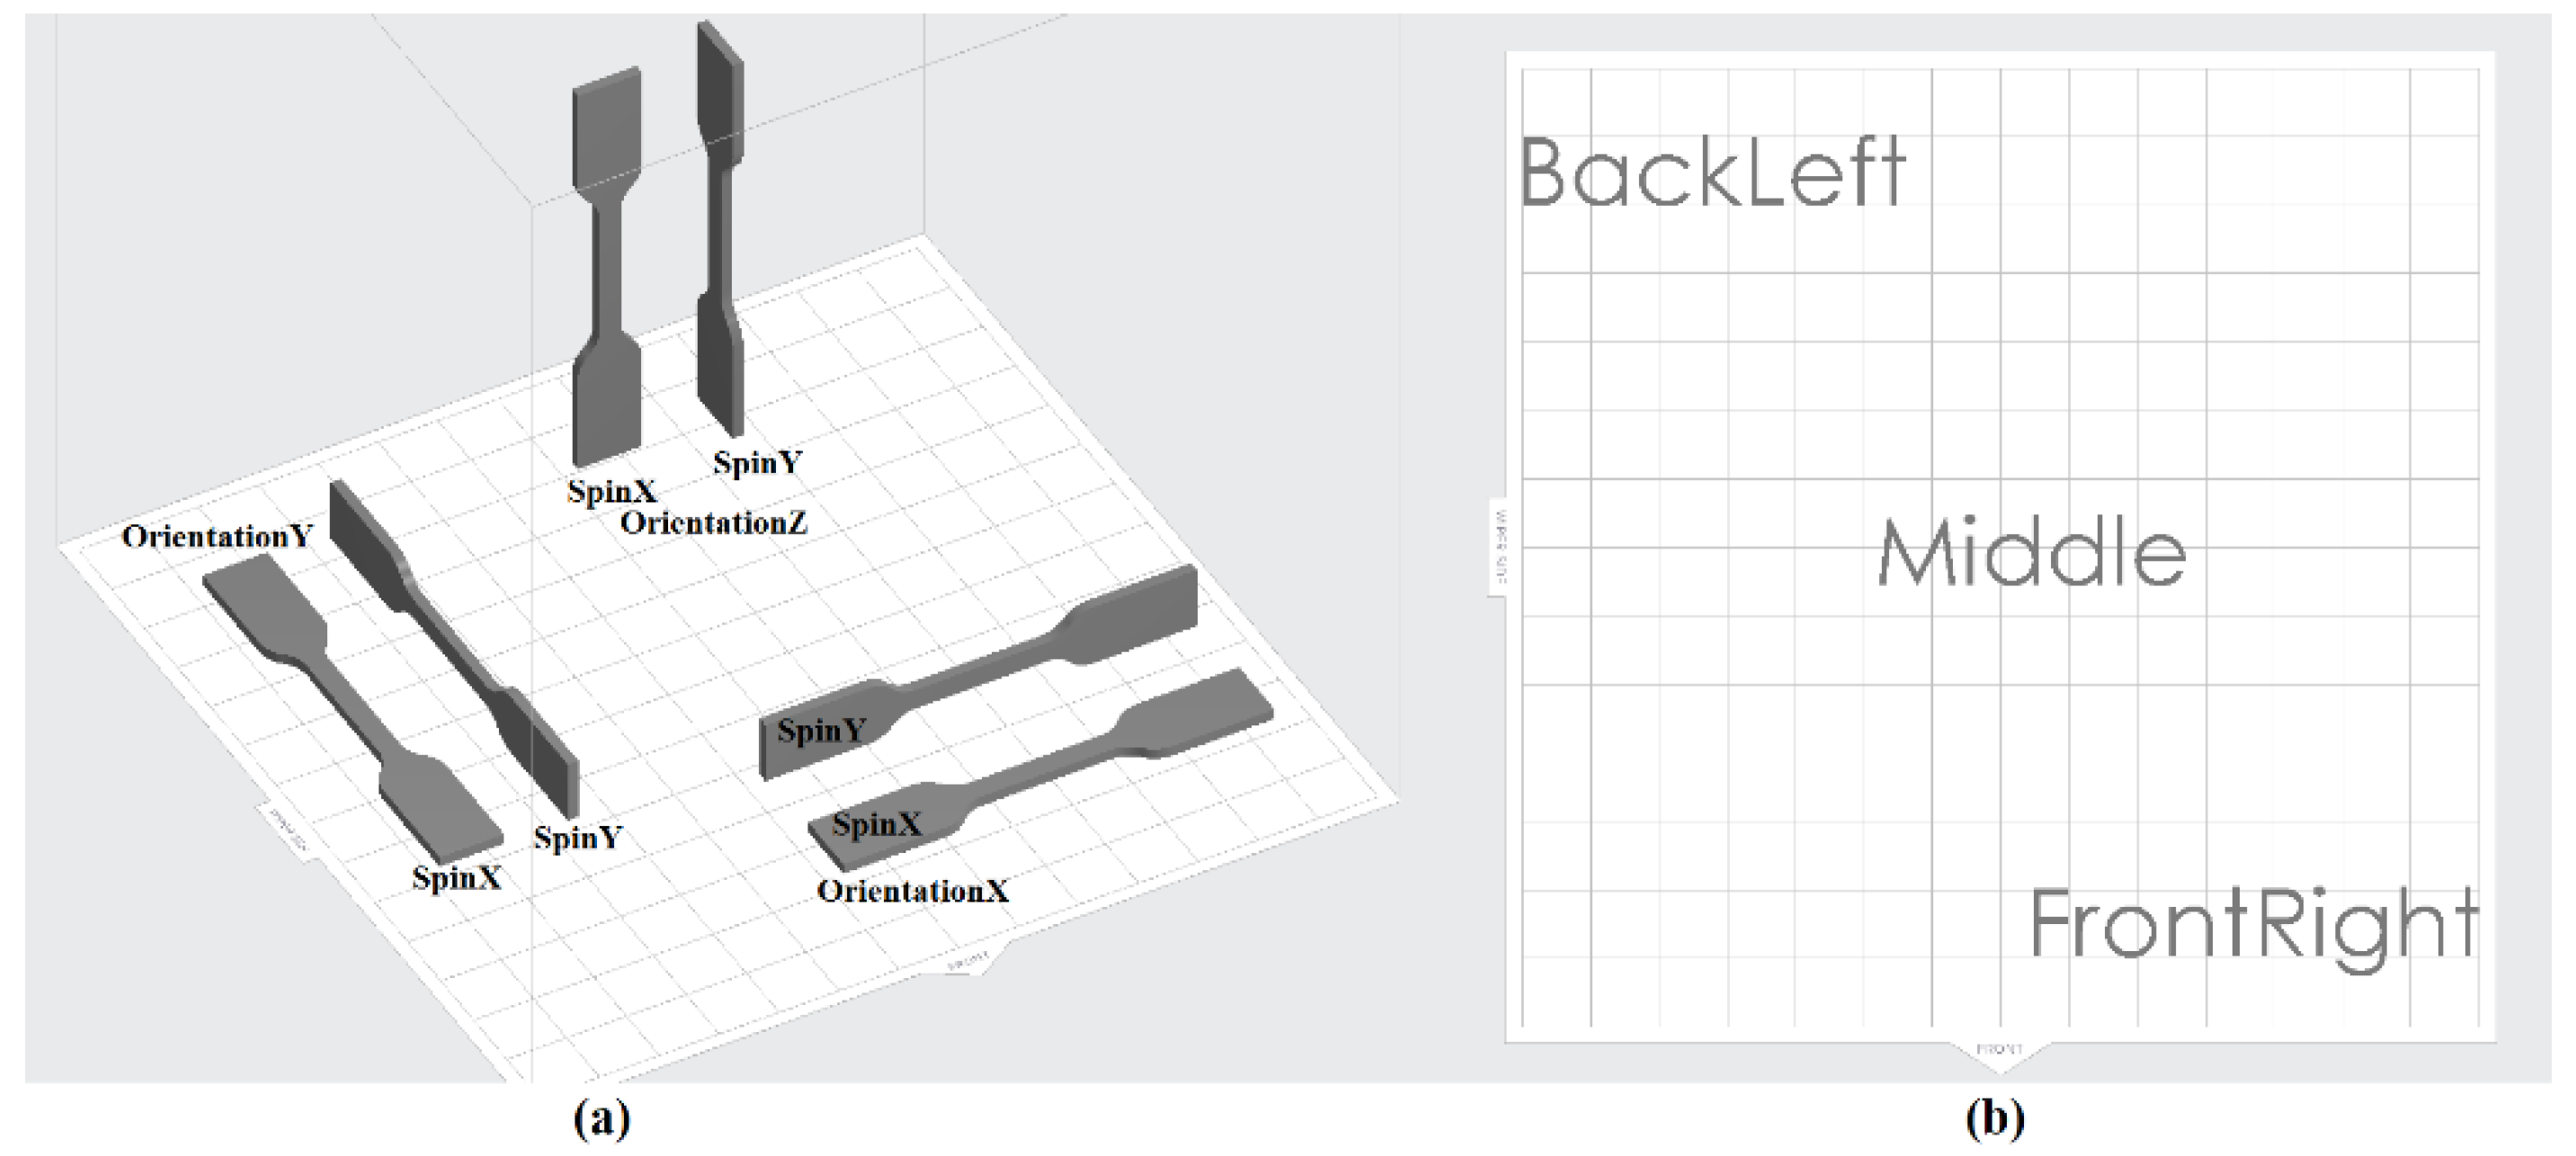
Part rotation (spin) is considered as a 2-level factor as shown in
Figure 1a; part orientation and part position are 3-level factors as seen in
Figure 1a,b, respectively. Finally, post curing time is a 3-level factor, with these factors being 0, 60 and 120 min. The post curing process used a 365 nm wavelength lamp with a measured power of 0.068 W/cm
2.
2.2.1. Design of Experiments
Taguchi’s mixed level DoE was implemented using Minitab. This allows the study of the effect of a factor on the responses while keeping the number of experiments to a minimum by the use of an orthogonal array [
16,
17]. An L18 array matrix was designed to obtain the 18 different experiments. A total of five replications were run for each experiment resulting in 90 runs. All five samples of each experiment were printed together to establish the mechanical repeatability of a single print.
Five factors were analyzed on this experiment with four of them being 3-level and one a 2-level factor.
Table 1 summarizes the factors and levels studied.
Factor 1, part rotation (spin), refers to the rotation of the part with respect to its longitudinal axis; this factor can be observed in
Figure 1. Factor 2, layer thickness, refers to the height variation of the building platform between consecutive layers, which was limited by the options offered by the used software. Factor 3, part orientation, refers to the alignment of the part with respect to the axis of the printer as shown in
Figure 1. Factor 4, post curing time, indicates the amount of time that the part was cured under UV light at 60 degrees Celsius. Factor 5, position, indicates the location on the printing surface where the part is printed, which, if the printing process is consistent across the plane or printing should not have a significant effect on the final results.
2.2.2. Test Specimens
The tensile test specimens used for this work were printed in accordance with the ISO-527-1/2:2012 standard [
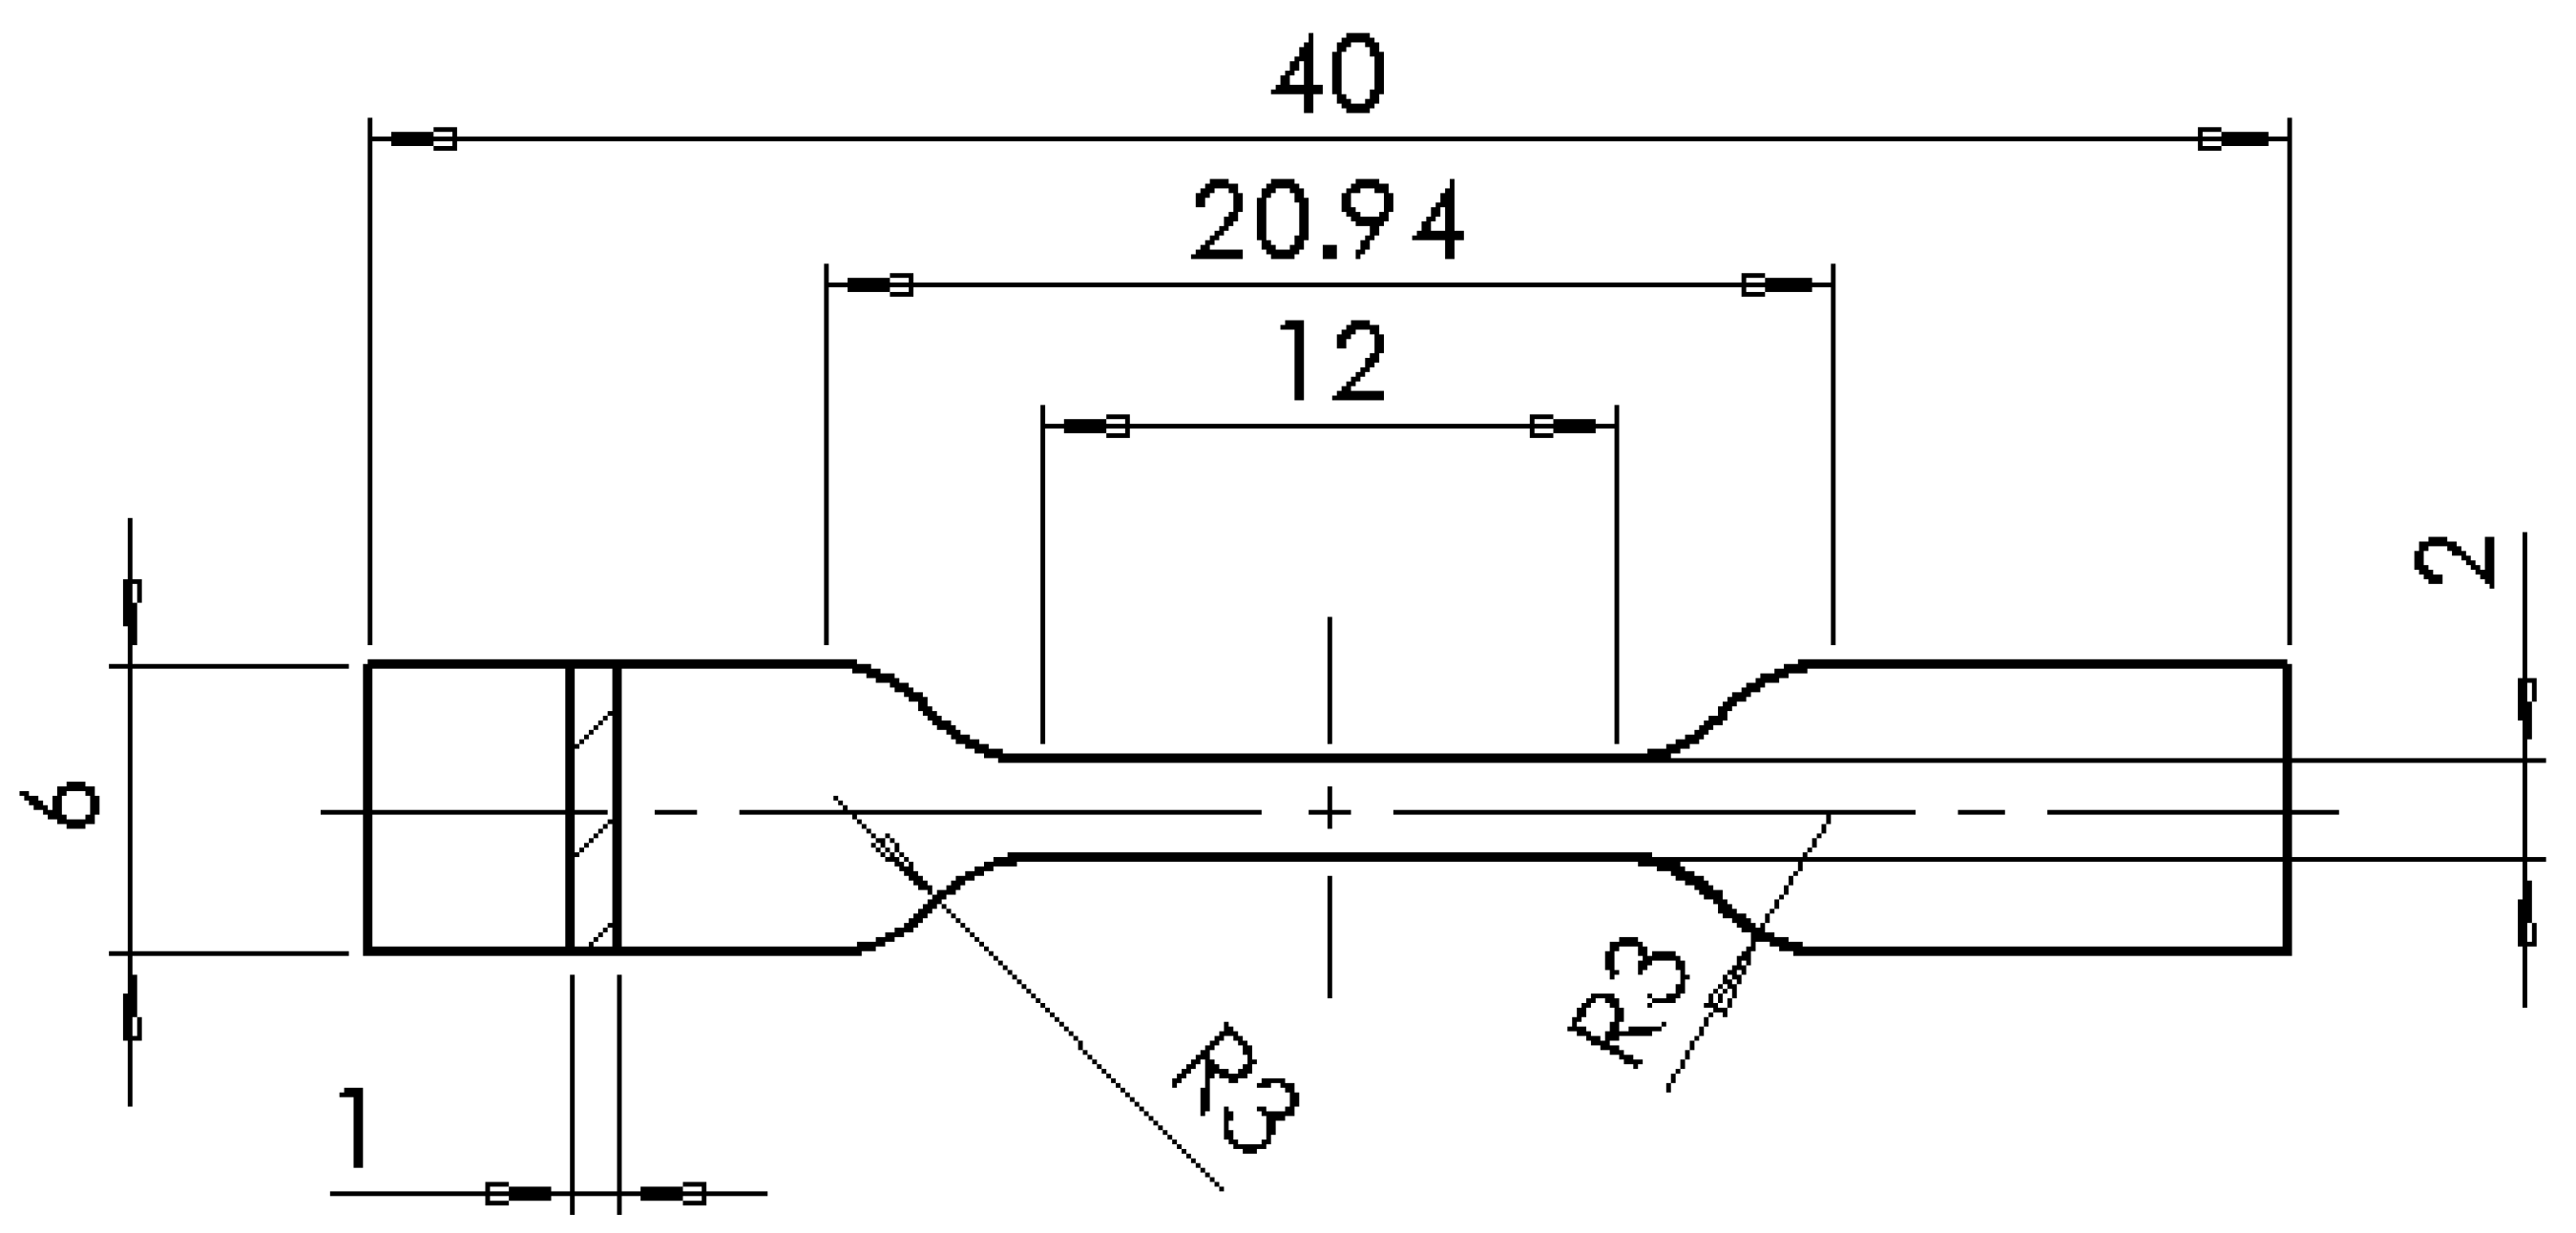
18]. The maximum break load of the machine used was the limitation taken to choose the test specimen type; which was chosen as ISO 527: Type 5B. A schematic view and the dimensions of the specimen are shown in
Figure 2.
2.2.3. Pre-Processing
The designed test specimen’s CAD file was saved in STL format with a maximum deviation tolerance of 0.002 mm and maximum angle tolerance of 0.5°. The STL file was then opened and processed in PreForm, adding support structure and applying any design constriction required by each experiment. After this process, each unique file is sent to the printer.
2.2.4. Post Processing
All printed parts were cleaned by immersion in a 99.5% isopropyl alcohol bath for 10 min as recommended by the manufacturer. Any existing support structure was removed with pliers after the initial printing process. The parts were then post cured under UV light for the required time at 60 °C. To undergo post curing the parts are exposed to light and turned half way through curing time. The pieces are then left on shelf at room temperature for 24 h.
2.2.5. Tensile Testing
Tensile tests and data analysis were performed as per ISO 527:2012 standard [
18].
3. Results and Discussion
This section presents the results obtained from the tensile tests experiments. The results have been divided into elastic modulus, ultimate tensile stress (UTS) and ultimate strain measured at the point of break. First, an overview of all the experiments is shown. Later, the effect of each factor is statistically analyzed individually and ranked in terms of Signal to Noise ratio (S/N ratio) and means response. To finalize, a brief discussion on the printing time with respect to the mechanical properties is presented, as well as a discussion on the findings for each factor.
3.1. General Interpretation of the Results
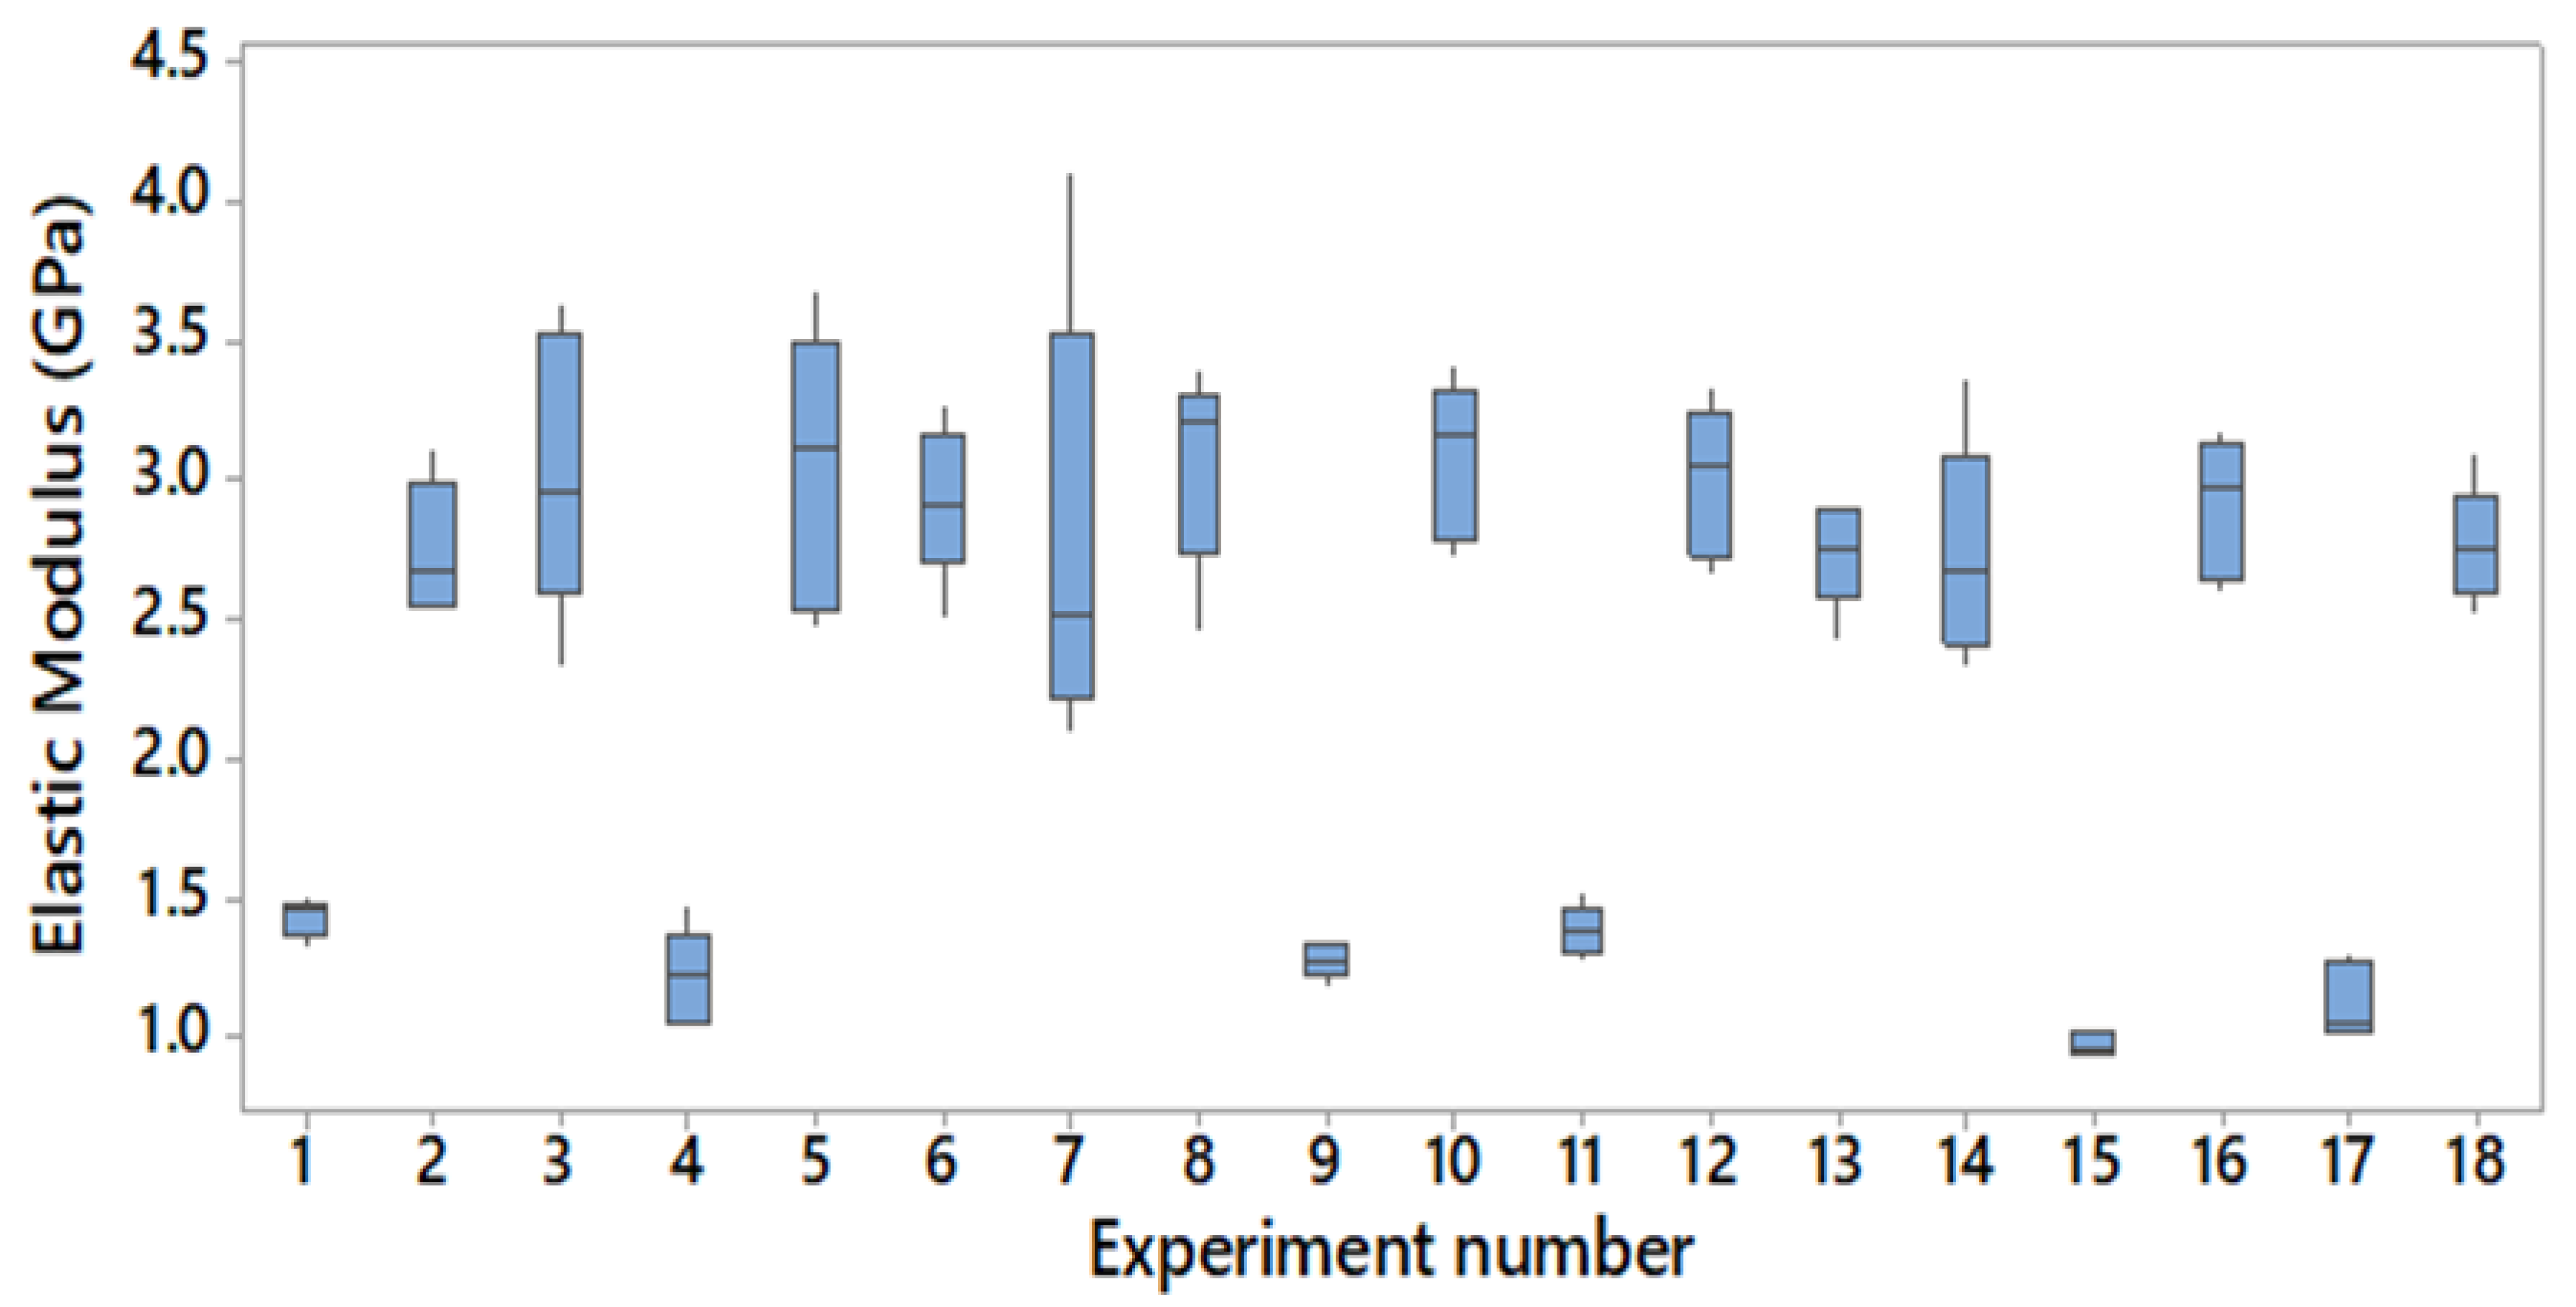
The boxplot of the elastic modulus obtained for all the experiments is shown in
Figure 3; the blue bars are the range between the first and third quartile and the black lines represent the minimum and maximum values. Each bar represents the five results corresponding to five repetitions of the same experiment or printed batch; each experiment has a unique combination of factors as per Taguchi’s design. The average of each batch varies between 3.08 GPa and 0.97 GPa, representing a 216% increment on the elastic modulus for the same material printed under different conditions. However, the mentioned variation was with respect to the averages of each experiment, the maximum elastic modulus was reported to be 4.10 GPa while the minimum was 0.93 GPa, increasing the difference to a 342%. This change reported in the difference of results when comparing averages or individual elastic moduli is due to the high-observed standard deviation, especially for the post cured samples.
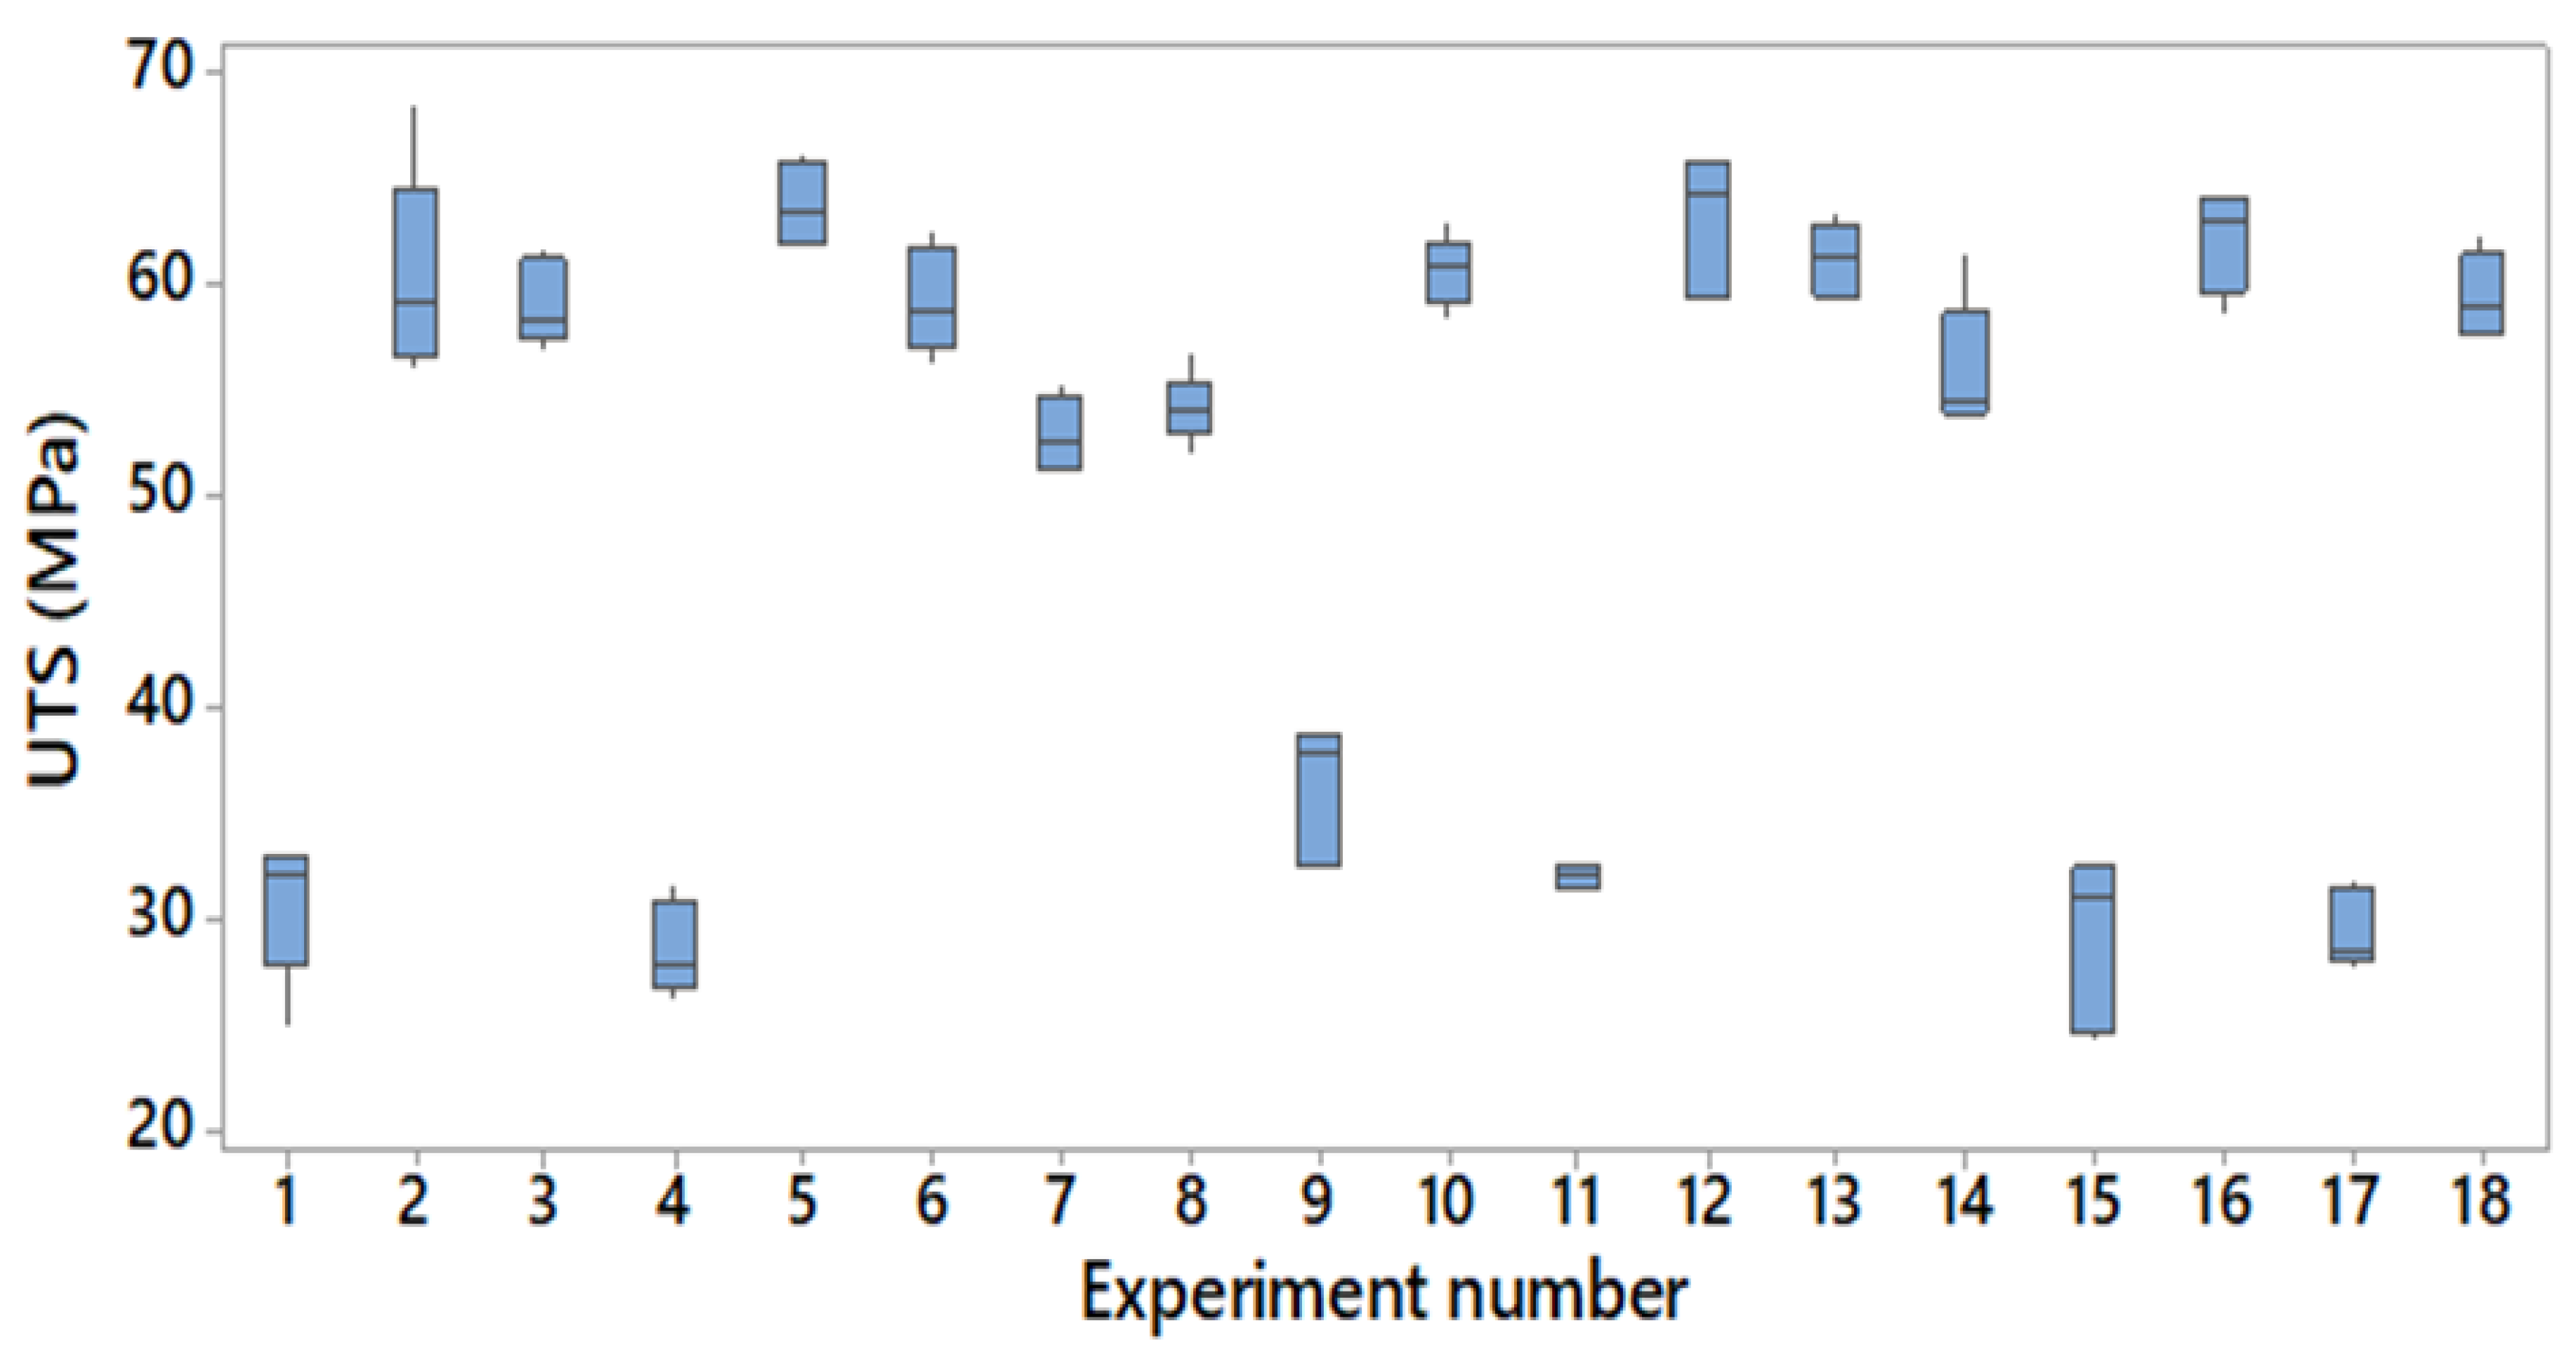
Similarly, the boxplot of the test samples’ ultimate tensile strength (UTS) is observed in
Figure 4. The mean UTS values vary between 63.8 MPa and 28.6 MPa; this again showed a 123% difference between the minimum and maximum values on average of each batch and 181% when comparing global maximum and minimum individual results (24.3 MPa and 68.5 MPa, respectively). This time, the standard deviation is reported to be lower, hence the difference when comparing global maximum and minimum values and maximum and minimum averages is lower.
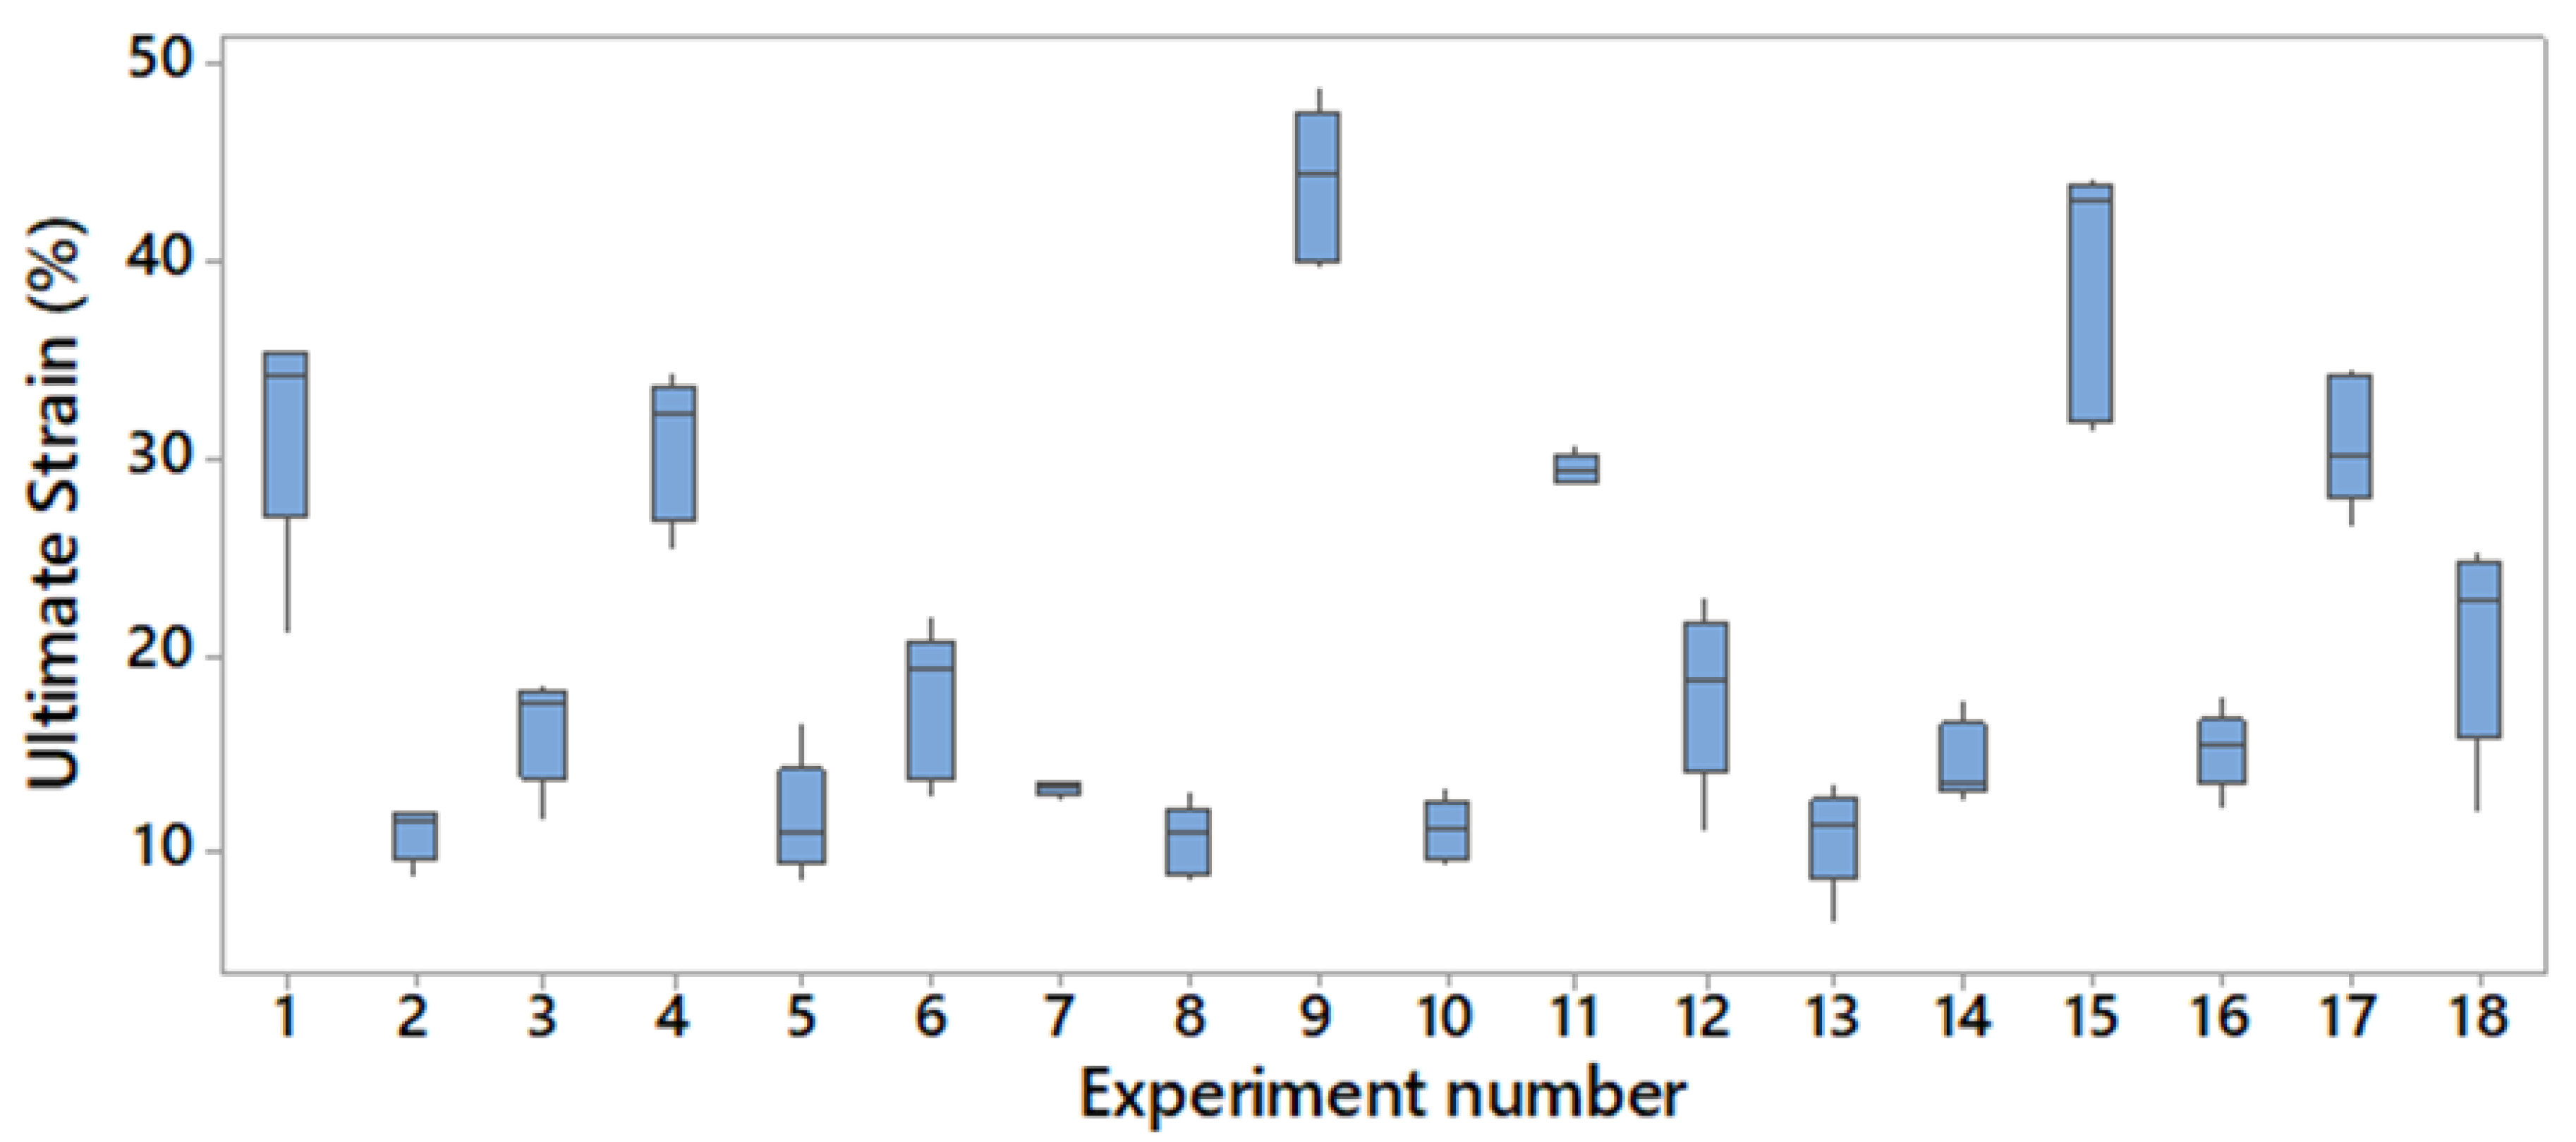
Finally, the same method was used for the ultimate strain expressed as a percentage (%). The corresponding boxplot can be observed in
Figure 5. In average, all experiments failed between 11% and 44% strain, representing an increment of 314%; however, the global minimum ultimate strain was reported to be 6% and maximum ultimate strain was 49%, meaning that the specimen that broke at the highest ultimate strain overcame more than seven times more strain than the one that broke with minimum strain.
3.2. Factor Analysis by Response
3.2.1. Elastic Modulus
The main output from a Taguchi analysis is the Signal to Noise ratio (S/N ratio). This magnitude measures the effect of each factor included in the DoE. To calculate the S/N ratio a given configuration must be chosen, depending on the desired output; In this case, “larger is better” was used.
Table 2 shows the results of the analysis.
The numbers observed are the S/N ratio for all levels of each factor. Delta represents the S/N ratio variation within the same factor, calculated as maximum S/N ratio minus minimum S/N ratio. Rank shows the order of the factors in terms of largest Delta. In this case, the post curing time is the most relevant factor that will affect the resulting elastic modulus.
An evaluation of the delta values shows that the first ranked factor, post curing time, accounts for the 78% of the elastic modulus variation. The next ranked factor, layer thickness, is only responsible for the 10% of the response. All other factors represent, individually, less than 5% of the response.
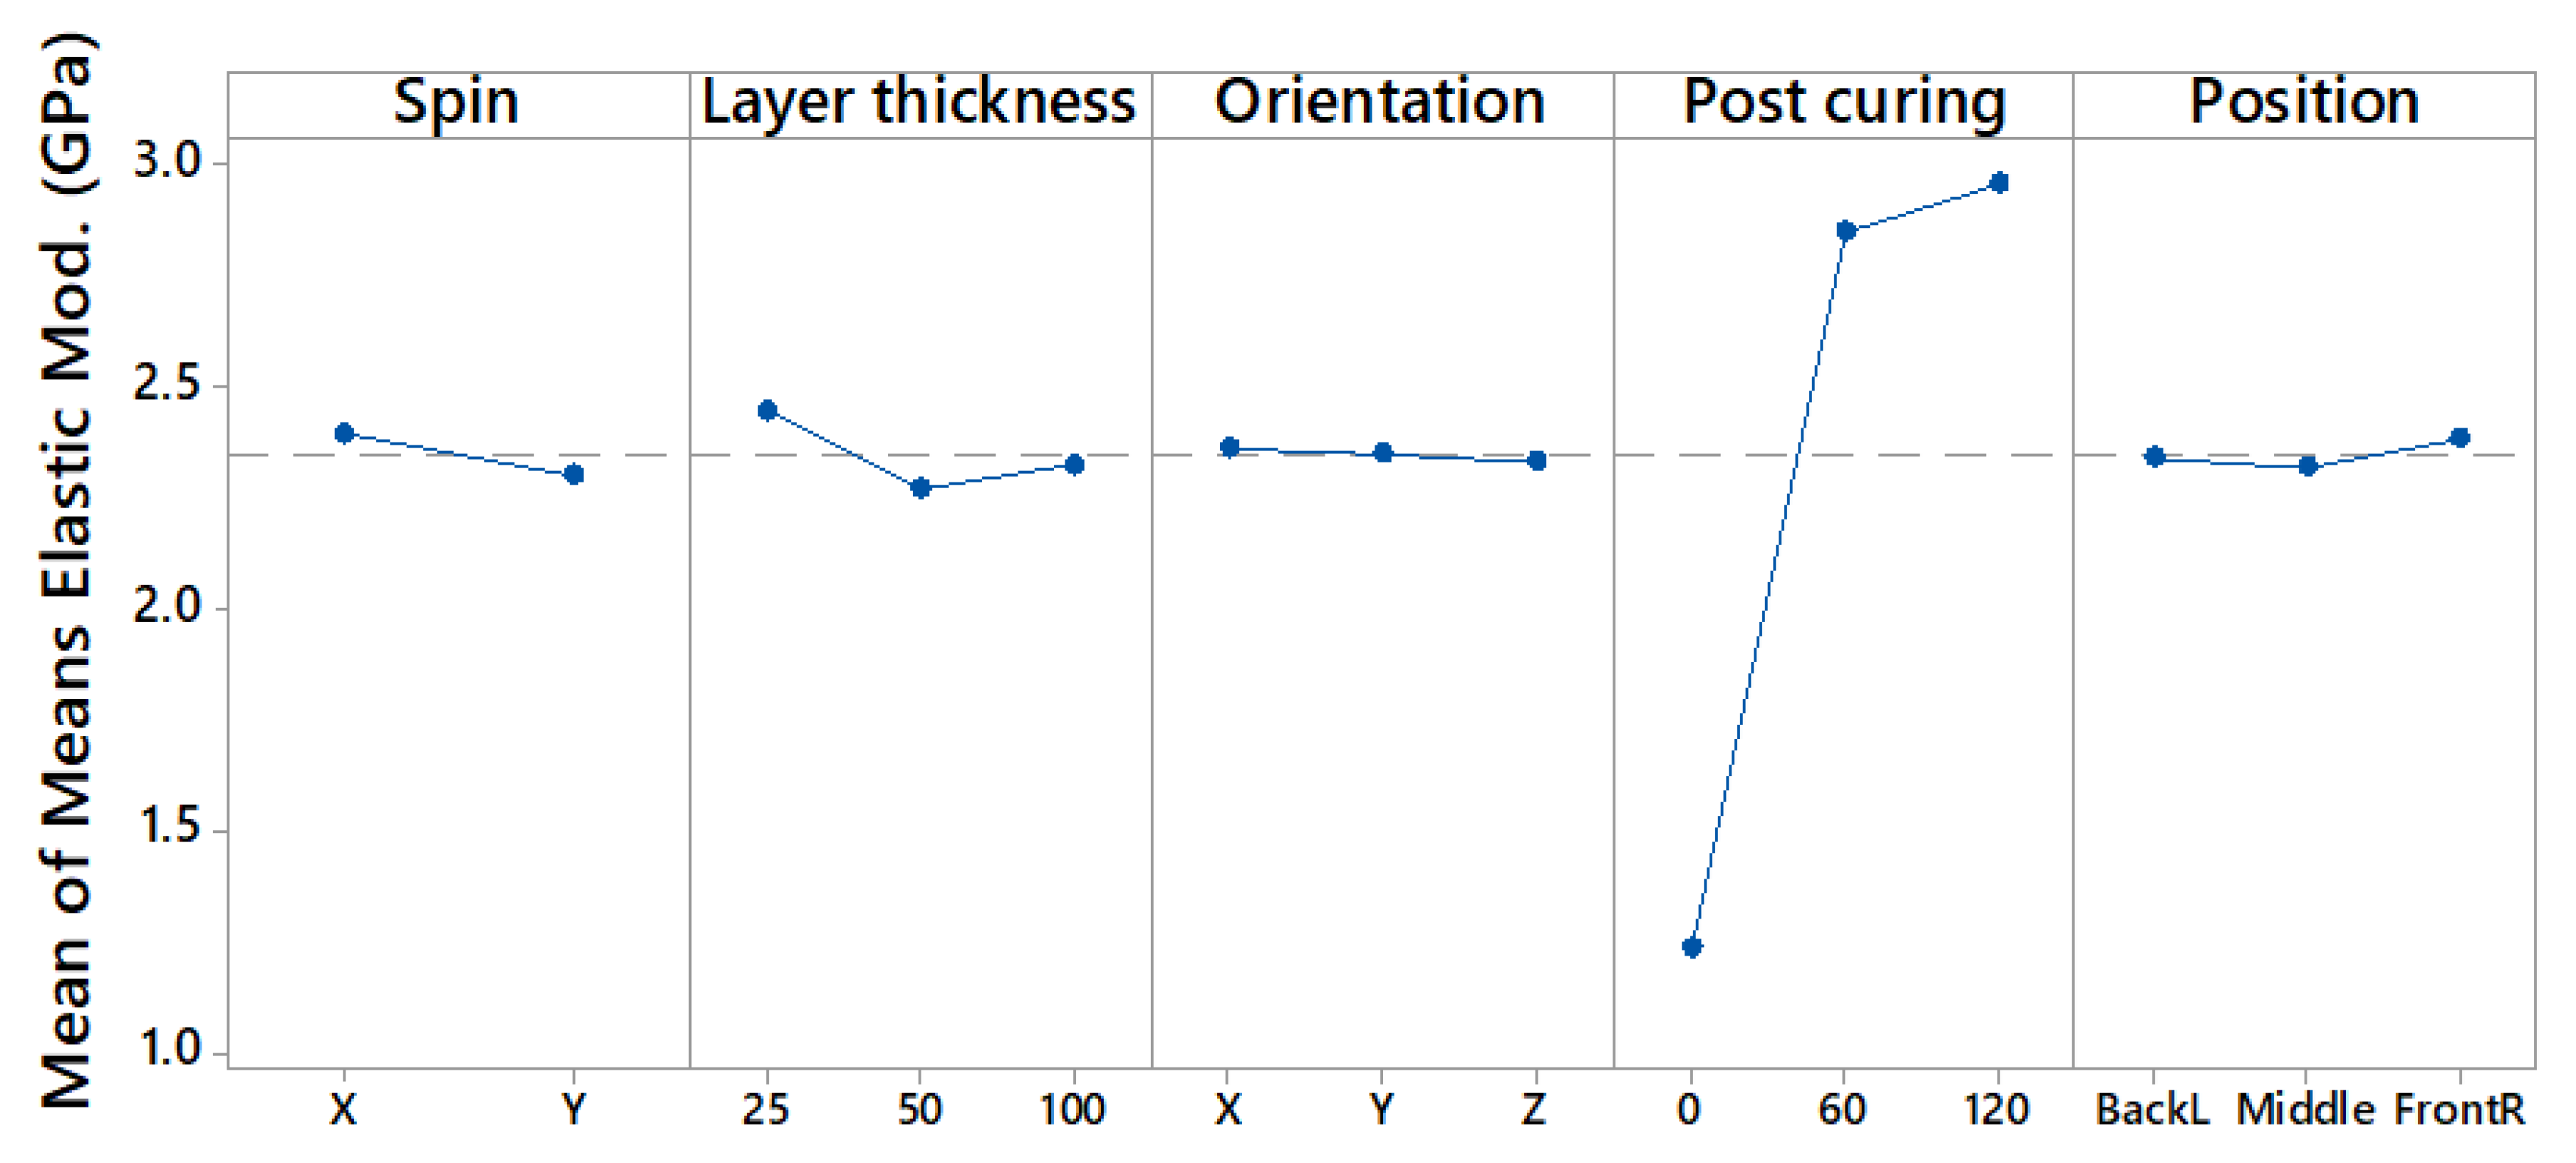
Finally,
Figure 6 represents the lot of Means of the elastic modulus of each individual level. A Plot of Means represents the mean result obtained from all experiments grouped by factors and levels; given the interaction between factors, this plot is used to compliment other analysis and to determine which factors are important and which ranking these factors follow.
Figure 6 confirms that post curing is the most important factor. From all the 90 experiments, the average elastic modulus of those that were post cured for 2 h was 2.96 GPa; the samples that were not post cured had an average value of 1.24 GPa. It is observed that the elastic modulus results did not undergo a relevant variation when varying other factors.
3.2.2. Ultimate Tensile Strength
The same steps were followed to analyze the ultimate tensile strength (UTS) results. The S/N ratio results are found in
Table 3. Again, the top ranked factor is post curing time; however, the second most important factor is part position instead of the layer thickness. This change indicates that not every factor affects different mechanical properties in the same manner. This time, post curing time represents 82% of the variation in UTS.
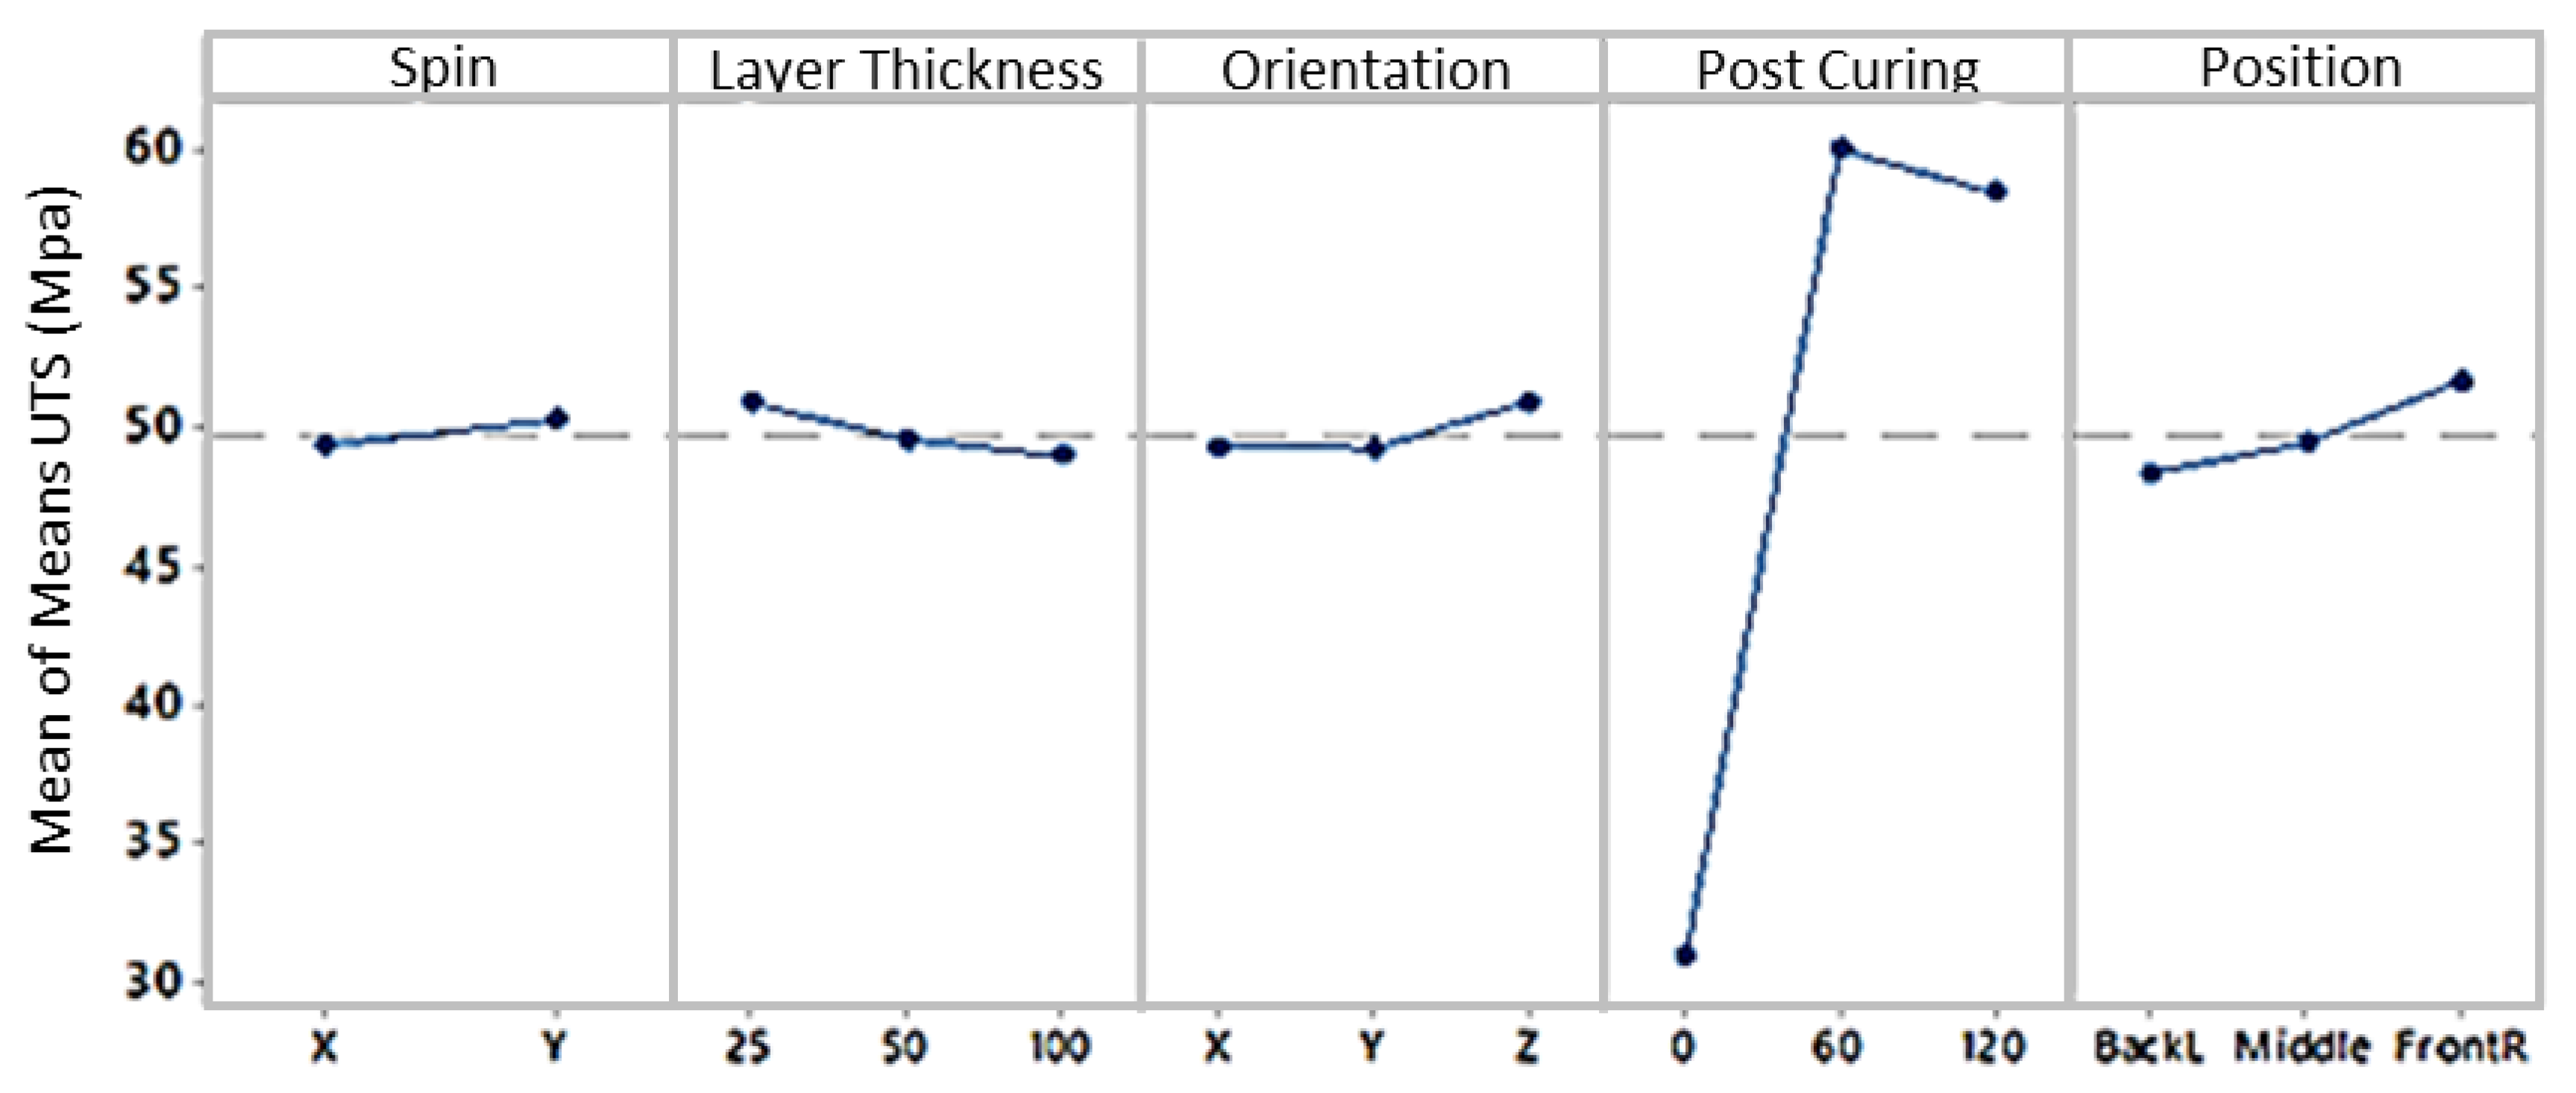
The mean UTS values can be found in
Figure 7. The most significant differences are introduced by the different post curing time levels, in this case, the mean UTS ranges between 53 MPa and 64 MPa for one hour post curing and 29 MPa and 36 MPa without post curing.
3.2.3. Ultimate Strain
Following the same analysis procedure as above, the ultimate tensile strain is studied. The highest ranked factor is, one more time, the post curing time, that represents 60% of the response variation, followed by the part orientation representing 22%. The signal to noise ratio values can be observed in
Table 4.
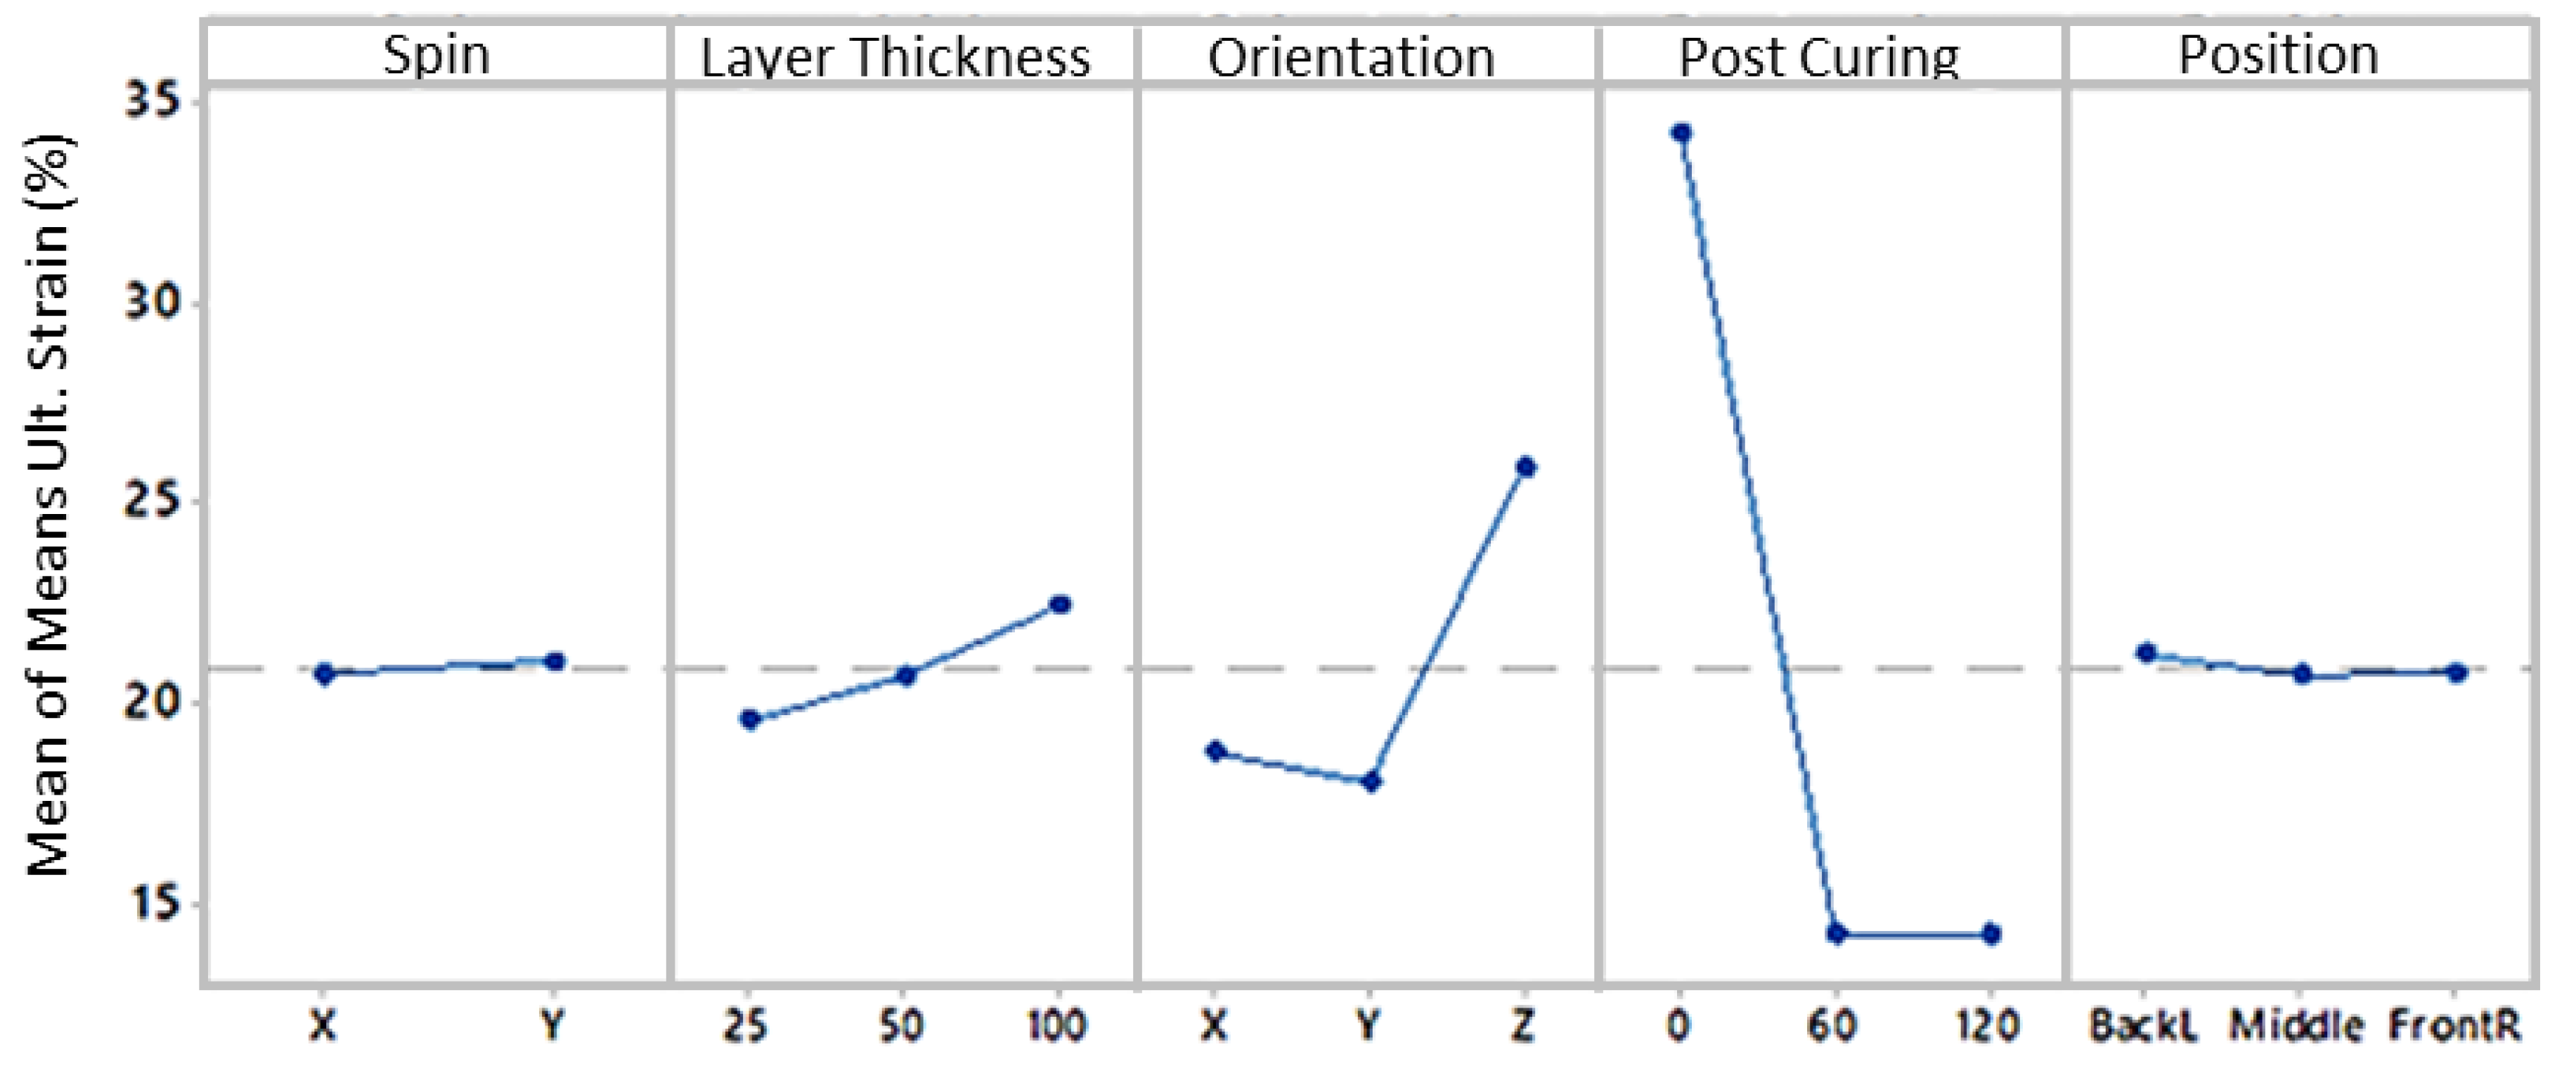
The mean ultimate strain is represented in
Figure 8. Opposed to the previous results, this time the highest response is given for no post cured samples while post cured specimens show the lowest strain values (34% ultimate strain compared to 14%).
4. Results
4.1. Cost and Time
The printing time for each of the designed experiments is a function of the part orientation, and other manufacturing process parameters. Therefore, each of the considered experiments results into a different print time. Printed parts also require post processing, so, post processing time should be added to the printing time. For this analysis, the sum of the estimated print time given by the software and the post curing time was used.
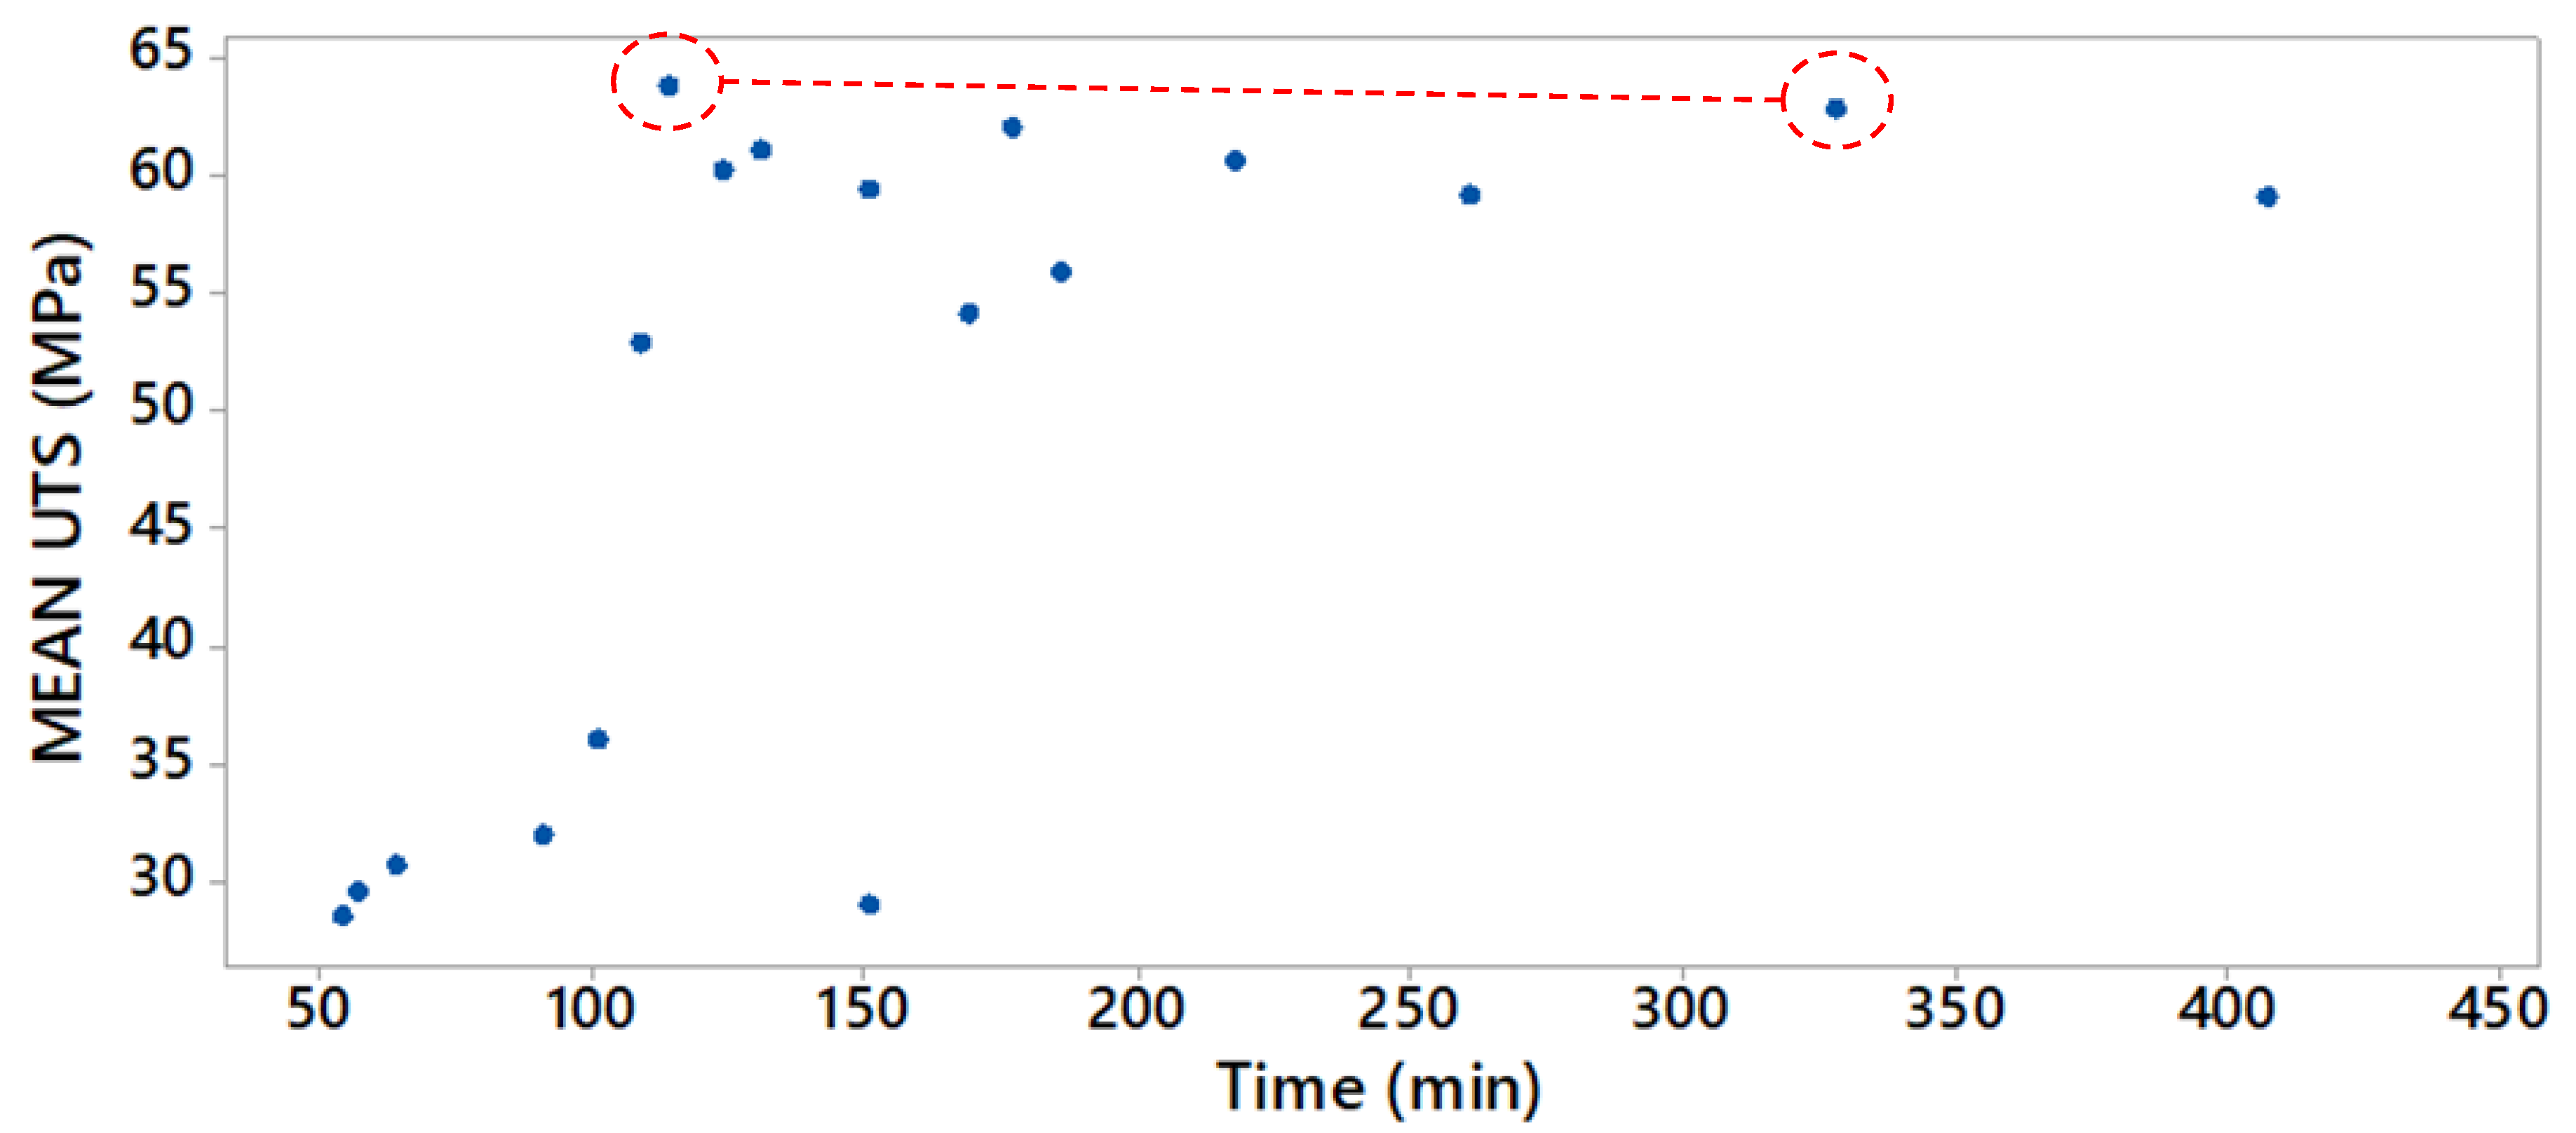
Figure 9 shows the average UTS of each experiment with respect to the total time. It is important to mention that the manufacturing cost is directly related to time in terms of machine use and energy. Labor time will remain approximately constant for any 3D printed part if no intervention is necessary by the operator. However, there is an increased probability of requirement of operator intervention as the print time increases. It should also be noted that this study was conducted in a small-scale facility. As such, different considerations would apply to larger facilities; for example, the post curing time may not add as much cost if it is performed in a large chamber with multiple pieces simultaneously.
As observed in
Figure 9, similar UTS results can be obtained from samples that take around 2 h, as well as the samples that take 5 h to print, with the latter being more than two times more expensive in terms of manufacturing time. On the figure, each point represents one of the 18 experiments that were run. This study highlights that combinations of factors that lead to long manufacturing time should not be associated with the obtainment of better UTS results. Additionally, shorter manufacturing times, below 100 min corresponding to non-post cured parts, show about half UTS (30 MPa) than the average post cured samples (60 MPa).
4.2. Print Settings for Optimized Model
To conclude the design of the experiments, the optimized print settings were extracted for the different mechanical properties studied.
Firstly, the individual and combined optimizations were obtained for both elastic modulus and UTS. Resulting in three experiments where the most influencing factors were constant, hence the optimized elastic modulus configuration was chosen for testing.
Table 5 highlights the optimized experiment for highest resulting elastic modulus. The optimized theoretical value of this test is an elastic modulus of 3.1 GPa, UTS of 57.1 MPa and ultimate strain of 10.88%.
After the experiment was run, the resulting average elastic modulus was 2.99 GPa, UTS was 54.5 MPa and ultimate strain was 15.3%. This result validates the optimization, which was the obtained elastic modulus and UTS within a 5% of the predicted ones. The measured ultimate strain had a larger deviation as compared to UTS and elastic modulus.
5. Discussion
The experimental results and statistical analysis provide critical insight in the effect of process factors on the mechanical properties of the printed parts. The Taguchi’s design of experiment ranks the factors and it shows that post curing time is the most important factor that affects the mechanical properties. Post curing time is a post printing factor, meaning that it is introduced during the post processing stage. In terms of factor significance within the printing process itself, the part orientation is the most significant factor, followed by the layer thickness, part position, and finally, part spin. This order of factors was obtained adding the percentage effect of each factor over the three mechanical properties studied.
5.1. Post Curing Time
It was shown that post curing the tensile specimens increases the elastic modulus and UTS by more than two times, with this being increase of similar magnitude for only 1 h of post curing or 2 h. On the other hand, post curing decreases the ultimate tensile strain. It is possible that the effect of the post curing time was intensified due to the small size of the specimens, making it possible for the UV light to penetrate the full part. The fact that post cured specimens show higher elastic modulus and UTS is directly related to the degree of polymerization of the resin. However, little to no improvement is observed between 2 h and 1 h of post curing, suggesting that the total polymerization of the specimens takes place within the first hour.
5.2. Part Orientation
The analysis of the results shows that the part orientation significantly affects the ultimate tensile strain. This effect is significantly higher on parts printed along the Z-axis. It is possible that the bond at the interface of the previous layer and the current layer being exposed is more ductile than the bond within the exposure layer itself; this leads to delaying the breaking point by avoiding the premature brittle failure of the layers themselves.
5.3. Layer Thickness
Decreasing the layer thickness results in an increase of the resulting elastic modulus and UTS. This is due to the transmittance of UV light through the layers and consequent curing of the resin; varying the layer thickness affects significantly both the mechanical behaviour and the geometrical accuracy. Despite the fact that using lower layer thickness values allows capturing more fine and complex details of the manufactured part, layer thickness controls light penetration through the previously manufactured layers. By reducing the layer thickness, the light penetration increases and penetrates more through the previous layers, which allows extra curing and increases the mechanical strength. In contrast, thicker layers lead to higher ultimate strain percentages. However, the effect is very small as compared to post curing time. As the layer thickness has a limited effect on the studied mechanical properties, its values can be chosen to optimize other factors such as surface finish without any significant effect on mechanical behaviour.
In order to further study the layer thickness effect on non-post cured samples, four more experiments were prepared and tested. The only factors considered were layer thickness and part orientation, which were assigned the values corresponding to levels 1 and 3 as per
Table 6.
The tests yield interesting results and show that the parts printed with 25 μm thickness layers show better mechanical properties, except for ultimate strain, than those printed with 100 μm; an elastic modulus of 1.4 GPa and 0.9 GPa, UTS of 37 MPa and 27 MPa but ultimate strain of 31% and 41% respectively. The parts printed along the Z were proven to have better mechanical properties; they had an elastic modulus of 1.4 GPa opposed to 0.9 GPa, a UTS of 38 MPa against 28 MPa, and an ultimate strain of 38% versus 34%.
5.4. Part Position and Part Spin
These factors’ effect is, again, so low for every response that any position or spin could be considered without affecting the mechanical properties. The fact that the part position has a very low effect is conditioned by the accuracy of the assembly and the low distortion of the optical parts.
6. Conclusions
A study on the material-process interaction is presented to explore the isotropy or anisotropy of 3D-printed parts by SLA processes. Currently, based on literature and manufacturer recommendations, printing parameters greatly affect their mechanical properties. Such effects were tested on 90 tensile specimens and later analyzed. The provided study confirms that the manufacturing process parameters have a significant effect on the mechanical response of the printed parts as measured in terms of ultimate tensile strength, elastic modulus, and strain. In fact, post-curing time (UV light) accounts for, in average, for 73% of the specimen’s mechanical behaviour. Findings show that parts printed on the Form 2 and post cured during at least 1 h are isotropic for the scale of the parts corresponding to the ISO-527 test samples. However, parts that were not post cured exhibited orthotropic behaviour, as commonly exhibited by 3D printed parts. Clearly, post curing has a significant effect on the mechanical performance of the parts, making it necessary for any application. The average elastic modulus, UTS, and ultimate strain of non-post cured parts was 1.2 GPa, 31 MPa and 34%, respectively, as opposed to post cured values of 2.9 GPa, 59 MPa and 14%, respectively.
The study also demonstrated that from a quality/cost perspective, a longer manufacturing time does not correlate to a high elastic modulus or UTS, high mechanical properties. Interestingly, through manufacturing process optimization, a part of an optimized strength can be achieved at low printing times. Lastly, statistical techniques were employed to optimize the mechanical behaviour of the printed parts. Experimental validation of the optimized configurations was carried out and the results were found to be an improvement over the standard process.
