Article

Mechanical Performance Assessment of Internally-Defected Materials Manufactured Using Additive Manufacturing Technology †

by
Abdel-Hamid Ismail Mourad
1,2,*,
Amir Hussain Idrisi
1,
John Victor Christy
1,
Dinu Thomas Thekkuden
1,
Hamad Al Jassmi
3,
Abdallah M. Ghazal
1,
Mahmmoud M. Syam
1 and
Omar Darwish Ali Ahmed Al Qadi
1
1
Department of Mechanical Engineering, College of Engineering, United Arab Emirates University, Al-Ain P.O. Box. 15551, UAE
2
Mechanical Design Department, Faculty of Engineering, El Mataria, Helwan University, Cairo P.O. Box. 11718, Egypt
3
Department of Civil and Environmental Engineering, College of Engineering, United Arab Emirates University, Al-Ain P.O. Box. 15551, UAE
*
Author to whom correspondence should be addressed.
This paper is an extended version of our paper published in Mourad, A-.H.I.; Ghazal, A.M.; Syam, M.M.; Al Qadi, O.D.; Al Jassmi, H. Utilization of Additive Manufacturing in Evaluating the Performance of Internally-defected Materials. In Proceedings of the International Conference on Smart Engineering Materials (ICSEM 2018), Bucharest, Romania, 7–9 March 2018.
J. Manuf. Mater. Process. 2019, 3(3), 74; https://doi.org/10.3390/jmmp3030074
Submission received: 3 July 2019 / Revised: 9 August 2019 / Accepted: 17 August 2019 / Published: 20 August 2019

Abstract

:
Assessment of the mechanical performance of internally-defected components or struc-tures is of crucial importance to many industrial fields such as aerospace, automobile, marine, construction etc. Most of the studies available in the literature include only analytical or numerical solutions, due to difficulty in the manufacturing of a testing sample with a specific internal defect geometry for experimental evaluations. In this study, Fusion Deposition Modeling (FDM) was utilized in the 3D-printing of Polylactic Acid (PLA) samples with internal cracks, aiming to assess their impact on the samples’ mechanical performance. The defect geometry, orientation, location along the sample gauge length and the influence of the process parameters, such as the infill percentage and the material color, were investigated. The influence of the internal defects is more pronounced for a 100% infill rate if compared with a 50% infill rate as a consequence of the porosity. A maximum drop of ~14% in the peak load of defect-free samples was recorded due to the presence of the internal defect. Moreover, the additive color to the PLA material might contribute to the material strength. Generally, the findings of this work could open another door for utilizing the additive manufacturing in many research areas, with potential industrial applications relevant to the assessment of internally-defected materials.

1. Introduction

There is an urgent requirement for inspecting the mechanical properties of structures with inward deformities, particularly in applications where such little imperfections can cause massive failure. These days, the significant improvement in the manufacturing procedures and material science make a strong platform for the development of advanced technologies.
Additive Manufacturing (AM) or 3D printing is a procedure for creating three-dimensional (3D) objects from Computer-Aided Design (CAD models) through an additive procedure in which progressive layers accumulate consecutively [1]. 3D printing technologies have been considered nowadays for various applications in aerospace automotive, biomedical, digital art, architectural design, etc. [2,3,4].
As per the 2011 Wohler’s report, FDM presently has achieved 41.5% of the utilized 3D frameworks industrially [5]. A recent research showed that the FDM process, in combination with vapor smoothing and investment casting, was successfully employed to fabricate SS 316L (alloy steel) bio-compactable bio-implants to replace body parts like limbs, etc. These implants exhibited superior mechanical properties [6]. FDM has three key elements in the system, including a material feed mechanism, liquefier/print head and building surface. Two materials are commonly processed by such technology, namely Acrylonitrile Butadiene Styrene (ABS) and Polylactic Acid (PLA) as FDM filaments, which will be extruded through the liquefier to the printing nozzle. PLA is proven to be a stronger alternative than ABS for FDM technologies. However, certain researchers have worked on improving the strength of ABS by blending it with graphene. The ABS-Gr composites were developed using a Twin-Screw Extrusion (TSE) method [7]. Optimized composites displayed a good strength, but Kim et al. [8] reported that PLA has a higher tensile strength as compared to ABS. Evaluating or improving the mechanical properties of AM-printed products was the main focus of some researches where these products still show weaker properties than those manufactured through conventional manufacturing processes [8,9,10,11].
The effect of process parameters on the mechanical properties of the 3D-printed samples has been extensively investigated in recent researches. Letcher and Waytashek [12] have tested the 3D-printed PLA material of different raster angles (0°, 45° and 90°) under tension, flexural and fatigue loadings, in order to evaluate the material’s properties. The tensile tests revealed that the 45° raster angle resulted in the strongest fabricated samples. However, the flexural testing showed that the raster angle of 0° resulted in the highest bending stress among the tested samples. In contrast to the above finding, Harris et al. [13] observed that the 0° raster angle was effective in imparting strength to the samples. As far as the fatigue testing results were concerned, both 0° and 45° raster angles resulted in almost similar behavior that was better than the one attained at 90°. The influence of the PLA color (i.e., natural, white, blue, gray and black) on the mechanical properties of the material have been studied by Wittbrodt et al. [14]. The samples were prepared at a 100% infill rate. The highest strength occurred for natural color, whereas the lowest one was attained by the gray color. It was suggested that multiple test geometries should be tested to evaluate the strength of 3D-printed samples [15,16]. The effect of infill percentage (0 to 100%), infill orientation (rectilinear and hexagonal) and strain rate (up to 15 mm/s) on the mechanical performance of ABS and PLA material have been investigated by Farbman et al. [17]. It was concluded that higher infill percentages result in stronger samples. Moreover, the comparison between the two infill patterns adopted in this study show that hexagonal infill pattern results in stiffer and stronger samples, as compared to the rectilinear arrangement. Void formation due to insufficient infill rates were studied by researchers [18], who have considered the void formations to be a main processing challenge in the FDM process with less infill density.
Apart from the process parameters, the mechanical characteristics are also affected by the presence of defects. Zeltmann et al. [19] have created a square cross-sectional embedded defect in “Vero Clear” material using a contaminant “Tango Black Plus” as a relatively weak material. Three sizes of the defect (i.e., 150   μ m, 250 μm and 500 μ m) have been tested. The effect of the embedded defect was not pronounced due to the material ductility [20,21,22,23,24,25,26,27,28]. The fracture performance and characteristics of the material influenced by many factors, such as the initial fatigue pre-crack creation, before testing the samples to evaluate its fracture toughness or study the stable crack growth behavior [29,30]. The results could be misleading for some important parameters such as initiation load, instability load, range of stable crack growth, etc., in case of imprecise dimensions of the pre-crack. Using the 3D printing the initial crack length can be created accurately, eliminating all of these discrepancies in the results [23,24,25,26,27,28].
Researchers have worked on investigating variable process effects on the deformation behavior of 3D-modeled specimens formed using the FDM process. Study of crack propagation gave light to the fracture behavior and its variation with the process parameters, like infill rate density and layer thickness [31]. In addition, the value of the fracture toughness or the critical stress intensity factor (KIC) depends upon the fatigue pre-crack length. Using 3D printing, the number of trials to validate the KIC value can be reduced due to the formation of precise pre-crack length. The porosity can be reduced using metallic materials instead of PLA material, and the effect of the geometry on the surface or internal defects can be evaluated precisely [32]. Sometimes, the EDM wire cutting techniques were used to create the initial cracks in absence of pre-cracking facility. The fine crack cannot be produced using the EDM wire cutting technique, as the produced crack would be almost double the diameter of the wire. This issue may be resolved using wire with a very small diameter [22]. In addition, the crack created with a straight front may cause many problems with crack propagations. 3D printing can create an initial crack with a notch similar to the chevron notch, which will allow the crack to initiate at a point [32]. The research work on the effect of materials’ internal defects on their fracture performance is very lacking. Researchers have used a 3D model of cracked skeletal bone in order to reconstruct complex defects and to carry a virtual analysis on it. These complex cracked specimens of bones have helped doctors to carry out successful surgery at a later stage [33]. Patterson [15] studied the impact of the Mode 1 type of crack and its propagation in 3D-printed PLA samples. The major objective of the study was to investigate the crack velocity and stability of PLA under a Mode 1 type of failure in which the tensile stress acts normal to the plane of the crack. This work also revealed that there were very few studies concerned with this area.
In light of the above literature, it can be concluded that there is very limited work on utilizing 3D printing in evaluating the mechanical properties of defected material or a product. Therefore, the main objective of this work is not to manufacture a complex product or detect defects in AM products with complex internal structures, but to utilize the AM technology in assessing the mechanical integrity of an internally-defected component and to check its potential usage in this research area. In this work, the effect of elliptical internal defects on the mechanical integrity of the 3D-printed PLA samples is investigated. Different defect orientations (0°, 30°, 45° and 90°) and locations along the sample gauge length (10 mm and 20 mm distance from the center) have been considered. In addition, this study aims to examine the effect of printing parameters, such as the infill rate and the material color, on the mechanical performance of defected material.

2. Materials and Methods

The commercially-available Ultimaker 2 Polylactic Acid (PLA) filaments (2.85 mm in diameter) were used in this study for the three-dimensional (3D) printing of the specimens using Fusion Deposition Modeling (FDM) [34,35]. It costs around USD 75 per roll (750 gms). The mechanical properties of PLA are given in Table 1.
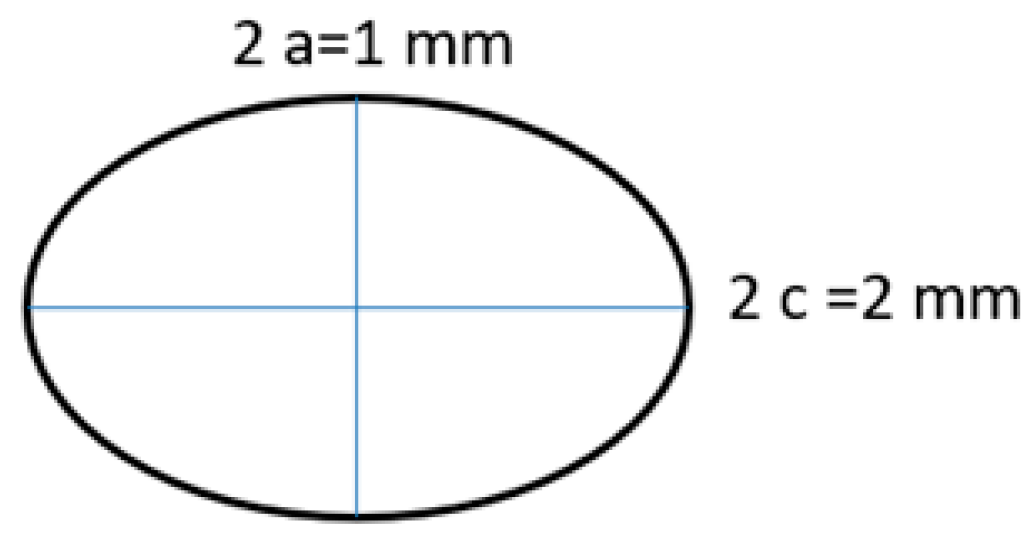
The standard for evaluating the mechanical properties of 3D-printed coupons is not available. Therefore, the ASTM D638 standard for testing the polymers has been followed for preparing the tensile specimens [37]. The dimensions of the standard tensile specimens and internal elliptical cracks are given in Figure 1 and Figure 2, respectively. The internally-cracked (elliptical crack dimensions: Minor diameter 2a = 1 mm, major diameter 2c = 2 mm) tensile specimens with dimensions aligned in different orientations were modeled using CATIA V5. The stereolithography (STL) file generated from the software was transferred to the 3D printing machine (Ultimaker 2) for fabricating the samples. The Ultimaker 2 has a 0.4 mm nozzle diameter that can provide a layer resolution of 40 microns to 200 microns. ‘CURA’ software is enabled in the 3D printer for controlling different process parameters (infill rate, infill percentage, raster angle, etc.), and to generate G codes.
Three sets of samples were experimented upon. The first set contains the samples with internal elliptical cracks oriented at 0°, 30°, 45° and 90°. The next set is designed to inspect the effect of internal elliptical cracks at a distance of 0 mm, 10 mm and 20 mm from the center along the sample central axis. In the third set, the size of the elliptical defect is doubled, and is oriented at 0°, 45° and 90°. Three specimens were tested for each case to ensure the repeatability of the results. The defect-free specimen results were considered as a reference.
The mechanical properties of the 3D-printed samples using FDM technology may depend upon the process parameters, such as PLA colors type, raster angle, printing layer thickness, feed rate and infill rate. The process parameters used in the present study to manufacture the PLA specimens are listed in Table 2.
Due to the variation of the PLA colors used in the present study, the feed rate (printing speed) for each color has been selected based on the recommended flow rate of extruding material. The feed rate of 50 mm/s was considered for the gray color, and an 80 mm/s feed rate was specified to extrude the green and natural (white) filaments. A raster angle of 45° and an extruding temperature of 228 °C were fixed during the fabrication process.
The PLA specimens were tested using the MTS universal testing machine equipped with 100 kN load cell and axial extensometer (MODEL 632, 25F-20) for strain measurements. The tests were conducted with an overhead speed of 0.25 mm/s at room temperature (300 K).
Fractured surfaces of the specimen were examined using a JEOL-JSM-6010LA scanning electron microscope (SEM). It can provide a resolution of 4 nm with a magnification power ranging from 5× up to 300,000×. Also, the device can handle a specimen size of up to 150 mm in diameter.

3. Results

3.1. Effect of Internal Defects

The influence of internal elliptical defect orientations (0°, 30°, 45° and 90°) on the mechanical properties were investigated. Samples with three different colors (white, gray and green) were used in this study. For the first set of specimens, the elliptical defect was placed at the center of the gauge length in all samples. In another set of experiments, specimens with internal defects located at 10 mm and 20 mm distance along the gauge length from the center were also tested. Since the cross-sectional area of the sample at the internal defect position is dependent on the defect orientation, it is more convenient to discuss the maximum load that the material can sustain prior failure, rather than the ultimate tensile strength [11].
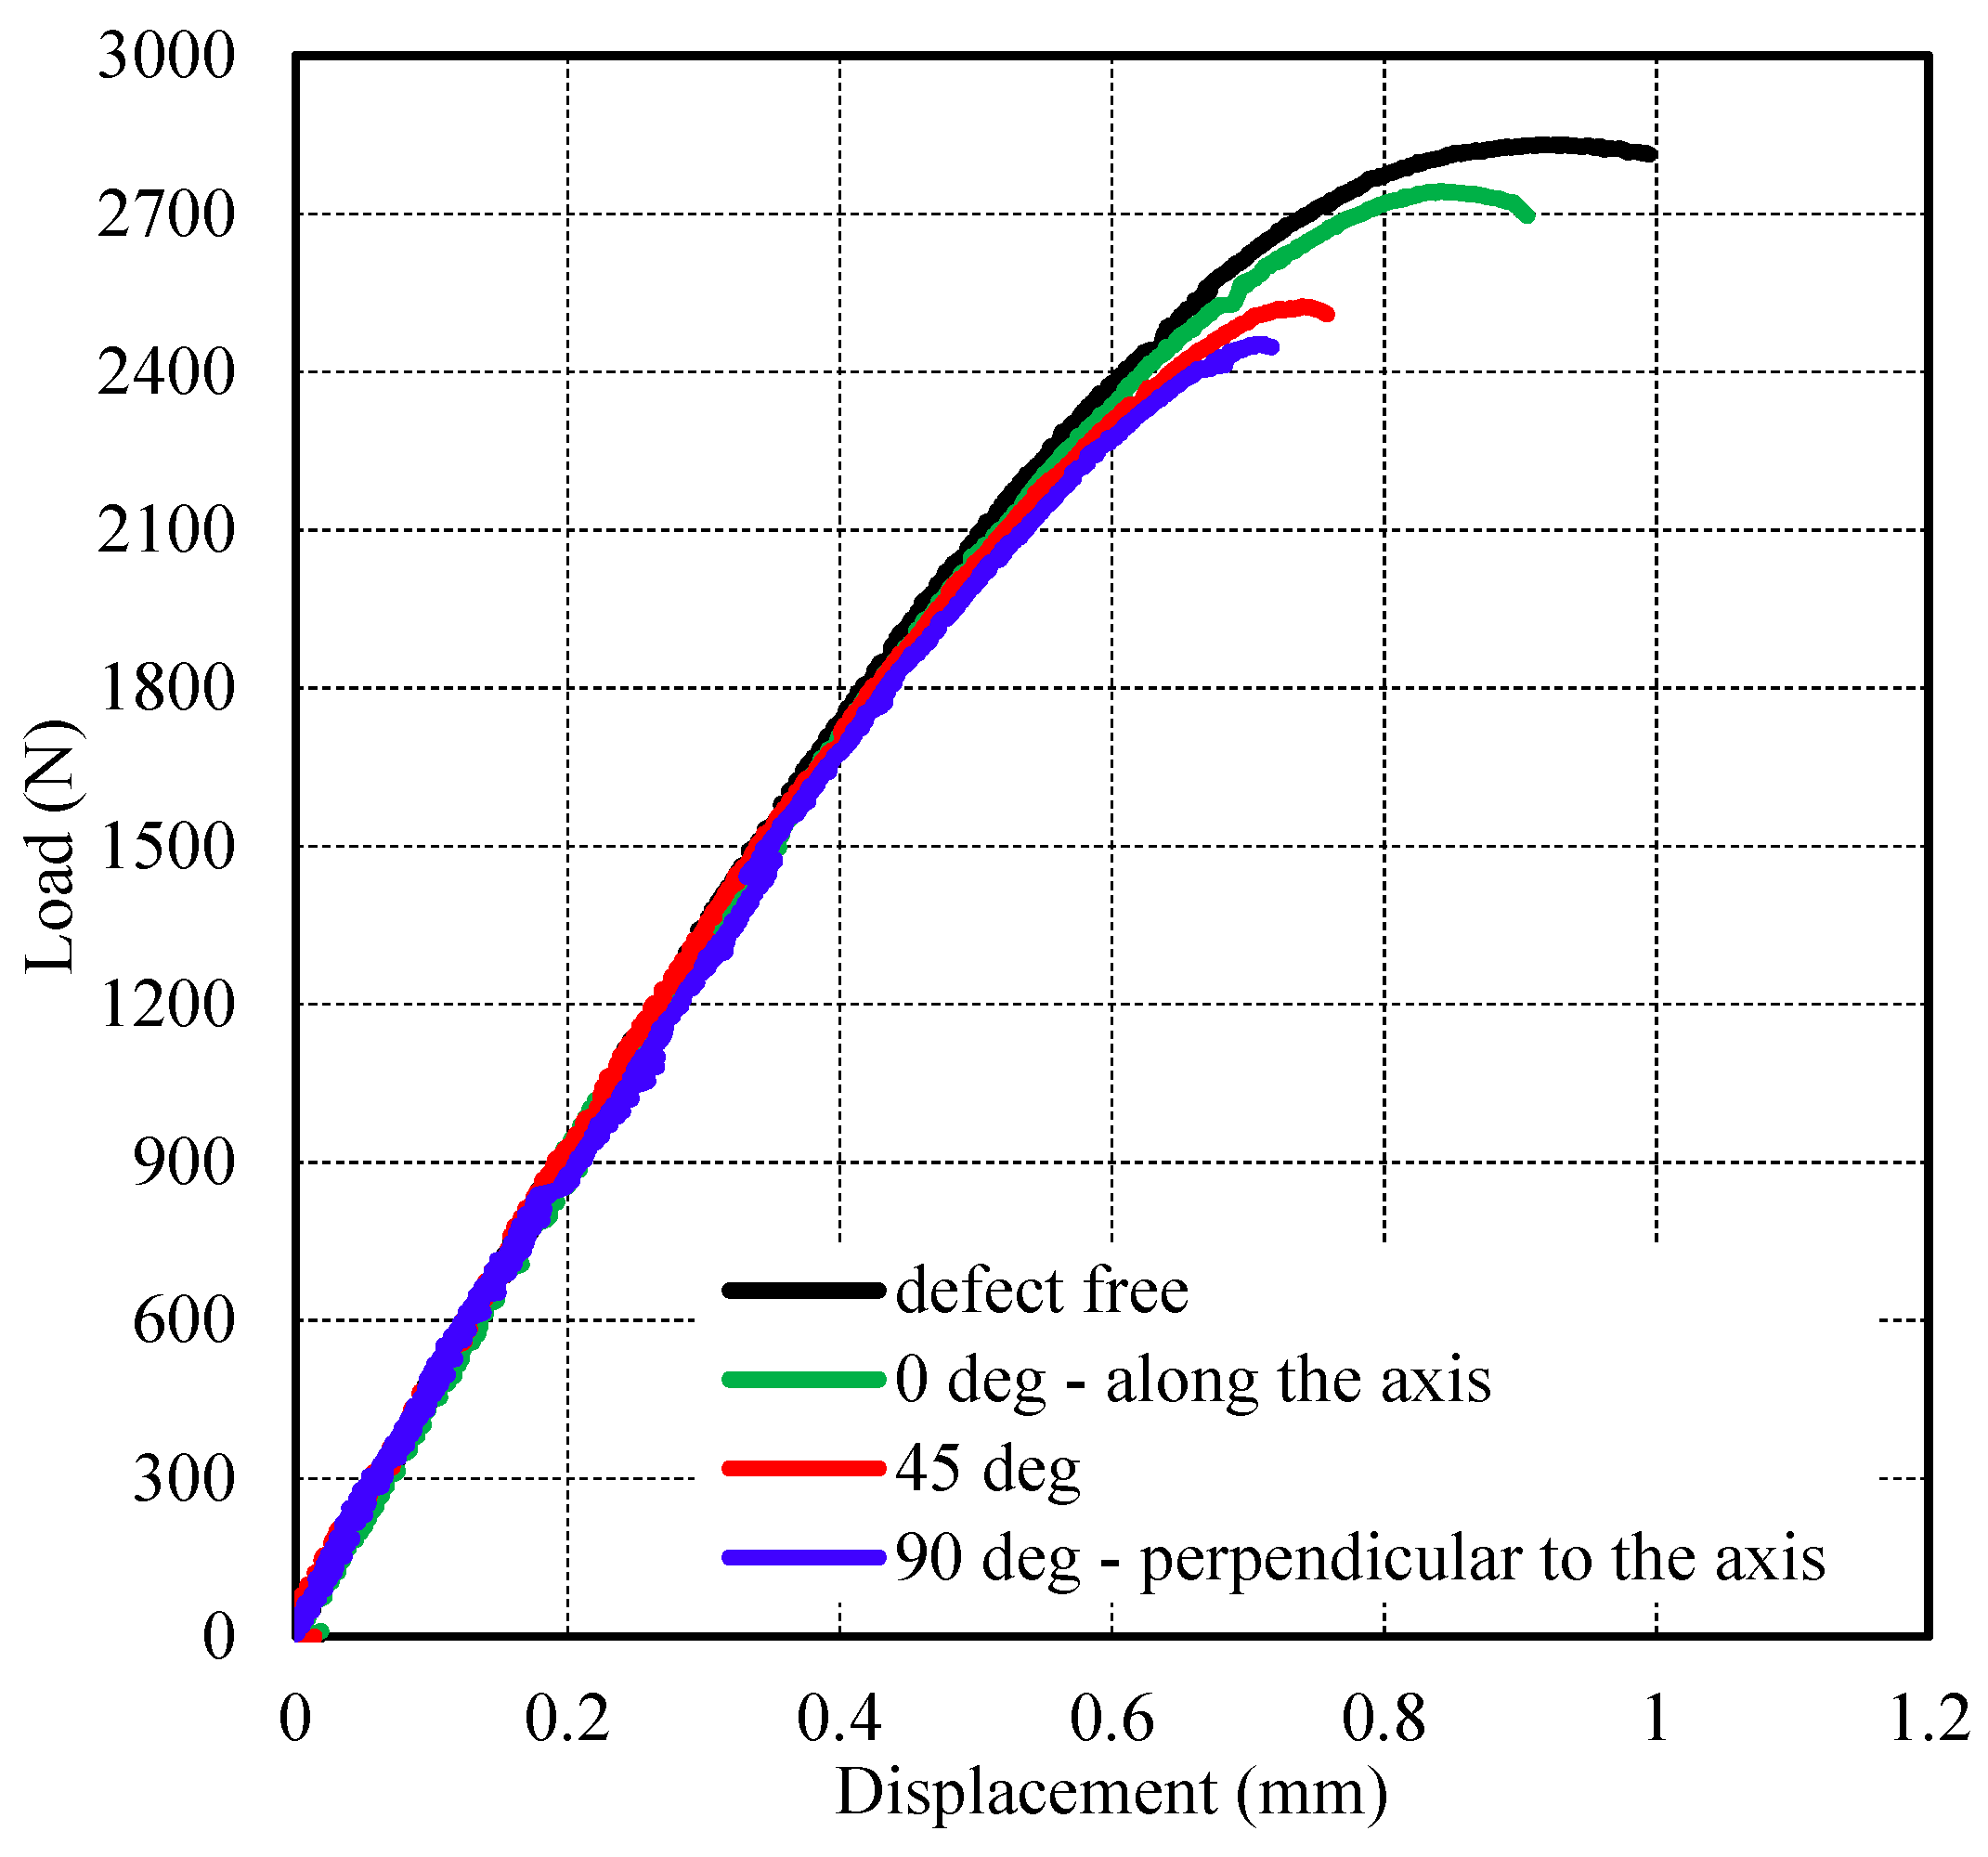
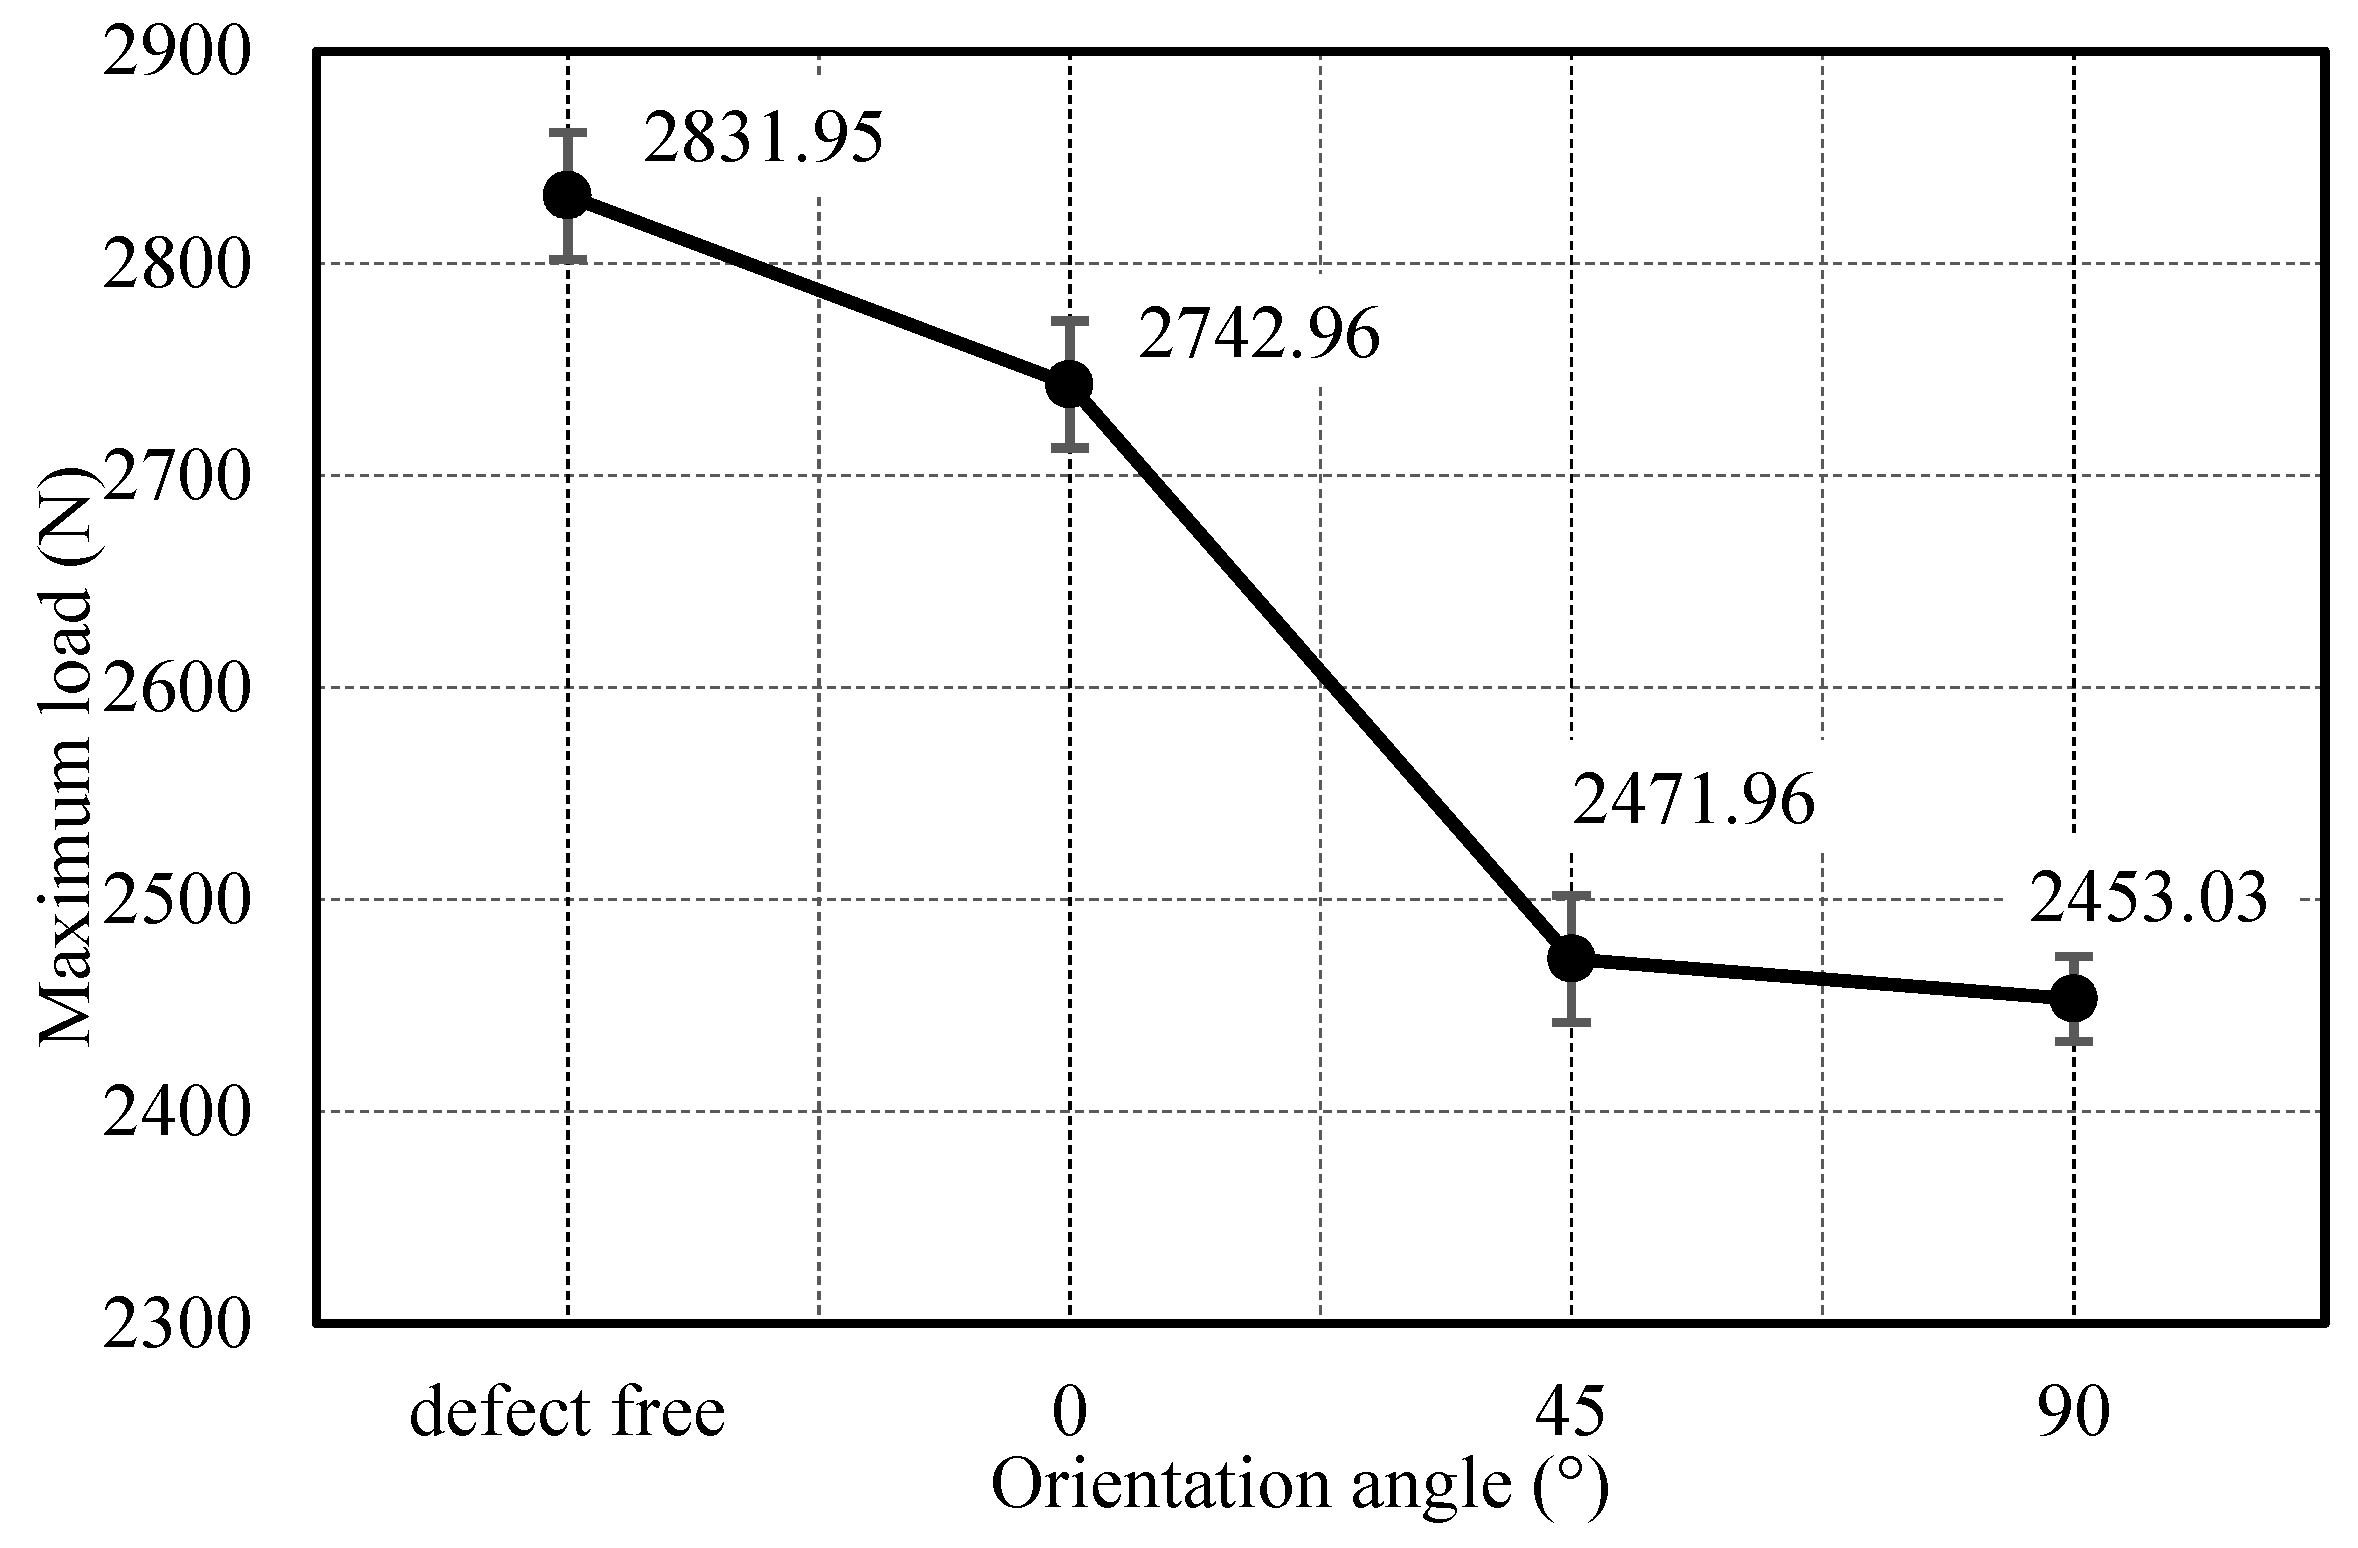
The load-displacement curves for green set of samples with different defect orientations are demonstrated in Figure 3. The defect is located at the center of the gauge length, and the additive color used is green. As depicted in Figure 3, the load-displacement curves for all tested samples have the same trend. The curve can be divided into three stages. In the 1st stage, the curves vary according to a linear relationship (i.e., constant stiffness or slope). However, the stiffness starts to decline slightly during the 2nd region, while the reduction becomes more pronounced in the 3rd stage. As expected, the maximum load of the sample was reduced with the defect orientation angle. The highest load is for the defect-free sample followed by the samples with defect along the axis, 0°, and the lowest is for the samples with a defect perpendicular to the axis, 90°. Figure 4 demonstrates the variation of the maximum load with the different defect orientations. The peak load was 2832 N for the defect-free specimen, but it reduced by 13.4% for the sample with the defect oriented perpendicular (90°) to the axis.
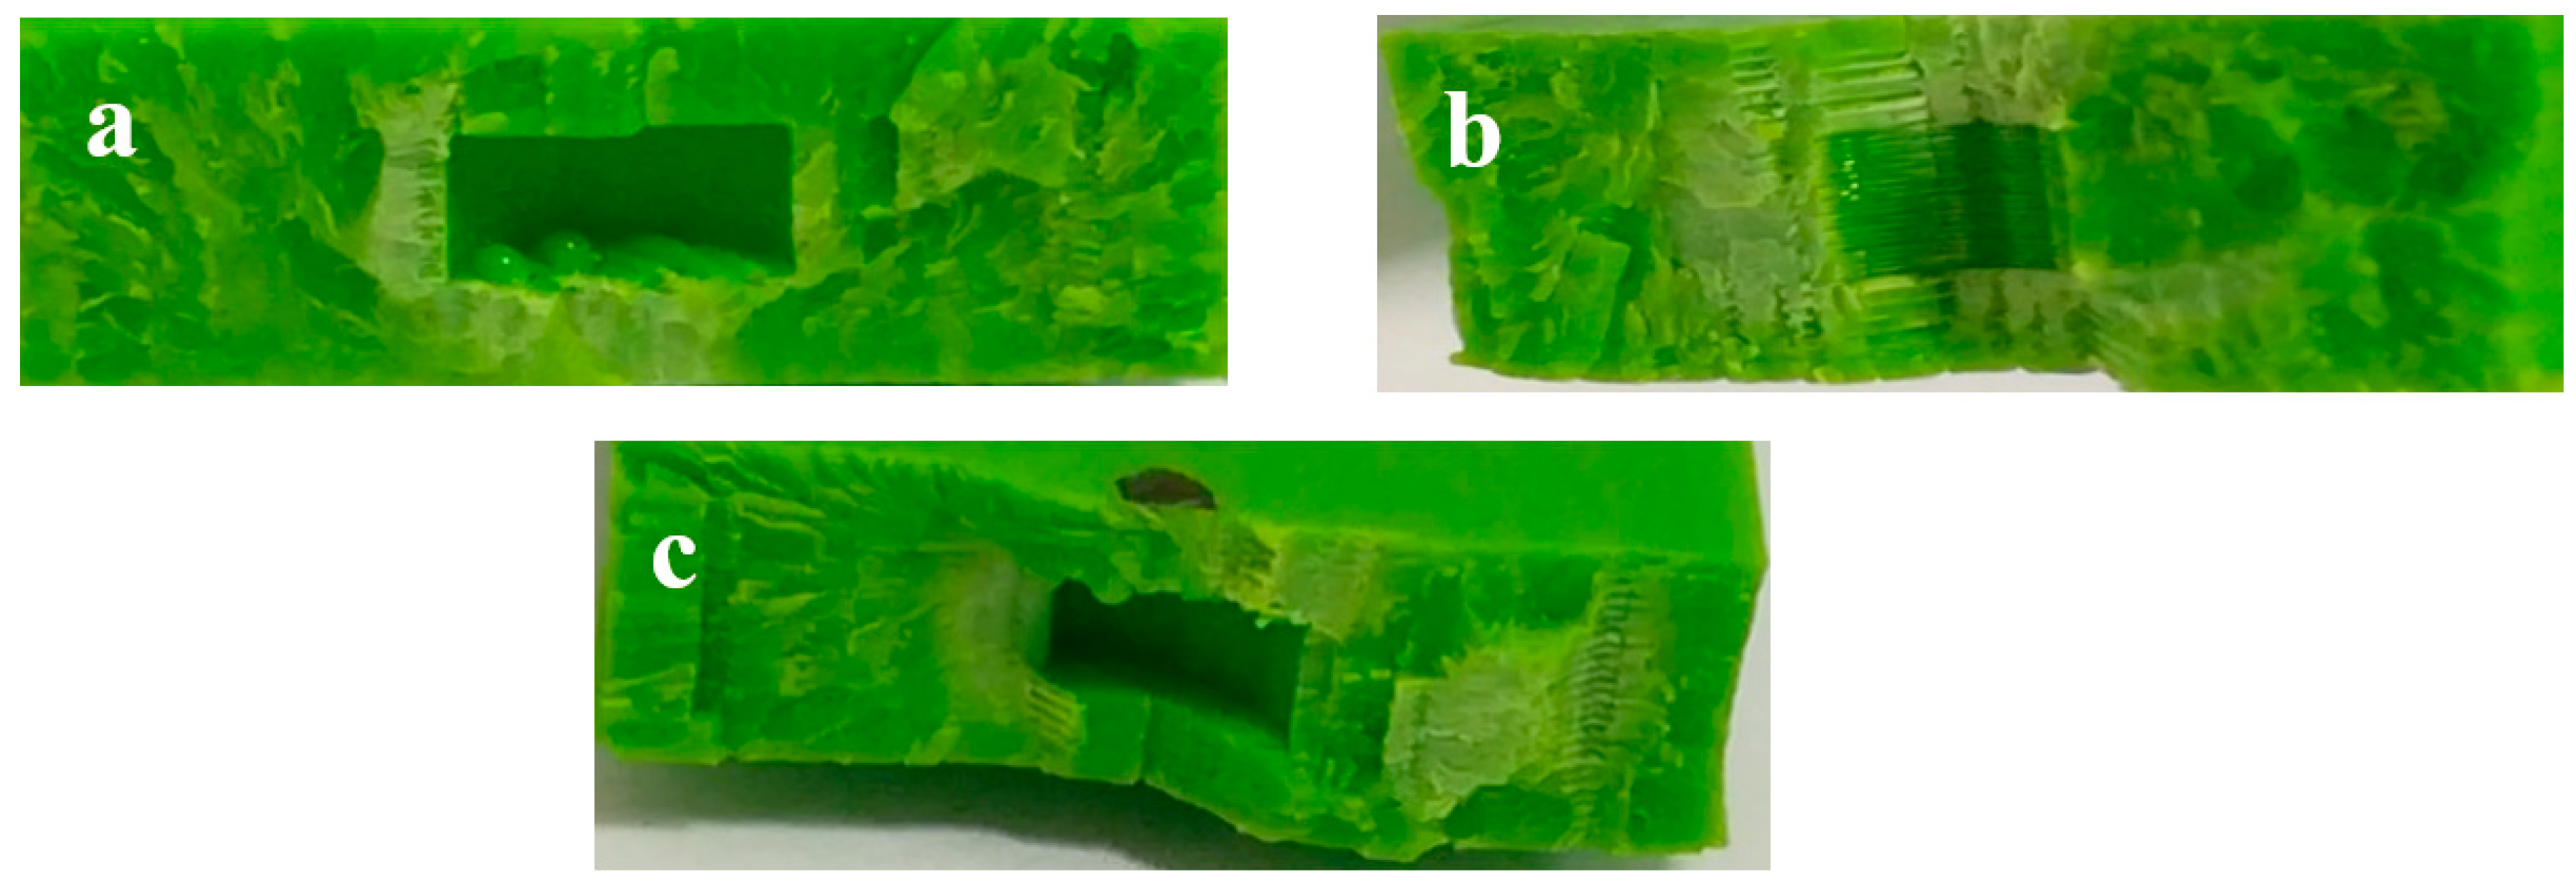
This behavior is attained, since the rotation of crack perpendicular to the axis produces higher normal opening stress on the defect. It was observed that the samples with internal defects were all fractured at the center of the gauge length, where the defect was present, as shown in Figure 5.
The fractured surfaces of the specimen with the crack oriented at different angles are presented in Figure 6. The fracture surface topography reveals that the material is porous-free with a smooth appearance. This may be the reason for obtaining the expected trend and the reproducibility of the results. These pieces of evidence and observations show that 3D printing technology can be utilized to manufacture not only precise samples geometry, but also ones with good quality. These samples can be used for assessing the mechanical performance of internally-defected materials.
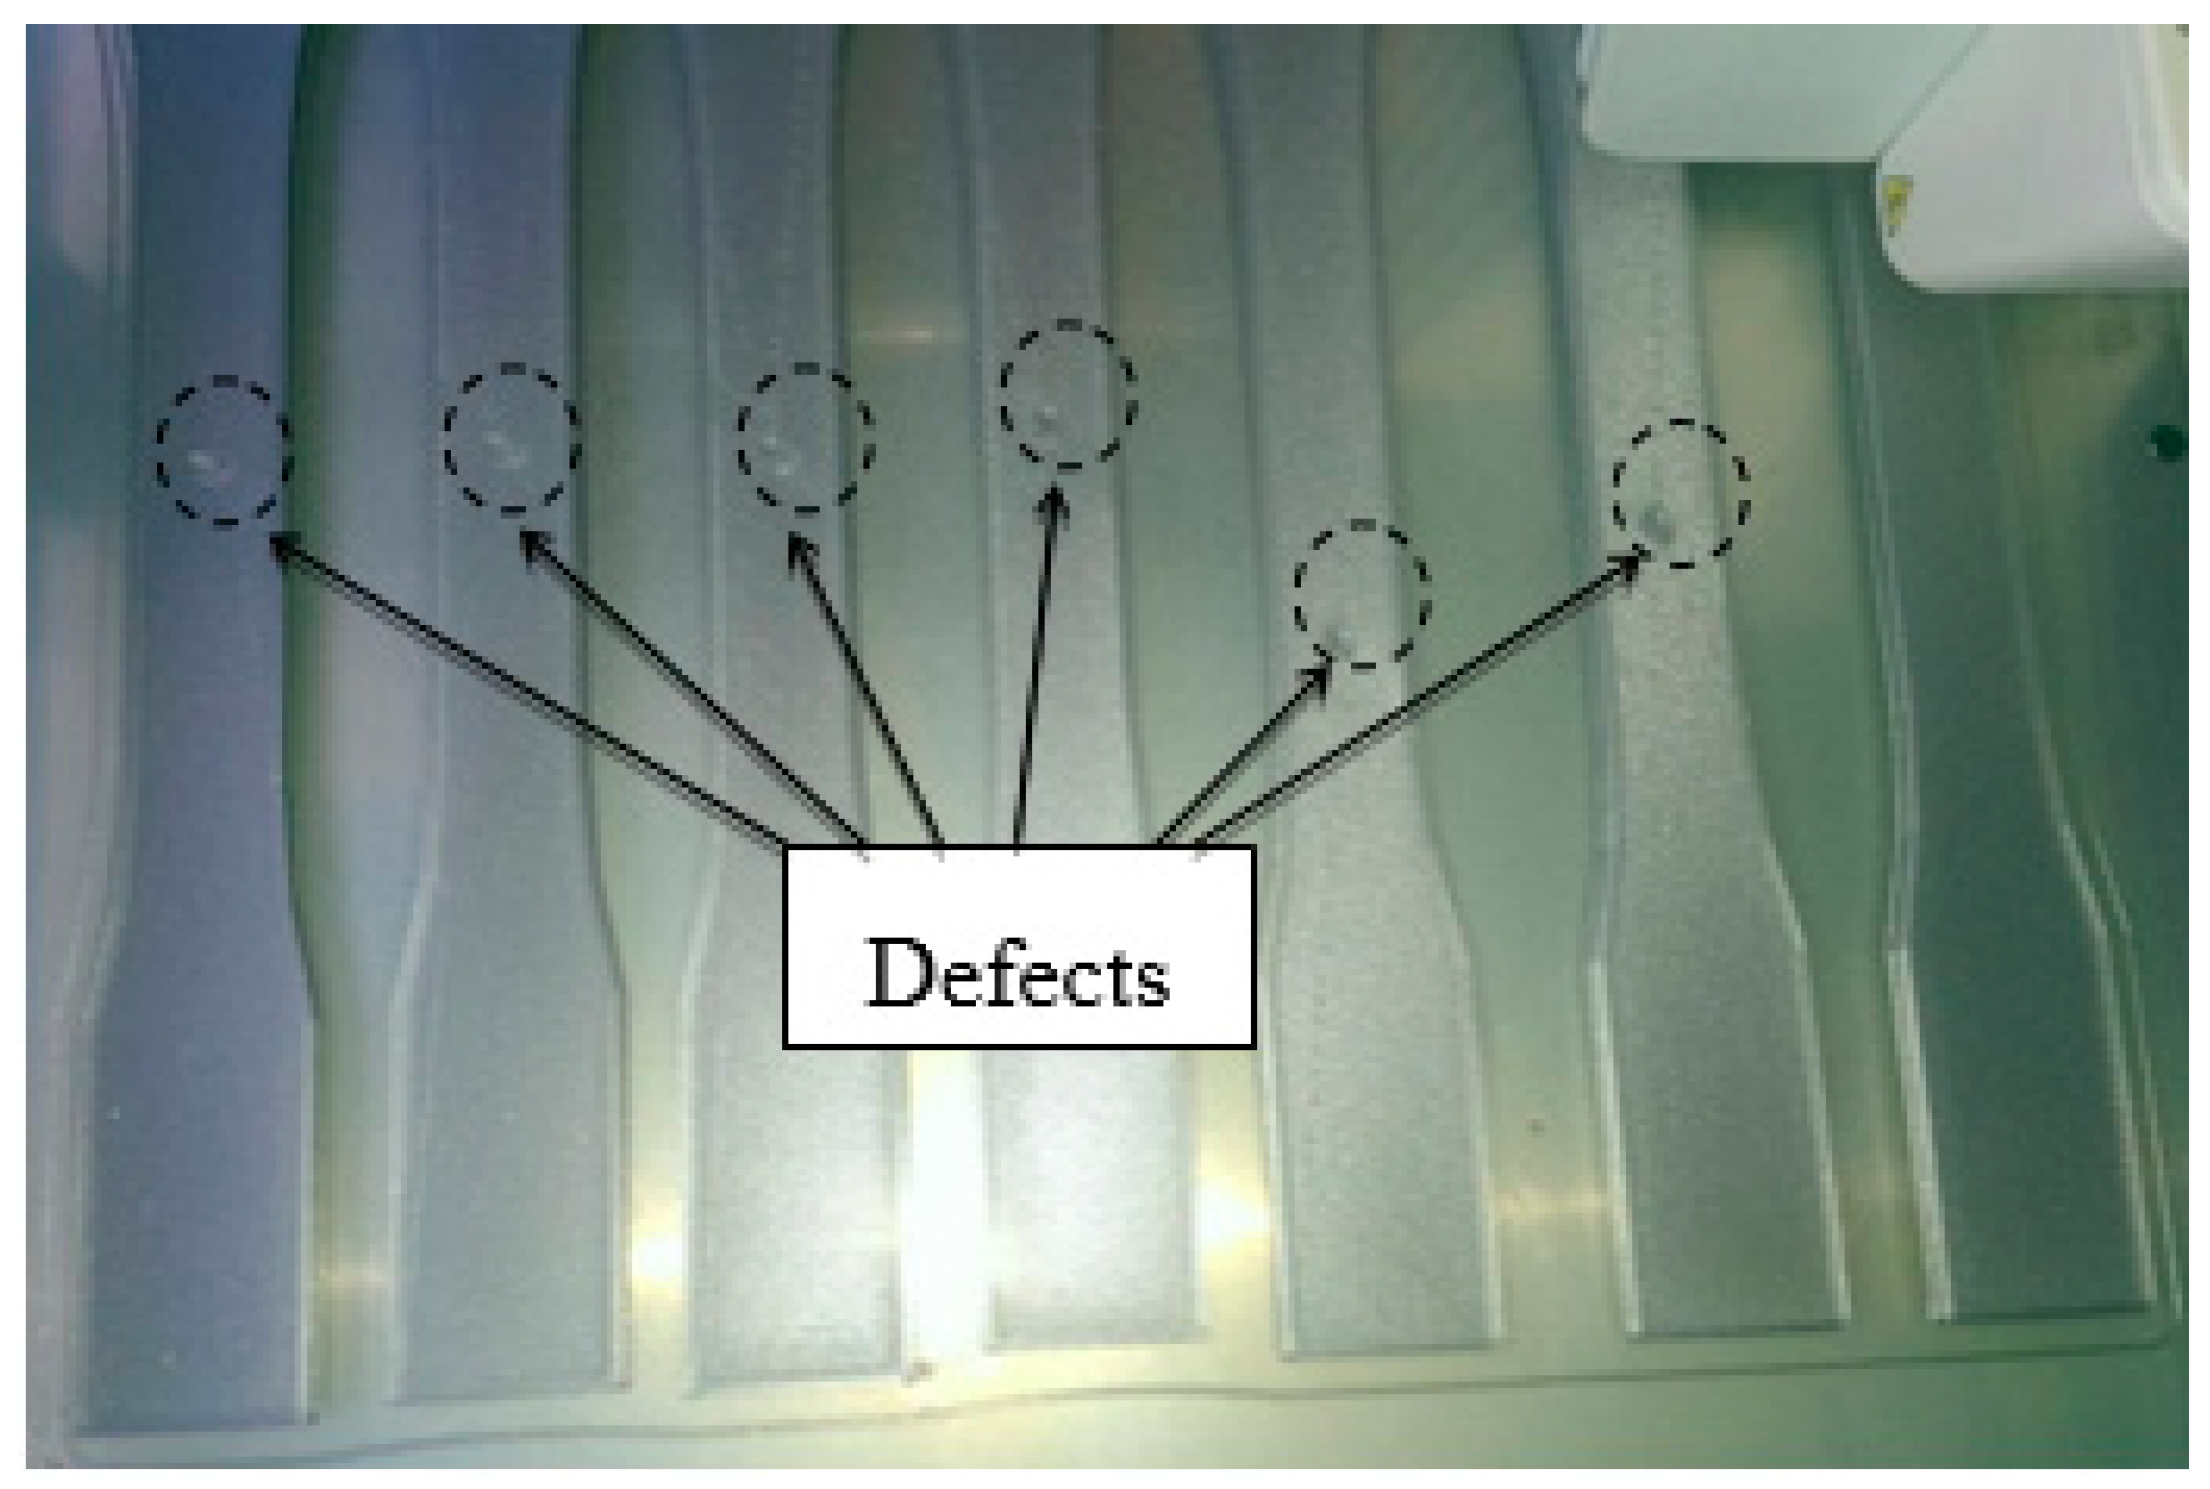
The dimension of the defects in gray samples was half of the defect dimension in green samples. The images of gray samples, shown in Figure 7, were captured during the 3D printing process.
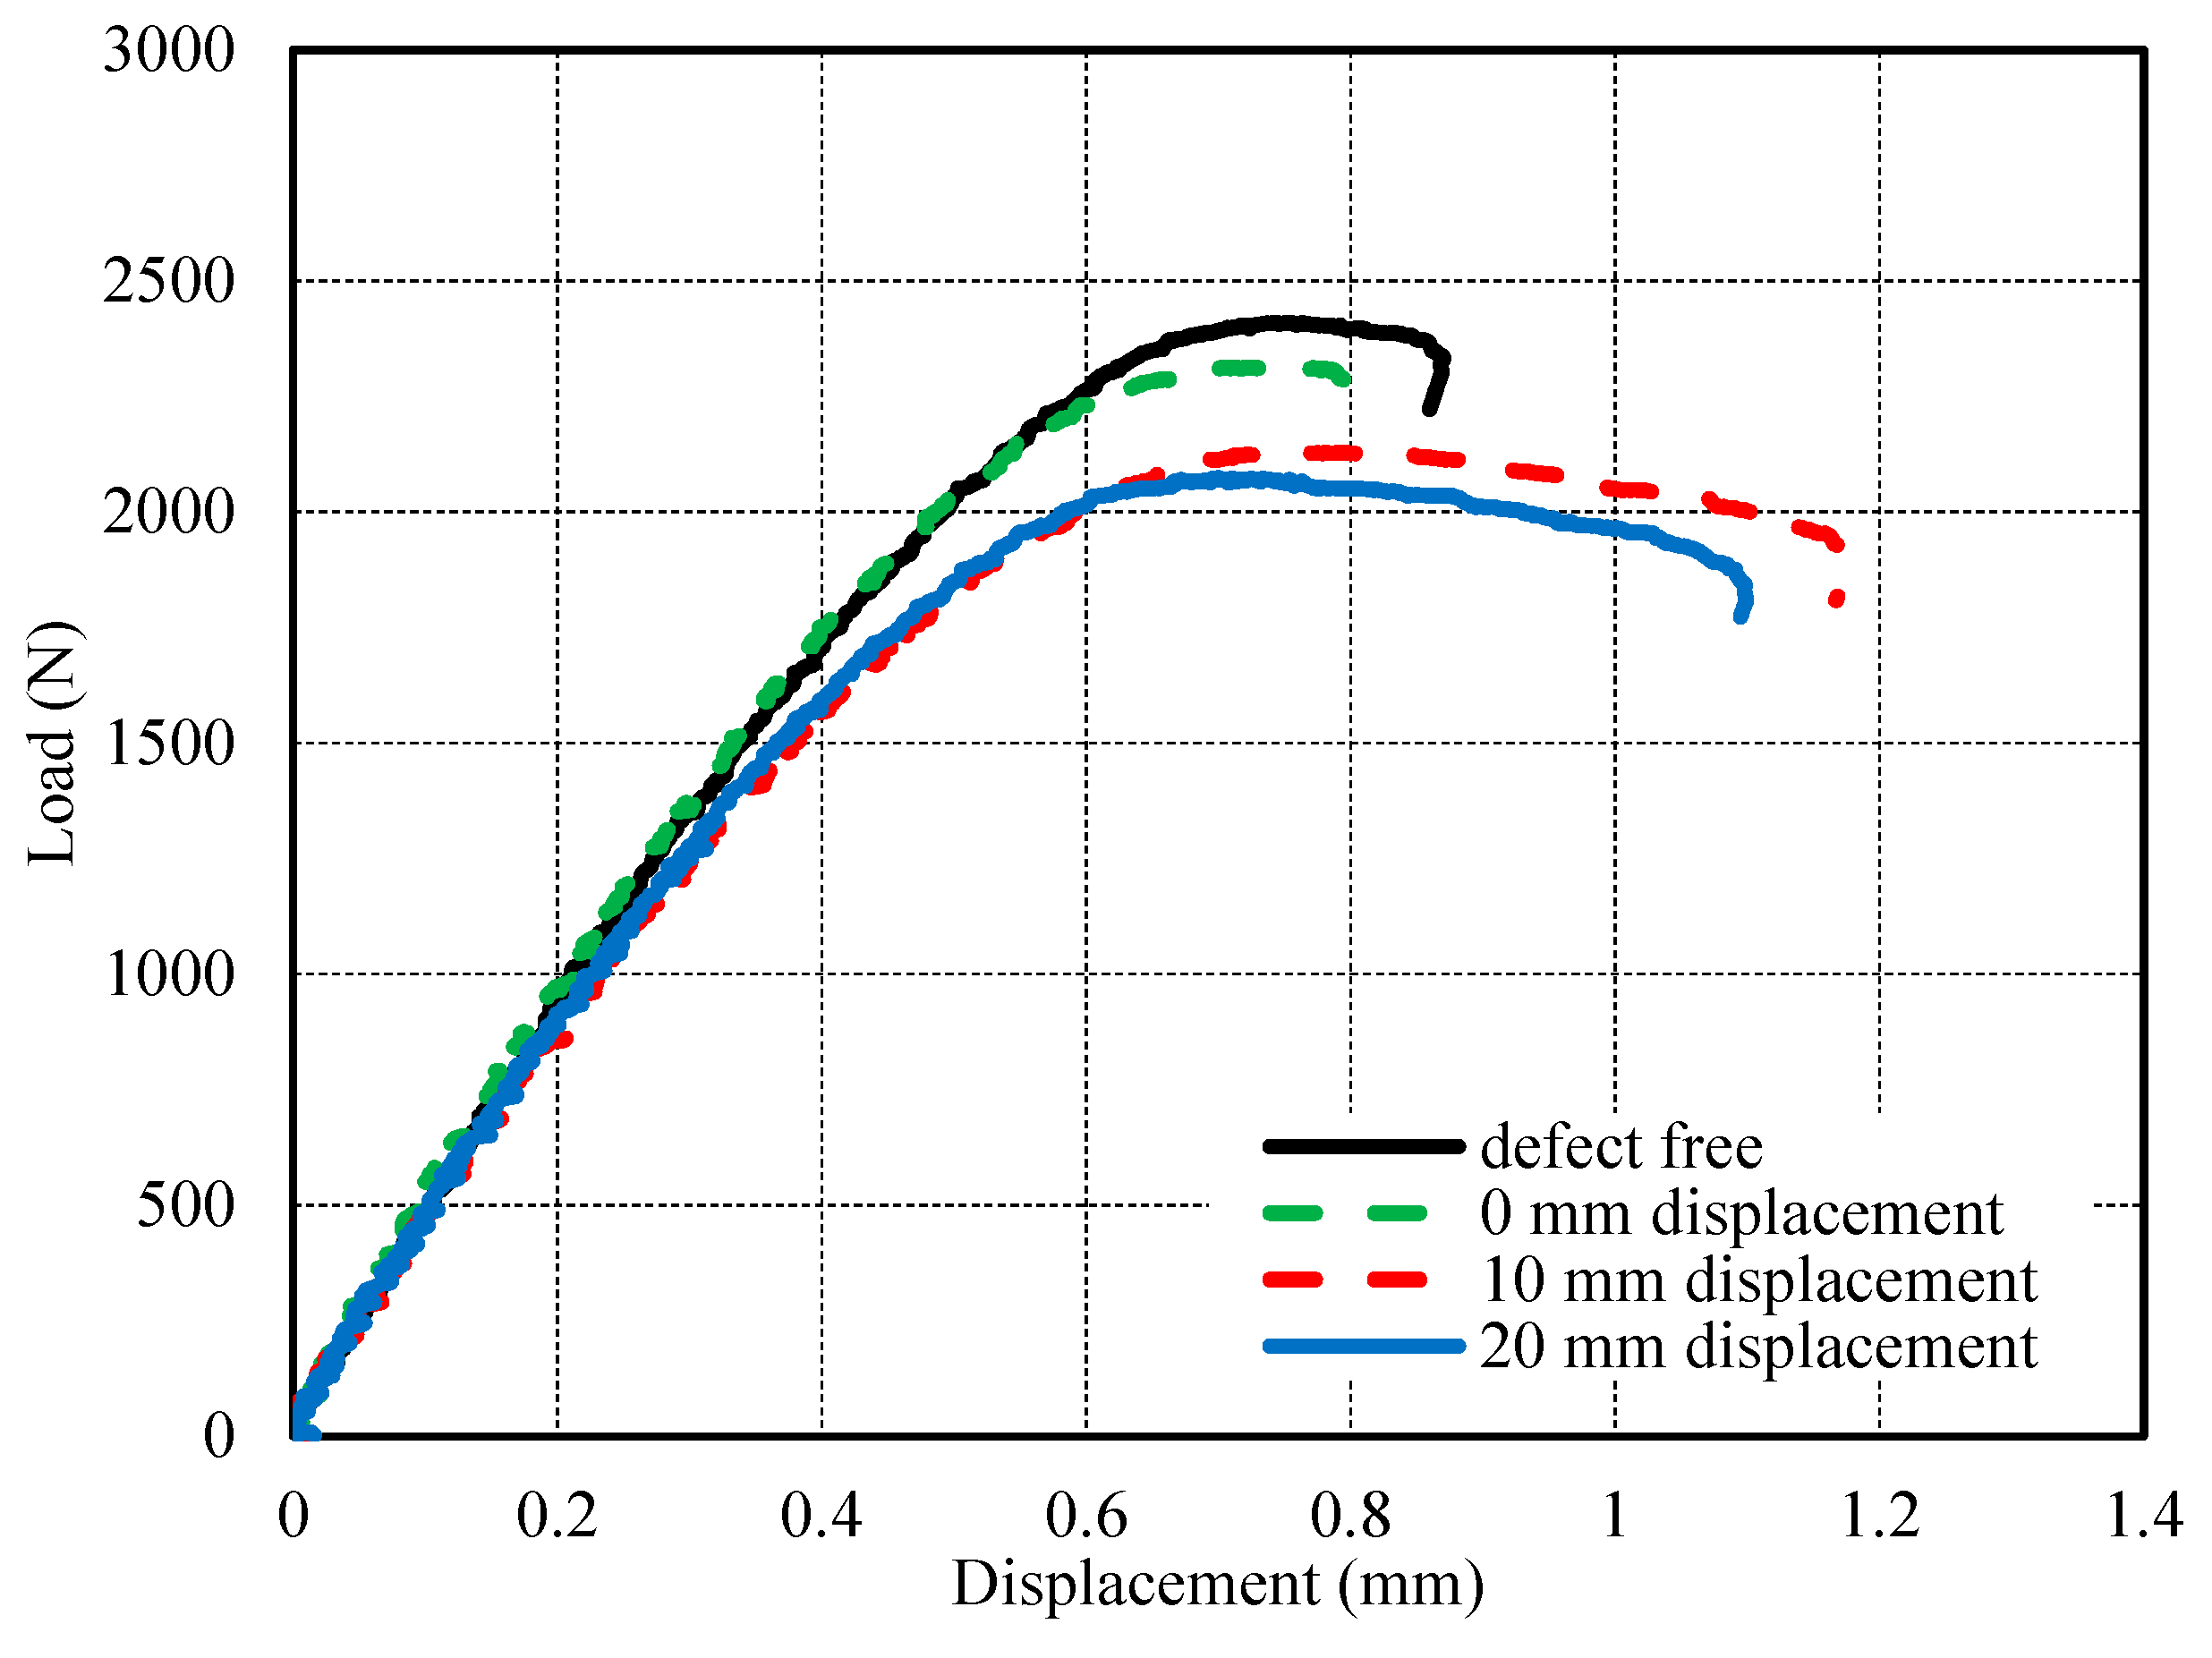
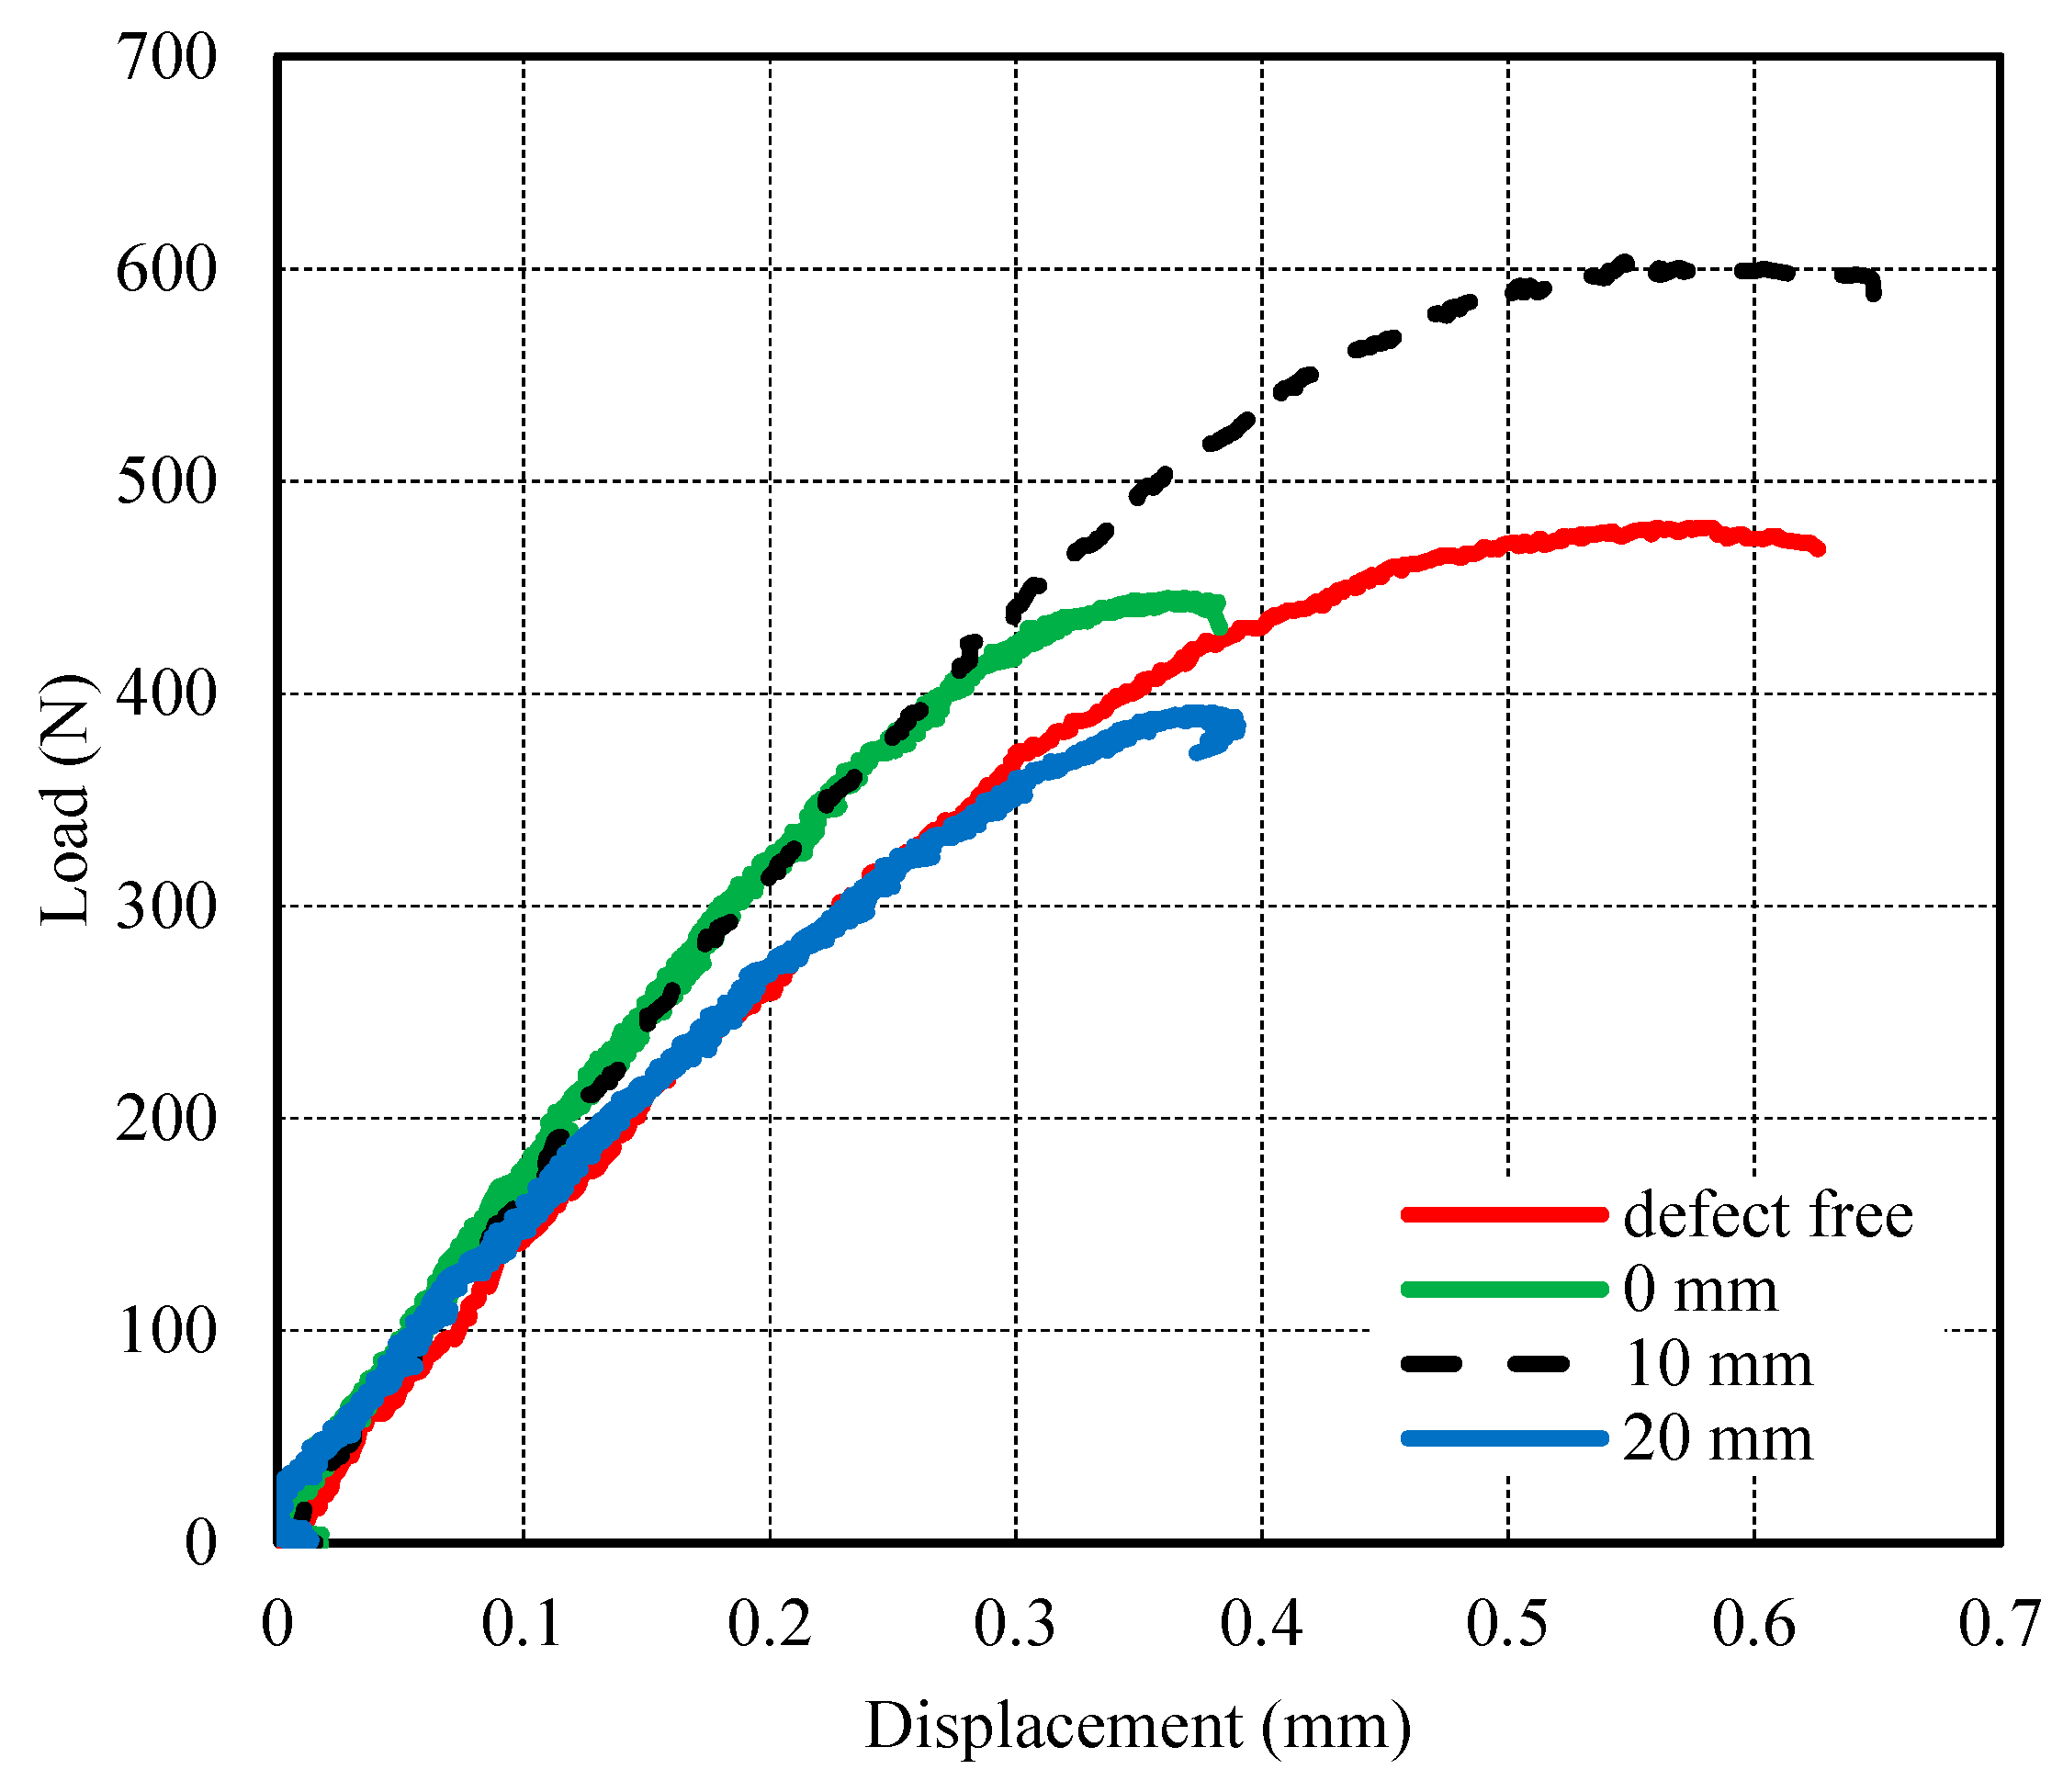
Figure 8 shows the load-displacement curves of gray samples with different defect locations. The effect of the defect location in the force-displacement curves is evident, as presented in Figure 8. Similar to the green set, this figure can be divided into three stages. In the 1st one, all cases had almost a linear relationship (constant slope or stiffness). However, in the 2nd stage, the curves start to deviate from their linear relationship with a minor reduction in the slope/stiffness. The reduction becomes more evident at the 3rd stage prior to failure. Figure 9 demonstrates the variation of the load-bearing capacity of the sample with the defect location. It can be seen that the peak load reduced with an increase in the defect location distance from the center. The maximum reduction obtained for the case of 20 mm displacement with a percentage reduction of almost 14%. This means that the maximum sustained load reduces as the defect location comes closer to the shoulder and causes an increase in the stress concentration factor. More analysis is demanded to confirm this observation.
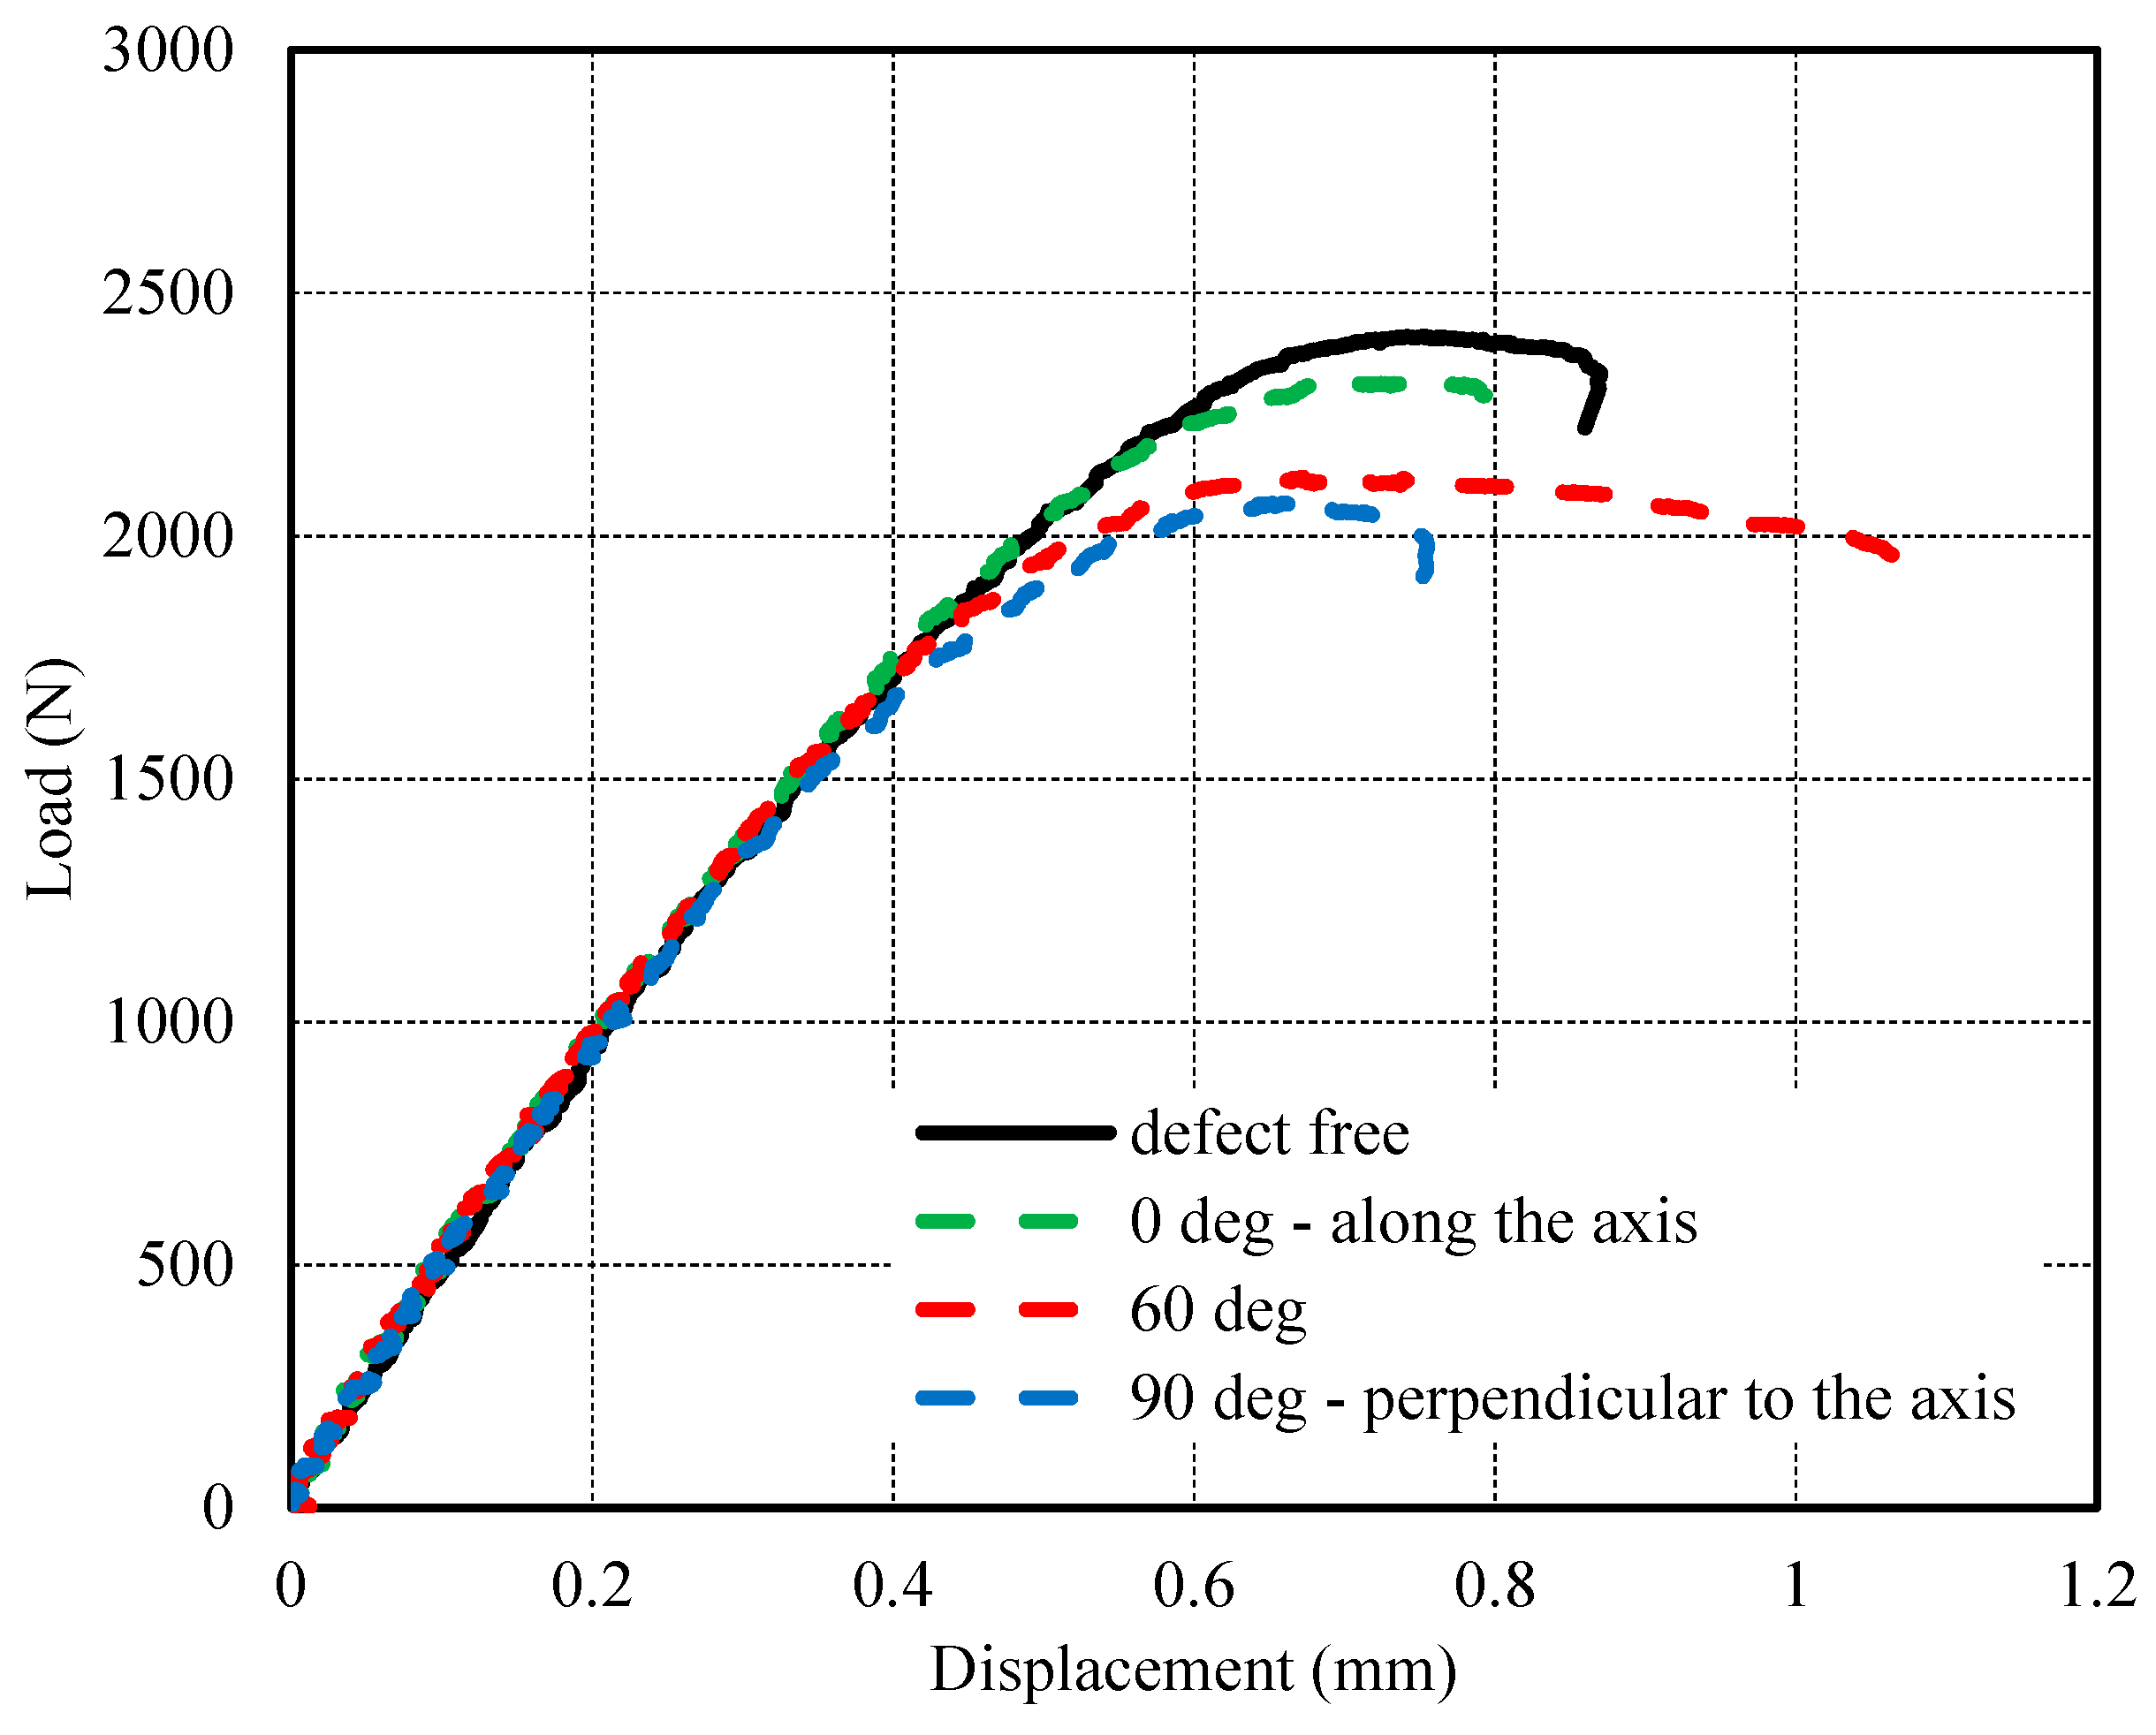
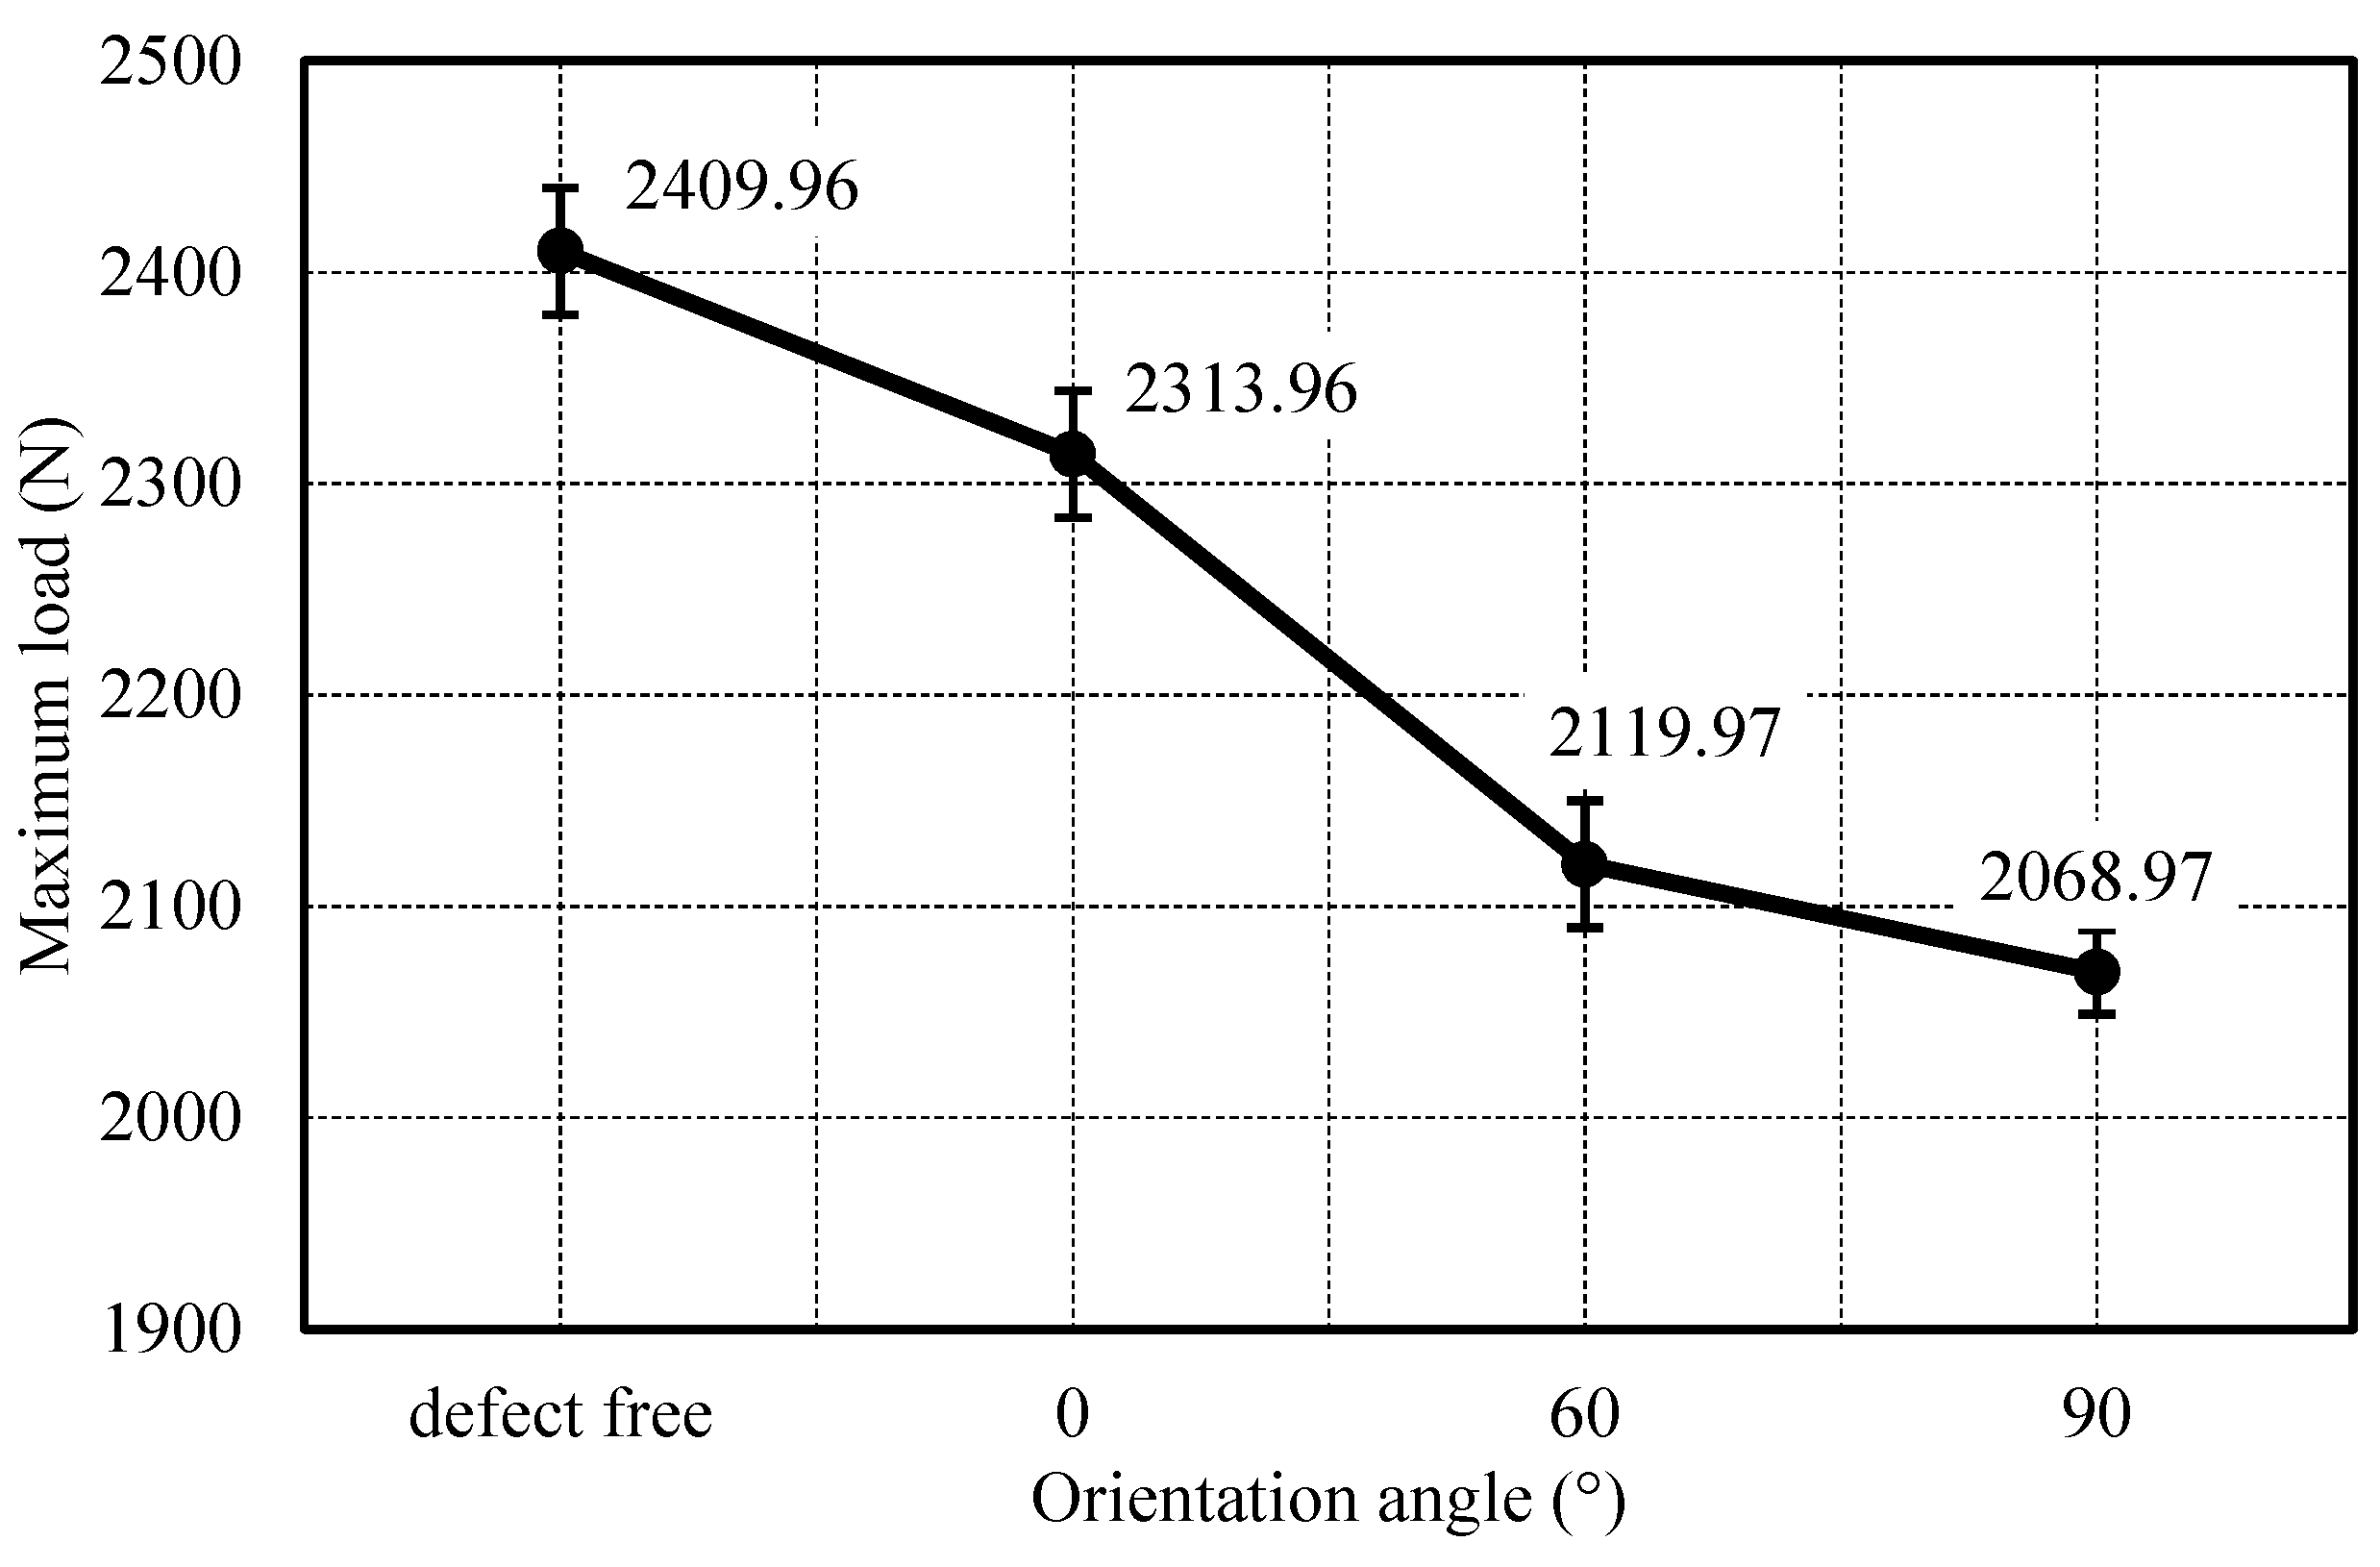
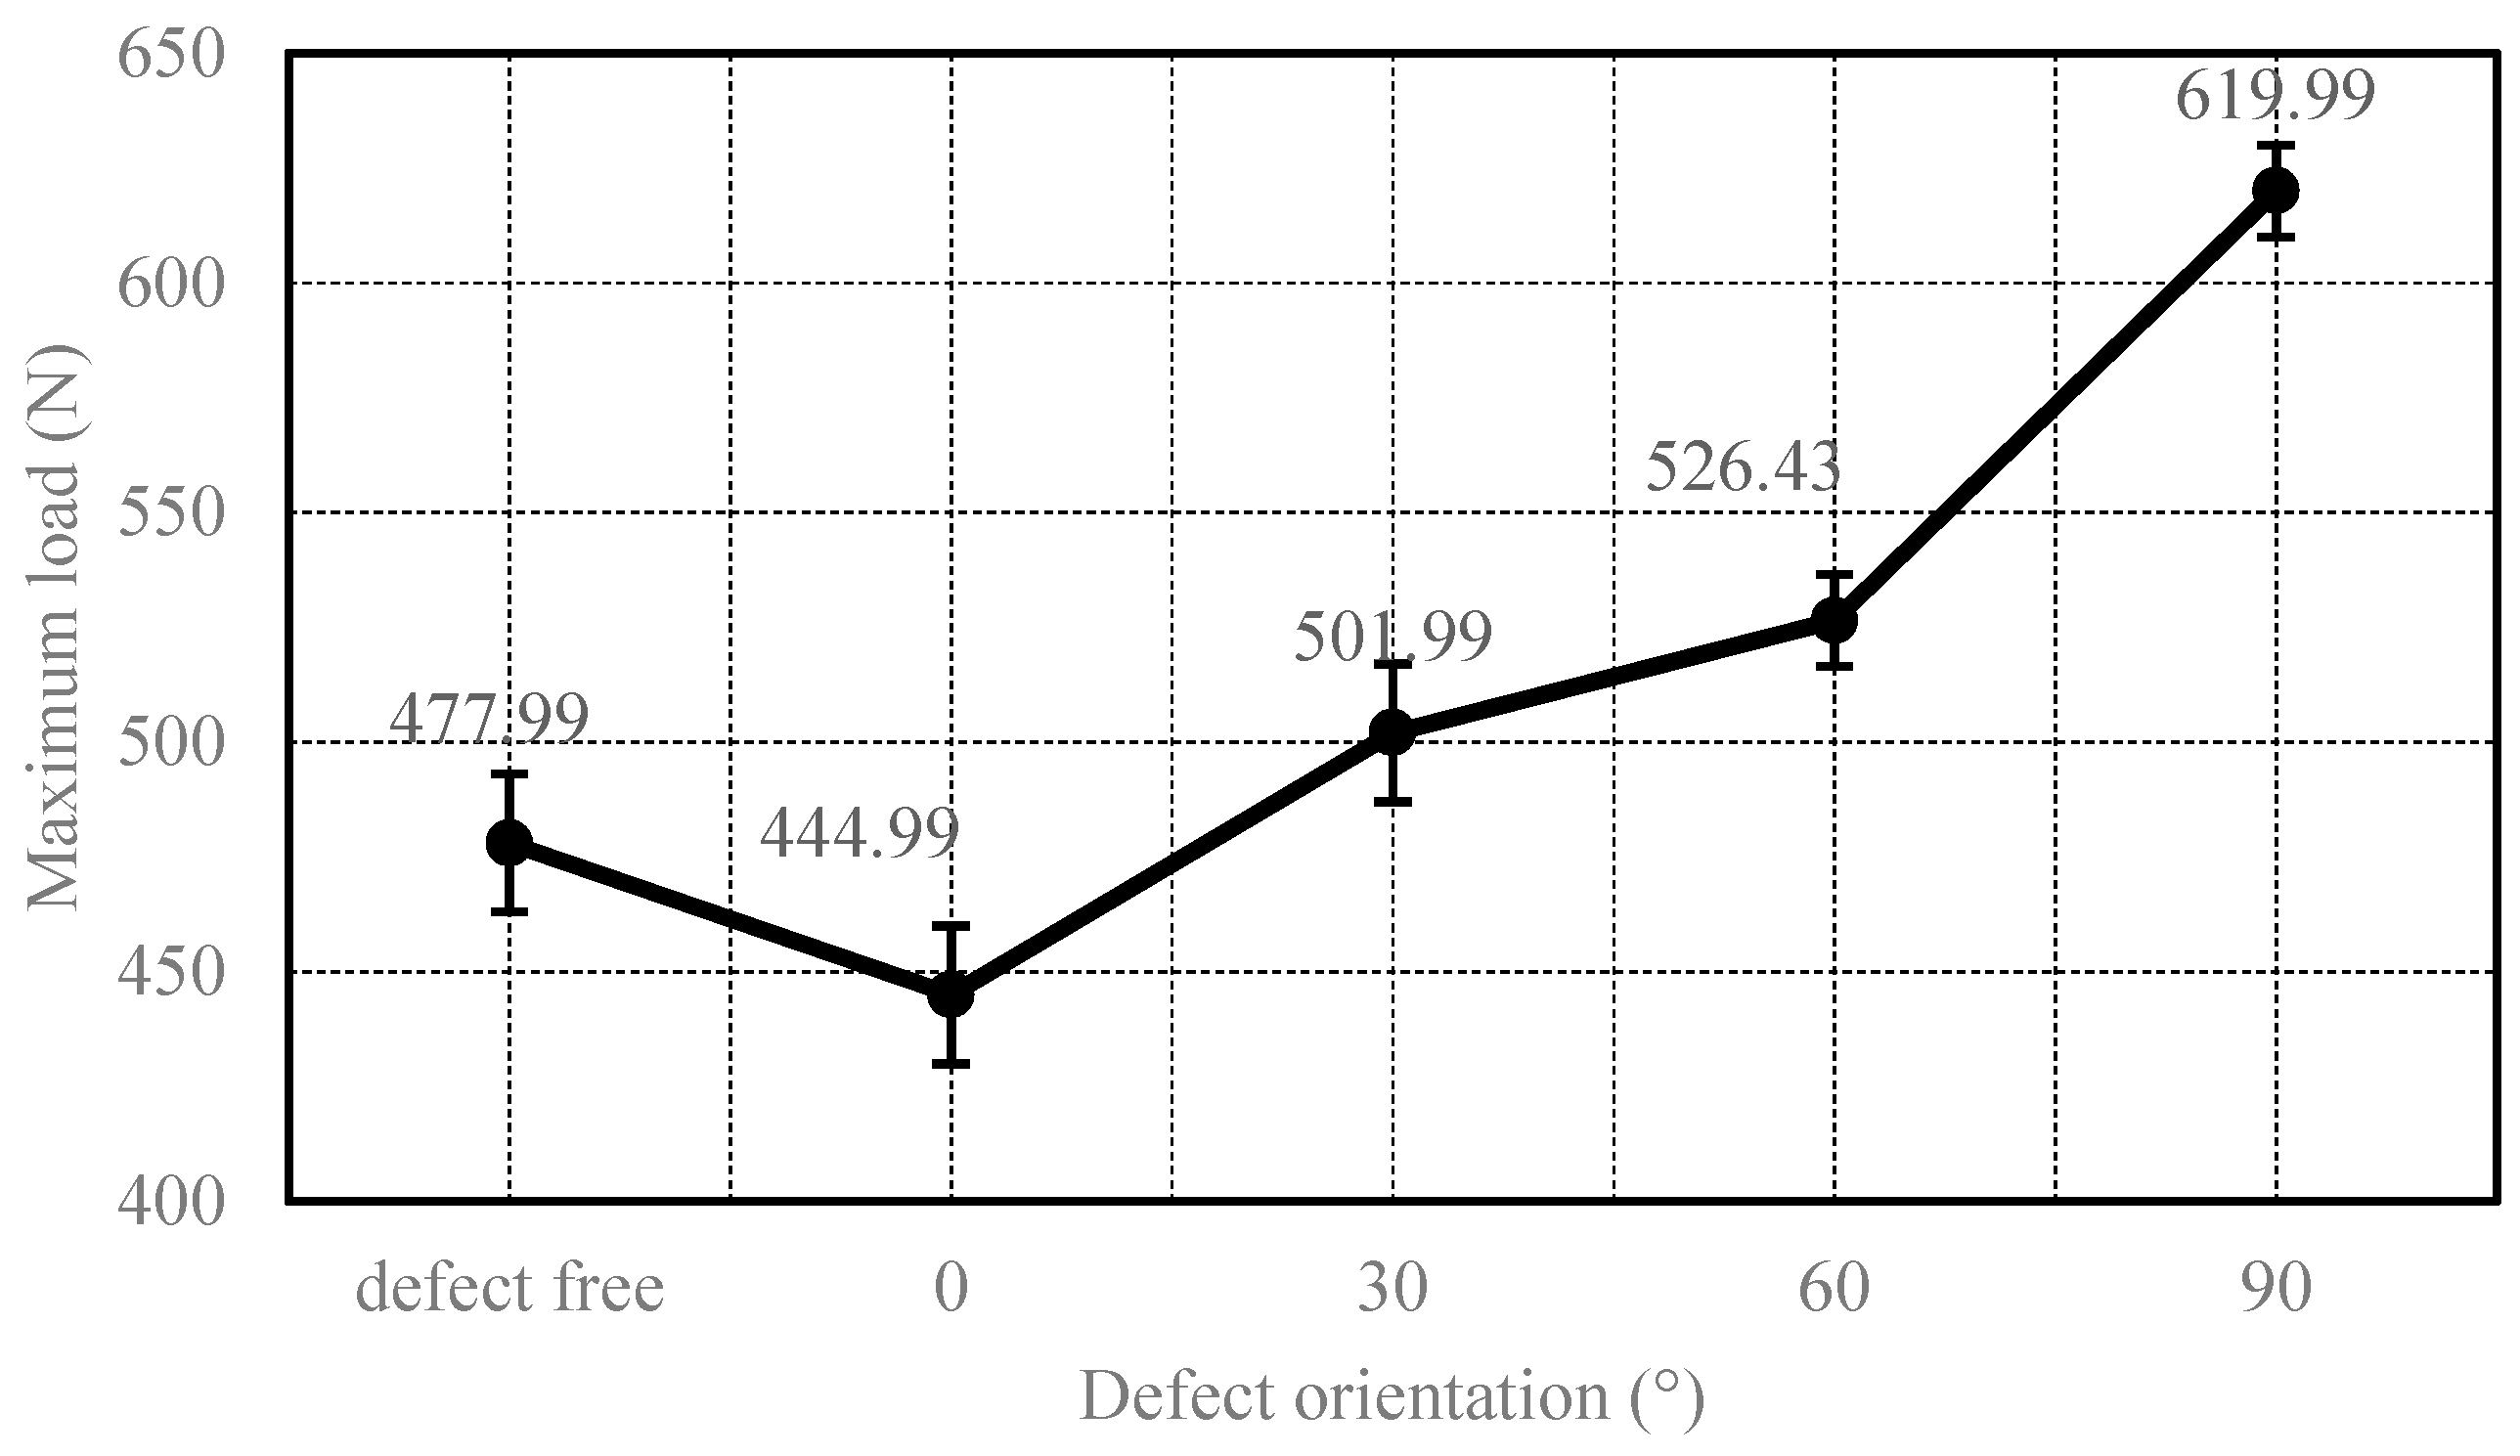
Similarly, the influence of the defect’s orientation was investigated for gray samples, as presented in Figure 10. The force-displacement curves of these gray samples have almost the same trend as for the curves of the green samples set. Figure 11 compares the reference case and the oriented, internal defects at the center of the gauge length. The impact of the defect’s orientation is obvious. Noticeable differences were recognized at the last stage where the “defect-free” case showed the highest value, and the “defect perpendicular to the axis” showed the lowest value, of the failure load.
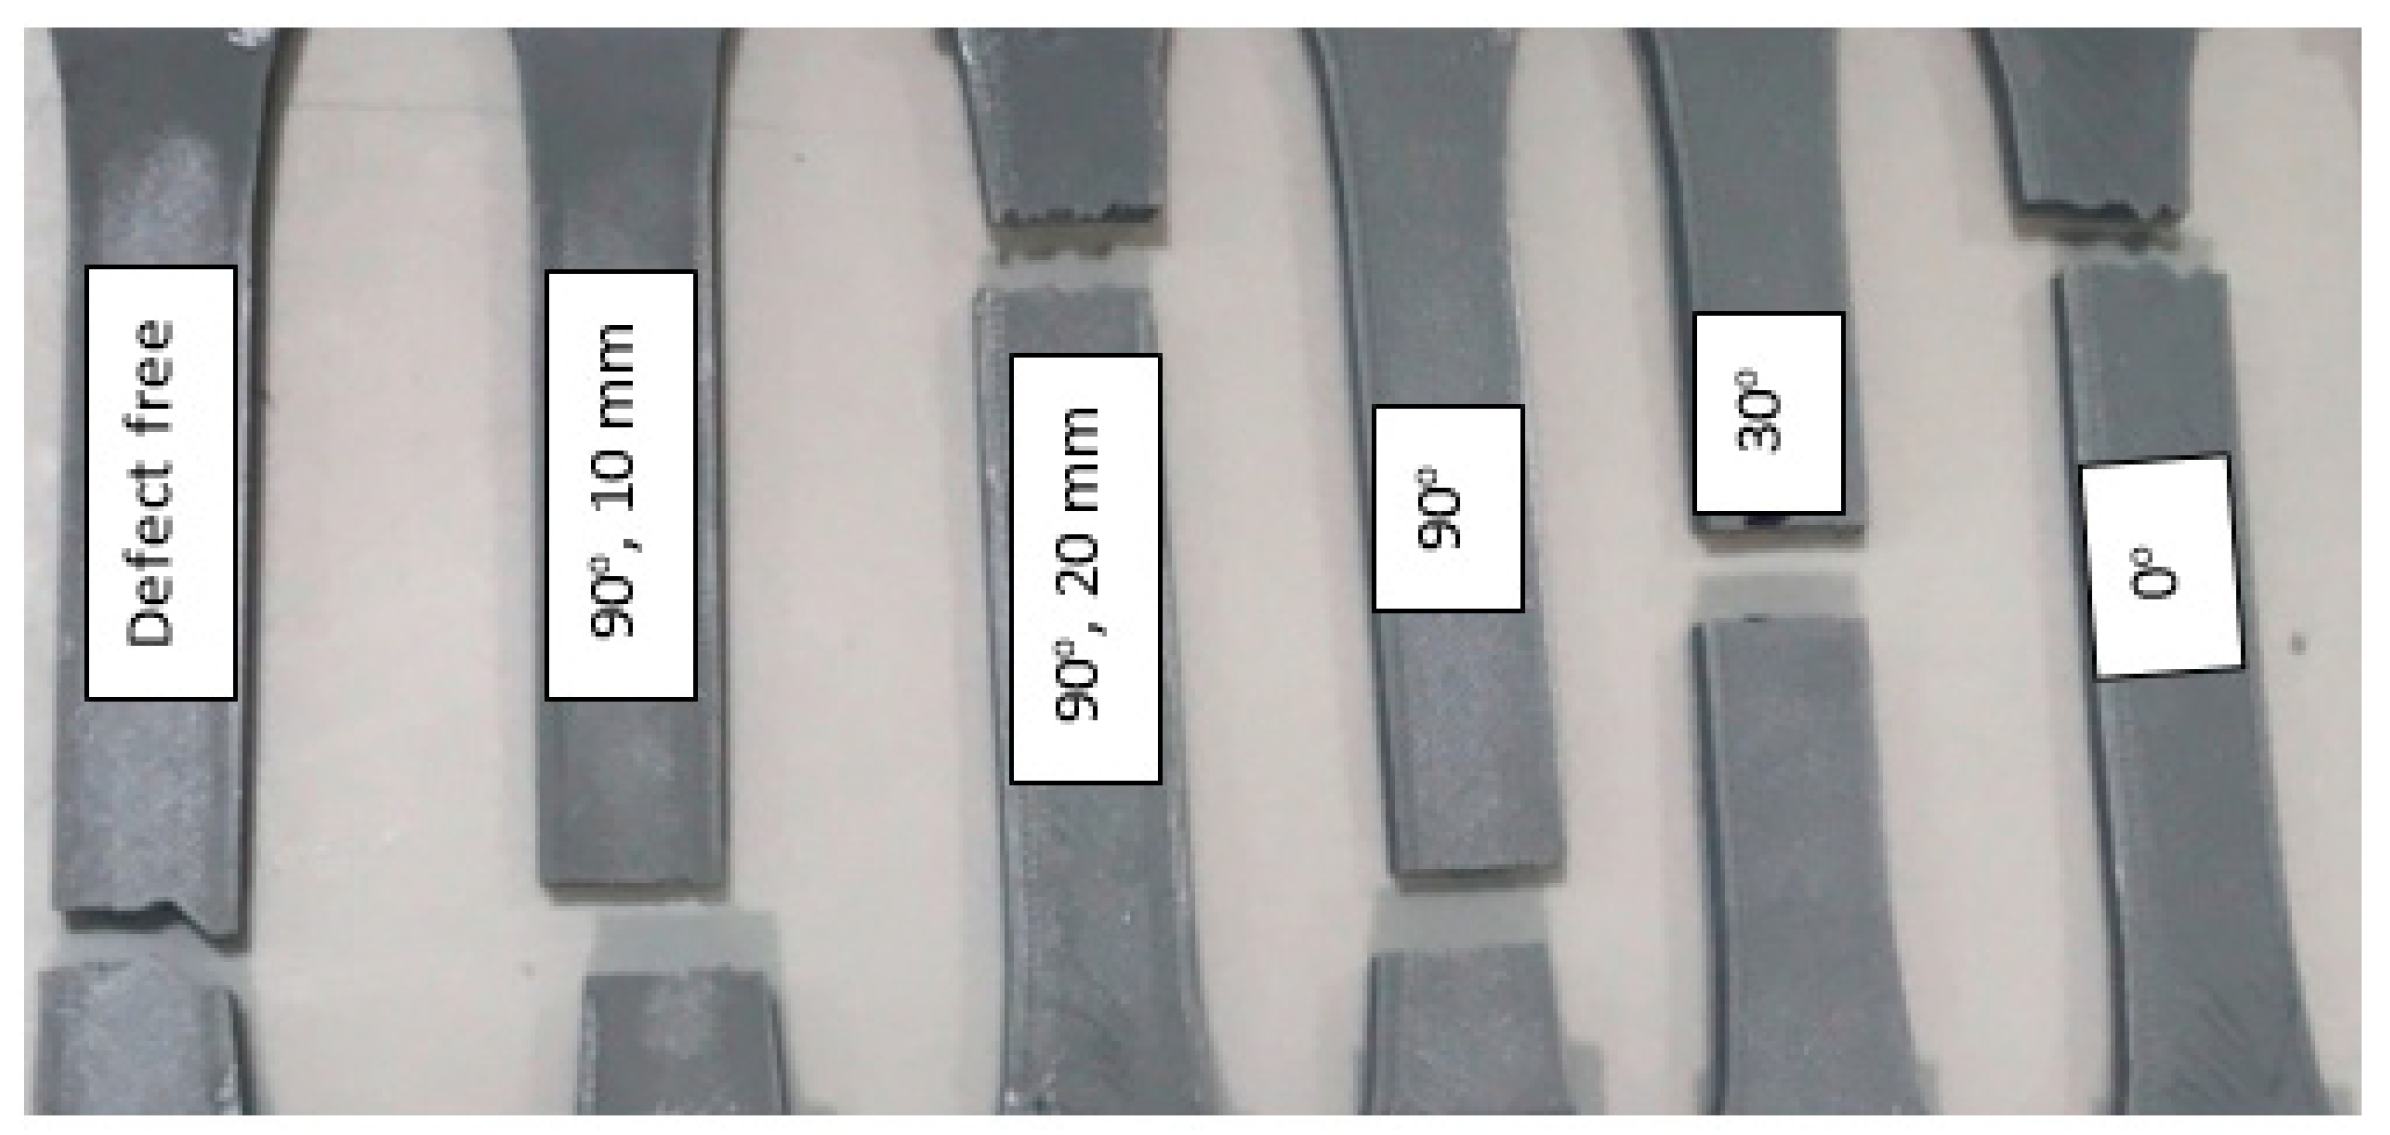
A maximum percentage reduction of 14% in the maximum load is noticed for samples with a 90° orientation defect, which is similar to that value noted for the green set. It has been observed that the specimens were not fractured at the section of the defect, as shown in Figure 12. This is due to the presence of the porosities that may weaken the specimen at any section.
For the white samples set, the infill rate was reduced from 100% to 50%, i.e., half the value of green and gray samples sets. The load-displacement curves for different defect positions are demonstrated in Figure 13 for the white samples. The presence of the porosities altered and affected the expected order of the curves, as can be seen in Figure 13 and Figure 14.
As depicted from Figure 13, Figure 14, Figure 15 and Figure 16, neither the location of the defects nor their orientation has shown a clear trend on their effect on the maximum load, and consequently, no conclusions can be made for the white set. This behavior is due to the presence of porosity which affected the load-bearing capacity of the material significantly.

3.2. The Effect of Infill Rate and Additive Color

The stress-strain curves for the gray, green and white defect-free samples are shown in Figure 17. The modulus of elasticity for these PLA materials is almost the same; ~ 3.6 GPa. It should be noted that the typical range of tensile modulus is 2.0–3.55 GPa [34,35]. The values obtained in this study for gray, green and white PLA are almost equivalent to the upper bound of the range above.
The white color PLA was found to be the strongest in this study compared to the gray and green PLA specimens, and these results are supported by Wittbrodt et al. [14]. They have reported that the PLA material color influences the maximum tensile strength that the material can sustain before fracture.
It should be noted that some previous studies have reported different maximum tensile strengths for the gray-color PLA; 50 MPa [12] and 54 MPa [14]. The variations in the values and their deviations from the one obtained in this study might be justified by the variations in the printing quality of different 3D printers [39]. Due to the lack of complete printing parameters, the comparison among the different studies is quite difficult [12,14]. However, the usage of double “shells” might contribute to the strength of the specimen, which is reflected in the tensile strength value [12]. All of the reported stresses fall within the typical tensile strength of PLA; 15–72 MPa [34,35].
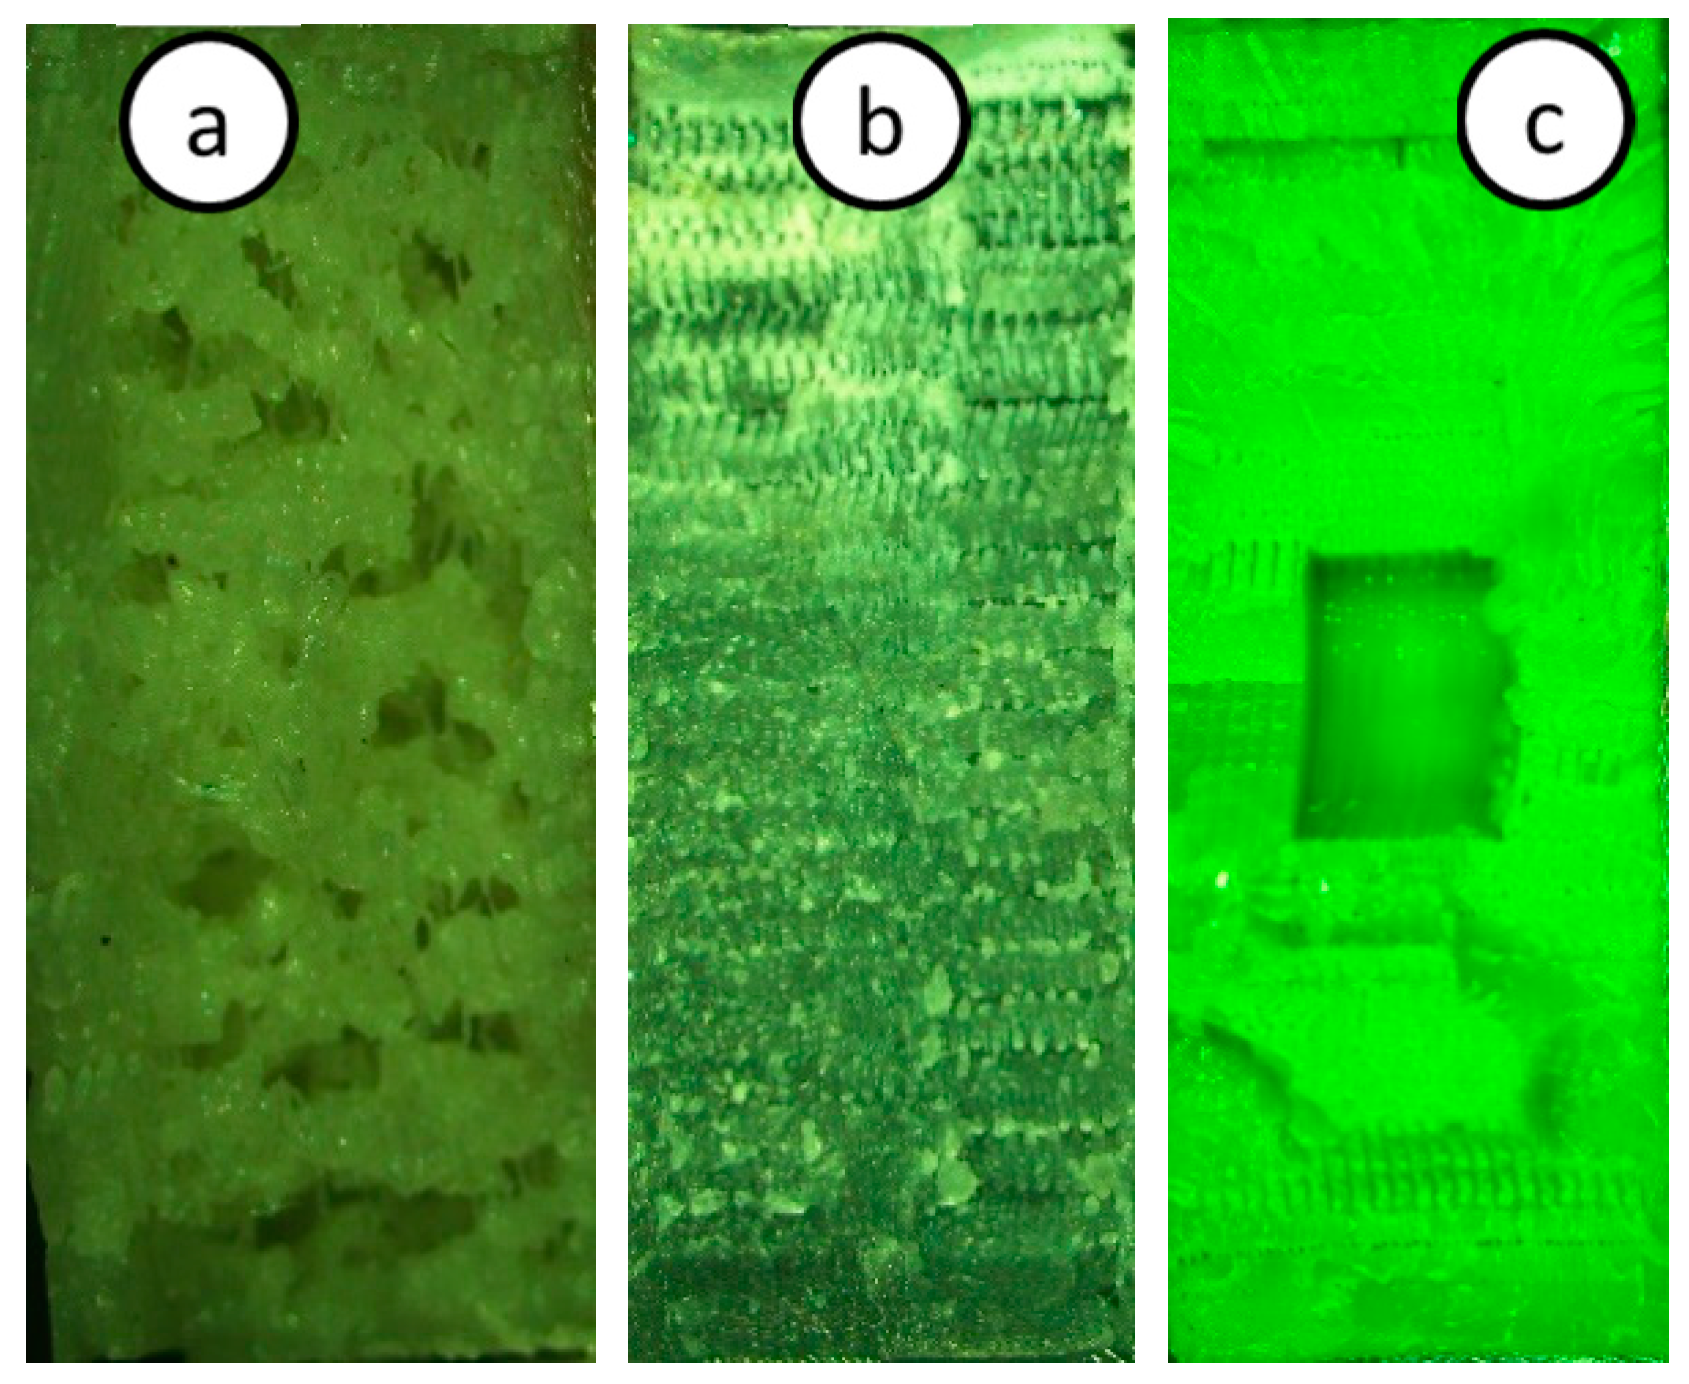
A fair comparison between the gray and green PLA can be done, since they have been printed at a 100% infill rate. The results reveal that the green printed samples are stronger than that of the gray color. There are two supporting arguments that can justify the results obtained above. The first argument attributes this variation to the different printing speeds used in fabricating the samples in each group (color). It was reported in [40] that for a flat oriented printing (similar to the one used in this study) the lower the printing speed, the lower the value of the tensile strength. It should be recalled that the gray PLA group was printed at 50 mm/s, while the green PLA group was printed at 80 mm/s. Nevertheless, despite the variation existence due to the printing speed, the disparities are considered to be negligible due to the slight change in the tensile strength value reported in [40]. On the other hand, the second argument supports the effect of the additive color in changing the crystallinity of the material [14]; hence, altering the strength of the material. In order to assess the second argument, magnified optical images at the fractured surfaces were taken and shown in Figure 19.
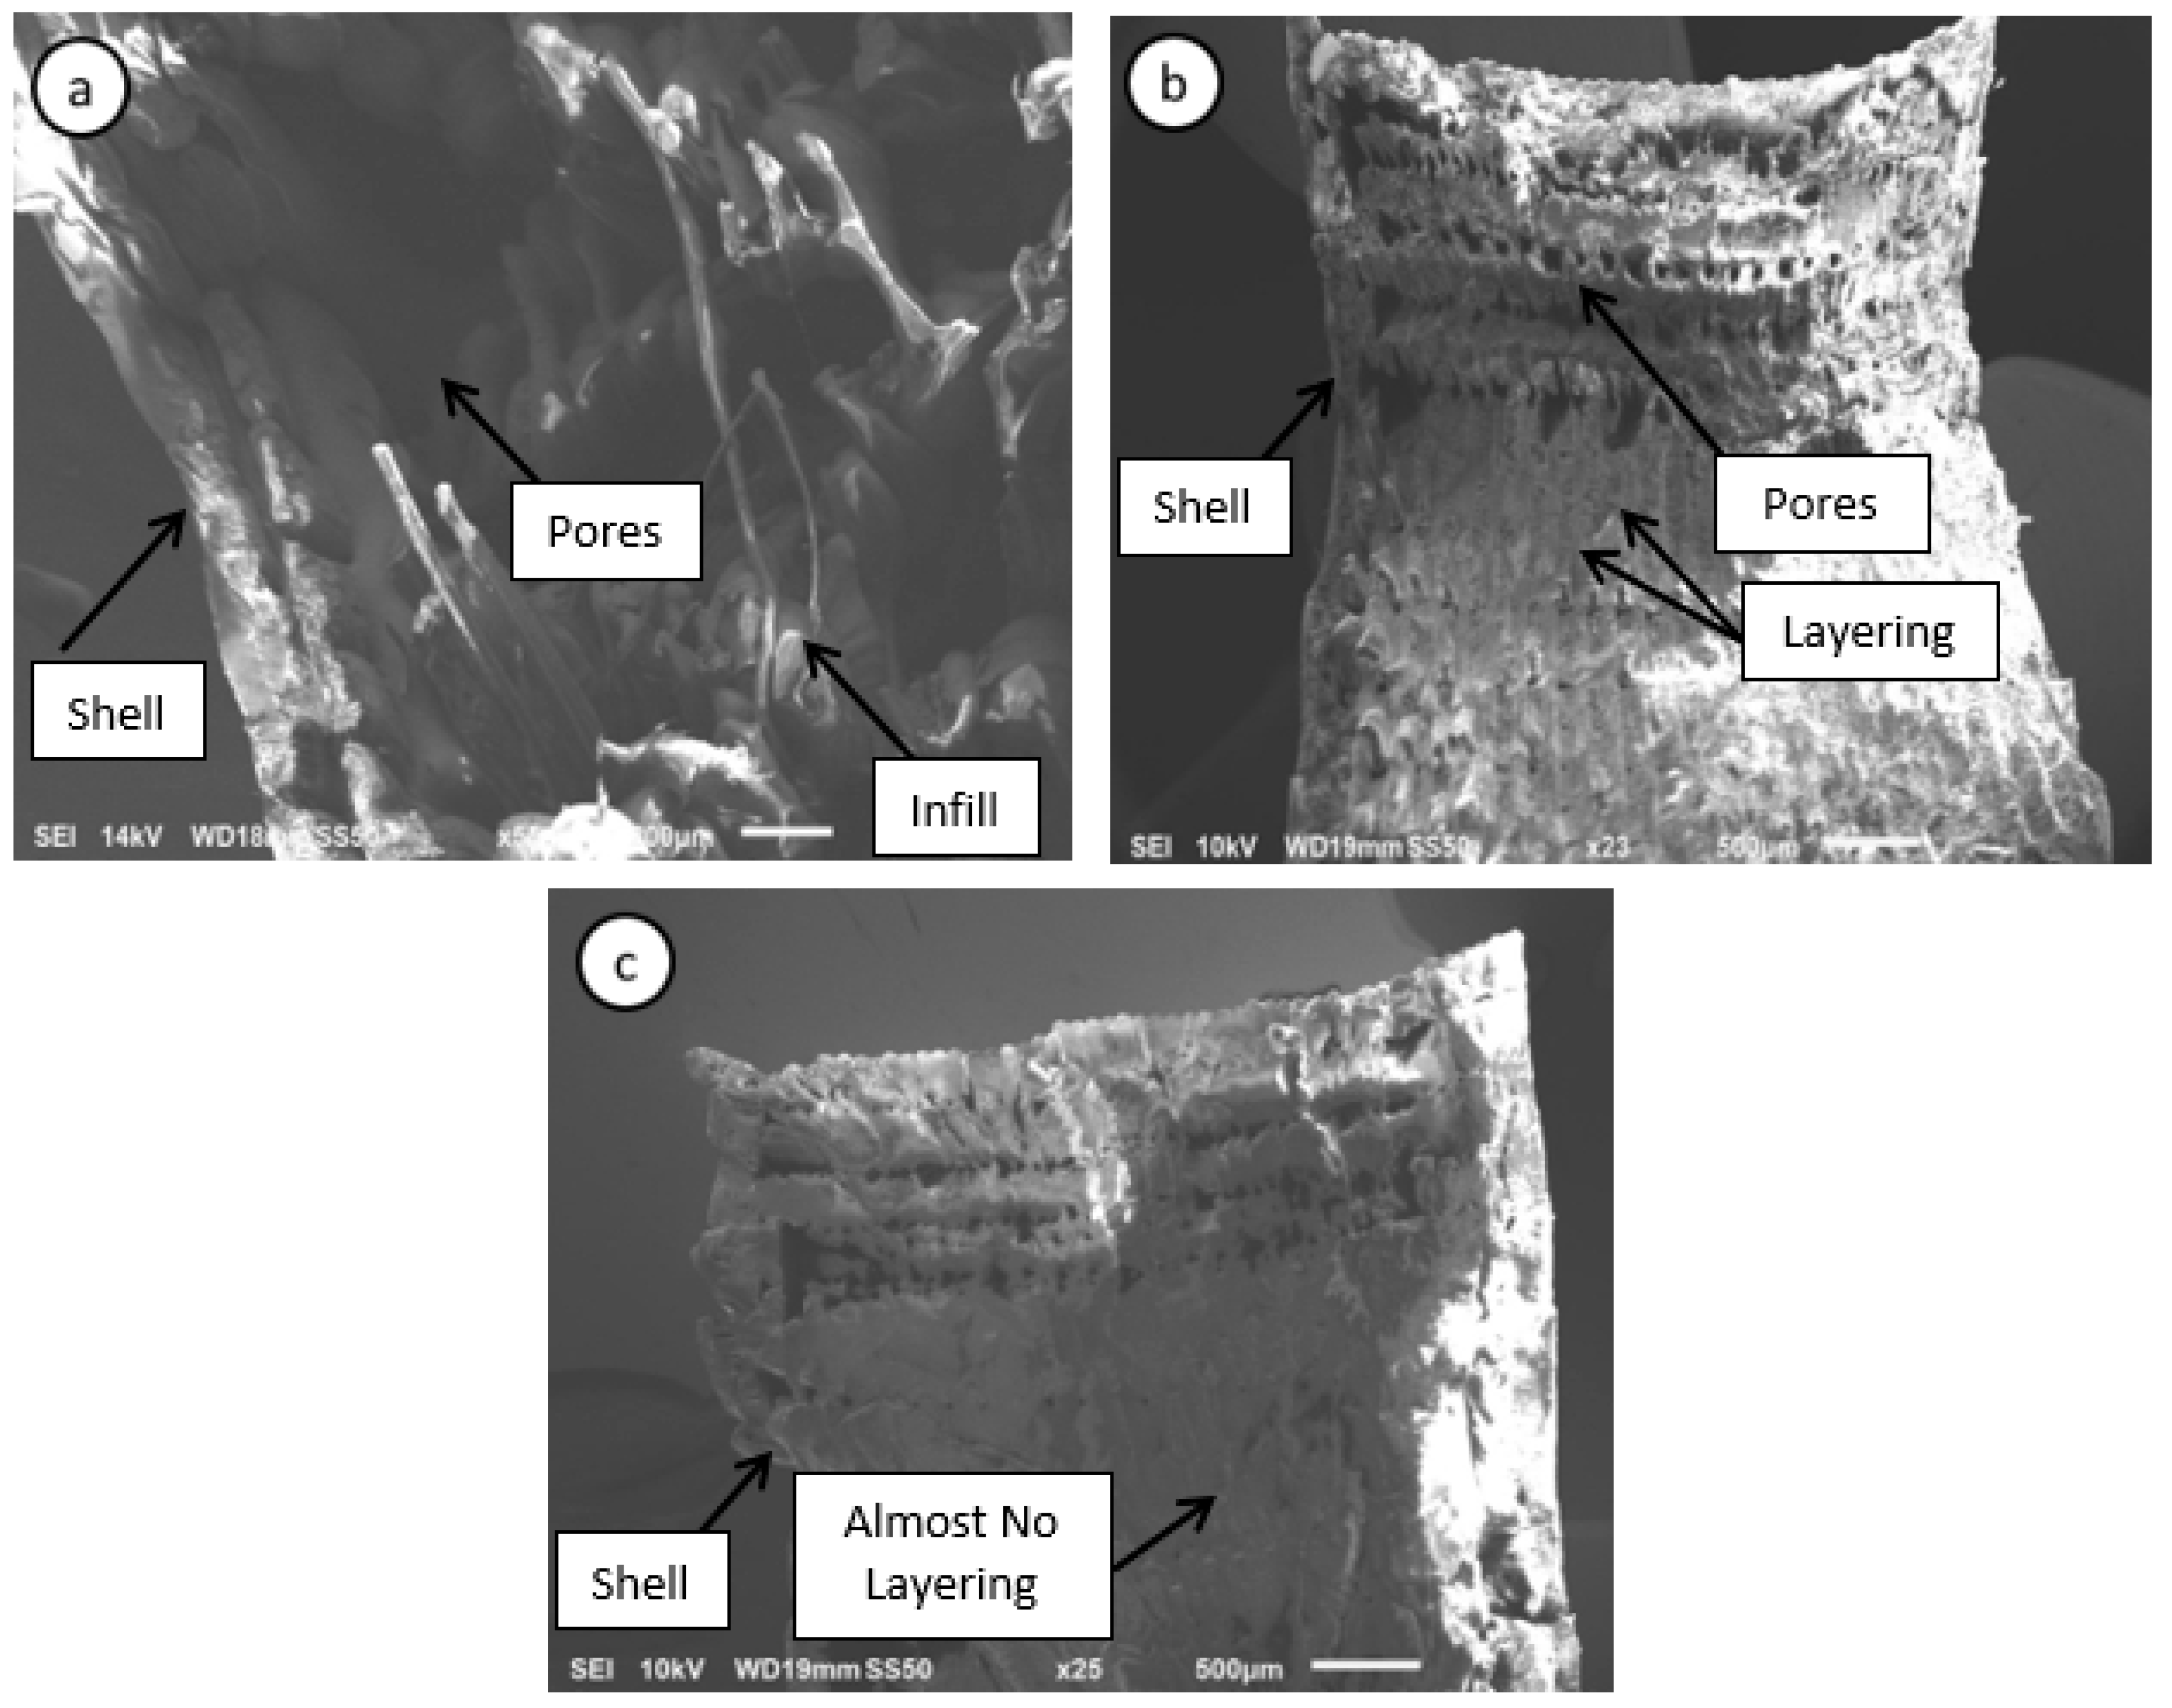
From Figure 18, there is clear evidence of the porosity on the fractured surfaces of the white-colored PLA due to a low infill percentage (50% infill). However, porosity is comparatively less due to a 100% infill in green and gray PLA samples. The SEM images of the fractured surface for these specimens are shown in Figure 19.
Figure 19a shows significant numbers of cavities in the prepared specimen using white filament. The voids created by the absence of material are the centers of the defect and attracts the stresses on it [41]. The SEM image distinguishes shell and infill.
The PLA was evidently non-uniformly-distributed in the sample. The fractured surface shows a brittle nature with a lot of voids. In Figure 19b, which shows the SEM image for the fractured surface of the gray sample, there is an evident effect of layering and pores, despite the 100% infill in this case. It is anticipated that the defect’s insertion contributes to the overall strength of the specimens; however, due to the evidence of porosity, there might be a place where the effect of such pores was more dominant than that of the defect. This causes the specimens to fracture at a weaker point. Figure 19c shows that the adhesion between the fiber-fiber layers is pronounced, such that no effect of layering and local pores is evident. For that reason, the effect of internal defects in such cases is more pronounced.
The SEM images support the argument raised in the comparison between the gray and green samples. Comparing the SEM for the gray and green samples, the green fractured surface showed a smoother build-up of the material far from the edges (contact with the shell material), as compared to the gray samples, which shows the different layers constituting the build-up of the sample. The smoother build-up implies stronger inter-layer fusion bonds between the different layers; hence, this is expected to have higher stress values [40,42].

4. Conclusions

In this work, additive manufacturing technology was used to create internally-defected samples, which is difficult to be achieved by any other manufacturing technique. This enables the mechanical performance assessment of an internally-defected material to be evaluated. Fused deposition modeling, one of the 3D printing methods, was utilized successfully to fabricate internally-defected tensile samples. The effect of elliptical defect location and orientation, infill rate, material porosity and color, were investigated. Both green and gray samples were fabricated using a 100% infill rate, while the white samples were fabricated using the 50% infill rate. Tensile tests and scanning electron microscopy were used for materials characterization. Defect-free samples made of green and grey PLA (100% infill rate) have the highest load-bearing capacity compared to their defected samples. The load-bearing capacity of the samples reduces with the presence of the internal defect and its orientation. The maximum reduction (14%) in tensile load was noticed for samples of defect perpendicular to its axis. The lower infill rates (50%) of the white PLA samples increased the level of porosity, which is associated with a significant reduction in the maximum tensile strength, and which increased the uncertainty of the results. The effect of the color additive is evident in the printing quality of the fabricated samples. The green color additive has shown the best adhesion properties among the printing layers. Also, the location of the defect in the grey samples was found to affect the load-bearing capacity. The SEM images of the fractured surfaces have supported the tensile tests results. In general, the presence of internal defects, their orientation, PLA color, infill rate and porosity level, were found to influence the load bearing capacity of the 3D-printed material manufactured using fused deposition modeling. Most importantly, the outcomes of this work could open another door for utilizing the additive manufacturing technology in many research areas that have potential industrial applications concerned with the performance evaluation of internally-defected materials

Author Contributions

Conceptualization, A.-H.I.M.; Data curation, A.M.G., M.M.S. and O.D.A.A.A.Q.; Formal analysis, A.M.G., A.H.I., J.V.C. and D.T.T.; Investigation, M.M.S., O.D.A.A.A.Q. and A.-H.I.M.; Methodology, A.H.I., J.V.C. and D.T.T.; Resources, A.M.G., M.M.S. and O.D.A.A.A.Q.; Supervision, A.-H.I.M. and H.A.J.; Visualization, H.A.J.; Writing – original draft, A.M.G., A.H.I., J.V.C. and D.T.T; Writing – review & editing, A.-H.I.M., H.A.J., A.H.I., J.V.C. and D.T.T.

Funding

This research received no external funding.

Conflicts of Interest

The authors declare no conflict of interest.

References

  1. Lee, D.; Miyoshi, T.; Takaya, Y.; Ha, T. 3D microfabrication of photosensitive resin reinforced with ceramic nanoparticles using LCD microstereolithography. J. Laser Micro/Nanoeng. 2006, 1, 142–148. [Google Scholar]
  2. Parandoush, P.; Lin, D. A review on additive manufacturing of polymer-fiber composites. Compos. Struct. 2017, 182, 36–53. [Google Scholar] [CrossRef]
  3. Horn, T.J.; Harrysson, O.L.A. Overview of current additive manufacturing technologies and selected applications. Sci. Prog. 2012, 95, 255–282. [Google Scholar] [CrossRef] [PubMed]
  4. Guo, N.; Leu, M.C. Additive manufacturing: Technology, applications and research needs. Front. Mech. Eng. 2013, 8, 215–243. [Google Scholar] [CrossRef]
  5. Wohler, T.T. Additive Manufacturing and 3D Printing State of the Industry: Annual Wourldwide Progress Report; Wohlers Associates Inc.: Fort Collins, CO, USA, 2011. [Google Scholar]
  6. Singh, D.; Singh, R.; Boparai, K.S.; Farina, I.; Feo, L.; Verma, A.K. In-vitro studies of SS 316 L biomedical implants prepared by FDM, vapor smoothing and investment casting. Compos. Part B Eng. 2018, 132, 107–114. [Google Scholar] [CrossRef]
  7. Singh, R.; Sandhu, G.; Penna, R.; Farina, I. Investigations for thermal and electrical conductivity of ABS-graphene blended prototypes. Materials 2017, 10, 881. [Google Scholar] [CrossRef]
  8. Kim, H.; Park, E.; Kim, S.; Park, B.; Kim, N.; Lee, S. Experimental study on mechanical properties of single-and dual-material 3D-printed products. Procedia Manuf. 2017, 10, 887–897. [Google Scholar] [CrossRef]
  9. Raut, S.; Jatti, V.S.; Khedkar, N.K.; Singh, T.P. Investigation of the effect of built orientation on mechanical properties and total cost of FDM parts. Procedia Mater. Sci. 2014, 6, 1625–1630. [Google Scholar] [CrossRef]
  10. Qattawi, A.; Alrawi, B.; Guzman, A. Experimental optimization of fused deposition modelling processing parameters: A design-for-manufacturing approach. Procedia Manuf. 2017, 10, 791–803. [Google Scholar]
  11. Gardan, J.; Makke, A.; Recho, N. A method to improve the fracture toughness using 3D printing by extrusion deposition. Procedia Struct. Integr. 2016, 2, 144–151. [Google Scholar] [CrossRef]
  12. Letcher, T.; Waytashek, M. Material property testing of 3d-printed specimen in PLA on an entry-level 3D printer. In ASME 2014 International Mechanical Engineering Congress and Exposition; American Society of Mechanical Engineers: New York, NY, USA, 2014; p. V02AT02A014. [Google Scholar]
  13. Harris, M.; Potgieter, J.; Archer, R.; Arif, K.M. Effect of Material and Process Specific Factors on the Strength of Printed Parts in Fused Filament Fabrication: A Review of Recent Developments. Materials 2019, 12, 1664. [Google Scholar] [CrossRef] [PubMed]
  14. Wittbrodt, B.; Pearce, J.M. The effects of PLA color on material properties of 3D printed components. Addit. Manuf. 2015, 8, 110–116. [Google Scholar] [CrossRef]
  15. Patterson, A.E. Crack Propagation in 3DPrinted PLA: Finite Element Modeling, Test Bed Design, and Preliminary Experimental Results; Technical Report; IDEALS: University of Illinois at Urbana-Champaign, Champaign County, IL, USA, 2018. [Google Scholar]
  16. Maiti, S.K.; Mourad, A.-H.I. Criterion for mixed-mode stable crack growth, Part I: Three point bend geometry and Part D Compact tension geometry with and without stiffener. Eng. Fract. Mech. 1995, 52, 321–347. [Google Scholar] [CrossRef]
  17. Farbman, D.; McCoy, C. Materials Testing of 3D-printed ABS and PLA Samples to Guide Mechanical Design. In Proceedings of the ASME 2016 11th International Manufacturing Science and Engineering Conference, Blacksburg, VA, USA, 27 June–1 July 2016; American Society of Mechanical Engineers: New York, NY, USA, 2016; p. V002T01A015. [Google Scholar]
  18. Ngo, T.D.; Kashani, A.; Imbalzano, G.; Nguyen, K.T.Q.; Hui, D. Additive manufacturing (3D printing): A review of materials, methods, applications and challenges. Compos. Part B Eng. 2018, 143, 172–196. [Google Scholar] [CrossRef]
  19. Zeltmann, S.E.; Gupta, N.; Tsoutsos, N.G.; Maniatakos, M.; Rajendran, J.; Karri, R. Manufacturing and security challenges in 3D printing. JOM 2016, 68, 1872–1881. [Google Scholar] [CrossRef]
  20. Mourad, A.-H.I.; Maiti, S.K. Mode I and Mixed-Mode Stable Crack Extensions through Stiffened Three-Point Bend Specimens. Fatigue Fract. Eng. Mater. Struct. 1995, 18, 645–652. [Google Scholar] [CrossRef]
  21. Mourad, A.-H.I.; Maiti, S.K. Mode II stable crack growth. Fatigue Fract. Eng. Mater. Struct. 1996, 19, 75–84. [Google Scholar] [CrossRef]
  22. Mourad, A.H.I.; Alghafri, M.J.; Zeid, O.A.A.; Maiti, S.K. Experimental investigation on ductile stable crack growth emanating from wire-cut notch in AISI 4340 steel. Nucl. Eng. Des. 2005, 235, 637–647. [Google Scholar] [CrossRef]
  23. Mourad, A.-H.I. Effect of stress state on mode II stable crack extension. Key Eng. Mater. 2005, 297, 1604–1610. [Google Scholar] [CrossRef]
  24. Maiti, S.K.; Kishore, G.K.; Mourad, A.-H.I. Bilinear CTOD/CTOA scheme for characterisation of large range mode I and mixed mode stable crack growth through AISI 4340 steel. Nucl. Eng. Des. 2008, 238, 3175–3185. [Google Scholar] [CrossRef]
  25. Maiti, S.K.; Namdeo, S.; Mourad, A.-H.I. A scheme for finite element analysis of mode I and mixed mode stable crack growth and a case study with AISI 4340 steel. Nucl. Eng. Des. 2008, 238, 787–800. [Google Scholar] [CrossRef]
  26. El-Sayed, M.; El Domiaty, A.; Mourad, A.-H.I. Fracture assessment of axial crack in steel pipe under internal pressure. Procedia Eng. 2015, 130, 1273–1287. [Google Scholar] [CrossRef]
  27. Mourad, A.I. Pure shear stable crack growth through Compact-Tension-Shear specimen in plane state of stress. Strength Fract. Complex. 2004, 2, 111–125. [Google Scholar]
  28. Mourad, A.-H.I.; Alghafri, M.G.; Abu Zeid, O.A. Stable crack extension through AISI 4340 steel: Experimental investigation. Key Eng. Mater. 2004, 261, 207–212. [Google Scholar] [CrossRef]
  29. Mourad, A.-H.; Maiti, S.K. Influence of state of stress on mixed mode stable crack growth through D16AT aluminium alloy. Int. J. Fract. 1995, 72, 241–258. [Google Scholar] [CrossRef]
  30. Maiti, S.K.; Mourad, A.-H.I. Criterion for mixed mode stable crack growth—II. Compact tension geometry with and without stiffener. Eng. Fract. Mech. 1995, 52, 349–378. [Google Scholar] [CrossRef]
  31. Kerekes, T.W.; Lim, H.; Joe, W.Y.; Yun, G.J. Characterization of process–deformation/damage property relationship of fused deposition modeling (FDM) 3D-printed specimens. Addit. Manuf. 2019, 25, 532–544. [Google Scholar] [CrossRef]
  32. DeVries, M.; Subhash, G.; Mcghee, A.; Ifju, P.; Jones, T.; Zheng, J.; Halls, V. Quasi-static and dynamic response of 3D-printed alumina. J. Eur. Ceram. Soc. 2018, 38, 3305–3316. [Google Scholar] [CrossRef] [Green Version]
  33. Tetsworth, K.; Block, S.; Glatt, V. Putting 3D modelling and 3D printing into practice: Virtual surgery and preoperative planning to reconstruct complex post-traumatic skeletal deformities and defects. SICOT-J 2017, 3, 16. [Google Scholar] [CrossRef]
  34. Kotlinski, J. Mechanical properties of commercial rapid prototyping materials. Rapid Prototyp. J. 2014, 20, 499–510. [Google Scholar] [CrossRef]
  35. Lanzotti, A.; Grasso, M.; Staiano, G.; Martorelli, M. The impact of process parameters on mechanical properties of parts fabricated in PLA with an open-source 3D printer. Rapid Prototyp. J. 2015, 21, 604–617. [Google Scholar] [CrossRef]
  36. Farah, S.; Anderson, D.G.; Langer, R. Physical and mechanical properties of PLA, and their functions in widespread applications—A comprehensive review. Adv. Drug Deliv. Rev. 2016, 107, 367–392. [Google Scholar] [CrossRef]
  37. Standard, A. D638: Standard Test Method for Tensile Properties of Plastics; ASTM Internation: West Conshohocken, PA, USA, 2010. [Google Scholar]
  38. Mourad, A.-H.I.; Ghazal, A.M.; Syam, M.M.; Al Qadi, O.D.; Al Jassmi, H. Utilization of Additive Manufacturing in Evaluating the Performance of Internally-defected Materials. IOP Conf. Ser. Mater. Sci. Eng. 2018, 362, 12026. [Google Scholar] [CrossRef]
  39. Roberson, D.A.; Espalin, D.; Wicker, R.B. 3D printer selection: A decision-making evaluation and ranking model. Virtual Phys. Prototyp. 2013, 8, 201–212. [Google Scholar] [CrossRef]
  40. Torrado, A.R.; Roberson, D.A. Failure analysis and anisotropy evaluation of 3D-printed tensile test specimens of different geometries and print raster patterns. J. Fail. Anal. Prev. 2016, 16, 154–164. [Google Scholar] [CrossRef]
  41. Idrisi, A.H.; Mourad, A.-H.I. Conventional stir casting versus ultrasonic assisted stir casting process: Mechanical and physical characteristics of AMCs. J. Alloys Compd. 2019, 805, 502–508. [Google Scholar] [CrossRef]
  42. Mourad, A.-H.I.; Idrisi, A.H.; Wrage, M.C.; Abdel-Magid, B.M. Long-term durability of thermoset composites in seawater environment. Compos. Part B Eng. 2019, 168, 243–253. [Google Scholar] [CrossRef]
Figure 1. Dimensions of the standard tensile specimen [31].
Jmmp 03 00074 g001
Figure 2. Dimensions of the internal elliptical defect.
Jmmp 03 00074 g002
Figure 3. Load-displacement curves for the green sample set with an elliptical defect located at the sample center with different orientations.
Jmmp 03 00074 g003
Figure 4. Effect of the orientation of the defects on the maximum load [31].
Jmmp 03 00074 g004
Figure 5. Fractured samples (a) perpendicular to the axis, 0° (b) 45° (c) along the axis, 90° [38].
Jmmp 03 00074 g005
Figure 6. Optical microscopic images (10× magnification) of fracture surfaces (a) perpendicular to the axis 0°, (b) along the axis 90°, and (c) 45° [38].
Jmmp 03 00074 g006
Figure 7. Internal defects captured during the three-dimensional (3D) printing of the grey specimens.
Jmmp 03 00074 g007
Figure 8. Load-displacement curves for the gray set specimens with different defect locations from the sample center.
Jmmp 03 00074 g008
Figure 9. Effect of the defect’s location on the peak load for gray samples.
Jmmp 03 00074 g009
Figure 10. Effect of defect’s orientation on the load-displacement curve of gray set samples.
Jmmp 03 00074 g010
Figure 11. Effect of the defect orientation on the peak load.
Jmmp 03 00074 g011
Figure 12. Fractured gray samples.
Jmmp 03 00074 g012
Figure 13. Load-displacement curves for the white set specimens with a defect at different locations from the sample center.
Jmmp 03 00074 g013
Figure 14. Effect of the defect location on the maximum load for white samples set.
Jmmp 03 00074 g014
Figure 15. Load-displacement curves of white samples set with a defect at different orientations.
Jmmp 03 00074 g015
Figure 16. Effect of the defect orientation on the maximum load of white samples set.
Jmmp 03 00074 g016
Figure 17. Effect of sample color on the stress-strain curve.
Jmmp 03 00074 g017
Figure 18. Optical microscopic images (10× magnification) at the fractured surface (a) White (b) Gray (c) Green.
Jmmp 03 00074 g018
Figure 19. Scanning electron microscope (SEM) images for the fractured surfaces. (a) White (b) Gray (c) Green.
Jmmp 03 00074 g019
Table 1. Typical ranges of mechanical properties for Polylactic Acid (PLA) material using Fusion Deposition Modeling (FDM) technology [36].
PropertiesValue
Polymer density (g/cm3)1.21–1.25
Tensile strength (MPa)15.5–72.2 (21–60)
Tensile modulus (GPa) 2.020–3.550 (0.35–3.5)
Elongation at break (%)0.5–9.2
Ultimate strain (%)2.5–6
Specific tensile strength (Nm/g)16.8–48
Specific tensile modulus (kNm/g)0.28–2.80
Glass transition temperature (°C)45–60
Melting temperature (°C)150–162
Table 2. Process parameters for FDM [31].
ParametersValue/Specification
PLA (colors)White, Gray, Green
Layer thickness (mm)0.1
Shell wall thickness (mm)1.05
Shell top/bottom thickness (mm)0.8
Infill percentage (%)50% (White), 100% (Green, Gray and White)
Feed rate/printing speed (mm/s)50 (Gray), 80 (White and Green)