Article

Automated Laser Ablation of Inhomogeneous Metal Oxide Films to Manufacture Uniform Surface Temperature Profile Electrical Heating Elements

1
Engineering Department, Lancaster University, Lancaster LA1 4YW, UK
2
2DHeat Limited, Dashmore Business Park, Lock Street, St Helens WA9 1HS, UK
*
Authors to whom correspondence should be addressed.
J. Manuf. Mater. Process. 2019, 3(3), 65; https://doi.org/10.3390/jmmp3030065
Submission received: 18 June 2019 / Revised: 15 July 2019 / Accepted: 31 July 2019 / Published: 2 August 2019

Abstract

:
This paper presents automated laser ablation strategies to improve the temperature distribution across the surface of inhomogeneous Ni-Fe-Cr-NiO electrical heating elements during joule heating. A number of iterative closed-loop laser control algorithms have been developed and analyzed in order to assess their impact on the efficacy of the heating element, in terms of homogeneous temperature control, and on the implications for automated fabrication of inhomogeneous metal oxide films. Analysis shows that the use of the leading method, i.e., use of a temperature-dependent variable-power approach with memory of previous processes, showed a 68% reduction in the standard deviation of the temperature distribution of the heating element and a greater uniformity of temperature profile as compared to existing manual methods of processing.

Graphical Abstract

1. Introduction

The current target set by the Intergovernmental Panel on Climate Change (IPCC) is to lower net carbon emissions to zero before a 1.5 °C rise in average global temperatures is realized [1]. Due to the large amount of energy consumed in heat production within the United Kingdom and abroad [2], a trend towards a lower carbon mix of electricity generation and the low proportion of electricity currently used to produce heat, there is a growing demand for efficient electrical heating technology to replace fossil fuel emitting heating technology to reach the IPCC target [3,4].
To fill this void, new electrical heating technologies are required that are more efficient, maintain a low economic and environmental cost of production, and have a high engineering versatility such that they can readily be integrated into and replace existing heating technologies [5].
Many materials and manufacturing processes have been investigated to produce this next generation of electrical heating elements. Recent research has largely focused upon ceramics [6] and graphene oxide [7], as well as a variety of other composites [8,9,10,11,12]. Whilst these materials give promising results, they have yet to demonstrate the ability to scale to large manufacturing processes due to production costs, reliability and temperature homogeneity. Promising research is being conducted on the use of metal oxides for heating elements due to their high resistance and thermal conductivity, low cost of production and ease of integrability [13,14]. A variety of methods of production of these films are currently in development, from electric-field-assisted chemical vapor deposition [15], DC magnetron sputtering [16] and flame spray processes [17]. The use of flame spray processes above the other processes brings the advantage of being able to manufacture large areas with thick coatings in a short space of time.
The metal oxide film studied in this research is formed from an Inconel 600 powder through the flame spray process with the main constituents of Ni-Fe-Cr-NiO. Due to the flame spray process, the oxidation of the film is much higher than predicted by the initial metallic Inconel 600 powder. This increases the electrical resistance of the film, making it suitable for incorporation into an electrical heating device as an electric heating element.
A barrier to efficient electrical heating is that many elements do not heat uniformly so the hot spot of the element has to be set to below the maximum allowable temperature [18]. This means the heat output efficiency of the element is low. However, throughout several industries, there are many applications that rely upon uniform heating, such as the production of composites and meshes [19], the bake-out stage of outgassing vacuum vessels [20], fast-response heating elements for injection molding [21] and actuator activation [22].
To fulfill the need for a new generation of efficient heating technology, promising developments are currently taking place looking into the incorporation of heating element films directly onto surfaces to be heated [8,9]. The advantage of the film being in direct contact with the heated surface means a much greater efficiency of heat transference. A key component of efficient heating is ensuring a uniform temperature profile.
A few approaches to increasing the uniformity of electrical heating elements have been undertaken. These include changing the emissivity of the element [23], altering the geometry or thickness of the element [24], and the incorporation of large thermal blocks to store or distribute the thermal energy [25]. The approach taken by this research is an additional manufacturing process to increase the uniformity of the temperature profile by using an automated laser ablation system with an integrated infrared imaging camera.
The laser system uses a treatment method to make decisions on the path and amount of treatment delivered by the laser system based upon thermal data provided by a thermal camera. This lies on the periphery of the current shift to the integration of sensor technology and control automation so that manufacturing processes decide their own treatment protocols [26].
The use of infrared imaging to assess the uniformity of heating elements is common [27], but the direct integration of the infrared imaging system within a closed-loop manufacturing process to affect the output of the heating element is rarely attempted. This is despite there being a variety of patents for similar techniques where infrared data is taken to adjust the heat distribution of parts with lasers using infrared cameras [28,29]. Therefore, the development of closed-loop laser ablation systems based on infrared imaging feedback is timely and worthy of this investigation.
In this work, heating elements formed from flame sprayed Inconel 600 is investigated. Due to this method of production, these films have an inhomogeneous and unknown composition and thickness, and in turn, inhomogeneous electrical properties and temperature distribution. Due to the current flow through the film, the element typically has a hot spot in the central region of the element, as seen in Figure 1, when powered with a DC voltage. This research presents a method to improve the uniformity of the heat distribution of the heating element by strategically reducing the thickness of the film locally through laser ablation, without needing prior knowledge of the film’s properties.
The method of optimization used is the targeted thickness reduction of the element through laser ablation of the surface. The proposed model of optimization is that the laser ablation increases the current density by reducing the thickness of the conduction pathways in the element [30]. Through targeting specific areas with the laser, the treated regions receive a higher proportion of the electrical power input relative to other areas and as a result, the temperature profile becomes more homogenous.
To analyze the results of this process the temperature profile after each cycle of ablation with the various treatment methods were visualized in contour maps of the temperature profile. Experiments into the changes in the element resistance via the control process are employed; a four-probe resistance methodology is used to gain accurate values of the element resistance. The effects of the laser on the target material were investigated, this was done through a variety of microscopy techniques such as optical, energy dispersive spectroscopy, and scanning electron microscopy. These are used to inform about the damage and changes to the target morphology and micro-structure.
The main focus of the research is the development of a processing strategy of how to treat the element with a carbon dioxide laser and evaluating various treatment methods to decide at what density and location the laser should treat the element. To enable this, the secondary focus was investigating the effects the laser upon the film composition and metrology.

2. Methodology

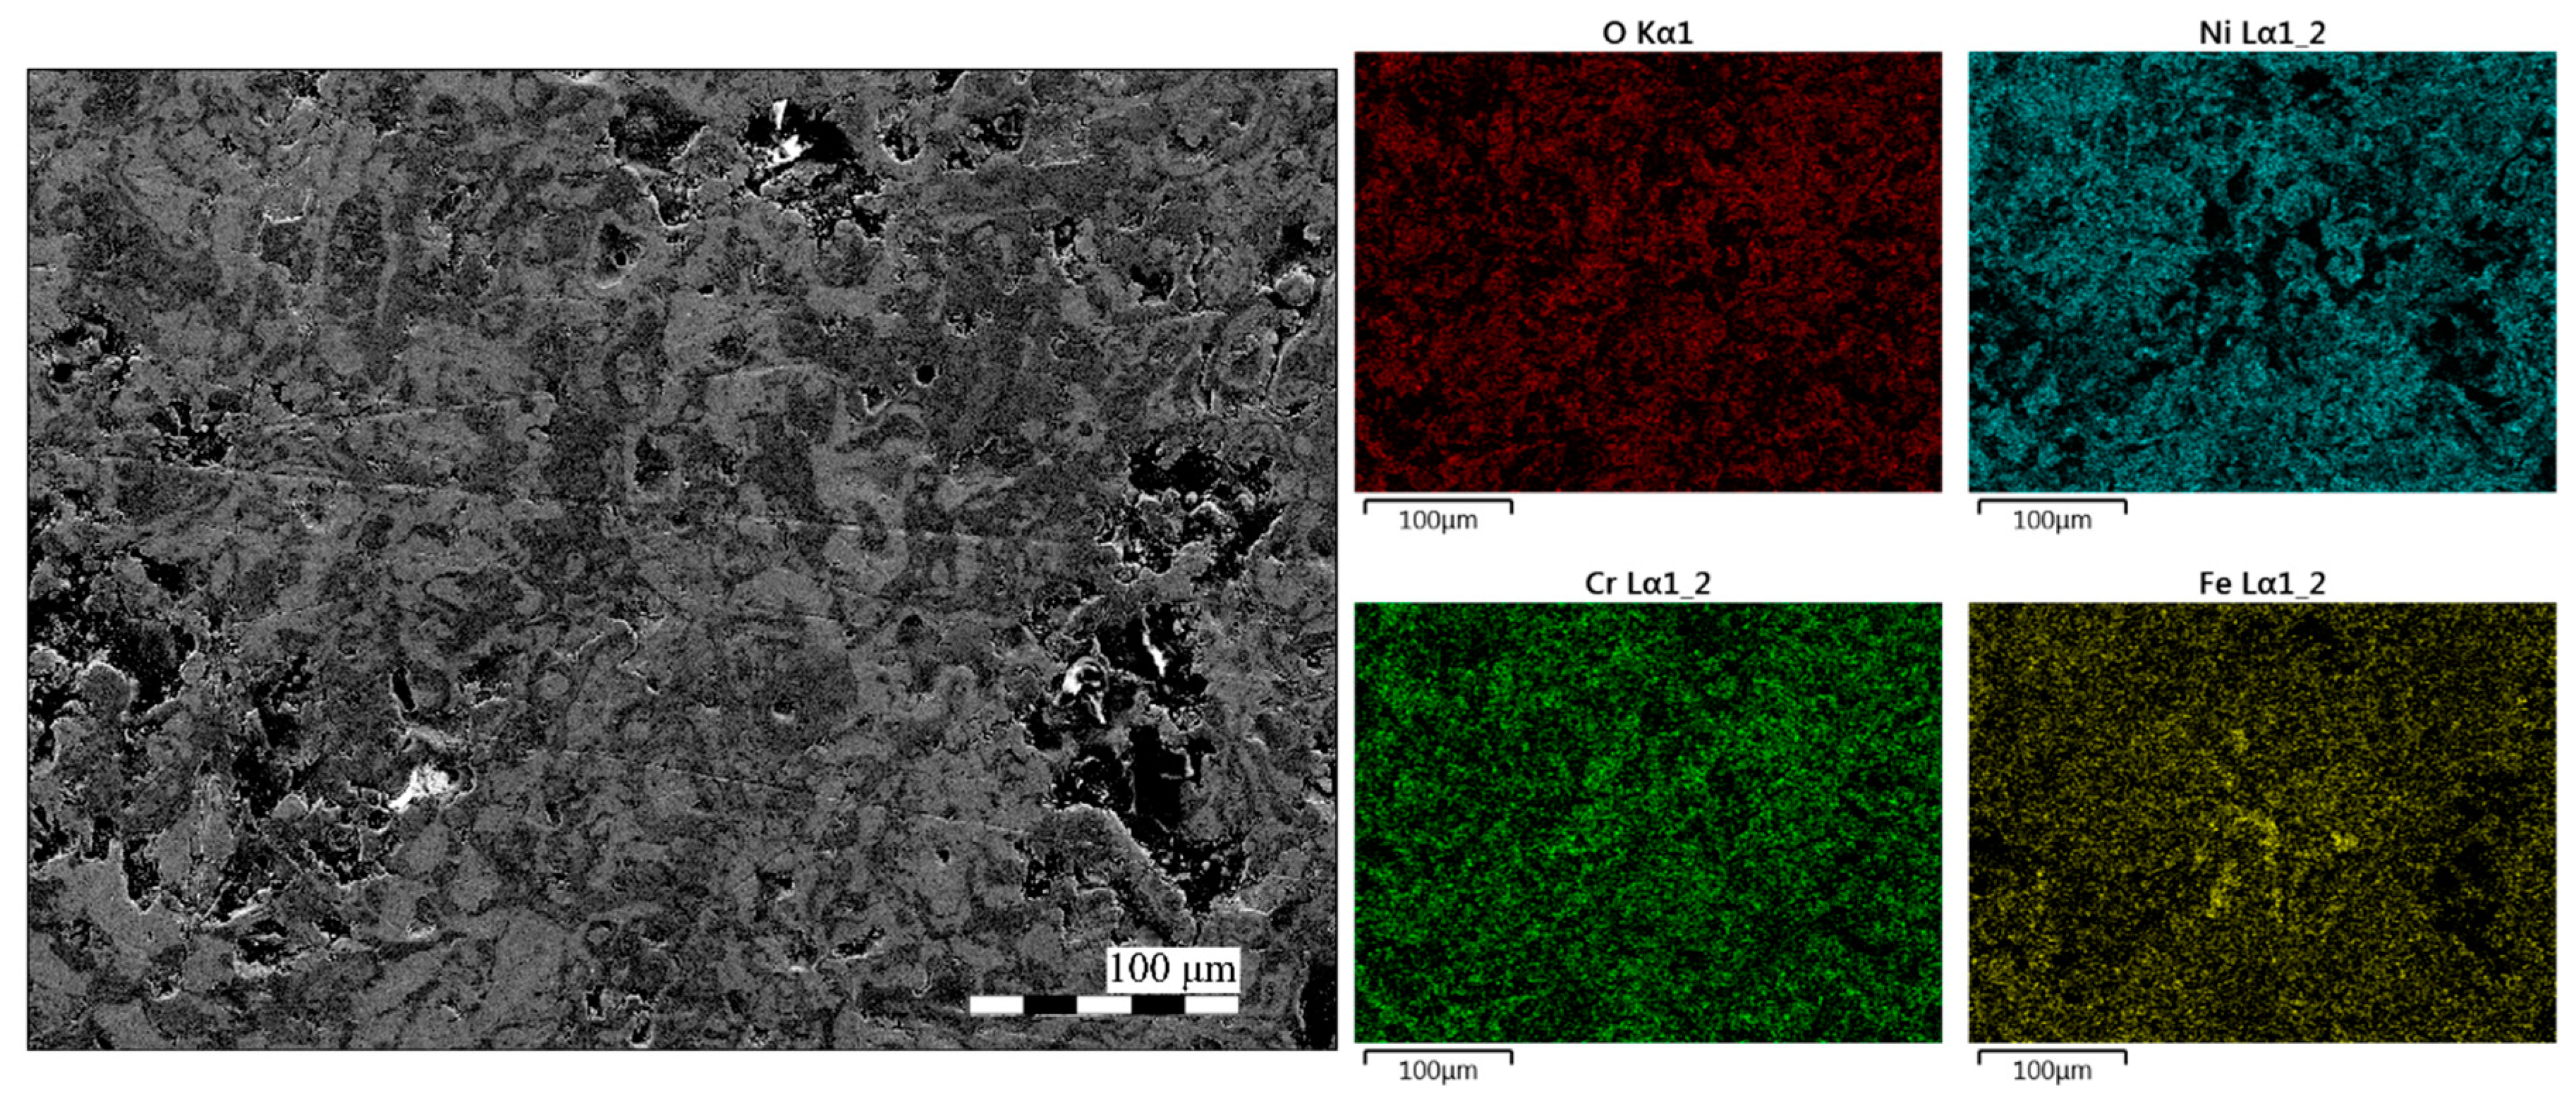
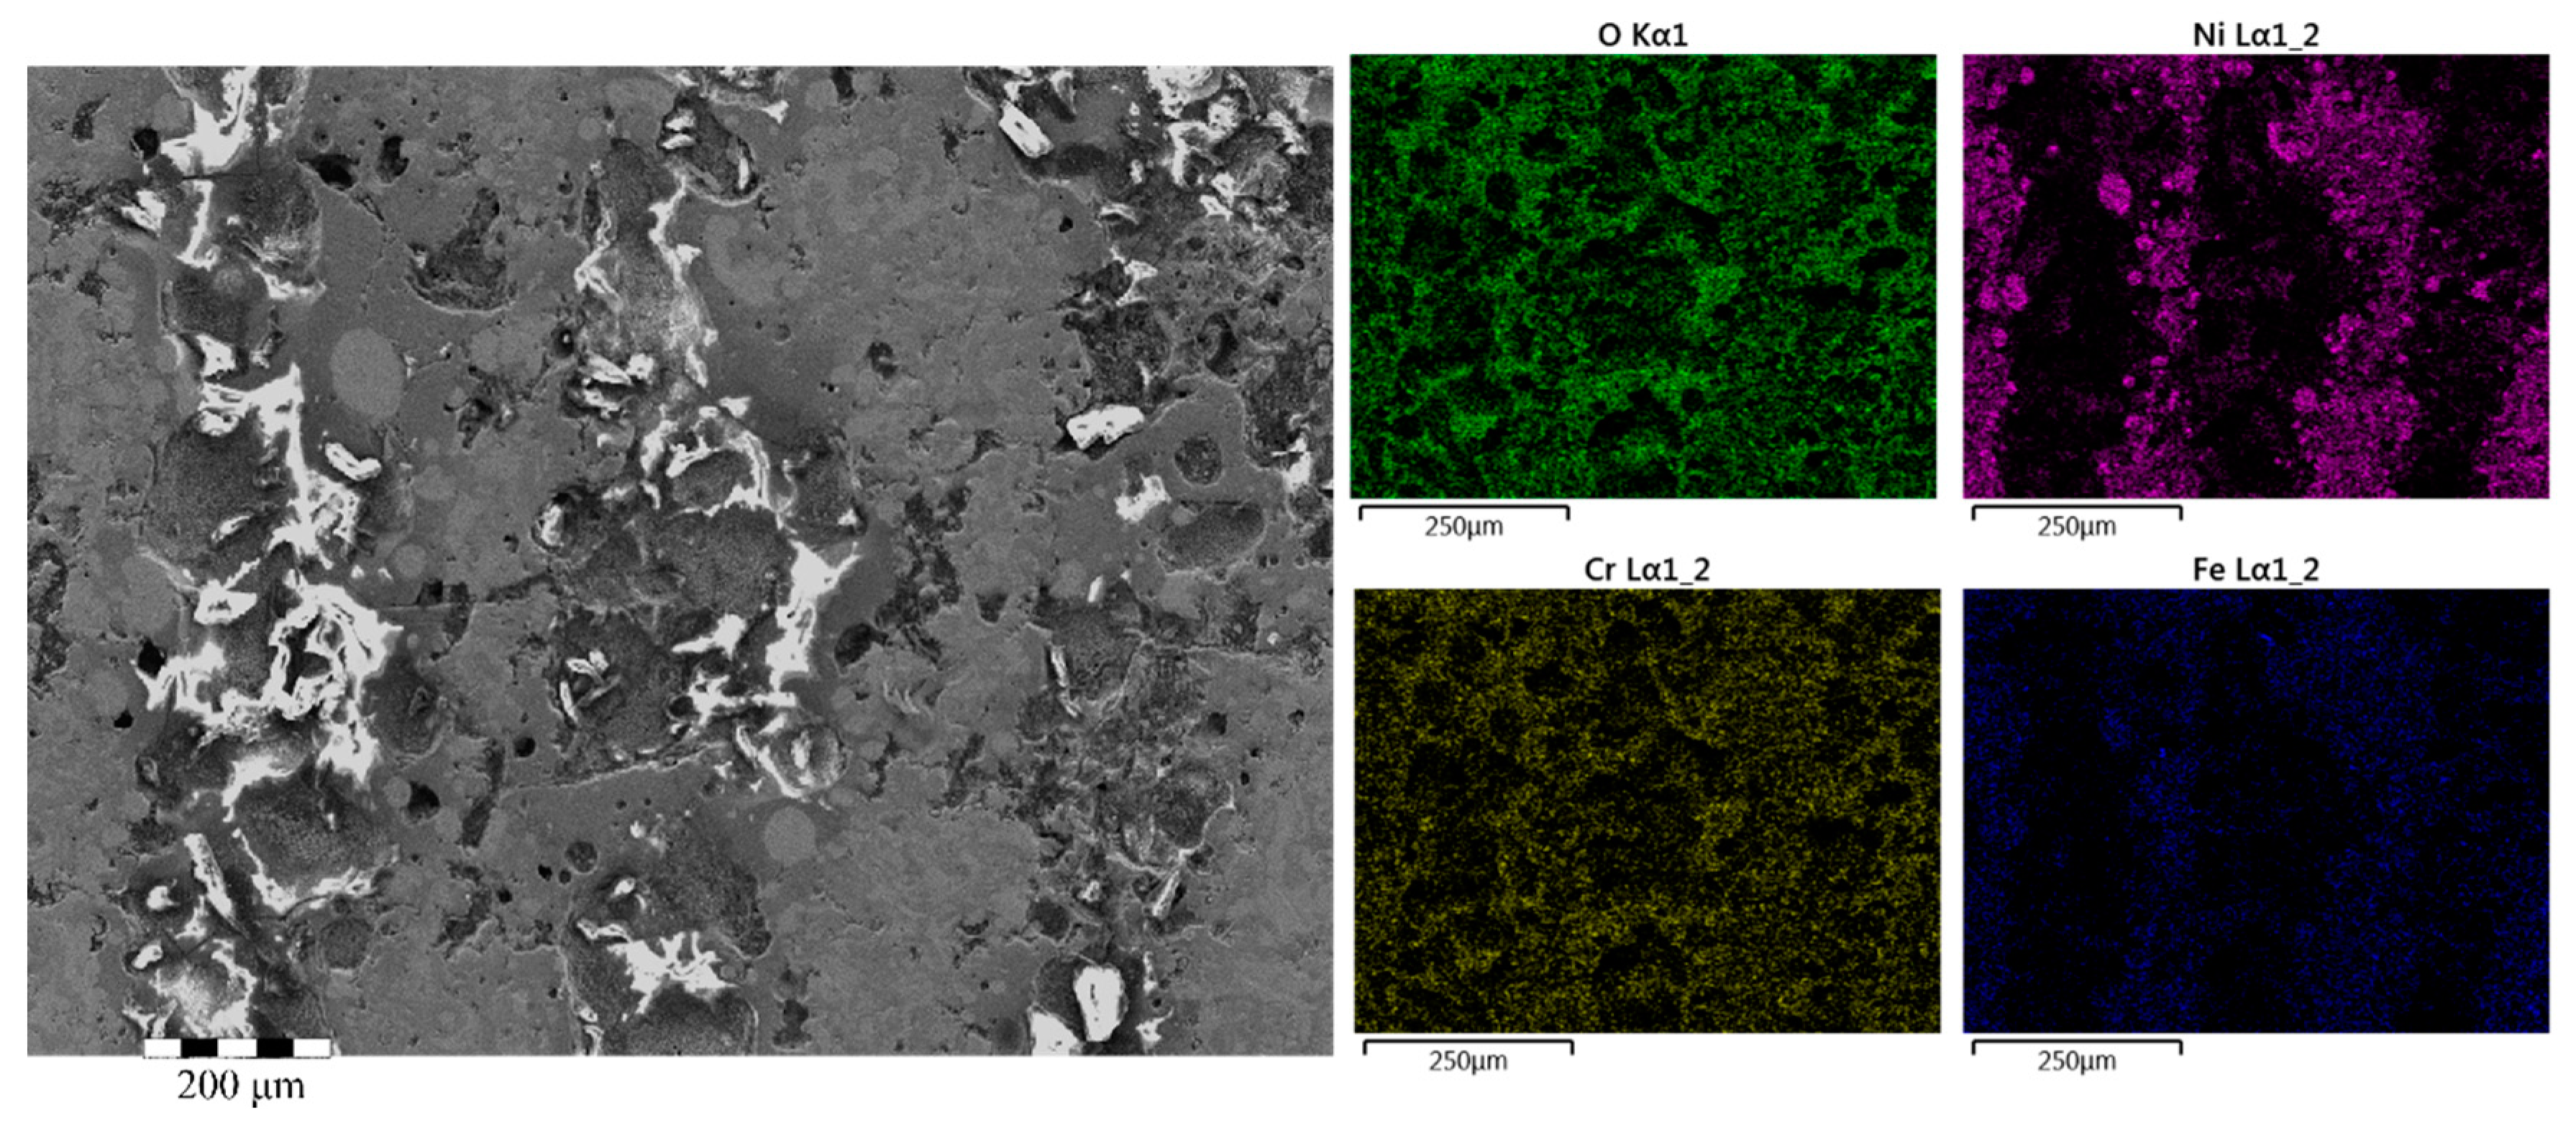
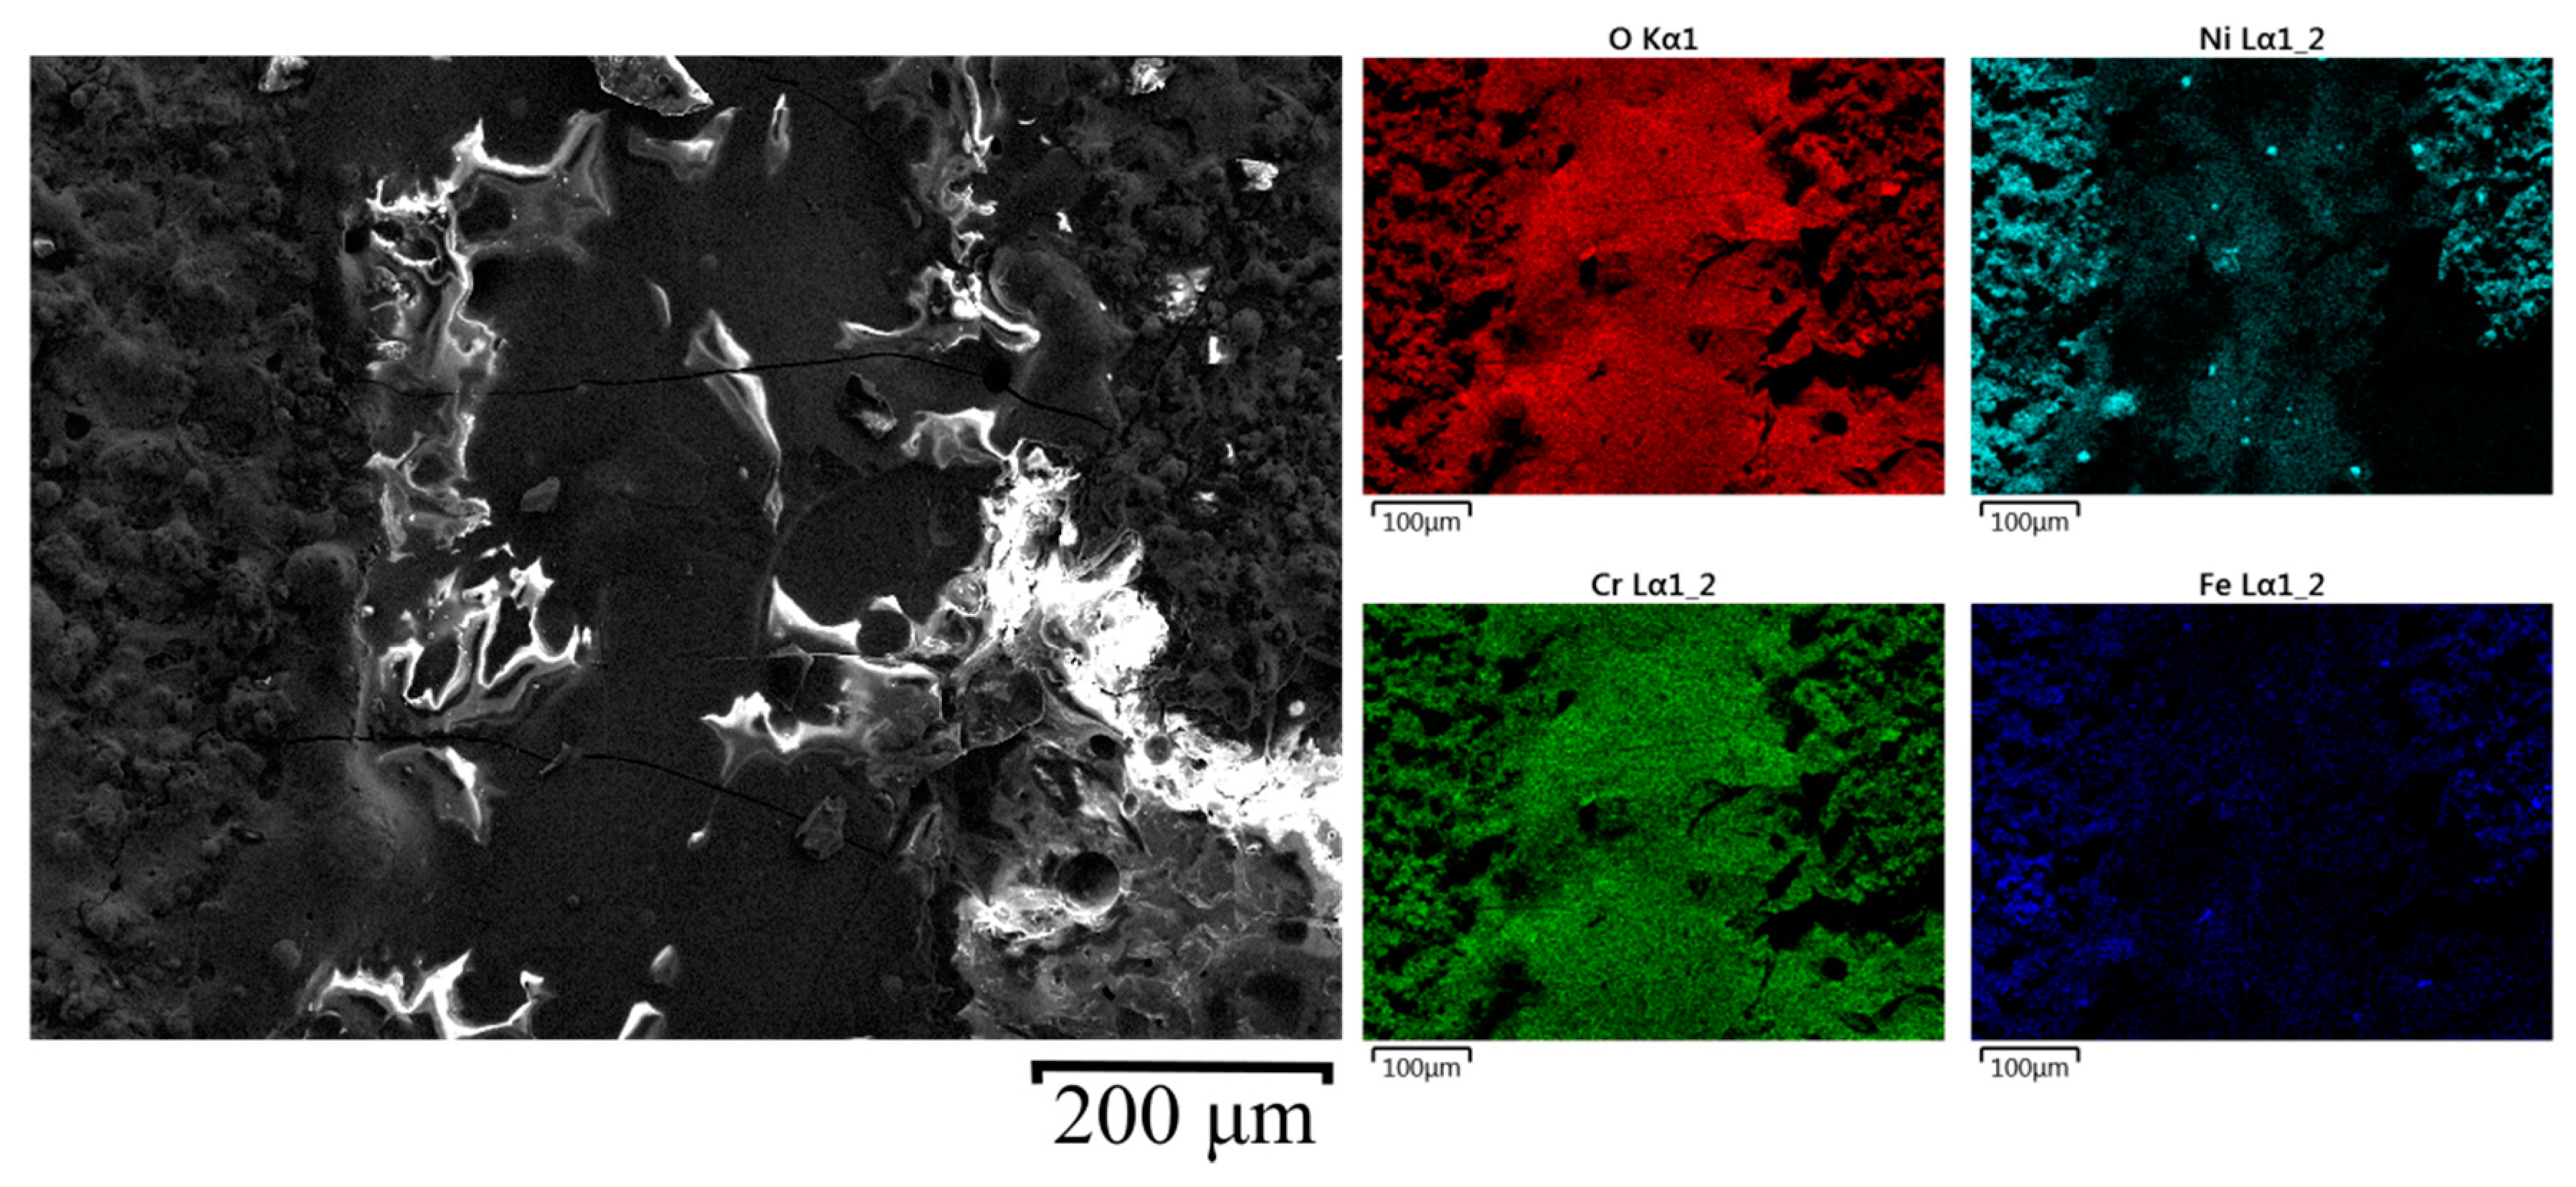
2.1. Metal Oxide Film Composition

The films are formed from metal particles through which oxidation and adherence to a substrate is caused by a flame spray process conducted by 2DHeat Limited. The flame spray process feeds powder through a nozzle into a gas flame aimed at the work piece. Due to the acceleration, heating and atomization of the powder, particles in the powder adhere to the surface it is being sprayed upon. This can be undertaken in a variety of gas environments, but for the manufacture of the films used in this research, the gas environment is at an average sea level atmosphere with the powder having access to oxygen from the environment. This means the powder oxidizes through the flame spray process to a high degree. The powder used within the flame spray process is a Inconel powder (Inconel 600) with approximately 75 wt% Ni, 15 wt% Cr, 10 wt% Fe ( ± 5%) and a particle size of 25 ± 23 μ m [17].
The main elements of the metal oxide film have been investigated using optical microscopy, and elemental dispersion spectroscopy. Previous microscopy into similar films has been undertaken in the literature before. Previous work has examined the change in the powder after flame spray onto the element [17].
The powder used in the flame spray process was found to have regions of metallic alloys present (Ni, Fe, Cr) in addition to oxidized regions of NiO, indicating that there is a mix of oxidation in the powder used in the flame spray process. After flame spraying, it was found that the dominant phase of the film was a NaCl crystal structure comparable to that of NiO. In addition, within the film, be appreciable quantities of metallicity in addition to the NiO were found. Regions of Ni, Fe and Cr metallicity, as well as a spinel phase, were found through XRD and optical microscopy [17].
Within the initial powder, there is a variety of elements present but only three distinct regions of metallic regions, oxide regions and spinel phase can be separated. This is due to the similar lattice parameters of the nickel, iron, and chromium. Another reason for a lack of iron oxide and chromium oxide in the XRD diffractogram is that the nickel oxide matrix can integrate appreciable quantities of Fe and Cr at high temperatures.
This suggests that NiO integrates large quantities of Fe and Cr at high temperatures within the range of parameters in the flame spray process. The balance of elemental components before flame spray is shown in Table 1 [17].
The morphology of the film can be separated into two categories, the oxide phase and metallic regions. An image of the cross-section of the film is shown in Figure 2. This shows how the metallic and oxide phases are arranged into an inhomogeneous layered pattern with several defects present. The origin of these defects is attributed to the differing metallicity and oxidation in the initial powder, size of particle in the initial powder and path through the flame spray nozzle. This image is indicative of the morphology of the film with the patterns seen matching with that seen in previous work on nickel oxide flame sprayed films [17].

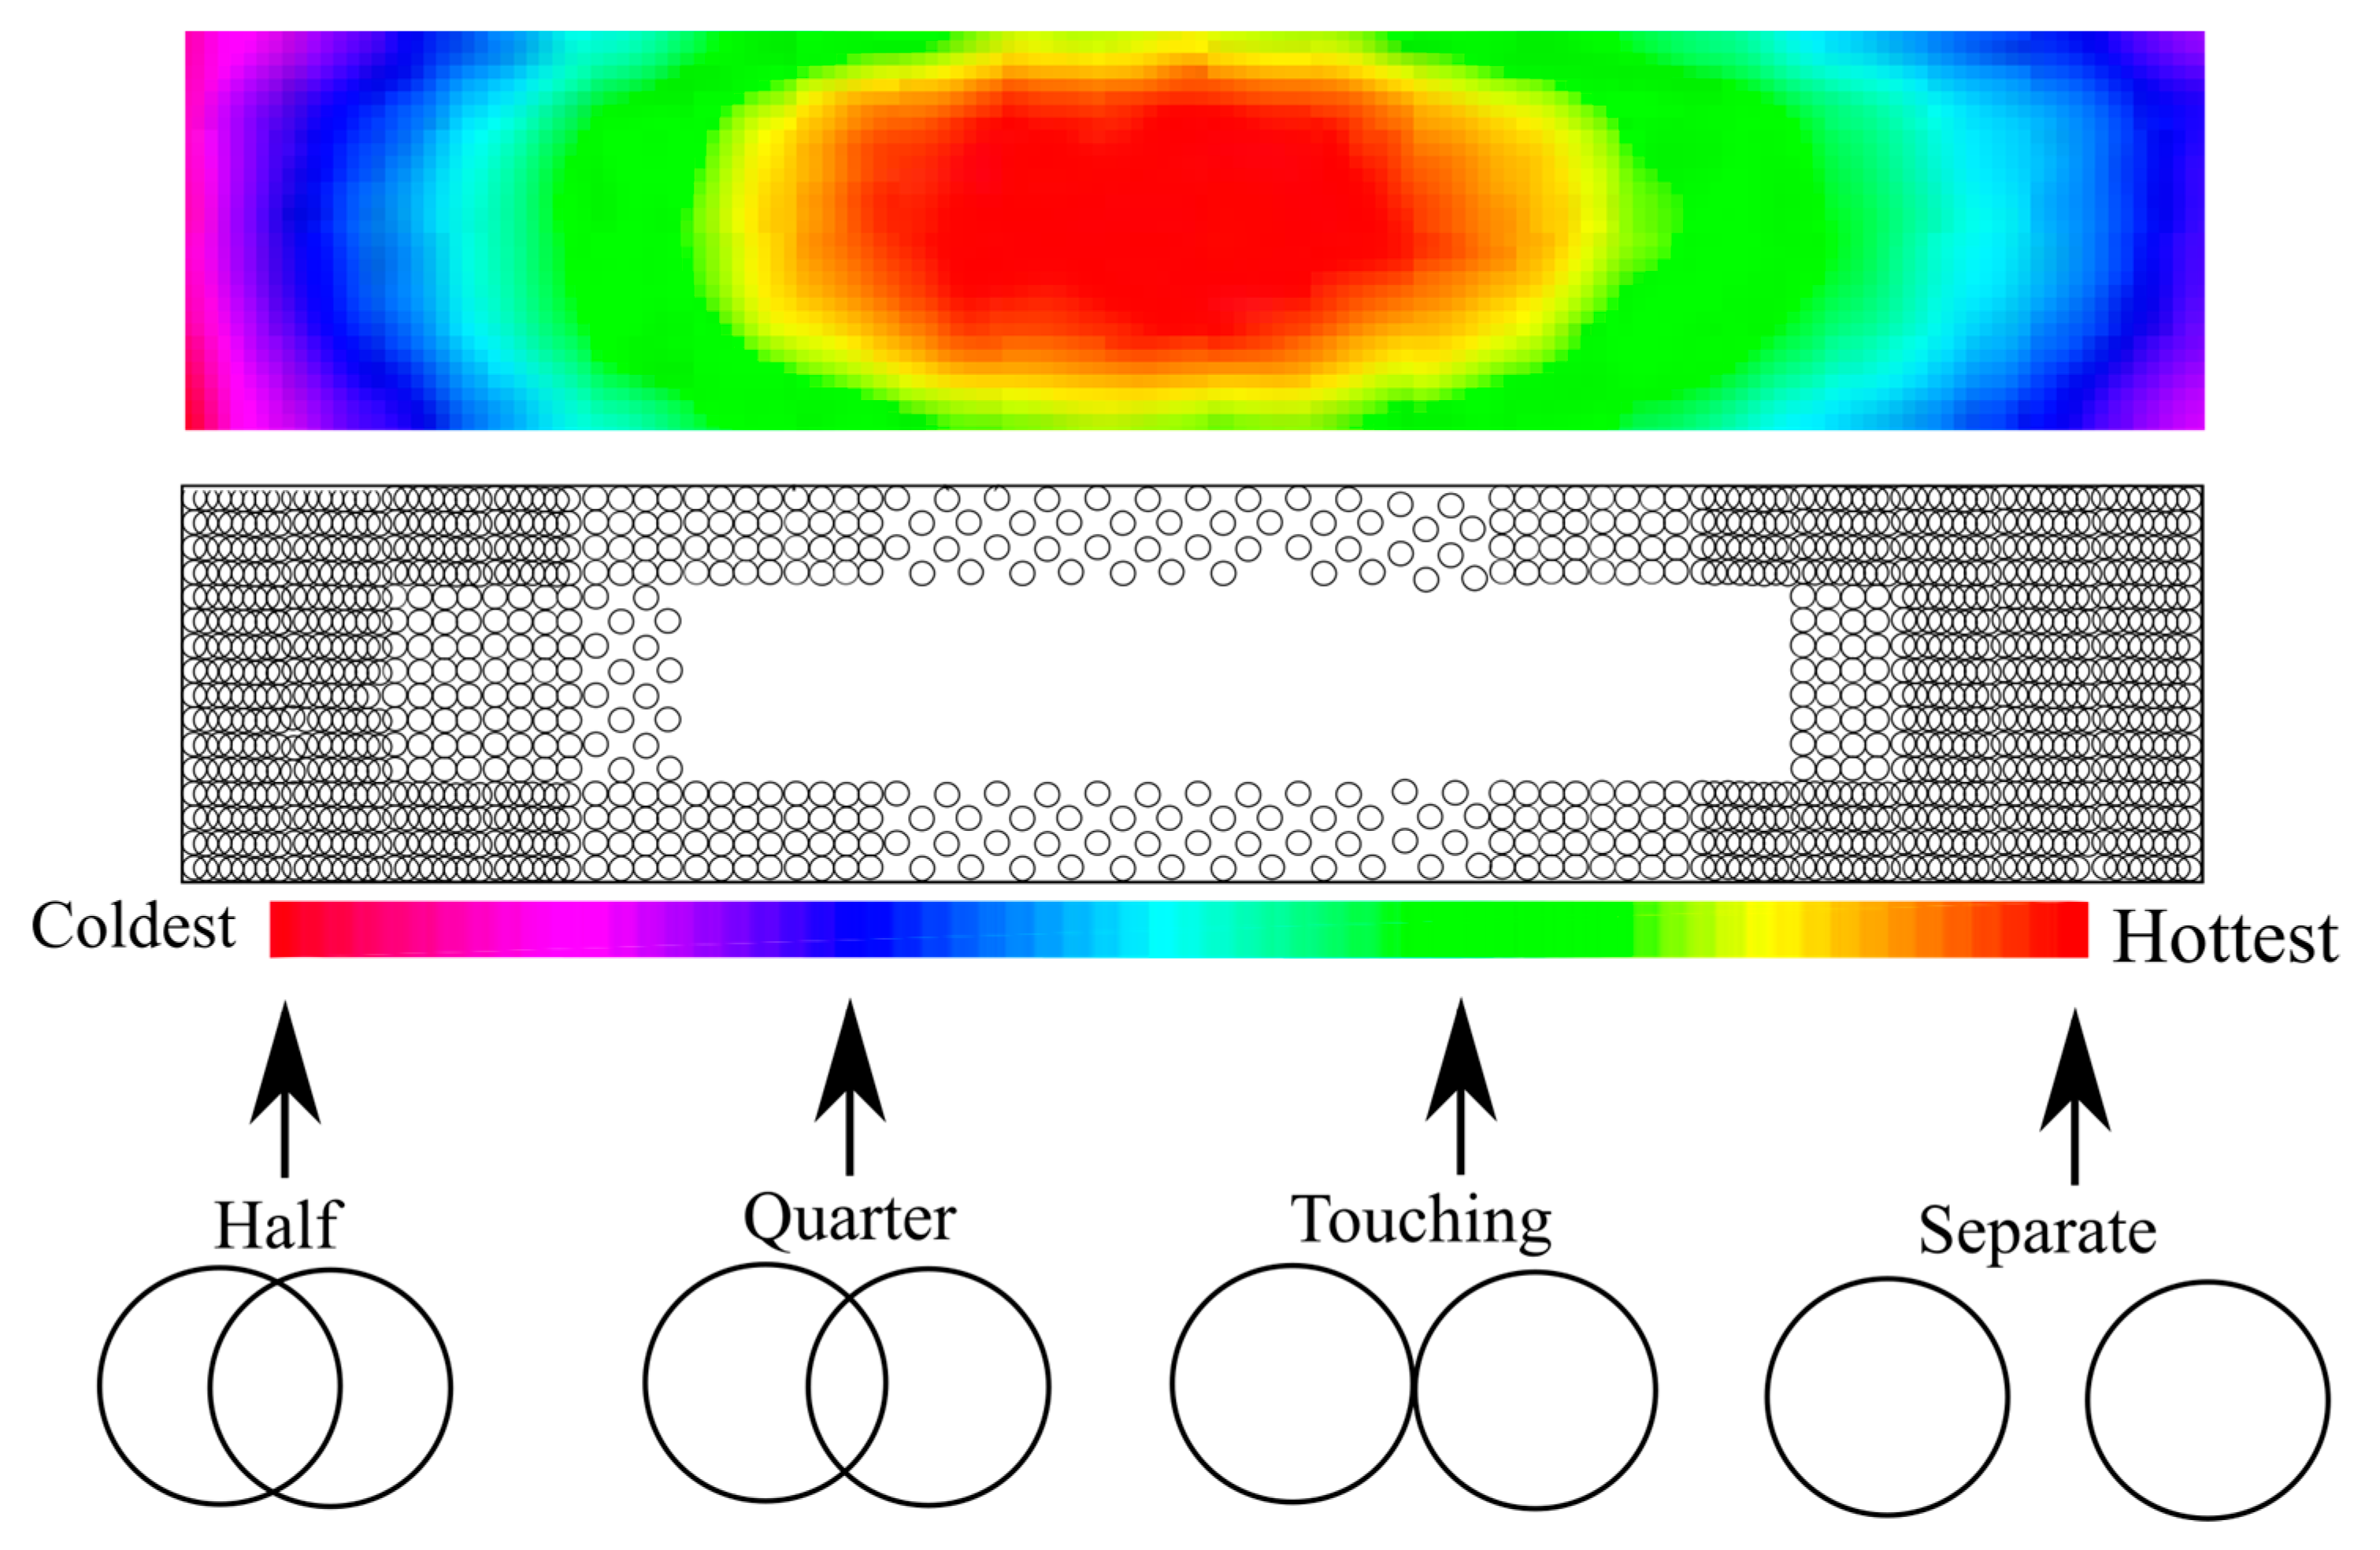
2.2. Model of Thermal Profile Uniformization of Electrical Heating Panels through Targeted Current Density Increase

Electrical heating elements produce heat through the transference of electrical energy into thermal energy. The mechanism for this process is through the collision of the electrons with the ionic lattice of the conductor. The expression for the heat production due to this process is shown in Equation (1):
d P d V = J 2 ρ
The differential heat output (P) by a conductor per unit volume (V) is given by the product of the squared current density through a conductor (J) and the resistivity ( ρ ) of the conductor [30]. This expression shows how the heat production is proportional to the square of the current density. This means that the main heat generation by the element occurs in the regions with the highest current density. Table 2 shows the resistivity of the main constituents of the film.
The origin of the hot spot within the film is due to current density flowing across the conductor, its exact shape and dimensions are governed by the exact geometry and composition of the conductor. Since the un-treated element has a roughly consistent thickness and the geometry of electrical connection is two bus bar connections along parallel edges, this generates a circular hot spot in the center as shown in Figure 1. The model of effect on the surface is the targeted laser ablation of the thickness on the element in select areas selected by the thermal camera. This increases the current density in and around the ablated areas, leading to a higher heat output.
From Table 2, the main current-carrying constituent of the film is shown to be nickel with a resistivity of 69.3 n Ω · m as this has the lowest resistivity out of all the main components. This is important to consider as the investigation of SEM-EDX shows the decrease in nickel metallicity by laser treatment. Since the leading term of the equation of heat production (Equation (1)) is the current density, any alterations in the local current density in a conductor means that at the affected regions, the heat production will be higher than before.
Current density has two aspects, the magnitude of current through the region and the cross-sectional area over which the current is flowing. By reducing the cross-sectional area of the current paths and maintaining the same magnitude of current, the current density can be increased and as a result, the heat output increased. This is the model of treatment that is used within the research where through laser ablation, the number of current paths within localized regions is decreased and, as a result, the heat output in comparison to before the treatment increases. Thus, the amount of heat production in that area, compared to other areas not treated, rises.

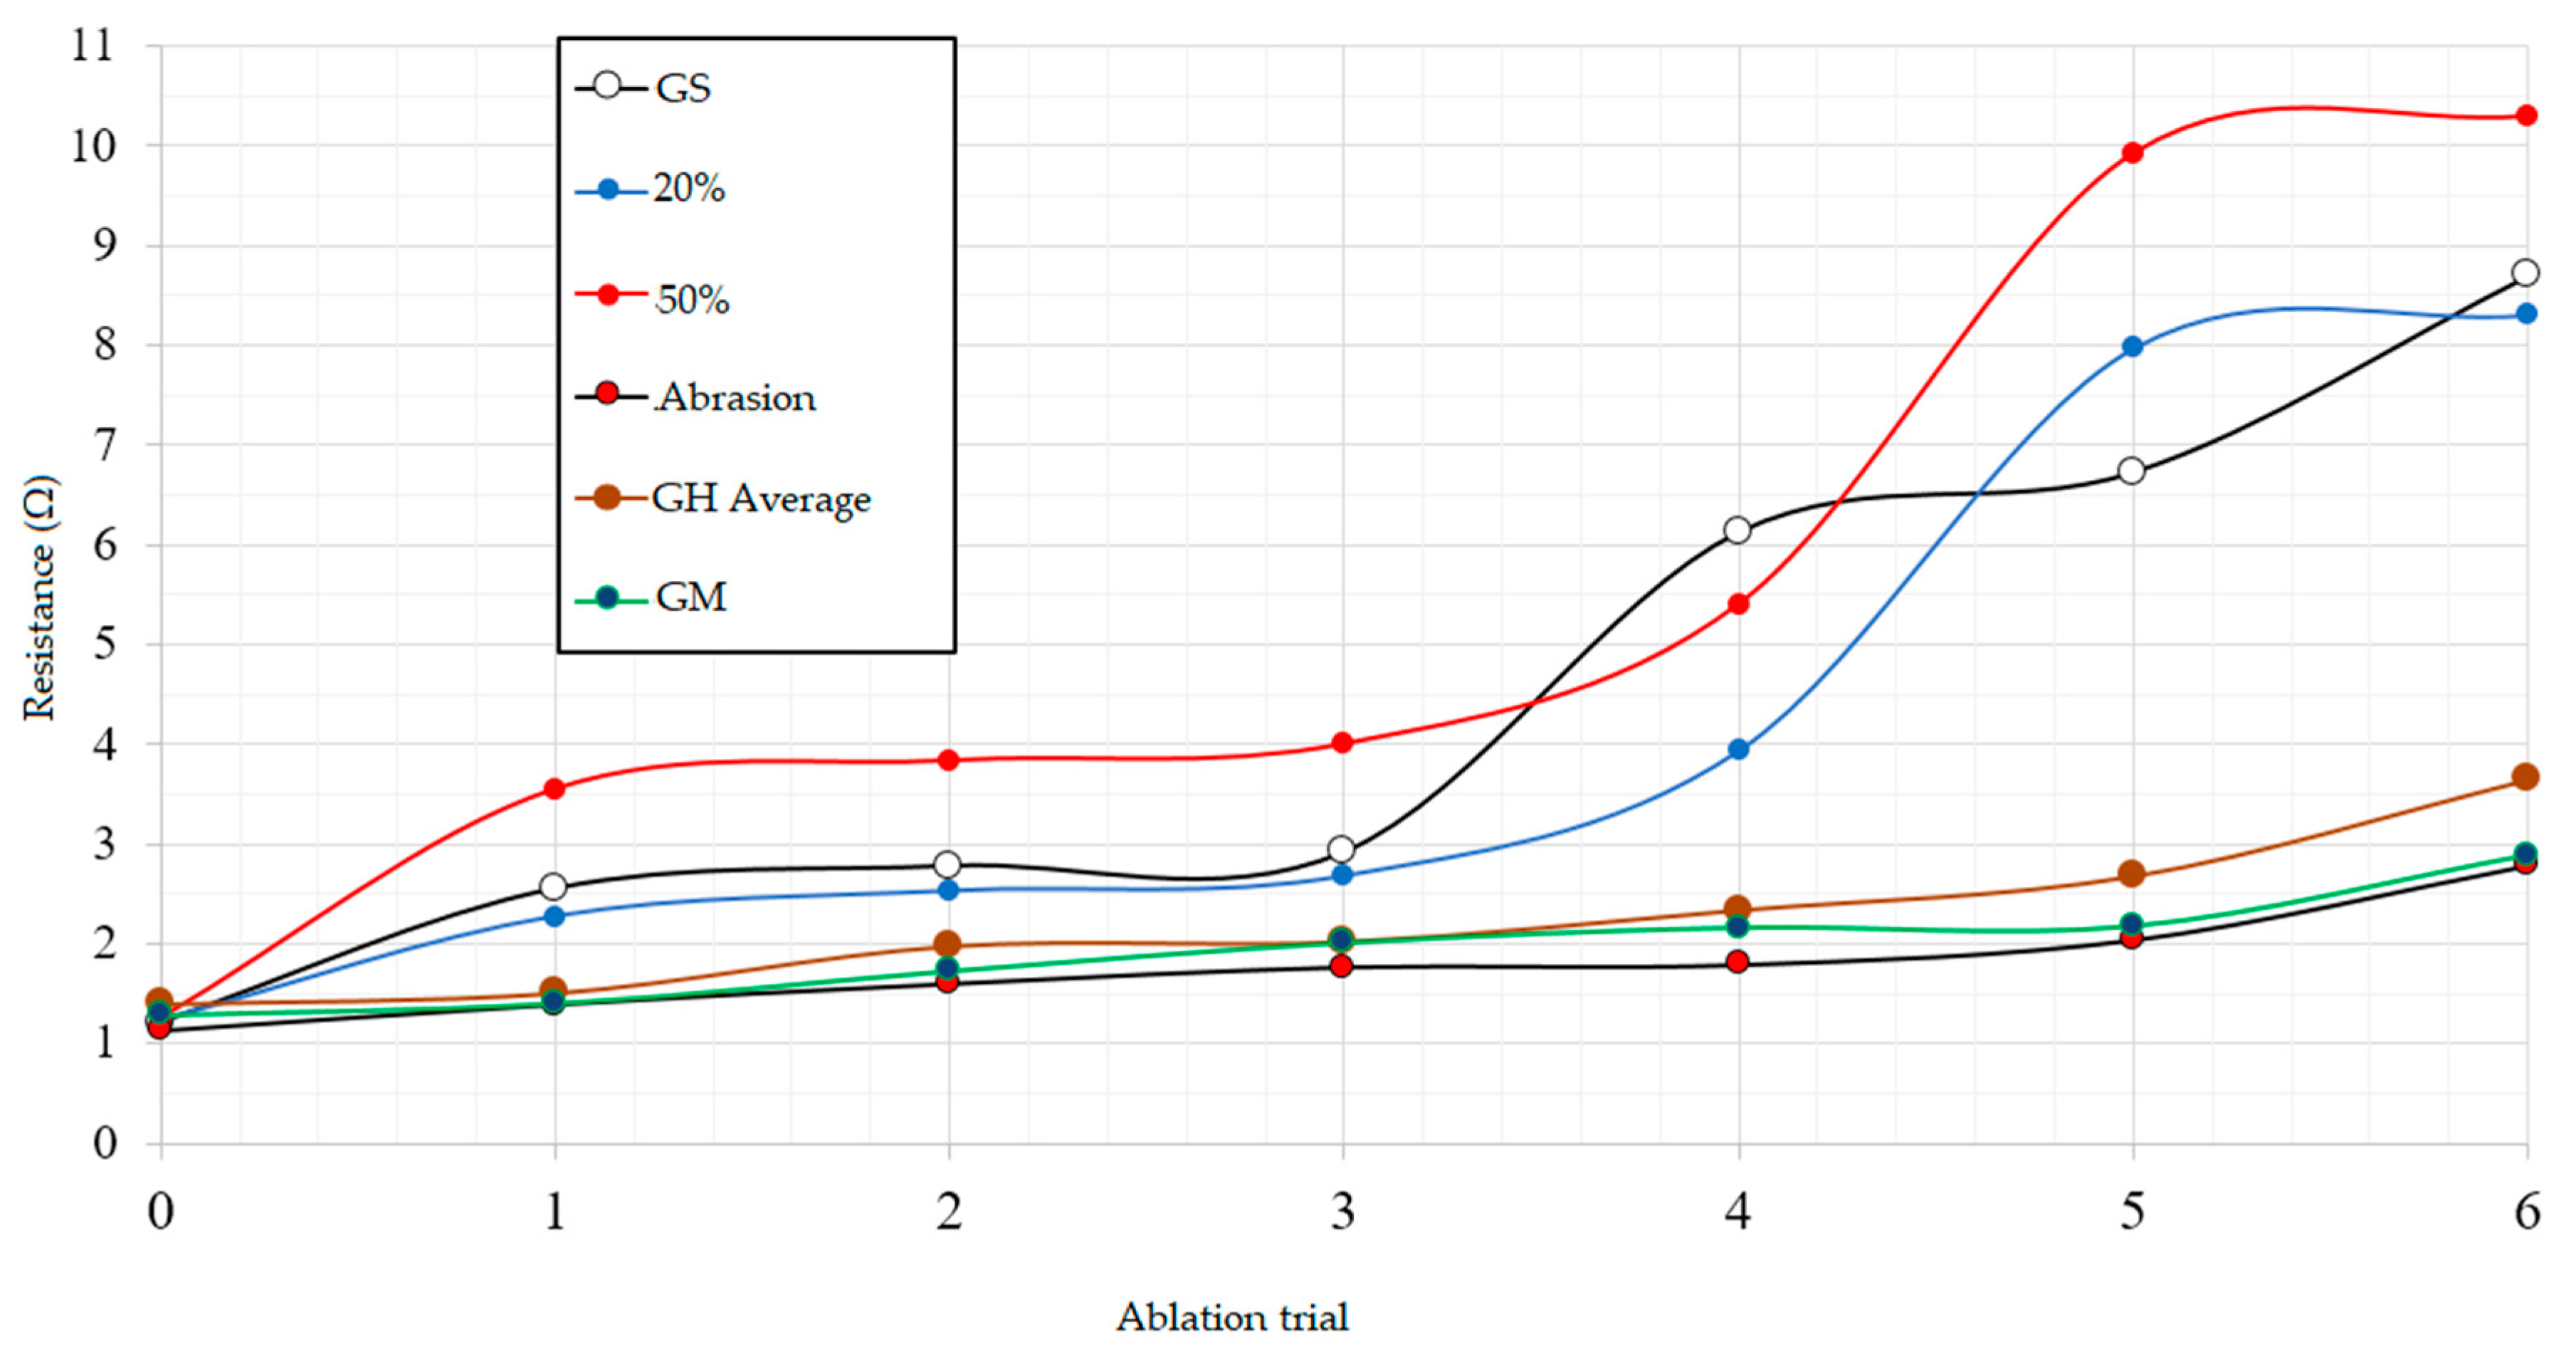
2.3. Resistance Measurement through the Four-Probe Method

The resistance of each element was found after each ablation cycle. This was recorded as it was useful for comparing the amount of damage each film had obtained in each ablation cycle. This is because the change in resistance is proportional to the change in thickness of the film. The measurement of the resistance was done through a four-probe line resistance method. This method was chosen because it reduces the effect of contact resistance on the measurement of the resistance and the resistance can be measured more precisely than with more traditional two-probe resistance measurement techniques. Figure 3 shows this method, the first probe is kept in the same position on the element and then the second probe is moved at regular intervals along the element; the voltage between these probes is recorded with the voltmeter as well as the total current flowing through the element form the power source. The data of the voltage between the segments is graphed and then the gradient is taken, which is used to find the resistance of the element with the recorded current through Ohms Law [32].

2.4. Laser Ablation of Metals and Oxides

The treatment mechanism relies upon the ablation of small regions of the element film surface to reduce the current density of the film in localized areas when powered so that treated regions generate a greater heat output than other regions to balance out the thermodynamic loads on the element, as well as the intrinsic inhomogeneity of the temperature profile of the element. To achieve this ablation, laser ablation is employed. This is because of the high speed, accuracy and versatility of laser ablation systems [33].
A 40 W maximum-optical-output commercial continuous with pulsed operation laser engraving device manufactured by Orion Motor Tech (10.6 µm CO2 laser with a 0.13 mm beam width) is used as a laser system. A pulsed beam is used with a gaussian pulse profile and intensity profile. When the beam is incident upon the material, a proportion of the light is absorbed, reflected and transmitted through the material. The proportion of light within each category depends on the wavelength of light and the media with which the light is interacting.
α = 2 ω σ c 2 ϵ o
The proportion of light reflected or absorbed and transmitted through the material is given by the absorption coefficient. Equation (2) states the absorption coefficient (α) of light with angular frequency ω , assuming a Drude model within a conductor with the conductivity σ where the constant c is the speed of light and ϵ o is the dielectric constant [34]. This states that the greater the conductivity of the material, the greater the absorption coefficient. This means that materials with a lower conductivity absorb a greater proportion of the laser beam energy when the beam is incident upon it. Since the resistivity of the oxidized film coating is on the order of 548.1 n Ω · m, this shows that the absorption coefficient of the laser on the oxidized surface is 2850   cm 1 , showing the laser will be strongly absorbed by the film. This corresponds closely with values of the absorption coefficient of 2000   cm 1 reported within the literature [31,35].

3. Film Processing Method

Initial tests took place to calibrate the laser settings to achieve the optimal combination of the speed and laser power to use on the material. A range of scanning speeds (10 mm/s to 300 mm/s) and laser powers (10 W to 30 W) were used to ablate the film; the effects of the four extremes of the laser’s settings are shown in a matrix in Figure 4. The laser in these tests was set to a continuous operation with the resultant fluence calculations taking account of this fact. The upper layer of the film has been ground to remove some of the oxide layer on top so that the difference in the composition of the dross and the size and morphology of the laser lines can be examined.
It can be seen in Figure 4 that the main effect when the laser power is increased is the increase in oxidation of the metallic film and the increase in size of the ablated channel. Evidence of this is seen through the decrease in the lighter metallic regions and increase in the darker oxide regions. The appearance of the film without ablation can be seen on the edges of each line of ablation, which shows a mix of metallicity and oxide.
To further investigate how deeply the laser penetrates the film and the effect of the pulse of the laser on the material, unablated and ablated films were cross-sectioned and polished. A trial is shown in Figure 5 and Figure 6, wherein the unablated film is shown at several locations in Figure 5, and the same film ablated at 30 W with a scanning speed of 300 mm/s corresponding to an applied fluence of 0.5 J·mm−2 is shown in Figure 6. The laser lines are perpendicular to the image cross-section.
The film’s cross-section, as shown in Figure 5 and Figure 6, show a change in composition similar to that seen with the optical images of the films’ surface. The metallic regions have decreased and there is an increase in the oxidation of the film. Through the laser ablation, the majority of the depth of the film has been affected by the heat from the laser, as shown by comparing the images. This shows that the heat-affected zone of the laser must be reduced as much as possible.
The effect on the elemental constituents of the film from the laser interaction was determined by comparing electron dispersion spectroscopy imagery, as well as SEM imaging of the laser lines at higher resolution on the film surface. This was achieved with a JEOL JSM-7800F SEM EDX at 10 eV.
Figure 7 shows the composition of the unablated film with the upper surface of the film ground away. The elemental maps of the unablated film in Figure 7 show that there is a mix of nickel chromium and iron across the films with a homogenous distribution across the film. It is also seen that the darker regions of the film correspond to an increase in oxygen on the elemental map, which indicates the presence of oxides in these regions.
Figure 8 shows three vertical laser lines along the film with the upper dross of the laser line and the surface of the film ground down so that the bottom of the laser channel is at the same height as the surrounding film. There is a clear change in the elemental maps when comparing the film before and after ablation, the amount of nickel and iron has drastically decreased in the laser lines. The amount of oxygen appears to be similar with a small increase in the amount of oxidation around the laser lines. This is expected as the films are already highly oxidized.
Within Figure 9, the laser channel has been visualized at a higher resolution to view the changes in the film composition within the heat-affected zone; this laser line has not been ground so the dross and raw film surface was observed. Within the heat-affected zone, the nickel content has decreased and the oxidation in the heat-affected zone and laser line has increased. This confirms what has already been observed with the optical imagery and the other SEM-EDX images.

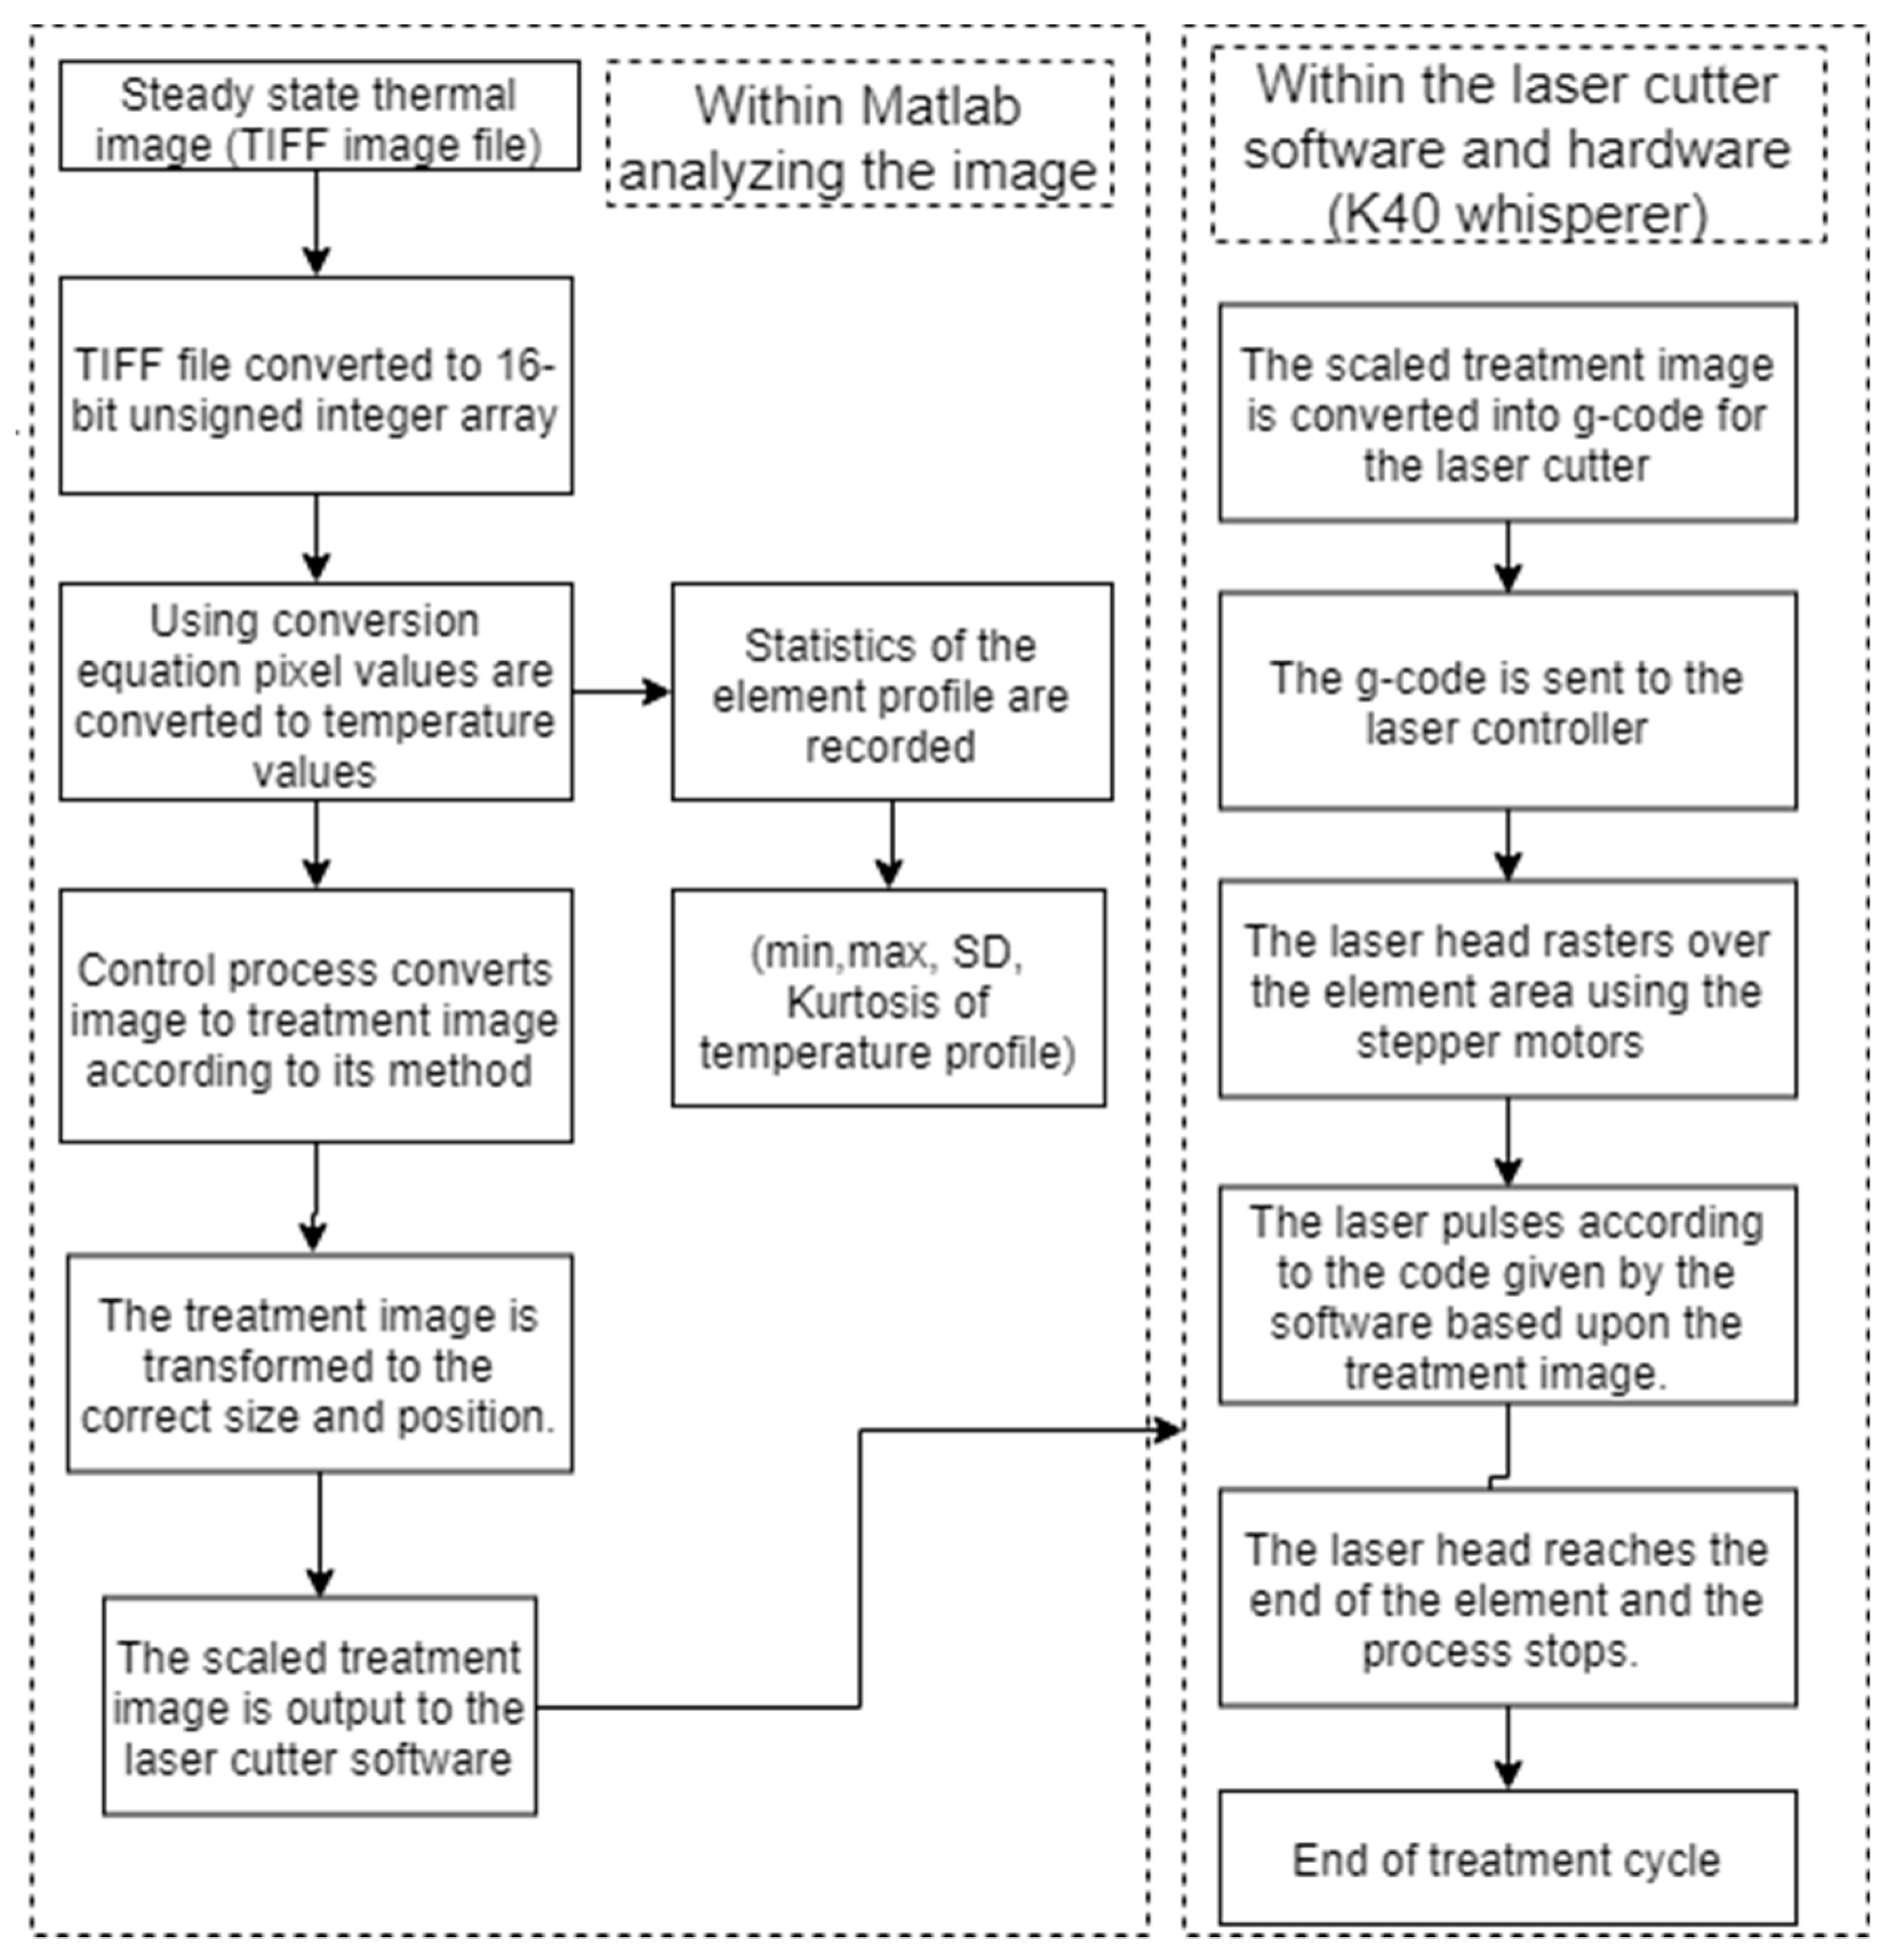
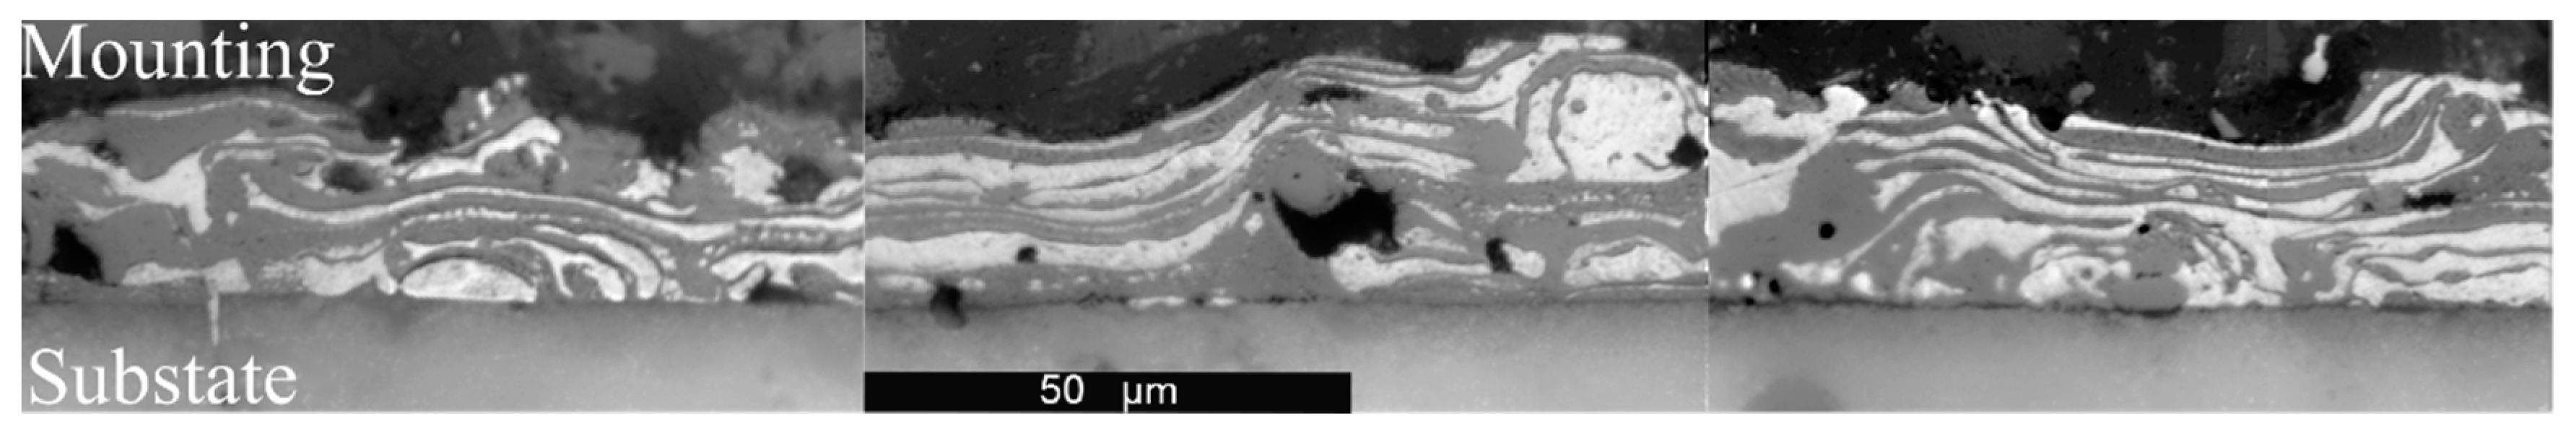
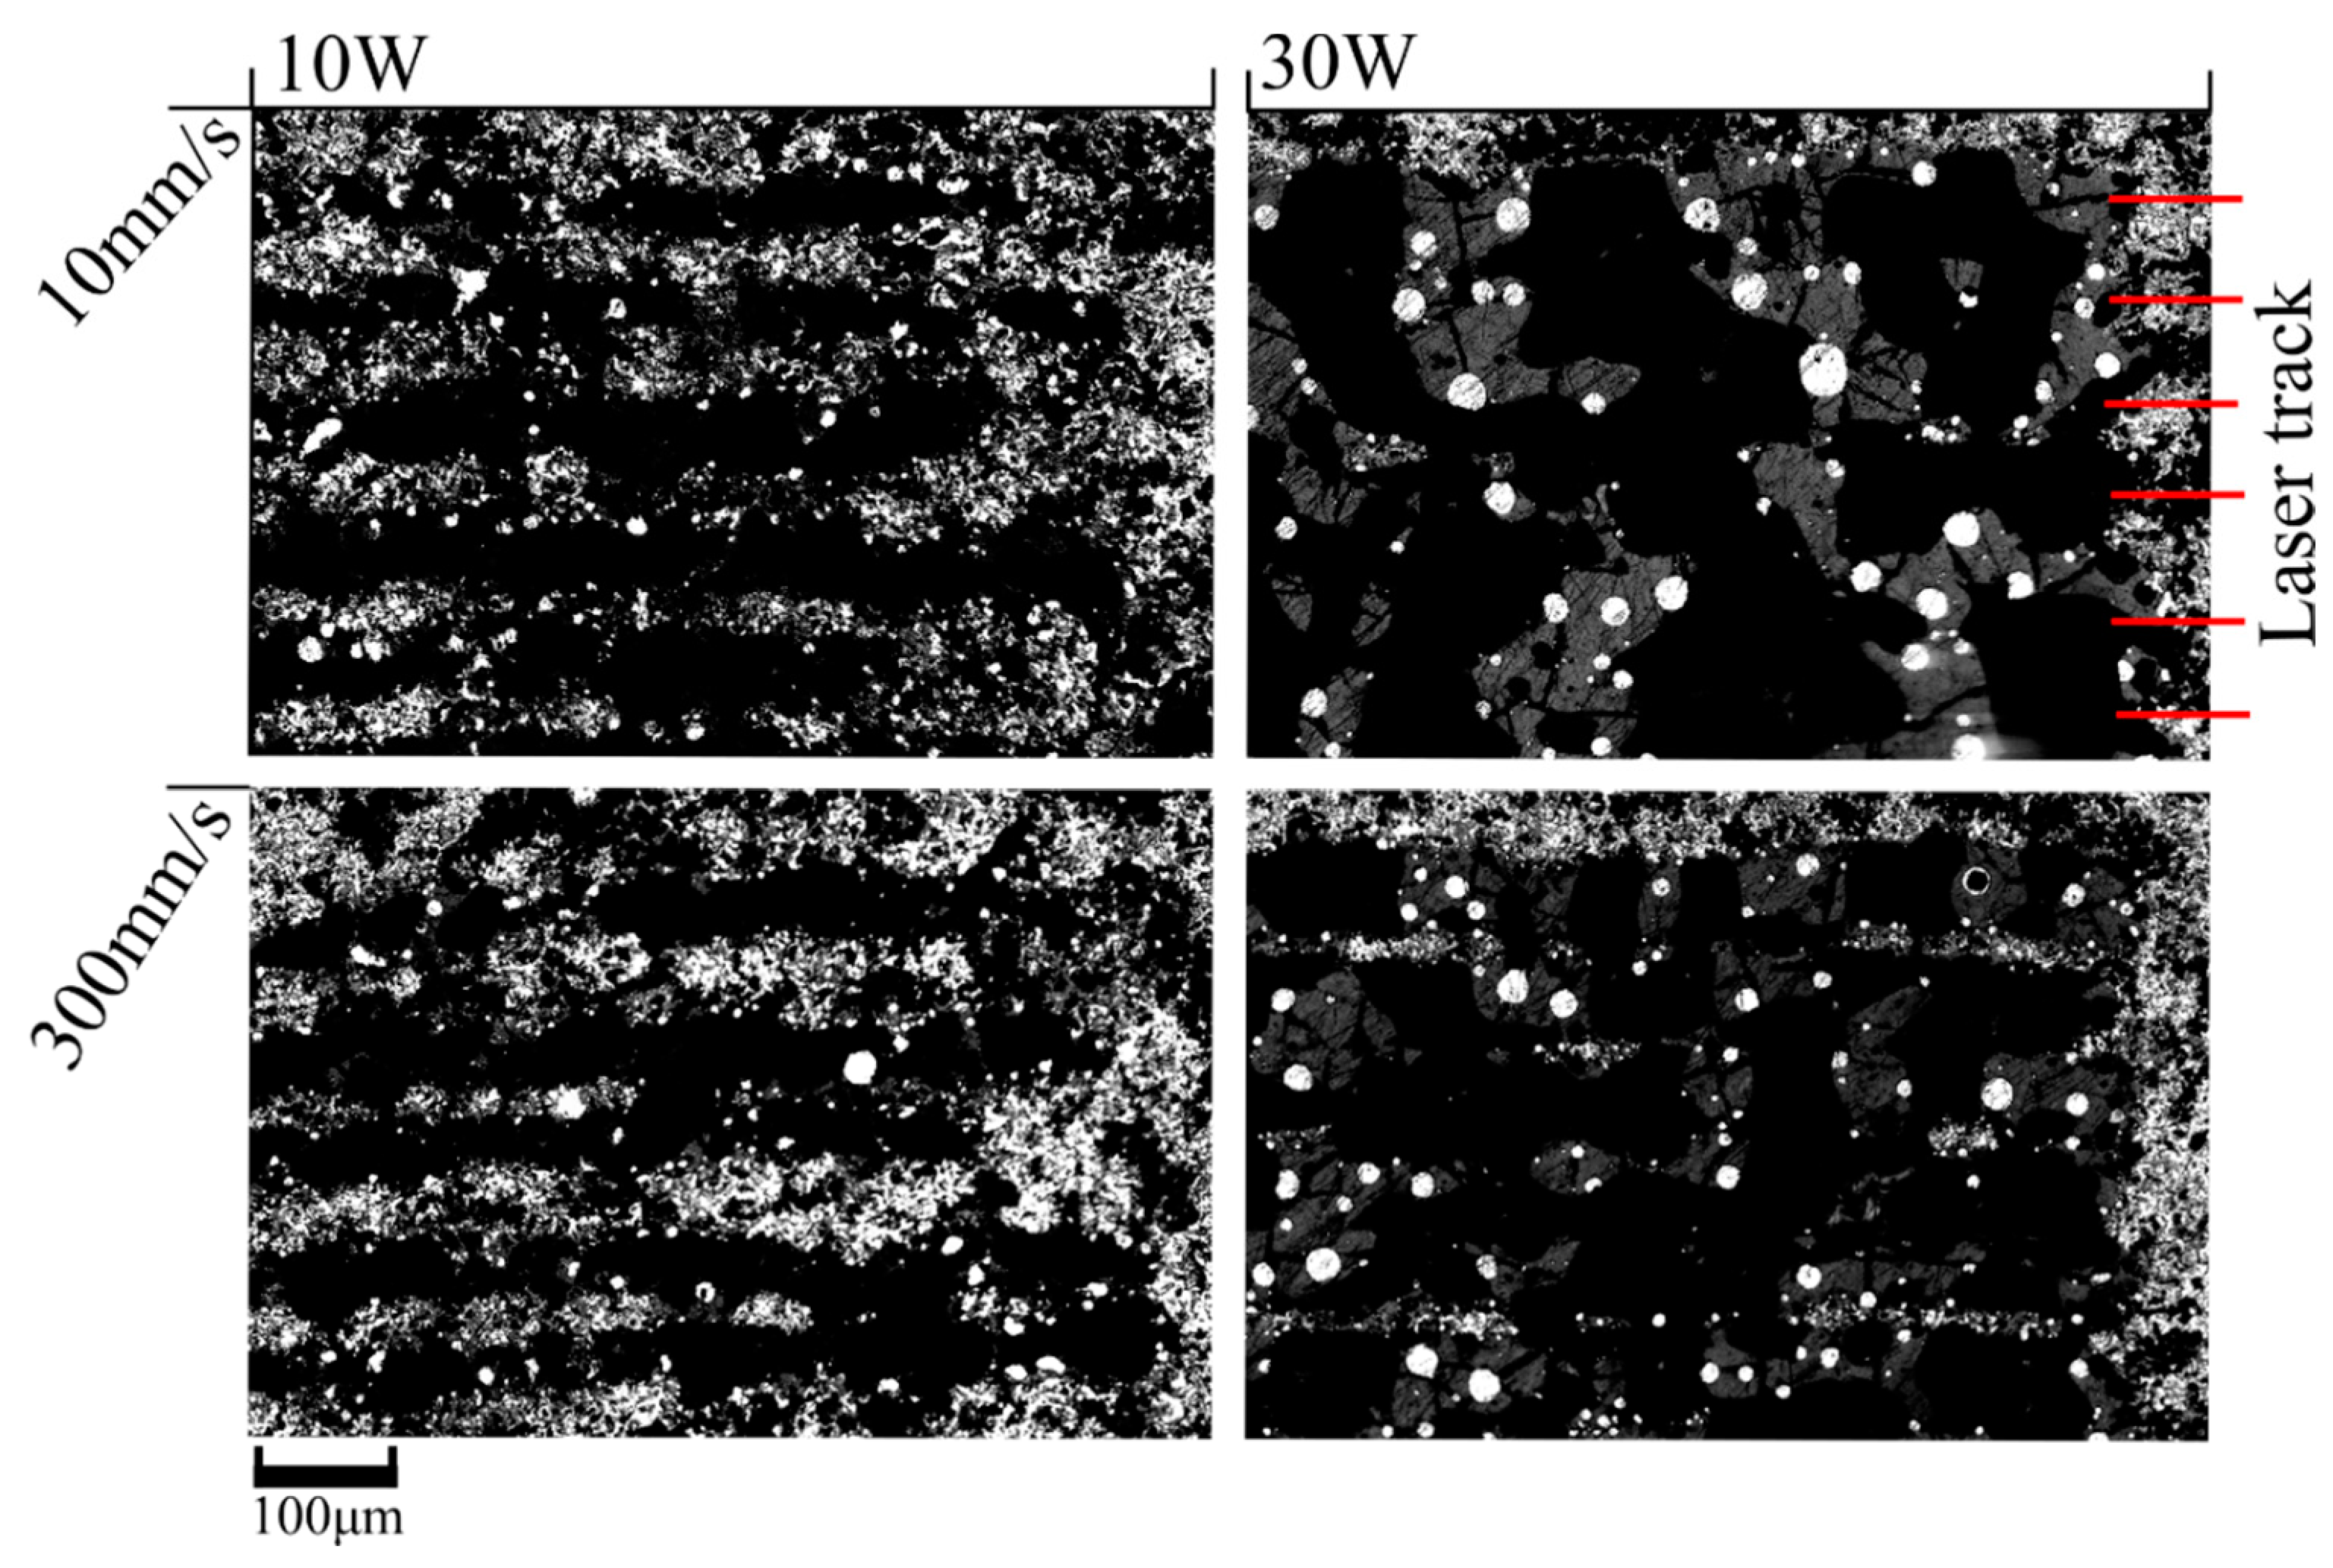
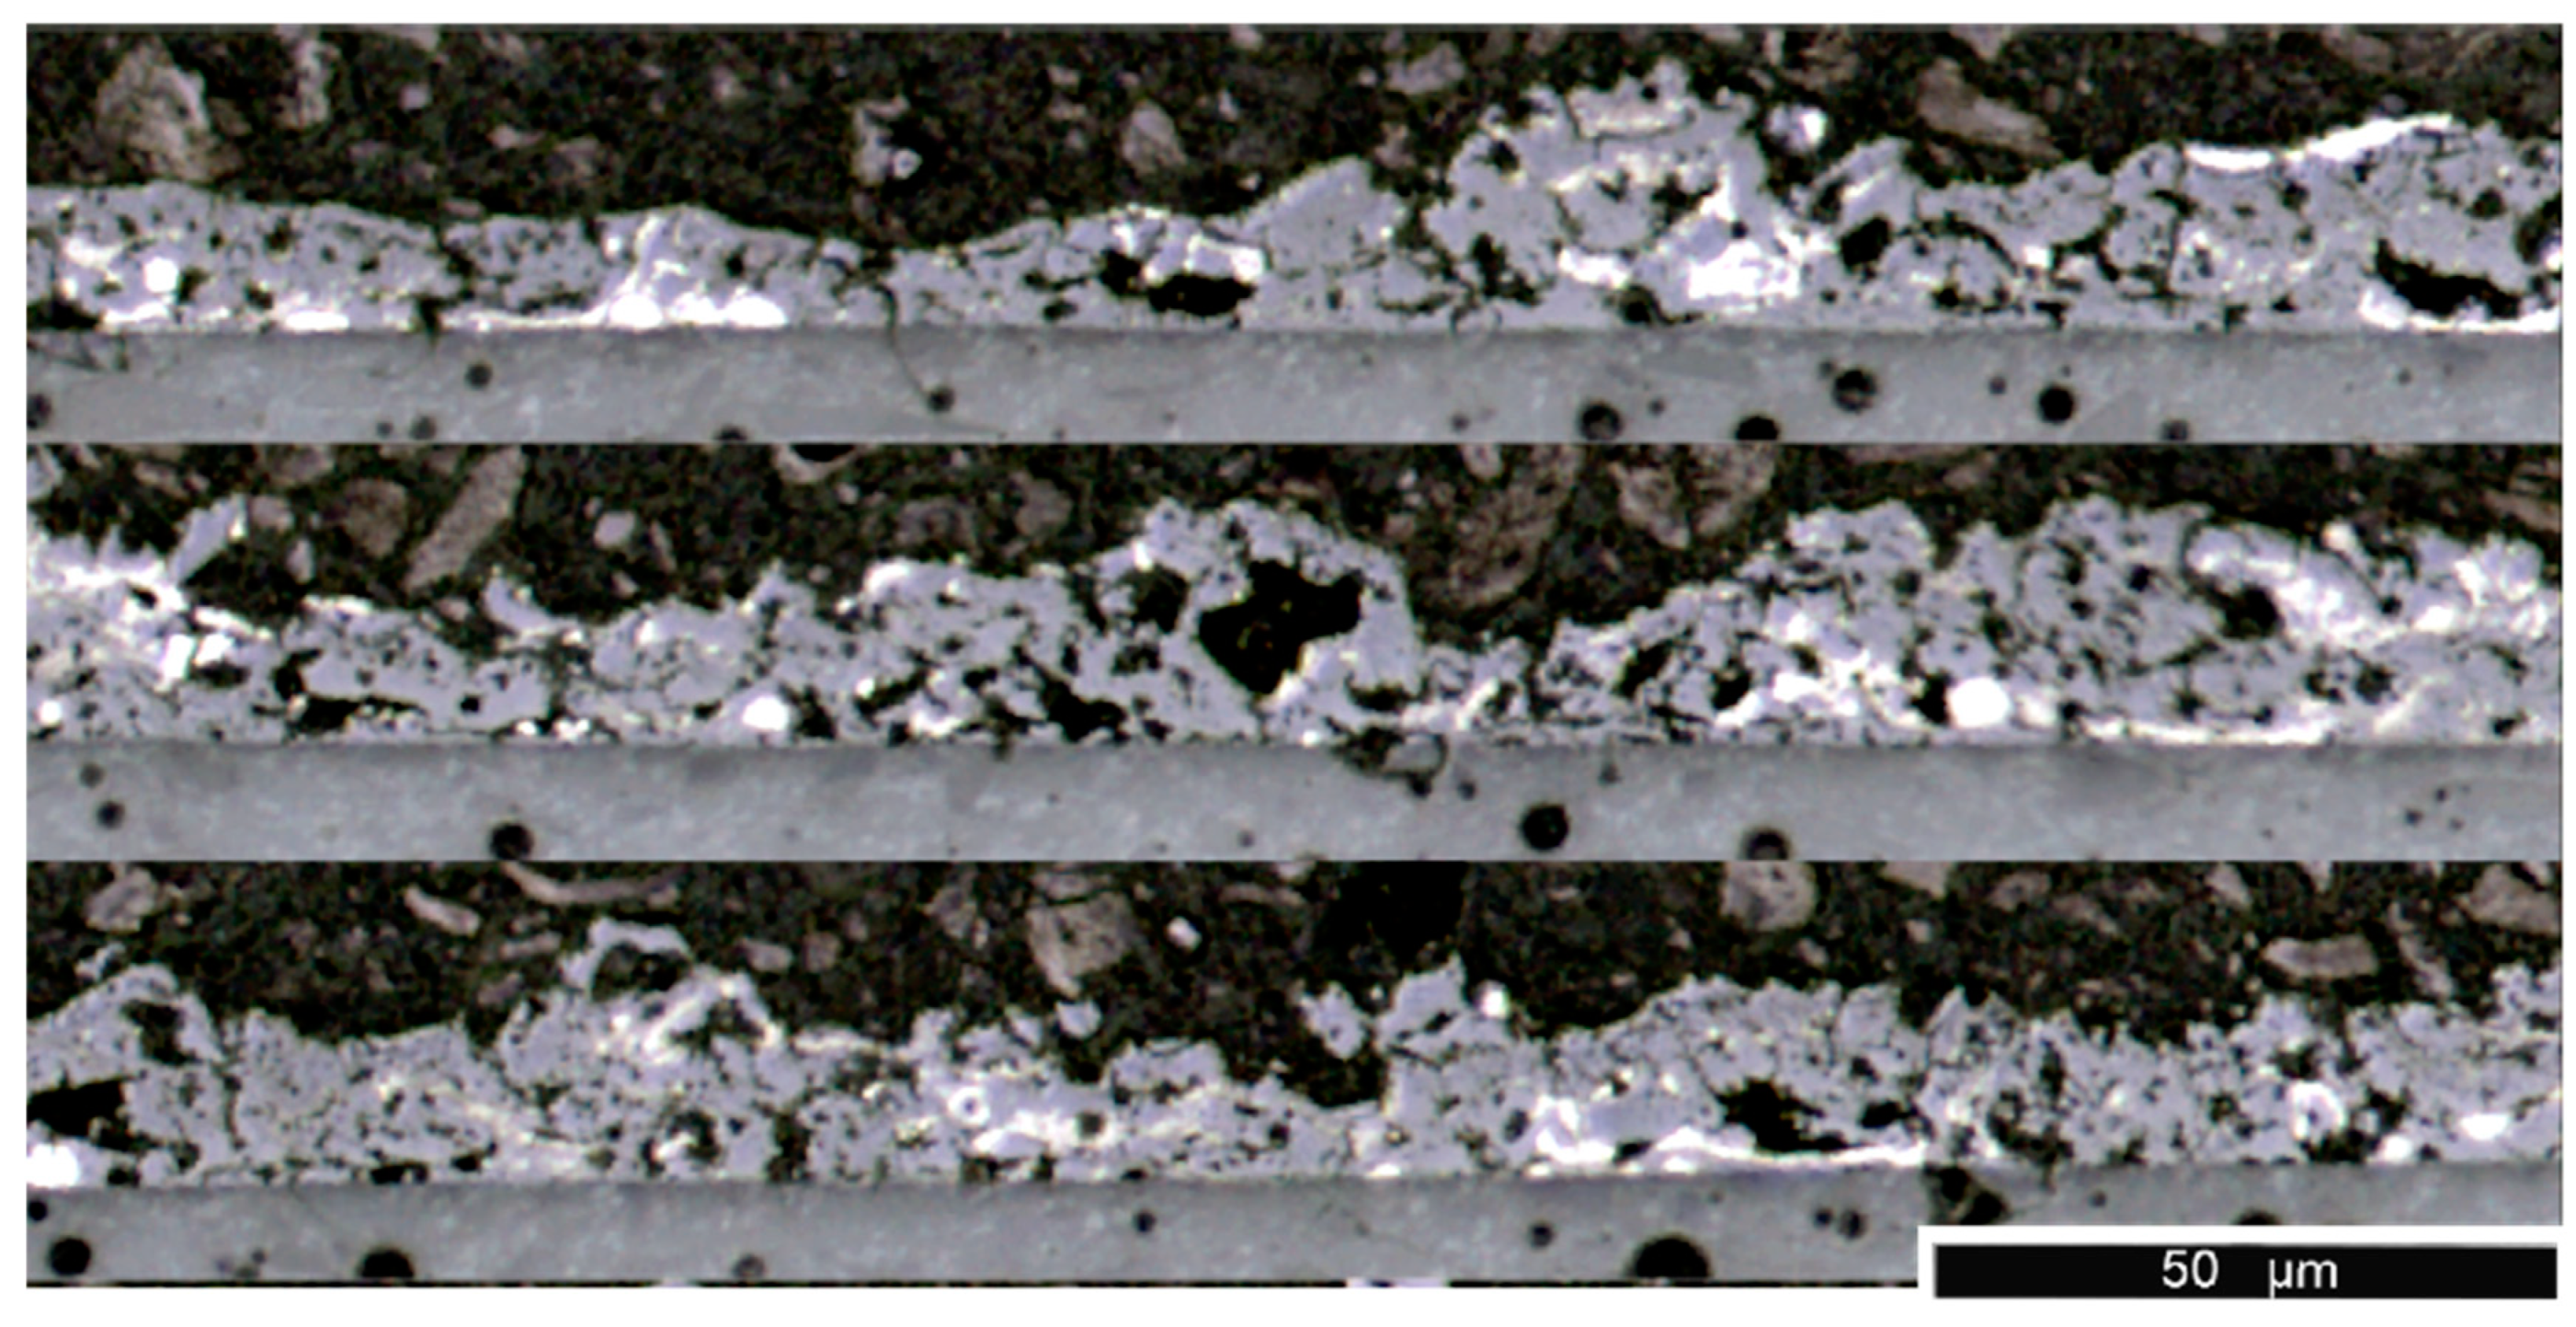
3.1. Laser Ablation Analysis

Since the material under investigation was found to be highly inhomogeneous and the effect of the laser not fully predictable, an iterative stochastic approach was used in the development of the laser-ablation control strategy. This approach seeks to modify the element in multiple cycles using the statistical data of the element thermal profile at each stage to determine the next process strategy.
Each process iteration must affect the element as little as possible, so the minimum amount of damage is caused to the element whist still observing a change in the temperature distribution and maintaining a reasonable production rate. From the investigation above, it was shown that the damage to the film is minimized by lowering the interaction time of the laser with the film either through pulsing the laser or using as high a scanning speed as possible. Fixing the scanning speed and pulsing the beam yields the ability to simply set the fluence used. The pulsed output also allows for the interaction time of the laser to be controlled, this is set to the shortest attainable with this system of 33 µs. In addition, a pulsed ablation has the advantage of maintaining the current paths through the element (as compared to causing continuous channels to be cut), which is vital to ensure temperature profile homogenization.
As a result, the laser parameters used in the remainder of this study are a beam size of 0.13 mm with a raster speed of 300 mm/s, a pulse energy of 300 µJ and a fluence of 2.26 × 10 2   J · mm 2 . Since the amount of fluence given to the element during each pulse is fixed, the control strategy can be focused on determining the best density and location of the laser pulses in order to affect the most efficient material removal.
Figure 10 shows a thermal image of the heating element without any treatment. The hottest area is the central region, with the coldest areas on the edges. The aim of the control strategy is to increase the uniformity of the temperature profile. Since there is a continuous change in temperature across the element, the material removal must continuously vary so that the amount of damage to the film is minimized, ensuring no abrupt changes in surface topography, which may cause early failure and non-convergence of the ablation process. This is achieved by continuously varying the distance between the pulses as a function of local temperature. Figure 10 shows how the density of pulses can be changed depending on the temperature of the element. The coolest areas are ablated with a high density of laser pulses, whereas the hotter areas are ablated less.
The translation between the thermal data and the treatment process is called the processing method. This determines which areas receive the most treatment by altering the density of laser pulses in each region as explained in the element processing method. Each processing method uses its own method to determine the regions to affect the most and, as a result, have their advantages and disadvantages, which are examined further in this work.
In summary, the processing strategy used is to set the speed of the laser as high as possible and to pulse the laser in a series of pulses across the element. The density and location of these pulses is determined by the treatment method, which translates the infrared data of the element temperature profile into this processing strategy.

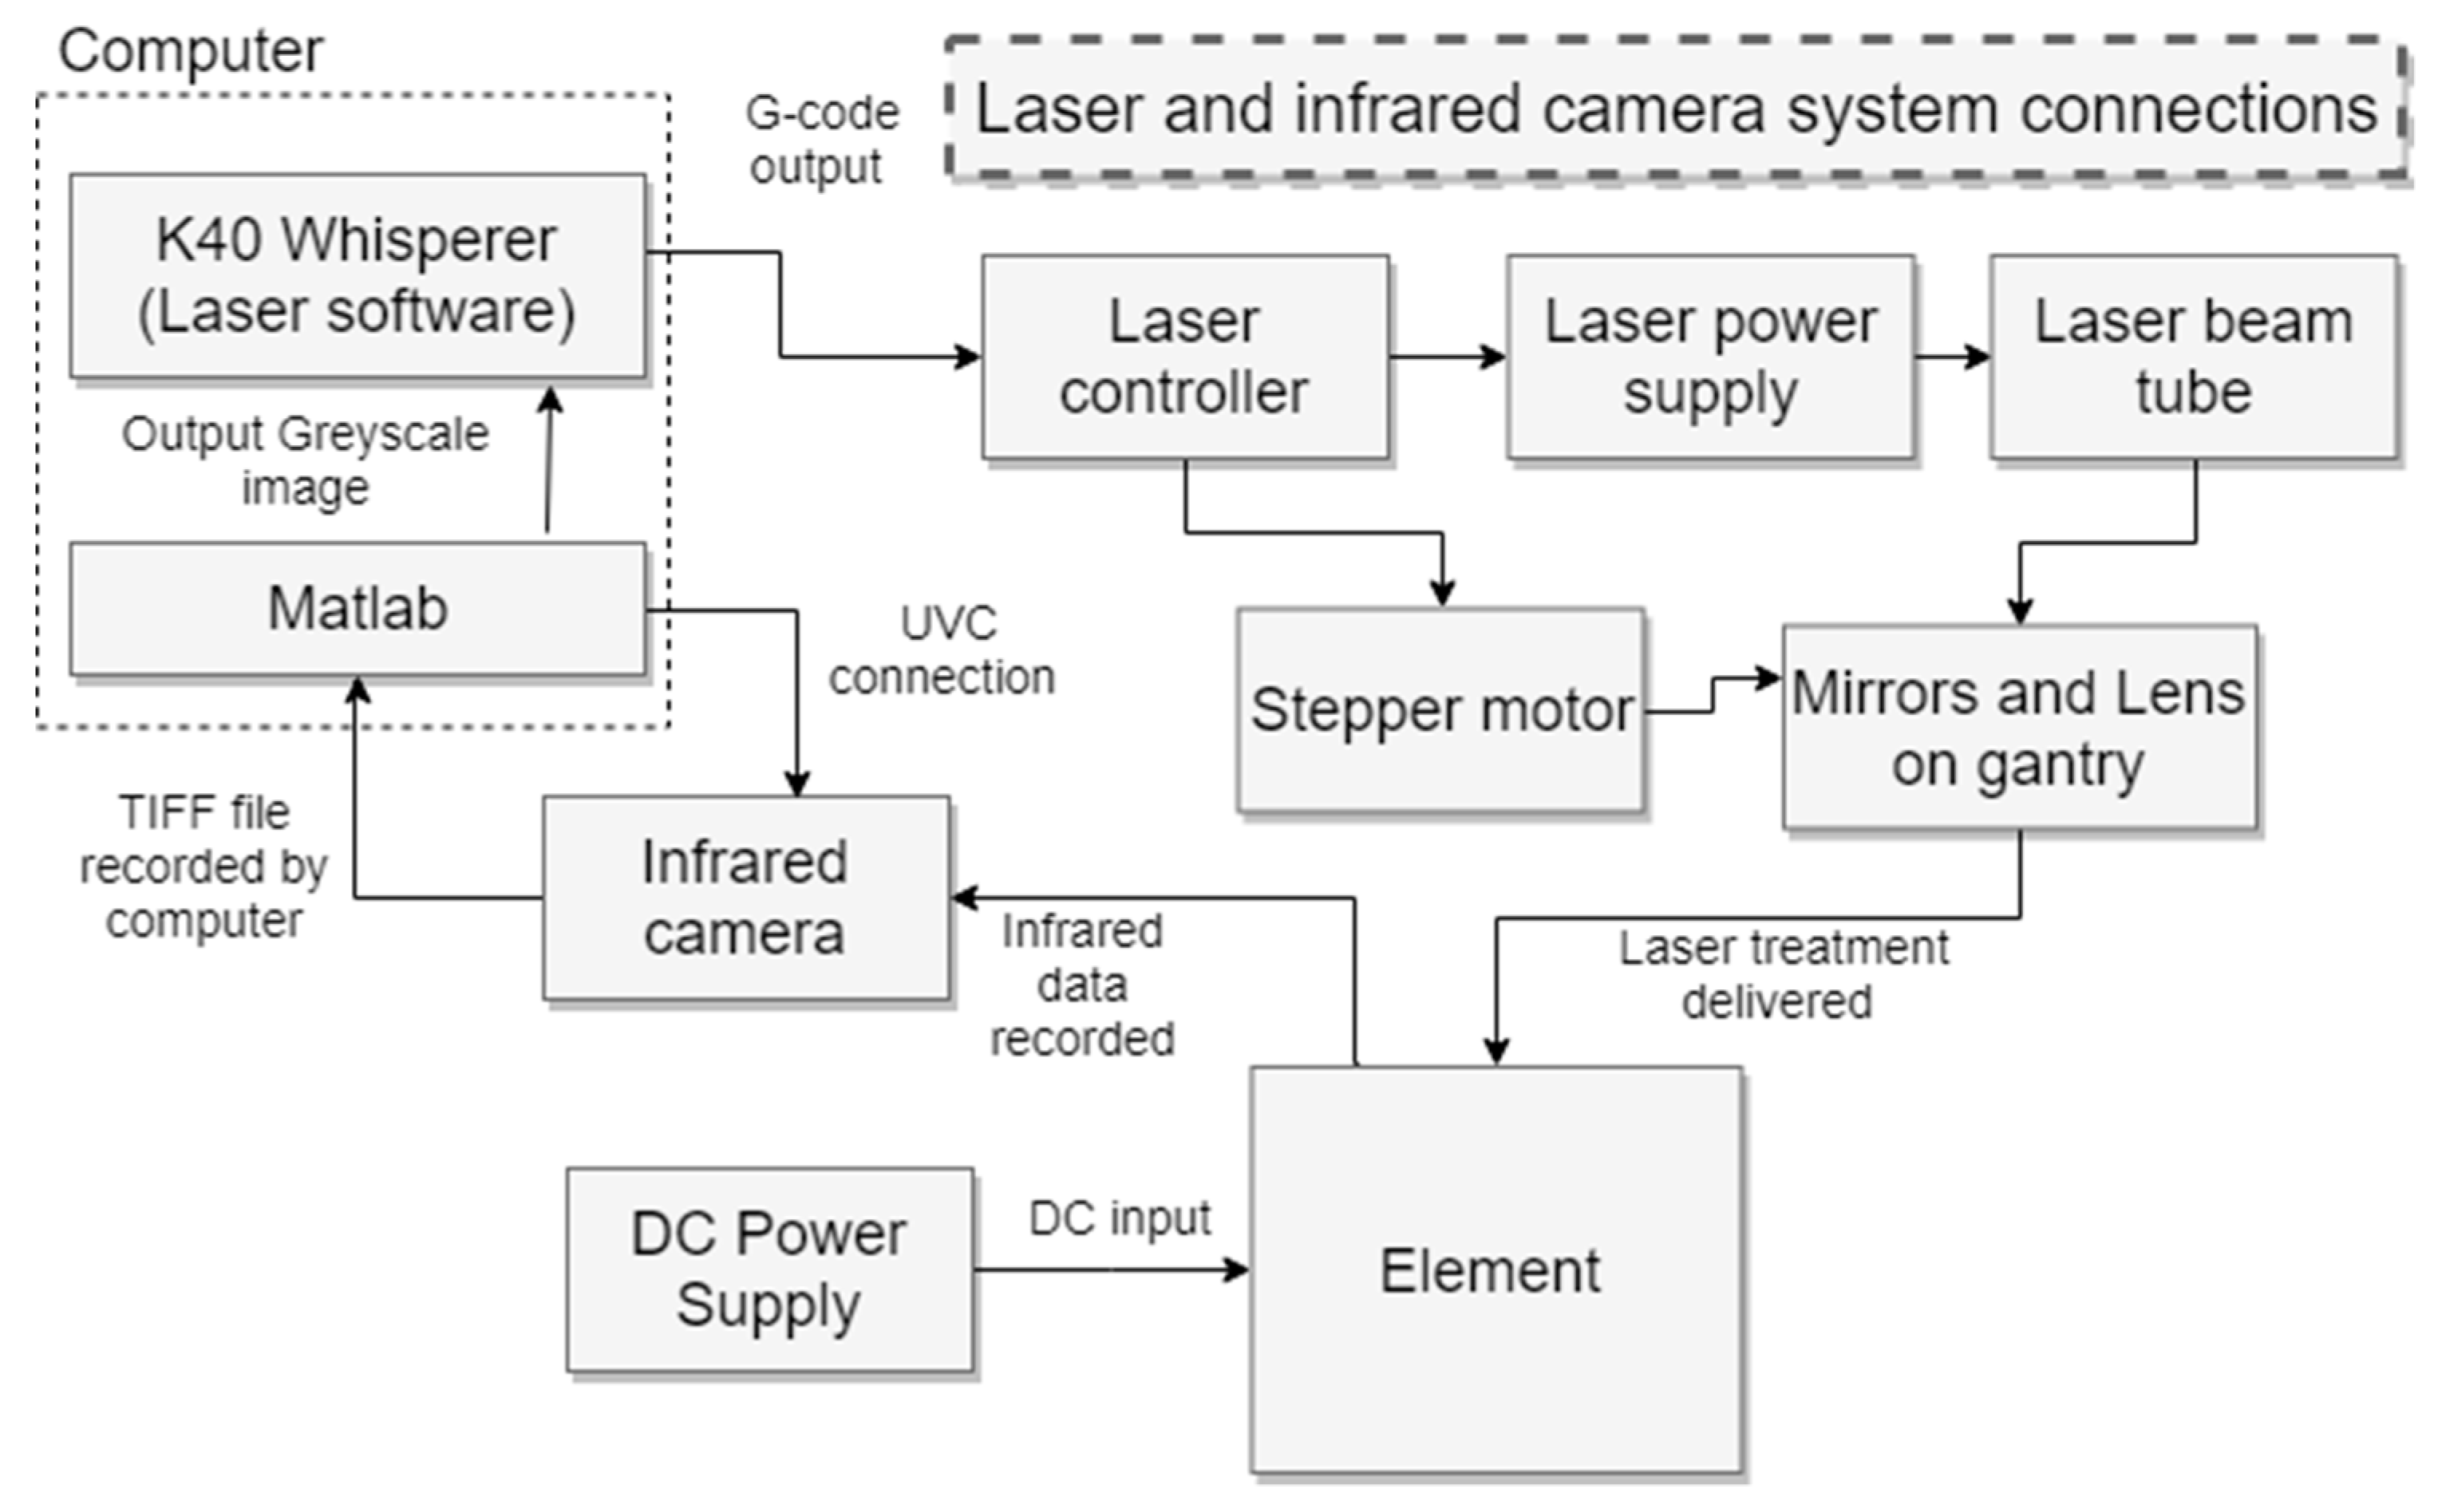
3.2. The Laser Ablation System with Integrated Infrared Imagery

The system used to ablate the metal oxide films is a pulsed carbon dioxide laser with wavelength 10.6 μ m, maximum optical output of 40 W, minimum focus radius of 0.13 mm, laser head speed up to 300 mm/s and minimum pulse time of 33 ms. The infrared imaging sensor used was a Flir lepton 3.5 with a pixel array of 160 × 120, a thermal range of −10 to 400 °C with thermal resolution <50 mK. The field of view of the camera is 180 × 130 mm with a working distance of 200 mm at a 0.1 s exposure time. The components of the laser system and their connections to the other components are shown in Figure 11. A software diagram is shown in Figure 12. This diagram shows how the infrared data is taken by the Matlab script and turned into a processing strategy for the laser and how that laser outputs a specific strategy onto the element in each treatment cycle.
The steps in processing the thermal image are to initially generate an array of thermal data for the whole element, then the regions for treatment are selected according to the control process. This determines the density and location of pulses on the element according to the thermal data. This is then output as a greyscale image file to the laser software for output. The laser outputs the desired output onto the element by rastering over the surface and outputting a high density of pulses in the darkest regions and less dense outputs in the lightest regions, with a linear scale between. This was shown in Figure 10 previously.

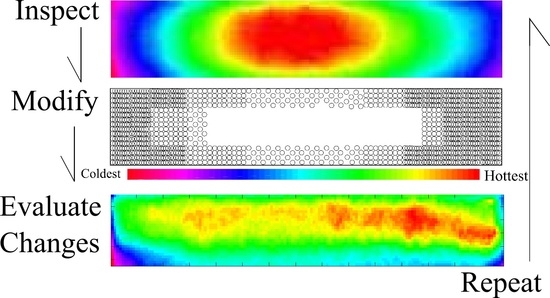
3.3. Control Processes to Increase the Uniformity of the Surface Profile

Various control processes were developed to ablate the element, see Table 3. They are compared and investigated to determine which control process produces an optimally ablated element. The control processes main determination is where to treat the element and the density of treatment. To compare the laser treatment against a control treatment, an ablation method called the abrasion treatment is implemented, which is carried out by rubbing the coldest regions of the element thermal profile with an abrasive paper.

4. Results

The various control processes are analyzed by looking at the steady state temperature profile of the heating element when powered. The same power is applied to each element by altering the voltage input in the element as the resistance changes through the treatment method. Secondly, the statistical analysis of the element is carried out by comparing the standard deviation and kurtosis of the temperature distribution of the element.

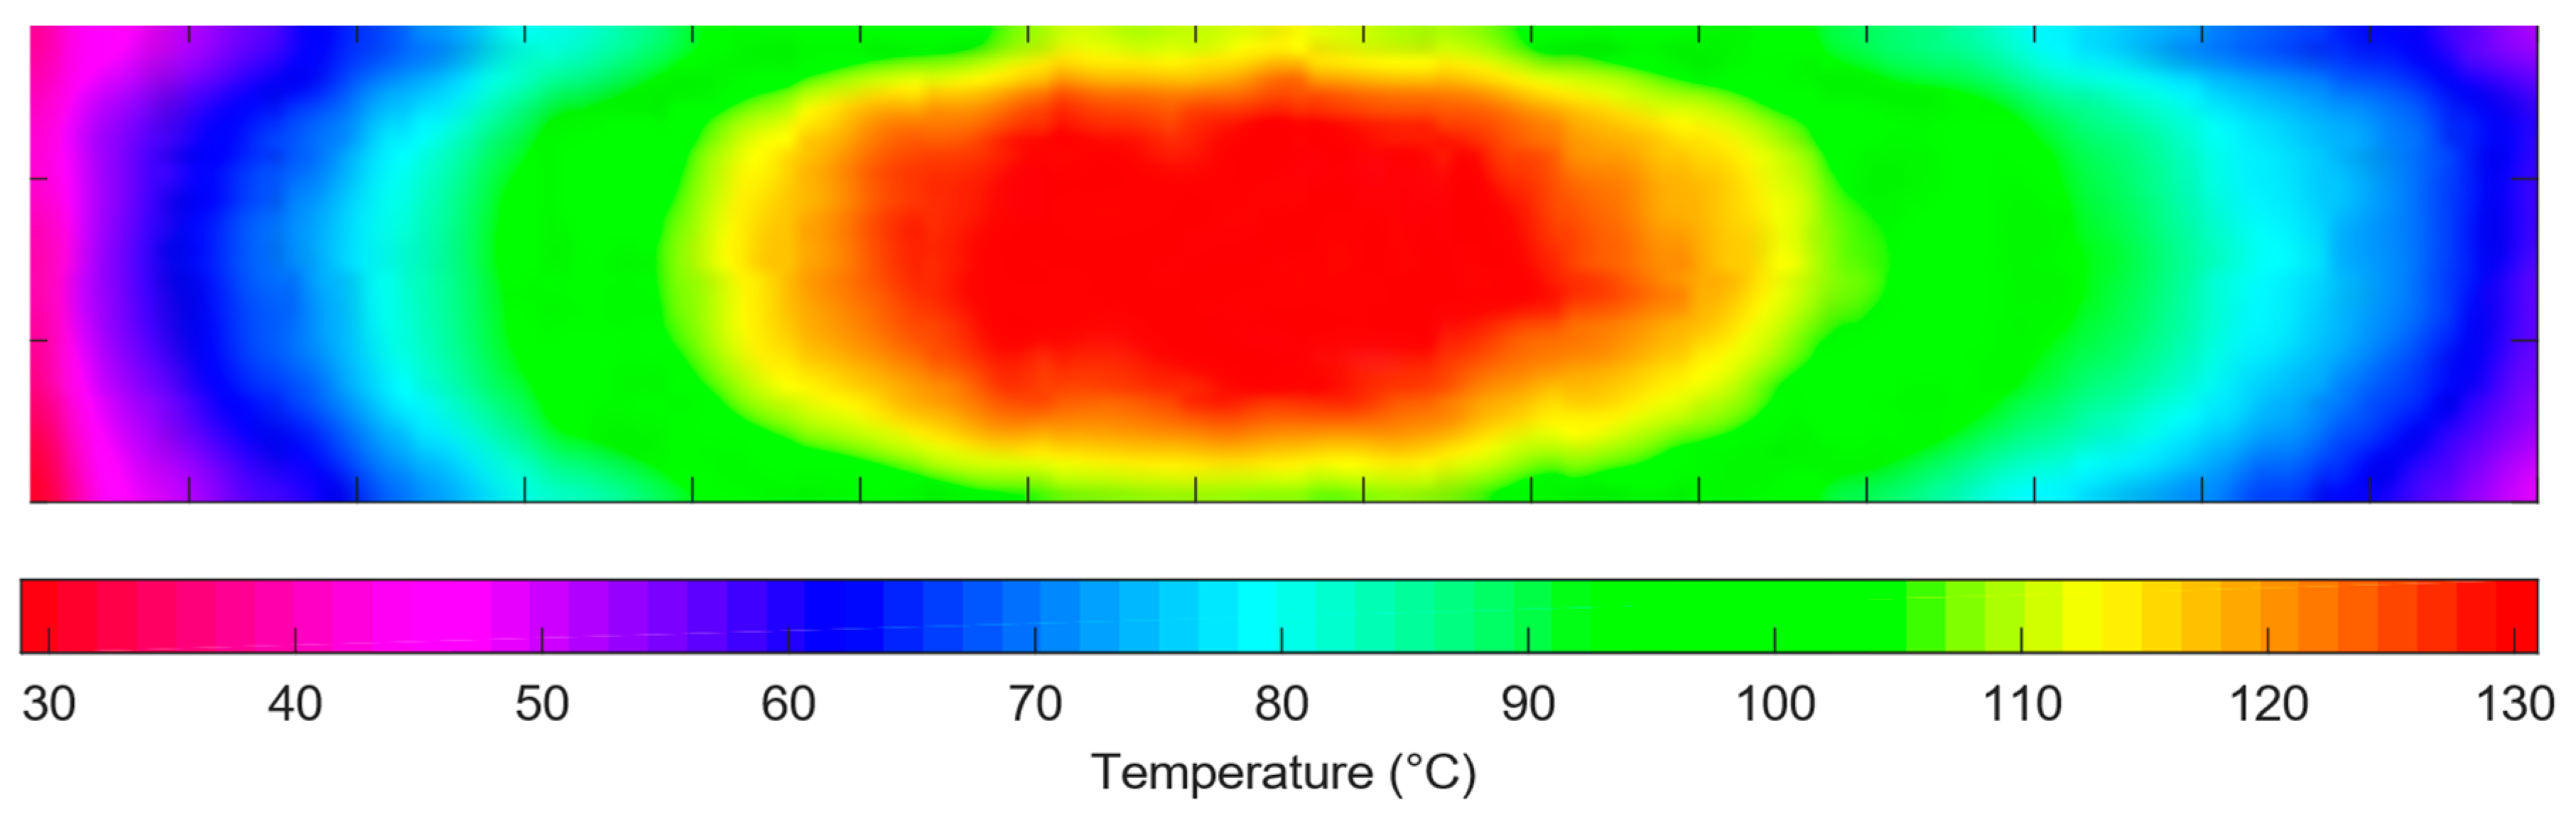
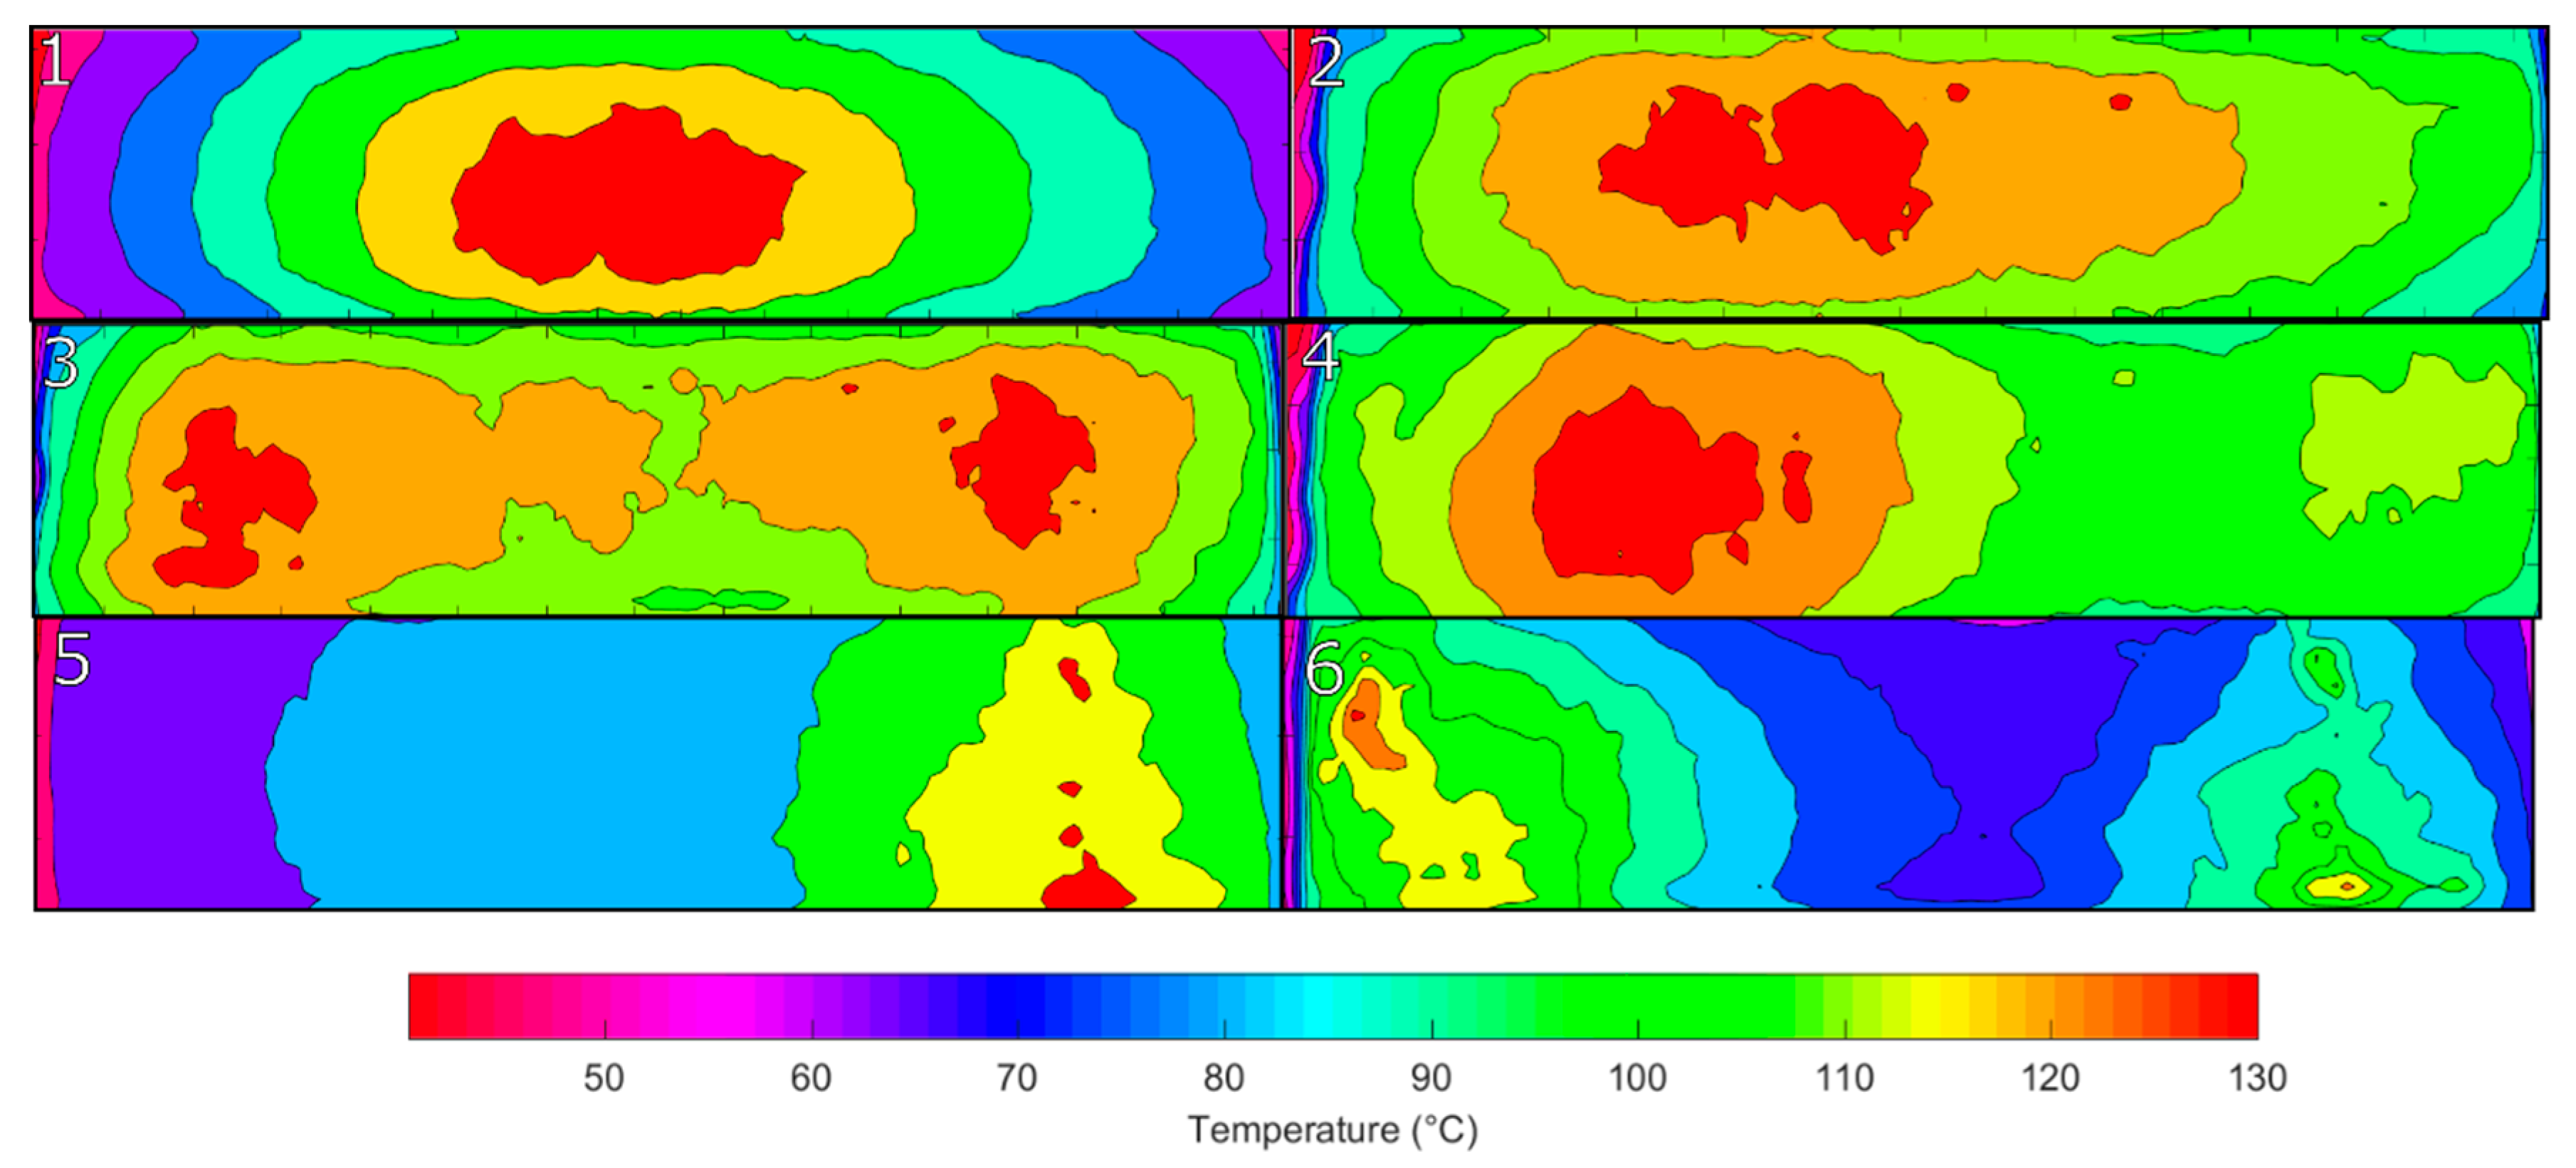
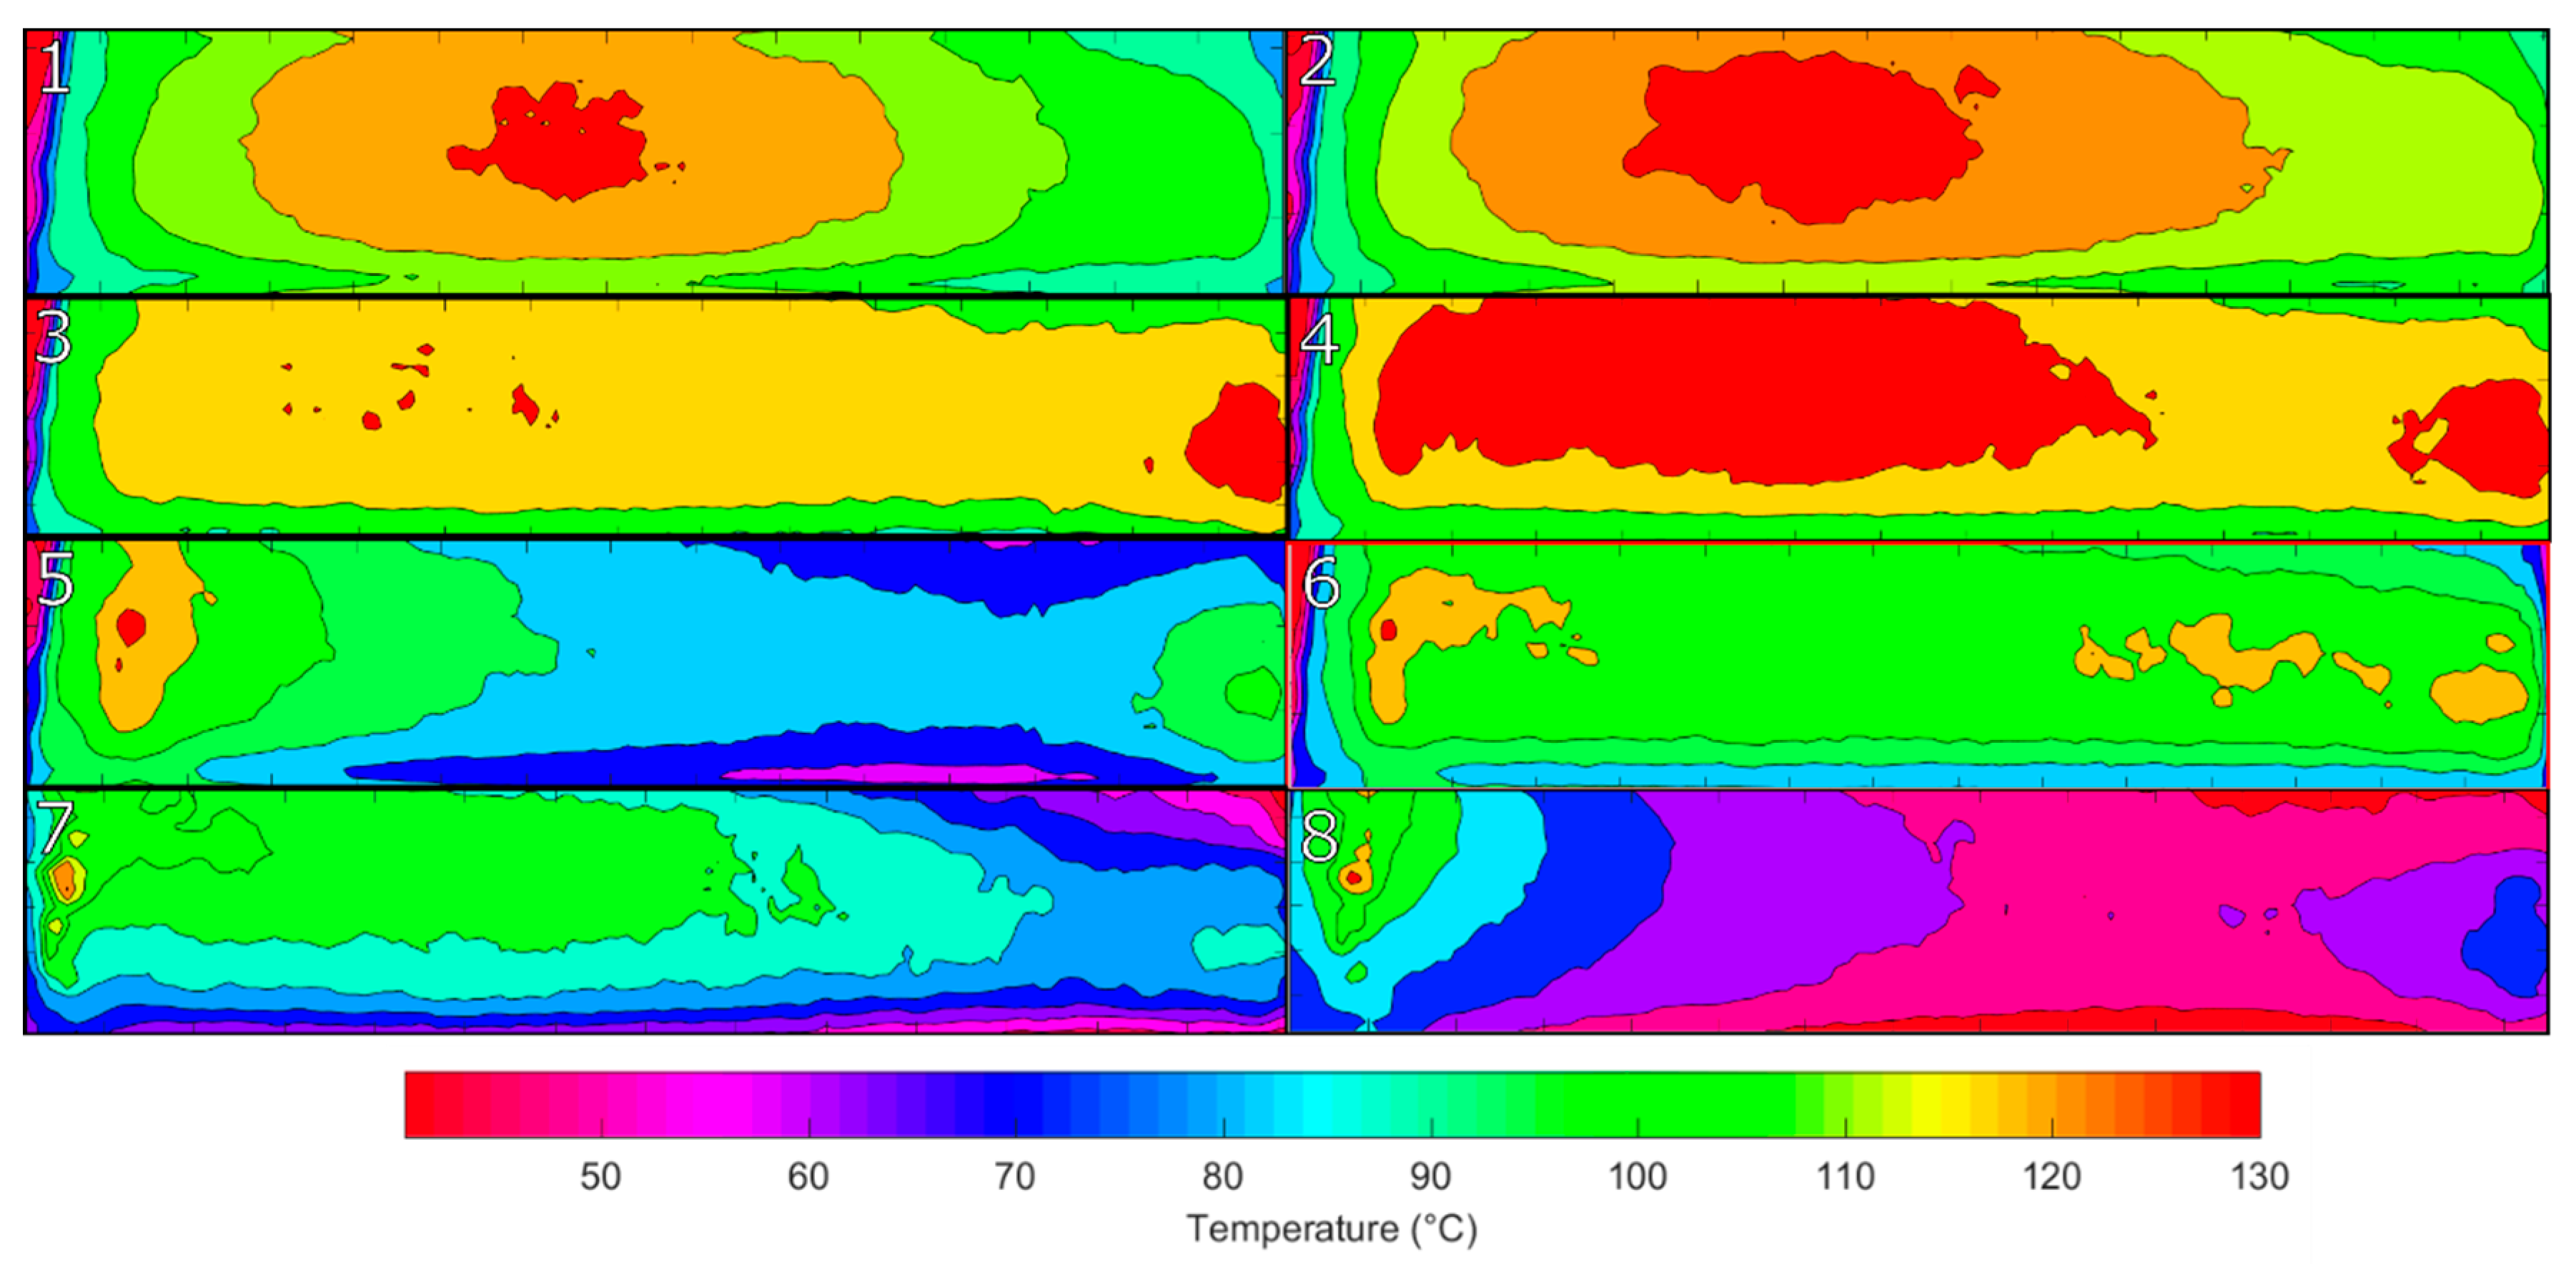
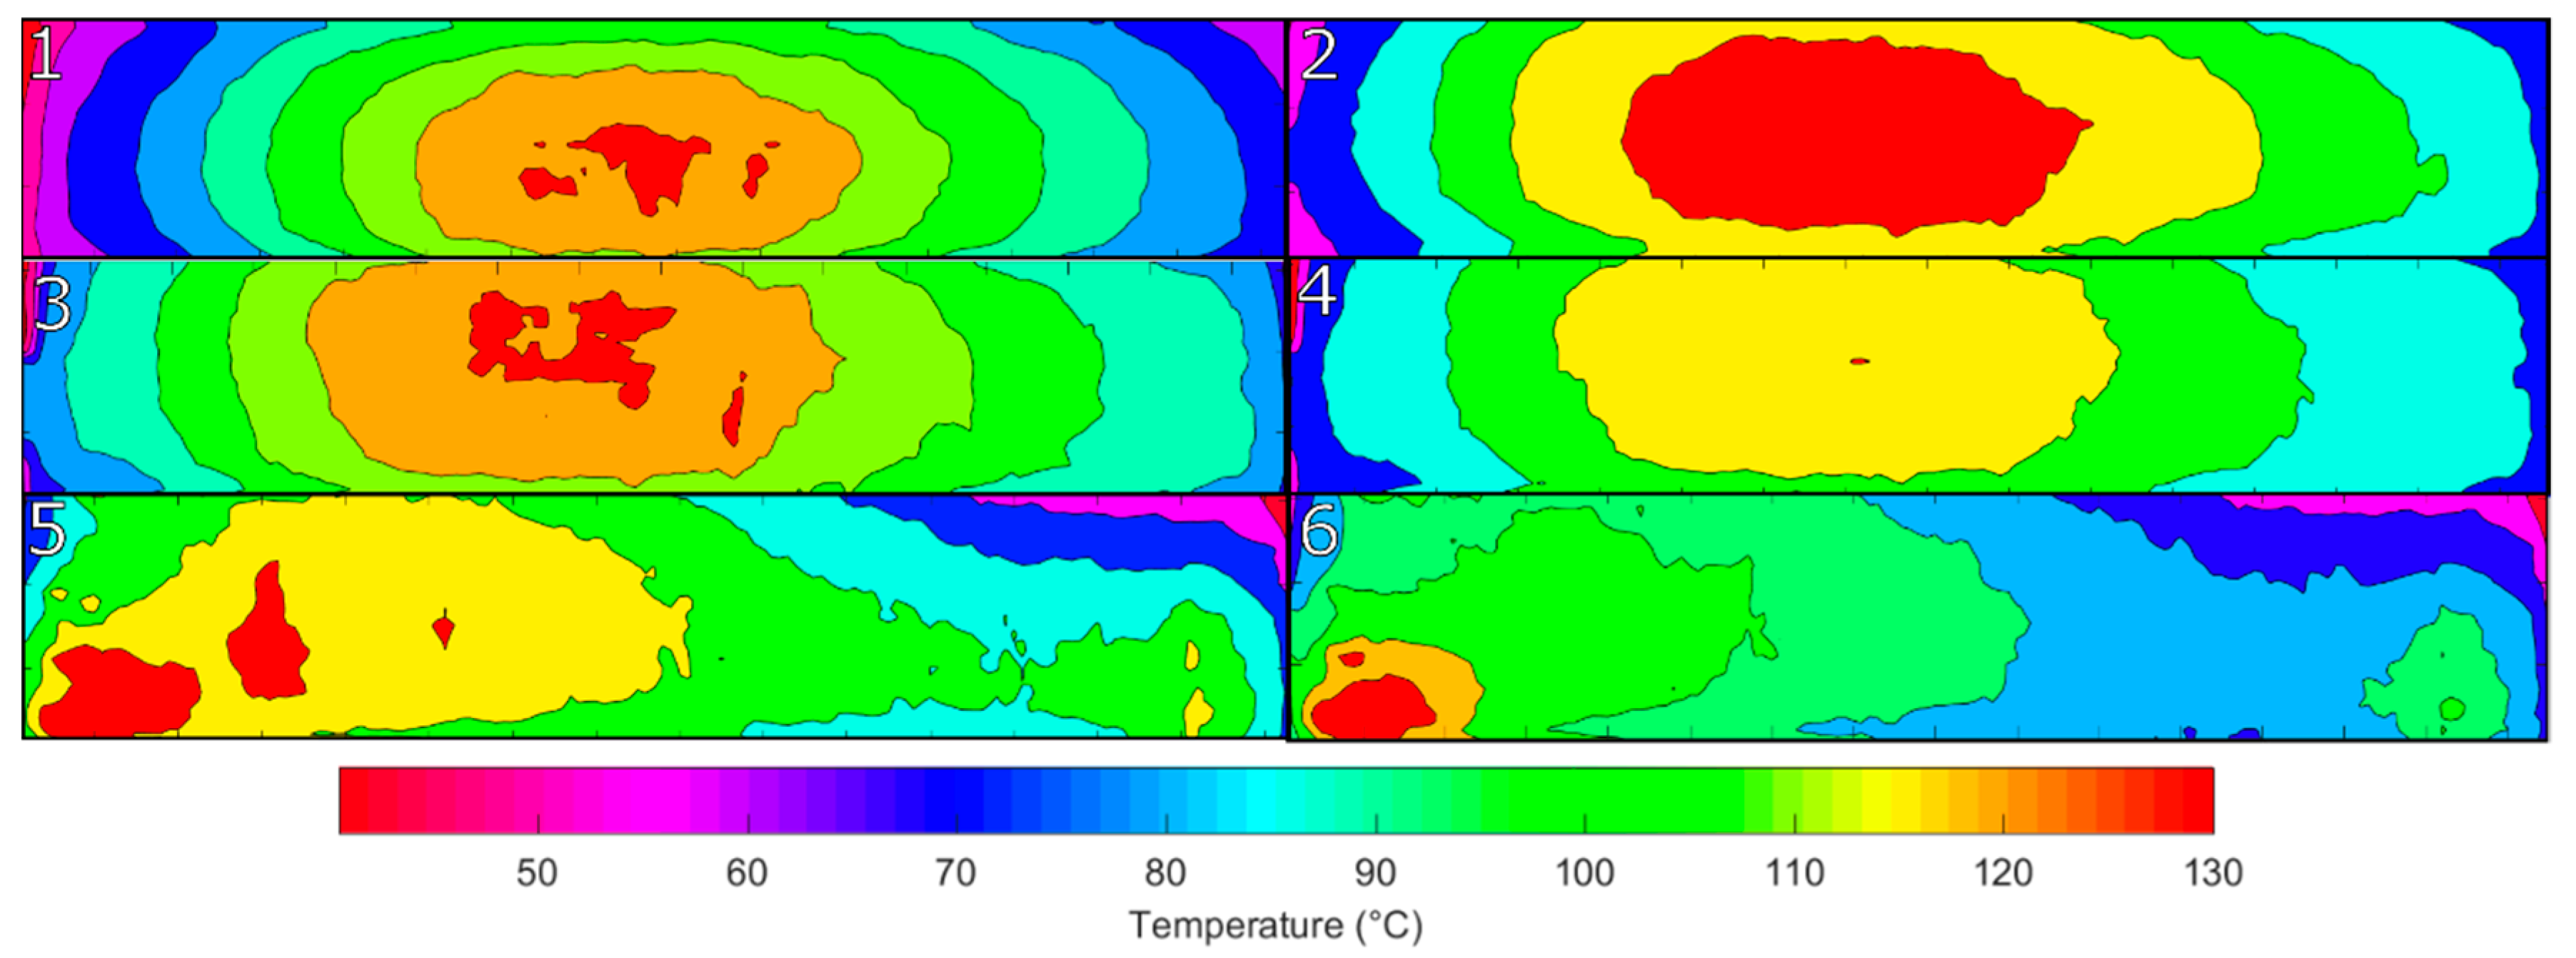
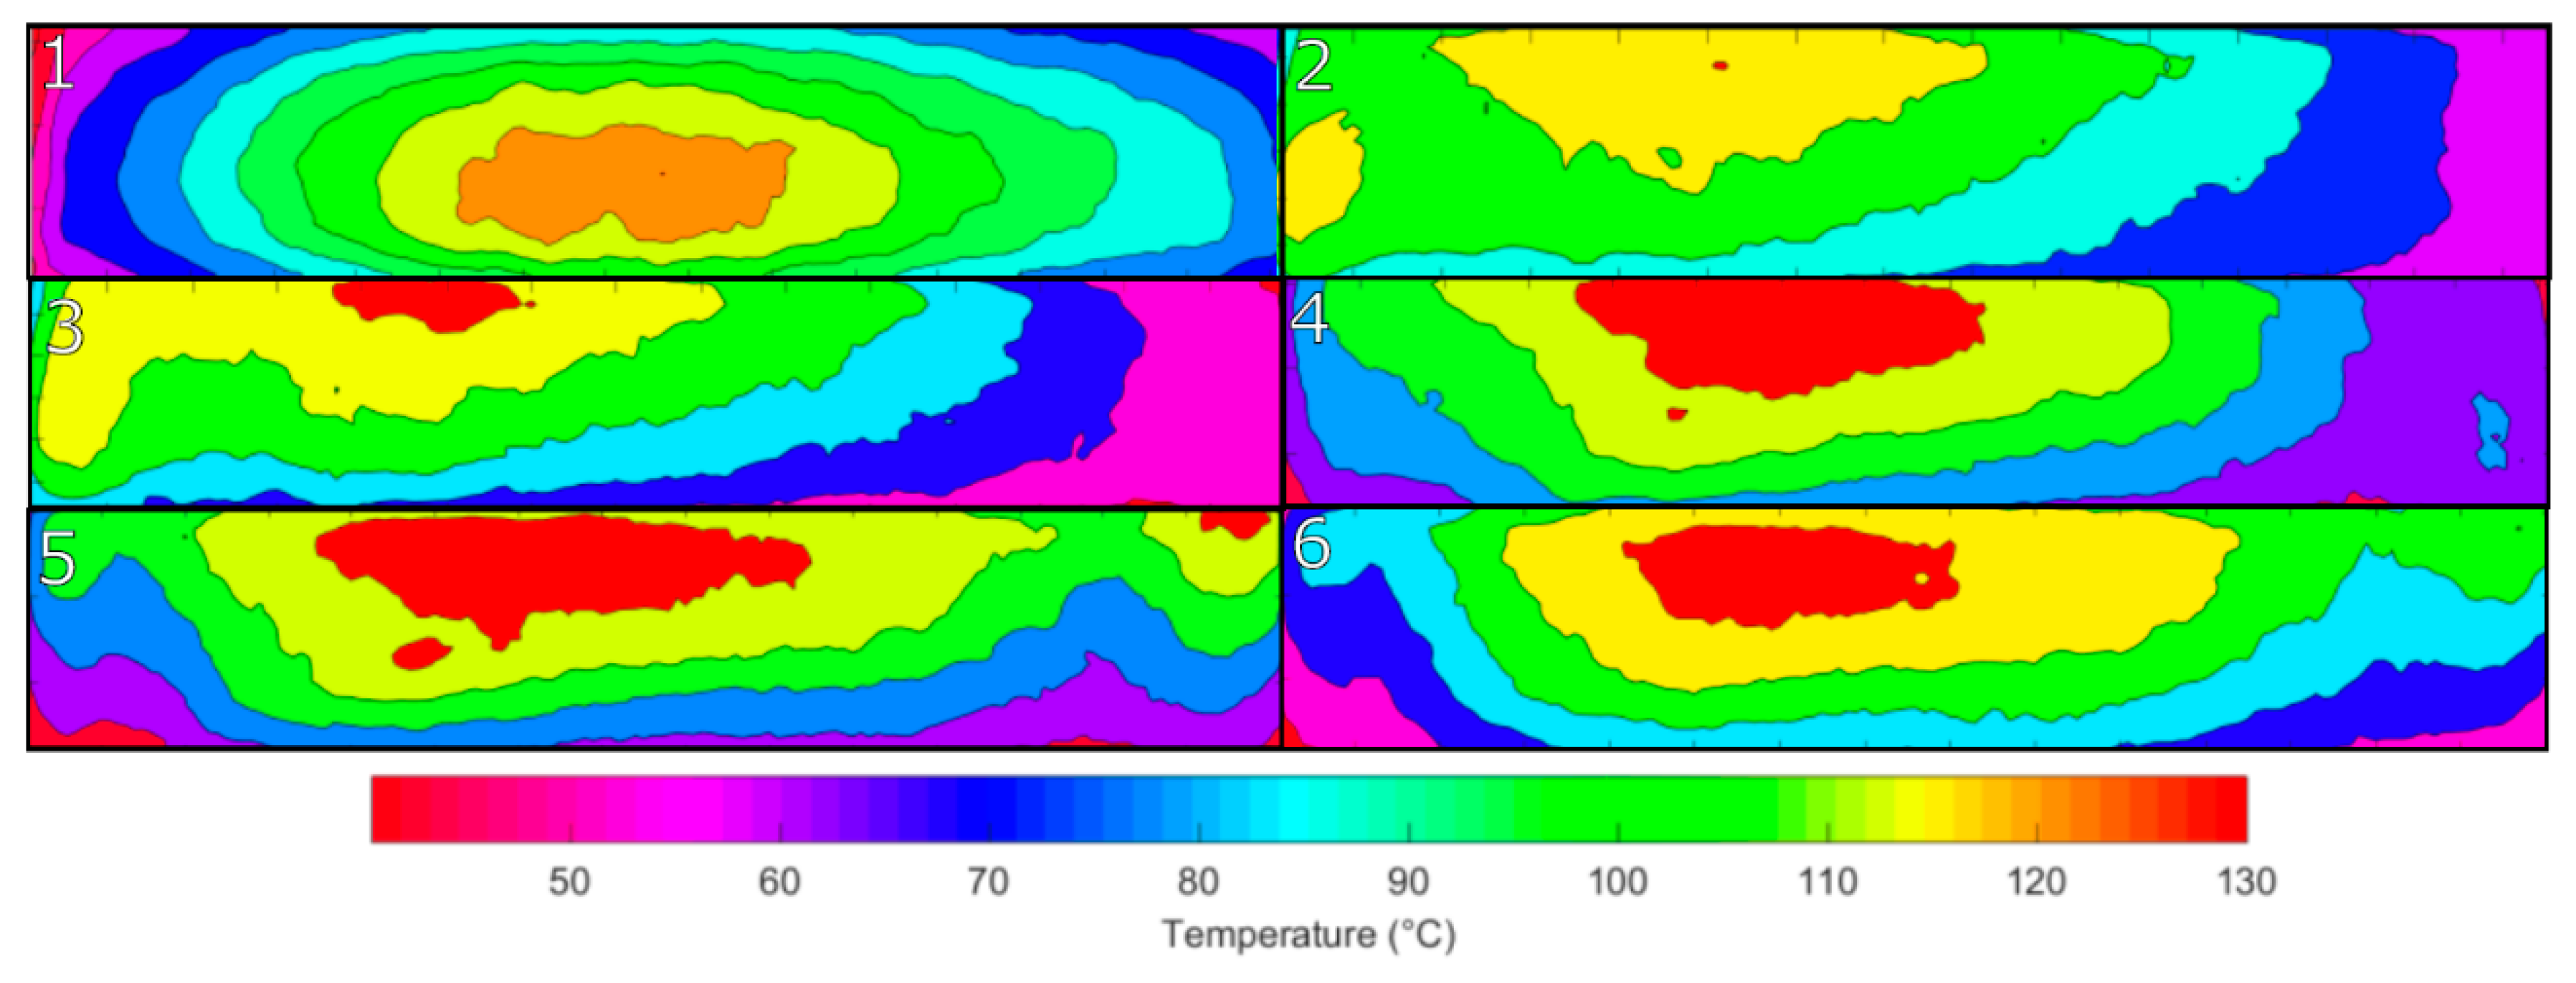
4.1. Control Strategy Comparisons through Thermal Imagery

A manual abrasion technique was developed to provide a benchmark against which the laser ablation techniques could be compared. This method consists of taking a thermal image and sanding the cold areas by hand and repeating the process until no further improvement is observed. The temperature profile of the element is recorded after each iteration of the process. The distribution of temperature across the element is visualized as a contour plot with the regions between each contour comprising a 10 °C difference. Each subfigure in Figure 13 depicts the thermal image at the end of each iteration denoted by the number presented.
The abrasion method does have a clear effect on the distribution of the temperature on the element, as seen from Figure 13. The hot spot size has increased in area, causing the temperature profile to become more uniform. There are still many regions much colder than the average temperature, showing that this method is not fully effective at increasing uniformity.
The 20% method ablates all areas below the 20% percentile temperature with the same amount of treatment, this means the density of pulses is constant and the only factor changing is the location of the treatment. This method is shown in Figure 14, in the initial treatments the technique is very successful at increasing the uniformity of the temperature profile with the best profile seen after just two treatments. Then after this, the uniformity of the element decreases as the element is over treated. The uniformity of the final two treatments is worse than the uniformity of the initial element.
The 50% method is similar to the 20% method where all regions receive the same density of pulses but all regions below the median temperature are ablated instead. The 50% method treatments are shown in Figure 15. The uniformity of the element increases in the initial treatments in a similar fashion to the 20% method. The uniformity of the fourth image is optimal based off the temperature profile plot and after that, the uniformity decreases, with the sixth plot increasing in uniformity. It appears that there is an oscillation of uniformity as the laser treats either the inside or outside of the element as it can only access areas below the median temperature.
The greyscale method alters the density of pulses of the laser continuously as the temperature of the element changes, so the coldest areas receive the greatest treatment, as set out previously in Figure 10. The threshold for this is at the coldest regions, the pulses overlap with each other, at the median temperature, the pulses no longer overlap and at the hottest areas, there is a gap of one pulse between the laser pulses.
The Greyscale method treatments, as shown in Figure 16, increases the uniformity across the element as shown through the decrease in the hot spot size and the reduction in temperature variation from 100 °C to 60 °C. The plots show that the best uniformity is shown in Figure 16, subfigure 4. Since this method treats all regions but changes the density of treatment, the figure shows that the density of treatment in the coldest areas must be increased and in the hottest areas decreased.
As a consequence of these results, the greyscale threshold hybrid method was produced as a hybrid method between the greyscale and threshold methods. This method sets the threshold of the greyscale to between the coldest region and the median, instead of the hottest region, so that all areas at a temperature above the median are not treated. These results were repeated three times to view how reliable the treatment technique is and how the variation of the elements effects how well they are treated. Figure 17 shows the first treatment by the GT method.
The uniformity across the element increases as the element is treated with the most uniform element profile in image six. Other than a few small hot spots, the majority of the element is within a 20 °C range. After the subsequent treatments, the element is damaged, as shown by the variation and decrease in uniformity of the element profile.
Figure 18 shows the second repeat of the GT method treatment. The element treatment progresses in a similar way to the first trial, with the sixth image having the most optimum profile. There is variation in this trial in that after the sixth trial, the element does not become damaged in the same way as in the first trial and still maintains a uniform temperature distribution. As observed in the 1st GT trial, there are also small regions of high temperature generated at the edges of the element.
The third trial of the GT method is shown in Figure 19. There is a visible difference between the thermal profiles of the elements in the first and second trial compared to the third trial. Comparing the initial element in each trial shows that the initial element in the third trial has a much lower uniformity than the first and second trial. The element uniformity when treated is, as a result, not as uniform. There is a definite increase in the uniformity of this atypical element, which will be quantified by the statistical metrics of the standard deviation of the profiles in the next section.
A common trend seen in the previous temperature profile plots is the presence of areas of high temperature on the optimized elements at the edge of the elements after treatment. The Greyscale–Threshold plus Memory (GM) hybrid method was produced to combat this. This method uses the Greyscale-Threshold (GT) method but retains a memory of the previous treatments on the element and reduces the amount of treatment in areas already treated by a factor of how much the element was previously treated.
Figure 20 shows the temperature contour plot of the Greyscale–Threshold plus Memory method. The distribution of temperature across the element increases in uniformity with the hot spots reducing in size and becoming concentrated more on the edges of the element. The treatment of elements does not show signs of an oscillation of treatment but more a steady improvement to an optimum temperature profile. The variation between the lowest and highest temperature areas is around 20 °C.

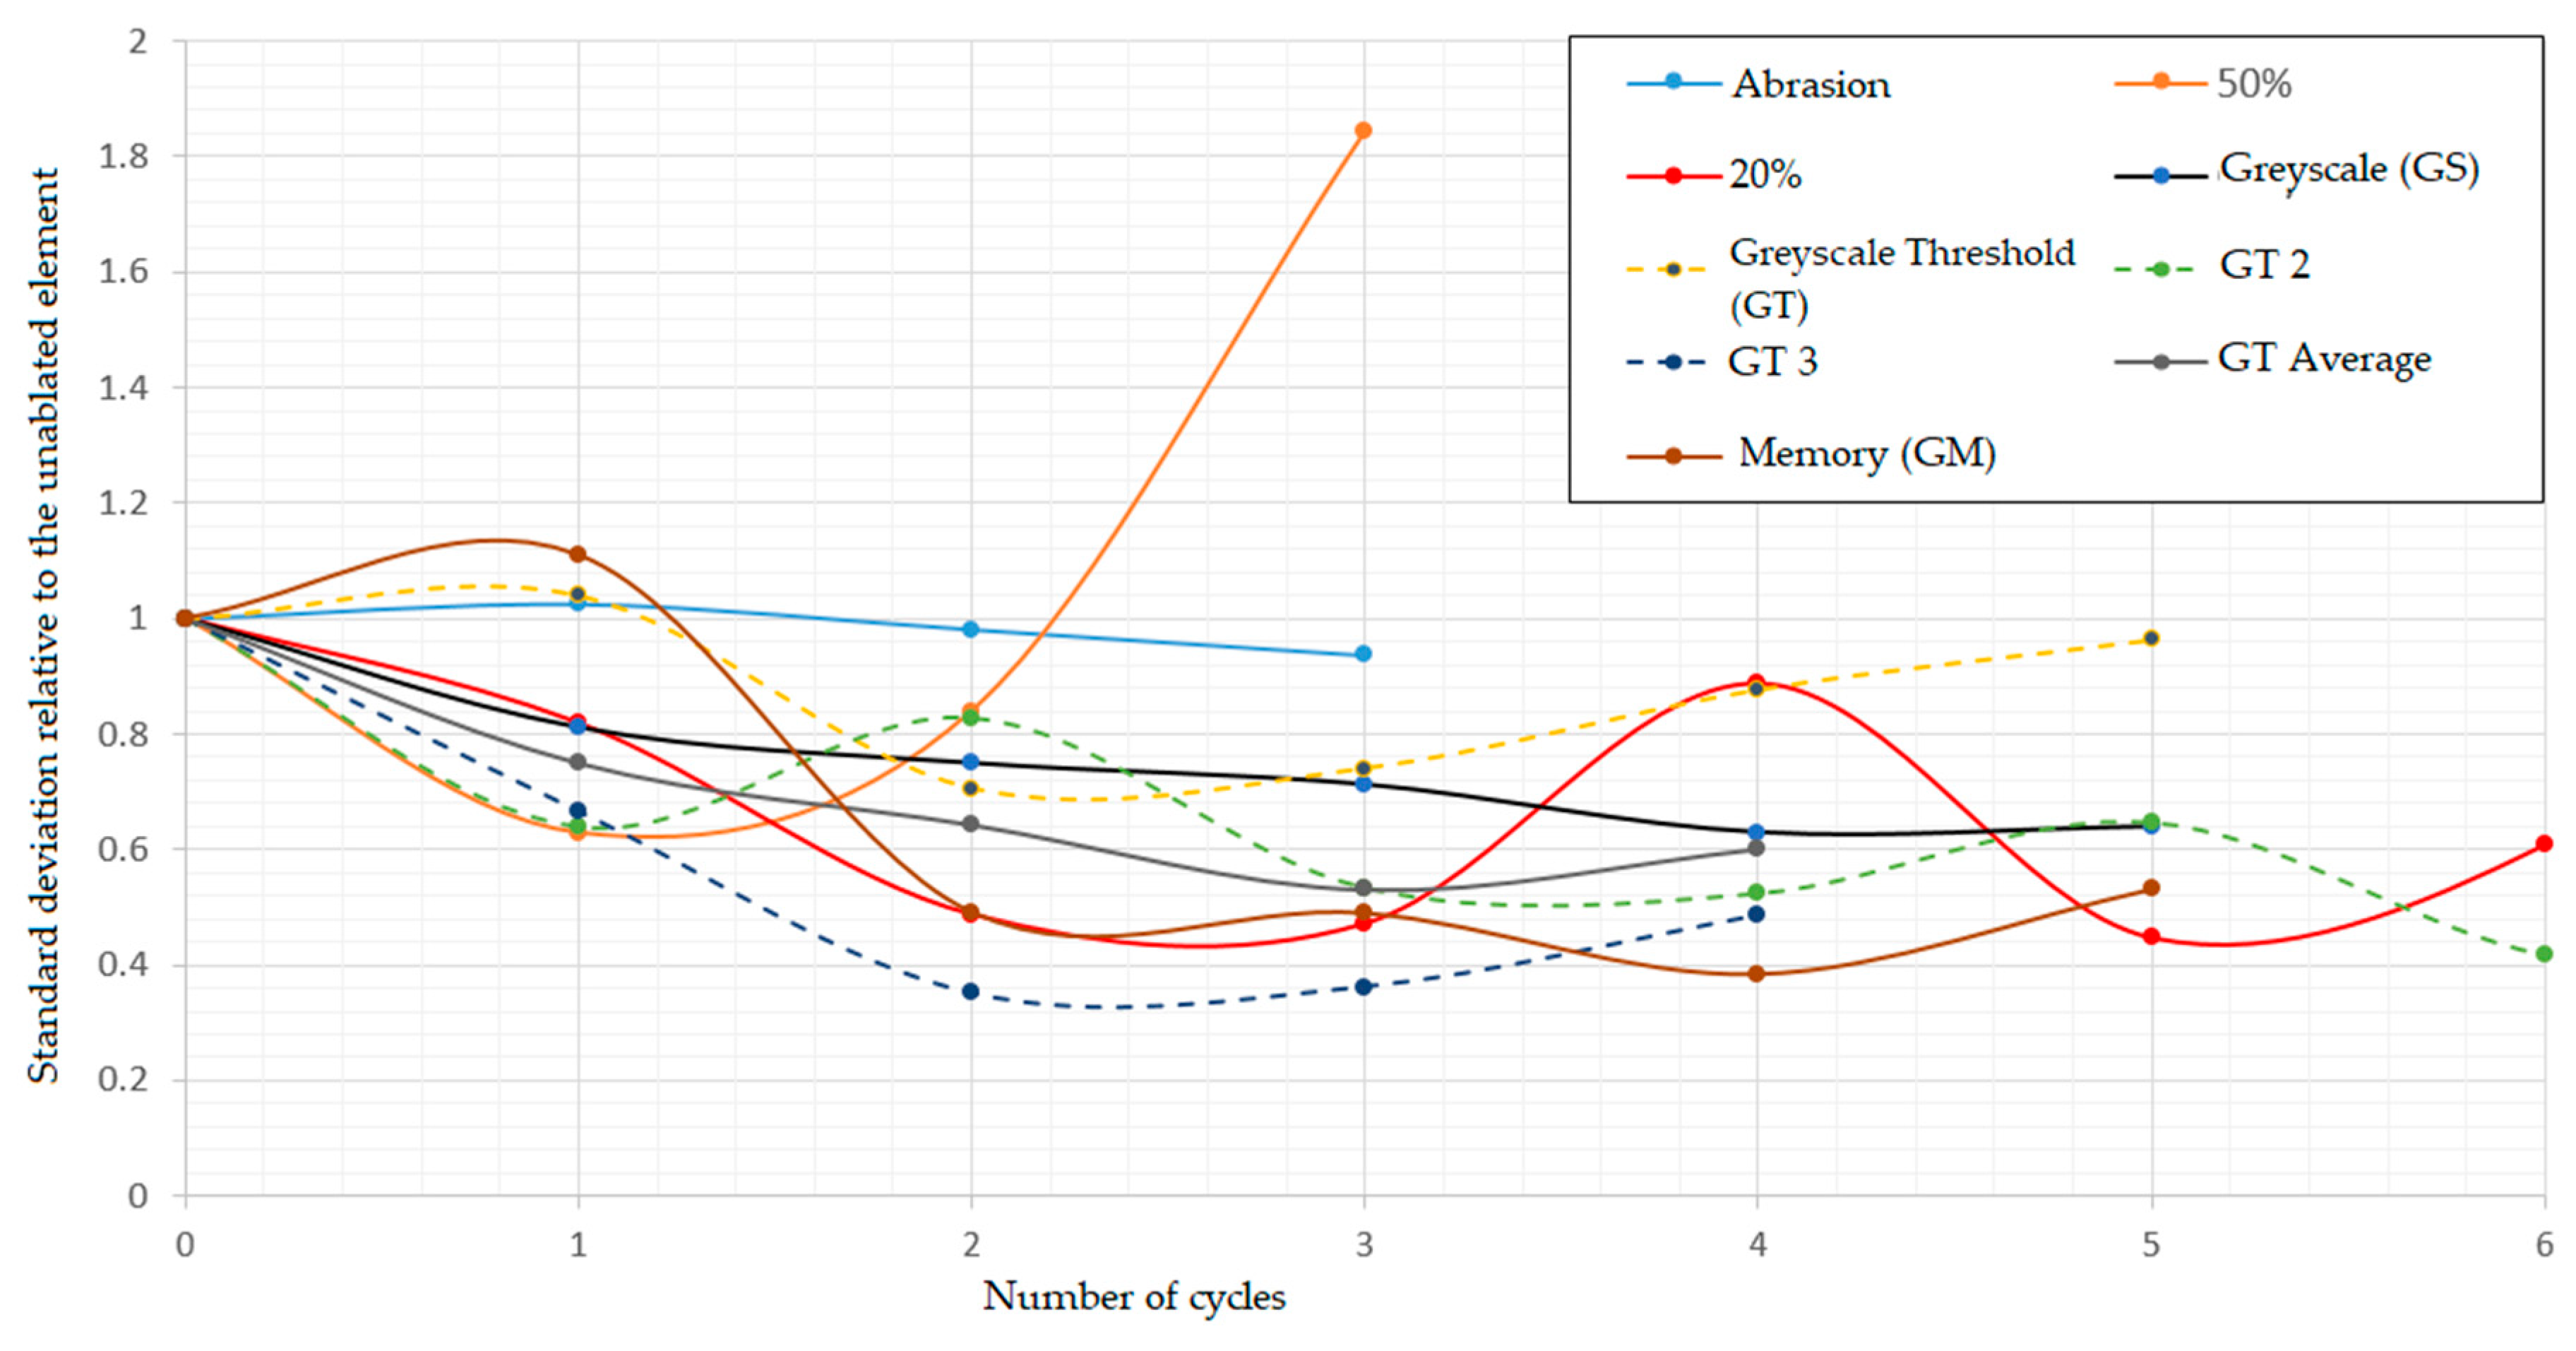
4.2. Control Process Metrics

The temperature profiles can be analyzed using standard statistics to determine the uniformity quantifiably. Table 4 summarizes the key metric differences between the most uniform element produced by each processing method.
Within Table 4, the greatest improvement to the standard deviation is seen with the GM method followed by the GT method and then, the 20% threshold method. The greatest improvement per cycle is seen in the 20% method with the GM and GT methods approximately equal. The kurtosis of the optimized profile indicates whether the distribution of the temperature distribution is peaked, flat or shouldered. A kurtosis of 3 is indicated as ideal as that would indicate the temperature distribution follows a normal distribution. The kurtosis of the optimized profile is closest to 3 for the GM, GT and 20% methods, this indicates these optimized profiles have a temperature distribution kurtosis closest to a normal distribution, which indicates their thermal output is the most uniform.
Finally, the 20% method is the quickest method, taking half the amount of time to complete its treatment compared against the other rival methods, with the additional benefit of taking the fewest number of cycles. There is little difference between the processing time for the other methods, with the threshold and memory method requiring a greater amount of cycles.
Within Figure 21, the standard deviation of the distribution of temperature has been plotted for each trial of ablation relative to the initial standard deviation of the element. This allows for further examination of how each method optimizes the element temperature profile. An oscillatory behavior is observed in the data where the standard deviation of the data decreases up to an ‘optimized point’ and then after that, the standard deviation increases.
The total resistance of each element after each treatment cycle from each method is shown in Figure 22. This quantifies how much damage and change the element has upon experience through the treatment. The greatest change in resistance is seen in the 20%, 50% and GS methods. Within these three methods, the resistance increases from the first treatment. There is then a plateau as the resistance is unchanged until between 3 and 4 cycles of treatment, where the resistance of the element increases greatly until another plateau is reached. Within the abrasion, GT and GM methods, the resistance increases much more steadily, with the majority of cycles at a resistance lower than the resistance of the first ablation trial of the GS, 20% and 50% methods. These methods do not show the increase–plateau–increase behavior that the first three methods showed, indicating a much smoother treatment of the element.

5. Conclusions

A number of strategies for using selection laser ablation to correct the temperature distribution of inhomogeneous metal oxide heating elements has been described. The various processing methods have their advantages and disadvantages. The 20% processing method takes the least time per cycle and requires the lowest amount of cycles to produce its optimal element and hence, is the most productive method. However, it is only the second-best method with regard to reducing the standard deviation of the element as well as the temperature distribution kurtosis. These metrics make this method one of the best methods, but it has drawbacks. Because it is an aggressive process, the method drastically increases the resistance of the element and, subsequently, this method creates the greatest damage to the element in the processing. The method has been shown to generate more high-temperature regions, which has been shown to lead to burnouts and damage to the film integrity.
On the other hand, the greyscale hybrid with memory method produces the greatest reduction in the standard deviation of the element, and the temperature distribution of elements processed using this method have a kurtosis close to that of a normal distribution. The increase in the resistance of the element as a result of this processing method is far less than that of the 20% method. However, this method takes double the amount of time than the 20% method and requires more cycles. If this process was scaled up to an industrial scale, this processing time could significantly impact the manufacturing time of these elements.
The use of a greyscale to alter the density of treatment is an innovative method, where the power and speed of the laser are set so that damage to the film is minimized. Alternative ways of doing this could be to alter the pulse time of the laser to achieve greater amounts of ablation or to use time periods much lower than the 33 μ s used in this study so that the laser pulses in the nanosecond regime. If this is achieved, along with the improvement of the film deposition or composition, then this could allow for a much more deterministic approach to the research. However, the approach presented here is an industrially viable technique for processing films, wherein the composition and topology cannot be determined and yet need to be processed automatically.

Author Contributions

Conceptualization, J.I., D.C. and J.L.; methodology, J.I.; software, J.I., D.C.; validation, J.I., D.C. and J.L.; formal analysis, J.I.; investigation, J.I.; resources, J.I., D.C., J.L.; data curation, J.I.; writing—original draft preparation, J.I.; writing—review and editing, J.I., D.C.; visualization, J.I., D.C.; supervision, D.C., J.L.; project administration, D.C.; funding acquisition, J.L.

Funding

This research was delivered through the Centre for Global Eco-Innovation at Lancaster University, funded by the European Regional Development Fund (Low Carbon Eco-Innovatory–22R15P00045) in collaboration with 2DHeat Limited.

Acknowledgments

Thank you to Xingzhong Liang and Pedro Riviera who trained and allowed myself to use their optical microscopy and polishing facilities in the Department of Engineering at Lancaster University.

Conflicts of Interest

The authors declare no conflict of interest.

References

  1. Rajendra, P. Global Warming of 1.5 °C; Intergovernmental Panel on Climate Change: Geneva, Switzerland, 2018. [Google Scholar]
  2. Department for Business, Energy & Industrial strategy. United Kingdom Energy Statistics 2017; Department for Business, Energy & Industrial Strategy: London, UK, 2017. [Google Scholar]
  3. Palmer, J.; Cooper, I. United Kingdom:Housing Energy Fact File; Department for Energy and Climate Changes: London, UK, 2013. [Google Scholar]
  4. Leslie, K. Should we be going off gas? No. 30. Sanctuary Mod. Green Homes; Alternative Technology Association: Melbourne, Australia, 2015; pp. 60–63. [Google Scholar]
  5. Han, H.J.; Jeon, Y.I.; Lim, S.H.; Kim, W.W.; Chen, K. New developments in illumination, heating and cooling technologies for energy-efficient buildings. Energy 2010, 35, 2647–2653. [Google Scholar] [CrossRef]
  6. He, R.; Fang, D.; Wang, P.; Zhang, X.; Zhang, R. Electrical properties of ZrB2–SiC ceramics with potential for heating element applications. Ceram. Int. 2014, 40, 9549–9553. [Google Scholar] [CrossRef]
  7. Neella, N.; Gaddam, V.; Rajanna, K.; Nayak, M.M. Low cost, disposable and wearable body warmer using RGO sheets coated on cloth substrate as heating element. In Proceedings of the 2017 IEEE 12th International Conference on Nano/Micro Engineered and Molecular Systems (NEMS), Los Angeles, CA, USA, 9–12 April 2017; pp. 177–180. [Google Scholar]
  8. Pang, E.; Pickering, S.; Chan, A.; Wong, K. Use of recycled carbon fibre as a heating element. J. Compos. Mater. 2013, 47, 2039–2050. [Google Scholar] [CrossRef]
  9. Isaji, S.; Bin, Y.; Matsuo, M. Electrical conductivity and self-temperature-control heating properties of carbon nanotubes filled polyethylene films. Polymer 2009, 50, 1046–1053. [Google Scholar] [CrossRef]
  10. Lee, T.-W.; Jeong, Y.G. Regenerated cellulose/multiwalled carbon nanotube composite films with efficient electric heating performance. Carbohydr. Polym. 2015, 133, 456–463. [Google Scholar] [CrossRef] [PubMed]
  11. Cueff, S.; Labbé, C.; Cardin, J.; Doualan, J.L.; Khomenkova, L.; Hijazi, K.; Jambois, O.; Garrido, B.; Rizk, R. Efficient energy transfer from Si-nanoclusters to Er ions in silica induced by substrate heating during deposition. (Technical report). J. Appl. Phys. 2010, 108, 064302. [Google Scholar] [CrossRef]
  12. Wang, Y.; Jiang, H.; Tao, Y.; Mei, T.; Liu, Q.; Liu, K.; Li, M.; Wang, W.; Wang, D. Polypyrrole/poly(vinyl alcohol-co-ethylene) nanofiber composites on polyethylene terephthalate substrate as flexible electric heating elements. Compos. Part A Appl. Sci. Manuf. 2016, 81, 234–242. [Google Scholar] [CrossRef]
  13. The Engineering Toolbox. Thermal Conductivity of Metals, Oxides and Alloys. Available online: https://www.engineeringtoolbox.com/thermal-conductivity-metals-d_858.html (accessed on 15 October 2018).
  14. Zhao, P.; Kim, S.; Yoon, S.; Song, P. Characteristics of indium zinc oxide/silver/indium zinc oxide multilayer thin films prepared by magnetron sputtering as flexible transparent film heaters. (Report). Thin Solid Films 2018, 665, 137–142. [Google Scholar] [CrossRef]
  15. Warwick, M.E.A.; Binions, R. Electric field assisted aerosol assisted chemical vapor deposition of nanostructured metal oxide thin films. Surf. Coat. Technol. 2013, 230, 28–32. [Google Scholar] [CrossRef]
  16. Cheong, H.-G.; Song, D.-W.; Park, J.-W. Transparent film heaters with highly enhanced thermal efficiency using silver nanowires and metal/metal-oxide blankets. Microelectron. Eng. 2015, 146, 11–18. [Google Scholar] [CrossRef]
  17. Duffield, M.E.; Tatlock, G.J.; Lewis, J.F. High-Temperature Decomposition of Fe- and Cr-Doped NiO Produced by a Novel Flame Spray Technique. Oxid. Met. 2017, 88, 351–360. [Google Scholar] [CrossRef] [Green Version]
  18. Tennenhouse, C. Design and maintenance of electric heating elements. Ind. Heat. 2000, 67, 34. [Google Scholar]
  19. Hou, M.; Yang, M.; Beehag, A.; Mai, Y.-W.; Ye, L. Resistance welding of carbon fibre reinforced thermoplastic composite using alternative heating element. Compos. Struct. 1999, 47, 667–672. [Google Scholar] [CrossRef]
  20. Rathjen, C.; Blanchard, S.; Henrist, B.; Koelemeijer, W.; Libera, B.; Lutkiewicz, P. Ultrathin Polyimide-Stainless Steel Heater for Vacuum System Bake-Out. In Proceedings of the 2005 Particle Accelerator Conference, Knoxville, TN, USA, 12–20 May 2005; Volume 2005, pp. 2744–2746. [Google Scholar]
  21. Jansen, K.M.B.; Flaman, A.A.M. Construction of fast-response heating elements for injection molding applications. Polym. Eng. Sci. 1994, 34, 894–897. [Google Scholar] [CrossRef]
  22. Lantada, A.D.; Rebollo, M.S. Towards Low-Cost Effective and Homogeneous Thermal Activation of Shape Memory Polymers. Materials 2013, 6, 5447–5465. [Google Scholar] [CrossRef] [PubMed] [Green Version]
  23. Hemmer, C.; Polidori, G.; Popa, C. Temperature optimization of an electric heater by emissivity variation of heating elements. Case Stud. Therm. Eng. 2014, 4, 187–192. [Google Scholar] [CrossRef] [Green Version]
  24. Liu, Y.; Jiang, W.; He, S.; Ma, Y. An efficient plate heater with uniform surface temperature engineered with effective thermal materials. Opt Express 2014, 22, 17006–17015. [Google Scholar] [CrossRef] [Green Version]
  25. Zhao, J.; Jian, Q.; Zhang, N.; Luo, L.; Huang, B.; Cao, S. The improvement on drying performance and energy efficiency of a tumbler clothes dryer with a novel electric heating element. Appl. Therm. Eng. 2018, 128, 531–538. [Google Scholar] [CrossRef]
  26. Heiner, K.; Hans-Georg, L. Recommendations for implementing the strategic initiative Industrie 4.0′. Bus. Inf. Syst. Eng. 2013, 4, 239–242. [Google Scholar]
  27. Hippensteele, S.A.; Russell, L.M.; Stepka, F.S. Evaluation of a Method for Heat Transfer Measurements and Thermal Visualization Using a Composite of a Heater Element and Liquid Crystals. J. Heat Transf. 1983, 105, 184–189. [Google Scholar] [CrossRef]
  28. Barrington, S.J.; Eason, R.W. Homogeneous substrate heating using a CO 2 laser with feedback, rastering, and temperature monitoring. Rev. Sci. Instrum. 2000, 71, 4223–4225. [Google Scholar] [CrossRef]
  29. Boeing Co. Methods and Systems for Controlling and Adjusting Heat Distribution over a Part Bed. U.S. Patent No. US7515986B2, 7 April 2009. [Google Scholar]
  30. Griffiths, D.J. Introduction to Electrodynamics, 4th ed.; Pearson: Boston, MA, USA, 2013. [Google Scholar]
  31. Park, C.; Kim, J.; Lee, K.; Oh, S.; Kang, H.J.; Park, N.S. Electronic, Optical and Electrical Properties of Nickel Oxide Thin Films Grown by RF Magnetron Sputtering. Appl. Sci. Converg. Technol. 2015, 24, 72–76. [Google Scholar] [CrossRef] [Green Version]
  32. Serway, R.A.; Gordon, J.R. Principles of Physics; Saunders College Pub: Philadelphia, PA, USA, 1998. [Google Scholar]
  33. Majumdar, J.D.; Manna, I. Laser processing of materials. Sadhana Acad. Proc. Eng. Sci. 2003, 28, 495–562. [Google Scholar] [CrossRef]
  34. Indhu, R.; Vivek, V.; Sarathkumar, L.; Bharatish, A.; Soundarapandian, S. Overview of Laser Absorptivity Measurement Techniques for Material Processing. Lasers Manuf. Mater. Process. 2018, 5, 458–481. [Google Scholar] [CrossRef]
  35. Newman, R.; Chrenko, R.M. Optical Properties of Nickel Oxide. Phys. Rev. 1959, 114, 1507–1513. [Google Scholar] [CrossRef]
Figure 1. A thermal image of a 30 × 130 mm thin film-heating element with 3A and 6V DC applied across the element.
Jmmp 03 00065 g001
Figure 2. An optical microscopy image of the cross-section of the film at three positions along the element, showing the film inhomogeneity.
Jmmp 03 00065 g002
Figure 3. Four-probe line resistance measurement method.
Jmmp 03 00065 g003
Figure 4. The change in composition of the film due to ablation. Light areas denote metallic areas and the darker areas denote exidise areas. Laser power is increased from (left) 10 W to (right) 30 W. Scanning speed is increased from (top) 10 mm/s to (bottom) 300 mm/s. This corresponds to an applied fluence of (top left) 5 J·mm−2, (top right) 15 J·mm−2, (bottom left) 0.17 J·mm−2, and (bottom right) 0.5 J·mm−2.
Jmmp 03 00065 g004
Figure 5. A composite optical image of the cross-section of the unablated film in three locations.
Jmmp 03 00065 g005
Figure 6. A composite optical image of the film after ablation on three separate cross-sections of film.
Jmmp 03 00065 g006
Figure 7. An EDX image of the raw unablated element with the upper surface ground away.
Jmmp 03 00065 g007
Figure 8. An EDX image of a laser-ablated line on the film surface.
Jmmp 03 00065 g008
Figure 9. An EDX image of a laser-ablated line on the film surface.
Jmmp 03 00065 g009
Figure 10. Diagram depicting a stylized image of the element processing model transferring a thermal image of an element into a processing map used by the laser in one cycle with the laser pulses shown by the black circles.
Jmmp 03 00065 g010
Figure 11. Connection of the components within the laser system.
Jmmp 03 00065 g011
Figure 12. Processing control strategy employed by the Matlab software to transfer the infrared image data to a laser processing strategy.
Jmmp 03 00065 g012
Figure 13. Contour plots of the surface temperature profile after each cycle of processing. Number denotes the process iteration. The scale within each image and across all the images applies to all of the plots.
Jmmp 03 00065 g013
Figure 14. Contour plots of the surface temperature profile measurements shown after each cycle of ablation using the 20% method to treat element.
Jmmp 03 00065 g014
Figure 15. Contour plots of the surface temperature profile measurements shown after each cycle of ablation using the 50% method to ablate element.
Jmmp 03 00065 g015
Figure 16. Greyscale method contour plots of the surface temperature profile measurements after each cycle of ablation using the Greyscale method.
Jmmp 03 00065 g016
Figure 17. The first repetition of the Greyscale–Threshold hybrid (GT) method is shown in the contour plots of the surface temperature profile measurements shown after each cycle of ablation.
Jmmp 03 00065 g017
Figure 18. The second repetition of the Greyscale–Threshold hybrid (GT) method is shown in the contour plots of the surface temperature profile measurements shown after each cycle of ablation.
Jmmp 03 00065 g018
Figure 19. The third repetition of the Greyscale–Threshold hybrid (GT) method is shown in the contour plots of the surface temperature profile measurements shown after each cycle of ablation.
Jmmp 03 00065 g019
Figure 20. The Greyscale–Threshold plus memory hybrid (GM) method processing is used to treat the element. The result is visualized in contour plots of the surface temperature profile measurements shown after each cycle of ablation.
Jmmp 03 00065 g020
Figure 21. Graph of the standard deviation of the surface temperature relative to the initial standard deviation of the element.
Jmmp 03 00065 g021
Figure 22. The resistance of each element after each ablation cycle with various processing strategies.
Jmmp 03 00065 g022
Table 1. Elemental components of the initial powder before flame spray.
ElementNiCrFeSiCuMn
wt%Bal.14.98.60.550.30.13
Table 2. Resistivity of the main constituents of the film at 20 °C [31,32].
MaterialResistivity (n Ω ·m)
Metallic nickel69.3
Metallic iron96.1
Metallic chromium125.1
Nickel oxide548.1
Table 3. Descriptions of the various processing methods investigated.
Ablation MethodSummary
Abrasion BaselineThe abrasion method is carried out by the analysis of the thermal profile of the element and abrading with an abrasive medium of the coolest regions of the element temperature profile.
20% Threshold (20%)All regions at temperatures lower than the 20th percentile of the temperature distribution were ablated at the optimized output of the pulsed laser beam in a raster pattern.
50% Threshold (50%)All regions at temperatures lower than the 50th percentile of the temperature distribution were ablated at the optimized output of the pulsed laser beam in a raster pattern.
Greyscale (GS)The element is ablated in a raster pattern with the coldest areas receiving more treatment than hotter areas through altering the duty cycle of the pulsed beam; areas at the highest temperature regions receive 0% of the power output, the coldest region receiving 100% with a linear scale between.
Greyscale-Threshold (GT)The Greyscale algorithm is used to find the levels of treatment in the areas between a threshold value (set at the hottest 20th percentile) and the lowest temperature.
GT + Memory (GM)The GT method was used, but previous treatments (n − 1) considered to reduce the intensity of subsequent treatments (n) by up to 10% of the output of the previous treatment.
Table 4. The performance metrics of the various processing methods used to compare the total improvement of the temperature profile from the initial element to the optimized profile.
Metric20% Threshold50% ThresholdGreyscaleGreyscale ThresholdGT with Memory
Abbreviation20%50%GSGTGM
% Standard Deviation Improvement62.1−25.157.465.871.2
% Standard Deviation Improvement/Cycle15.5−6.37.111.111.9
Optimized Profile Kurtosis2.712.083.573.372.71
Time/Cycle (mins)1.52.03.03.03.0
Average Number of Cycles48466

