3.2. Surface RS State After Pre-Machining and DR, Influence of the Measurement Device
As discussed in the introduction section, the characterization of the RS profiles after DR is still an issue even when the process parameters are fixed, due to some specific measurement procedure characteristics. Often, employing the same measurement techniques is not a guarantee for consistent results, as the precision and the devices’ setup can vary. Therefore, the current section presents results of RS surface profiles measured on same specimens but using different diffractometers. In addition, some of the most significant DR process parameters were varied and the resulting RS profiles were compared.
In
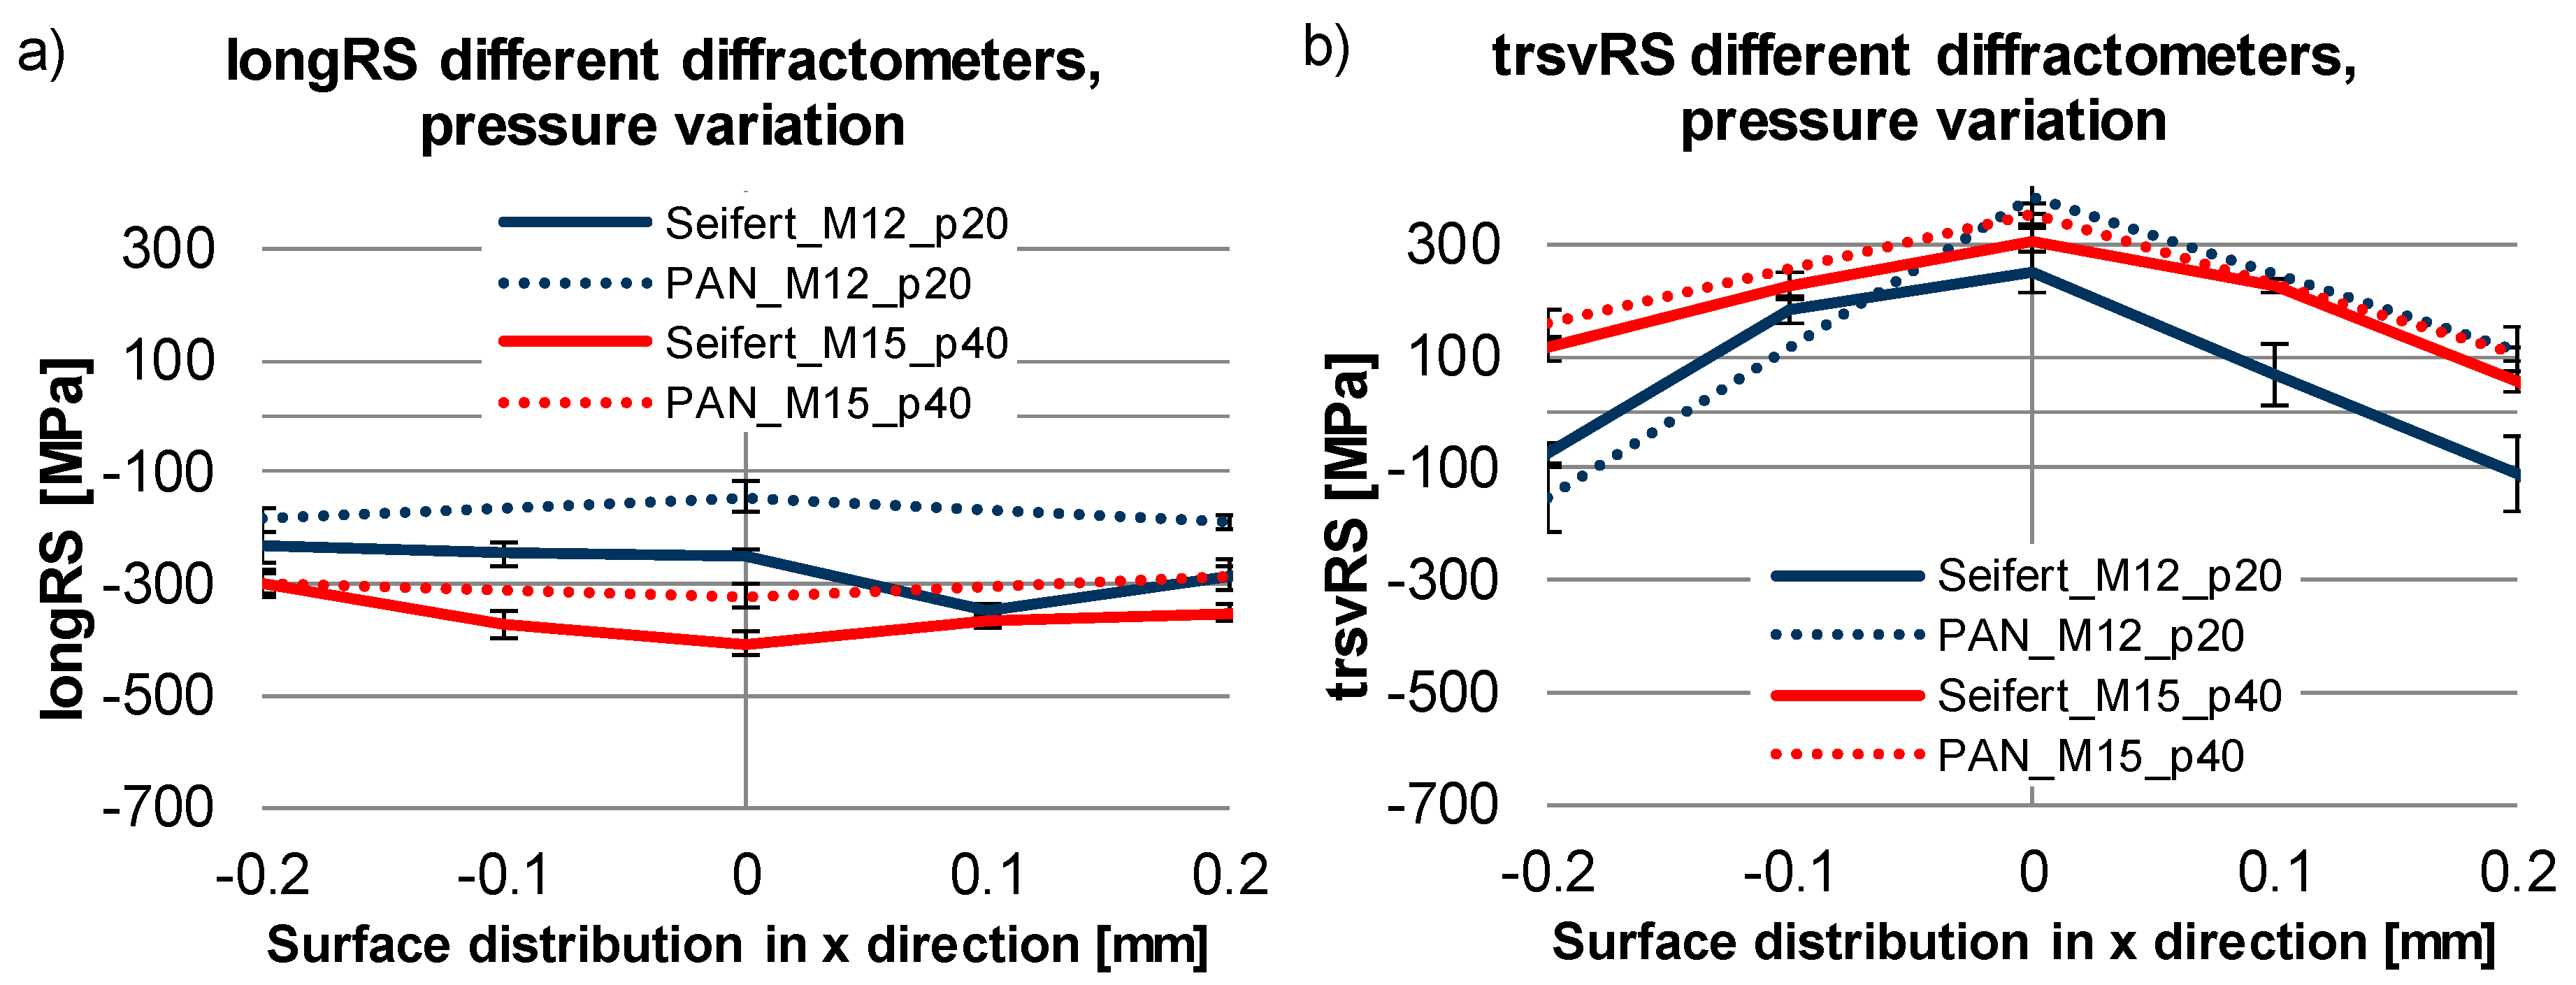
Figure 4 are plotted the surface RS distribution of DR specimens (milled + DR), where the DR pressure was varied from 20 MPa to 40 MPa. The same specimens were measured using Seifert and PANalytical diffractometers, using measurement parameters and orientation plotted in
Table 4 and in
Figure 2. In the both measured directions: Longitudinal (see
Figure 4a) and transverse (see
Figure 4b), the difference between the values derived by the both diffractometers lay between 50 MPa and 150 MPa. The higher DR pressure (see specimen M15_p40) leaded to a slight shifting of the transverse RS from compressive towards tensile. The RS distribution in longitudinal direction varied from this in transverse direction for the both specimens and this is typical for the DR process, due to the in-process differing plastic stretching and shrinking in the longitudinal and transverse directions [
16].
It is also visible that the stress distribution was not always as expected symmetrical to the center of the DR trace; this can be a sign of a measurement position misalignment.
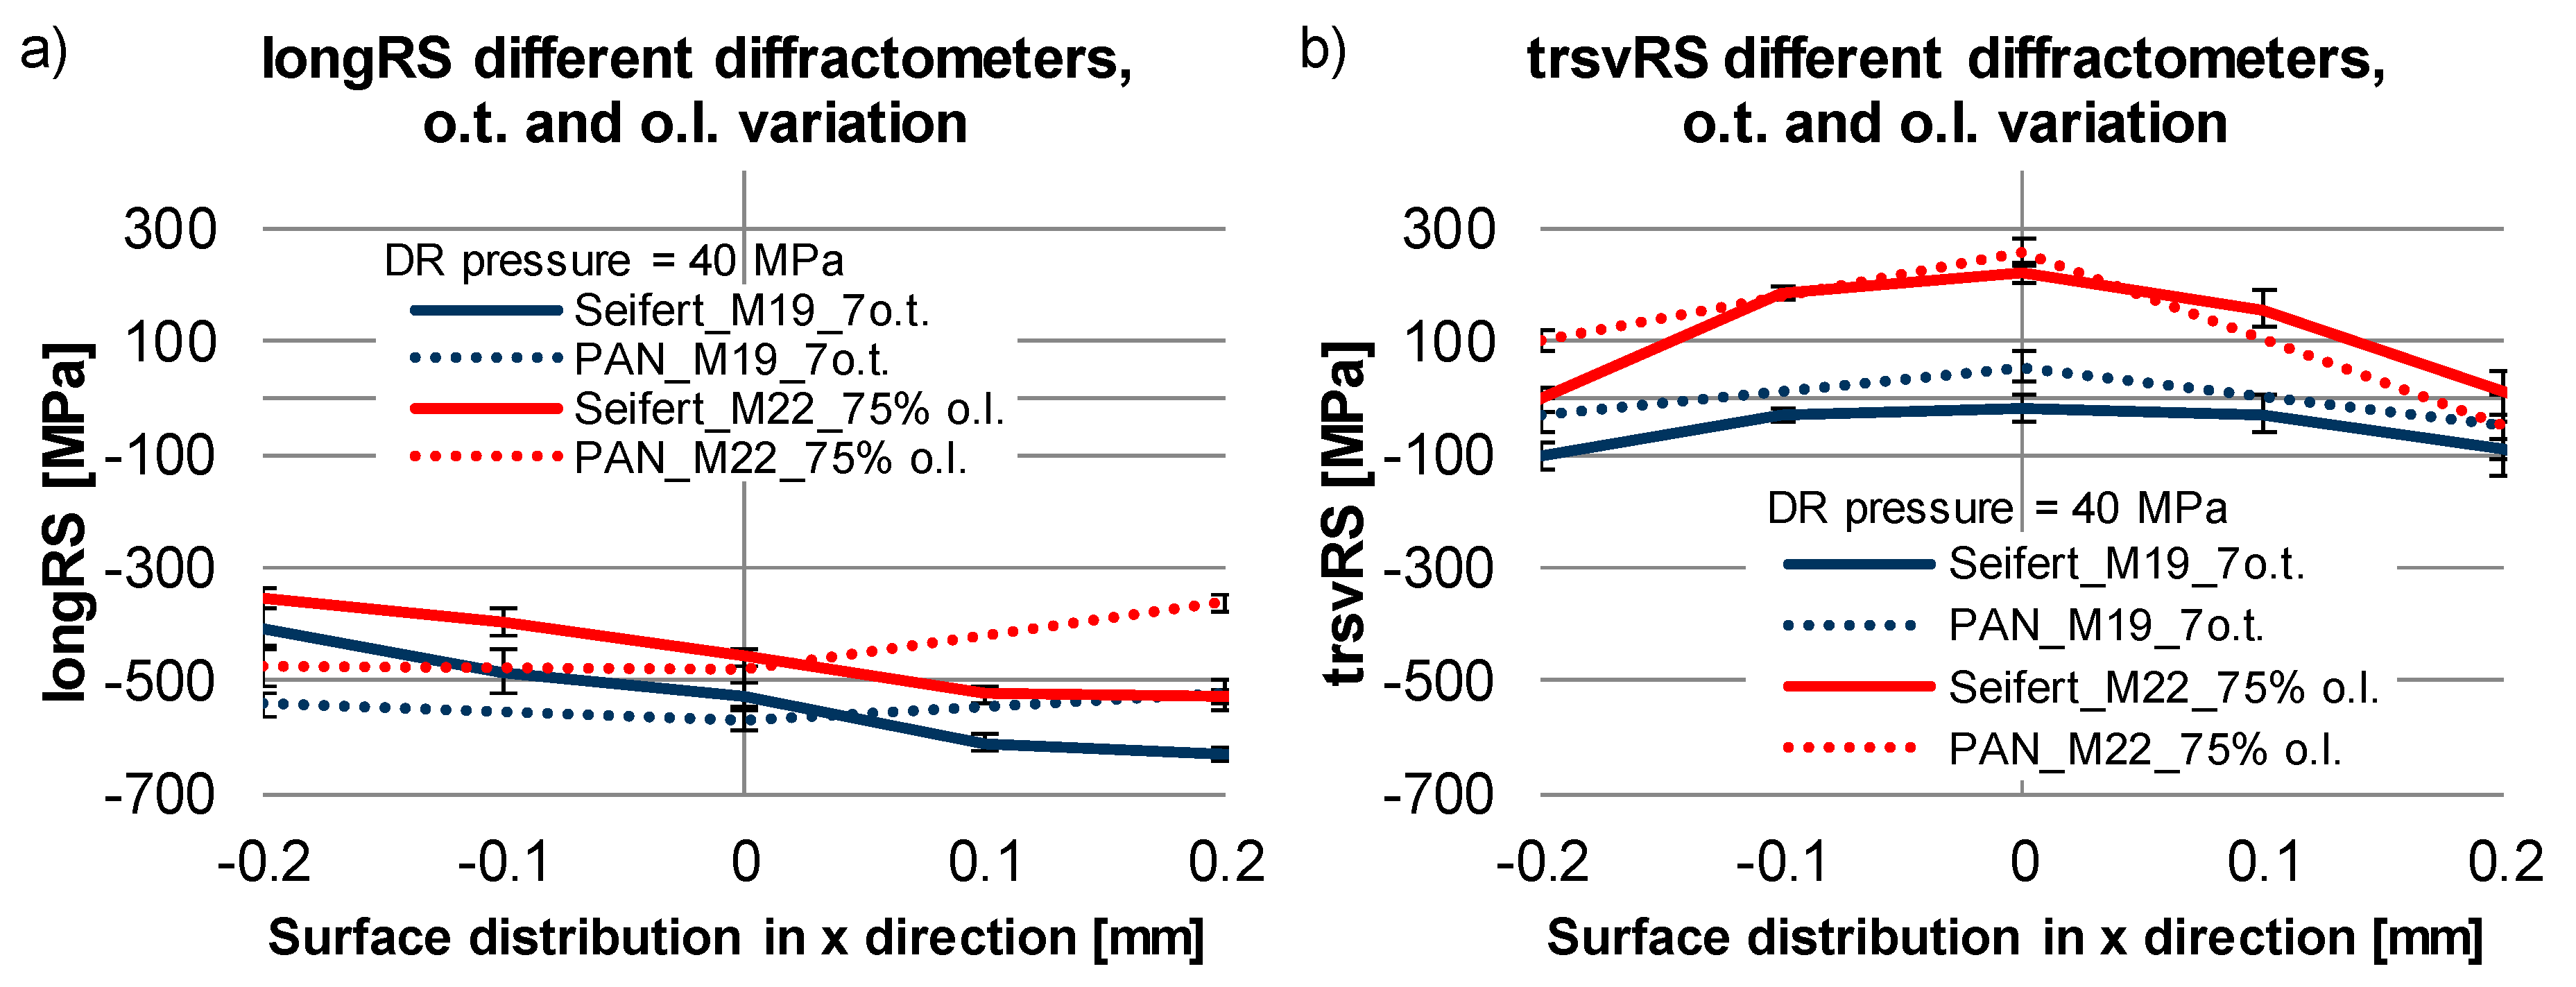
Figure 5 (milled + DR state) shows the surface RS distribution in longitudinal (see
Figure 5a) and in transverse (see
Figure 5b) direction, by variation of the number of overturns (o.t.) or the overlapping (o.l.) percentage. The DR pressure was kept constant at 40 MPa. Here, both measurement devices deliver again similar results but some moderate asymmetry in the stress profiles in longitudinal direction (see
Figure 5a) was present. The RS state in longitudinal direction after DR with 7 overturns (
Figure 5a, M19_7o.t.), compared with the no overturn (
Figure 4a, M15_p40) was higher compressive with values between -400 MPa to -600 MPa (single overturn: −300 MPa to −400 MPa). The 75% overlapping (M22_75% o.l.) compared with no overlapping (M15_p40) delivered similar results. In the transverse direction, the DR with 7 overturns (M19_7o.t.,
Figure 5b), compared with the single overturn (M15_p40,
Figure 4b), reduced the tensile RS situated in the middle of the DR trace. The DR with overlapping (M22_75% o.l.), compared with DR without overlapping (M15_p40) delivered similar RS profiles.
The results shown in
Figure 4 and
Figure 5 confirm that, in this particular case, the employment of different measurement devices, when applying similar measurement techniques and parameters do not lead to a large inconsistency of the determined RS values. Nevertheless, when in general investigating very similar RS states, the observed discrepancy of up to 150 MPa can be a crucial factor for the correct interpretation of the measured values.
3.3. Surface RS State After DR, Influence of the Pre-Machining
The results shown in the previous section emphasized some aspects of the measurement uncertainties that may arise when using different diffractometers. The performed in-trace measurements focused in the middle of the DR trace did not show the complete RS state impacted by the DR process. The surface measurement area was, therefore, expanded to fully cover the width of the DR trace in an amount of over 0.7 mm. The measurement path was extended to 3 mm (±1.5 mm), as its position remained the same—transverse to the DR trace (−x and +x direction). The stress determination was obtained using the diffractometer Seifert XRD 3000 PTS, with the parameters shown in
Table 4.
In this section, the pre-machining treatment of the later DR specimens was varied, where specimens labeled with “M” were milled and deep rolled and those labeled with the “P” were milled, polished and deep rolled. Some changes in the RS profiles were expected due to the variable roughness (on the milled specimens much higher than on the polished ones) and the corresponding change in contact surface between work piece and tool during the initial penetration of the DR tool. The DR process parameters were varied in the same manner as in the previous section: Applied pressure, number of overturns and overlapping percentage. The RS surface profiles in both longitudinal and transverse directions were depicted.
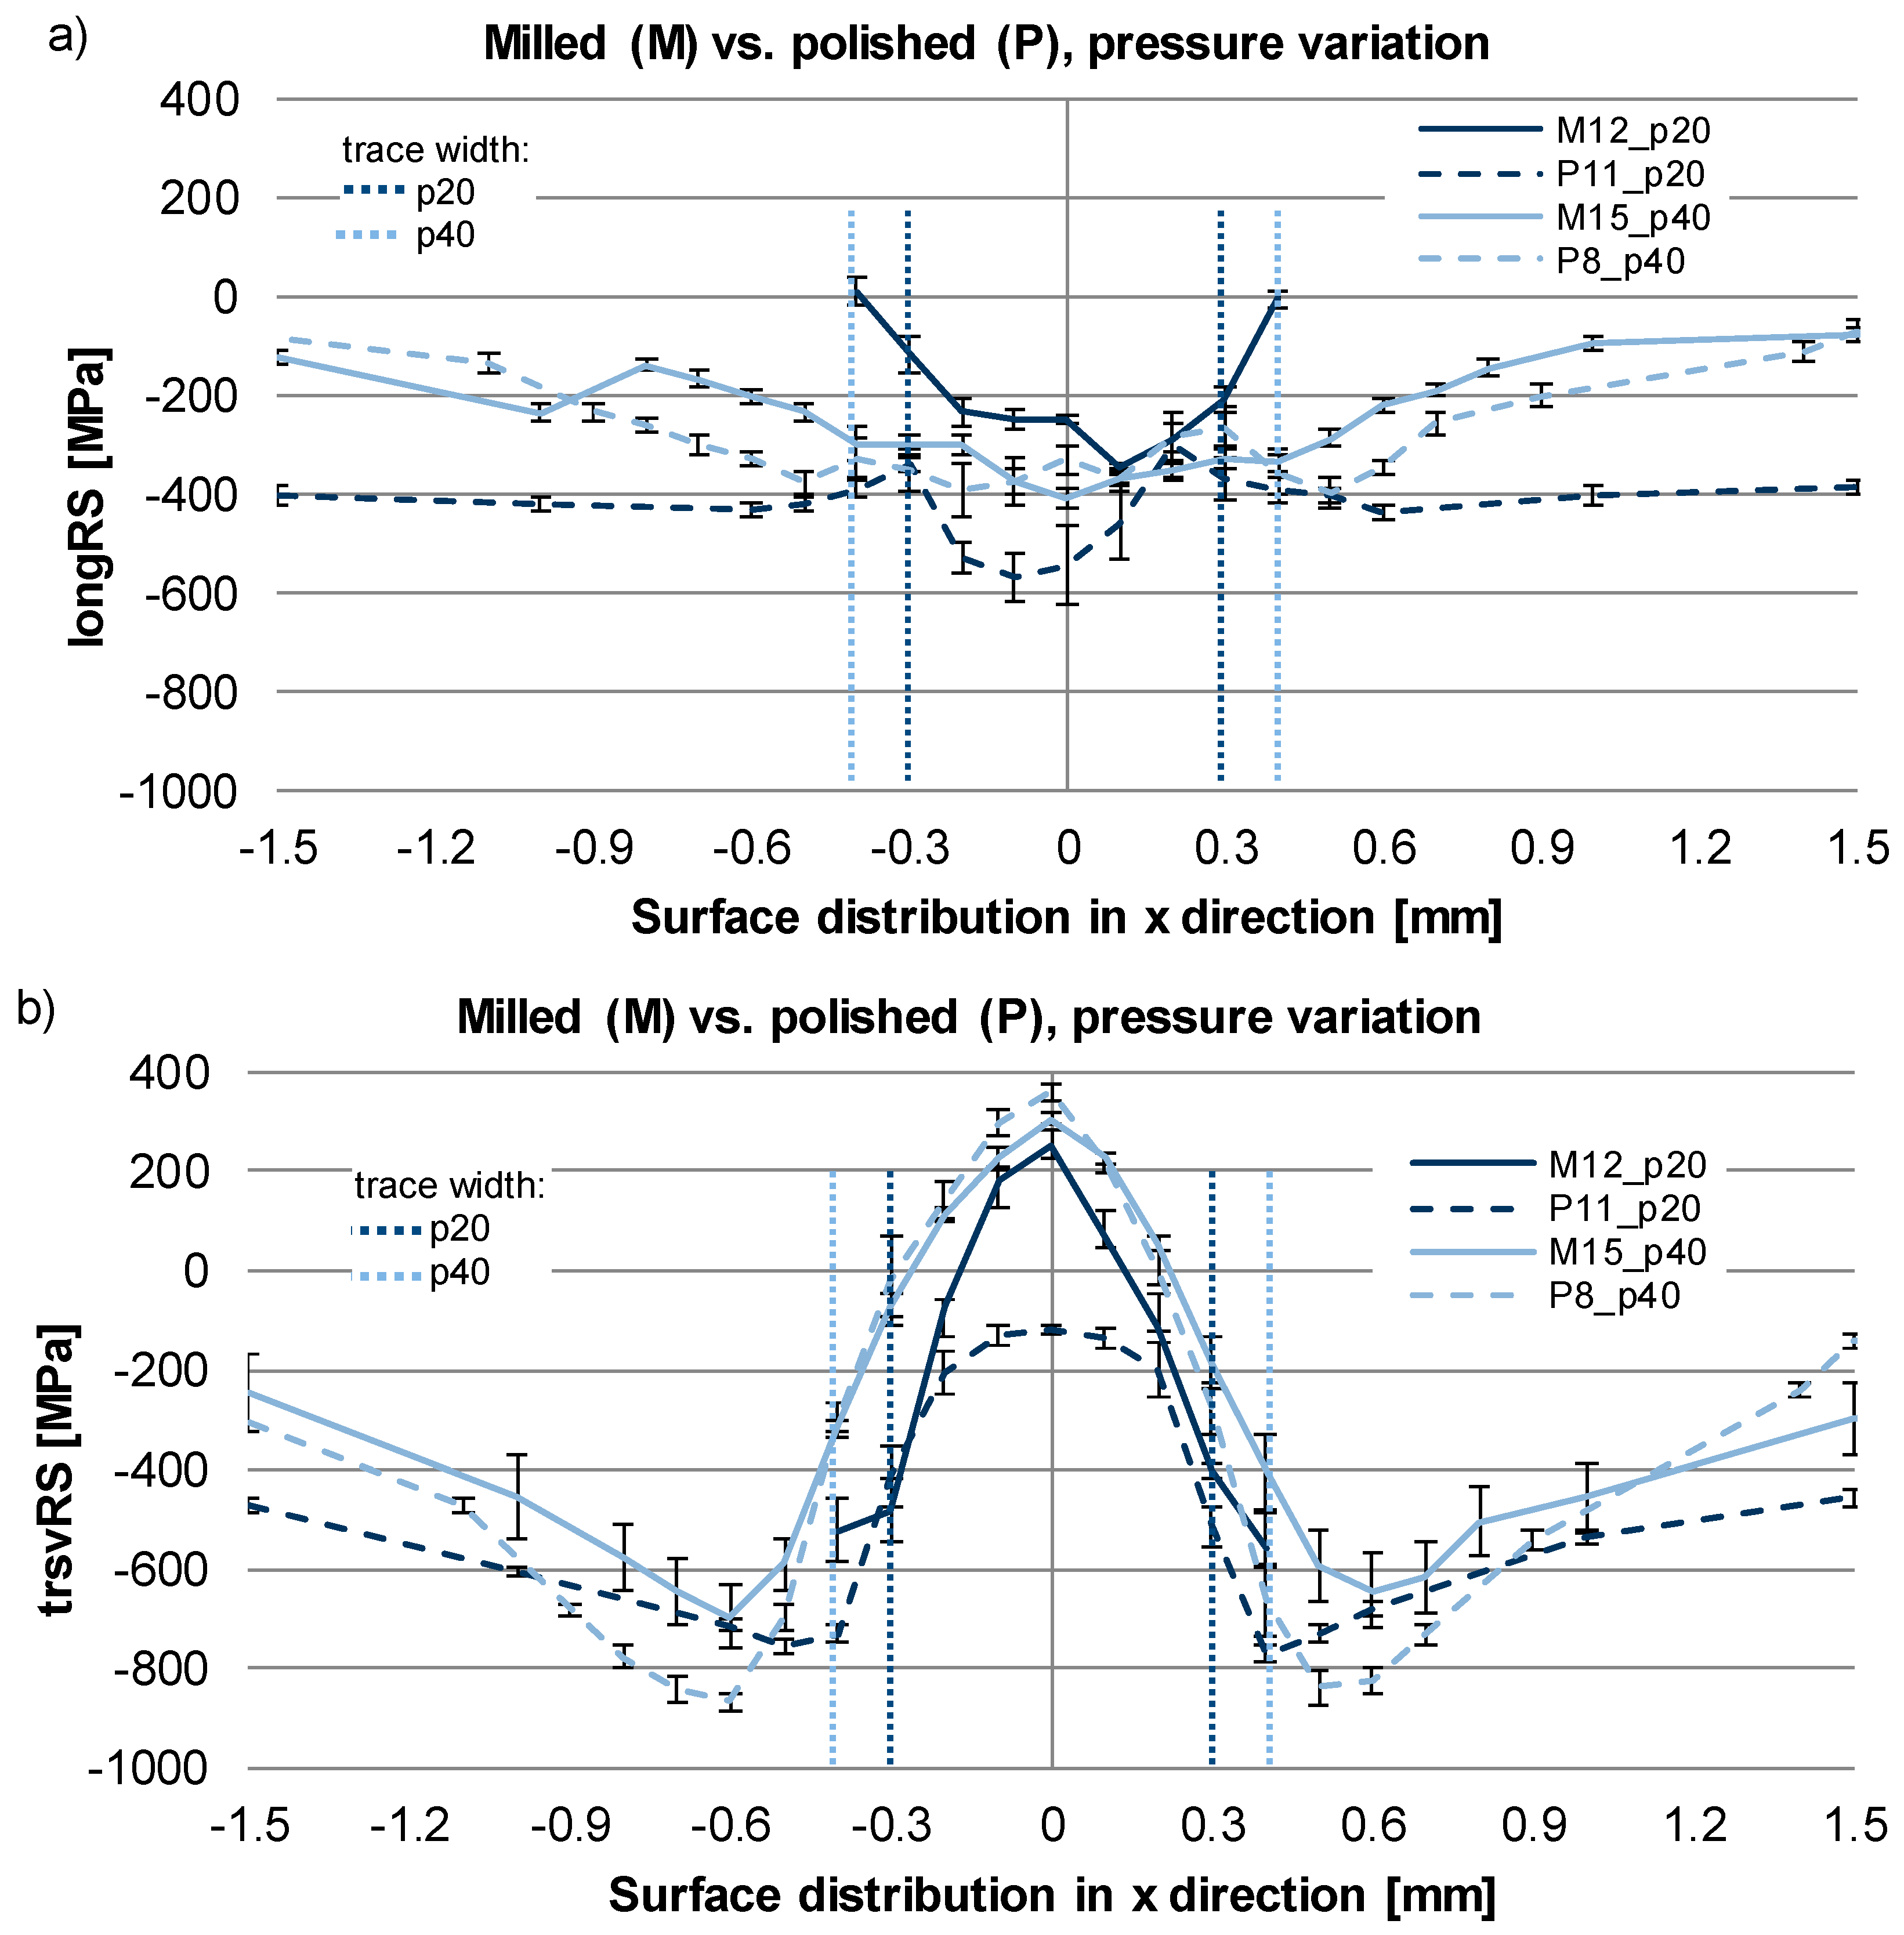
Figure 6 represents the surface RS profiles and the trace width of specimens deep rolled with variable pressure. The width of the DR trace (designated with dotted vertical lines) increased with increasing of the DR pressure, an indication of expanding plastically deformed zone. For the used material, the process pressure from 20 MPa to 40 MPa can be considered as a low to high range. The further increasing of the DR pressure should not lead to greater RS state changes due to saturation level reached. By DR treatment with 40 MPa, the maximal determined surface RS was near the yield strength of the material. Considering the almost ideal plastic behavior of the material (the yield strength and the ultimate strength are very close as values), no significant raise of the RS should be expected by further increasing the DR pressure. Additional investigations of the hardness state and the x-ray diffraction peak widths (FWHM) show that the material does not prone to cold working, as after DR, no significant change of the hardness and the x-ray diffraction peak widths was observed.
The stresses in longitudinal direction are plotted in
Figure 6a. Here, the highest difference exhibited the stresses of the milled vs. polished specimens treated with a DR pressure of 20 MPa. It was assumed that the polished + DR specimens should exhibit lower compressive RS than the milled + DR specimens due to the resulting difference in the contact force during treatment caused by the variable surface roughness. Considering the applied DR pressure was, in general constant, when the contact area between specimen and DR tool decreased due to high roughness of the specimen, the contact pressure increased proportionally with the decrease in contact area. This should lead to a higher amount of plastic deformation and higher compressive RS values. In contrary to this assumption, the polished + DR specimen (P11_p20) exhibit higher compressive RS than the milled + DR (M12_p20) and even than the specimens treated with 40 MPa pressure (M15_p40 and P8_p40). Nevertheless, it is notable that the residual stresses of the untreated material (see the results from ±0.6 mm towards out of the DR trace) were significantly higher compressive, app. −400 MPa than those of the rest of the specimens. This can be an indication of higher compressive residual stresses generated by the polishing process, or residual stresses inherited from previous process chain steps.
On the other hand, the RS measured on the specimens treated with 40 MPa pressure were similar for both pre-machining states, where those measured on the polished + DR specimen were at some places up to 100 MPa higher compressive than these measured on the milled + DR specimen.
For all four specimens, the stress affected area largely exceeds the width of the DR trace.
In
Figure 6b are plotted the RS in the transverse direction. The compressive RS maximum of up to −900 MPa (as the value almost approached the yield strength of the material) is located for all specimens out of the DR trace, where the polished specimens (P11 and P8) exhibited higher compressive RS than the milled specimens (M12 and M15). In the middle of the trace, the measured stresses for all specimens but P11 are moderate tensile. Here, the P11 differs again from the rest of the specimens, exhibiting slightly compressive instead of tensile stresses.
In general, it can be expected that in the transverse direction the compressive RS maximum was located out of the trace. This was an effect of the plastic deformation caused by the DR tool, expressed as material transverse stretching in the DR trace, where the stretched material was pushed in direction out of the trace, see [
16]. In [
17], it is discussed the typical RS profile of DR specimens, where it was stated that higher DR force/pressure, can lead to tensile RS on the surface.
Although, it remains unclear if the differing surface RS profile of the P11 specimen is due to inconsistency of the RS state from the pre-machining or it is an effect of the DR treatment. A superposition of the both factors is also possible.
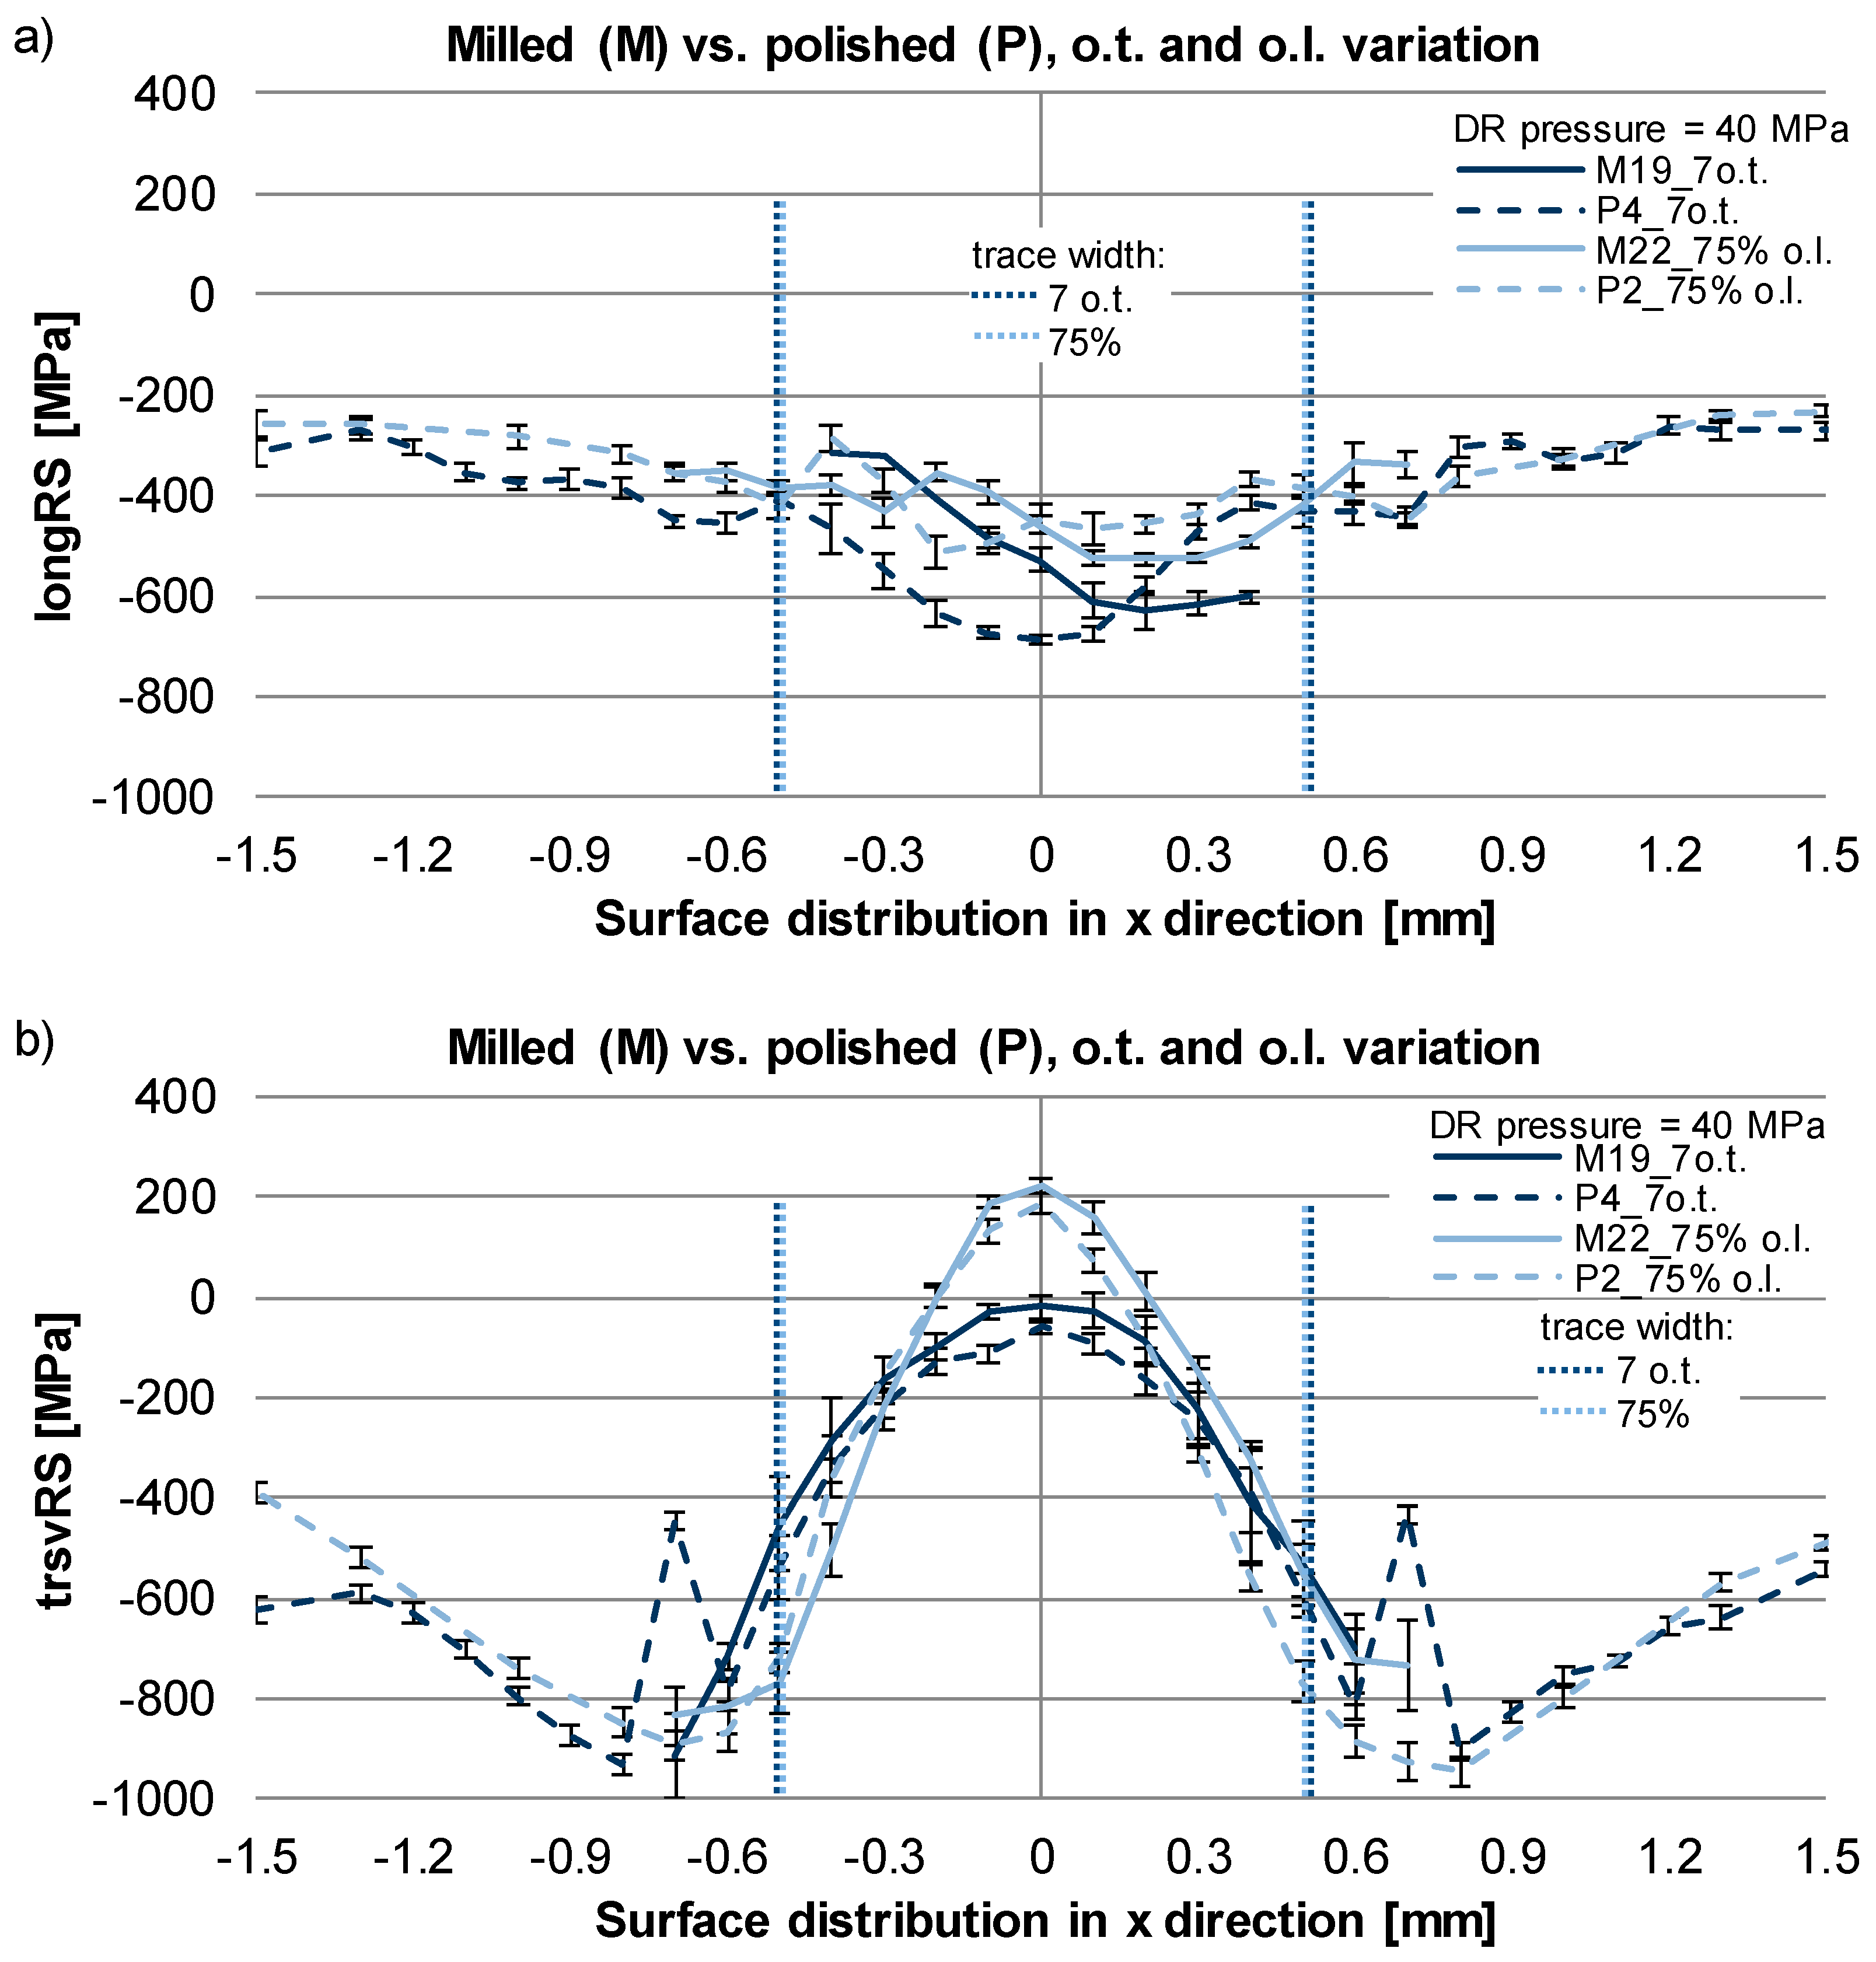
The next process parameters’ variation was done as fixing the DR pressure at 40 MPa and varying the number of overturn (o.t.) or the overlapping percentage (o.l.). The pre-machining state (milled or milled + polished) was varied as well. For the specimen treated with DR with overlapping, the zero-x coordinate in the diagrams described the center of the overlapping trace. The surface RS distributions are plotted in
Figure 7: Longitudinal direction—
Figure 7a and transverse direction—
Figure 7b. For both directions, it was expected that RS distribution should be symmetrical to the middle of the DR trace. In longitudinal direction, for two of the specimens (M19 and M22) this was not the case. Here, a lateral shift (up to 200 µm) of the stress profiles was observed, where it is not clear, is if the shifting was caused by a faulty DR treatment or if it is due to positioning misalignment during the stress determination. Regardless, the lateral shifting, it is visible that the DR treatment with seven overturns (M19 and P4) enhanced the maximal compressive RS in comparison with the single overturn (M15 and P8,
Figure 6a) with 250–300 MPa. The stresses obtained by DR treatment with overlapping of 75% (M22 and P2) do not significantly differ from those generated by the single trace DR (M15 and P8,
Figure 6a).
It was additionally observed that the different pre-machining (milling or milling + polishing) did not significantly affect the final RS distribution.
The surface RS profiles in transverse direction are shown in
Figure 7b. Here, similarly to the results from
Figure 6b, there is a presence of tensile, tending to zero residual stresses in the middle of the DR trace and the maximal compressive RS are located out of the DR trace. The DR treatment with seven overturns shifted the tensile stresses positioned in the middle of the DR trace in direction compression, to achieve a stress state near zero. In milled + polished + DR state, the treatment with seven overturns compared with a single overturn, the generated compressive RS were similar, reaching approximately −900 MPa. In contrary, the milling (w/o polishing) + DR treatment with seven overturns compared with single overturn delivered compressive RS out of the trace of approximately −900 MPa (approximately 200 MPa higher compressive than the single overturn). This means that the multiple overturn DR treatment was, in this case, more favorable than the single overturn treatment.
Remarkable for the results of specimen P4 are the two measured values at x = −0.7 mm and at x = 0.7 mm, which differed from all other results shown in
Figure 7b. It is difficult to make an assumption about the origin of this local stress peaks but they are unlikely present due to local microstructure imperfection or treatment failure, as they are symmetrical to the trace’s middle.
It was also observed that the stress profiles of specimens M19 and M22 were not shifted in the lateral direction, as the profiles measured in longitudinal direction but they are symmetrical to the middle of the DR trace and this can be an indication about misalignment of the X-ray primary beam.
The stress state of the specimens treated with 75% overlapping (M22 and P2,
Figure 7b) and of those treated without overlapping (M15 and P8,
Figure 6b) was similar and the pre-machining (milled vs. milled + polished) did not affect significantly the final RS state.
3.4. RS Depth Distribution After DR, Influence of the Pre-Machining
After the characterization of the RS surface distribution achieved by different pre-machining states and varied DR process parameters, the RS depth profiles were obtained on the same specimens. It is important to point that the information for the RS depth distribution is, in general, crucial for the prediction of the fatigue behavior of the treated parts and cannot be substituted only by surface RS profiles determination. The so-called stress impact depth is an important characterization parameter, as the presence of deeper, not only high in amount, compressive RS can serve for retarding the propagation of existing cracks and can prevent cracks formation even by the presence of tensile RS on the surface. The definition “crack arrest/closure” describes this phenomenon [
18].
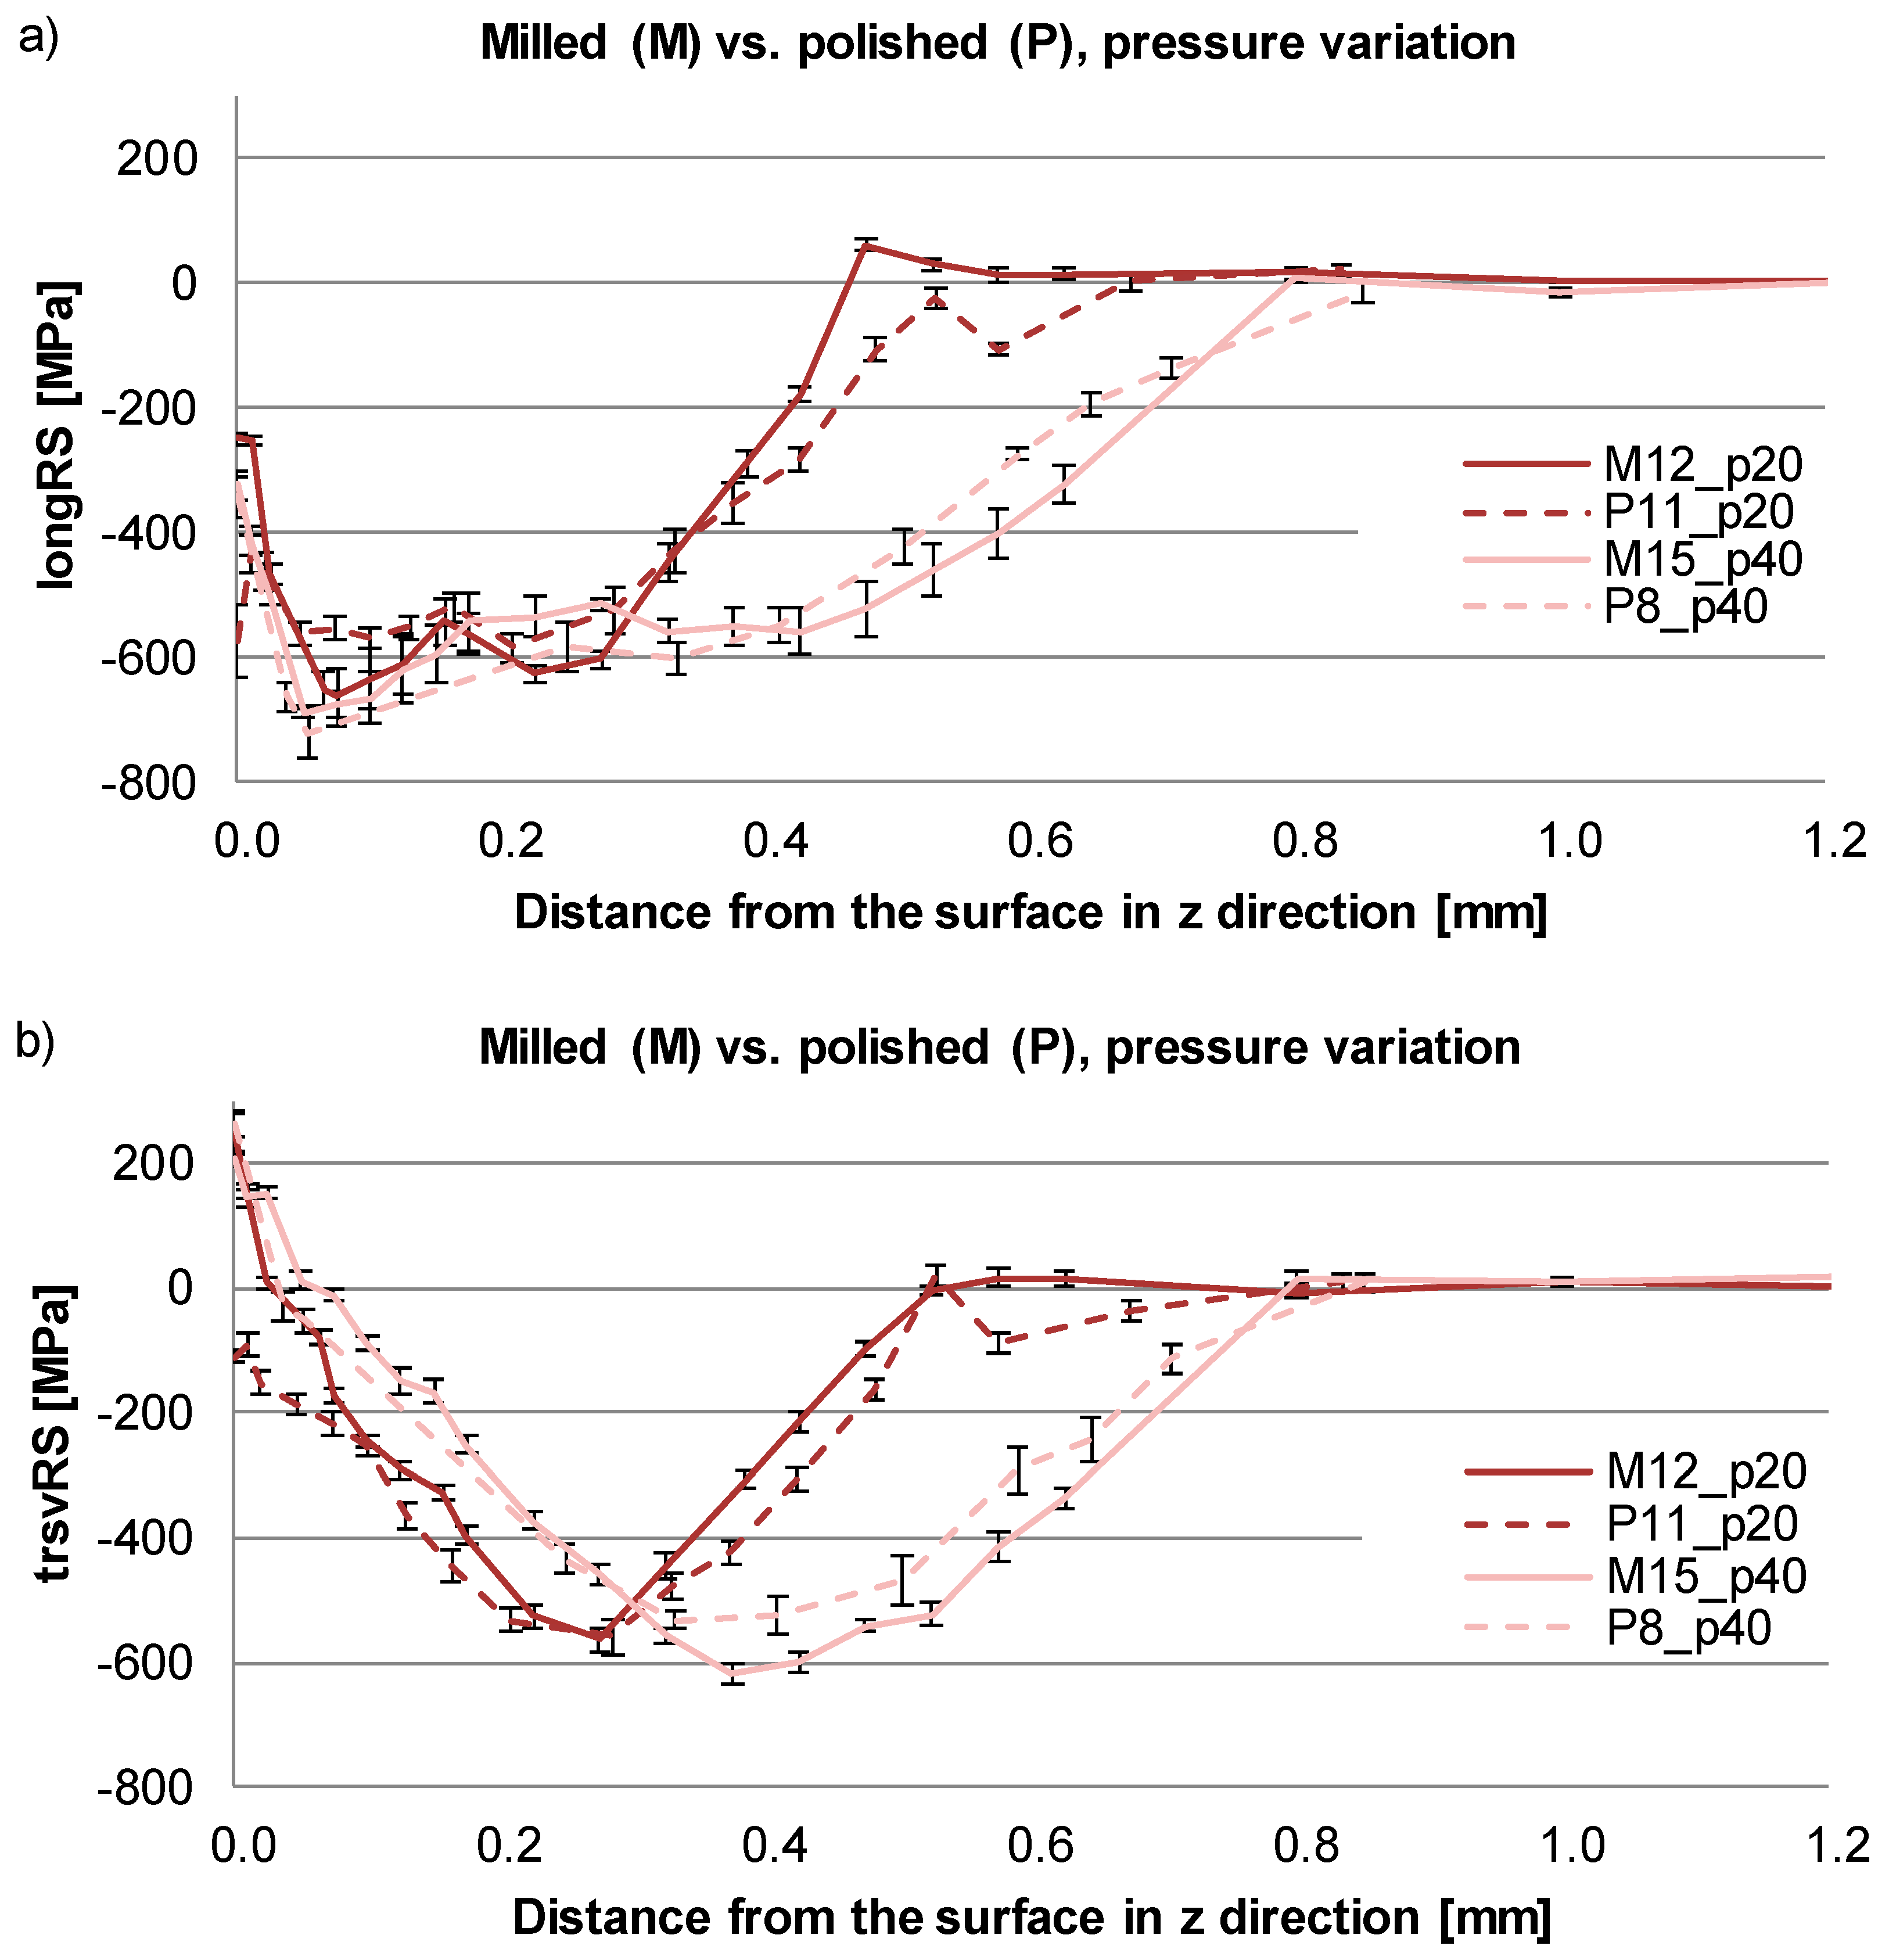
In
Figure 8 are shown the depth stress profiles of specimens treated with variable pre-machining and with DR pressure 20 MPa or 40 MPa. The measuring points were defined in the middle of the DR trace in +z direction (see
Figure 2) and the consecutive measured surfaces were obtained as the corresponding material layer was removed with means of electropolishing. The stress redistribution due to the material removal was considered but the measured values were not corrected, as the total thickness of the specimens (approximately 10 mm) was much larger than the total layer removed (approximately 1.2 mm). In addition, the highest measured values were always near the surface, where the stress redistribution due to the material removal was not substantial. Despite this, a test correction was done with the help of the mathematical formulations of Moore and Evans [
19] and the difference between the corrected and not-corrected values did not exceed 50 MPa.
Figure 8a illustrates the RS in depth, measured in longitudinal direction for the specimens treated with 20 MPa or 40 MPa DR pressure and with variable pre-machining state. It can be observed that for all specimens, the magnitude of the compressive RS is similar (maximal difference 200 MPa) and the maximum is found about 75–100 µm below the surface. In contrary, the stress impact depth is quite different, namely the stresses of the specimens treated with 40 MPa pressure reach zero at approximately 0.7 mm depth, where those of the specimens treated with 20 MPa tended towards zero at just 0.45 mm depth. Additionally, a discrepancy between the results for the different pre-machined states of approximately 300 MPa was present only at the surface and at about 50 µm depth diminished.
In
Figure 8b are depicted the depth profiles of the stresses in transverse direction, by variable pre-machining state and variation of the DR pressure. Similarly to the results in
Figure 8a, the higher DR pressure (M15 and P8) did not lead to enhancing the amount of the compressive RS but it positively affected the stress impact depth, increasing it with about 0.30 mm from 0.5 mm (M12 and P11) to 0.8 mm (M15 and P8). The transverse residual stress curve shape differs from this in longitudinal direction, having a maximum of the compressive residual stresses shifted into higher depth of 0.3 mm to 0.4 mm. Notable is also the difference of the stress profiles for the specimens M12 and P11. Despite of the big discrepancy of the stresses on the surface (approximately 350 MPa difference), this difference drastically diminished at about 75 µm depth.
Typically for DR, the application of higher DR pressure lead to raising the stress impact depth in both longitudinal and transverse directions. The higher DR pressure lead to higher contact pressure between tool and work piece during processing. The higher contact pressure resulted in a thicker plastically deformed zone, which prevented the redistribution of the stresses after releasing the DR pressure, thus expanding the residual stress impact zone deeper into the material.
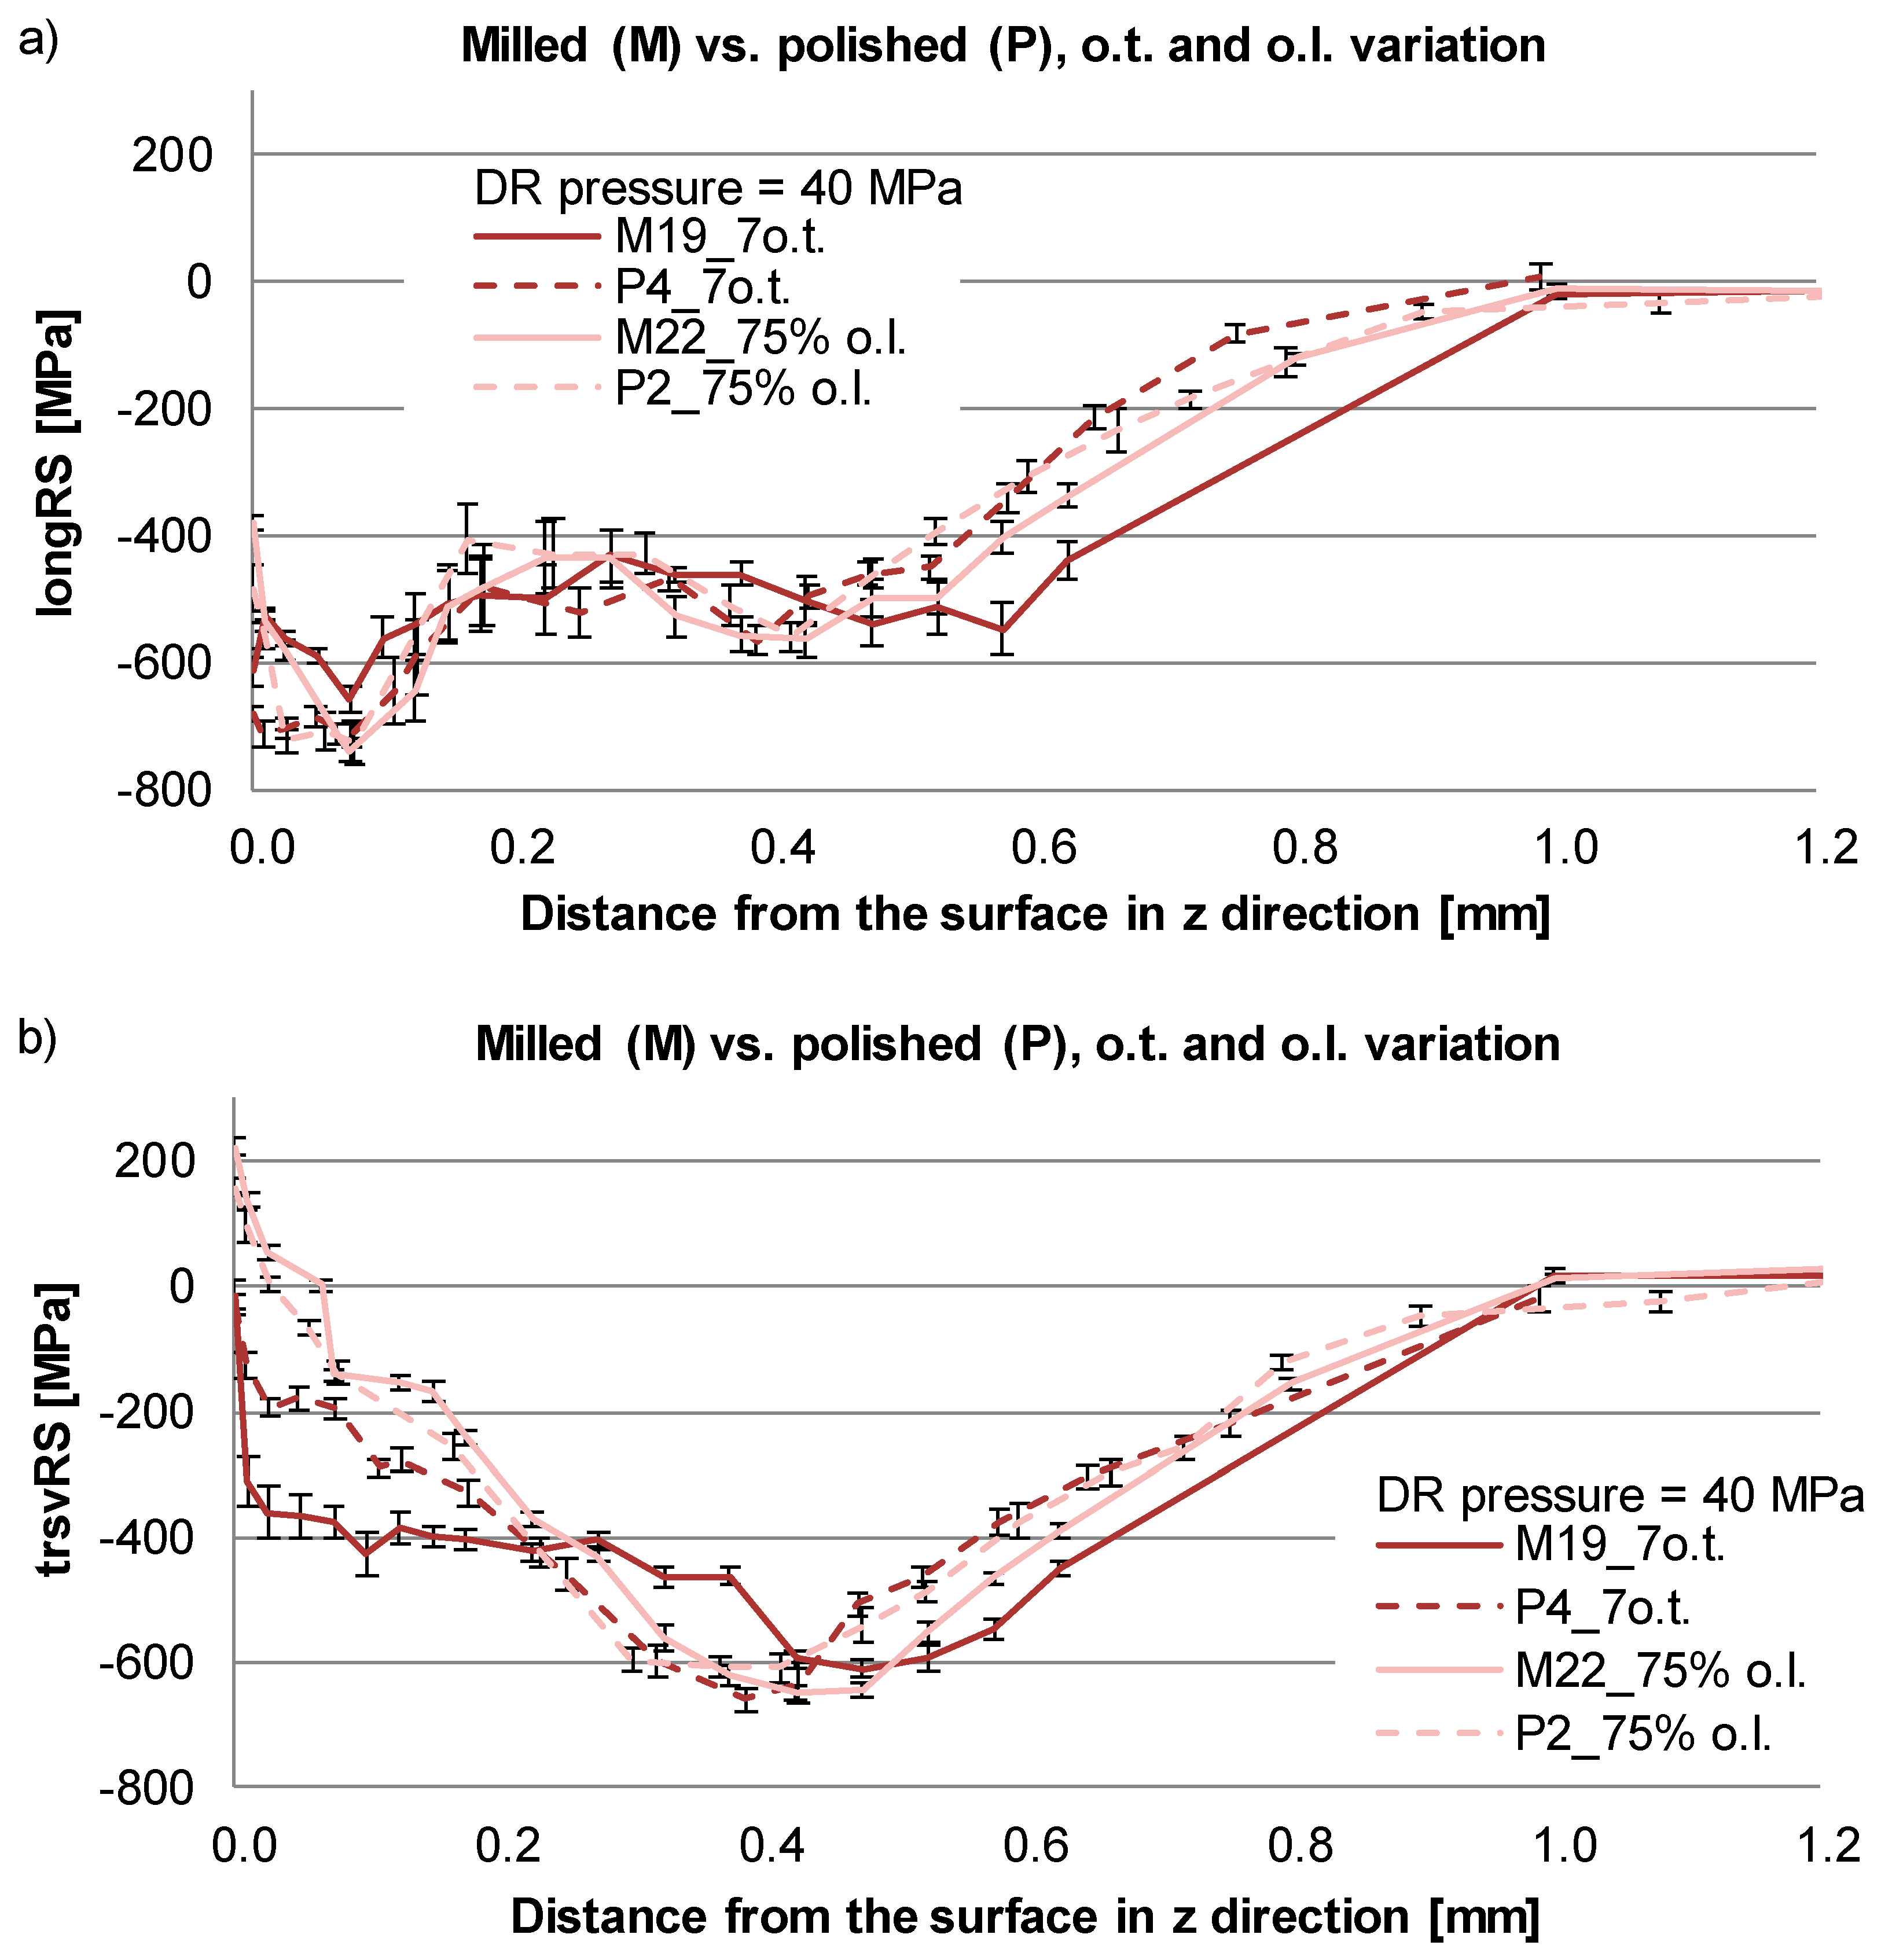
The next results (see
Figure 9) display the stress depth profiles in longitudinal (
Figure 9a) and in transverse (
Figure 9b) direction, by a fixed DR pressure of 40 MPa and treatment with seven overturns (o.t.) or with 75% overlapping (o.l.).
The depth distribution in the longitudinal direction is consistent for all four specimens and compared with the specimens M15 and P8 (see
Figure 8a) the compressive RS are similar as position and as amount. Although, the stress impact depth reached about 1.0 mm for all four specimens (
Figure 9a), where the M15 and P8 (see
Figure 8a), treated also with 40 MPa DR pressure but only once and without overlapping have a smaller stress impact depth of 0.8 mm. On the one hand, this observation confirms the favorable effect of the multiple-overturn DR treatment and on the other hand, it emphasizes the change in the RS state if applying DR with or without overlapping.
The same specimens were also measured in the transverse direction; the values are plotted in
Figure 9b. Near the surface, the treatment with seven overturns (M19 and P4) compared with single overturn (M15 and P8,
Figure 8b) generated near zero, instead of tensile stresses. In addition, the stresses developed more rapidly towards higher compression than those generated by the single overturn. The compressive stress maximum remained almost the same as amount but shifted to a higher depth with approximately 0.1 mm and the stress impact depth was greater, namely app. 1.0 mm, compared with this generated by the single treatment of 0.8 mm.
The depth profiles of the specimens M22 and P2 treated with 75% overlapping were almost identical with those of M15 and P8 from
Figure 8b (both without overlapping). The only difference is in the stress impact depth, which in case of treatment with overlapping reached 1.0 mm, where the stress impact depth without overlapping was about 0.8 mm.
When comparing the results of the different pre-machining states, the treated with 75% overlapping specimens (M22 and P2) exhibited almost identical RS depth profiles, while the specimens treated with seven overturns (M19 and P4) had RS depth profiles which moderately differ from each other.
Based on the comparisons made in this section, it can be concluded that the multiple overturn DR treatment and treatment with overlapping were more advantageous in terms of stress impact depth compared with single overturn treatment and without overlapping. The DR pressure did not have a significant impact on the compressive residual stress amount but affected greatly the stress impact depth with up to 0.3 mm. The variation of the pre-machining did not lead to a significant tendency, as the depth profiles of milled + DR or milled + polished + DR specimens were either very similar or a moderate random discrepancy was available.


