Article

Microstructure Development during Low-Current Resistance Spot Welding of Aluminum to Magnesium

1
Faculty of Engineering and Informatics, University of Bradford, Richmond Road, West Yorkshire BD7 1DP, UK
2
Mechanical Engineering Department, University of Technology, Jamaica, 237 Old Hope Road, Kingston 6, Jamaica
*
Author to whom correspondence should be addressed.
J. Manuf. Mater. Process. 2019, 3(2), 46; https://doi.org/10.3390/jmmp3020046
Submission received: 9 May 2019 / Revised: 11 June 2019 / Accepted: 12 June 2019 / Published: 14 June 2019

Abstract

:
Resistance spot welding of aluminum (Al5754) to magnesium (AZ31B) alloys results in the formation of a variety of solidification microstructures and intermetallic compounds that may affect the in-service performance of the weld. This study evaluates the relationship between the welding parameters and the properties of the weld nugget that is formed, and clarifies the morphological and microstructural evolutions within the weld regions during the low-current “small-scale” resistance spot welding of Al5754 to AZ31B. The investigations included a combination of microstructural characterization and thermodynamic analysis of the weld region. The results show that the welding time and clamping force parameters have significant effects on the properties of the nugget formed. The optimal welding parameters were found to be 300 ms welding time and 800 N clamping force. Weld nuggets formed with lower welding time and clamping force were undersized and contained extensive porosity. Meanwhile, a clamping force above 800 N caused gross deformation of the test samples and the expulsion of the molten metal during the welding process. The most significant microstructural changes occurred at the weld/base metal interfaces due to the formation of Al17Mg12 and MgAl2O4 intermetallic compounds as well as significant compositional variation across the weld pool. The thermal gradient across the weld pool facilitated the formation of several microstructural transitions between equiaxed and columnar dendrites.

1. Introduction

The dissimilar joining of advanced alloys and composites to form hybrid structures has become desirable as a way of reducing energy consumption and improving fuel efficiency when designing engineering systems [1,2]. Two of the lightest structural materials available for the design and construction of engineering components are aluminum (Al) and magnesium (Mg). Although the use of light-weight alloys (Al and Mg) is economically advantageous, Liu et al. [3] in their review of techniques available for joining aluminum alloys to magnesium alloys suggested that the absence of suitable technology for dissimilar joining of Al to Mg has limited the use of these alloys. Liu and Ren [4] also showed that the available techniques that have been studied—which include adhesive bonding, mechanical fastening, fusion welding, or solid-state processes such as diffusion bonding or friction stir welding—have not been effective.
Kah et al. [5] investigated techniques for joining dissimilar materials and found that the primary limitation of adhesive bonding and mechanical fastening are that the joint strength is limited to the strength of the adhesive or fastener used to join the materials. However, Urbikain et al. [6] showed “nutless” bolted joints, which combine friction drilling and form tapping, and can support dissimilar joining. As demonstrated by Cooke [7], solid-state processes such as diffusion bonding are capable of joining these alloys while restricting adverse chemical reactions within the weld zone. In addition, the formation of intermetallic compounds can be controlled by the use of suitable interlayers at the weld interface. Various techniques have been used for joining dissimilar metals, such as metal inert gas welding (MIG) or tungsten inert gas welding (TIG), Shahid et al. [8] demonstrated that the primary limitation encountered during the fusion welding process is the formation of intermetallic compounds within the weld zone, which compromises the strength of the weld. These compounds form because of high welding temperatures causing heterogeneous compositional variations across the weld region, which lead to the precipitation of intermetallic phases that decrease the joint strength. Subsequent treatment of the friction stir welded joints have shown potential to improve the mechanical properties of the welds [9]. Friction stir spot welding has also shown progress in joining Al to Mg alloys, as found by [10] and [11].
In an article by Kumar et al., [12] the author reviewed the application of magnesium and its alloys in the automotive industry and indicated that the primary technique used for joining these alloys is resistance spot welding (RSW). During the resistance spot welding process, the weld nugget is formed when the materials are melted by the heat obtained from the resistance of the material to electric current. There are significant challenges to joining aluminum to magnesium, such as the presence of surface oxides, which necessitates the use of a high welding current in the range of 14 to 20 kVA. The high contact resistance can also lead to the rapid erosion of the electrode tips that are used in the RSW welding process, as indicated by Thakur and Nandedkar [13], who optimized the parameters of the resistance spot welding process using Taguchi orthogonal array. The different thermochemical properties of Al and Mg can lead to the formation of unwanted intermetallic compounds and galvanic corrosion. However, the scientific literature suggests that if the process parameters are optimized, the volume of intermetallic compounds formed during welding can be reduced. On the other hand, corrosion can be controlled by painting or coating while still achieving significant weight reduction. Webber et al. [14] demonstrated factors that have been shown to affect the weld microstructure, including the welding temperature, solid/liquid interface growth rate, and cooling rate. Therefore, suitable optimization of these factors may lead to significant improvements in the performance of the weld [15,16].
Sun et al. [17] studied the mechanical properties of resistance spot welds formed between aluminum and magnesium with an Sn-coated steel interlayer. The results showed that when that Sn-coated steel interlayer was used, the formation of Al–Mg intermetallic compounds was prevented, and the mechanical performance of the weld improves. The microstructural variations within the weld region are critical to the chemical and mechanical properties of the weld given the likelihood for the formation of intermetallic compounds such as Al12Mg17 and Al3Mg2. While several studies have been dedicated to the characterization of the solidification microstructures in the fusion welding of similar metals, only limited literature exists on the characterization of the properties developed during dissimilar resistance spot welding of aluminum and magnesium. A suitable correlation has not been made between the welding parameters and the formation of nugget microstructures during the small-scale resistance spot welding process in which the welding current cannot be adjusted. These systems are typically used in job shops.
This study evaluates the influence of welding parameters on nugget formation during low-current resistance spot welding. The optimized weld nugget was characterized for its composition, morphology, microstructure, and solidification sequence. The solidification parameters—Gibbs energy of formation, Rayleigh number (Ras), and Marangoni (Ma)—were also calculated. The mechanical properties of the weld nugget were evaluated using Vicker’s microhardness testing. Finally, the mechanisms responsible for the development of the weld nugget microstructure were discussed based on the melting behavior of the base metals. This information provides interesting data that establishes parameter limits for dissimilar joining aluminum and magnesium using small-scale resistance welding, which can be used for the development of a numerical model of the resistance spot welding process.

2. Experimental Procedure

2.1. Materials

Commercially available aluminum (Al5754) and magnesium (AZ31B) alloys were used to prepare the Al–Mg couples by the resistance spot welding process. The chemical composition of the alloys used in this study was published previously [18].

2.2. Cold Pressing and Resistance Spot Welding

The Al and Mg samples, of dimension 20 mm × 12 mm × 1 mm, were prepared with abrasive paper from 240 to 1200 grits. Each sample was polished to 1 μm using particle-impregnated carrier paste and paraffin lubricant. Following the polishing process, each sample was degreased with acetone, and then immersed in a pickling solution of 15 wt.% HNO3 and 2 wt.% HF for 2 min and subsequently rinsed with distilled water.
A Clarke CSW13T Resistance spot welding machine equipped with a dome-shaped electrode tip and a welding current of 6.3 kVA was used for the welding process. The effect of clamping force and welding times were assessed using the settings shown in Table 1.
Prior to welding, each sample pair was cold pressed using a hydraulic press to a load of 100 kN. The samples were cold pressed before welding to facilitate oxide break-up and ensure metal-to-metal contact. Oxide break-up is important to decrease contact resistance during the welding process.

2.3. Microstructural Characterization

To study the solidification microstructure of the Al–Mg weld nuggets, a Struers Accutom-5 microcutting machine was used to cut each welded sample transverse through the weld line. The samples were subsequently prepared with abrasive paper (240–1200 grit), and then polished to 1 μm using particle-impregnated carrier paste and paraffin lubricant. The polished samples were first cleaned with acetone and distilled water, and then etched by 2% HNO3 in methanol and 1% HF in distilled water. Microscopic and compositional analysis of the weld zone was performed using an Oxford Scanning Electron Microscope (SEM) equipped with energy dispersive spectroscopy (EDS).

2.4. Microhardness Measurements

Microhardness testing was performed across the fusion zone using a Leitz Vicker’s microhardness tester with a load of 0.1 kg, and a dwell time 30 s was applied during the tests.

3. Results

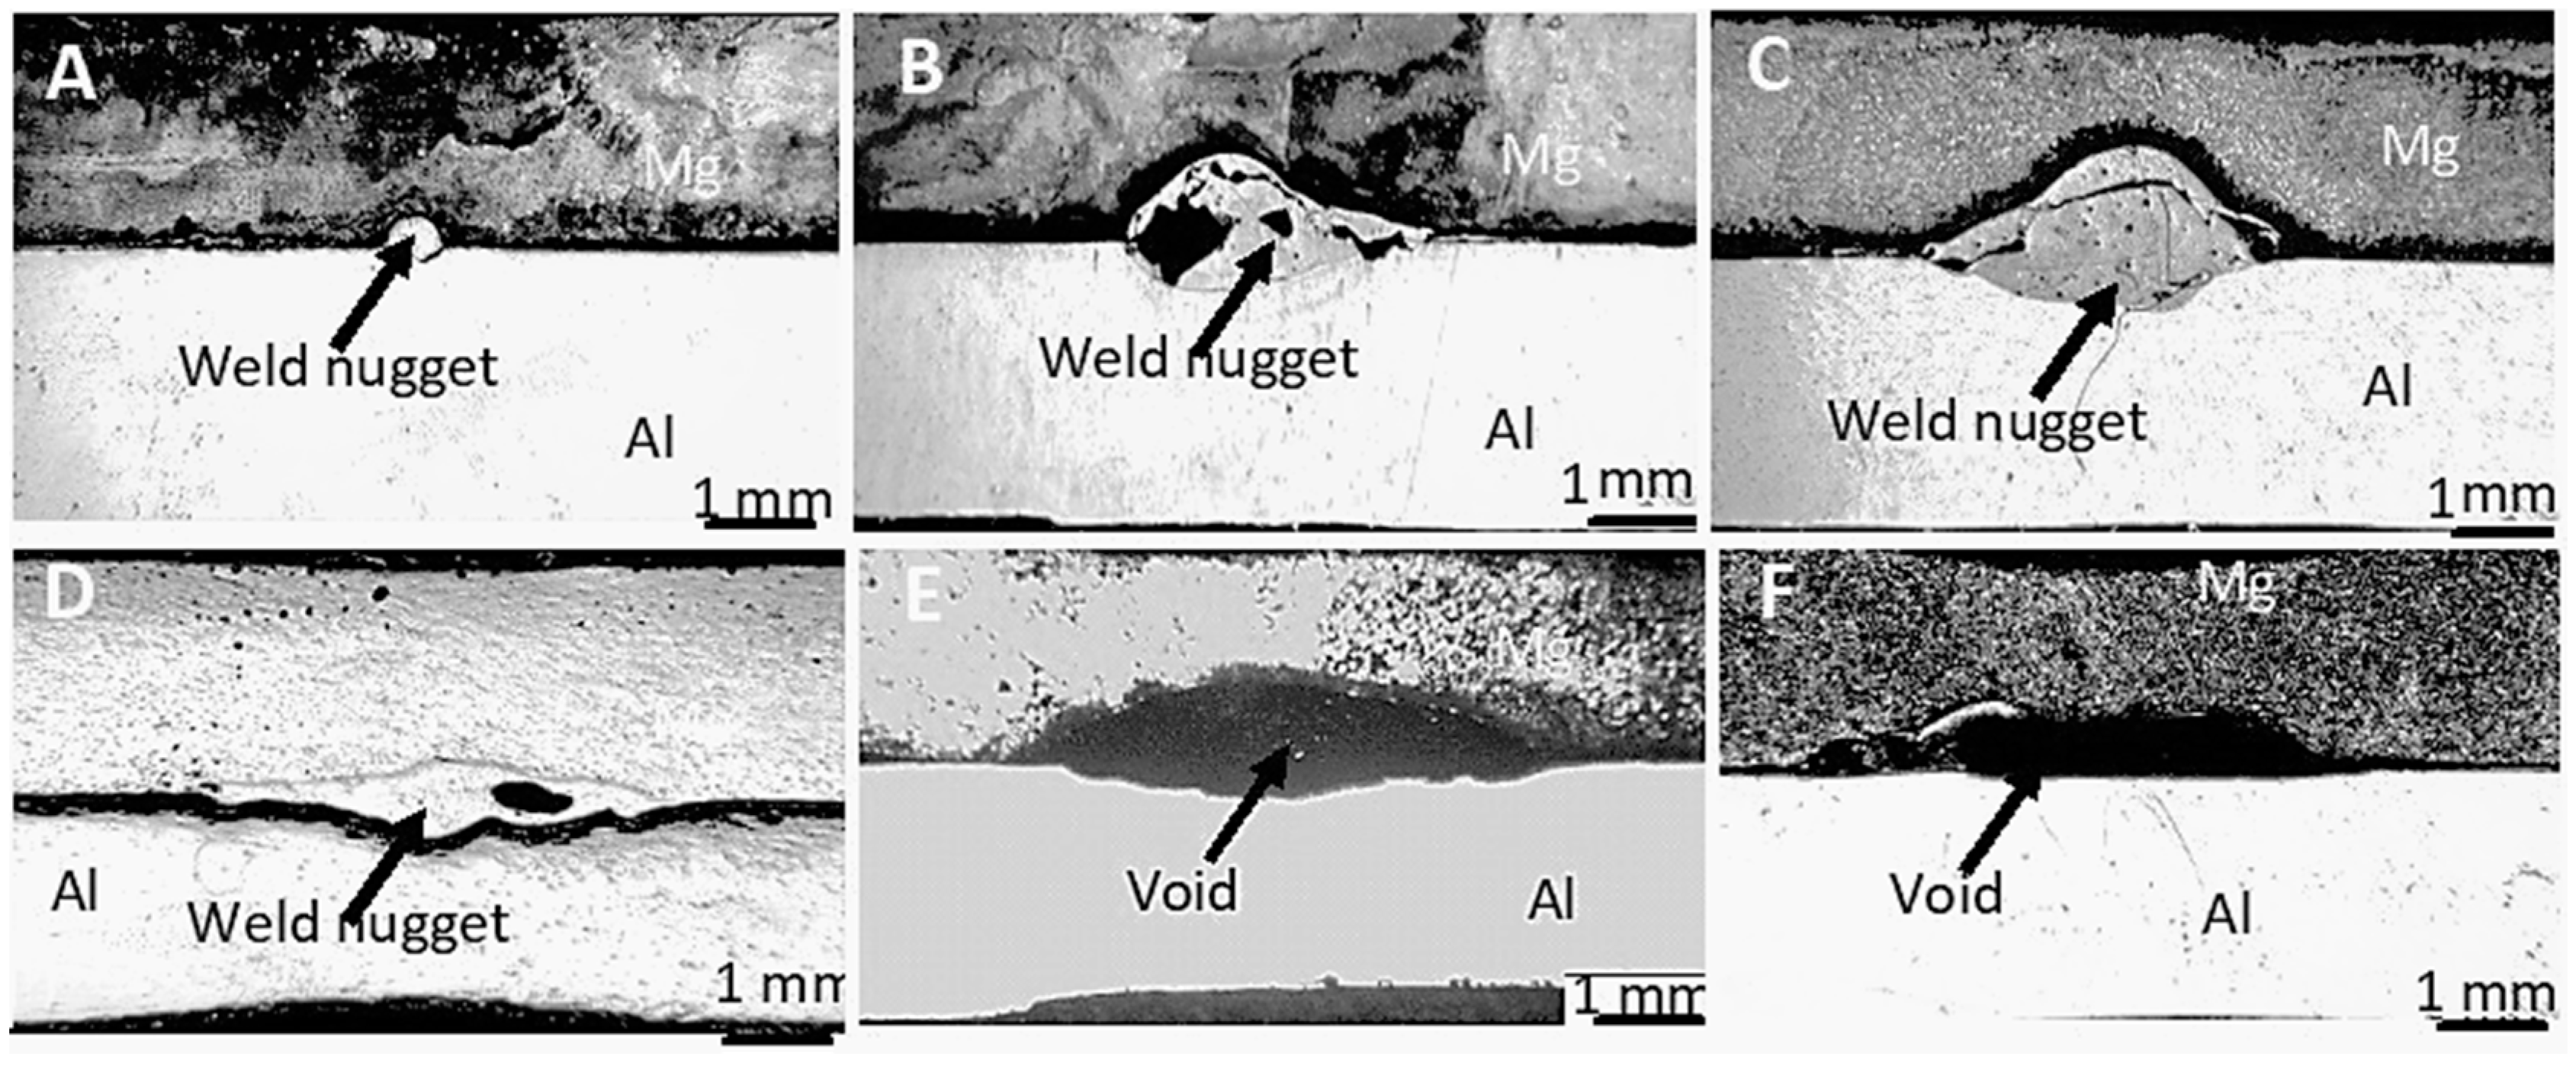
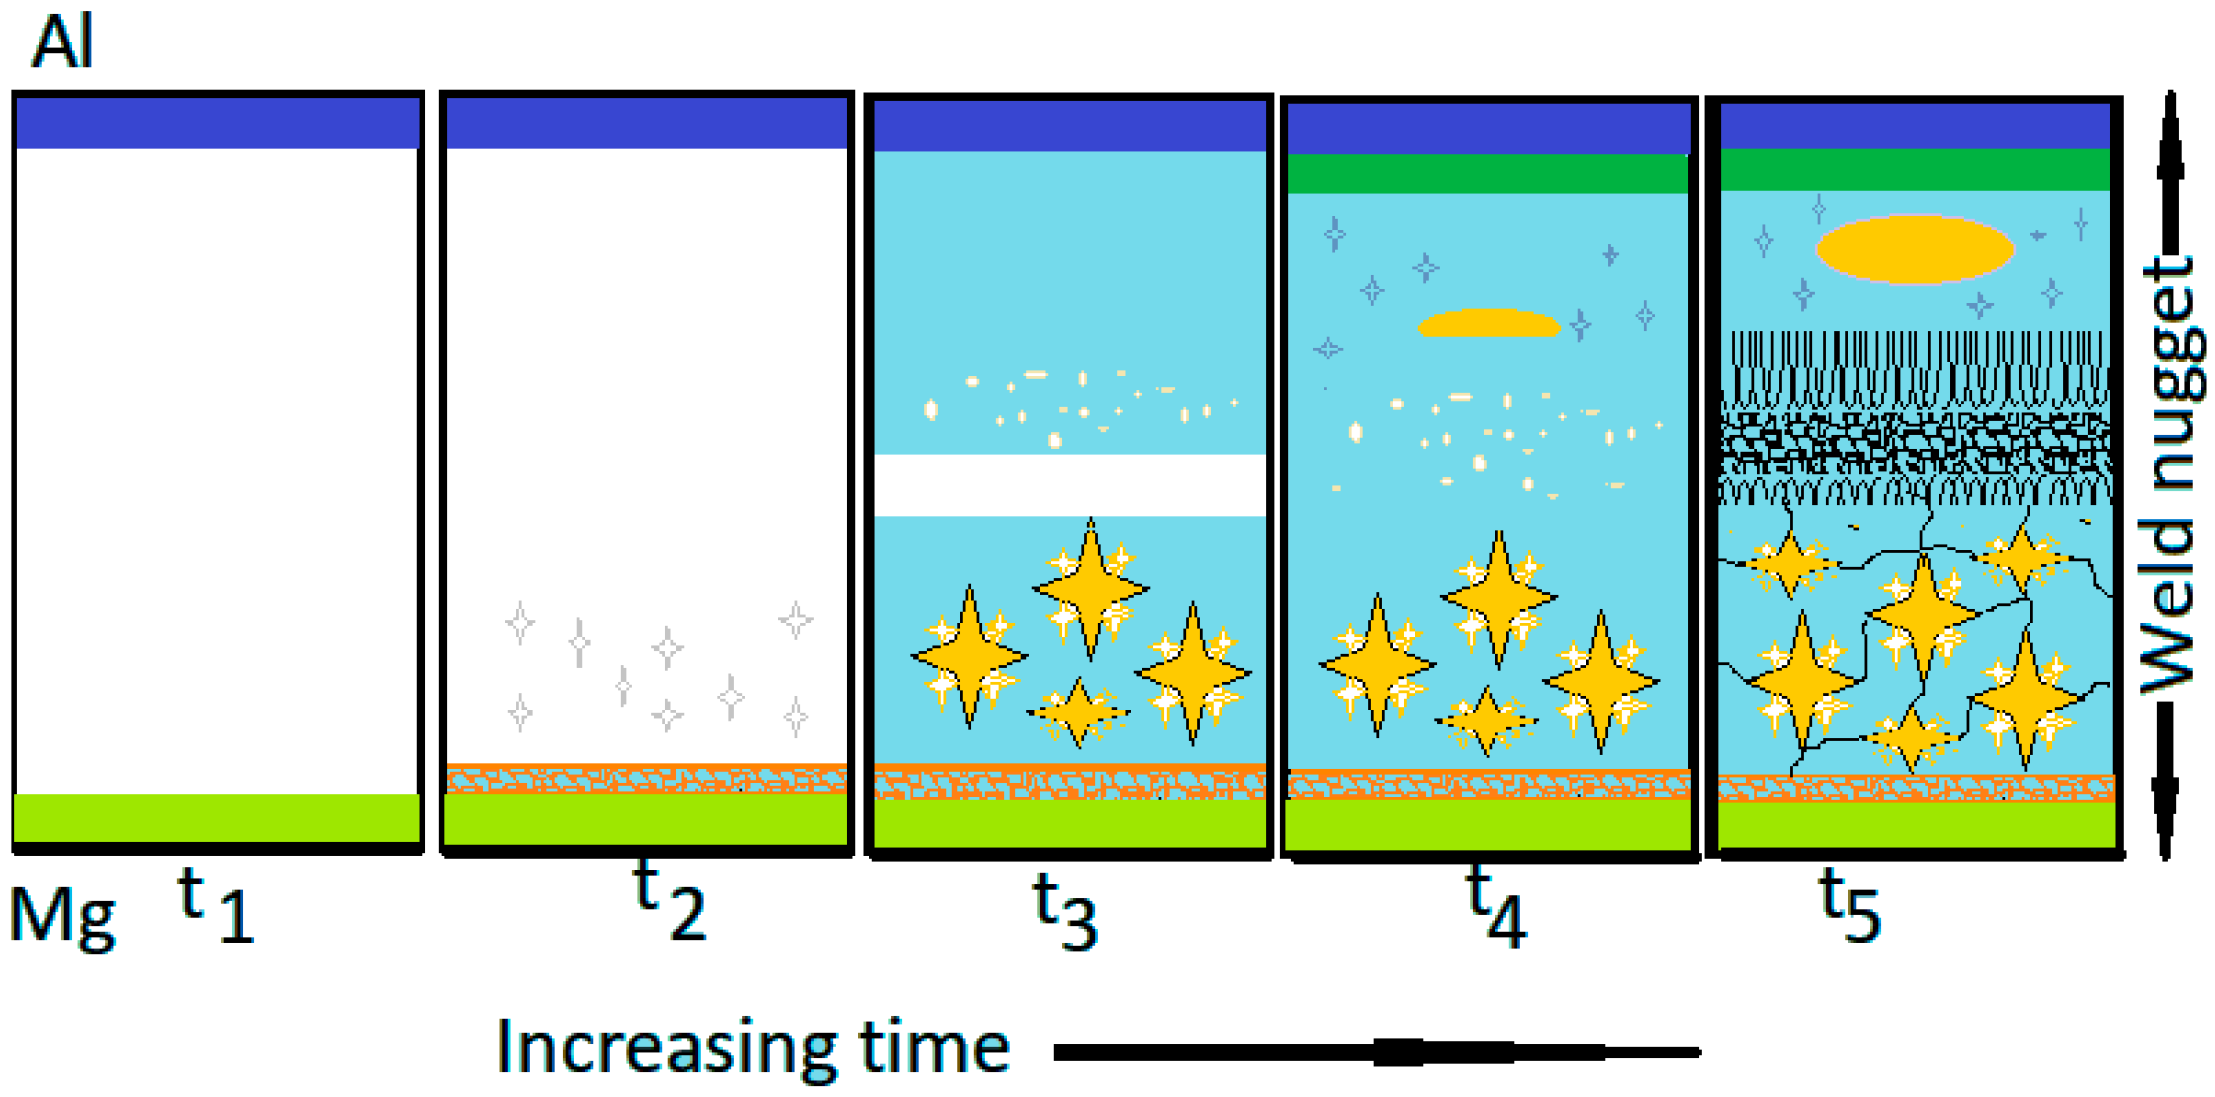
3.1. Formation of the Weld Nugget

In this study, the clamping force and welding time were varied to determine the effect of these parameters on the weld nugget diameter and the microstructure developed during resistance spot welding of Al5754 to Mg-AZ31B. Figure 1 shows the optical micrographs of weld nuggets formed as a function of welding time and clamping force. When a welding time of 100 ms was used, an irregular shaped underdeveloped nugget was formed. When the welding time was increased to 200 ms, the diameter of the weld nugget increased significantly; however, a large void and numerous microcracks were formed within the weld nugget. For a welding time of 300 ms, a marginal increase was observed in the weld nugget diameter; however, similar to the sample welded for 200 ms, several microcracks were present within the weld nugget. Similar findings were recorded when the welding time increased to 400 ms.
When the clamping force was studied (see Figure 2), the results show that for a clamping force of 600 N, the weld nugget did not penetrate sufficiently into the base metals. Further increase of the clamping force to 800 N increased the penetration of the weld nugget into the base metal. However, the results show that the molten metal was squeezed out for clamping forces above 800 N. An inverse relationship was observed between the clamping force and the penetration distance. When the clamping force was increased, it appears that the Mg-side of the sample was compressed, causing an expulsion of the molten liquid from the center of the weld and leaving voids that are expected to reduce joint performance.
Figure 2 shows a summary of the relationships between the welding parameters studied and nugget diameter and penetration. The results suggest a positive correlation between the welding time and nugget diameter; as the welding time increased, the diameter of the weld nugget also increased.
The typical microstructures of transverse sections of the weld nugget that formed during resistance spot welding are presented in Figure 3. The weld pool appears to be distorted with a larger portion of the melting occurring on the Mg-side of the sample. The weld microstructure is characterized by a thick band that outlines the weld nugget at the Mg interface toward the bottom of the weld pool. At the upper side, the Al interface is characterized by a network of cracks that appear to travel along the fusion zone within the Al fusion interface. The center of the weld zone also contained an extensive network of large cracks. The distortion of the weld pool was attributed to differences in the thermal conductivity and melting temperature of Al and Mg alloys. The lower melting temperature and thermal conductivity of the Mg alloys resulted in the localized heating and slow dissipation of heat from the Mg alloy, which consequently resulted in greater melting and widening of the weld pool on the Mg side.
The Al5754 alloy has a thermal conductivity of 147 W/m·K and electrical resistivity of 49 n Ω·m, while Mg-AZ31B has a thermal conductivity of 96 W/m·K and electrical resistivity of 92 n Ω·m. The higher conductivity of the aluminum alloy may contribute to faster heat dissipation, while the lower electrical resistivity may cause lower heat generation. Given the differences in the geometry of the melted regions for the two alloys tested, the average composition of the weld zone was estimated by calculating the area of the weld nugget protruding into each base metal and along with molar data. The composition of the nugget was calculated to be approximately Mg-67%, which falls in the two-phase region of the Al–Mg phase diagram [19]. Close examination of the fusion zone suggests that there could be localized variations in the composition across the welded region due to several regions having different microstructures within the weld zone; each phase was labeled S1 to S5. The composition of each phase was identified using EDS analyses and is presented in Table 2.

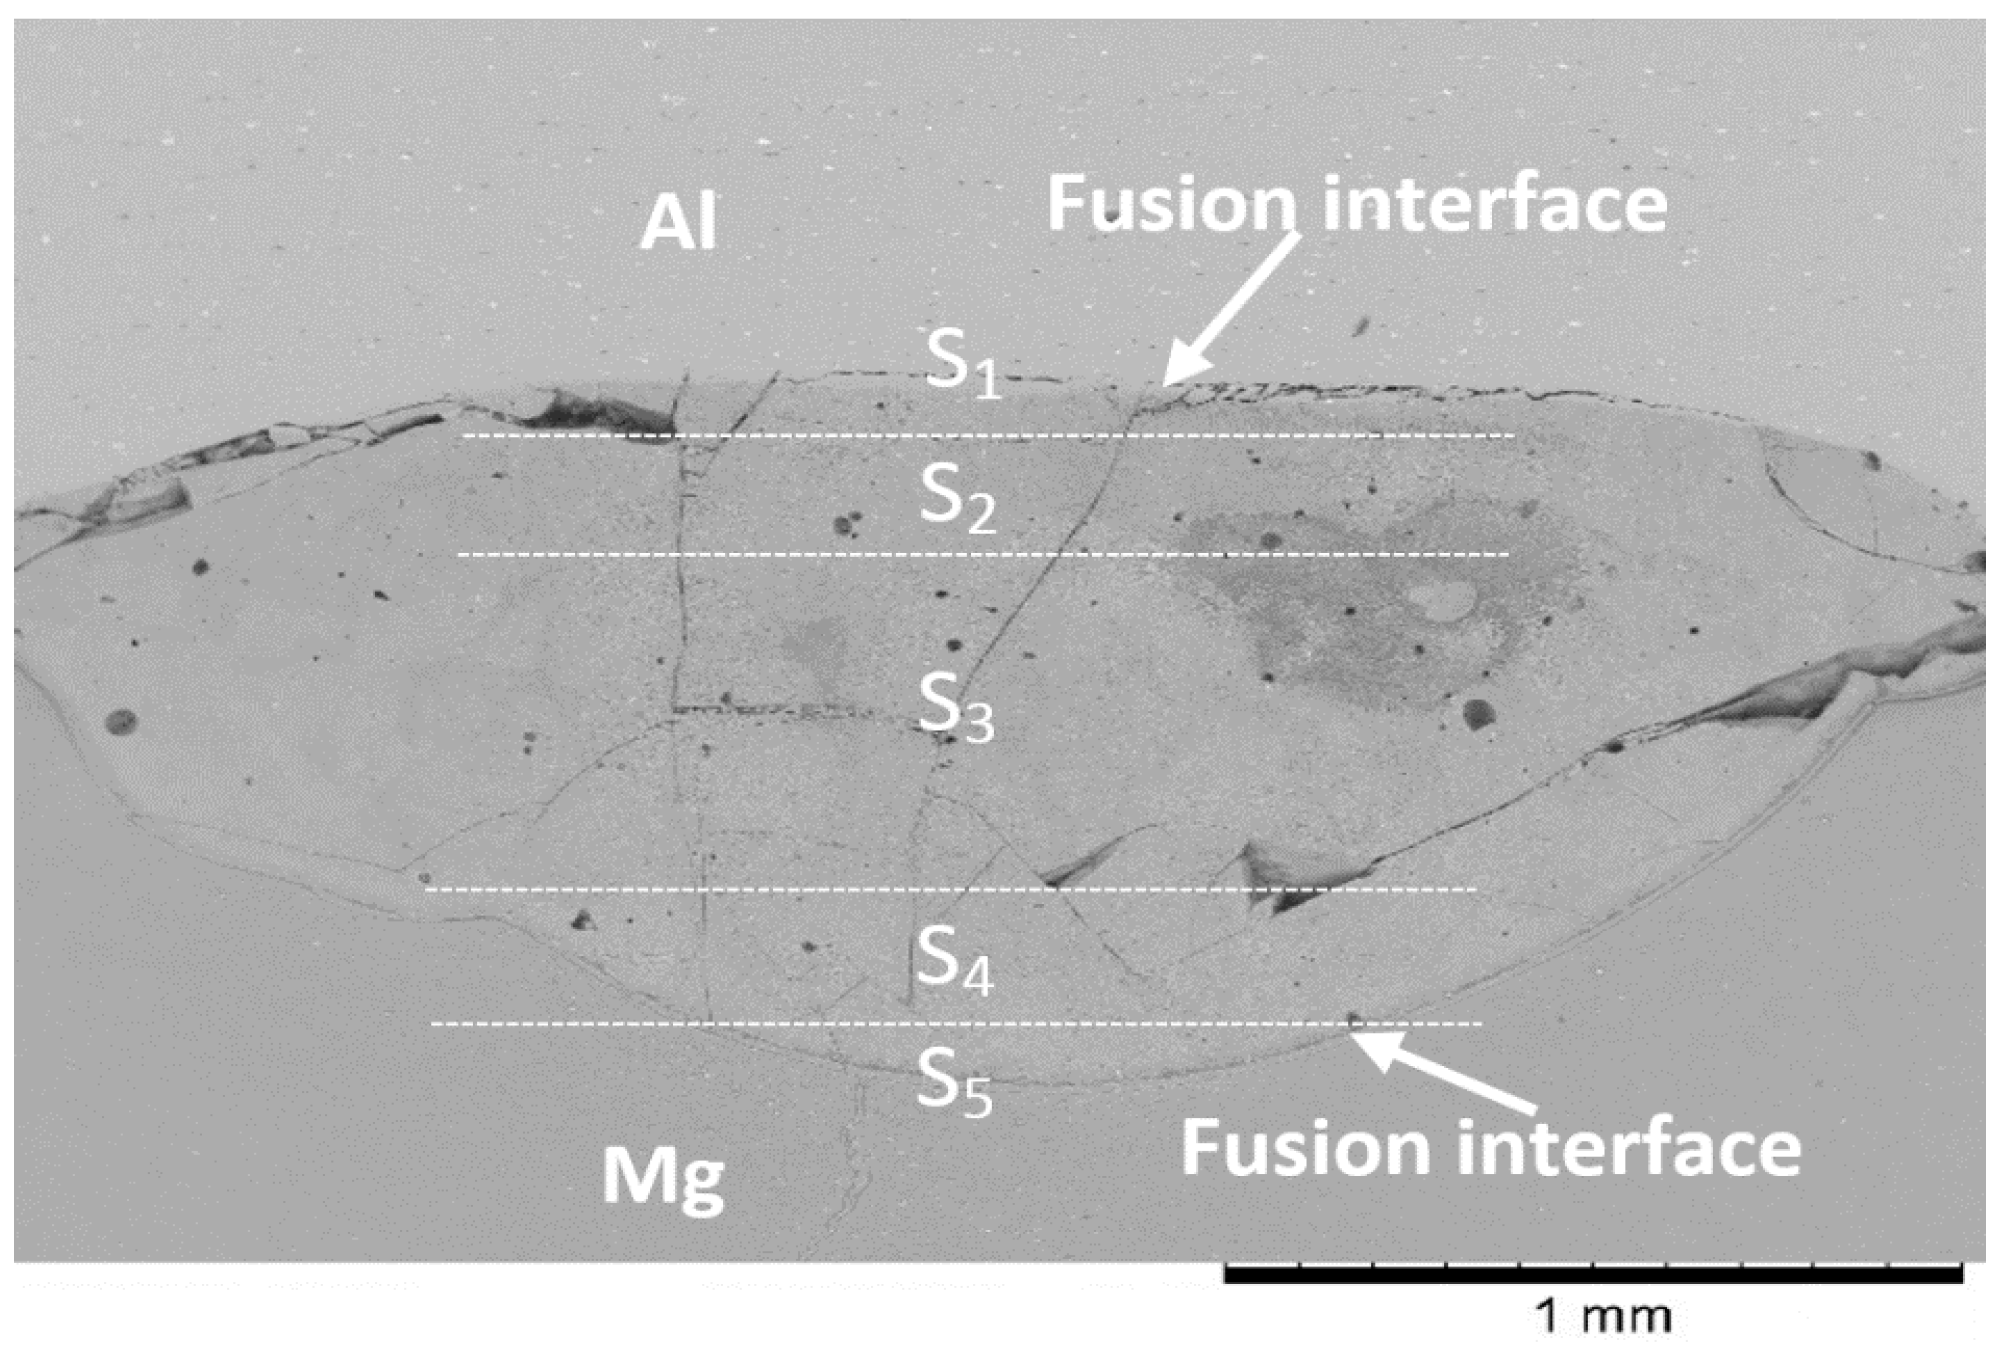
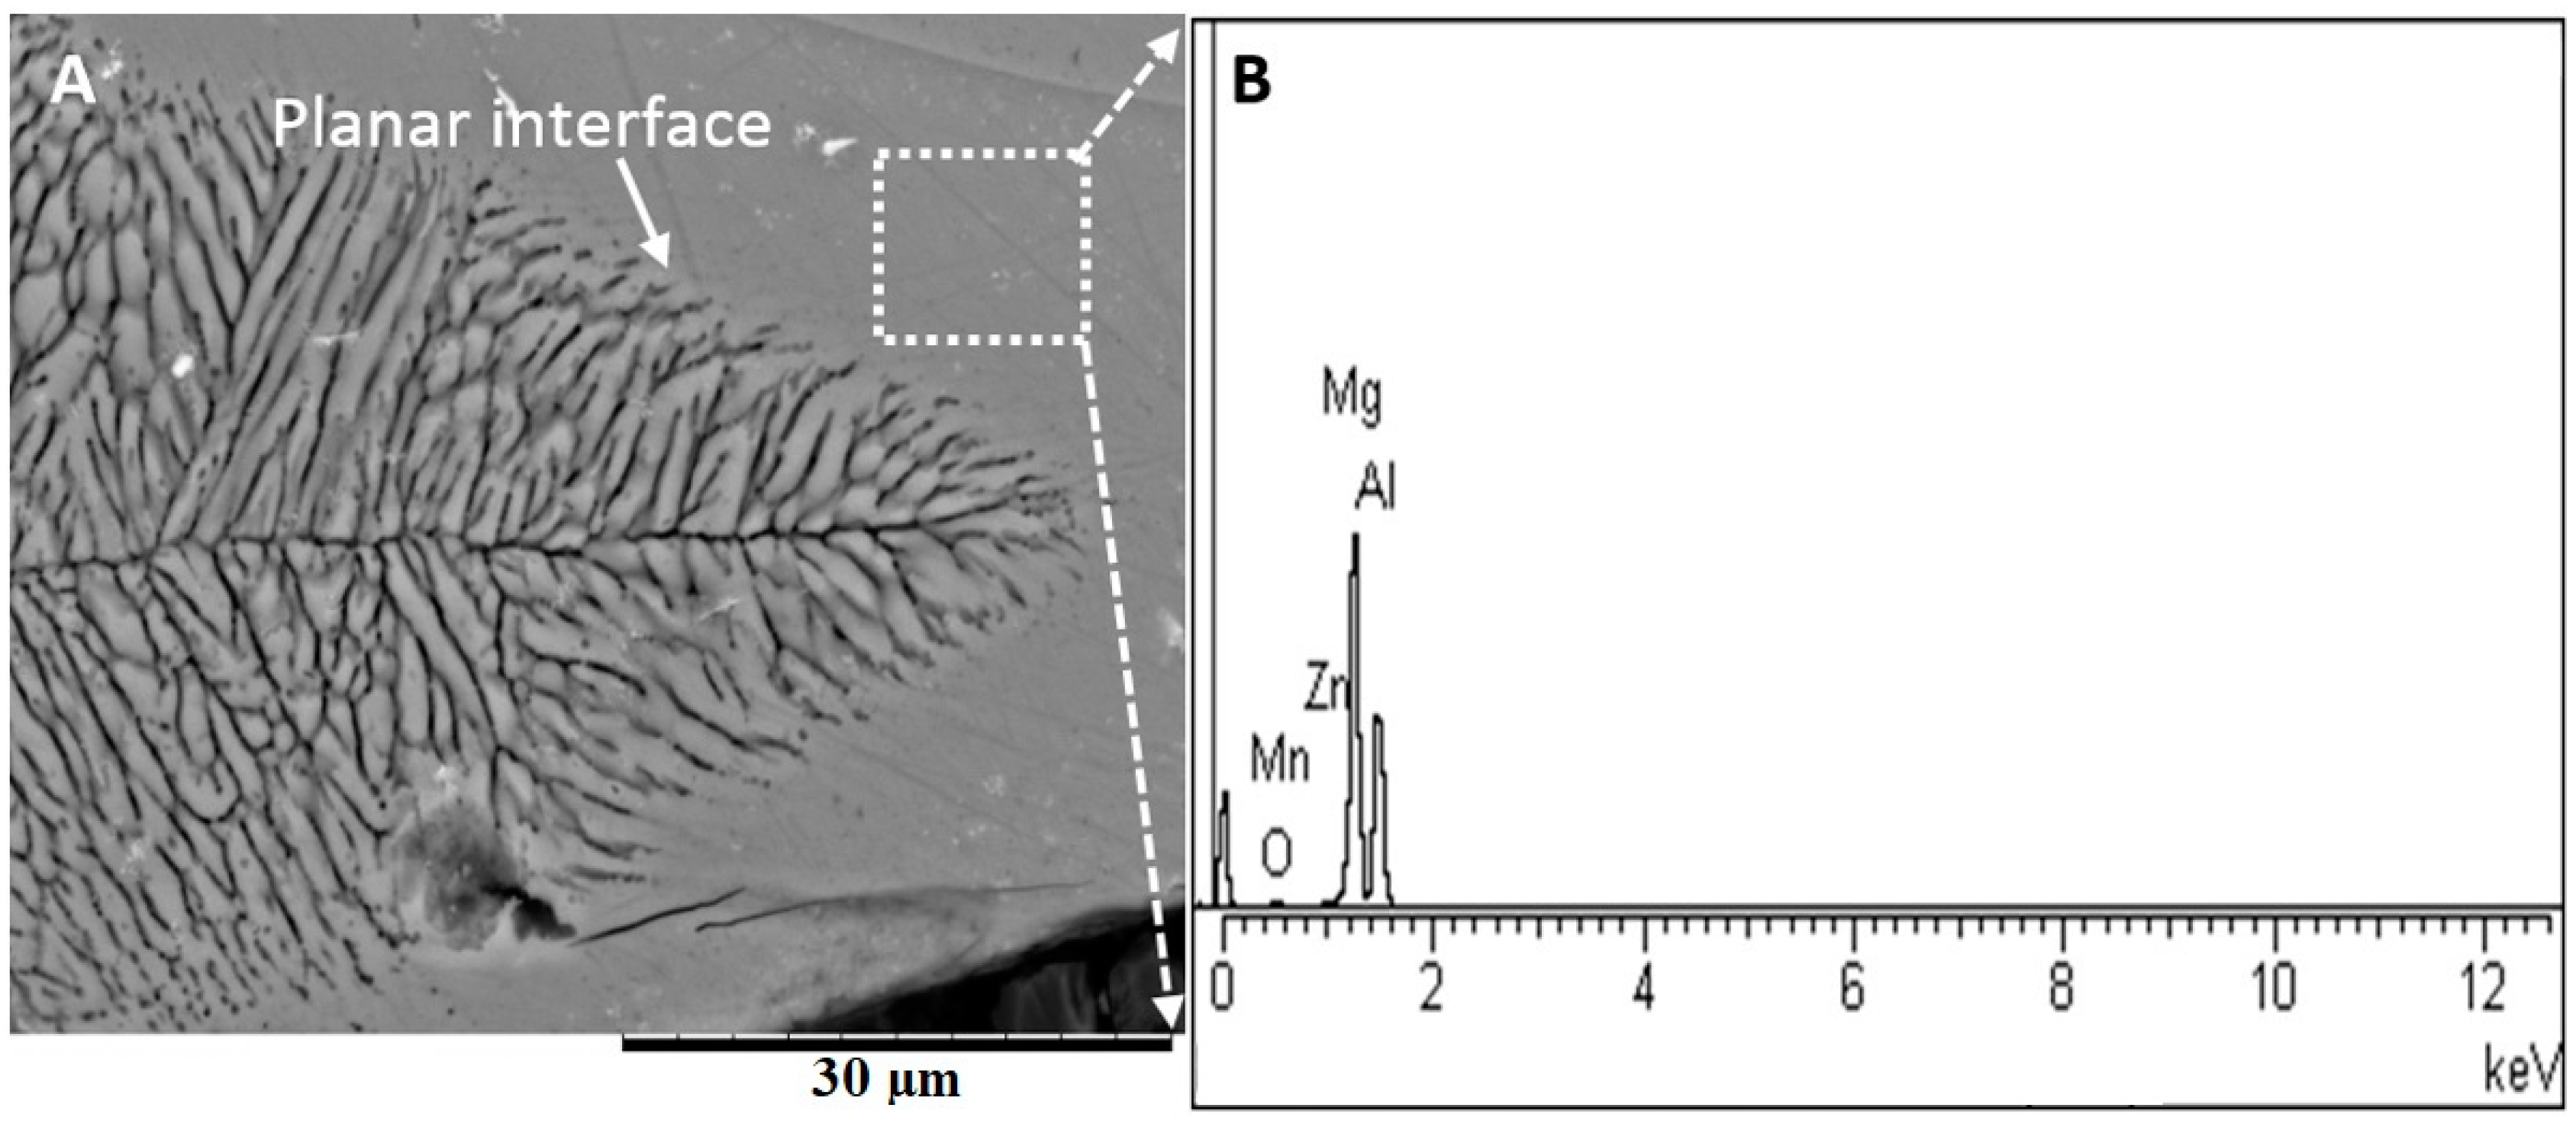
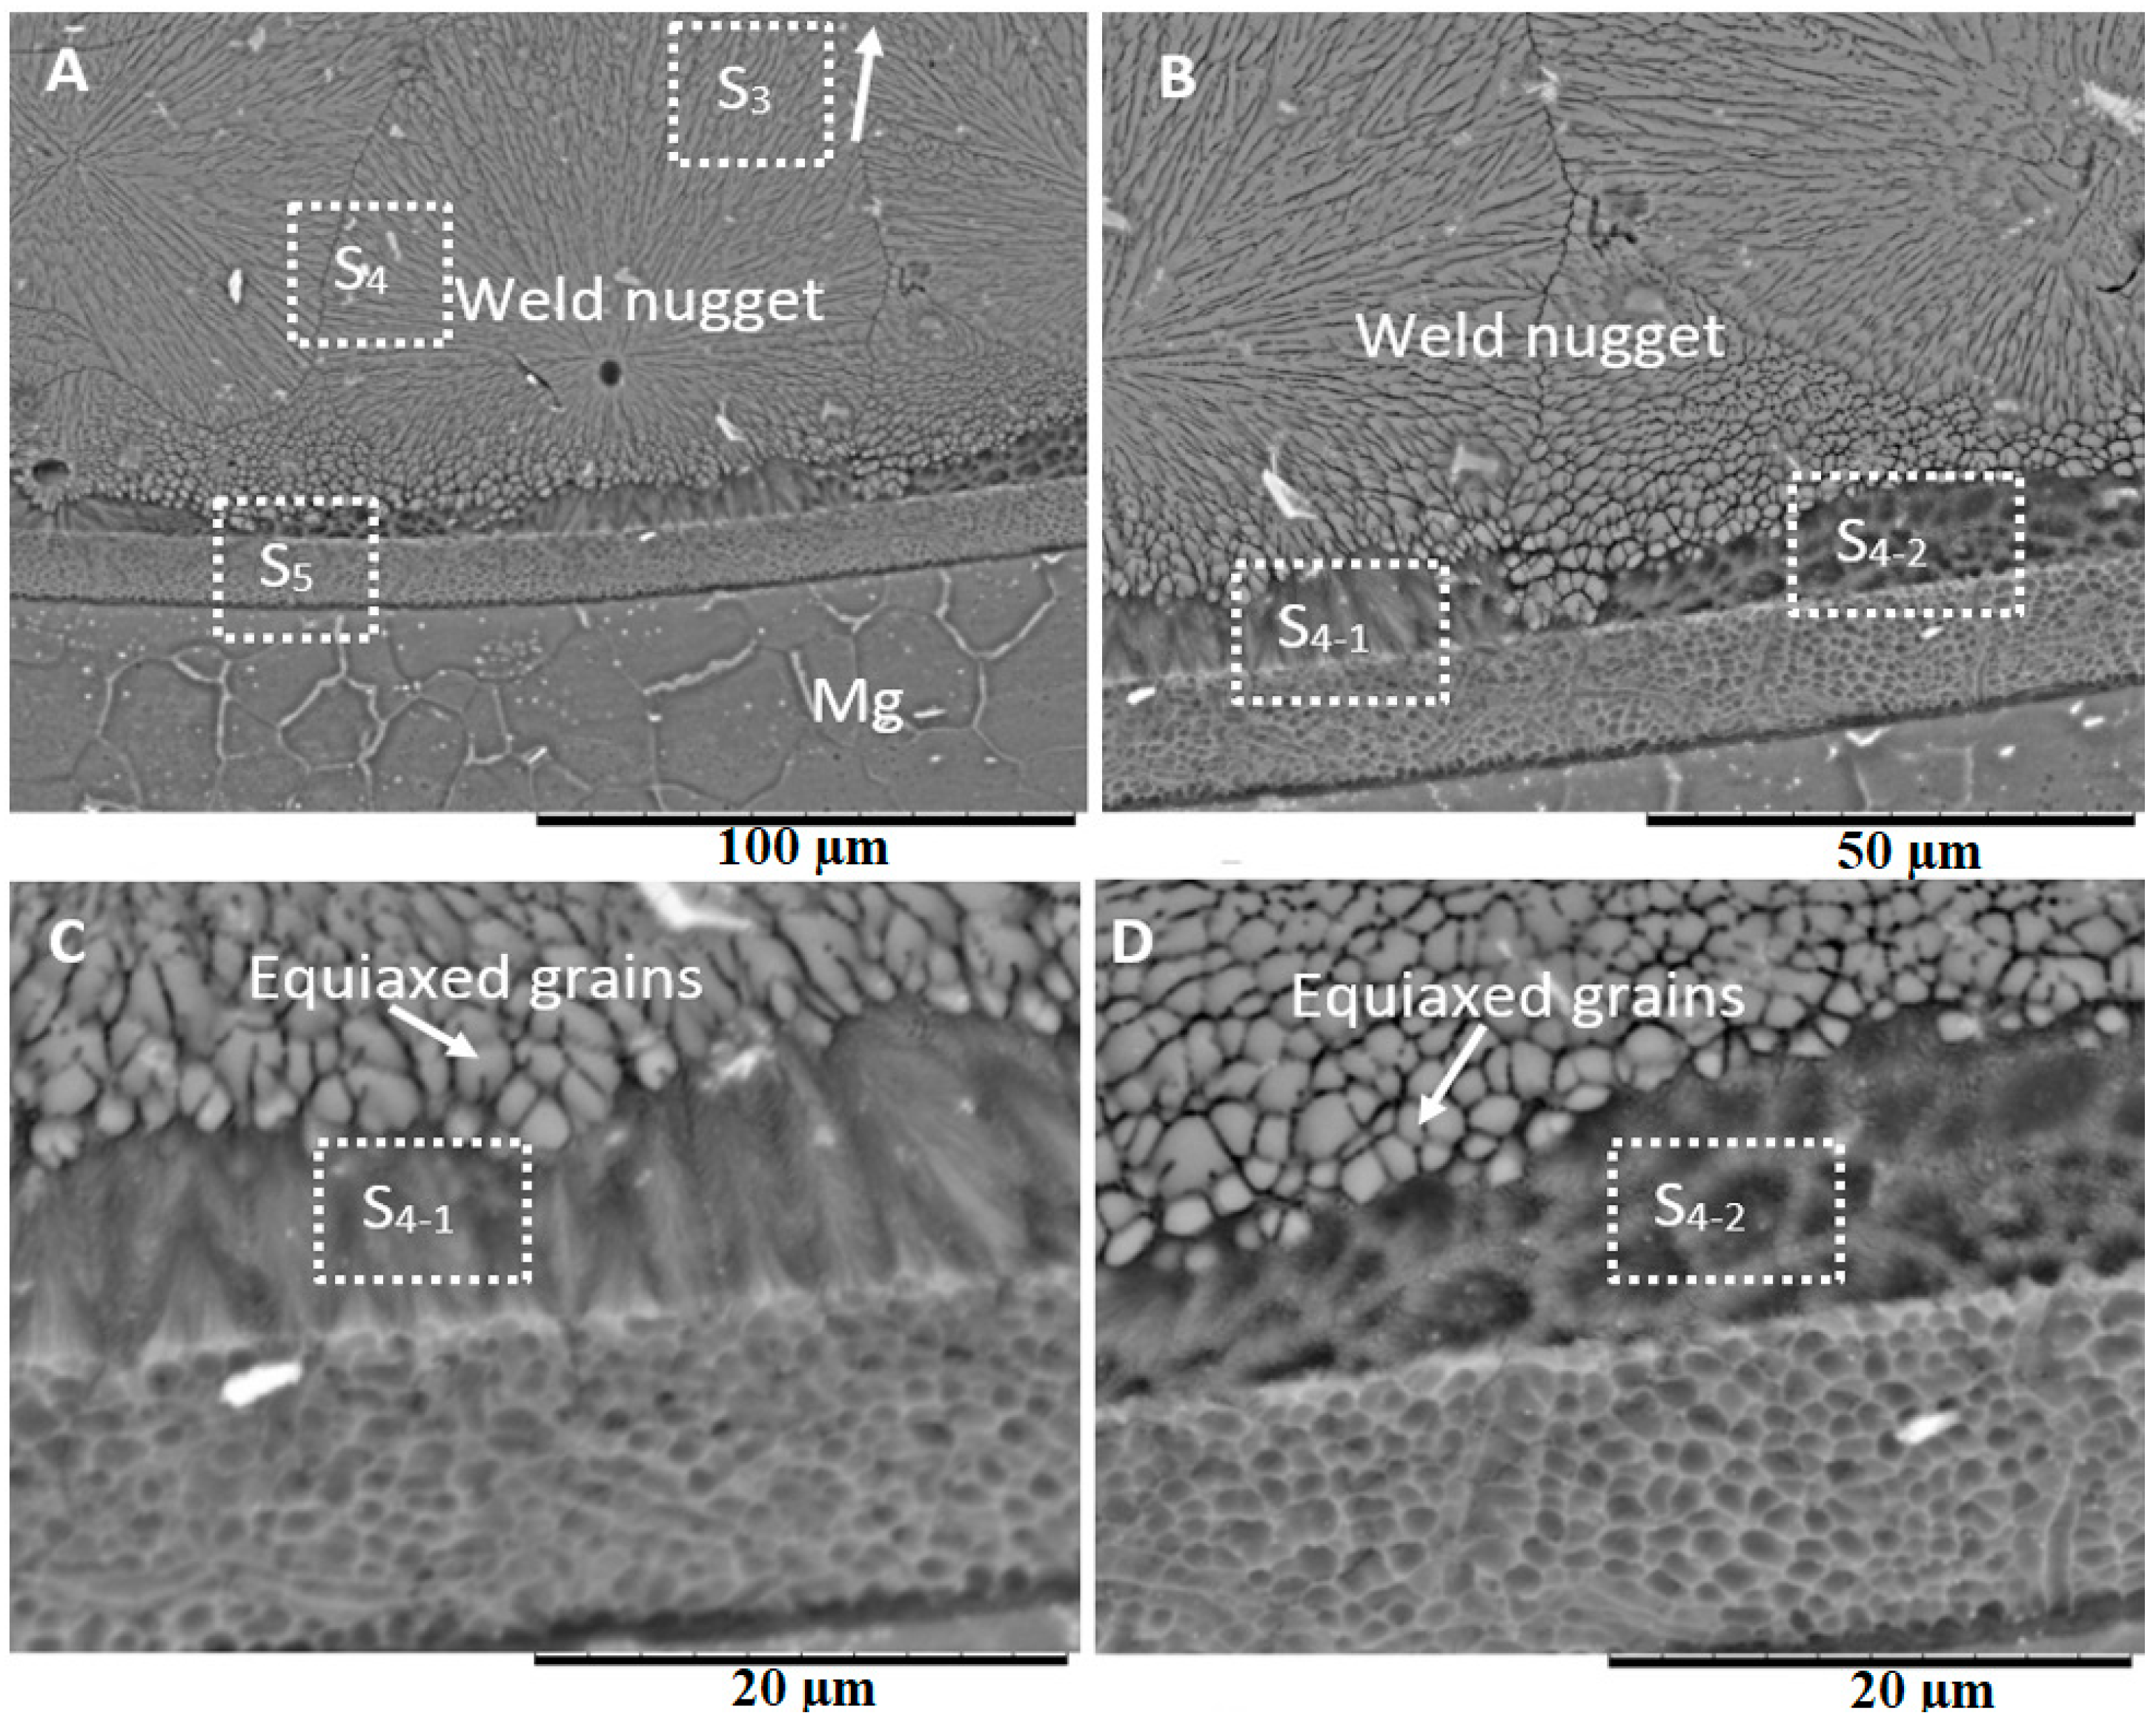
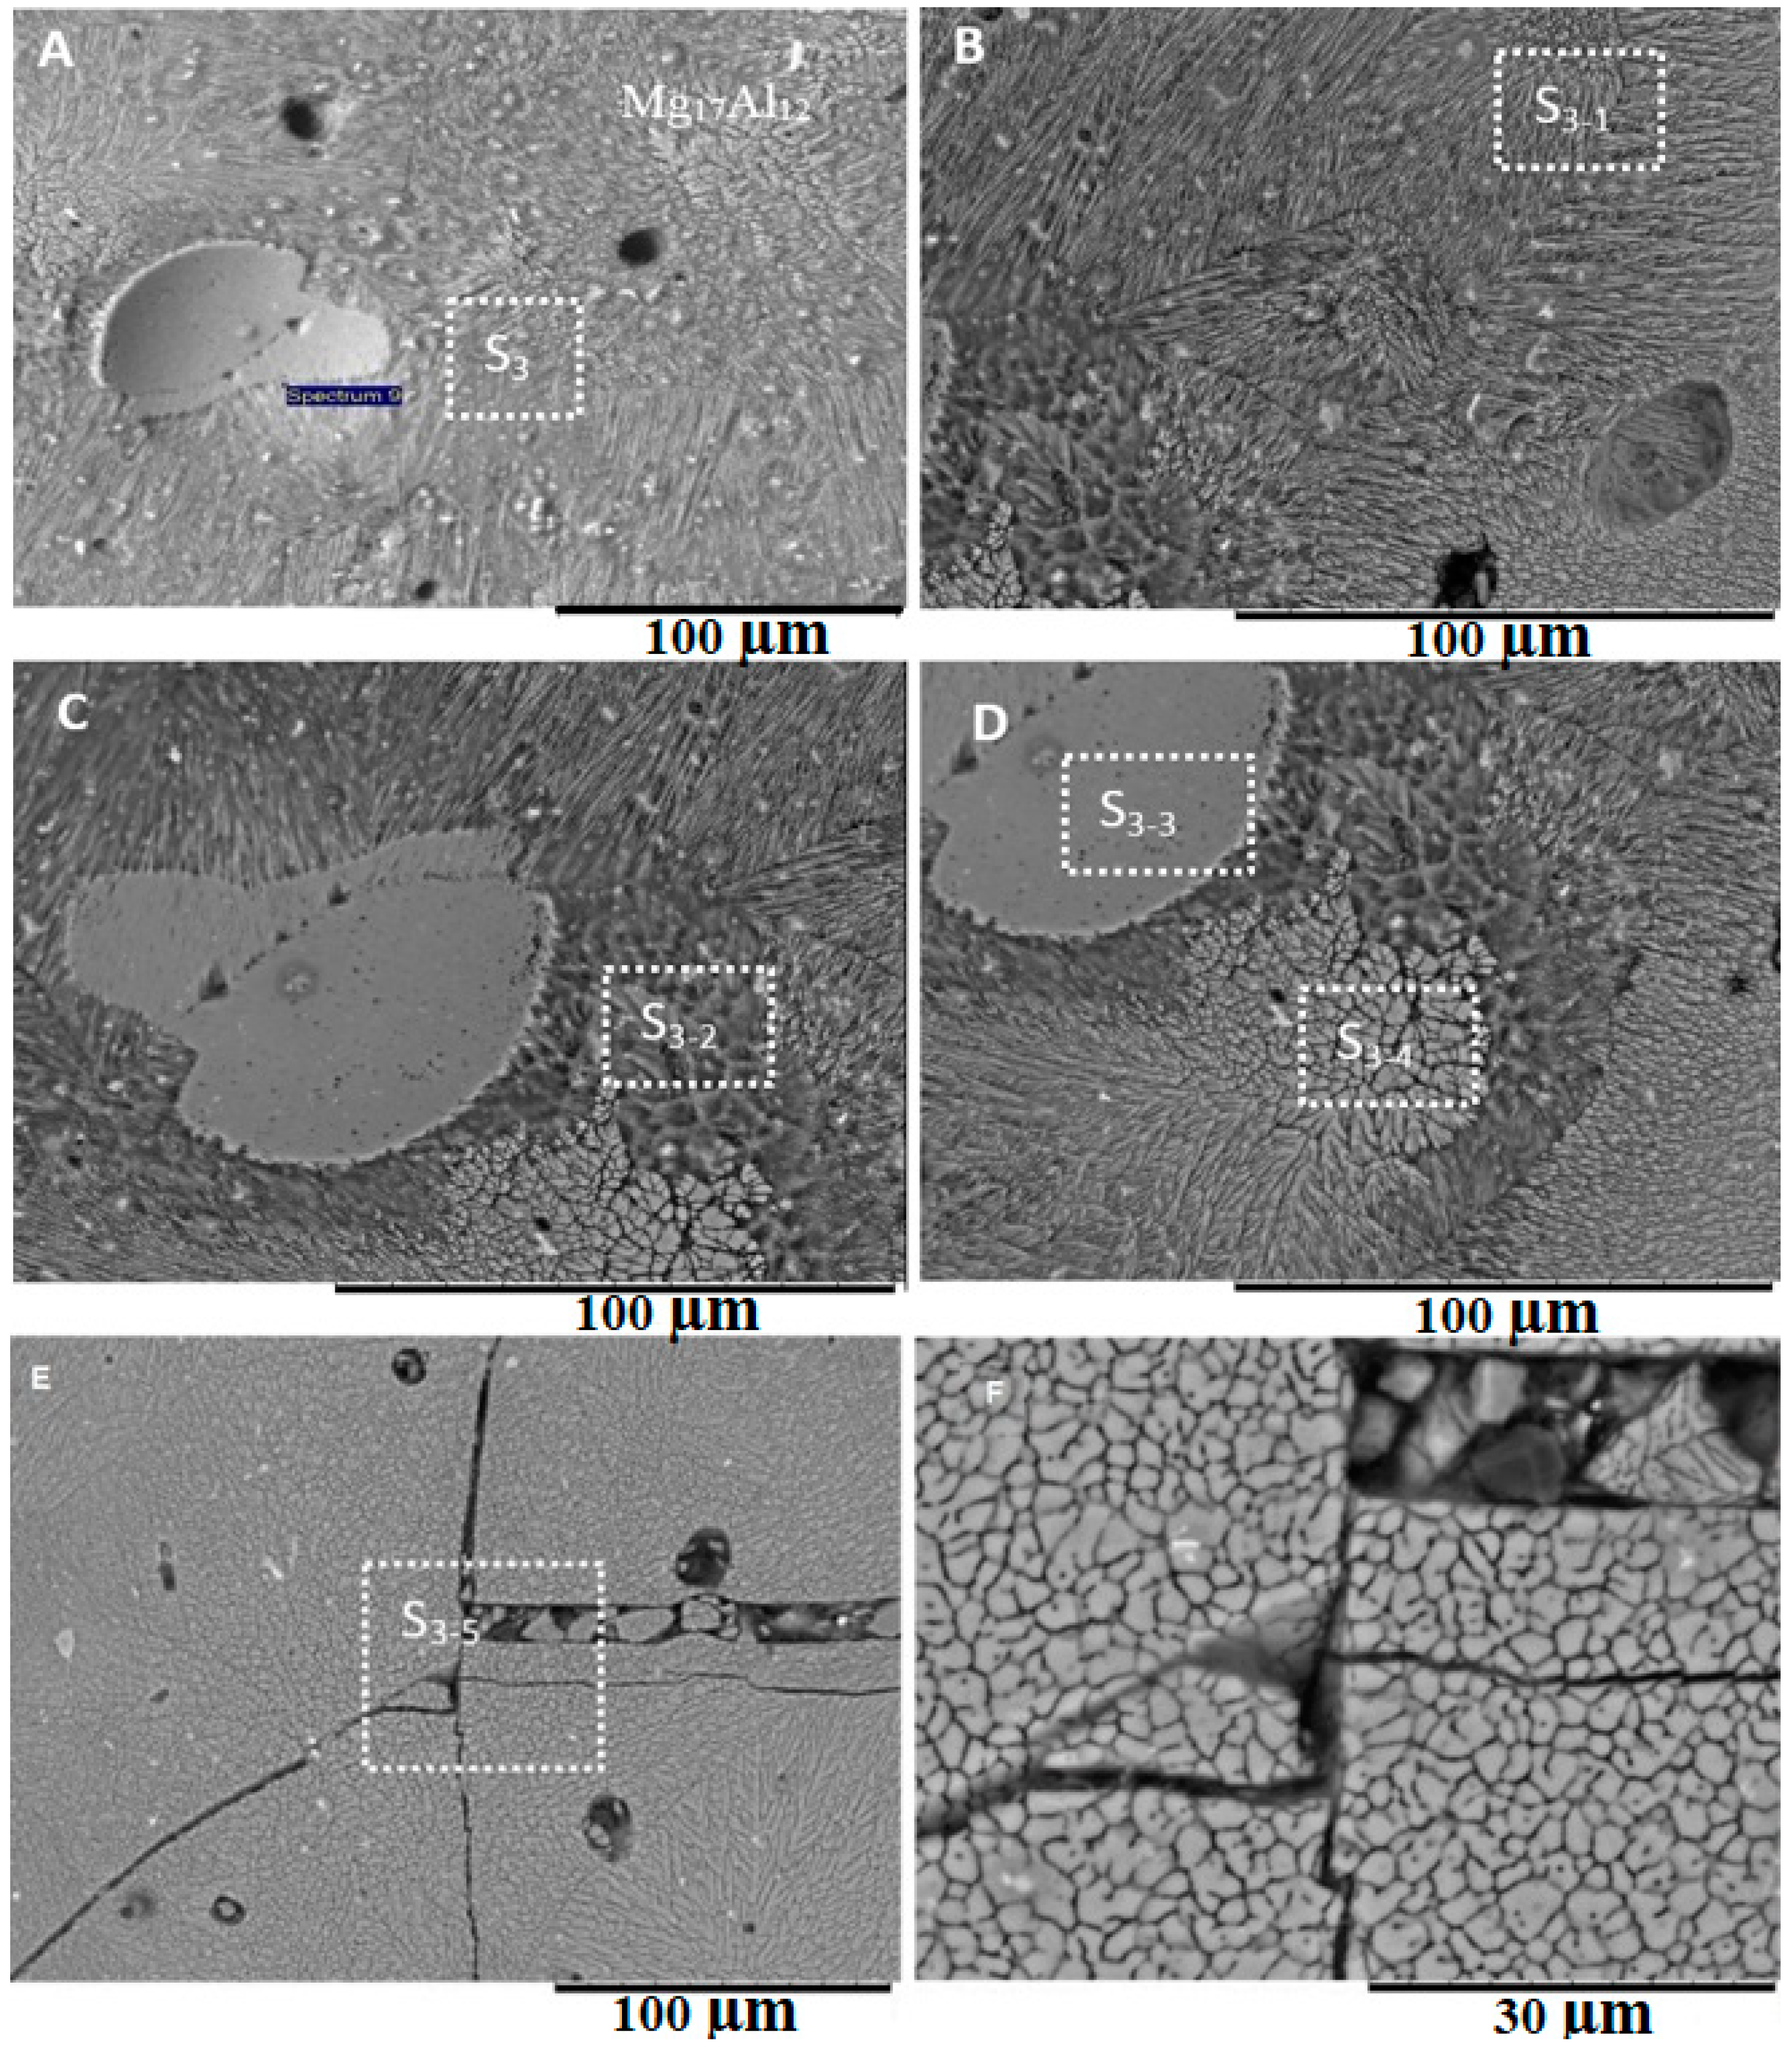
3.2. Microstructure Analysis of the Fusion Interfaces

The micrographs presented in Figure 4 shows the microscopic details at the Al interface. The distinct reaction layer labeled as S1 was evaluated by EDS and found to be approximately Al-42 at.%, Mg-58 at.%, which would fall in the two-phase region of the Al/Mg phase diagram to produce the γ-phase Mg17Al12. Extensive cracking was also observed in this phase, which suggests that the formed compound is brittle. The fine planar region is followed by long columnar grains growing toward the center of the weld pool. This region labeled as S2 had a composition of Mg-48 at.%, which likely produced the phase Mg17Al12. Figure 5 shows a planar interface with some cellular growth that changes to columnar grains, growing toward the center of the weld pool.
The fusion interface on the Mg-side (see Figure 6) is defined by a thick layer labeled as S5. The structure of this region is synonymous with a honeycomb structure, as shown in Figure 6D. The unique feature of the microstructure in the region can be seen between the S5 and the edge of the fusion zone, which appears to be a mixture of columnar dendritic arms growing toward the Mg fusion interface and equiaxed grains indicating a transition from columnar to equiaxed grains. The region labeled as S4-1 in Figure 6C shows evidence of incomplete columnar to equiaxed transition (CET). The region labeled as S4-2 (see Figure 6C,D) shows evidence of incomplete equiaxed grain formation. A magnified image of the columnar grains growing toward the Mg fusion interface is shown in Figure 7. EDS analysis of these regions showed that layer S5 had a composition of Al-18.23 at.%, Mg-33.2 at.%, O-28.44%, and C-17.48%, which is likely the Mg + MgAl2O4 phase.
Given the differences in the grain sizes and type of grains found within this region, it is believed that solidification was heterogeneously nucleated within the weld pool close to the Mg-side and propagated to the Mg interface, as evidenced by the orientation of the columnar grains. The phase formations observed at the Mg/weld nugget interface is discussed later in relation to the interrelation between the phase diagram and the diffusion induce transport phenomena within the weld pool.

3.3. Microstructure at the Center of the Weld

The microstructure at the center of the fusion zone is shown in Figure 8. The compositional analysis presented in Table 2 shows the composition of the dark gray dendrites to be 41.97 at.% Mg, Al-24.96 at.%, and O-19.30 at.%, which as predicted from the phase diagram is Al + Mg5Al8. The high oxygen content may be attributed to the oxidation of the surface of the polished sample. The phase present at the center of the weld pool was found to be Mg-54 at.% and Al-24 at.%. which is likely the Mg17Al12 intermetallic compound. The presence of equiaxed grains at the center of the weld pool suggests that this region was the last to solidify. The composition of the region labeled as S3-5 in Figure 8E was Mg-41 at.%, which is likely Mg17Al12. The dendritic arms at the center of the weld pool appeared to be finer than the one close to the Al interface, as shown in Figure 8. Additionally, an incomplete columnar to equiaxed transition region was observed at the weld center, and is labeled as S3-4, which represents the complete transition of columnar grains to fine equiaxed grains. However, large transgranular brittle fractures are observed in the center of this region (see Figure 8E,F).

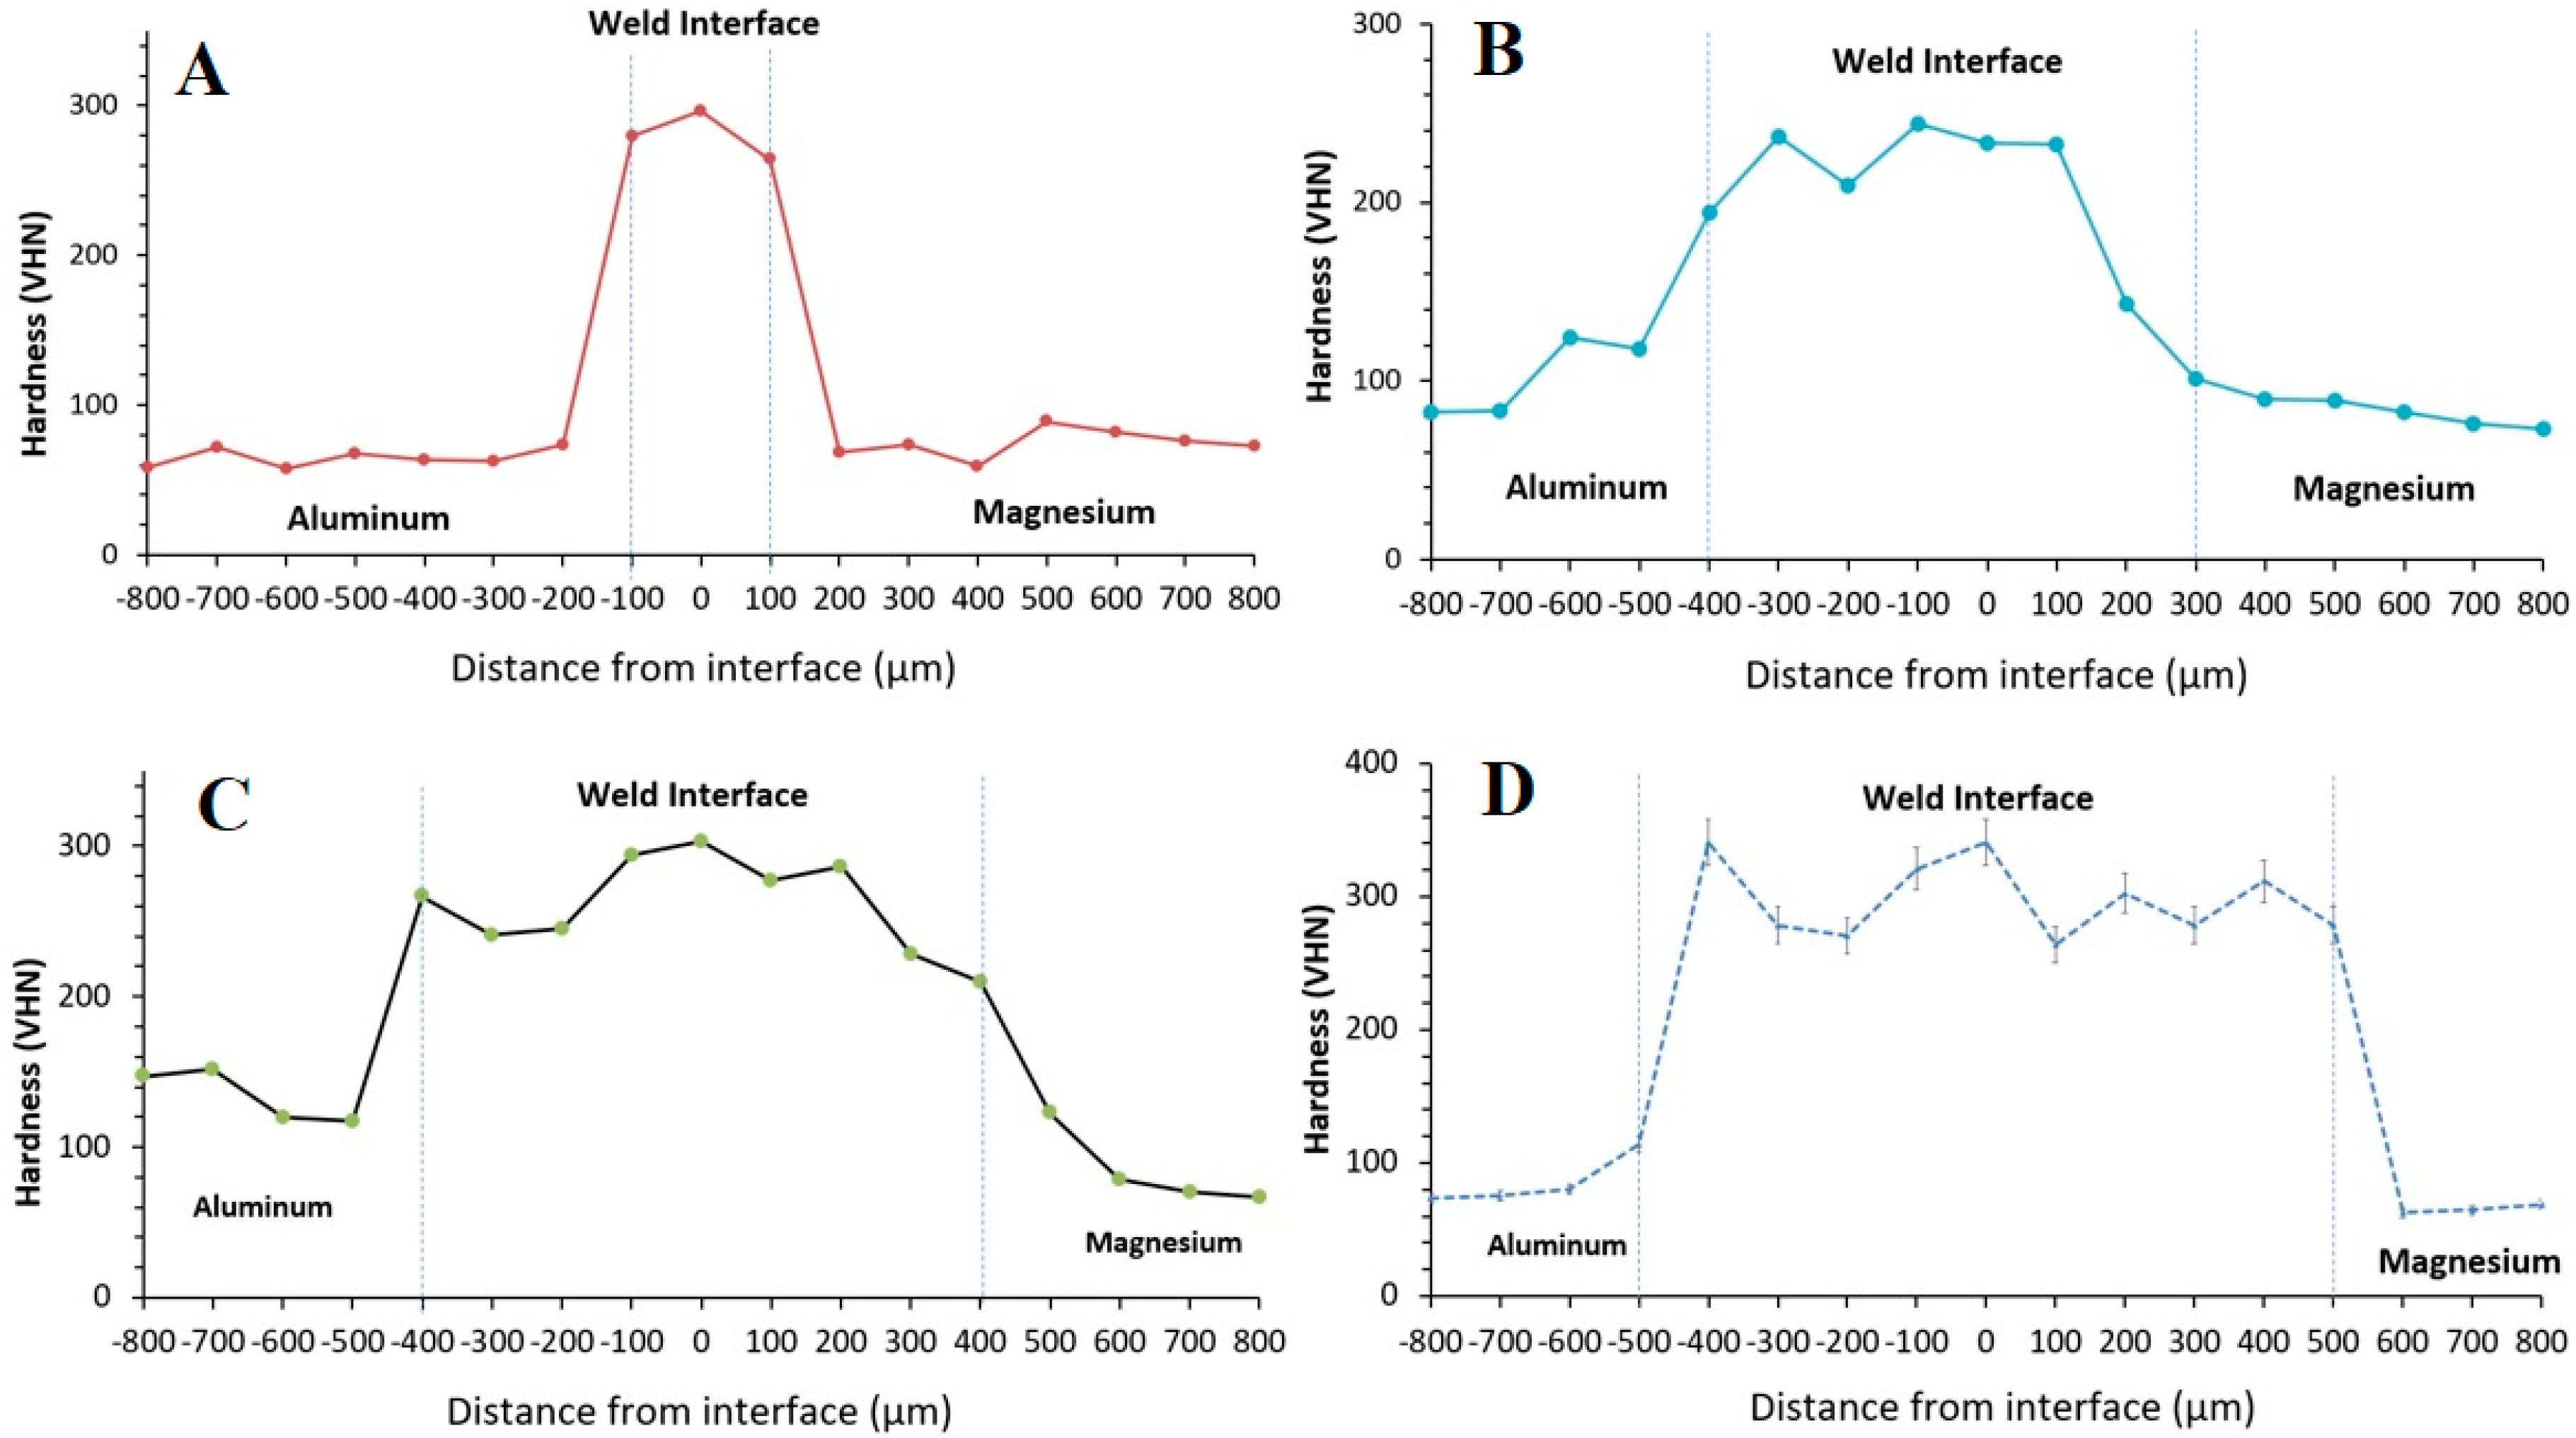
3.4. Microhardness Measurements

Vickers microhardness tests were performed across the weld nuggets, and the hardness profiles are presented in Figure 9. Analysis of the hardness profile revealed that the peak hardness occurred in the center of the weld nugget for all the tested samples. The hardness profiles confirm the variation of the hardness across the weld nugget, which corresponds to the increased penetration depth. This behavior may be ascribed to the formation of various intermetallic compounds within the weld nugget during welding. It is well established that a direct correlation exists between the hardness variation within the weld interface and the volume of intermetallic compounds formed during welding.

4. Discussion

4.1. Effect of Welding Parameters on Weld Nugget Formation

The results show that the welding time and clamping force parameters have significant effects on both the diameter and penetration depth of the weld nugget formed during the small-scale resistance spot welding of aluminum to magnesium. The impact of welding time on the weld nugget diameter and penetration depth can be characterized in terms of the amount of heat conducted into the materials during the welding process. A longer welding time allows for more heat input into the materials, which causes the nugget diameter and penetration depth of the weld to increase. Conversely, a long welding time also causes a softening of the heat-affected zone around the weld zone, which may negatively affect the mechanical performance of the weld, as shown by Zhou et al. [20].
During the low-current resistance welding of aluminum to magnesium conducted in this study, the data showed that increasing the clamping force resulted in an increase of the nugget diameter and a reduction in the penetration depth of the weld nugget due to deformation of the magnesium sample and elongation of the weld nugget, as well as significant expulsion of the molten metal from within the weld nugget. This finding contradicts existing research which shows that as the clamping force increases, the contact resistance decreases, and this limits melting and retards nugget growth [21]. However, it should be noted that these studies typically used clamping force in the 4 to 10 kN range, which has the capability of reducing the height of the surface asperities, and decreases contact resistance. However, in small-scale resistance spot welding, this phenomenon is not observed, since the clamping force is in the range of 0.6 to 1.2 kN. Additionally, expulsion of the molten metal from within the weld nugget may not be due only to an increase in the clamping force, but also an explosion that has been shown to be a characteristic of overwelding. In such instances, molten metal is expelled from the weld nugget when the internal pressure in a liquid nugget caused by melting liquid expansion exceeds the clamping force, as shown by Senkara and Zhang [22]. The use of the optimized parameters settings of 300 ms welding time and 800 N ensures adequate melting and prevents the expulsion of the molten metal during the welding process.

4.2. Weld Nugget Microstructures

Analysis of the optimized microstructure shown in Figure 3 confirms that the melting and mixing of dissimilar metals during welding leads to the formation of several phases within the weld nugget upon solidification. The solidification process occurring within a dissimilar resistance weld is analogous to the solidification observed in metal casting. These systems experience significant heat loss through the walls of the container, which leads to the formation of a chill cast region close to the walls of the container; this region is often characterized by small grain sizes. As solidification progresses, dendritic growth within the liquid accelerates the formation of columnar grains growing toward the center of the weld pool. As the temperature of the sample decreases, equiaxed grains are nucleated within the center of the weld pool. Dissimilar resistance spot welding can be compared to metal casting, since the weld pool is enclosed by two metal plates, which control the heat loss/cooling rate. A controlling factor in the cooling rate is the heat transfer coefficient of the metals being joined. Given the differences in the heat transfer capabilities of Mg and Al, it is expected that heat transfers through the Al sample will be greater, which suggests that solidification will be initiated at the aluminum interface and progress across the weld pool toward the Mg fusion interface. The results show that Mg17Al12 dendrites at the Al interface grow toward the weld pool opposite to the heat extraction direction (see Figure 4). These results are in keeping with conventional knowledge, which shows that solidification progressed in a direction opposite to that of heat removal.
The middle of the weld pool is labeled as S3 in Figure 10. Within this region, two types of microstructure were observed in the weld pool. On the Mg-side of the weld pool, equiaxed grains were observed that transitioned to fine columnar grains. Analysis of the grain structure suggests that solidification progressed toward the center of the weld pool, similar to that observed in the solidification of castings. Columnar dendritic growth is usually developed in a positive temperature gradient and remains unchanged over wide ranges of cooling rate. The morphology of the dendrite becomes finer as the cooling rate increases. A measure of the effects of solidification conditions is the dendrite arm spacing i.e. the spacing between primary, secondary, or higher-order branches. The driving force for secondary and tertiary arm growth is the supercooling in the region between primary dendrite arms. From the scientific literature, columnar dendritic growth can be modeled by the Ivantsov theory to develop a unique solution to the problem using the marginal stability criterion [23].
Examination of the Mg interface shows that solidification was also heterogeneously nucleated within the Mg-side of the weld, followed by the growth of primary and secondary columnar grains toward the Mg fusion interface. The presence of a fine equiaxed region at the Mg fusion interface confirms the transition of columnar grains to equiaxed grains. In some section, the incomplete transitions were visible. The presence of these sections was attributed to the fast cooling of the sample after the welding process. Given that the sample was welded in the open air, the rate of cooling was estimated to be fast. The formation of layer S5 is believed to limit the heat transfer through the Mg sample, which causes solidification to proceed across the weld pool toward the Al interface. The microstructure of the Mg/weld interface is shown in Figure 6A. The region above S5 is believed to form as a result of the retardation of heat transfer through the Mg sample, which is due to the formation of the S5 layer. This layer is believed to be the compound MgO + MgAl2O4, given the EDS data presented in Table 2.
Similar microstructural developments were observed for samples welded with welding times below 300 ms; however, significant porosities were also identified in the weld nuggets.

4.3. Formation of Intermetallic Compounds

Analysis of the weld nuggets revealed the formation of various intermetallic compounds. The reaction layer at the Al/weld nugget interface labeled as S1 (see Figure 4A) is believed to have formed due to the interdiffusion of Al and Mg from the molten weld pool into the aluminum solid. According to Liang et al. [24], the three possible intermetallic phases in the Al–Mg binary system are; β Al 140 Mg 89 , γ Al 12   Mg 17 , and ε Al 30 Mg 23 . EDS analysis of S1 found that the chemical composition of the reaction layer (see Table 2) in conjunction with the Al–Mg phase diagram suggests the formation of the   γ Al 12   Mg 17 solid solution [19].
An illustration of the temperature and composition profile across the weld pool is shown in Figure 10A. The thermal gradient at the Mg interface is assumed to be positive because of the heat extraction through the Mg sample. The rate of cooling of the weld pool is believed to be retarded by the thick band of MgAl2O4 formed at the fusion interface. In a previous article [18], this phase was evaluated to be Al + Al140Mg89; however, the high oxygen content was assumed to be a surface phenomenon, and not an integral component of the compound. The EDS analysis presented in Table 2 showed an oxygen content of 28.44 at.% in the S5 layer at the Mg fusion interface, which suggests the compound of type MgO + MgAl2O4. The literature shows that MgAl2O4 can form due to several reactions. Given that the samples were welded in the air, oxidation of the samples would lead to the formation of both MgO and Al2O3. As predicted by Equation (1), a reaction between MgO and Al2O3 has the potential of forming MgAl 2 O 4 ( s ) . However, given that the oxides are both in the solid state, the process is expected to be very slow [25].
MgO s + Al 2 O 3 ( s ) = MgAl 2 O 4 ( s ) Δ G 1023 K o = 37.32   kJ / mol
Alternatively, the oxidation of the aluminum/magnesium melt during the resistance welding process can lead to the formation of a porous MgO at the fusion interface (see Equation (2)). The porosity of the oxide layer would cause further oxidation of the weld pool, which could lead to the formation of MgAl2O4 as predicted by Equation (3) [26]:
3 Mg l + 3 2 O 2 ( g ) = 3 MgO ( s ) Δ G 1023 K o = 1471.2   kJ / mol
3 4 Mg l + 3 2 Al l + 3 s O 2 ( g ) = 3 4 MgAl 2 O 4 ( s ) Δ G 1023 K o = 1222.19   kJ / mol
The variation of the composition of Al within this region is shown in the composition profile, and is believed to be very steep because of the variation of Al across the Mg fusion interface.
Beyond layer S5, the gradient of the composition profile decreases toward the center of the weld pool. The changes in the composition of the weld pool are reflected in the formation of layers S3, S4, and S5 on the Mg-side of the weld nugget. The heterogeneous nucleation of phase S3 occurs beyond layer S5, and the grain grows in both directions toward this Mg interface, and faster toward the center of the weld pool.

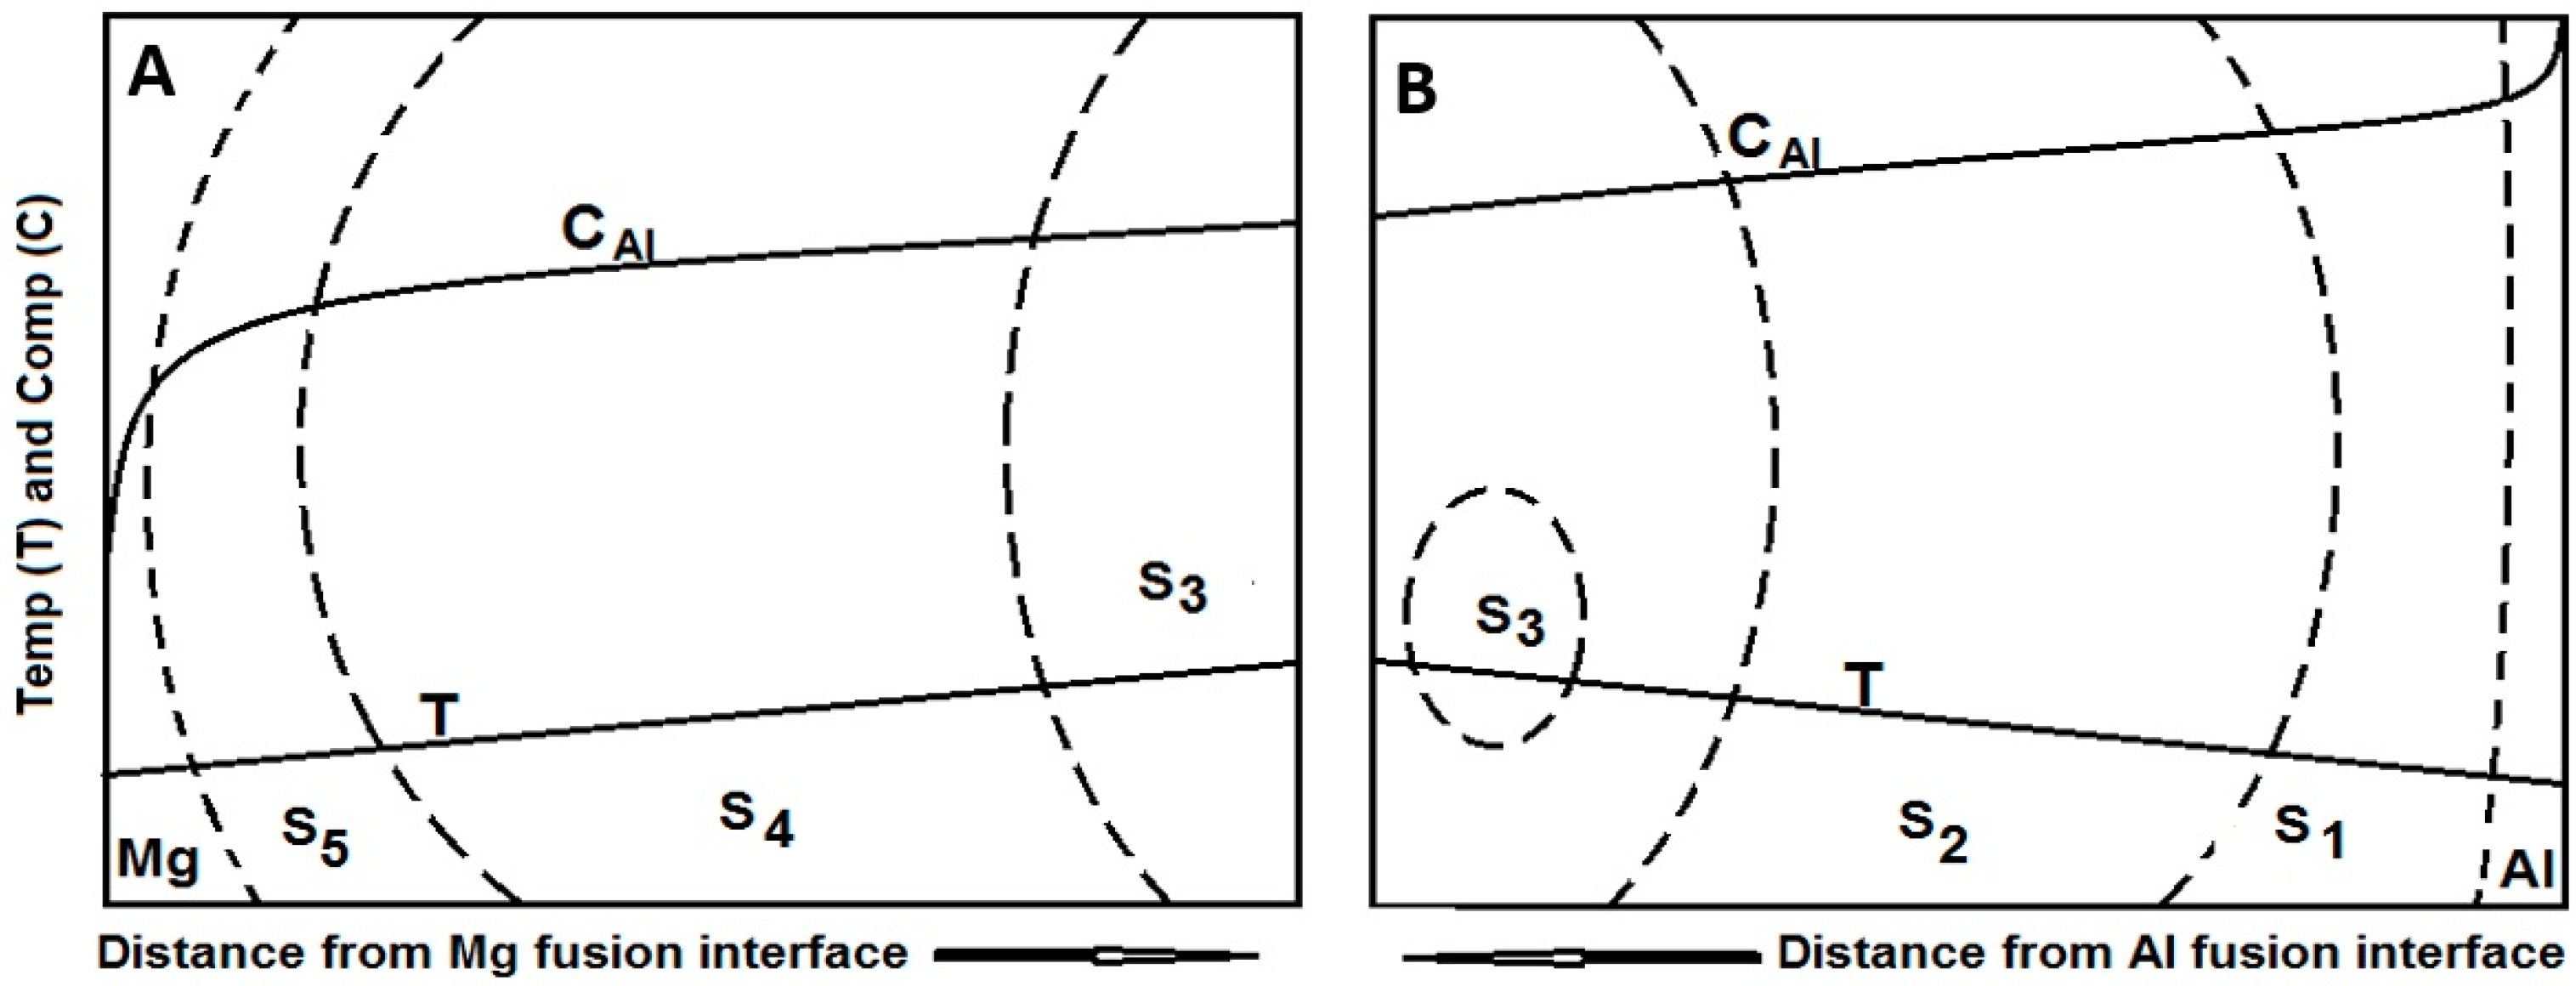
4.4. Macrosegregation in the Weld

The welding parameters have been shown to significantly affect the volume of molten liquid forms during welding and the volume that is retained during the welding process. When sufficient melting occurs and the clamping force does not cause liquid expulsion, as discussed earlier, fluid flow and mixing of the molten metals within the weld pool facilitated the formation of a macrosegregation pattern caused by density gradients in the liquid. The differences in the density of Al and Mg can give rise to natural convection within the molten weld pool. The relative strength of this flow can be determined by evaluating the dimensionless Rayleigh number (Ras) and the Marangoni (Ma) shown in Equations (4) and (5), respectively:
R a s = g Δ ρ L 3 μ k
M a = γ T d T d x   L 3 μ k
where g is the gravitational acceleration, L is the length scale, μ is the liquid viscosity, k is diffusivity, γ T is the coefficient of surface tension as a function of temperature, ρ is the density, and d T d x is the temperature gradient.
From the present study, the width of the weld pool was taken to be L 3   mm , the temperature gradient for a typical resistance welding of Al and Mg was taken as d T d x   10   k / m , and Δ ρ is the differences in the densities of the base metals studied. Using those values, the Rayleigh number was calculated to be Ras = 4.49 × 10⁴, and the Marangoni number was found to be Ma = 6.34 × 10³, by dividing the Rayleigh number by the Marangoni number Ras/Ma = 7. Given that the Rayleigh number is five times greater than the Marangoni number, the solute convection within the weld pool will lead to the lighter Mg17Al12 phases segregating to the top of the weld pool and the heavier MgAl2O4 phase segregating to the bottom of the weld pool. Similar results were observed by Chatterjee et al., who studied dissimilar laser welding to Ti and Ni [27]. The solidification path shown in Figure 11 was estimated using the Scheil model in Thermo-Cal and confirms the early solidification of the lighter face centered cubic (FCC) phase followed by a heavier hexagonal close-packed (HCP) phase as the temperature of the weld pool decreased. The phases identified in the weld nugget are consistent with the results of the Scheil model.

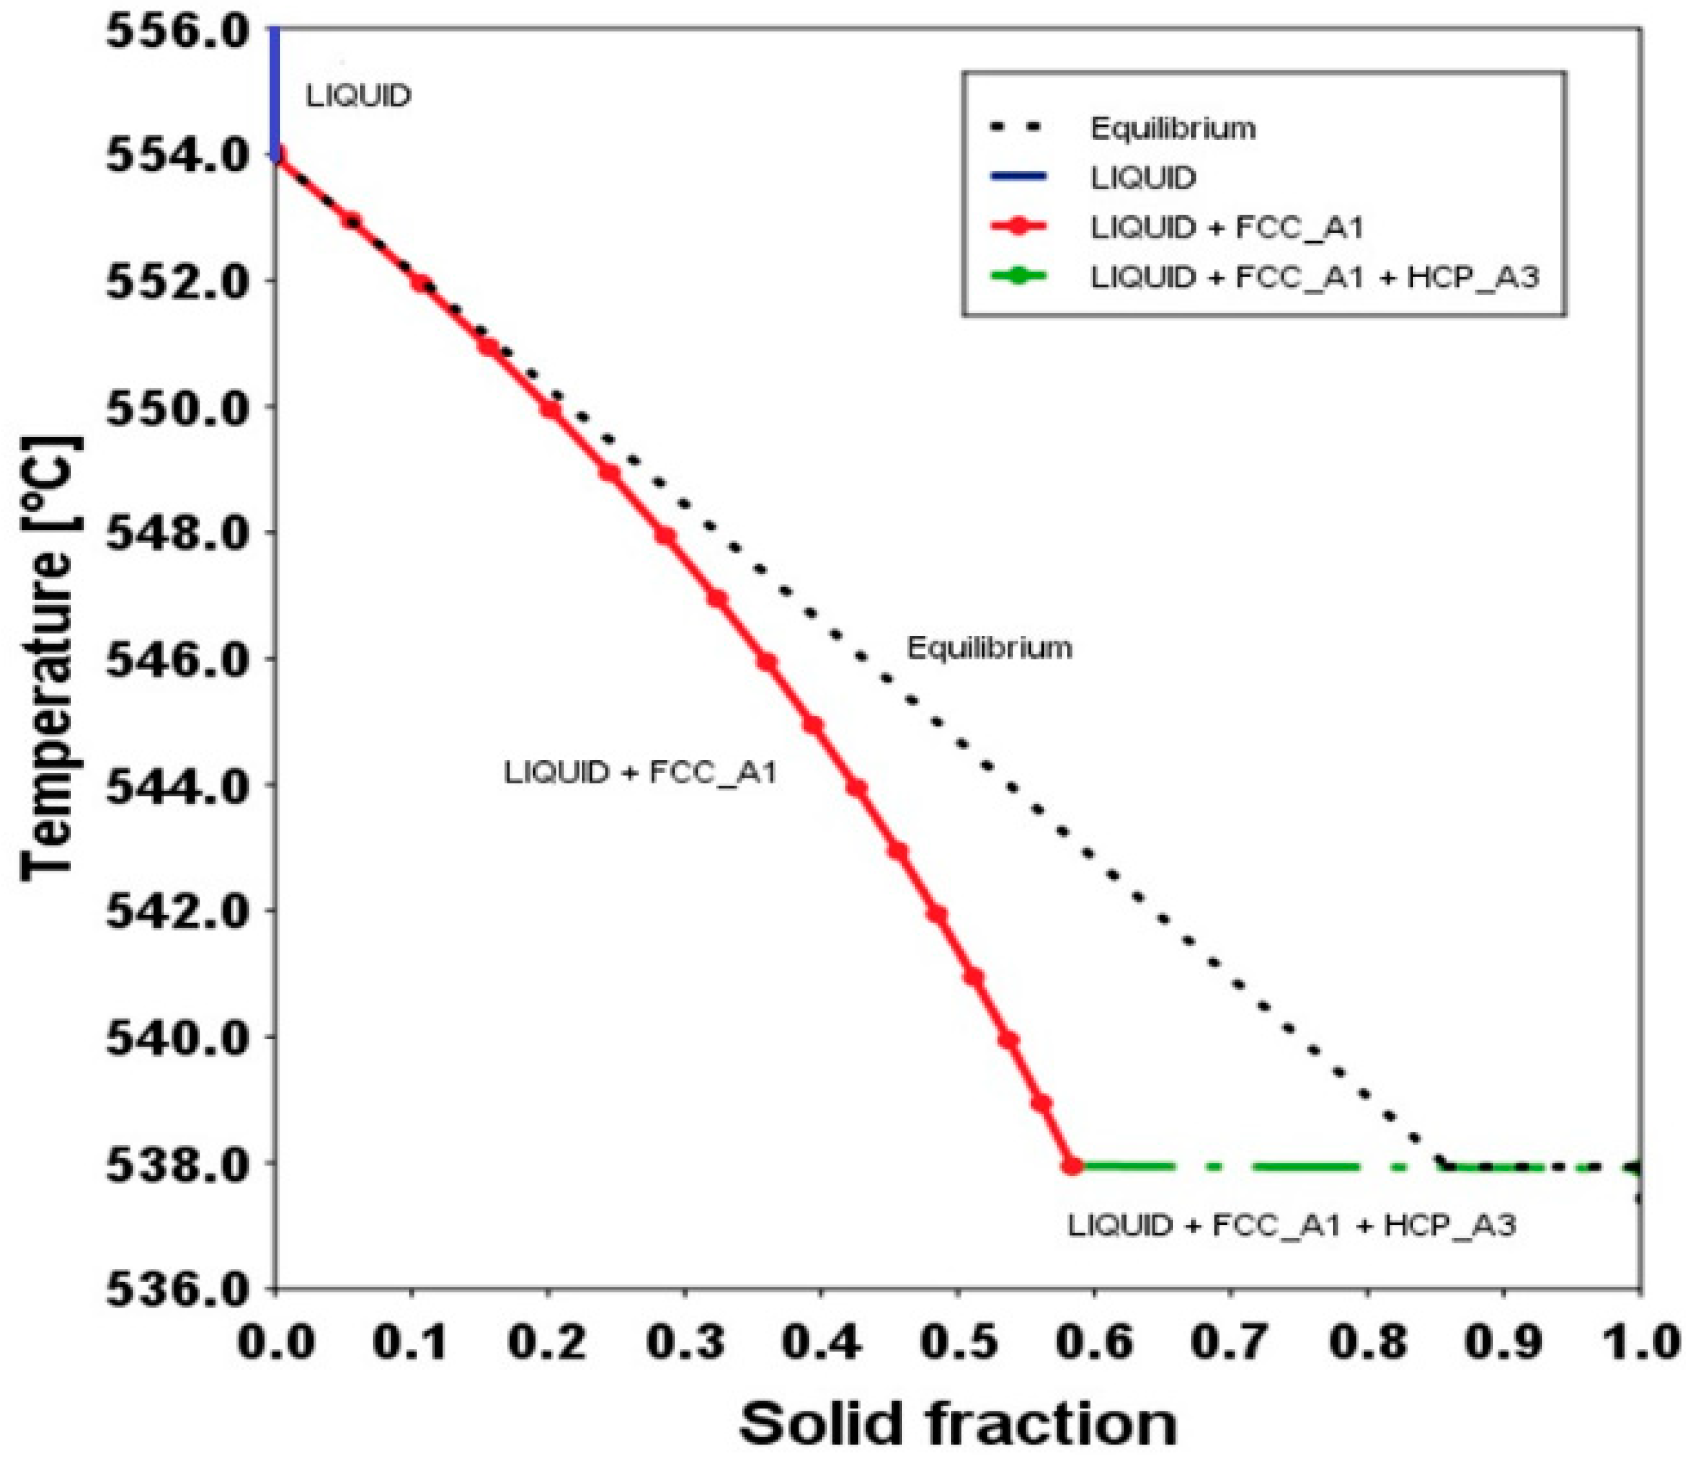
4.5. Solidification Sequence

The sequence by which solidification progressed in the optimized weld nugget is shown in Figure 12. The molten weld pool is shown as t1 bordered by Mg and Al. As the solidification time progresses, a layer (S5) forms at the Mg fusion interface and the heterogeneous nucleation of the MgAl2O4 phase. At time t3, the continued growth of the MgAl2O4 grains occurs, as well as the nucleation of equiaxed grains within the weld center. At time interval t4, Al–Mg grains are nucleated on the Al-side of the weld pool and the formation of an Al17Mg12 diffusion zone. At time interval t5, a complete microstructure of the solidified weld nugget is shown in Figure 12. When this solidification sequence is compared to that of casting, several differences in the sequence and the direction of solidification were observed. When casting is solidifying, chill-cast grains are formed at the nucleation sites along the container walls followed by equiaxed grains, and then the faster growing columnar grains, which grow on a positive temperature gradient toward the center of the liquid. The solidification direction observed in this study appears to progress along a negative temperature gradient toward the Al interface, as shown in Figure 12.

4.6. Microhardness Measurements

The welding parameters were seen to significantly influence the variation of the hardness values recorded across the width of the weld interface. Noticeably higher hardness values were recorded within the weld nugget (see Figure 9) and confirm the presence of various intermetallic compounds within the weld interface. The difference in the hardness values recorded between the weld interface and the Al and Mg base metals were attributed to the precipitation of three primary compounds: Al17Mg12, Mg5Al8, and MgAl2O4. Short welding time constrained the weld nugget growth due to the insufficient melting of the base metals and limited the width of the weld interface. When the welding time increased, the width of the weld interface increased, and this was confirmed by the hardness measurement presented in Figure 9. Conversely, when the clamping force was increased beyond 800 N, the expulsion of the molten metal led to the formation of large cavities (see Figure 1) with a weld nugget that prevented the assessment of the hardness variation.

5. Conclusions

This study evaluated the influence of welding parameters on nugget formation during small-scale resistance spot welding. The optimized weld nugget was characterized for its composition, morphology, microstructure, and solidification sequence. Four types of microstructure were observed in the weld zone based on differences in composition, growth morphology, and solidification mode. Detailed analysis of the results and thermodynamic computations led to the following conclusions:
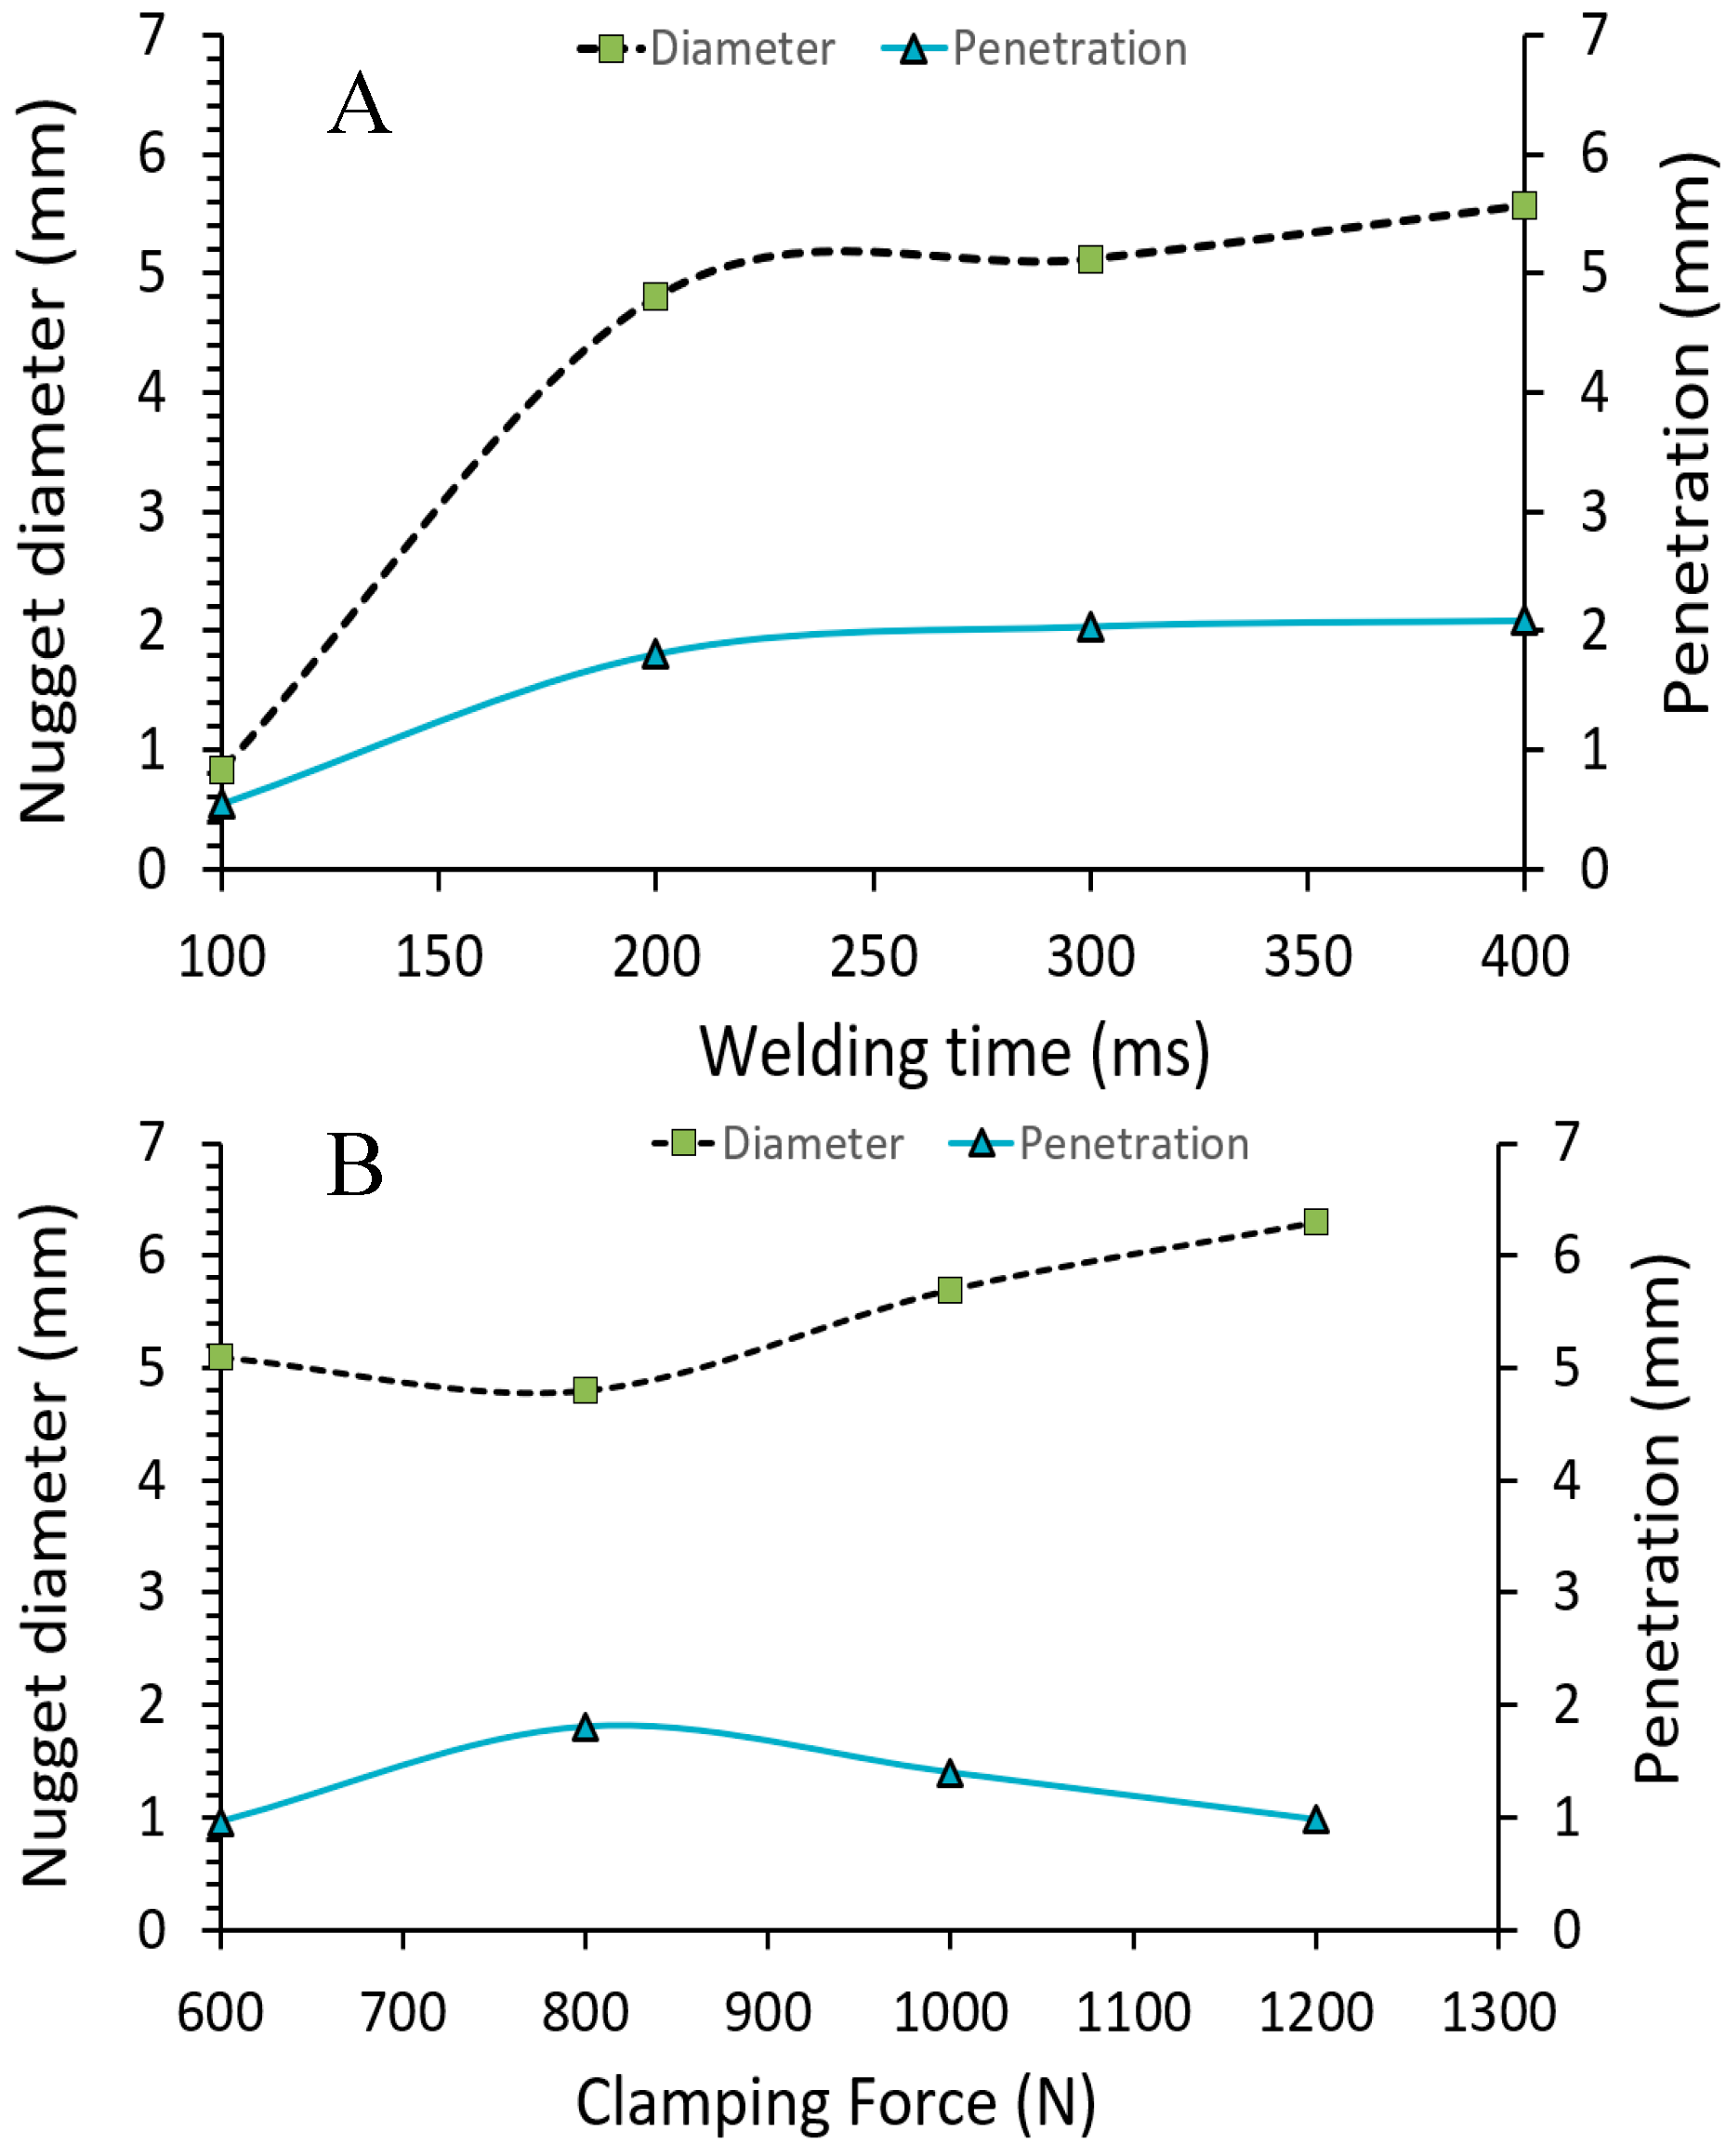
  • The optimal parameter settings for small-scale resistance welding were found to be 300 ms welding time and 800 N clamping force. Weld nuggets formed with lower welding time and clamping force were undersized and contained extensive porosity, while clamping force above 800 N cause gross deformation of the test samples and the expulsion of the molten metal during the welding process.
  • The differences in the thermokinetic properties of aluminum and magnesium alloys led to the formation of an asymmetrical joint with most of the melting taking place on the Mg-side of the weld. Geometric analysis of the weld nugget showed that 67% of the weld nugget occurred on the Mg-side. Verification of the composition of the weld nugget using EDS confirmed the dominance of Mg content within the weld nugget, which led to the formation of the Mg17Al12 and the Mg5Al8 intermetallic compounds.
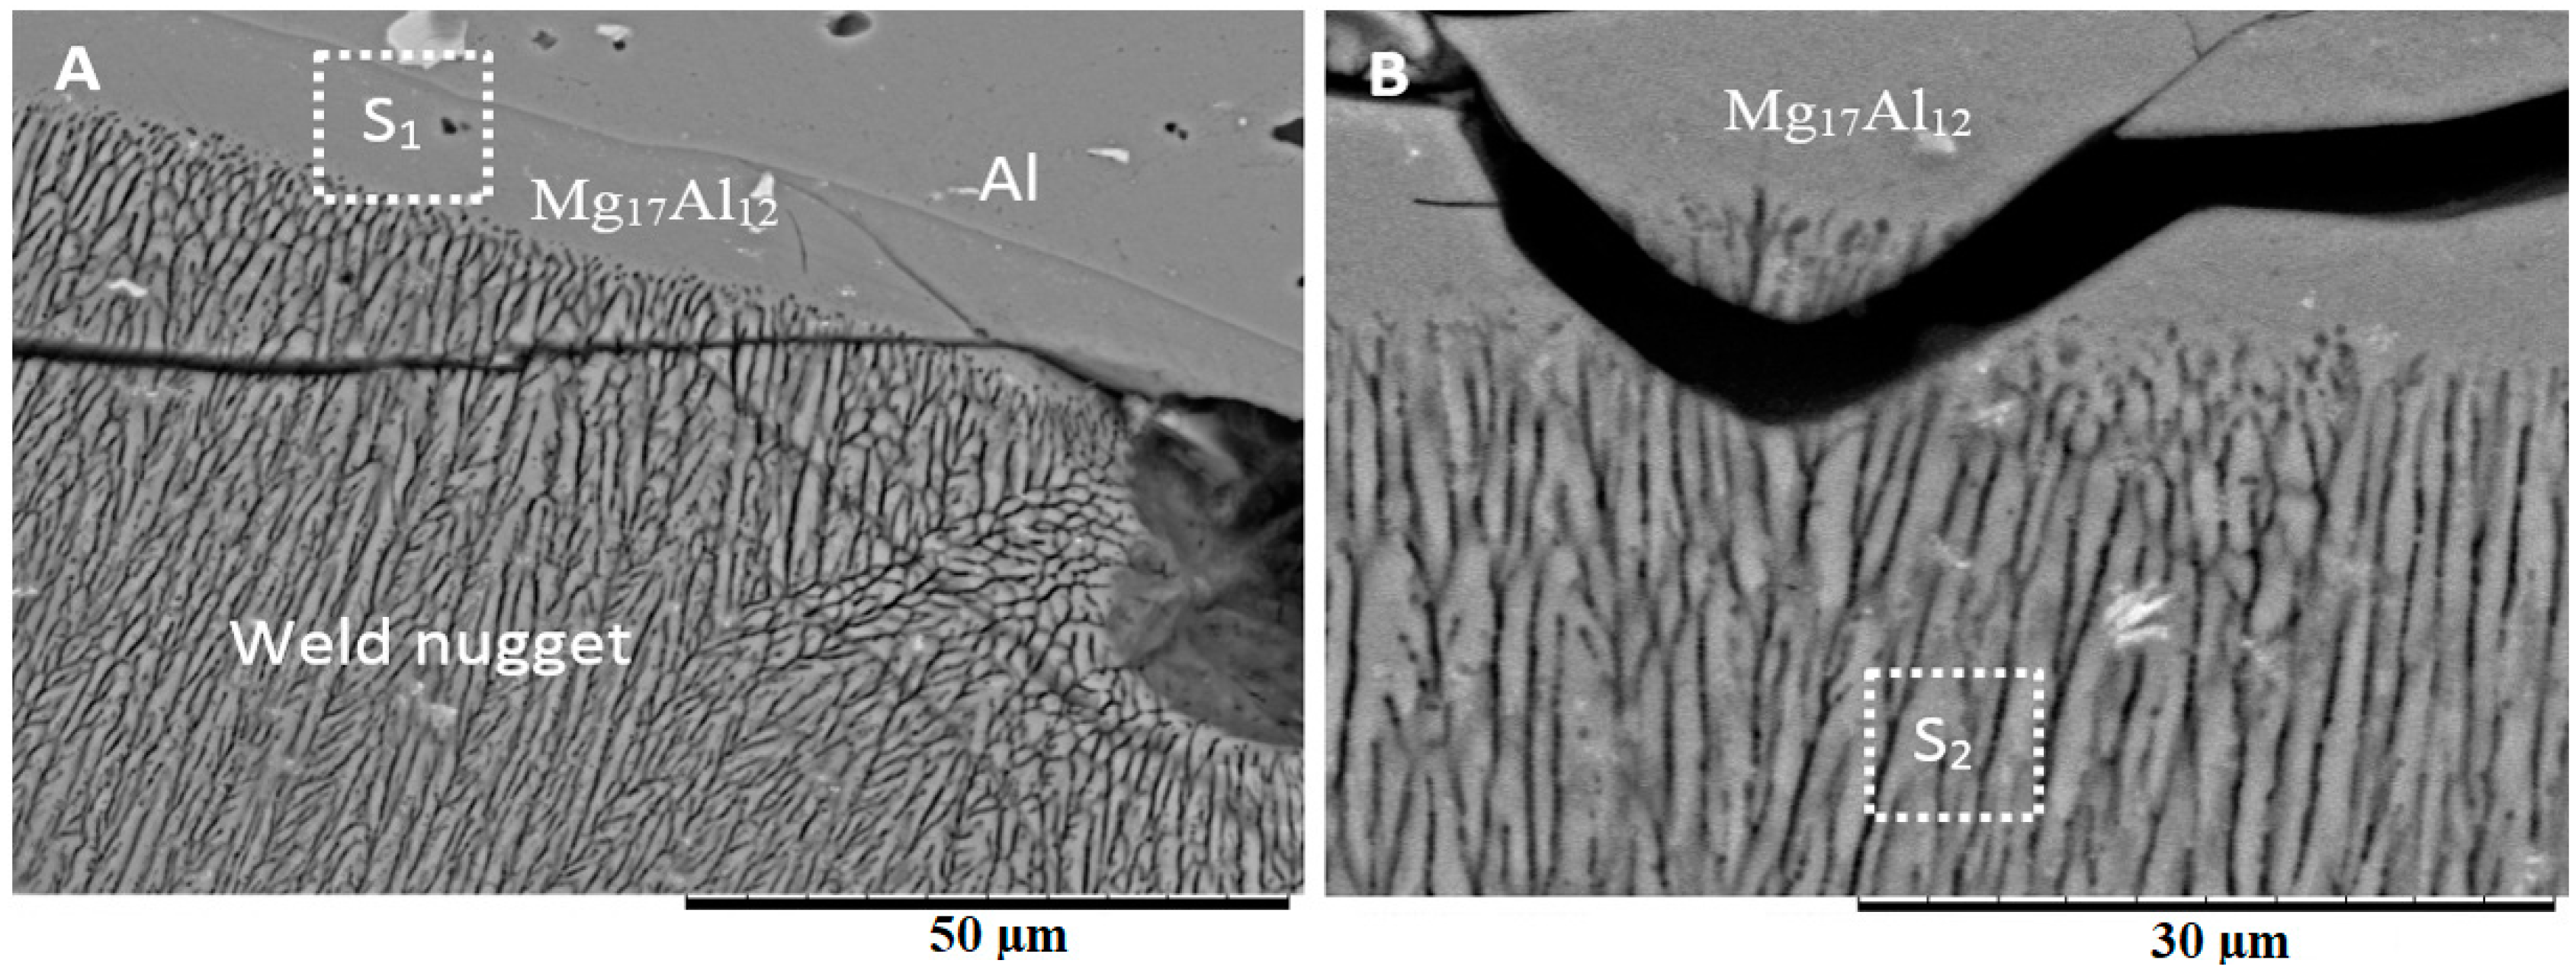
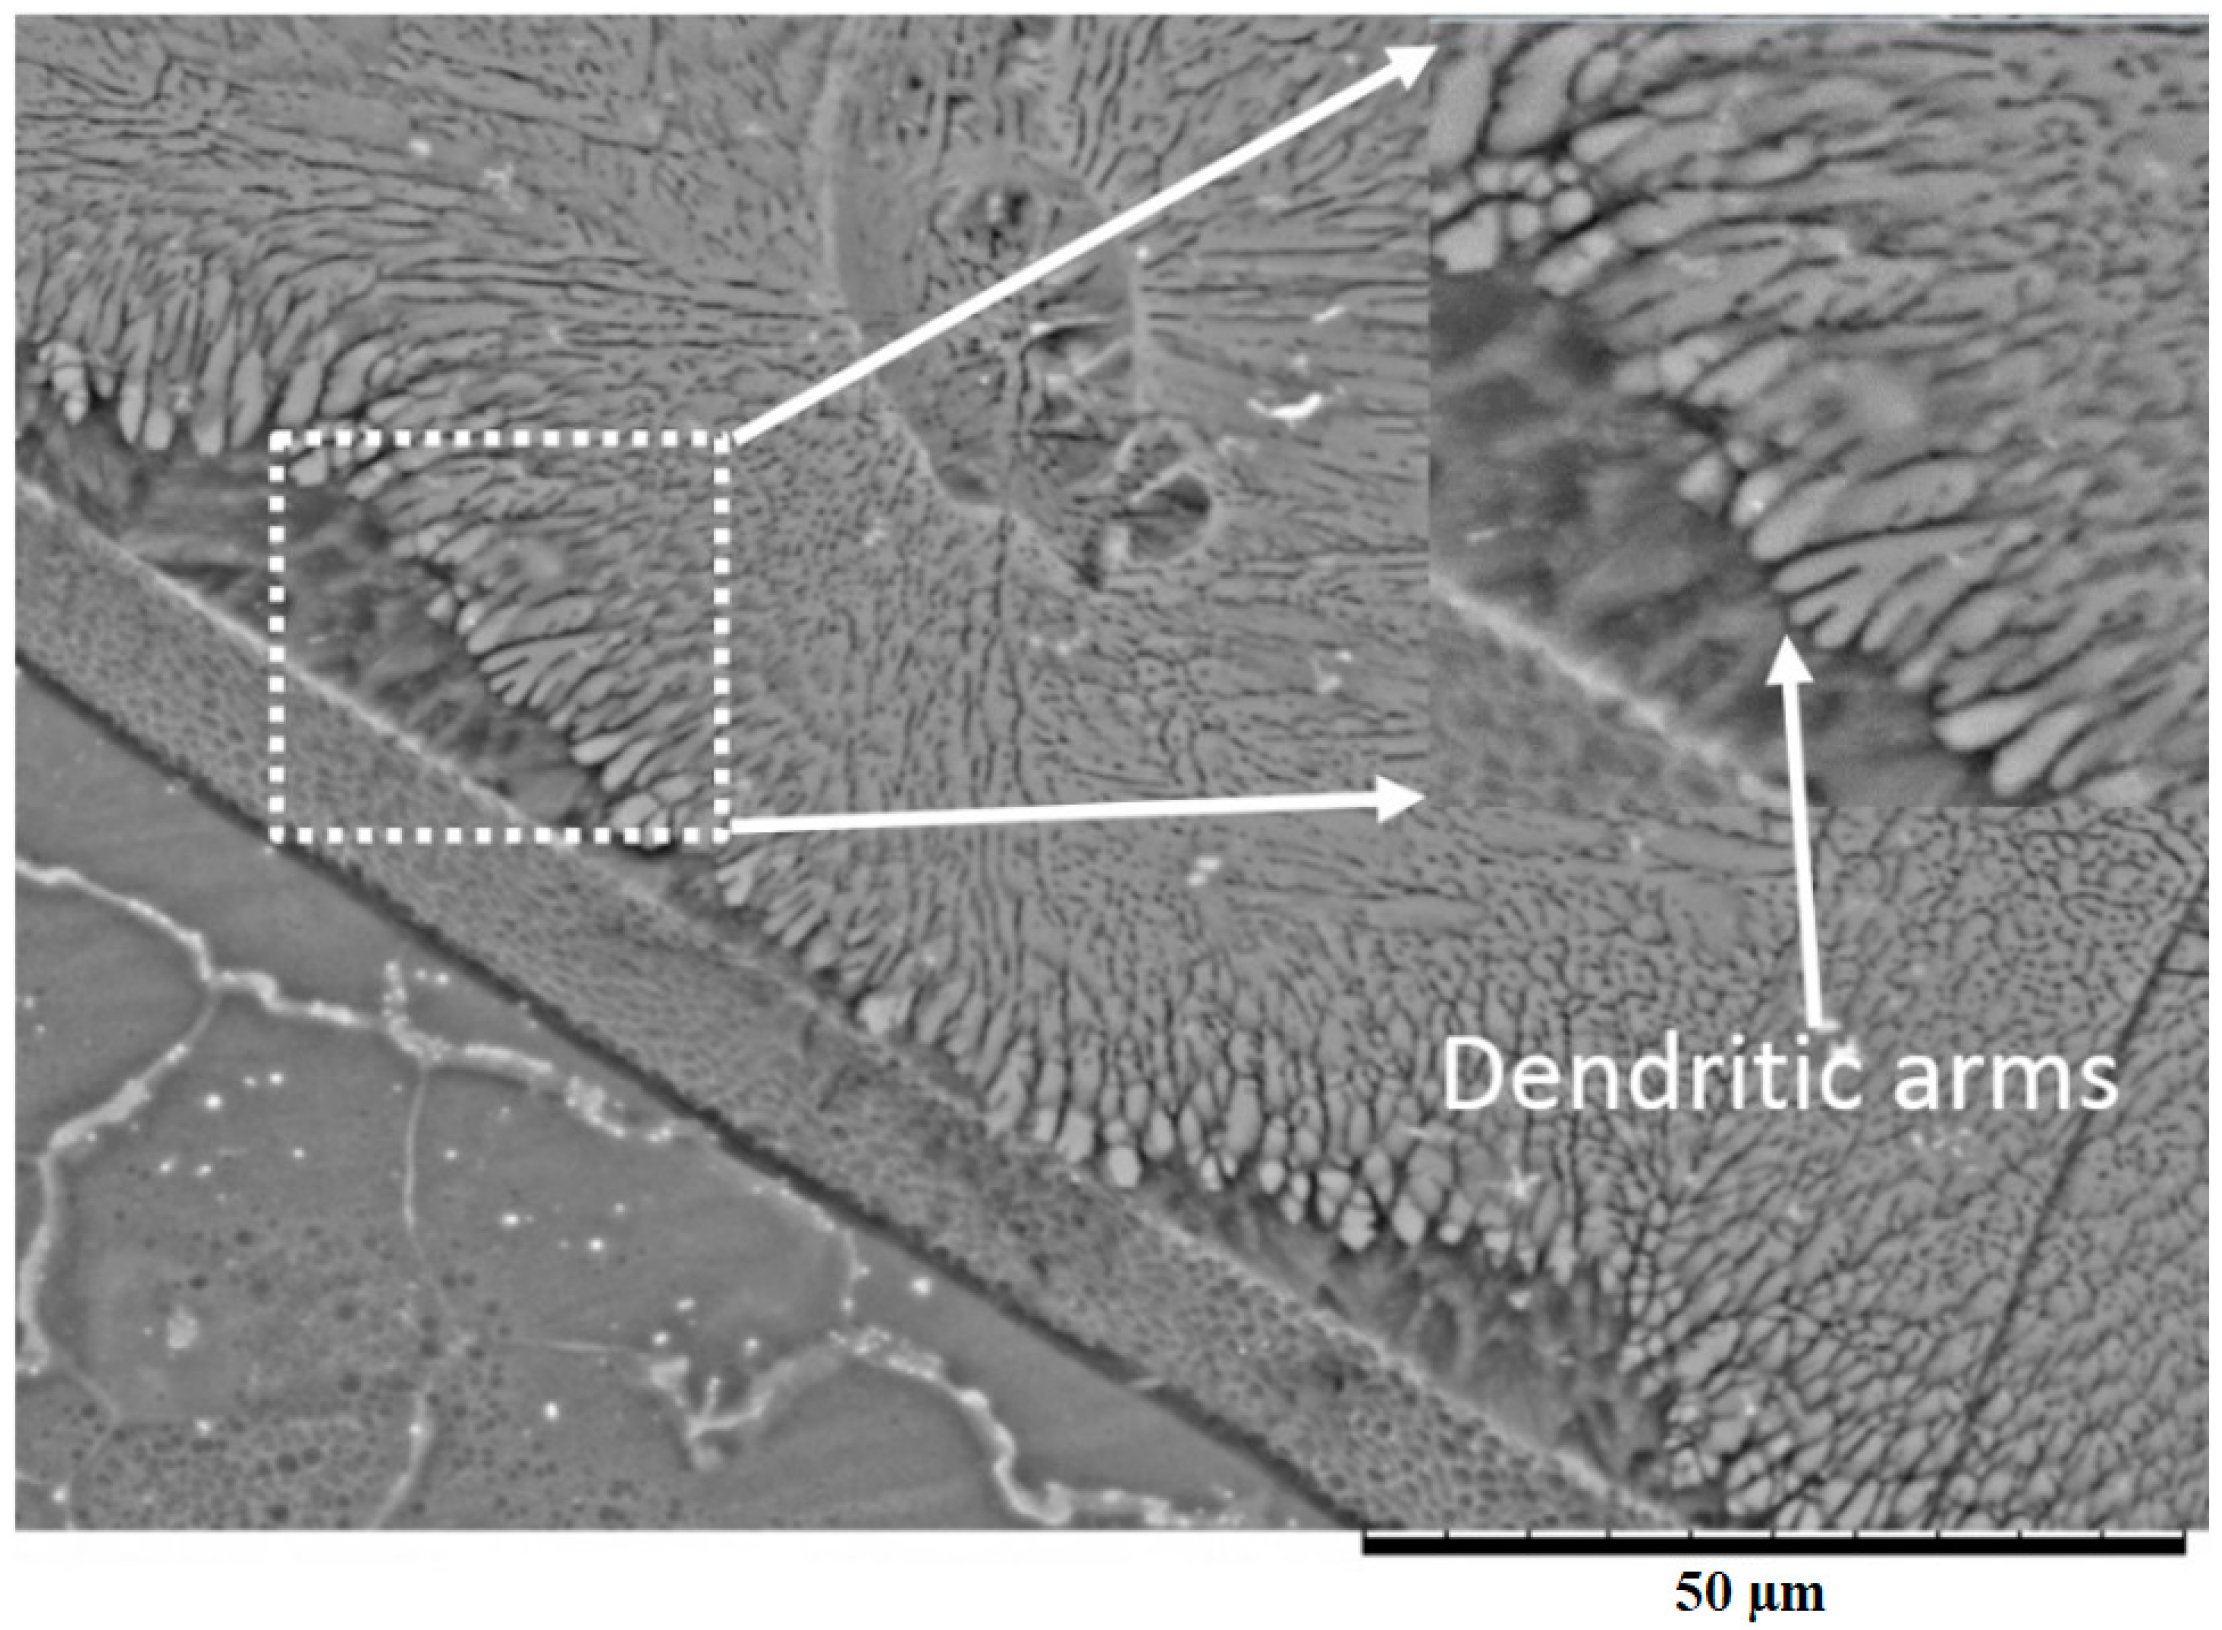
  • Various morphological transitions were observed on the Al-side between planar, cellular, and dendritic, as predicted by the increasing growth rate when moving from the base metal into the center of the weld nugget. Meanwhile, on the Mg-side, a thick MgAl2O4 layer was observed, and beyond this layer, a transition between cellular, equiaxed, and columnar dendritic morphologies was observed.
  • The diameter of the weld nugget was found to increase with an increase of both welding time and clamping force. However, at higher clamping force, melt expulsion occurred, leading to the formation of voids within the weld nugget.

Author Contributions

Conceptualization, K.O.C. and T.I.K.; Methodology, K.O.C.; Formal Analysis, K.O.C.; Investigation, K.O.C.; Resources, T.I.K.; Writing—Original Draft Preparation, K.O.C.; Writing—Review and Editing, K.O.C., and T.I.K.; Supervision, T.I.K.; Validation K.O.C.; Project Administration, T.I.K. and K.O.C.

Funding

This research received no external funding.

Acknowledgments

The authors wish to thank Nick Platt at Magnesium Elektron (Swinton, Manchester M278BF) who provided the magnesium material tested in this study.

Conflicts of Interest

The authors declare no conflict of interest.

References

  1. Muhamed, M.; Omar, M.; Abdullah, S.; Sajuri, Z.; Wan Zamri, W.; Abdullah, M. Brazed Joint Interface Bonding Strength of AR500 Steel and AA7075 Aluminium Alloy. Metals 2018, 8, 668. [Google Scholar] [CrossRef]
  2. Materials, L. Lighweight Materials 2016 Annual Report; United States Department of Energy: Washington DC, USA, 2017.
  3. Liu, L.; Ren, D.; Liu, F. A review of dissimilar welding techniques for magnesium alloys to aluminum alloys. Materials 2014, 7, 3735–3757. [Google Scholar] [CrossRef] [PubMed]
  4. Liu, L.; Ren, D. A novel weld-bonding hybrid process for joining Mg alloy and Al alloy. Mater. Des. 2011, 32, 3730–3735. [Google Scholar] [CrossRef]
  5. Kah, P.; Suoranta, R.; Martikainen, J.; Magnus, C. Techniques for joining dissimilar materials: Metals and polymers. Rev. Adv. Mater. Sci. 2014, 16, 229–237. [Google Scholar]
  6. Urbikain, G.; Perez, J.M.; López de Lacalle, L.N.; Andueza, A. Combination of friction drilling and form tapping processes on dissimilar materials for making nutless joints. Proc. Inst. Mech. Eng. Part B J. Eng. Manuf. 2018, 232, 1007–1020. [Google Scholar] [CrossRef]
  7. Cooke, K.O. A comparative analysis of techniques used for joining intermetallic MMCs. In Intermetallic Matrix Composites; Woodhead Publishing: Sawston, UK, 2018; pp. 221–241. ISBN 9780857093462. [Google Scholar]
  8. Shahid, F.; Khan, A.A.; Saqib Hameed, M. Mechanical and Microstuctural Analysis of Dissimilar Metal Welds. IJRRAS 2015, 25, 6. [Google Scholar]
  9. Rodríguez, A.; Calleja, A.; López de Lacalle, L.; Pereira, O.; González, H.; Urbikain, G.; Laye, J. Burnishing of FSW Aluminum Al–Cu–Li Components. Metals 2019, 9, 260. [Google Scholar] [CrossRef]
  10. Choi, D.H.; Ahn, B.W.; Lee, C.Y.; Yeon, Y.M.; Song, K.; Jung, S.B. Formation of intermetallic compounds in Al and Mg alloy interface during friction stir spot welding. Intermetallics 2011, 19, 125–130. [Google Scholar] [CrossRef]
  11. Sato, Y.S.; Shiota, A.; Kokawa, H.; Okamoto, K.; Yang, Q.; Kim, C. Effect of interfacial microstructure on lap shear strength of friction stir spot weld of aluminium alloy to magnesium alloy. Sci. Technol. Weld. Join. 2010, 15, 319–324. [Google Scholar] [CrossRef]
  12. Kumar, D.S.; Sasanka, C.T.; Ravindra, K.; Suman, K.N.S. Magnesium and Its Alloys in Automotive Applications—A Review. Am. J. Mater. Sci. Technol. 2015, 4, 12–30. [Google Scholar] [CrossRef]
  13. Thakur, A.; Nandedkar, V. Optimization of the Resistance Spot Welding Process of Galvanized Steel Sheet Using the Taguchi Method. Arab. J. Sci. Eng. 2014, 39, 1171–1176. [Google Scholar] [CrossRef]
  14. Webber, T.; Lieb, T.; Mazumder, J. Welding Fundamentals and Processes. In ASM Handbook; ASM International: Materials Park, OH, USA, 2011; ISBN 9781615031337. [Google Scholar]
  15. Manladan, S.M.; Yusof, F.; Ramesh, S.; Fadzil, M.; Luo, Z.; Ao, S. A review on resistance spot welding of aluminum alloys. Int. J. Adv. Manuf. Technol. 2017, 90, 605–634. [Google Scholar] [CrossRef]
  16. Gullino, A.; Matteis, P.; D’Aiuto, F. Review of Aluminum-To-Steel Welding Technologies for Car-Body Applications. Metals 2019, 9, 315. [Google Scholar] [CrossRef]
  17. Sun, M.; Niknejad, S.T.; Gao, H.; Wu, L.; Zhou, Y. Mechanical properties of dissimilar resistance spot welds of aluminum to magnesium with Sn-coated steel interlayer. Mater. Des. 2016, 91, 331–339. [Google Scholar] [CrossRef]
  18. Cooke, K.O.; Khan, T.I. Resistance spot welding aluminium to magnesium using nanoparticle reinforced eutectic forming interlayers. Sci. Technol. Weld. Join. 2017, 23, 271–278. [Google Scholar] [CrossRef]
  19. Mezbahul-Islam, M.; Mostafa, A.O.; Medraj, M. Essential Magnesium Alloys Binary Phase Diagrams and Their Thermochemical Data. J. Mater. 2014, 2014, 704283. [Google Scholar] [CrossRef]
  20. Zhou, Y.; Gorman, P.; Tan, T.; Ely, E.J. Weldability of thin sheet metals during small-scale resistance spot welding using an alternating-current power supply. J. Electron. Mater. 2000, 29, 1090–1099. [Google Scholar] [CrossRef]
  21. Chen, F.; Tong, G.Q.; Ma, Z.; Yue, X.K. The effects of welding parameters on the small scale resistance spot weldability of Ti-1Al-1Mn thin foils. Mater. Des. 2016, 102, 174–185. [Google Scholar] [CrossRef]
  22. Senkara, J.; Zhang, S.J.H. Expulsion Prediction in Resistance SW. Weld. J. 2004, 83, 123–132. [Google Scholar]
  23. McFadden, S.; Browne, D.J. A generalised version of an Ivantsov-based dendrite growth model incorporating a facility for solute measurement ahead of the tip. Comput. Mater. Sci. 2012, 55, 245–254. [Google Scholar] [CrossRef]
  24. Liang, P.; Su, H.-L.; Donnadieu, P.; Harmelin, M.G.; Quivy, A.; Ochin, P.; Effenberg, G.; Seifert, H.J.; Lukas, H.L.; Aldinger, F. Experimental investigation and thermodynamic calculation of the central part of the Mg-Al phase diagram. Zeitschrift Met. Res. Adv. Tech. 1998, 89, 536–540. [Google Scholar]
  25. Levi, C.G.; Abbaschian, G.J.; Mehrabian, R. Interface interactions during fabrication of aluminum alloy-alumina fiber composites. Metall. Trans. A 1978, 9, 697–711. [Google Scholar] [CrossRef]
  26. Kim, K.H. Formation of endogenous MgO and MgAl2O4 particles and their possibility of acting as substrate for heterogeneous nucleation of aluminum grains. Surf. Interface Anal. 2015, 47, 429–438. [Google Scholar] [CrossRef]
  27. Chatterjee, S.; Abinandanan, T.A.; Chattopadhyay, K. Microstructure development during dissimilar welding: Case of laser welding of Ti with Ni involving intermetallic phase formation. J. Mater. Sci. 2006, 41, 643–652. [Google Scholar] [CrossRef]
Figure 1. Optical micrograph of the nugget formed as a function of welding time: (A) 100 ms, (B) 200 ms, and (C) 300 ms using a constant clamping force of 800 N, and a clamping force of (D) 600 N, (E) 1000 N, and (F) 1200 N using a constant welding time of 300 ms.
Jmmp 03 00046 g001
Figure 2. Relationship between resistance spot welding parameter: (A) Welding time, nugget diameter, and penetration; (B) Clamping force, nugget diameter, and penetration.
Jmmp 03 00046 g002
Figure 3. Al/Mg spot weld. The fusion interfaces are shown by the arrows, welding parameters: 6.3 kVA; electrode force 800 N; 300 ms. Several variations in the microstructure within the weld zone was observed, each phase was labeled S1 to S5.
Jmmp 03 00046 g003
Figure 4. (A) Microstructure at the Al weld interface; (B) Detailed microstructure of the planar interface at the Al fusion interface.
Jmmp 03 00046 g004
Figure 5. (A) Microstructure of the Al weld interface showing the growth of columnar grains; (B) EDS analysis of the Al fusion interface.
Jmmp 03 00046 g005
Figure 6. (A) Micrograph of the Mg fusion interface; (B) Magnified image of the Mg interface; (C) detail micrograph of phase S4-1; (D) Detailed microstructure of S4-2.
Jmmp 03 00046 g006
Figure 7. Microstructure of the weld pool close to the Mg interface.
Jmmp 03 00046 g007
Figure 8. (A) Microstructures in the middle of the weld region labeled as S3; (B) Columnar grains; (C) incomplete equiaxed grain transitions; (D) Columnar to equiaxed transition; (E) Equiaxed grains in the center of the weld; (F) Detailed view of the region labeled S3-5.
Jmmp 03 00046 g008
Figure 9. Microhardness profile across the weld nugget for samples joined with 800 N, 6.3 kVA for (A) 100 ms; (B) 200 ms; (C) 300 ms; and (D) 400 ms.
Jmmp 03 00046 g009
Figure 10. Schematic of the weld nugget showing the relationship between the temperature and compositional gradients and the phase formation across the weld zone (A) Magnesium interface to the weld center (B) Aluminum interface to the weld center.
Jmmp 03 00046 g010
Figure 11. Scheil solidification diagram showing solid fraction versus temperature.
Jmmp 03 00046 g011
Figure 12. Schematic of the development of the solidification structure within the weld nugget as a function of time.
Jmmp 03 00046 g012
Table 1. The parameters and settings investigated.
ParametersWelding Time (ms)Clamping Force (N)Welding Current (kVA)
Experiment
11008006.3
22008006.3
33008006.3
44008006.3
53006006.3
630010006.3
730012006.3
Table 2. Chemical composition (at.%) of the microstructures observed in the weld pool.
SpectraAlSiMgZnCO
S142.11057.89000
S228.09047.650.2913.5310.44
S323.84050.150.2211.0514.73
S3-117.600.3426.980.2822.4329.43
S3-224.96041.970.289.3319.30
S3-323.58048.850.3211.8213.98
S3-423.84050.150.2211.0514.73
S3-523.16041.090.2412.5920.53
S429.68045.750.2411.7911.56
S4-119.230.2136.180.3218.9622.23
S4-29.390.1620.640.1748.4619.39
S518.230.2733.240.2017.4828.44

