Article

Investigation of Feedstock Preparation for Injection Molding of Oxide–Oxide Ceramic Composites

1
Karlsruhe Institute of Technology, Institute of Applied Materials (IAM-WK), 76344 Eggenstein-Leopoldshafen, Germany
2
University of Freiburg, Institute for Microsystem Technologies, 79110 Freiburg, Germany
*
Author to whom correspondence should be addressed.
J. Manuf. Mater. Process. 2019, 3(1), 9; https://doi.org/10.3390/jmmp3010009
Submission received: 28 October 2018 / Revised: 7 December 2018 / Accepted: 20 December 2018 / Published: 16 January 2019

Abstract

:
In this fundamental work, a series of experiments were performed to define the optimal amount of dispersant and solid content for feedstock with and without ceramic fibers (Nextel 610). Based on these fixed conditions, investigations were carried out to discover the effects of binder system, fiber sizing, and increasing fiber content on mixing and viscosity. In addition, the effects of kneading temperature and time, fiber sizing, and different binder systems on fiber length were investigated using a measuring mixer, high-pressure capillary rheometer, and microscopy. Stearic acid, as a dispersant, modified the particle surface and improved the rheological properties. Moreover, increasing the solid content in the feedstocks led to an exponential growth of final torque and relative viscosity, because of the increasing friction between particles. Paraffin wax (PW)- and polyethylene glycol (PEG)-based feedstocks showed different mixing behaviors and rheological results with increasing fiber, whereas PEG-based feedstocks had higher final torques and kneading energies without fibers, whilst PEG feedstocks displayed lower viscosities. Consequently, during kneading, the amount of fiber has been predominating over fiber length, and the effect of the binder, the kneading temperature, and time did not cause significant changes.

1. Introduction

Ceramics are used in almost all industrial areas because of their high hardness, good corrosion and erosion resistance, and excellent high-temperature stability. With the increasing demand for industrial mass production and complex geometries, the interest in ceramic injection molding (CIM) has also increased [1,2,3]. CIM is a subtopic of a more general term, i.e., powder injection molding (PIM), where the powder could be any material in the periodic system, as long as it is sinterable. The PIM process is a derivation from plastic injection molding, but includes some extra steps, such as debinding (solvent, catalysis, and thermal) and sintering, to achieve the desired final parts. The initial step is the compounding of the selected powder (or powder/powder (fiber) mixture) and a binding system. The binder is a temporary carrier of solid particles in powder injection molding, and includes more than one component with specific functions in terms of molding (provide flowability to feedstock) and binder removal. Several researchers have investigated different formulations of the binding system because each powder–process–geometry combination could require its particular formulation [1,4,5,6,7,8].
As a part of a binding system, paraffin wax defined the basic flowability of the feedstock and was mixed with polyethylene to provide green part stability. Furthermore, PEG4000 and PVB (which are both thermally removable) are the alternative binder components, instead of paraffin wax and polyethylene, respectively. On the other hand, stearic acid coats and modifies the solid surface to create a chemical bridge with the binder to decrease the viscosity or increase the solid content in the feedstock [9]. After mixing of the solid and binder components, injection molding takes place in the desired forms, and the green parts should then be debinded and sintered.
Another special variant of the injection molding process is for the short fiber-reinforced plastic components, and has become a widely used process in industry because of the variety of matrix/fiber combinations that provide tailored properties for each desired product. There has been increasing interest by several researchers to investigate the different types of materials, fiber orientations, and their effects on the properties [8,10,11,12,13,14,15,16,17,18].
The third aspect of this work was the ceramic matrix composites. These have recently become more popular because of their promising mechanical stability at high working temperatures, and because of their lower densities compared to high-temperature-capable metallic super alloys whose temperature capability is limited to 1150 °C. For these reasons, ceramic matrix composites (CMCs) are applicable as structural materials for aeronautical and other high-temperature applications. Nowadays, the industrial focus is on cost reduction, increasing efficiency, and durability improvements. All-oxide CMCs, which have relatively lower production and material costs and are without oxidizing problems, have become materials of higher interest to industry, even though they have a relatively lower working temperature and fracture toughness compared to non-oxide ceramic composites. Both the ceramic matrix and fibers are physically brittle, but their composites may show quasi-ductile deformations based on mechanisms such as fiber pull-out, crack bridging, or crack deflection. Generally, the reinforcement mechanism of oxide CMCs is based on a weak-matrix principle (see Figure 1), in which no coatings are needed to create interfaces. Instead, the quasi-ductility is achieved by creating a porous weak matrix and weak bonding between the matrix and fibers. This principle also makes the processing simpler. By choosing weak-matrix composites, the use of submicron powders (alumina in our case) and suitable additives becomes necessary for shaping and for control of the sintering behavior [19,20,21,22].
This work aimed to combine the abovementioned processes and materials to achieve cost-effective products with tailored properties for certain industrial areas, as well as to reveal the processability and reproducibility of fiber-filled feedstocks for injection molding. Additionally, the focus was on discovering the effect of the dispersant, solid content, and fiber content on the rheology.
The effect of processing on fiber length or rupture is a key factor in feedstock preparation, which could have a significant influence on the mechanical properties. In other words, our main challenge was to develop sustainable, highly fiber-filled feedstocks based on our previous experiences with powder injection molding.

2. Materials and Methods

2.1. Materials and Equipment

In this project, we used alumina powder “TM-DAR” from Taimei Chemicals Co. Ltd., Tokyo, Japan, which is a high-purity alumina powder (d50 = 0.11 μm) of the low-temperature sinterable alumina TM-D series, and Nextel 610 chopped alumina fibers with polyvinyl alcohol (PVA) sizing (~3.2 mm in length and 10 to 11 μm in diameter) from 3M Deutschland GmbH, Neuss, Germany. We composed the main binding system based on paraffin wax (PW) “Sasolwax® 6403” from Sasol Performance Chemicals, Hamburg, Germany, that ensures the flowability of the feedstock. In addition, we chose low-density polyethylene (PE) “Lupolen® 1800H” from LyondellBasell Industries N.V., Frankfurt, Germany as a backbone polymer, to provide the required stability for the injection-molded green parts while also being compatible with Sasolwax® 6403 in terms of complete solubility of all individual components [4]. The last component was stearic acid (>98%) from Carl Roth GmbH + Co. KG, Karlsruhe, Germany as a dispersant, which modifies the surface of the solid particles and fibers to inhibit agglomeration, and serves as a lubricant between solid particles and machine walls, and as a plasticizer for polymers [23]. In addition to the standard formulation, an alternative binder formulation was investigated, based on the work by Weber [24], made out of stearic acid, polyvinyl butyral (PVB) “Mowital® B30H” from Kuraray Europe GmbH, Hattersheim am Main, Germany, and polyethylene glycol (PEG) “ROTIPURAN® Ph. Eur.” from Carl Roth GmbH + Co. KG.
For small volumes, a laboratory compounder (W50 EHT), provided by Brabender GmbH & Co., KG and equipped with gearbox, mixer bowl, roller blades, and front plate, was used and gives the torque vs. time as a result, in which the torque displays the resistance of materials against the rotating blades during the mixing process. An example of a kneading curve with the indications of final torque and three main regions, i.e., filling zone, kneading zone, and equilibrium, is given in Figure 2. Measuring viscosity is done by using a high-pressure capillary rheometer (HPCR Rheograph 25) provided by GOETTFERT Werkstoff-Prüfmaschinen GmbH, Buchen, Germany. For this work, we used a capillary of 2 mm diameter, 25 mm active length, and 90° feeding angle. A surface area analyzer (Gemini VII 2390) from Micromeritics Instrument Corporation, Aachen, Germany, was used for Brunauer–Emmett–Teller (BET) measurements. An OCA 200 Optical contact angle measuring and contour analysis system for alumina powder and binders, and a DCAT 25SF dynamic contact angle measuring device, and tensiometer for fibers, were used to measure the contact angle. Both devices were produced by DataPhysics Instruments GmbH, Filderstadt, Germany

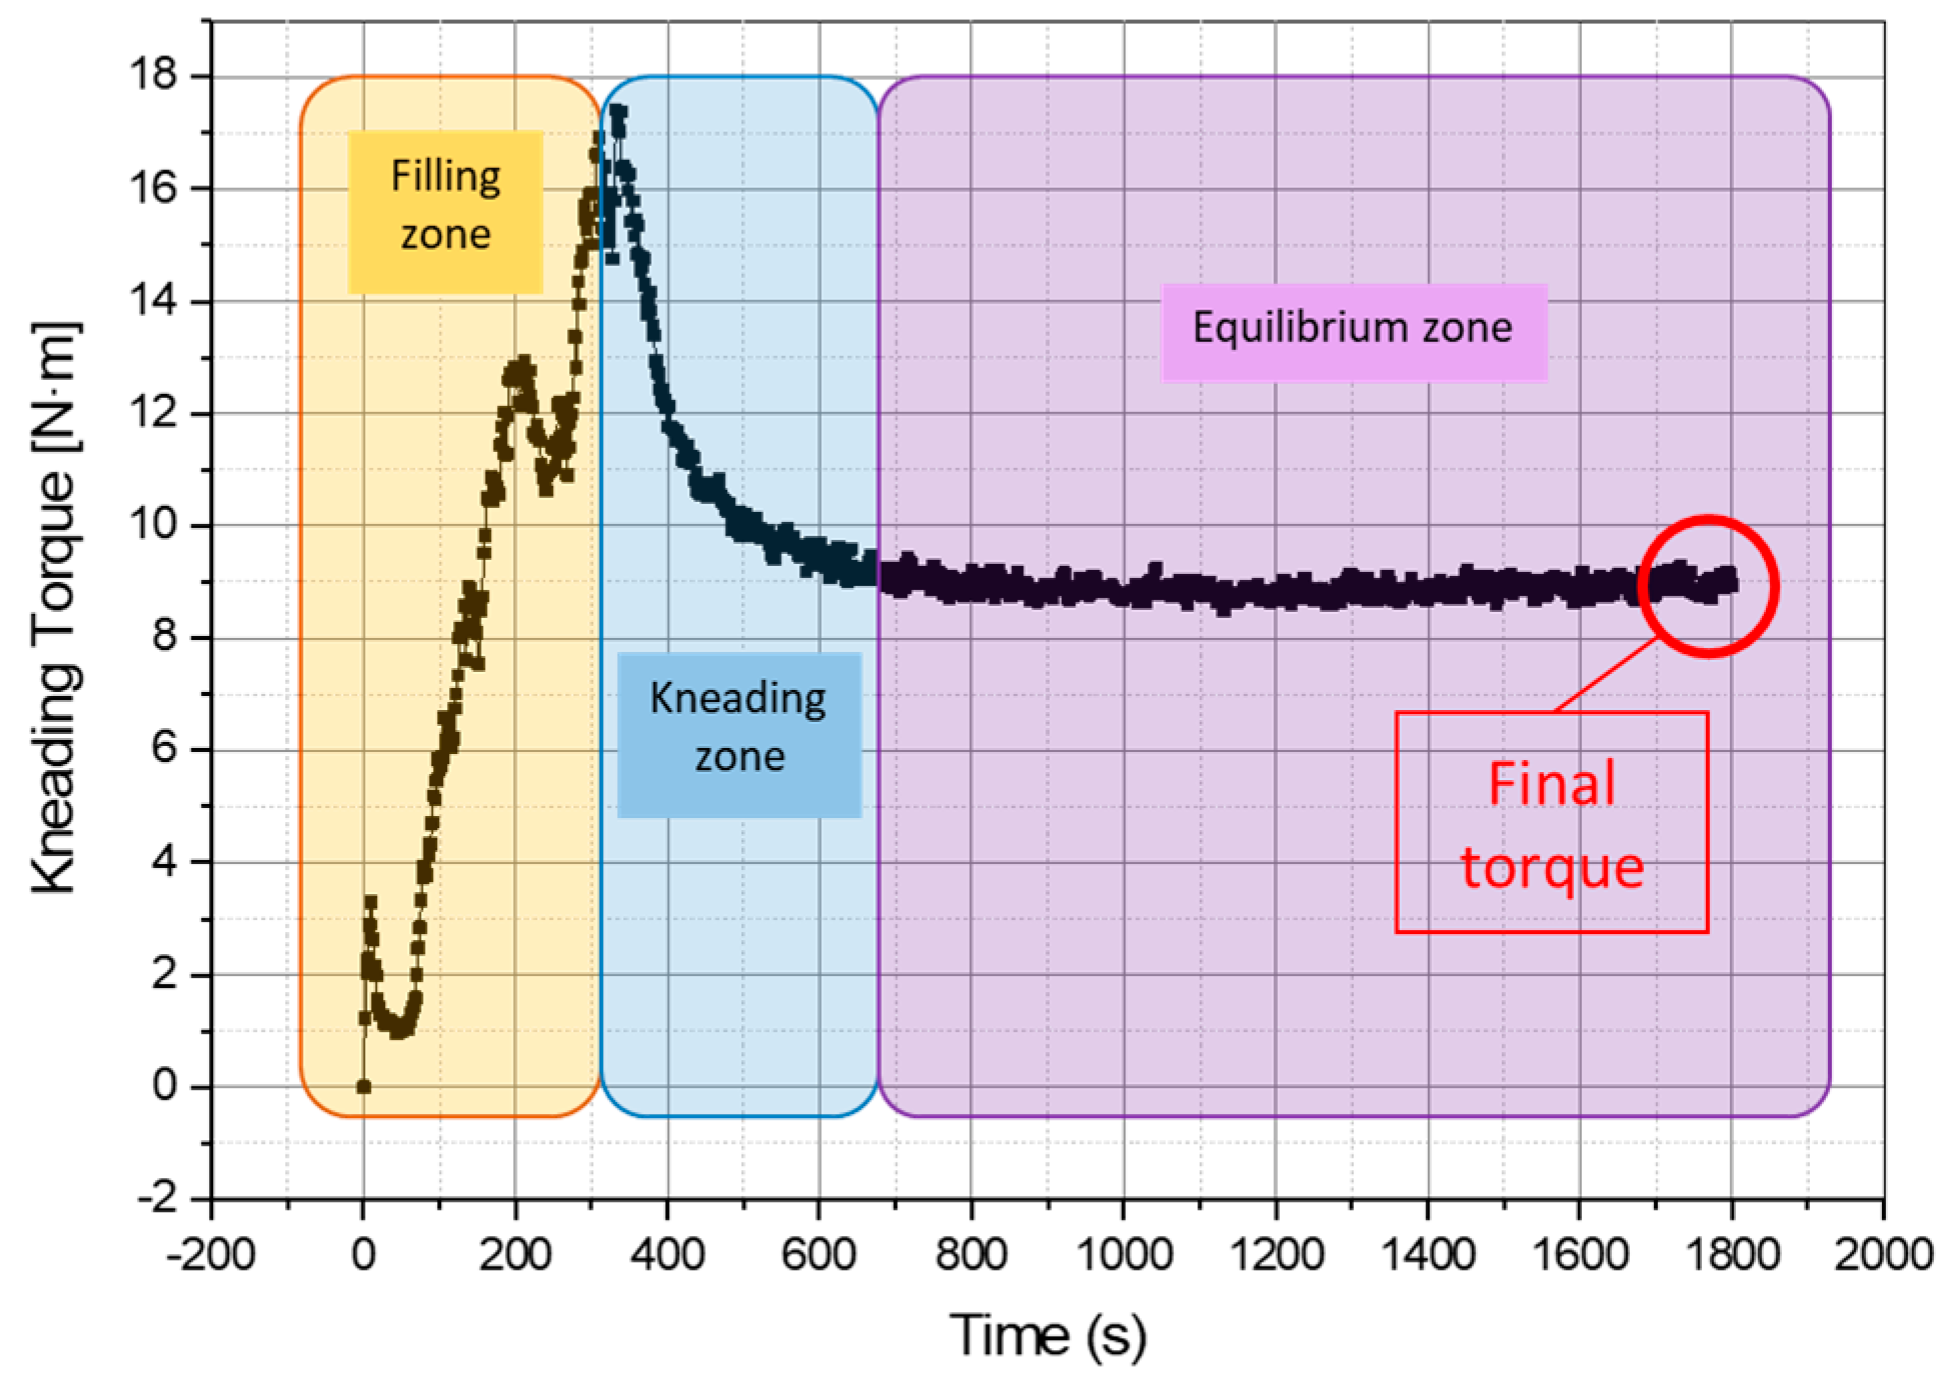
2.2. Kneading, Parameters, and Filling Sequence

Before starting, the mixing parameters were set depending on the purpose. The rotational speed was always constant at 30 min−1. For general feedstock preparation, the parameters are as in Table 1.
For fiber length measurements, there are several setting combinations for different binding systems and amounts of fibers in the feedstocks, as listed in Table 2:
In addition, applying a certain filling sequence is necessary for reliable comparison. Filling starts with adding part of the powder until it fills one-fourth of the chamber. Subsequently, stearic acid and binder components were added. After the binder has melted, within about 3 min, the remaining powder is added to the mixture. If the feedstock includes fibers after binder melting, we continue with adding all fibers slowly, and then add the remaining powder.

2.3. Defining the Required Amount of Dispersant

The theory by Li et al. [25] explains the calculations for the least amount of dispersant required to cover the surface area of powder particles (provided that they are spherical) by using the projected area of the dispersant as seen in Figure 3, where dp is the diameter of the powder and ds is the diameter of the dispersant.
The main idea behind this idealized model is to calculate the amount of dispersant, in grams per square meter, by using the geometrical calculations for the total surface area of the powder. However, neither the powder nor the fibers have regular shapes, such as spherical or cylindrical and uniform distributions of particle size, as seen in Figure 4a,b. For these reasons, BET measurements are more reliable than geometrical calculations to provide the surface area of powder and fibers.
The surface area of powder, A T P or fiber, A T F can be calculated by using BET measurements for powder and fibers, as in Equations (1) and (2), where W T P o w d e r and W T F i b e r s are the total weights of the powder and fibers, in grams, in the given feedstock recipe.
A T P = B E T P o w d e r   [ m 2 · g 1 ] · W T P o w d e r ,
A T F = B E T F i b e r s   [ m 2 · g 1 ] · W T F i b e r s .
Equation (3) gives the projected area of the dispersant, A s , which is necessary for calculating the number of dispersant molecules, N s , depending on the surface area of either powder or fibers as in Equation (4). The weight of the minimum required dispersant, W s , can be calculated as in Equation (5) for powder and fibers separately.
A s = π · d s 2 4 ,
N s = A T P ( o r   A T F ) A s ,
W s = N s · M N A = A T · M A s · N A ,
where M is the mole mass of the dispersant in (g·mol−1) and N A is the Avogadro number in (mol−1). In addition, the coverage index, C s (mg·m−2), as a material property, was calculated by dividing the weight of the dispersant by the total area of the powder as in Equation (6), which makes the term independent from the type of the powder in terms of surface area, and constant for each type of dispersant. On the other hand, the physical and chemical reactions between powder surface and dispersant should be considered separately for optimal performance:
C s = W s A T = M A s · N A .

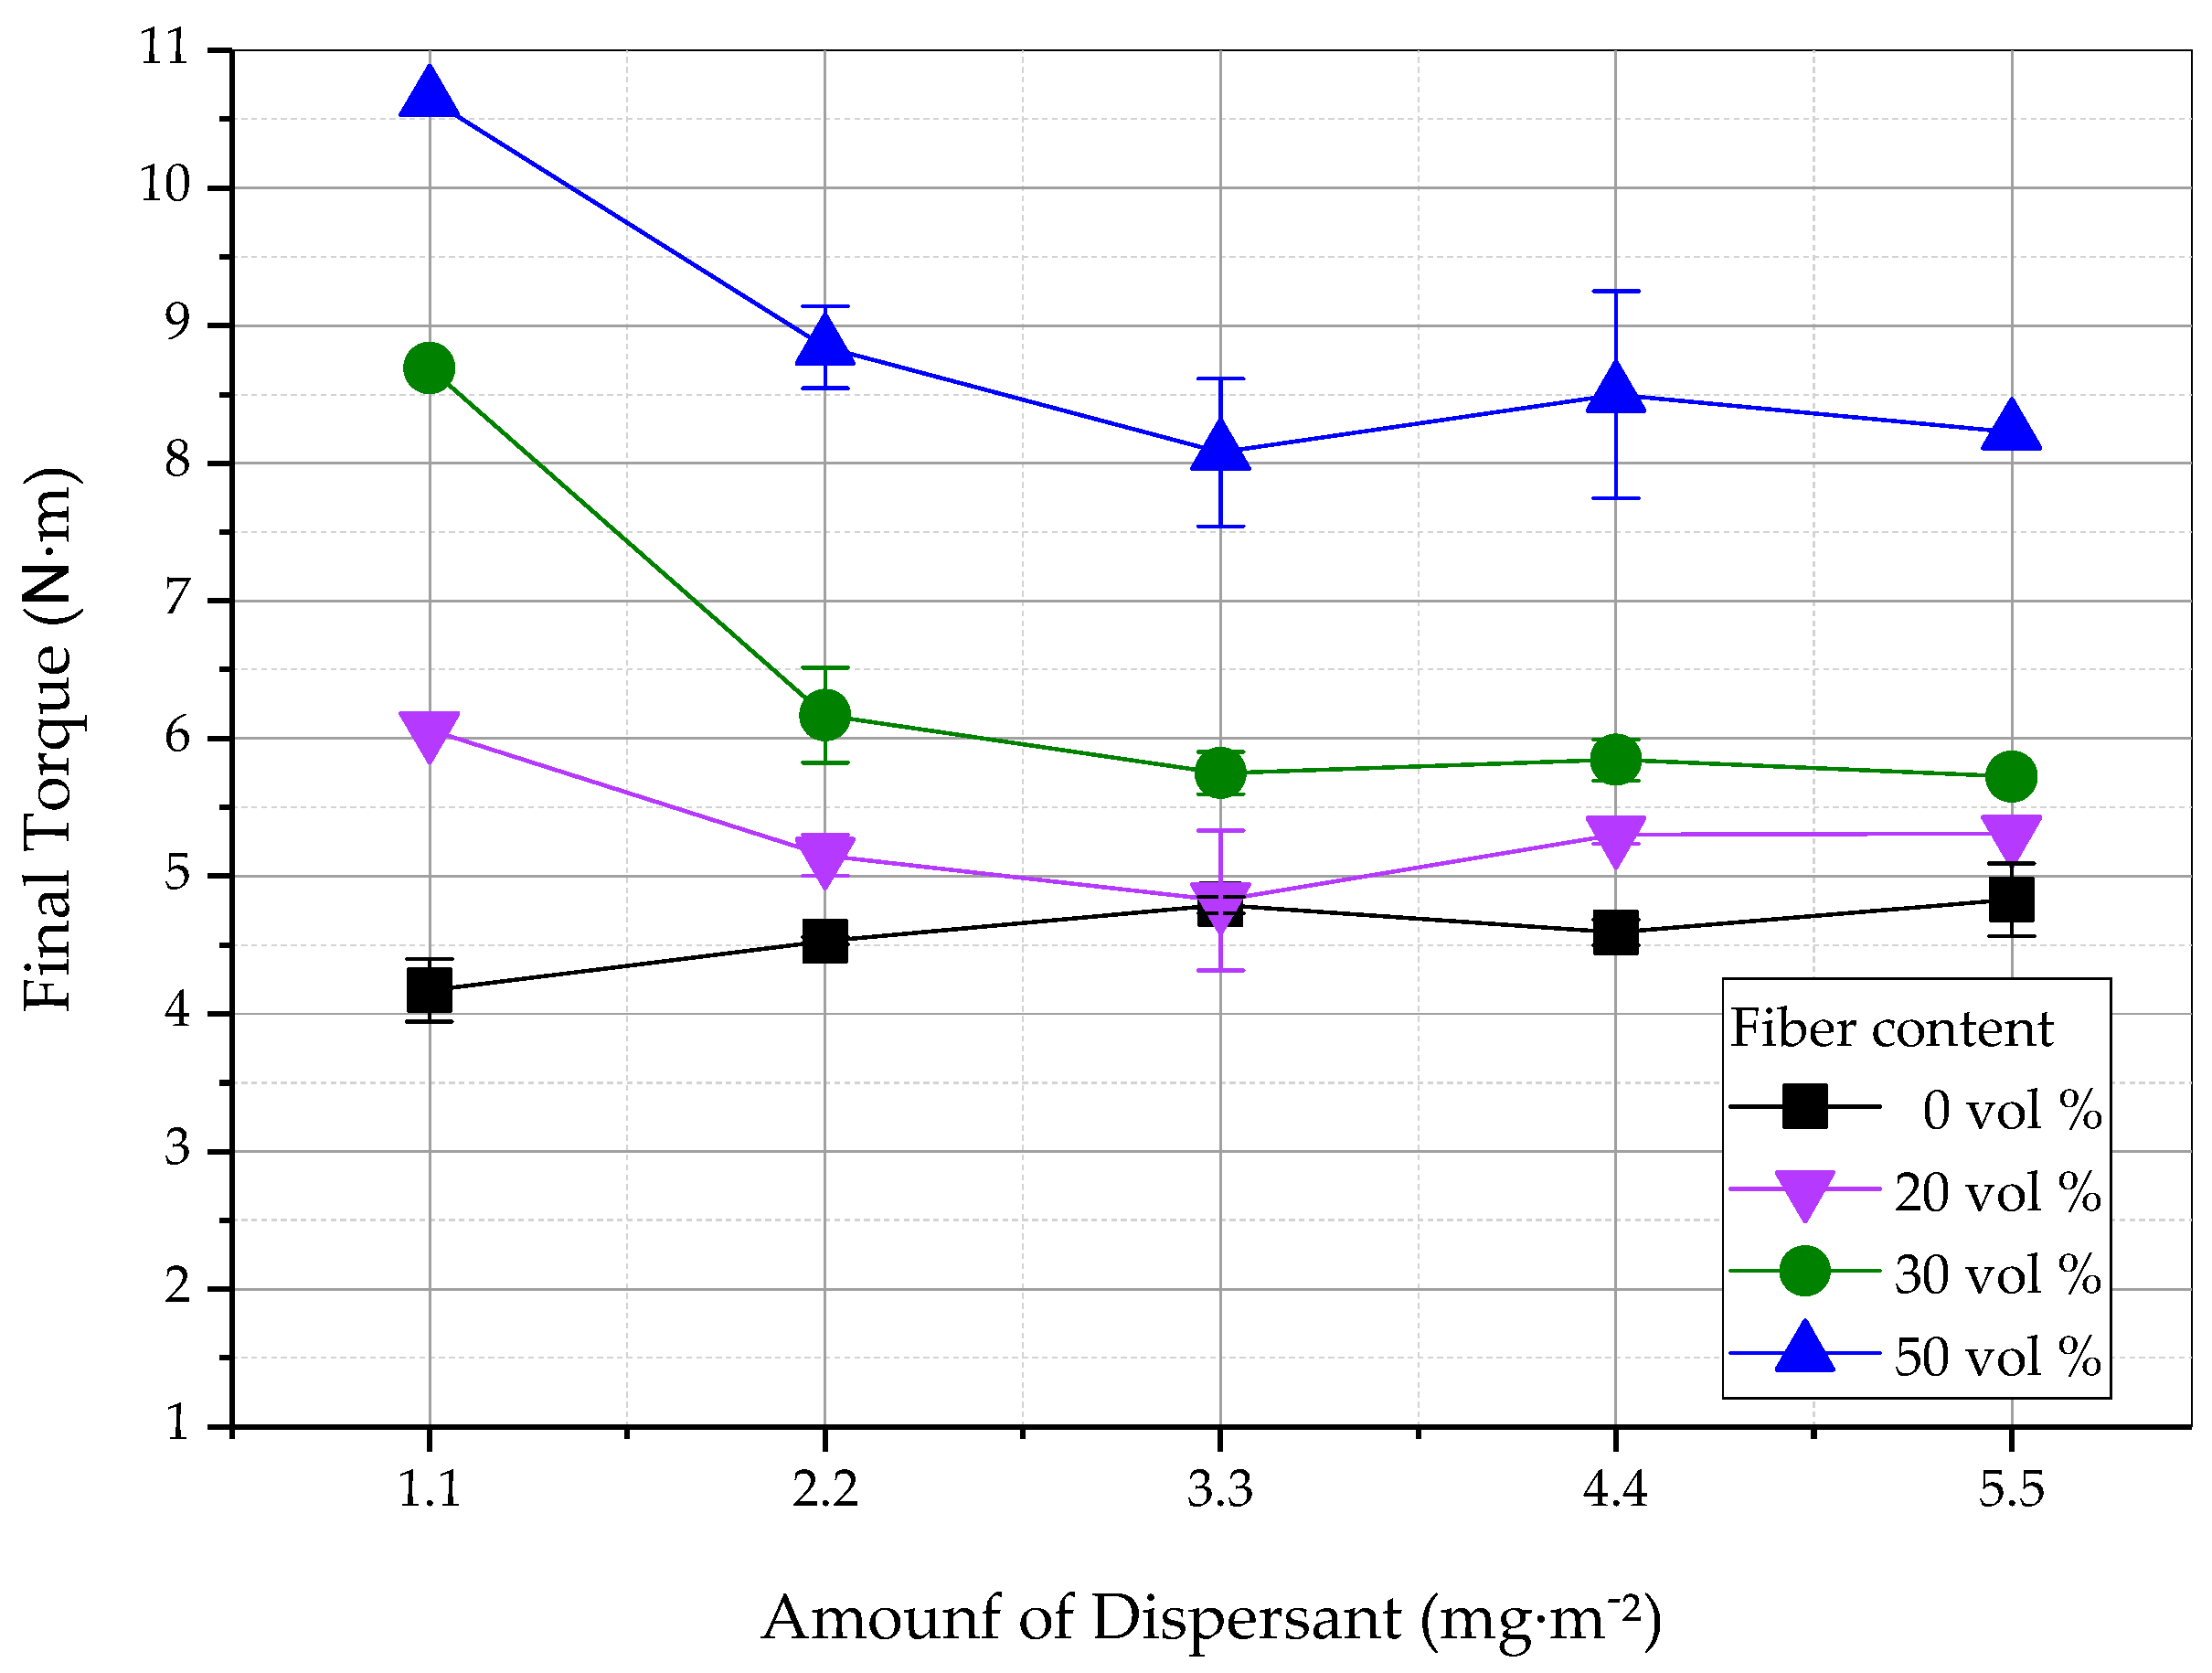
2.4. Experimental Investigation of Dispersant

Parallel to the geometrical calculations for the amount of the dispersant, the effect of the dispersant was investigated for different feedstocks with 0, 20, 30, 50 vol % fibers in solid content by varying the concentration of stearic acid from 1.1 to 5.5 mg·m−2. For this experiment, the solid content was held constant at 50 vol %, depending on the previous experiences.

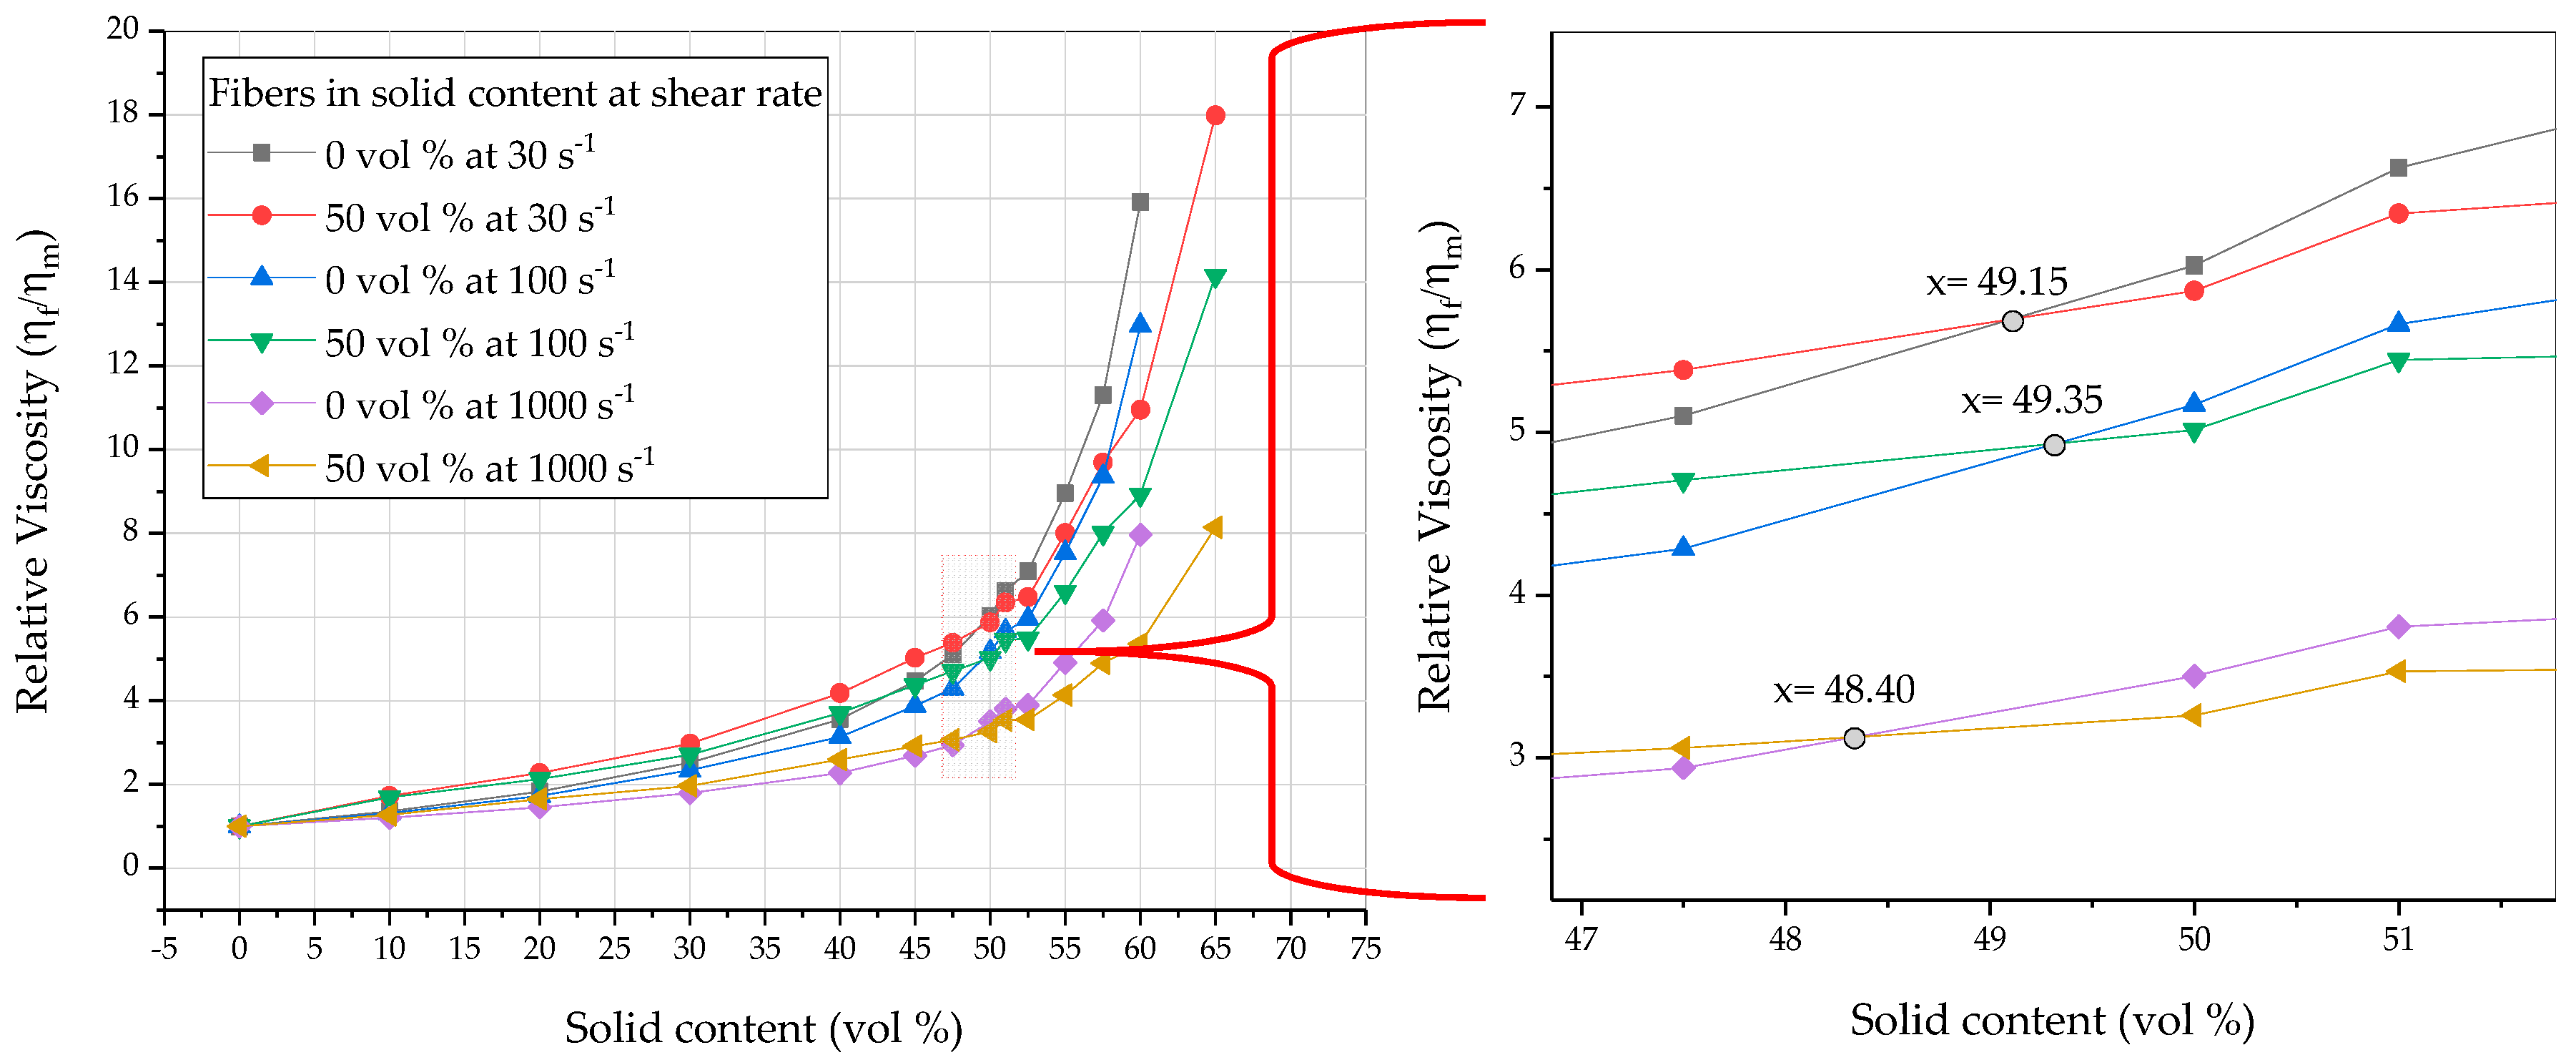
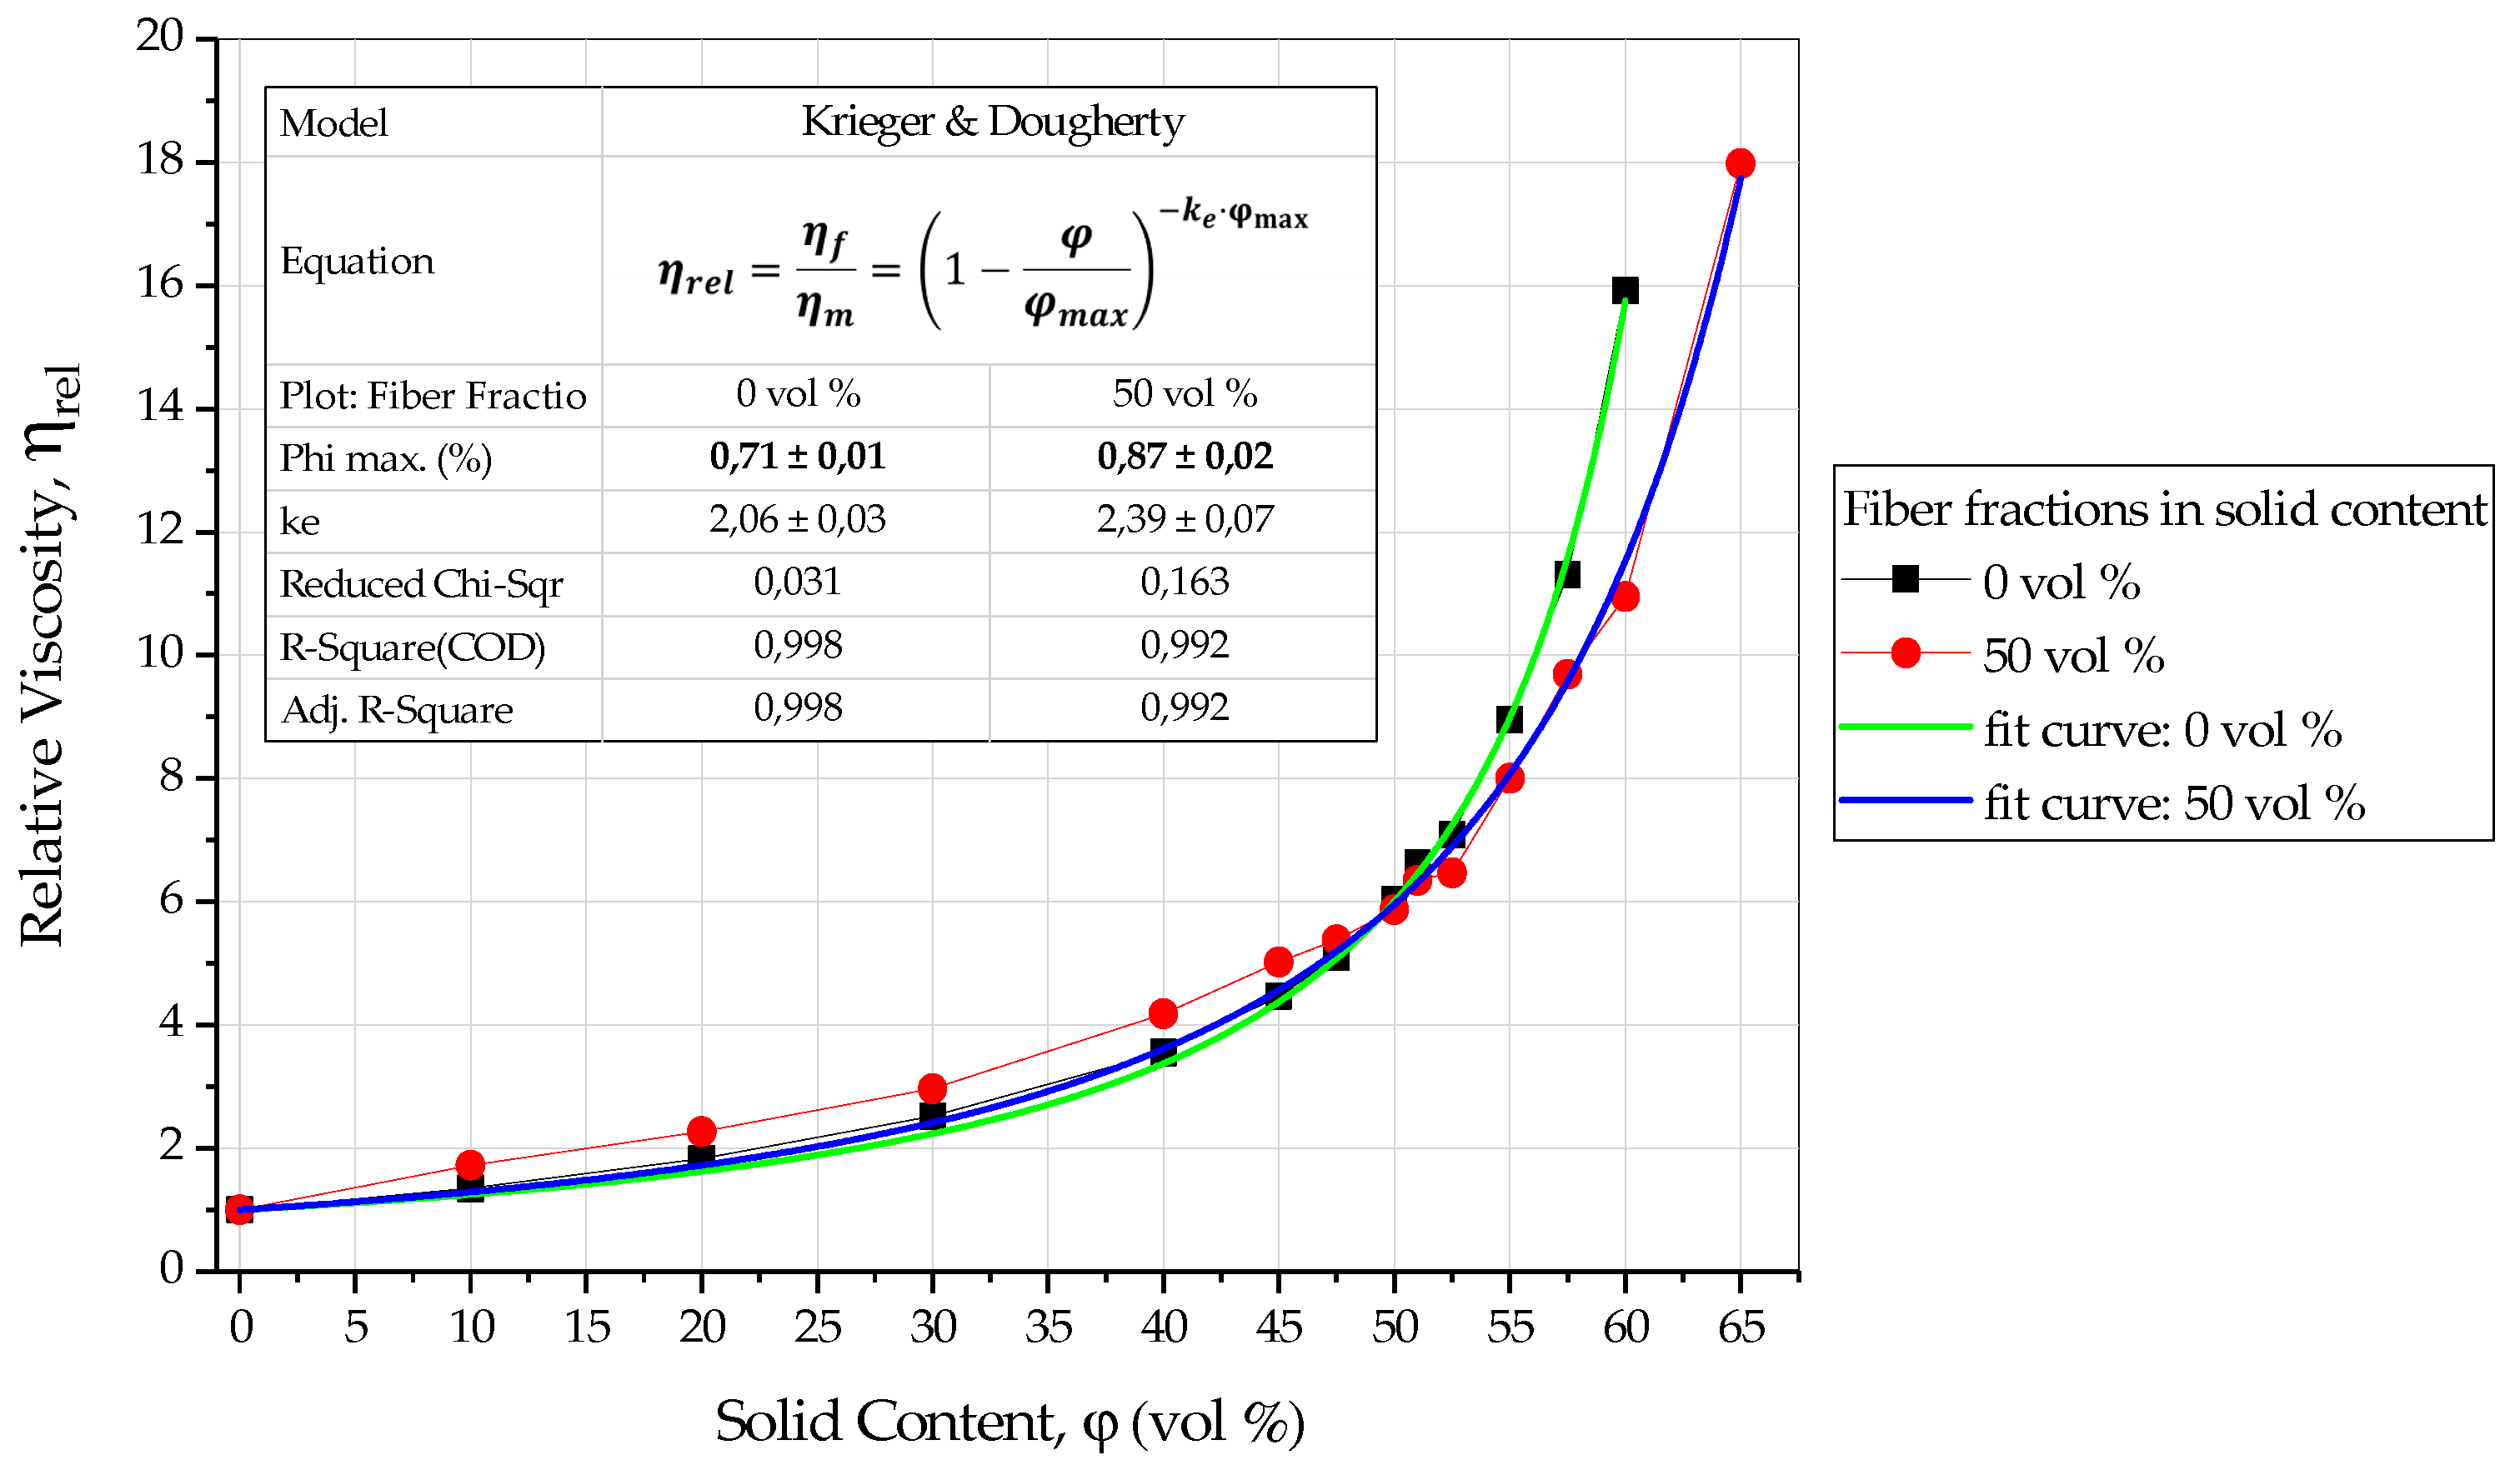
2.5. Investigation of Solid Content in Feedstock

A certain amount of dispersant was defined by previous procedures and, by using this, we prepared feedstocks with 0 to 65 vol % solid content for two variations: first, 0 vol % fibers (standard feedstock), and second, 50 vol % of fibers in the solid content. The results are given and evaluated in terms of the final torque, kneading energy (calculated by using Equation (7)), and rheology, to be able to explain the effects of increasing solid content and to decide on a certain solid content for further investigations. In addition to that, we applied the Krieger and Dougherty model [26], on relative viscosity vs. solid content curve, to define the maximum possible solid content as in Equation (8).
E = 2 · π · f · Δ t i = 1 i = i   m a x M ( t i ) ,
where E, kneading energy (N·m); f, rotational frequency of blades (s−1); M, torque (N·m); Δt, integration time increment (s)
η r e l = η f η m = ( 1 φ φ m a x ) k e · φ m a x ,
where ηrel, relative viscosity (feedstock viscosity divided by matrix viscosity); φ, solid content (vol %); φmax, maximum solid content (vol %); ke, free parameter or intrinsic viscosity (vol %−1); ηf, viscosity of feedstock; ηm, viscosity of binder without solid particles.

2.6. Investigating the Effects of Increasing Fiber Content, Fiber Coating, and Alternative Binding Systems on the Rheological Properties

After setting the dispersant and solid content to constant values, the feedstocks based on polyethylene and paraffin wax without fiber sizing were kneaded for 30 min at 125 °C. Additionally, it is advised to burn out the PVA sizing on the fibers before use, because of possible intermediate processes like prepregging with resin, or insulating applications [27]. In this fundamental work, however, there is no limitation to using the fibers with PVA sizing. This is why these feedstocks were also prepared without heat cleaning the fibers for comparison. Alternatively, we prepared a series of selected PEG-based feedstocks with 0, 30, and 50 vol % fibers, in solid content, for further evaluations. This follows a similar path to the solid content investigations by using final torque, kneading energy, and viscosity.

2.7. Effect of Kneading Time, Temperature, and Binding System on the Fiber Length

Fiber length is one of the most determinant factors, especially as regards the mechanical properties. Therefore, it is essential to investigate the effects of processing parameters and define the critical influences on fiber length for further process improvements. For this purpose, a series of feedstocks were prepared at constant stearic acid, 3.3 mg·m−2, and solid content, 50 vol %, by varying the fiber content (with/out fiber sizing), kneading time and temperature, and binding system. Small samples were taken from different regions of each feedstock, softened on thin glass specimen plates, and pressed lightly with another glass plate, which made the fibers visible on the surface and allowed us to measure them under light microscope. For each variation, there are at least 5 images available. On these images, about 30,000 fiber lengths were measured, in total, to discover the effects of kneading conditions on fiber rupture statistically.

3. Results

3.1. Calculating Stearic Acid and Its Effects

The coverage index C s is dependent on the molecular weight and projected area, and is equal to 2.3 mg·m−2 for stearic acid. At this point, measuring or defining the powder surface area as accurately as possible becomes critical for feedstock development.
One feedstock preparation without fibers contains 88.88 g TM-DAR powder, and the BET surface area is 11.8735 m2·g−1. According to the BET measurements, the surface area of the powder for a given recipe, A T P , equals to 1055.317 m2, and the corresponding amount of stearic acid is 2.43 g by using C s . On the other hand, the BET surface area of the fibers is 0.1201 m2·g−1, so that the total surface area of the fibers, A T F for the feedstock with 50 vol % fibers is 5269 m2, which is much smaller than for the powder. In Table 3, the total stearic acid quantities and the weight fractions of SA for powder and fibers, based on BET measurements, are given for each feedstock with different fiber contents and stearic acid concentrations. It is clear that the required amount of stearic acid for fibers is much lower than for the powder, and varies from 0.25 to 1.03 weight percentage of the total required stearic acid for the relevant feedstock.
Further experiments include investigations on the effects of different dispersant concentrations from 1.1 to 5.5 mg·m−2. The corresponding quantities are given in Table 3.
Increasing the amount of stearic acid has a significant influence up to a certain point, where it reaches a quasi-balance range of the final kneading torques between 2.2 and 3.3 mg·m−2 within standard deviation, because the amount of stearic acid most probably does not increase the wettability and compatibility between powder and binder anymore, as seen in Figure 5 for the paraffin wax-based feedstocks.
Despite the fact that such an amount of stearic acid theoretically cannot coat the whole solid surface, feedstock with 0 vol % fiber and 1.1 mg·m−2 stearic acid has the lowest final torque in its group. The reason could be the inadequate quantity of stearic acid and applied stress to break down the agglomerates during kneading. Since the agglomerates decrease the total surface area, 1.16 g stearic acid could be sufficient to cover the surface of the agglomerates. However, it is not sufficient if the dispersant molecules can diffuse in the agglomerates. On the other hand, without breaking the agglomerates, the powder has a bimodal size distribution behavior, which could also lead to a better packing [28] and flow behavior [29], thus, a decrease in the final kneading torque. The particle size distributions are given in Figure A1 and Figure A2, and correspond to two variations: the powder agglomerates are mixed with alcohol and then attempted to be broken down by ultrasonic bath (UsB) before measurement, or are measured directly. The d50 of the TM-DAR powder without UsB is 17.40 µm whereas, with UsB, it is 0.11 µm.
By adding fibers to feedstocks, there is a general increase in final torques that will be evaluated later. With the presence of fibers, the surface area definitions have become relatively more reliable, because not only do the fibers have significantly lower surface areas than powders but, also, they hold their shape even when they break down into smaller fibers. For example, if all fibers are chopped from 3200 µm into 50 µm, the increase in stearic acid should be less than 1 weight %, because the initial lateral area remains the same, and only the fractured surface areas should be considered. For these reasons, increasing stearic acid improves the flow behavior of the feedstocks with fibers as expected, and 3.3 mg·m−2 is the lowest point for fiber-filled variations.
The viscosities of all variations are represented in Figure 6. The viscosities have not been changed by increasing either the amount of dispersant, the amount of fibers, or both. The reason for this could be that the exchange of paraffin by stearic acid does not result in any change in the linear viscoelastic behavior. This can be explained by the fact that the paraffin wax is an oligomer of polyethylene in its chemical structure, and also acts as a plasticizer. This means that an exchange by stearic acid does not alter the basic rheological behavior of the binder.
By evaluating the viscosity results separately as in Figure A3, the viscosities are higher, at 1.1 mg·m−2, for the fiber-filled feedstocks. At higher SA concentrations, there are only very slight changes. The reason for this is that the paraffin wax-based binder system has almost no polar component (see Table 4) that decreases the adhesion force between binder and the solid content. This could also cause formation of a layer on the surface of the measurement channel, which could cloud at least the effect of an increasing fiber content on the rheological behavior.
Consequently, these results do not mean that 3.3 mg·m−2 is the ultimate concentration for these certain types of powder, fiber, and dispersant combinations. However, it is important to restrict the framework of further experiments, and a concentration of stearic acid of 3.3 mg·m−2 is sufficient to fulfill the requirements.

3.2. Effect of Solid Content

Once the stearic acid quantity has been defined as being constant, the effects of solid content on the final torque (FT) and kneading energy (KE) of different feedstocks were investigated and demonstrated in Figure 7a,b. The experiments included the paraffin wax-based feedstocks without fiber and with 50 vol % fiber content. It is clear that relatively higher torques are needed for the fiber-filled feedstocks to achieve the same rotational speed during kneading, as for the feedstocks without fibers (e.g., ca. 8.1 Nm with fibers vs. 4.8 Nm without fibers at 50 vol % solid content). This behavior changes at a point between 60 and 65 vol %, where the standard feedstock without fibers shows a gradually higher final torque and kneading energy. With increasing solid content in the feedstocks, the corresponding final torques and kneading energies increase with similar exponential growths, because the particle–particle interactions or, in highly fiber filled feedstocks, rather particle–fiber and fiber–fiber interactions, started to dominate the mixtures from a critical solid content instead of polymeric slip layers between particles and fibers, which means an increase in inner friction.
In Figure 8, the solid content dependency of relative viscosity at different shear rates is demonstrated. The figure on the right side represents the focus on a range between approx. 47.5 and 52.5 vol % of solid content, in which feedstocks with and without fibers reach the same viscosity. From that equilibrium point, the feedstocks with 50 vol % fibers in solid content show lower viscosities, and the difference between two variations increases with increasing solid content. Although the torque measurements are available for both feedstocks at 65 vol % solid content, the viscosity of 65 vol % for feedstock without fiber variation could not be measured, which means that the feedstock has reached the infinite viscosity and shows no flow anymore. Additionally, 65 vol % is relatively near to the theoretical maximum filling degree of about 70 vol % (see “Phi max.” for 0 vol % in Figure 9). On the other hand, the viscosity of highly fiber-filled feedstock at 65 vol % solid content could be measured, where the fibers that enable flowability even at higher solid contents [28] [30] most probably are oriented and flow together.
Figure 9 shows that, using OriginPro 2017, the Krieger and Dougherty model was applied to relative viscosity vs. solid content at a shear rate of 30 1/s, that is in between the minimum and maximum shear rates during kneading for specific device conditions [31]. The maximum calculated solid contents are 70.6 vol % ± 0.6 for 0 vol % fibers, and 86.7 vol % ± 2.5 for highly fiber-filled feedstocks. The value for non-fiber feedstock, 70.6%, is under 74%, which is the theoretically highest packing for spherical mono size particles [1], that is expected with an irregular shape and size distribution of TM-DAR powder.
As seen in Figure 8, the curves start to show exponential growth between 45 to 52.5 vol % solid contents for the feedstock without fibers. Additionally, in Figure 9, feedstocks show similar flow behaviors very near to 50 vol %. For these reasons, the further experiments will be done at a 50 vol % filling degree.

3.3. Investigating the Effects of Increasing Fiber Content, Fiber Coating, and Alternative Binding Systems on Rheological Properties

At constant amounts of stearic acid, 3.3 mg·m−2, and a solid content of 50 vol %, further feedstocks were compounded for 30 min at 125 °C (see Table 1) by increasing the fiber content from 0 to 50 vol % in solid fraction with/out PVA sizing variations, and were evaluated in comparison to an alternative binding system based on PEG-4000, as shown in Figure 10. The first thing to note is the generally increasing trend with increasing fiber content. Moreover, all these feedstock variations were produced with relative lower standard deviations that show their reproducibility. This can also be seen in Figure A4.
In general, paraffin wax (PW)-based feedstocks have a lower final torque (4.9 vs. 6.0 N·m) and kneading energy (28.5 vs. 34.9 kN·m) than the PEG-based feedstocks, until they are highly filled with fibers. The final torque and kneading energy values of PW-based feedstocks converge towards 50 vol % of fibers in solid content at 8 N·m and 47 kN·m, respectively, and the effect of PVA sizing is noteworthy only at 30 vol % fibers. Furthermore, the final torques of PEG-based feedstocks do not converge at a certain point, and the amount of PVA sizing increases together with an increasing fiber content, which causes a growing distance between values, in which the feedstocks with PVA have lower final torque values, e.g., 8.49 vs. 7.52 N·m at 50 vol % fibers in solid content. On the other hand, the effect of PVA sizing is not significant for kneading energies, yet the feedstock with PVA has, still, a lower kneading energy. The effect of PVA sizing can also be seen in the viscosity results (see Figure 11).
The differences in viscosity results are prominent between two binding systems. PW-based feedstocks show very similar viscosities, where PVA sizing leads to a slight decrease compared to 0 vol % fiber variations. On the other hand, the PEG-based systems have lower viscosities, as a whole, and the viscosities decrease with increasing fiber content from 182.7 (0 vol %) to 69.5 (50+ vol % (“+” means fibers are used with PVA sizing)) Pa·s at 100 s−1 apparent shear rate within the group. Additionally, the effect of PVA sizing is also apparent in both systems, in which the sizing leads to a decrease in viscosity at different ratios, as shown in Table 5. The PW-based systems show linearity in the viscosity measurements that caused the same percentage of decrease. On the other hand, PEG-based systems tend to change the slope with increasing shear rates, also with PVA sizing. Additionally, it must be considered that the amount of PVA increases with increasing fiber content.
Consequently, the binding system defines the flow characteristics of the feedstock with the intrinsic viscosities and adhesion capabilities of the solid content. In this work, the PEG-based binding system shows lower viscosities than the PW-based system because of higher adhesion forces between the polar matrix of PEG/PVB and the solid particles (both fibers and powder), which probably made the decrease in viscosity recognizable by an increasing fiber content, which is not the case with PW-based systems. Additionally, the sizing on the fibers improves the flowability of feedstocks during mixing and rheological investigations.

3.4. Effects of Kneading Time, Temperature, and Binding System on the Fiber Length

The feedstock preparation steps definitely have an effect on the fiber length. This becomes apparent due to the applied stresses on the fibers and particle–fiber and fiber–fiber collisions, especially during kneading. Through several kneading sessions, the PW-based feedstocks with 30 and 50 vol % fibers in solid content under kneading conditions as in Table 2, and PEG-based feedstocks with 30 and 50 vol % fibers in solid content for 30 min at 125 °C, were compounded. The fiber lengths were measured on the images of lightly pressed specimen from each variation, as shown in Figure 12.
Along with fiber length measurements, the effect of PVA sizing was investigated qualitatively on the same images. The fibers were produced and delivered in bundles with PVA, as shown in Figure 13; the PVA grade is kept secret by the company. As a result of this, the material properties of PVA, e.g., the melting temperature which is normally in the range of 150 to 230 °C, are unknown. The compounding temperature of 125 °C is normally not enough to melt the sizing, and could lead to fiber bundles being preserved and orientated as clusters (see Figure 14). Analyses of the images showed that the fiber clusters or bundles were dispersed and relatively homogeneously mixed with the binder. The reason could be that the mixing temperature was high enough to soften the PVA and, together with the physical load in the mixing chamber, the PVA could not hold fibers together anymore and was mixed with the binder.
Figure 14 demonstrates the mean values of fiber lengths with standard deviation versus feedstock and process parameters, including fiber content, presence of fiber sizing, kneading temperature and time, and alternative binding system. The maximum and minimum fiber lengths were also added to the diagram for comparison. In general, the concept of kneading ruptured the fibers from 3200 µm to ~300 µm, which were also in the region of 50 to 500 µm, as given in the literature for injection molding of short fiber-reinforced polymers [8]. This led us to expect further breakage during injection molding down to 100 µm or lower. It is also noticeable, for both binding systems, that the increase in fiber amount lead to a decrease in fiber length, from ca. 300 to 200 µm. However, the fiber lengths are slightly higher in PEG-based systems. On the other hand, increased kneading temperature and time show almost no effect on the fiber length. For these reasons, the processing parameters were fixed at 125 °C and 30 min kneading temperature and time during feedstock production for injection molding experiments.

4. Conclusions

There are several previous works defining the amount of dispersant and solid content in terms of powder injection molding by using various types of powders, like zirconia, alumina, or steel powders. However, there are almost no theoretical or experimental investigations with ceramic short fibers used in powder injection molding processes, in which the effects of dispersant and solid content are significantly high. This paper attempts to define the bounds for processing of different fiber-filled feedstocks by using experimental results.
Initially, the amount of stearic acid at 3.3 mg·m−2 and a solid content at 50 vol % were defined as being constant by systematic experiments. After the fundamental parameters were defined, an investigation was done to discover the effects of fiber content, fiber sizing, and alternative binding system on kneading, viscosity, and fiber length. The feedstocks are highly reproducible according to the kneading behaviors, in which the effect of the fiber presence became more significant after 30 vol % fibers in solid content, because of lacking orientation in the kneading chamber and increased fiber–fiber contacts.
In addition to that, PEG4000-based feedstocks have higher final torques and kneading energies, except for 50 vol % fibers in solid content, in contrast to their lower viscosities than paraffin wax-based feedstocks. The PEG–PVB system has certain advantages in terms of powder injection molding, like water solubility (environmentally friendly), elimination of powder–binder segregation according to previous works, and relatively lower viscosities or, alternatively, lower working temperatures. The reason for this could be better adhesion of the binder on alumina powder and fibers. The results of PEG-based systems steered us to some positive impressions, but it is still necessary to investigate the effects of dispersant and solid content for this binder system separately, by following a similar path. On the other hand, PVA sizing provides some improvements on rheology.
At the end of the processing chain, the fiber lengths are measured, which is one of the most important parameters for the end product, providing the fracture toughness and quasi-ductility properties to ceramic matrix composites and, unfortunately, having experienced a high degree of rupture through processing. Future mechanical characterizations could reveal the importance of fiber length, as stated in the literature, for short fiber-reinforced polymers [32,33].
Consequently, the processing parameters of kneading were defined for TM-DAR Al2O3 powder and chopped Al2O3 Nextel 610 fiber combinations at 125 °C 30 min and 50 vol % solid content. Thus, producing feedstocks was defined within a relatively narrow scope for further experiments on injection molding, in terms of process parameterizing and fiber orientation control, because there were limitations to time and material.

Author Contributions

Designing and performing experiments, visualization and writing, H.M.T.; supervision and writing—editing, T.H. and V.P.; material preparation, D.S.

Funding

This research (PI363/7-1) is funded by DFG and was partly carried out with the support of the Karlsruhe Nano Micro Facility (KNMF, www.knmf.kit.edu), the Helmholtz Research Infrastructure at Karlsruhe Institute of Technology (KIT, www.kit.edu).

Acknowledgments

We are also grateful to Margarete Offermann and Christina Odemer (Institute for Applied Materials—Ceramic Materials and Technologies, Karlsruhe Institute of Technology) for the particle size and distribution, BET and DSC analyses.

Conflicts of Interest

The authors declare no conflict of interest.

Appendix A

Figure A1. Particle size distribution without applying ultrasonic bath dispersion.
Jmmp 03 00009 g0a1
Figure A2. Particle size distribution applying ultrasonic bath dispersion.
Jmmp 03 00009 g0a2
Figure A3. Separate representation of the viscosities of different feedstocks with increasing fiber content and stearic acid.
Jmmp 03 00009 g0a3
Figure A4. Reproducibility of different feedstocks with different binders and increasing amount of fibers.
Jmmp 03 00009 g0a4

References

  1. Mutsuddy, B.C.; Ford, R.G. Ceramic Injection Molding, 1st ed.; Chapman & Hall: London, UK, 1995. [Google Scholar]
  2. Moritz, T.; Lenk, R. Ceramic injection moulding: A review of developments in production technology, materials and applications. Powder Inject. Mould. Int. 2009, 3, 23–34. [Google Scholar]
  3. Schmücker, P.M.M. All-Oxide Ceramic Matrix Composites with porous Matrices. In Ceramic Matrix Composites; Krenkel, W., Ed.; Wiley-VCH Verlag: Weinheim, Germany, 2008; pp. 205–229. [Google Scholar]
  4. Bose, A. Injection Molding of Metals and Ceramics; Metal Powder Industries Federation: Princeton, NJ, USA, 1997. [Google Scholar]
  5. German, R.M. Powder Injection Molding—Design & Applications; Innovative Material Solutions Inc.: State College, PA, USA, 2003. [Google Scholar]
  6. Abach, A.; Ehrenstein, G.W. Mehrkomponentenpulverspritzgießen von Al2O3 und funtionisiertem Al2O3. Available online: https://www.kunststoffe.de/fachinformationen/zeitschrift-kunststofftechnik/artikel/mehrkomponentenpulverspritzgiessen-von-al2o3-und-funktionalisiertem-al2o3-548874.html (accessed on 28 October 2018).
  7. Pötsch, G.; Michaeli, W. Metal/Ceramic Powder Injection Molding. In Injection Molding an Introduction, 2nd ed.; Carl Hanser Verlag: Munich, Germany, 2008; p. 230. [Google Scholar]
  8. Advani, S.G.; Sozer, E.M. Overview of Manufacturing Processes—Injection Molding. In Process Modeling in Composites Manufacturing, 2nd ed.; CRC Press: Boca Raton, FL, USA, 2011; p. 31. [Google Scholar]
  9. Chou, C.-C.; Senna, M. Correlation between rheological behavior of aqueous suspensions of alumina and properties of cast bodies: Effect of dispersant and ultrafine powders. Am. Ceram. Soc. Bull. 1987, 66, 1129–1133. [Google Scholar]
  10. Chang, S.H.; Hwang, J.R.; Doong, J.L. Manufacturing Process Optimization of Short Glass Fiber Reinforced Polycarbonate Composites in Injection Molding. J. Reinf. Plast. Compos. 2000, 19, 301–321. [Google Scholar] [CrossRef]
  11. Chen, C.S.; Chen, T.J.; Chen, S.C.; Chien, R.D. Optimization of the injection molding process for short-fiber-reinforced composites. Mech. Compos. Mater. 2011, 47, 359–368. [Google Scholar] [CrossRef]
  12. Franciszczak, P.; Piesowicz, E.; Kalniņš, K. Manufacturing and properties of r-PETG/PET fibre composite—Novel approach for recycling of PETG plastic scrap into engineering compound for injection moulding. Compos. Part B Eng. 2018, 154, 430–438. [Google Scholar] [CrossRef]
  13. Mathurosemontri, S.; Uawongsuwan, P.; Nagai, S.; Hamada, H. The Effect of Processing Parameter on Mechanical Properties of Short Glass Fiber Reinforced Polyoxymethylene Composite by Direct Fiber Feeding Injection Molding Process. Energy Procedia 2016, 89, 255–263. [Google Scholar] [CrossRef] [Green Version]
  14. Matsuoka, T.; Takabatake, J.-I.; Inoue, Y.; Takahashi, H. Prediction of fiber orientation in injection molded parts of short-fiber-reinforced thermoplastics. Polym. Eng. Sci. 1990, 30, 957–966. [Google Scholar] [CrossRef]
  15. Sánchez-Sánchez, X.; Elias-Zuñiga, A.; Hernández-Avila, M. Processing of ultra-high molecular weight polyethylene/graphite composites by ultrasonic injection moulding: Taguchi optimization. Ultrason. Sonochem. 2018, 44, 350–358. [Google Scholar] [CrossRef] [PubMed]
  16. Sathishkumar, T.P.; Satheeshkumar, S.; Naveen, J. Glass fiber-reinforced polymer composites—A review. J. Reinf. Plast. Compos. 2014, 33, 1258–1275. [Google Scholar] [CrossRef]
  17. Tseng, H.-C.; Chang, R.-Y.; Hsu, C.-H. Improved fiber orientation predictions for injection molded fiber composites. Compos. Part A-Appl. Sci. Manuf. 2017, 99, 65–75. [Google Scholar] [CrossRef]
  18. Yan, X.; Cao, S. Structure and interfacial shear strength of polypropylene-glass fiber/carbon fiber hybrid composites fabricated by direct fiber feeding injection molding. Compos. Struct. 2018, 185, 362–372. [Google Scholar] [CrossRef]
  19. Francois, C. CMC Materials for Space and Aeronautical Applications. In Ceramic Matrix Composites; Krenkel, W., Ed.; Wiley-VCH Verlag: Weinheim, Germany, 2008; pp. 327–351. [Google Scholar]
  20. Gerendas, K.T.M.; Cadoret, Y.; Wilhelmi, C.; Machry, T.; Knoche, R.; Behrendt, T.; Aumeier, T.; Denis, S.; Göring, J.; Koch, D.; et al. Improvement of oxide/oxide CMC and development of combustor and turbine components in the HIPOC program. In Proceedings of the ASME 2011 Turbo Expo: Turbine Technical Conference and Exposition, Vancouver, BC, Canada, 6–10 June 2011. [Google Scholar]
  21. Parlier, M.; Ritti, M.; Jankowiak, A. Potential and perspectives for oxide/oxide composites high temperature materials potential and perspectives for oxide/oxide composites. J. Aerosp. Lab. 2011, 1, 1–12. [Google Scholar]
  22. Zok, F.W. Developments in oxide fiber composites. J. Am. Ceram. Soc. 2006, 89, 3309–3324. [Google Scholar] [CrossRef]
  23. Edirisinghe, M.J. The effect of processing additives on the properties of a ceramic-polymer formulation. Ceram. Int. 1991, 17, 89–96. [Google Scholar] [CrossRef]
  24. Weber, O. Wasserlösliche Bindersysteme Zum Minimieren Von Pulver-Binder-Segregationsefekten Im Mikropulverspritzguss. Ph.D. Thesis, Albert Ludwigs University of Freiburg, Freiburg im Breisgau, Germany, 2015. [Google Scholar]
  25. Li, Y.M.; Liu, X.Q.; Luo, F.H.; Yue, J.L. Effects of surfactant on properties of MIM feedstock. Trans. Nonferr. Met. Soc. China 2007, 17, 1–8. [Google Scholar] [CrossRef]
  26. Krieger, I.M.; Dougherty, T.J. A Mechanism for Non-Newtonian Flow in Suspensions of Rigid Spheres. Trans. Soc. Rheol. 1959, 3, 137–152. [Google Scholar] [CrossRef]
  27. 3M Ceramic Textiles and Composites. NextelTM Ceramic Textiles Technical Notebook; No. 98-0400-5870-7; 3M Ceramic Textiles and Composites: Maplewood, MN, USA, 2004. [Google Scholar]
  28. German, R.M. Particle Packing Density. In Powder Injection Molding, 1st ed.; Metal Powder Industries Federation: New York, NY, USA, 1990; pp. 23–60. [Google Scholar]
  29. Chang, C.; Powell, R.L. Effect of particle size distributions on the rheology of concentrated bimodal suspensions. J. Rheol. 1994, 38, 85–98. [Google Scholar] [CrossRef]
  30. Ranganathan, S.; Advani, S.G. Characterization of orientation clustering in short-fiber composites. J. Polym. Sci. Part B Polym. Phys. 1990, 28, 2651–2672. [Google Scholar] [CrossRef]
  31. Schramm, G. A Practical Approach to Rheology and Rheometry, 2nd ed.; Thermo Electron (Karlsruhe) GmbH: Karlsruhe, Germany, 2004. [Google Scholar]
  32. Fu, S.-Y.; Lauke, B. Effects of fiber length anf fiber orientation distributions on the tensile strength of short-fiber-reinforced polymers. Compos. Sci. Technol. 1996, 56, 1179–1190. [Google Scholar] [CrossRef]
  33. Fu, S.Y.; Hu, X.; Yue, C.Y. Effects of Fiber Length and Orientation Distributions on the Mechanical Properties of Short-Fiber-Reinforced Polymers. Mater. Sci. Res. Int. 1999, 48, 74–83. [Google Scholar] [CrossRef]
Figure 1. (a) The reinforcement mechanisms for continuous-fiber ceramic composites. (b) Using a fiber coating to create a weak interface, (c) creating a weak matrix through fine-scale matrix porosity, and (d) using fugitive coatings that will be volatilized by oxidation and leave a narrow space between the fiber and matrix, as described in [22].
Jmmp 03 00009 g001
Figure 2. Example of kneading results and three main zones: filling (left), kneading (middle), and equilibrium (right).
Jmmp 03 00009 g002
Figure 3. Idealized coverage model of the dispersant on spherical powder [25].
Jmmp 03 00009 g003
Figure 4. (a) Cross-sectional SEM image of a Nextel 610® aluminum oxide fiber, (b) SEM image of TM-DAR® aluminum oxide powder.
Jmmp 03 00009 g004
Figure 5. Effect of increasing stearic acid on various paraffin wax-based feedstocks with increasing fiber content.
Jmmp 03 00009 g005
Figure 6. Viscosity results of all feedstock variations in terms of stearic acid investigations.
Jmmp 03 00009 g006
Figure 7. Effect of increasing solid content on (a) final kneading torque and (b) kneading energy.
Jmmp 03 00009 g007
Figure 8. Relative viscosities for different shear rates versus solid content for the feedstocks with 0 and 50 vol % fibers in solid content.
Jmmp 03 00009 g008
Figure 9. Application of Krieger and Dougherty model for defining the maximum possible solid content in the feedstocks with 0 and 50 vol % fibers in solid content.
Jmmp 03 00009 g009
Figure 10. Comparison of final kneading torques and kneading energies depending on the amount of fibers in solid content, the presence of PVA sizing, and the binding system used.
Jmmp 03 00009 g010
Figure 11. The viscosities of feedstocks with two binding systems and increasing amounts of fibers with/out PVA sizing at 160 °C.
Jmmp 03 00009 g011
Figure 12. An example image of lightly pressed paraffin wax-based feedstock with 50 vol % of fibers in solid content for measuring the fiber length.
Jmmp 03 00009 g012
Figure 13. SEM image of fiber bundles with PVA sizing as delivered.
Jmmp 03 00009 g013
Figure 14. Fiber lengths versus different processing conditions and binding systems.
Jmmp 03 00009 g014
Table 1. General kneading settings.
ParameterValueUnit
Kneading temperature125°C
Kneading time30min
Table 2. Kneading settings for fiber length measurements.
Kneading Temperature (°C)Kneading Time (min)
12530
12560
16030
16060
Table 3. The stearic acid quantities based on BET measurements for various feedstocks, and the weight fractions for powder and fibers.
*F: FractionVolume Fraction of Fibers in Solid Content in vol %
0203050
Stearic acid (SA) concentrations in mg·m−21.1Total SA in Feedstockg1.160.930.820.59
*F Powderweight %10099.7599.6498.98
*F Fiberweight %00.250.361.02
2.2Total SA in Feedstockg2.291.861.631.17
*F Powderweight %10099.7599.5798.97
*F Fiberweight %00.250.431.03
3.3Total SA in Feedstockg3.482.792.451.76
*F Powderweight %10099.7599.5999.03
*F Fiberweight %00.250.410.97
4.4Total SA in Feedstockg4.643.723.262.35
*F Powderweight %10099.7599.5799.02
*F Fiberweight %00.250.430.98
5.5Total SA in Feedstockg5.804.664.082.93
*F Powderweight %10099.7499.5899.01
*F Fiberweight %00.260.420.99
Table 4. The surface energies calculated from the measured contact angles for the individual samples, including polar and disperse components.
SpecimenDisperse Component (mN·m−1)Polar Component (mN·m−1)
TM-DAR Powder37.0026.78
Nextel 610 Fiber25.5121.53
Paraffin Wax-based Binder23.170.10
PEG4000-based Binder30.9322.11
Table 5. The effect of PVA sizing on viscosities of different feedstock combinations.
BinderFiber ContentShear RateDecrease in Viscosity in the Presence of PVA SizingBinderFiber ContentShear RateDecrease in Viscosity in the Presence of PVA Sizing
s−1% s−1%
PW-based3010013.4PEG-based3010019.9
100013.4100010.7
5010015.85010021.4
100015.8100041.1

