Article

A Control Method for the Ultrasonic Spot Welding of Fiber-Reinforced Thermoplastic Laminates through the Weld-Power Time Derivative

1
BMW Group, 80788 Munich, Germany
2
Institute of Lightweight Engineering and Polymer Technology (ILK), Technische Universität Dresden, 01307 Dresden, Germany
*
Author to whom correspondence should be addressed.
J. Manuf. Mater. Process. 2019, 3(1), 1; https://doi.org/10.3390/jmmp3010001
Submission received: 24 October 2018 / Revised: 18 December 2018 / Accepted: 24 December 2018 / Published: 30 December 2018

Abstract

:
It was found that the ultrasonic spot welding may serve as an efficient method to join relative large thin-walled parts made of fiber-reinforced thermoplastics. In this study, a new control method for the ultrasonic spot-welding process was investigated. It was found that, when welding fiber-reinforced thermoplastic laminates without energy directors, overheating and decomposition of the polymer at the weld spot occurred. The occurrence of the overheating took place at unpredictable times during welding. It was observed that the time trace of the consumed power curve by the welder follows a similar pattern as the time trace of the temperature in the weld spot center. Based on this observation, a control system was developed. The time derivative of the welder power was monitored in real time and, as soon as it exceeded a critical value, the ultrasonic vibration amplitude was actively adjusted through a microcontroller. The controlling of the ultrasonic welding process forced the temperature in the weld spot to remain in an adequate range throughout the welding duration for the polymer diffusion to occur. The results of the controlled welding process were evaluated by means of weld temperature measurements, computed tomography scans, and microscopic analysis of the weld spot fracture surfaces.

1. Introduction

The well-established methods used in joining of fiber-reinforced polymers in general are mechanical fastening, adhesive bonding, and fusion bonding (sometimes referred to as welding) [1,2]. From the many already existing welding technologies for fiber-reinforced thermoplastics, a remarkable one is ultrasonic welding [3]. Mechanical vibrations with a frequency above the audible spectrum (usually between 20 kHz and 45 kHz) are applied through a metallic horn on the work-piece accompanied by static pressure. The vibrations cause intensive intermolecular and boundary friction heating at and around the joint interface, which in turn heats up locally and rapidly until the polymer diffusion temperature is exceeded; then, the vibrations are stopped and the joint is healed under static pressure [4].
In practice, energy directors are intentionally inserted in the weld interface at the required joint location to focus the ultrasonic vibration energy [4]. Benatar and Gutowski [5] investigated the ultrasonic welding process of carbon fiber-reinforced polyetheretherketone (PEEK) with the presence of energy directors. They concluded in their work that a good bond quality was achieved when the melt fronts of the adjacent energy directors met. This event was traced by the quick rise in the welder power. However, molding of the energy directors on relatively large thin-walled and thermoformed thermoplastic sheet laminates demands additional processing steps, which might be undesirable in high-volume-production [2]. Villegas [6] investigated an ultrasonic welding approach, in which a neat polymer thin film was placed separately in the weld interface as a flat energy director. To monitor the process, the displacement and power curves of the welder were used. The energy-directing approach using thin-film placement in the weld interface was expanded to include continuous ultrasonic seam welding of stiff thermoplastic composites plates [7]. Li et al. [8] investigated a spot welding method through focusing the ultrasonic energy between the mating fiber-reinforced thermoplastic plates with the absence of the energy directors. It was found that applying high static welding forces during the weld initiation stage helps concentrate the ultrasonic energy at the desired spot under the horn and improve the weld strength, and may eliminate the melting at the contact edges. Zhi et al. [9] monitored the quality of the ultrasonic welds done without energy directors between carbon fiber-reinforced thermoplastic plates through the horn displacement and dissipated power. The welding process was analyzed using temperature measurements by placing K-type thermocouples at the weld interface and the horn contact interface. A similar approach was used in Reference [10]. Grewell [11] reported in research on the ultrasonic welding of neat thermoplastic parts that the joint quality can be enhanced when using a well-defined weld force and amplitude profile during the ultrasonic welding. Fischer et al. [12] implemented the welder energy to determine the end of the weld process when welding thermoplastic plies during a fully automated patch-preforming. Several methods for controlling and monitoring the ultrasonic welding process were proposed and investigated in the past decades; however, the need for an active process control system is essential.
It is known that the heat generation during the ultrasonic spot welding of thermoplastics or thermoplastic composites without energy directors or through thin-film energy directors is dominated in the initial stages by friction energy dissipation. At the following stages, the friction energy dissipation gradually diminishes, and heating due to viscoelastic dissipation dominates [6,9,13]. Ideally, it may be assumed that the energy dissipated by friction is converted to heat. The generated heat flux by the friction movement may be averaged to the amount of energy dissipated per unit time per unit area q ˙ f r i c . Nevertheless, the hammering effect α should be introduced to the equation [14]. The hammering effect represents the average portion of the cycle in which the horn applies the displacement on the laminates. If the interfacial friction is considered to be Coulomb damping, then the amount of energy dissipated q ˙ f r i c per unit area is the result of the relative movement amplitude u 0 multiplied by the interfacial pressure amplitude σ 0 and the friction coefficient μ (given in Equation (1)). The viscoelastic heating may be taken from literature as the dissipated energy by viscoelastic damping [5,13,14,15,16]. This heat q ˙ v i s c is volumetric and may be resembled by the loss modulus of the viscoelastic material E multiplied with the square of the strain amplitude ε 0 , and is given in Equation (2) [17,18].
q ˙ f r i c = α 2 μ ω π u 0 σ 0
q ˙ v i s c = α 2   ω E ε 0 2 2
In this work, a welding method without energy directors was used. The ultrasonic spot welding configuration is eligible for the automated application of spot welds on large thermoplastic composite thin-walled parts. One of the main problems, which often occurs during the ultrasonic welding of fiber-reinforced thermoplastic laminates without energy directors, is the unpredictable overheating and consequent decomposition of the matrix at the weld spot. The randomness of the overheating leads to a lack in process stability. This overheating occurs because there is no sufficient matrix in the weld zone to flow and carry the excessive heat away. In the case of welding the composite parts with energy directors, as soon as the temperature exceeds the melting (softening) temperature of the energy director, the melt fronts flow and carry the heat away from the weld zone [15,19]. However, in the case of spot welding without energy directors, the rate of flow of the matrix becomes lower than the rate of heating. As a result, the weld spot reaches decomposition temperatures rapidly and unexpectedly. To overcome this drawback, an algorithm for a logical weld-process control method was developed and its influence on the weld spot overheating was investigated.

2. Material and Methods

2.1. The Ultrasonic Spot Welding Configuration

The ultrasonic spot welding was done without energy directors in the interface; the energy focusing was achieved by applying the welds amid a flat-end anvil and a flat-end ultrasonic horn. The anvil and the horn had circular contact to the welded parts, in which the anvil had a smaller contact diameter D a with the welded parts than the horn D h . A combination of a relative high static weld force [8] and the geometry of the anvil/horn ends facilitate the focusing of the ultrasonic energy at a spot in the weld interface. The configuration of the ultrasonic welding is given in Figure 1; a detailed view of the horn/anvil ends and the essential dimensions are illustrated in the detail view.
One of the main problems which was observed during the ultrasonic spot welding of fiber-reinforced thermoplastic laminates without energy directors was overheating and thermal decomposition of the thermoplastic matrix in the weld interface. It was observed that, at an unpredictable time, the temperature in the weld spot rose very rapidly and exceeded the thermal decomposition temperature of the matrix. The decomposition of the matrix caused defects in the weld spot in the form of cavities, delamination, and gas entrapments, which in turn reduced the quality and strength of the weld spot. To avoid overheating and create a uniform weld spot, a control method was essential.

2.2. The Process Controlling Hypothesis

The power consumed by the ultrasonic welder P(t) during the ultrasonic spot welding follows, in most cases, a typical time-trace pattern, which is plotted as the solid line in Figure 2. Parallel to it, plotted as the broken line, is the temperature curve measured in the center of the spot weld. The plots illustrated in Figure 2 are real measurements which belong to a single ultrasonic spot weld.
By observing the temperature and the power curve patterns, one might clearly notice that the weld power P(t) and the weld center temperature T(t) have a clear correlation. In the weld initiation phase, the power and the temperature curves rise rapidly; then, at a transition phase, the temperature and the power curves undergo only slight changes. At a certain instance of time, both curves show an abrupt rise before stabilizing again. This second rise of the temperature leads to the decomposition of the matrix at the weld spot. A similar observation was made by Tolunay [19] while measuring the temperature in the interface of two disc-shaped specimens during ultrasonic welding.
It was assumed in this work that, if the second rise of the power curve is prevented, then this may prevent the sudden increase in temperature up to the decomposition zone. It may lead instead to the stabilization of the temperature and, consequently, the weld spot will have sufficient time in the optimum temperature zone to undergo a uniform diffusion process. The prevention of the second rise of temperature was achieved by means of monitoring the power time derivative in real-time. If the derivative in the expected time period exceeded a certain pre-set value, then the applied vibration displacement amplitude was reduced. The pre-set power derivative value to trigger the amplitude drop and the amount of amplitude drop were determined experimentally.
It was reported that the power P(t) consumed by the weld is the sum of the total power dissipated in the welded material as heat through friction and viscoelastic mechanisms plus the power lost in the rig and system [6,14]. The viscoelastic dissipated power is a function of the square of the strain amplitude (Equation (2)) and, thus, a function of the square of the deformation amplitude [15]. The friction heating on the other hand is a function of the average slippage amplitude in the weld interface u 0 and both components of the interfacial pressure amplitude σ 0 , which are the average static interfacial pressure σ s t a t i c and the average dynamic interfacial pressure amplitude σ d y n 0 . By a closer observation of the friction dissipation (Equation (1)), both the slippage and the dynamic pressure are functions of the displacement amplitude A0. Thus, the friction power dissipation becomes a function of the square of the ultrasonic vibration amplitude. The parameters and variables which correlate with q ˙ f r i c are given in Equation (3) and the parameters which correlate with q ˙ v i s c are given in Equation (4). The variables which mainly influence the dissipated or consumed power are given in Equation (5).
q ˙ f r i c ( u 0 , σ d y n 0 , σ s t a t i c , ω ) ( A 0 2 , σ s t a t i c , ω ) ;
q ˙ v i s c ( ε 0 2 , ω ) ( A 0 2 , ω ) ;
P ( t ) ( q ˙ f r i c , q ˙ v i s c ) ( A 0 2 , σ s t a t i c , ω ) .
In this discussion, only the adjustable variables were taken into consideration. The static pressure (the static welding force), in addition to its influence on the friction heating, influences the heating rate through effecting the hammering effect as reported in References [14,15]. Therefore, adjusting it might give unpredictable influence on the power dissipation. The frequency is assumed by several researchers to be used as a weld control input because it is in a linear correlation with the weld power; however, this in turn is constant in the given welder and can only be adjusted in a narrow range. Therefore, to control the weld power P(t), the active adjusting of the vibration amplitude is most applicable to the design of the control system.

2.3. The Control System and Instruments

The control system used for the experimental study was attained by connecting an external microcontroller through a commercial high-speed digital amplifier/data recorder to the main welder controller. The latter in turn was the standard built-in controller of the ultrasonic generator. The used weld generator was capable of outputting a nominal maximum power of 2400 W with a nominal mean frequency of 30 kHz. The ultrasonic stack consisted of a 30-kHz converter, a 1.5:1 titanium booster and a 4:1 steel stepped flat-end horn. The horn-end had a diameter of Dh = 18 mm and the anvil had a diameter of Da = 10 mm. The anvil was constructed in a way that it had a natural frequency of about 42 kHz to avoid resonance vibrations within the rig.
According to the laser vibrometer measurements, the stack provided a maximum base-to-peak displacement amplitude A100% = 0.028 mm at the horn-end. The displacement amplitude at the end of the horn could be adjusted through the internal controller of the welder in terms of percentage from the maximum available amplitude A = 100 A0/A100%. During welding, it can be varied through an external analog signal; a 10-V analog signal from the external controller sent to the generator corresponds to A = 0% amplitude and 0 V corresponds to A = 100%. The welder generator can provide, in real time, the consumed electrical power value as an analog output signal in the range of 0–10 V, where 0 V corresponds to 0 W and 10 V corresponds to the maximum welder power of 2400 W.
The measurement and amplification unit consisted of a temperature signal amplification module, an amplification module for input signals, an amplification module for the output signals, and a data recorder. The sample rate at which the measurement unit was operated at was 300 Hz. The implemented controlling unit was a commercial programmable microcontroller. The wiring and connections are schematically illustrated in 
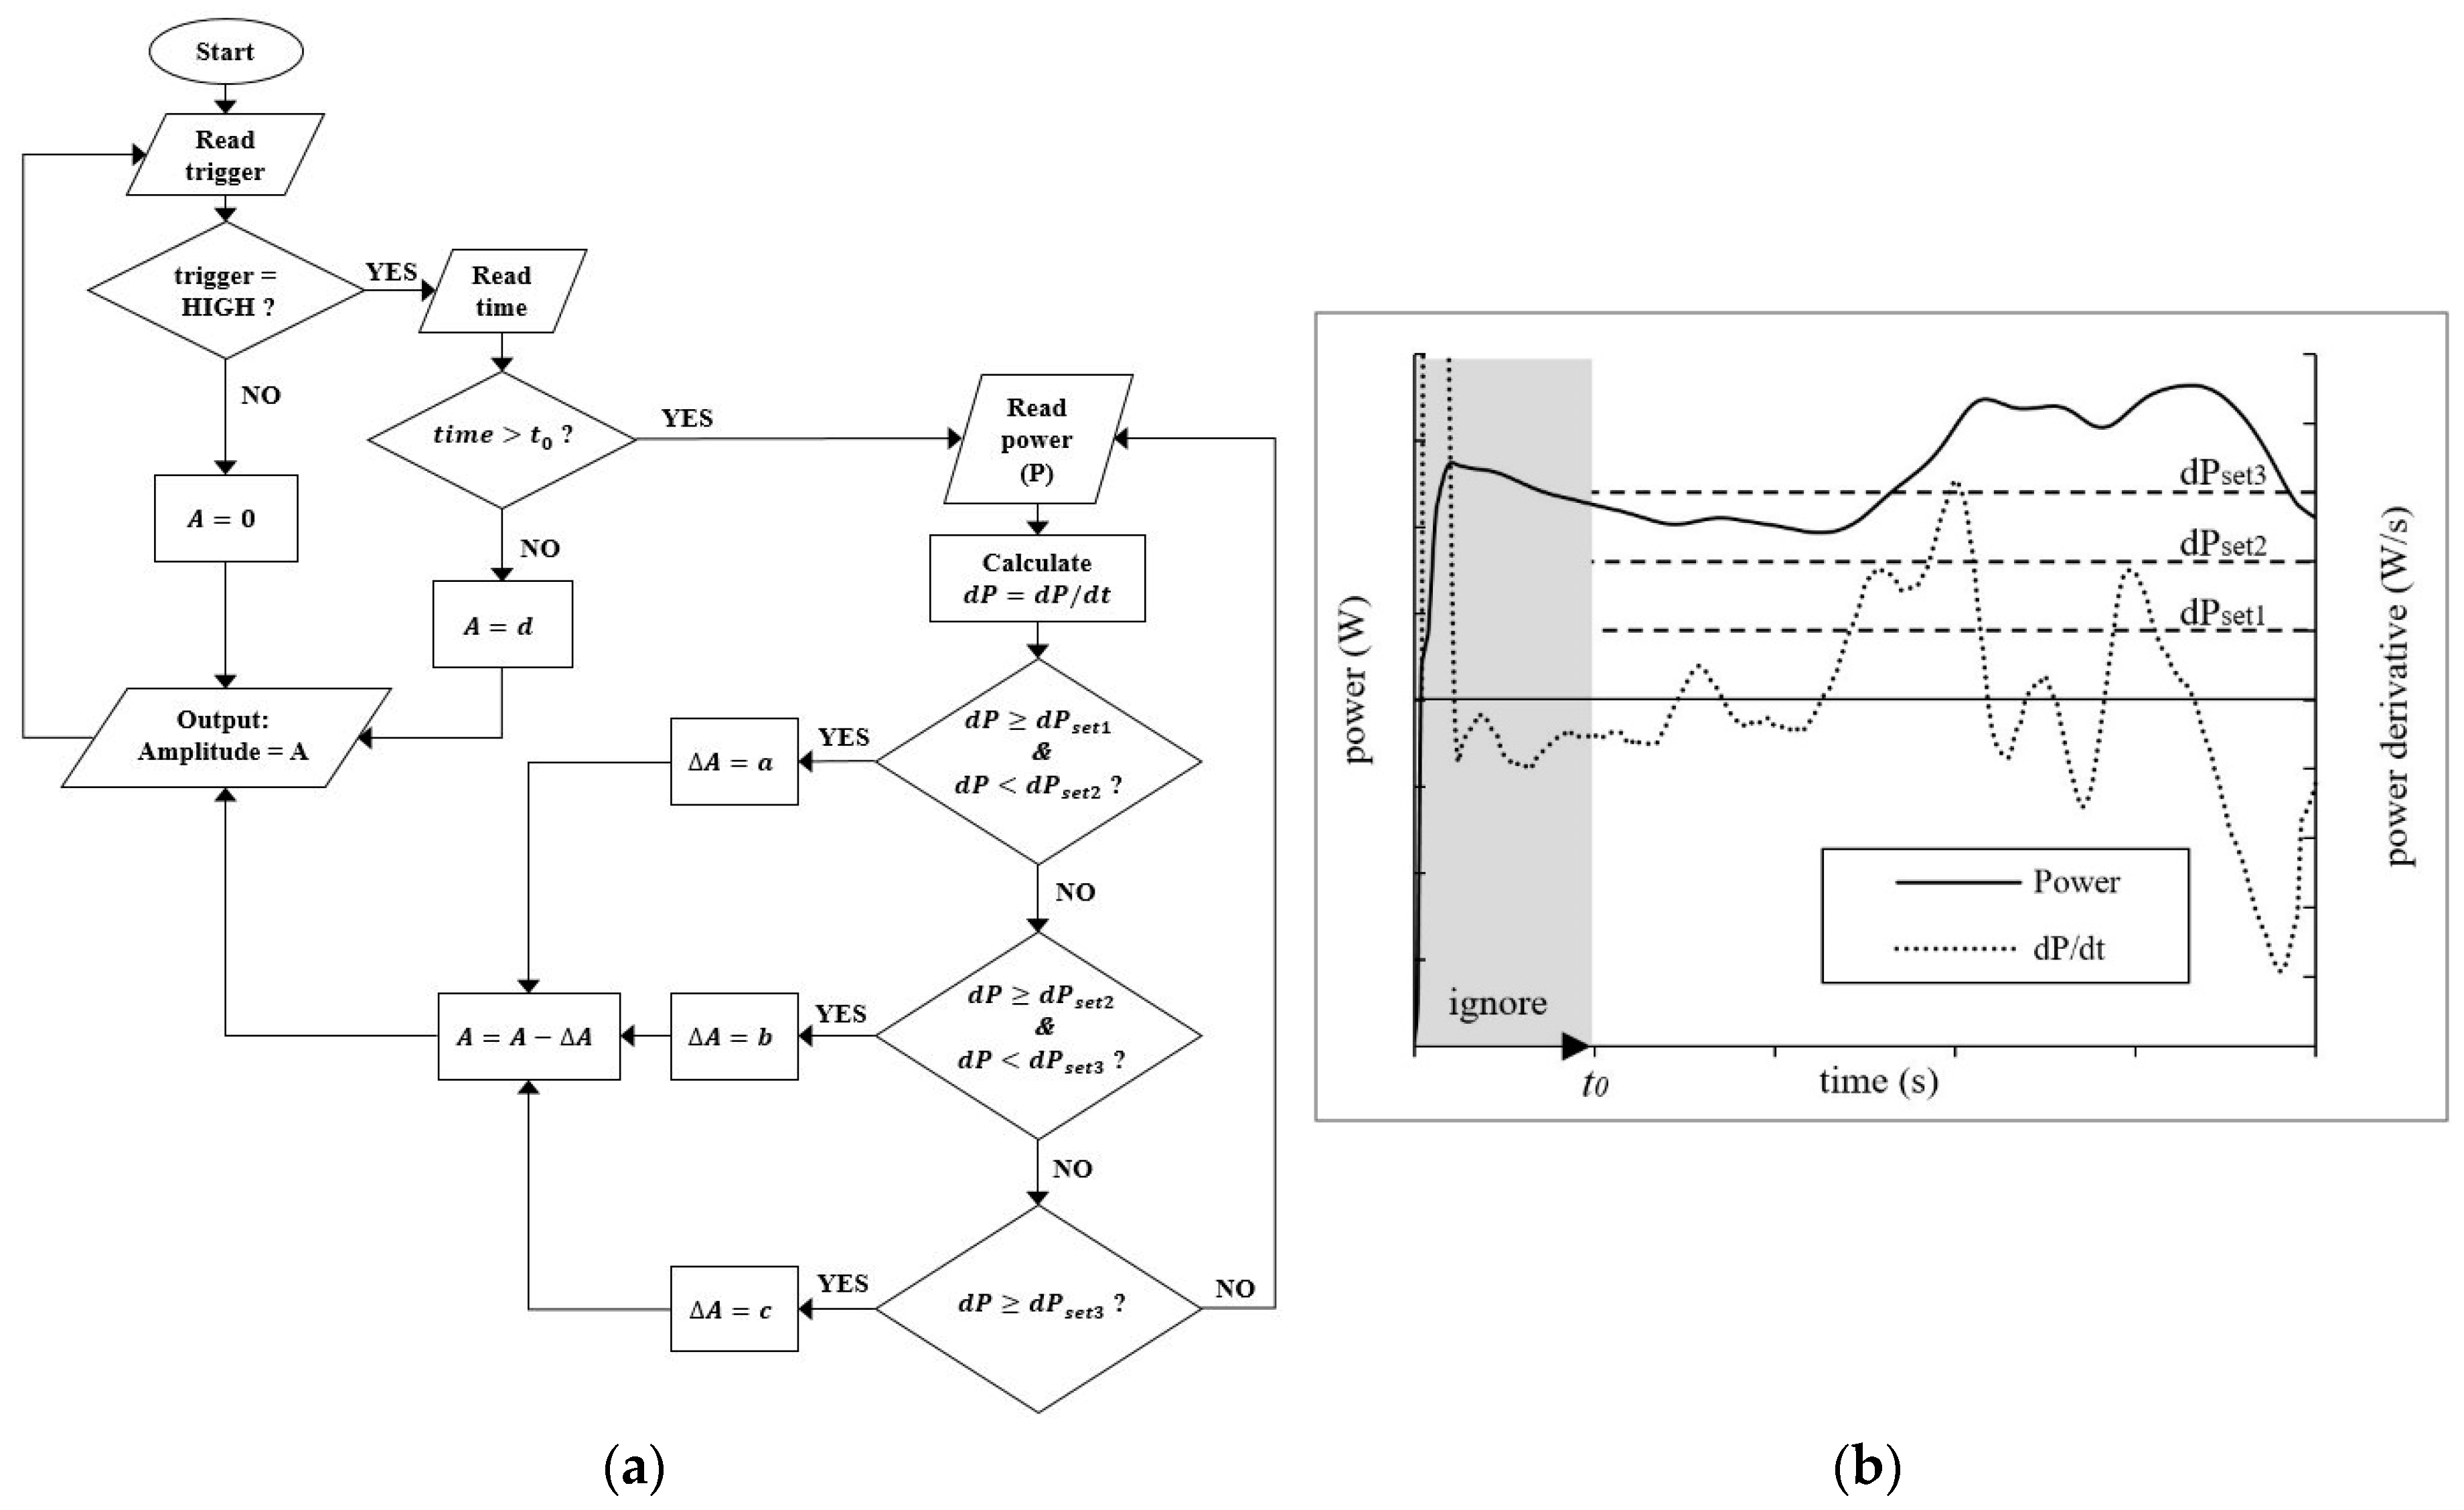
Figure 3. The algorithm for the controller is illustrated in Figure 4. The microcontroller read the amount of power consumed by the welder in terms of an analog voltage signal (0–3.3 V); then, it converted the voltage into the power value in terms of watts, where 0 V corresponded to 0 W and 3.3 V corresponded to 2400 W. The discrete time derivative of the measured power value dP/dt was calculated in the microcontroller in real time by dividing the difference in the power value between two successive controller loops over the duration of the complete loop. In the same internal cycle, the controller checked within three if-loops for certain conditions of the power derivative. In the first if-loop, the controller checked if dP/dt was within the range between dPset1 and dPset2; then, the pre-set initial amplitude A was dropped with a value of ΔA = a. This means that the new amplitude percentage after the loop would be A = A − ΔA. In a similar manner, the amplitude was dropped in the second and third if-loops, although with larger step sizes of b and c, respectively. At the end of each control loop, the microcontroller output the target vibration displacement amplitude percentage in terms of an analog 0–3.3 V signal at A, which was further amplified by the digital amplifier to 0–10 V and fed to the welder internal controller. The amplitude drop repeated for each loop of the controller until the if-loop conditions were not true; then, the amplitude remained constant until the pre-set weld time was reached and the trigger signal was set to LOW. Then, the ultrasonic vibrations were stopped and the weld healing took place under static pressure for a duration of 2 s.
This may be expressed as follows: if the slope of the power curve exceeds a critical value, then the amplitude A is reduced with a constant pre-set ΔA. With this approach, the amount of heat being generated in the weld zone is actively reduced and controlled within an optimum range. In previous work in the frame of this research, it was reported that only one if-loop is sufficient to control the weld power [20]. In this current work, the algorithm was expanded to include three parallel if-loops, thus allowing the system to react to small dP/dt values with smaller-amplitude drop steps and for larger dP/dt values with higher-amplitude drop steps. The controller started checking for the power derivative only after a delay of t0 from the weld start trigger point. This delay served to avoid the amplitude drop in the early phase of the welding, i.e., during the weld initiation where dP/dt becomes very large. The control principle is explained further in the later paragraphs.
In order to verify the process, the temperature vs. time in the center of the weld spots was measured using a thermocouple (twisted and arc welded K-Type 0.08-mm wire) and the temperature signal value was amplified and stored parallel to the power and amplitude values using the data recorder with a sample rate of 300 Hz. The measured values of the power, for the calculation of dP/dt, were filtered using a low-pass Butterworth filter with a frequency of 5 Hz, because the noise in the power values may result in undesired peaks in its derivative curves, whereas the measured temperature values were filtered using a low-pass Bessel filter with a frequency of 50 Hz.

2.4. The Specimen and the Specimen Fixture

The laminates were positioned as illustrated in Figure 5, and the spot weld was applied on their coinciding center of symmetries.
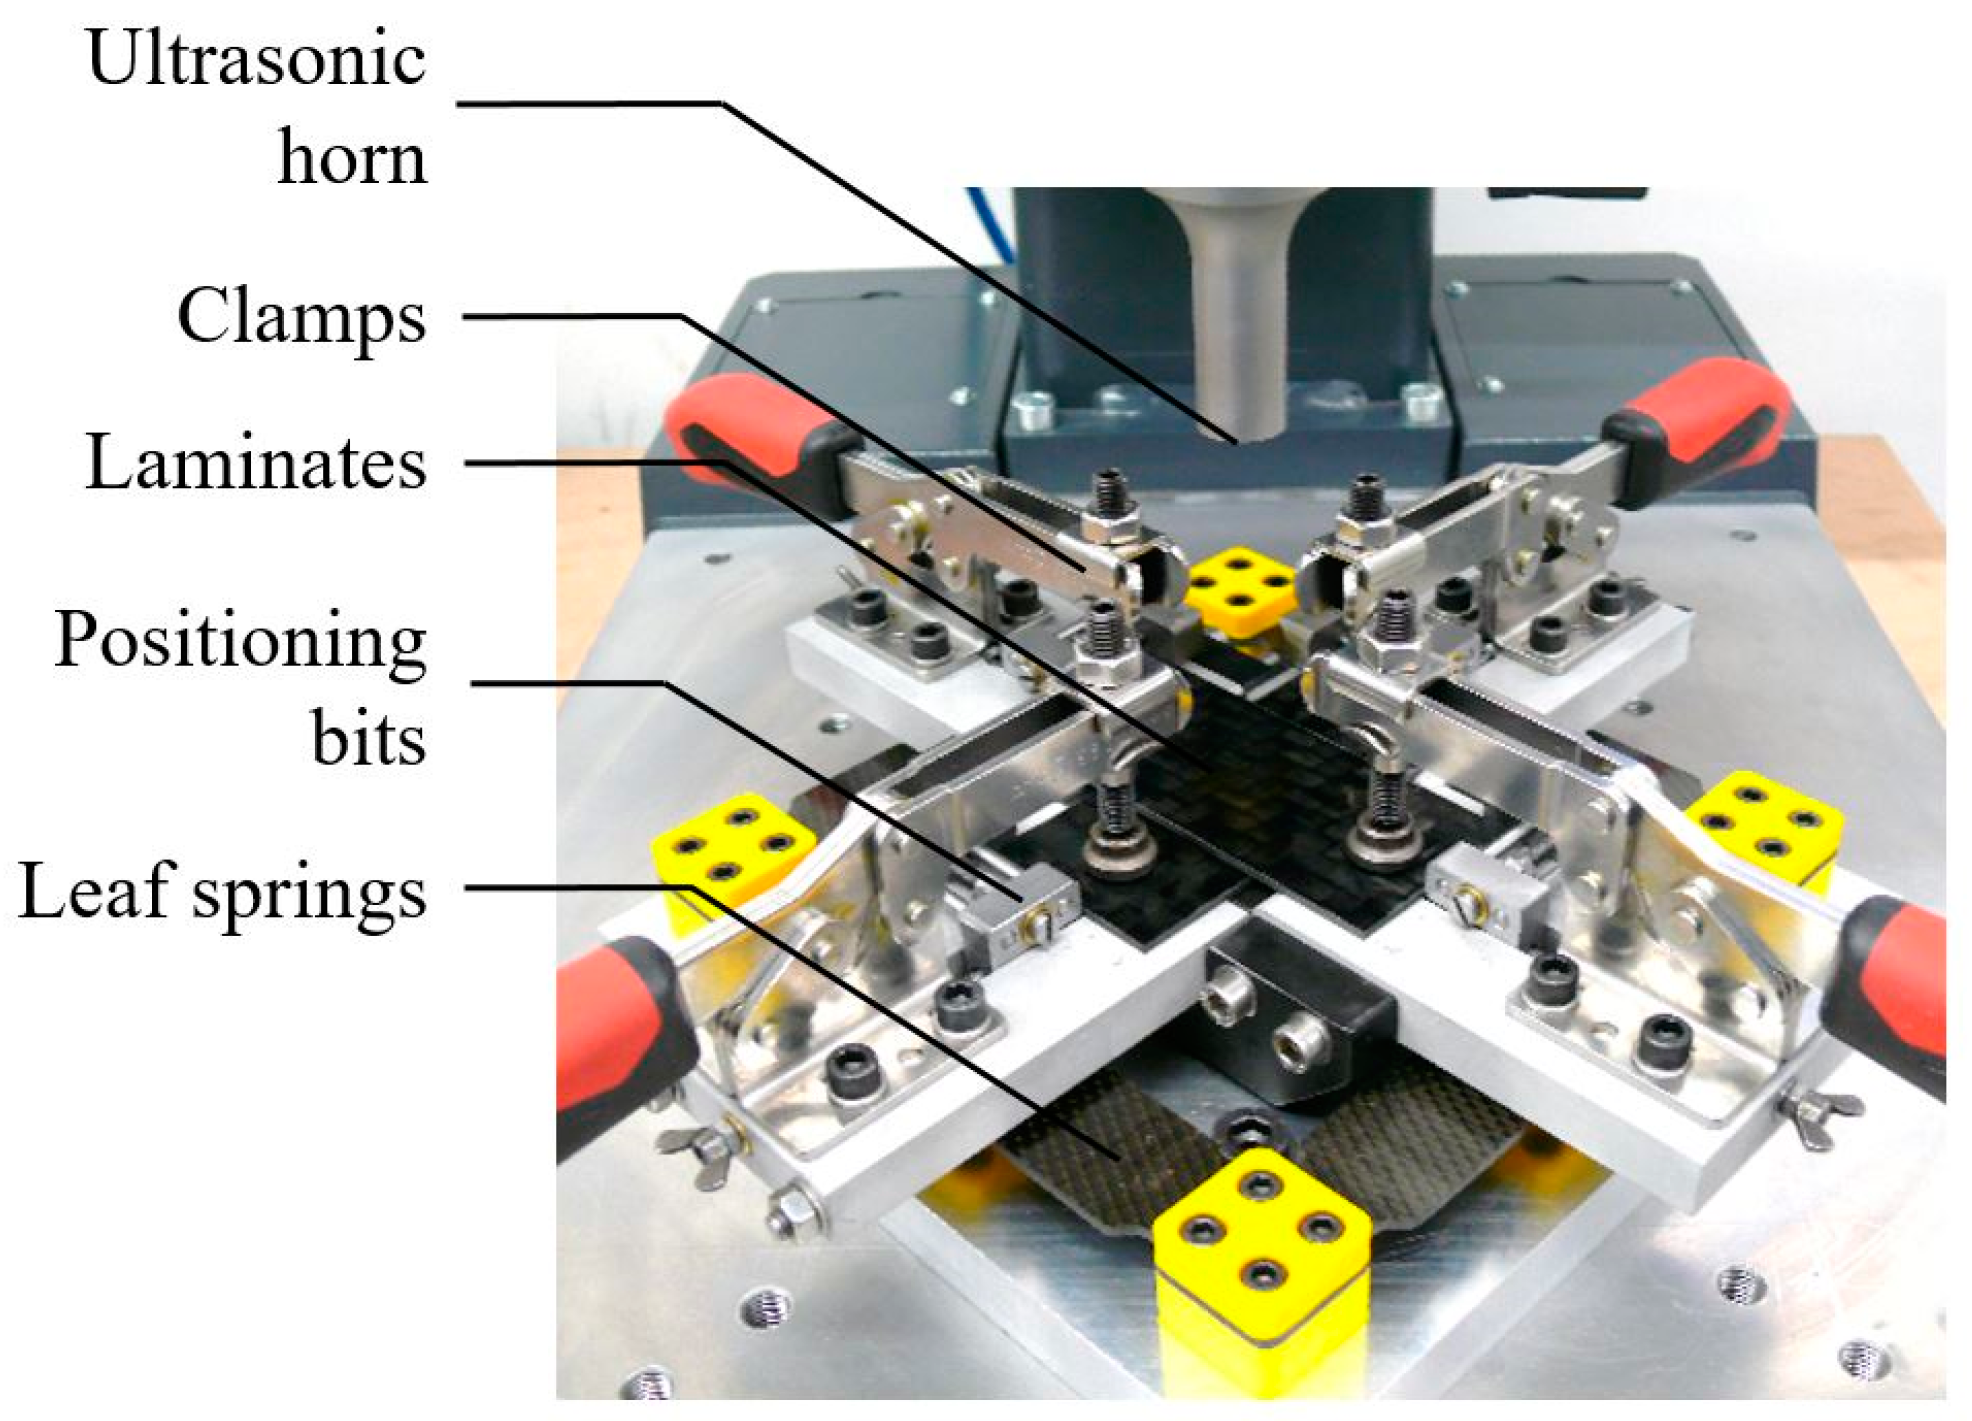
The fixture of the specimens is illustrated in Figure 6. It was constructed to allow the precise positioning of the laminates. It was designed to constrain all the relative in-plane movements but, at the same time, ensure the parallelism of the laminate surfaces with the horn and the anvil ends. The anvil end was built to resemble a freely rotating semi-sphere which was cut at one side to form the contact surface. The parallelism of the anvil and the horn-end faces played a crucial role in the uniform distribution of the vibration energy, thus avoiding the melting of the laminate surfaces at their contact with the horn and anvil.
The specimens for the experimental studies were cut from 960 mm × 800 mm × 2.1 mm thermoplastic laminate sheets made form a 12 K 2 × 2 twill carbon woven fabric-reinforced thermoplastic. The matrix was a high-fluidity Polyamide 6.6 (Nylon 6.6). Based on the differential scanning calorimetry test, the recorded glass transition temperature of the composite was Tg = 69 °C, the melt onset temperature was 243 °C, and the melt point was Tm = 259 °C. The thermal decomposition initiation temperature was taken from literature as Tdi = 358 °C according to Reference [21]. The laminates were consolidated with the hot-plate press approach. The final thickness of h = 2.1 ± 0.05 mm was resulted by stacking seven prepregs in the cross-ply sequence with a nominal fiber volume fraction of 50%. The specimens were dried in an oven at 75 °C for a minimum duration of 96 h before welding to ensure that the laminates were free from excessive water content.
For the temperature measurement, the thermocouples were prepared by twisting and arc-welding the ends of a fine gauge 40 (ϕ = 0.08 mm) K-type thermocouple wire pair. The thermocouples were carefully placed in the center of the laminate pairs at the weld interface (see Figure 5 and Figure 7); then, they were incorporated into the matrix by applying a short pulse (0.2 s) of ultrasonic vibration with an adequate static force on it. This approach ensured that the sensing end of the thermocouple was fixed in the desired location; later, during welding, the strain concentration at the matrix in the direct vicinity of thermocouple was significantly reduced. It is a well-known challenge to measure the temperature in the weld spot during ultrasonic welding. During the initial phase, the measured temperature might be higher than expected. This might be due to high local strain concentration around the thermocouple sensing end. The K-type thermocouple may also give misleading measurements under static pressure if no appropriate filters are applied. Nevertheless, in literature, the use of thermocouples to analyze and monitor the ultrasonic welding process is often encountered [9,10,19].

2.5. Experiment Plan

The experiments were divided into two groups. In the first group (UC-x), the influence of the weld duration 
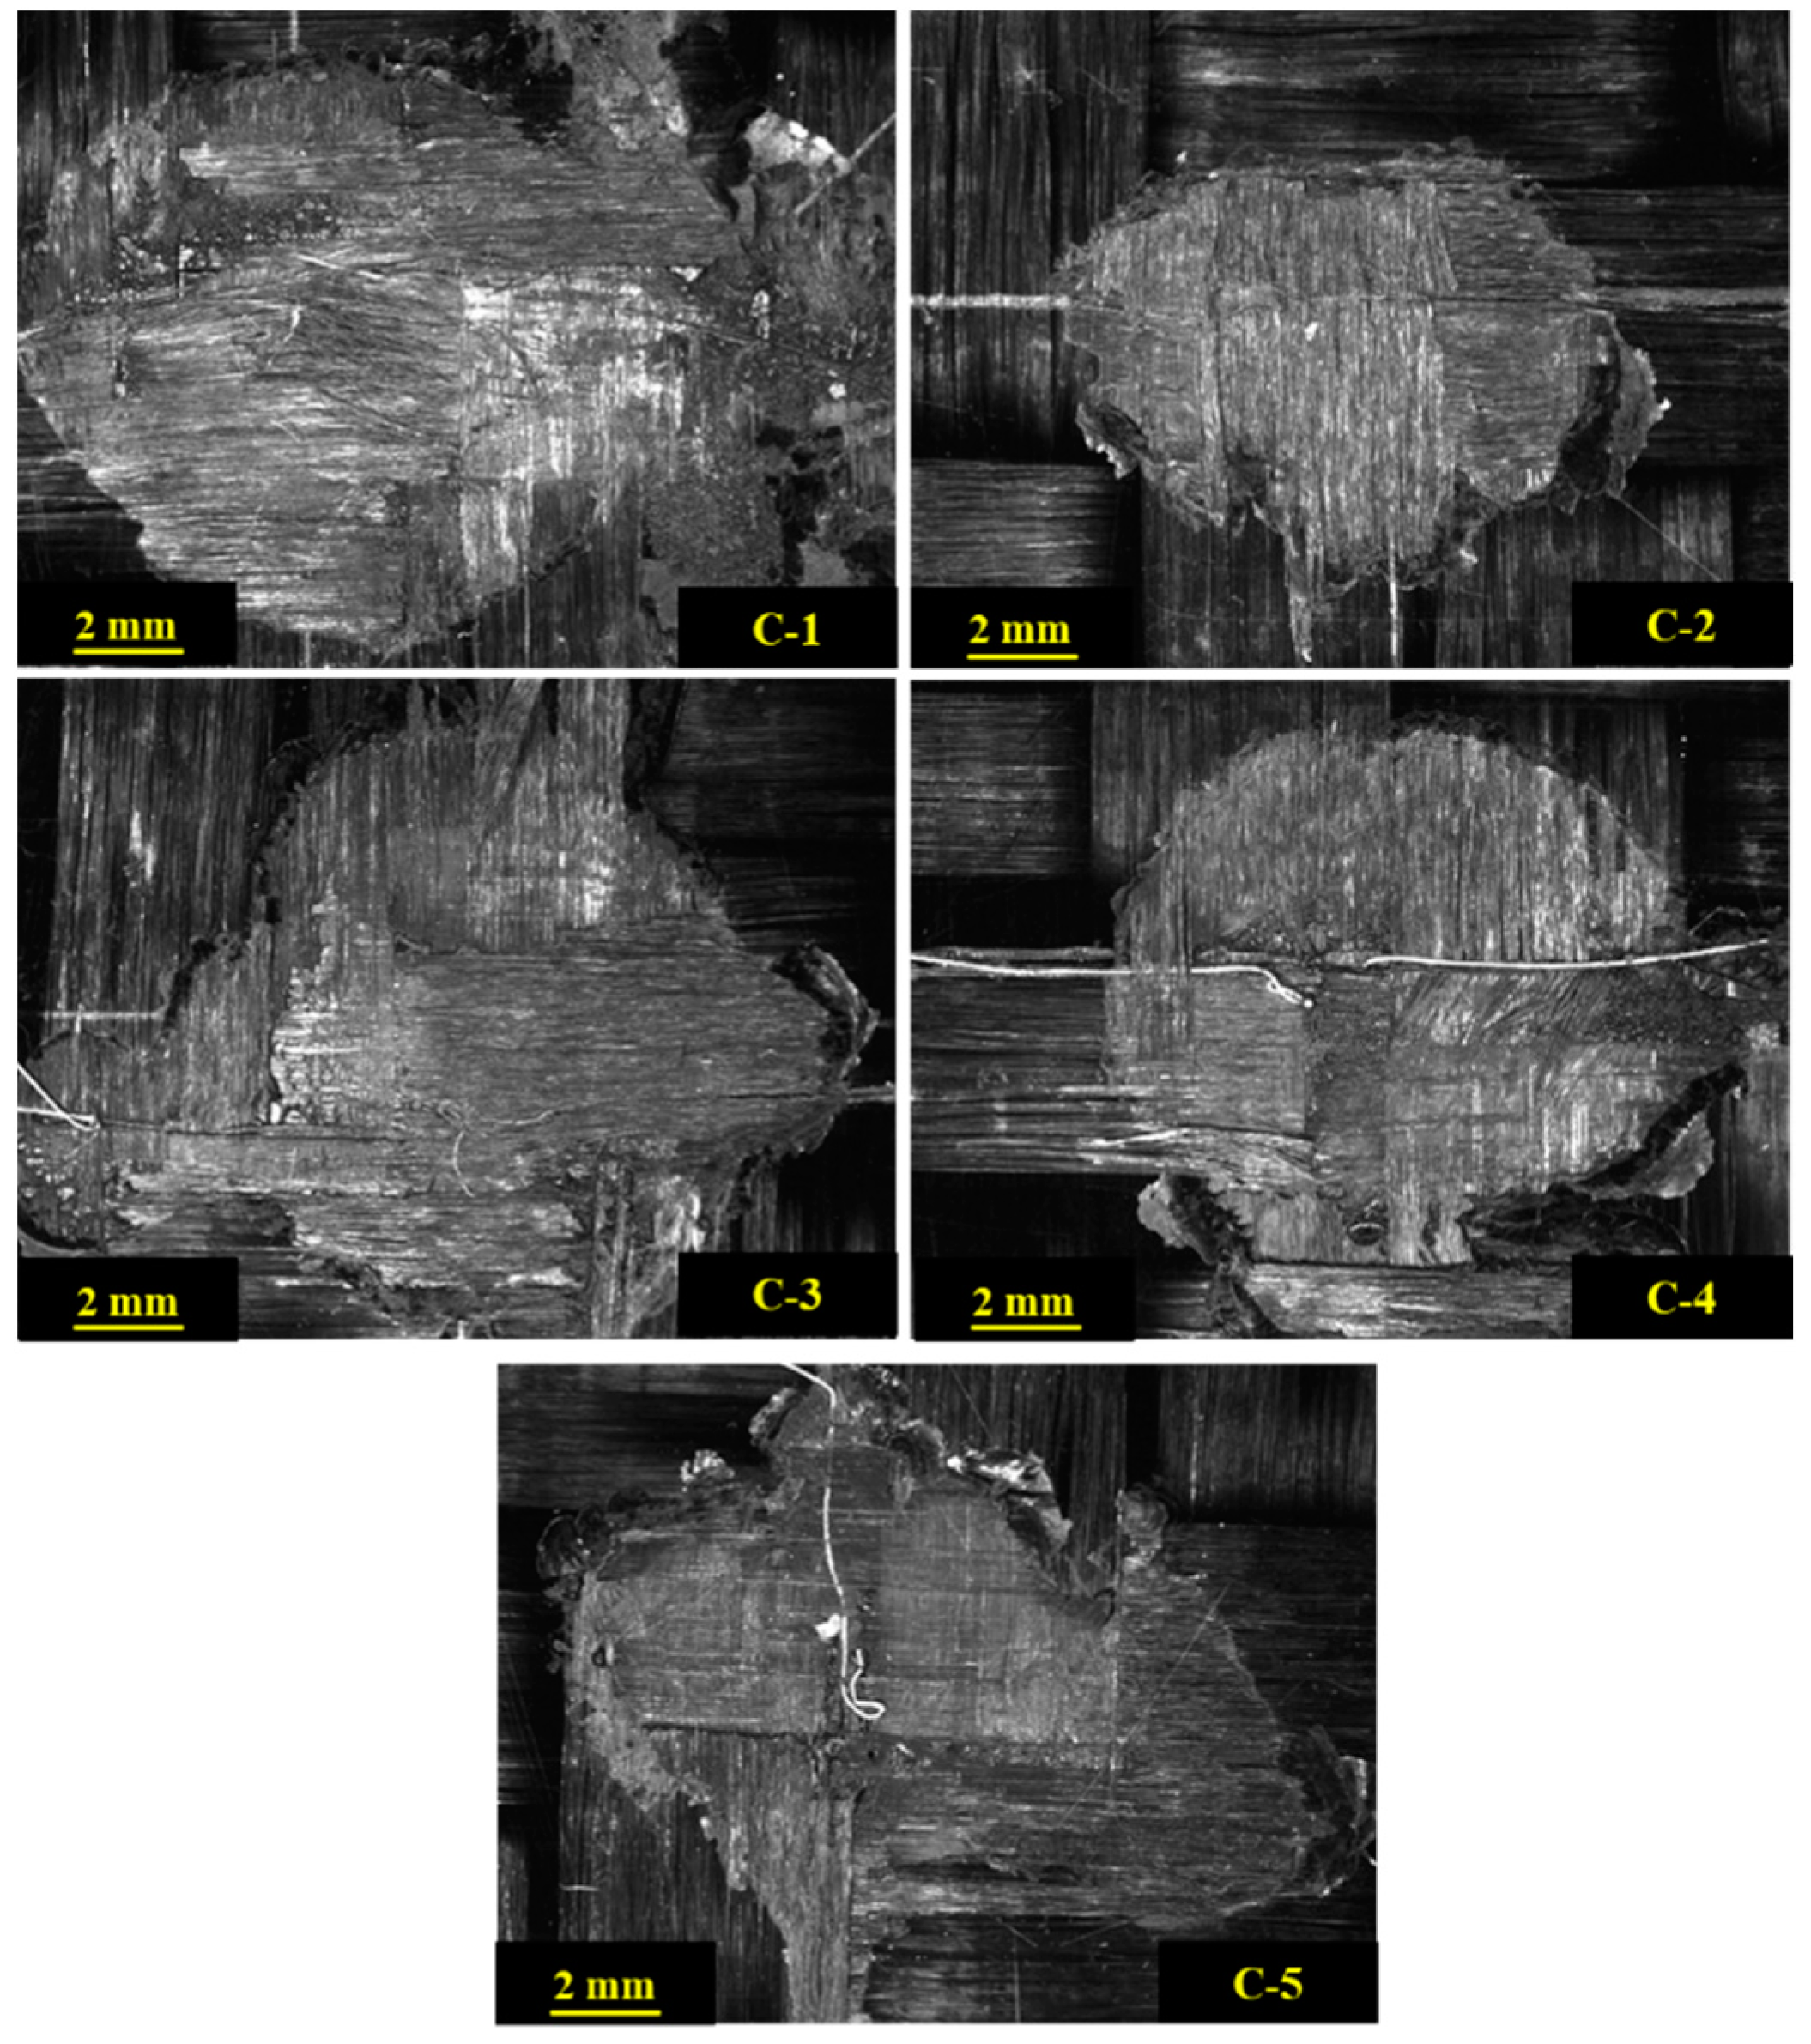
tw was monitored under constant parameters and without an active weld control. In the second group (C-x), the weld process control was turned on and the weld duration was set as constant at tw = 2.5 s. The weld control system was bypassed for the first group by setting the dPset values very high (considered as inf.). This high value during the welding was not exceeded, and the amplitude remained constant throughout the entire weld duration. In the C-x cases, different values and scenarios for the dPset were investigated; in the first three cases, the second and third if-loops were ignored by setting the dPset very high and, for the fourth and the fifth cases, the second and third if-loops were taken into consideration. The relevant process control parameters which were used for the experimental studies are given in Table 1.
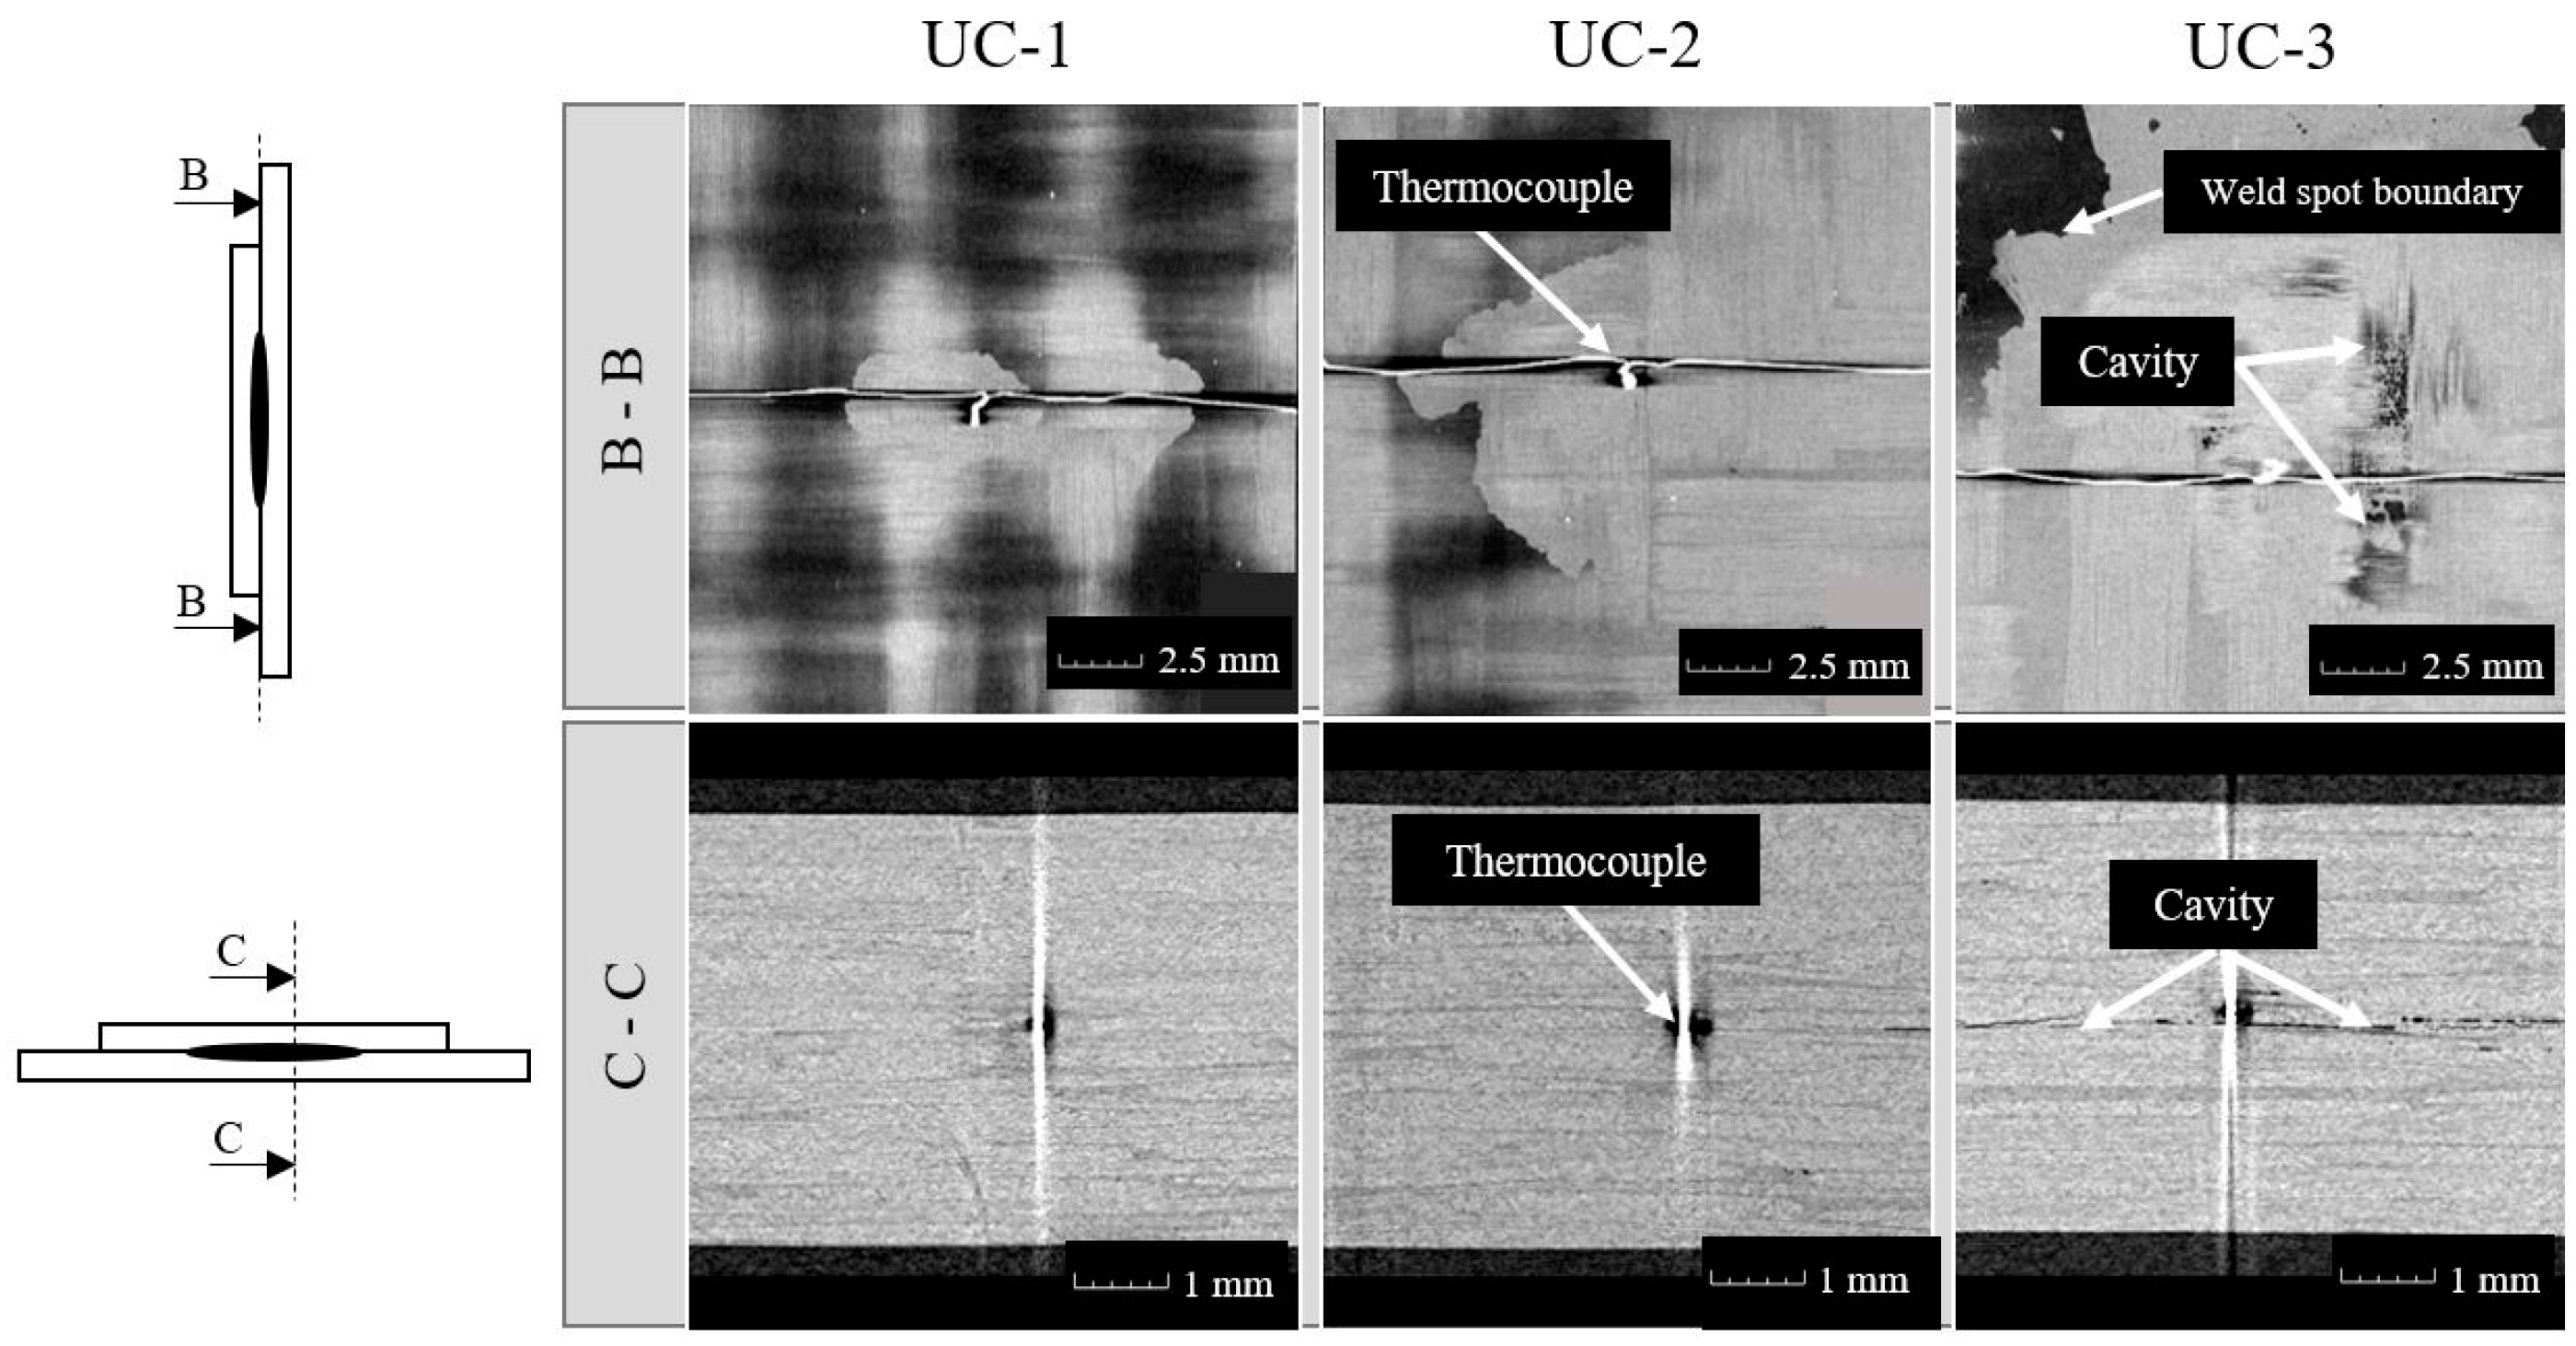
The additional relevant process variables, which were set constant throughout the investigations, were as follows: the weld press average static force, 650 N; the static force at the solidification phase, 600 N; the solidification time, 2 s. Several repetitions for each weld case (7–10 repetitions) were done to gather statistical data. The time traces of the temperature and the power were plotted for the UC-3 case, in order to discuss and illustrate the behavior of the temperature development in relation to the power curve during the DUS weld process. The results of the temperature measurement in the weld spots of the controlled welds were analyzed to identify the influence of the control system on the temperature development vs. time at the center of the weld spot. A reference weld spot was chosen from each case and was scanned through the computed tomography method. The scans were done in the laboratories of the Institute of Lightweight Engineering and Polymer Technology (ILK) at Technische Universität Dresden, using an in situ FICT 160; the X-Ray microfocus was 80 kV at 80 µA. The scans were done with a resolution of 12 µm with a duration of 15 min/scan. The computed tomography (CT) scans delivered insight into the quality of the weld spots. The quality was determined by the presence or the absence of the irregularities caused by the overheating of the matrix.

3. Results and Discussions

3.1. The Power and Temperature Curves

In Figure 8, typical temperature and power curves for an uncontrolled weld are plotted against time. The curves are the result of the UC-3 with a weld duration of tw = 2.5 s. The dashed line is the time trace of the temperature measured in the weld spot for one of the repetitions, and the solid line is the corresponding consumed weld power curve. The gray shaded areas around the curves represent the ranges covered by the time traces of temperature, while the hatched area represents the range of the power covered by the repetitions under similar conditions.
In most of the observed cases, as the oscillations were applied, the power rose rapidly and reached a peak value at ta = 0.1 s. At this stage, the temperature increased rapidly; then, it stabilized around 200 °C. At a certain instance of time (ts = 1.3 s), as soon as the interfacial layer of the welded spot initiated to melt, the entire applied vibrational strain energy focused there. Consequently, the temperature only in this thin local zone underwent a rapid increase, while the remaining layers away from the interface in the thickness direction remained relatively cold and solid. From this point on, the overall energy dissipation was higher than the total energy consumption in the previous stages, and this was observed in the rise of the power curve between ts = 1.3 s and td = 1.58 s. The increase in temperature above Tdi = 358 °C led to the gradual thermal decomposition of the matrix. The stage between the decomposition td and the temperature rise initiation ts is referred to as the second jump. The decomposition process and the heat transferred by the escaping hot gases resulted in a thermal equilibrium, and the temperature remained almost stable in a range around the mean value of 400 °C.
This behavior of the temperature and the power curves were observed for most of the uncontrolled welds. However, the onset time for the second jump (ts) in the curves deviated strongly from one weld to another. It can be observed in Figure 8 that the typical temperature curve (dashed line) underwent the second jump at the onset time of about ts = 1.34 s and reached the decomposition temperature at td = 1.58 s. Meanwhile, the earliest time for the onset of the temperature jump was recorded at ts = 0.75 s and the latest time was ts = 2.1 s. A similar behavior for the power curve was observed in almost all of the recorded cases. The power curve jump onset preceded the temperature jump onset. The onset of the power jump can be detected by its positive derivative at the mark-line (1) in Figure 9.
One may notice that the attempts to reach an optimum weld duration with statistical approaches may not be practical. The deviations of ts from the mean value of an optimum weld case were quite large. The ts was influenced unpredictably by many uncontrollable factors such as local matrix concentration, surface imperfections, and ultrasonic signal interferences. The suggestion of Benatar and Gutowski [5] to stop the vibrations when the power curve reaches a peak might work well for some ultrasonic weld configurations. However, in the differential spot welding, as can be inferred from Figure 9, when the power curves reached the peak value (mark-line (3)), the temperature had already passed the thermal decomposition temperature of the matrix and the weld suffered.
To overcome these limitations, it is possible to deduce from the above-discussed phenomena that the power curve exhibits a positive slope just before the initiation of the second temperature jump. The weld power is most sensitive as seen in Equation (7) to the vibration amplitude A0. It is assumed that, by detecting the second power jump initiation and reacting to it by actively reducing the vibration displacement amplitude, it is possible to control the temperature at the weld spot within an optimum range and for a sufficient duration to allow the weld spot to fully diffuse without overheating.
The traditional PID (proportional–integral–derivative) control method was not an option for this application. The PID needs a certain value of the weld power to regulate around it and, in the DUS welding, there does not exist a known power value which can be taken as a set point for the PID controller. For example, if a minimum safe value for power is set, and the weld spot coincides with a high matrix content location of the laminate, then the amplitude would be adjusted lower than needed and the weld will never reach the necessary melting temperature for the diffusion to occur.

3.2. The Controlled DUS Welding Process

The used controller detected the second jump of the temperature through monitoring sudden increases in the power time derivative above a preset value (the mark-line (2) in Figure 9). If the condition was true, then the amplitude was reduced with a pre-set percentage as described in the Section 2. The effectiveness of this control method lies in the fact that it detects the initiation of the weld spot melting and reacts to it by reducing the intensity of the viscoelastic heating. If the drop of the amplitude is relatively small, it takes several loops of amplitude reduction until the power curve stabilizes. This phenomenon gives time for the temperature to flow and distribute with a less sharp gradient in the thickness direction than in the initial phase. However, if the weld duration is prolonged, the inner layers will get hot enough to squeeze-flow under the static weld force into the interface and away from the weld spot, which in turn causes a second kind of weld spot degradation.
The experiments showed that, in most of the controlled welds, the measured temperature in the weld center remained below the decomposition temperature. The time traces of the temperature measured in the weld spots are plotted in Figure 10a–e for the five investigated controlled cases (C-1~5) respectively. The shaded grey areas in Figure 10 represent the temperature spectrum which resulted from the repetitions in each controlled case. The broken line is the time trace of a representative temperature curve. Parallel to each temperature curve the adjusted vibration displacement amplitude percentage is plotted. For the C-1 welds with dPset = 100 W/s, the measured temperature in some of the weld spot remained below 200 °C throughout the weld duration and the diffusion of the spot was not complete. An exception in one of the welds of the C-1 case was observed; the temperature in the weld spot continued increasing after the amplitude reduction occurred and it exceeded the Tdi limit. The problem of insufficient heat energy was not observed in the C-2 case where dPset = 200 W/s. However, for some of the repetitions, the temperature in the weld center and for the last 0.5 s of the weld duration exceeded the Tdi limit. The observed welds of the C-3 remained well within the optimum temperature zone; the temperature of the welds remained almost above the melting and mostly below the decomposition temperatures with the highest temperature measured at 308 °C.
For the controlled welds with the three if-loops (C-4 and C-5), a significant improvement in the process stability was observed. The system reacted with a higher level of flexibility to the power curve changes, and this was reflected in the temperature curves of the weld spots. The C-4 case had a low dPset1 and, as a consequence, the amplitude drop occurred in the early stage of the weld process; hence, the maximum measured temperature was around 304 °C. In some weld spots, the temperature remained throughout the weld duration just below the melting point of the matrix, such as the highlighted broken line in C-4. By increasing the power derivative limits for all three levels, such as in C-5, the reaction to the temperature second jump was delayed. Thus, in some of the repetitions of the C-5 case, it was observed that the temperature increased in the early stages of the weld to almost 340 °C; then, the control system reacted and the temperature dropped gradually and stabilized at around 300 °C. Nevertheless, in both of the tested cases, the temperature remained below the decomposition initiation temperature.
Example power curves from each of the controlled weld cases are plotted vs. time in Figure 11. It can be seen here that the power curves did not undergo the second jump; instead, they were almost flat at the last second of the welding duration. This is because, whenever the weld power initiated to increase, the controller reacted to it by reducing the weld vibration displacement amplitude. Consequently, less ultrasonic vibration energy was input to the weld spot and the heating rate was reduced. The elimination of the second power jump eventually led to the elimination of the second temperature jump in the weld spot center.
The investigations prove that the control method can be useful to eliminate the overheating problem during the ultrasonic spot welding of the composite laminates. If the control system is well calibrated, the temperature of the weld spot center might be controlled to remain within the adequate welding temperature.

3.3. The Computed Tomography Analysis

In order to determine, on one hand, the impact of the overheating on the weld spots and, on the other hand, the effect of the weld control on the weld spot quality, CT scans were done of the volume around the weld spots. The temperature measurements were restricted to the weld center; thus, the CT scans may give insight into the state of the weld spot at locations away from the thermocouple. It was observed from the section images produced by the scans that the uncontrolled welds which were stopped before the second jump (tw < ts) were not fully formed and had a small diameter. An example of this is the UC-1 weld case. The welds which were stopped far after the second jump, such as in the UC-3 case, had noticeable defects in the volume at the direct vicinity of the weld spot. The defects were most intensive in the weld spot at the weld plane. The observed defects were in the shape of cavities in the composite, which in turn were left behind by the thermally decomposed and evaporated matrix. In one of the CT scans of a weld, which by chance was stopped just shortly after the second jump (tw ≈ ts), a uniformly diffused weld spot was observed. The images from the CT scans at the weld plane and at the cross-section through the weld spot for the uncontrolled welds are given in Figure 12; the cavities are marked with arrows in the CT scan images of UC-3 (tw > ts).
The time traces of the temperatures measured in the controlled weld spots, which were CT-scanned, are plotted as the broken lines at each equivalent case in Figure 10. The images of two sections of a spot weld from each controlled weld case are plotted in Figure 13. The CT scans of most of the controlled welds revealed uniformly diffused weld spots with almost no cavities and negligible defects. From the CT scans, no significant differences between the weld spots done with different control parameters (C-2 to C-5) were observed. Only the CT scan of the weld spot for the C-1 case showed wide spread delamination and cavities at the weld spot. The scanned weld of the C-1 case had a temperature which exceeded the Tdi of the matrix due to inappropriate control parameters.
To further support the observations done using the CT scans, some of the welds were separated and the fracture surfaces were analyzed under a stereo-microscope with a magnification of 2×. The microscopic images of fracture surfaces from each controlled weld case (C-x) are given in Figure 14. Traces of fiber pull-up can be seen in the fracture surfaces, which is in turn an indication of the cohesive failure mode of the weld spot. However, it was difficult to trace and identify the cavities caused by overheating and thermal decomposition of the thermoplastic matrix from the microscopic images.
It is suspected that the presence of the thermocouple may interfere with the ultrasonic spot welding process. The presence of the thermocouple in the weld spot may, in some cases, act as an energy director, and the melt might initiate there. Therefore, ultrasonic spot welds were performed without thermocouples and under similar conditions of the C-5 weld case. Then, the volume around the weld spot was scanned using CT. Two cross-section images from the CT scan are illustrated in Figure 15, one at the weld plane (B–B) and the second at a cross-section through the weld spot (C–C). The images show a uniform diffused weld spot with no traces of overheating and thermal decomposition. The image at the C–C cross-section shows some minor cavities away from the weld interface (marked by white arrows). It was unclear at that stage if these small cavities were caused by the welding process or were defects in the laminates due to production.
It was observed from both the temperature measurements and the CT scan analysis that the control method might be a useful tool to eliminate or reduce the overheating and thermal decomposition of the thermoplastic matrix at the weld spot. The different investigated parameter sets show that the dPset value has a significant impact on the degree of success of the weld control system. The investigation proves that the control system is not influenced strongly by the presence of the thermocouple in the weld spot.

4. Conclusions

The influence of the new developed logical control method for the differential ultrasonic welding of fiber-reinforced thermoplastic laminates on welding process stability was investigated. The investigations were done by monitoring the time traces of the temperature in the weld spot and were verified through computed tomography scans of the weld spots. Three uncontrolled weld sets and five controlled weld sets were observed with several repetitions for each case. The three uncontrolled welds were done with different weld durations, which were 1 s, 2 s, and 2.5 s. The controlled welds, however, were carried out using a constant weld duration of 2.5 s, yet with varying weld control criteria. The suggested control system relied on the power time derivative of the welder to detect the initiation of the melting of the weld spot, and reacted to it by reducing the ultrasonic vibration amplitude to ensure a uniform diffusion temperature in the weld spot.
Through the investigated cases, it was observed that a complete elimination of the temperature jump up to the decomposition temperature was possible by implementing the logical control system. The welder-power time derivative may be used to indirectly detect the melting of the matrix and control the temperature in the ultrasonically welded spots of fiber-reinforced thermoplastic laminates. The control parameter dPset was found to have a high influence on the weld temperature. Controlling with small dP/dt limit values caused a rapid drop in the ultrasonic amplitude and resulted in an insufficient heat energy generation for the matrix to reach the melting temperature. Increasing the dPset or using three if-loops with three levels of d P s e t such as the C-5 case led the temperature of the weld to remain within the optimum boundaries for all the recorded cases. The CT scans of the volume around the weld spots delivered a better understanding of the influence of the temperature on the weld spot. The CT scans revealed a presence of cavities in the weld spots, in which the temperature reached or exceeded the thermal decomposition temperature of the matrix. However, the CT scans of the controlled weld spots showed mostly uniformly diffused and defect-free weld spots.
It is essential to investigate the influence of the logical weld control system on the weld strength and the process stability in comparison to the uncontrolled DUS welding process. The tests are to be repeated for DUS welds without the thermocouple, whose presence might influence the weld spot formation. Eventually, a more sophisticated control system needs to be developed.

Author Contributions

Conceptualization, S.T. and O.E. Methodology, investigation, and writing—original draft preparation, S.T. Writing—review and editing, M.D. Supervision, N.M. Project administration, F.F. Funding acquisition, O.E.

Funding

This research received no external funding.

Acknowledgments

Special thanks to Robert Carl, Kerem Ucar, Florian Buchner, and Albert Fellermayer for their contributions to the research work and their support in conducting the numerous time-intensive measurements. Thanks to Thomas Forstner for his contribution to the method development. Thanks to Hans Julius Langeheinecke for his support and contribution to the reviewing of the written work.

Conflicts of Interest

The authors declare no conflict of interest.

References

  1. Amancio-Filho, S.T.; dos Santos, J.F. Joining of polymers and polymer-metal hybrid structures: Recent developments and trends. Polym. Eng. Sci. 2009, 49, 1461–1476. [Google Scholar] [CrossRef]
  2. Ageorges, C.; Ye, L.; Hou, M. Advances in fusion bonding techniques for joining thermoplastic matrix composites: A review. Compos. Part A Appl. Sci. Manuf. 2001, 32, 839–857. [Google Scholar] [CrossRef]
  3. Yousefpour, A.; Hojjati, M.; Immarigeon, J.-P. Fusion Bonding/Welding of Thermoplastic Composites. J. Thermoplast. Compos. Mater. 2004, 17, 303–341. [Google Scholar] [CrossRef] [Green Version]
  4. Rotheiser, J. Joining of Plastics: Handbook for Designers and Engineers, 1st ed.; Carl Hanser Fachbuchverlag: Munich, Germany, 2015. [Google Scholar]
  5. Benatar, A.; Gutowski, T.G. Ultrasonic welding of PEEK graphite APC-2 composites. Polym. Eng. Sci. 1989, 29, 1705–1721. [Google Scholar] [CrossRef]
  6. Villegas, I.F. In situ monitoring of ultrasonic welding of thermoplastic composites through power and displacement data. J. Thermoplast. Compos. Mater. 2014, 28, 66–85. [Google Scholar] [CrossRef]
  7. Senders, F.; van Beurden, M.; Palardy, G.; Villegas, I.F. Zero-flow: A novel approach to continuous ultrasonic welding of CF/PPS thermoplastic composite plates. Adv. Manuf. Polym. Compos. Sci. 2016, 2, 83–92. [Google Scholar] [CrossRef]
  8. Li, Y.; Arinez, J.; Liu, Z.; Hwa Lee, T.; Fan, H.-T.; Xiao, G.; Banu, M.; Hu, S.J. Ultrasonic Welding of Carbon Fiber Reinforced Composite with Variable Blank Holding Force. J. Manuf. Sci. Eng. 2018, 140, 91011. [Google Scholar] [CrossRef]
  9. Zhi, Q.; Gao, Y.H.; Lu, L.; Liu, Z.X.; Wang, P.C. Online Inspection of Weld Quality in Ultrasonic Welding of Carbon Fiber/Polyamide 66 without Energy Directors. Weld. J. 2018, 97, 65–74. [Google Scholar] [CrossRef]
  10. Chen, L.Y.; Zhi, Q.; Li, J.C.; Liu, Z.X.; Wang, P.C. Single-Sided Ultrasonic Welding of CF/Nylon 6 Composite without Energy Directors. Weld. J. 2018, 97, 17–25. [Google Scholar] [CrossRef]
  11. Grewell, D.A. Simultaneous Amplitude and Force Profiling during Ultrasonic Welding of Thermoplastic Workpieces. U.S. Patent 5855706, 1 May 1999. [Google Scholar]
  12. Fischer, F.; Schuster, A.; Willmeroth, M.; Glück, R.; Engelschall, M.; Larsen, L.; Kupke, M. Safe and Sound Thermoplastics: Quality Assured Ultrasonic Welding in Fuselage Skin Production. In Proceedings of the 18th European Conference on Composite Materials, Athens, Greece, 25–28 June 2018. [Google Scholar]
  13. Zhang, Z.; Wang, X.; Luo, Y.; Zhang, Z.; Wang, L. Study on Heating Process of Ultrasonic Welding for Thermoplastics. J. Thermoplast. Compos. Mater. 2010, 23, 647–664. [Google Scholar] [CrossRef]
  14. Levy, A.; Le Corre, S.; Fernandez Villegas, I. Modeling of the heating phenomena in ultrasonic welding of thermoplastic composites with flat energy directors. J. Mater. Process. Technol. 2014, 214, 1361–1371. [Google Scholar] [CrossRef]
  15. Levy, A.; Le Corre, S.; Poitou, A. Ultrasonic welding of thermoplastic composites: A numerical analysis at the mesoscopic scale relating processing parameters, flow of polymer and quality of adhesion. Int. J. Mater. 2014, 7, 39–51. [Google Scholar] [CrossRef]
  16. Levy, A.; Le Corre, S.; Poitou, A.; Soccard, E. Ultrasonic welding of thermoplastic composites: modeling of the process using time homogenization. Int. J. Mult. Comp. Eng. 2011, 9, 53–72. [Google Scholar] [CrossRef]
  17. Roylance, D. Engineering Viscoelasticity; MIT: Cambridge, MA, USA, 2001. [Google Scholar]
  18. Lakes, R.S. Viscoelastic Materials; Cambridge University Press: Cambridge, UK, 2009. [Google Scholar]
  19. Tolunay, M.N.; Dawson, P.R.; Wang, K.K. Heating and bonding mechanisms in ultrasonic welding of thermoplastics. Polym. Eng. Sci. 1983, 23, 726–733. [Google Scholar] [CrossRef]
  20. Tutunjian, S.; Eroglu, O.; Dannemann, M.; Modler, N.; Fischer, F. Increasing the Joint Strength of Ultrasonic Spot Welded Fiber Reinforced Laminates by an Innovative Process Control Method. In Proceedings of the 18th European Conference on Composite Materials, Athens, Greece, 25–28 June 2018. [Google Scholar]
  21. Cai, Z.; Mei, S.; Lu, Y.; He, Y.; Pi, P.; Cheng, J.; Qian, Y.; Wen, X. Thermal properties and crystallite morphology of nylon 66 modified with a novel biphenyl aromatic liquid crystalline epoxy resin. Int. J. Mol. Sci. 2013, 14, 20682–20691. [Google Scholar] [CrossRef] [PubMed]
Figure 1. The configuration of the ultrasonic spot welding. Illustration of the main components and dimensions.
Jmmp 03 00001 g001
Figure 2. An example plot of the weld power and the weld spot temperature as functions of time for an exemplary ultrasonic spot weld applied on a carbon fiber-reinforced thermoplastic laminate pair.
Jmmp 03 00001 g002
Figure 3. A schematic representation of the welder, the data recording, and the control system.
Jmmp 03 00001 g003
Figure 4. (a) The algorithm of the control program in the microcontroller. (b) Schematic illustration of the algorithm.
Jmmp 03 00001 g004
Figure 5. A schematic drawing of the test specimen illustrating the laminate placement, dimensions, and the thermocouple location in relation to the designated weld spot. (a) Top view of the specimen, and (b) side view of the specimen.
Jmmp 03 00001 g005
Figure 6. The tool for positioning and fixing the laminates during the DUS welding (installed on the ultrasonic welder).
Jmmp 03 00001 g006
Figure 7. Thermocouple placement on the laminate and a magnified photo of the K-type thermocouple sensing end.
Jmmp 03 00001 g007
Figure 8. The power and temperature curves of the uncontrolled welds case UC-3. Illustrating the characteristic times and temperatures during the DUS welding.
Jmmp 03 00001 g008
Figure 9. The time traces of the power, temperature, and the power derivative for the uncontrolled weld case C-3-3. The initiation of the second jump of the power and the temperature are marked as the blue (1) and the green (2) lines respectively.
Jmmp 03 00001 g009
Figure 10. The time traces of the temperatures measured in the center of the weld spot (dotted lines) and the corresponding adjusted amplitude for the controlled weld cases and the shaded areas represent the temperature spectrum from the repetitions. The results of the each control parameter case are plotted in (a) C-1, (b) C-2, (c) C-3, (d) C-4, (e) C-5.
Jmmp 03 00001 g010
Figure 11. The time traces of the weld power for the controlled weld cases (the plotted curves are for the weld spots whose temperature curves are plotted as the dotted line in Figure 10).
Jmmp 03 00001 g011
Figure 12. Section images from the computed tomography (CT) scans of three uncontrolled welds. The top sections are at the weld plane (B–B) and the bottom sections are across the weld spot (C–C). The schematic drawings on the left illustrate the location of the sections.
Jmmp 03 00001 g012
Figure 13. The images from the CT scans of five controlled welds. The top images are at the weld plane (B–B) and the bottom ones are at a cross-section through the weld spot (C–C) (for the section locations, refer to Figure 12).
Jmmp 03 00001 g013
Figure 14. Microscopic images of the fracture surfaces (at the weld plane B–B) of the controlled weld spots. An exemplary fracture surface was chosen from each controlled weld case (images taken with a resolution of 1024 × 768 pixels using a stereo-microscope with a magnification of 2×).
Jmmp 03 00001 g014
Figure 15. CT scan of a controlled weld spot without the presence of the thermocouple. The weld was done under similar conditions and with parameters as the C-5 case.
Jmmp 03 00001 g015
Table 1. Weld parameters used for the experimental analysis of the uncontrolled and the controlled ultrasonic spot welds (the represented parameters are taken from the control algorithm in Figure 4).
Weld CaseStart Amplitude d (%)Weld Duration tw (sec)dPset1 (W/s)dPset2 (W/s)dPset3 (W/s)a (%)b (%)c (%)
UC-1801Inf.Inf.Inf.000
UC-2801.8Inf.Inf.Inf.000
UC-3802.5Inf.Inf.Inf.000
C-1802.5100Inf.Inf.100
C-2802.5200Inf.Inf.100
C-3802.5300Inf.Inf.100
C-4802.5100300500123
C-5802.52006004000123

