1. Introduction
Simulation-based process analysis has become a fundamental tool for examining and improving complex manufacturing systems [
1,
2,
3]. The expanding application of discrete-event simulation allows for the thorough modeling of system dynamics and perplexities that are complicated to solve using analytical approaches. Such models are perpetually used like Tecnomatix Plant Simulation in industrial environments, which offer high quality representation of real-world processes [
4,
5]. Nevertheless, while simulation models provide precision, their fusion with optimization approaches persists a major challenge. From the stochastic nature of system outputs, a significant challenge arises in simulation-based optimization. Performance measures such as throughput, congestion, and failure time are typically subject to random variability, necessitating multiple replications to gain relevant estimation. A widespread approach is to apply a fixed number of simulation runs for each candidate solution [
1,
5,
6]; however, this often results in the ineffective use of computational resources. In many cases, either needless simulations are carried out, or the estimation accuracy proves insufficient for reliable decision-making [
7]. As soon as multiple performance indicators have to be examined simultaneously, this issue becomes more pronounced. To treat these difficulties, various approaches have been proposed in the literature, including sequential sampling, variance reduction techniques, and optimization under uncertainty [
8,
9]. Specifically, adaptive sampling strategies based on confidence intervals have shown promise in dynamically balancing estimation accuracy and computational effort. However, most existing methods focus on single-objective settings or rely on simplified assumptions, limiting their applicability in realistic industrial scenarios where multiple stochastic performance measures must be evaluated.
There are several optimization options available, which can be applied in a simulation-based environment. Additionally, evolutionary algorithms, and in particular evolution strategies, have been repeatedly used in optimization problems with noisy objective functions [
10,
11,
12]. Their population-based structure and robustness to noise make them appropriate for simulation-based environments. Nevertheless, their efficiency firmly relies on the value and cost of fitness evaluations, which in turn are promptly affected by the replication strategy used during the simulation.
The repeated simulation experiments performed in this study can be interpreted as a Monte Carlo simulation, where each independent replication represents one realization of the stochastic manufacturing system. Monte Carlo methods are widely applied in discrete-event simulation to estimate the expected values of performance measures and to quantify the uncertainty associated with stochastic model outputs. In simulation-based optimization, Monte Carlo replications grant statistically reliable estimates of objective functions while accounting for the inherent randomness of manufacturing processes. The adaptive replication strategy proposed in this work can therefore be regarded as an adaptive Monte Carlo sampling procedure, where the number of replications is determined dynamically according to confidence interval criteria.
This paper presents a simulation-based optimization framework that implements a discrete-event simulation model with a MATLAB-based evolutionary optimization environment. The proposed approach creates a bidirectional interface between the simulation model integrated in Plant Simulation and the optimization algorithm, providing an automatic and iterative evaluation of candidate solutions. The main contribution of the study is the development of an integrated framework that combines discrete-event simulation, evolutionary optimization, adaptive confidence interval-based replication, sensitivity analysis, and statistical convergence analysis into a unified workflow for stochastic manufacturing systems. Unlike traditional approaches that use fixed replication, the method takes multiple performance measures into account simultaneously and applies metric-specific stopping criterion to provide statistical reliability while decreasing computational effort. The suggested framework is intended as a reusable architecture that can be adapted to other stochastic manufacturing systems with some modifications to the simulation model and optimization objectives.
The framework is validated through benchmark experiments comparing adaptive and fixed replication strategies, as well as repeated optimization runs to evaluate computational efficiency, repeatability, and robustness.
2. Literature Review
In recent decades, simulation-based optimization problems have become common as a result of the increasing complexity of production and logistics systems. Such problems are defined by the stochastic nature of the output data, which demands specific methods of analysis and optimization. In such cases, the objective function is declared regarding the stochastic output of a simulation model, making the optimization process considerably more complicated in comparison with deterministic formulations. A comprehensive overview corresponding to such problems and methods for solving them is given in the works of [
2,
13], which highlight the significance of accounting for the randomness of the output data and the high computational cost of simulation. More recent reviews verify the relevance of this field and highlight the growing interest in simulation-based optimization problems under conditions of high uncertainty [
3,
14]. In particular, there has been an increased focus on methods that explain the computational constraints and the stochastic nature of the output data.
A more thorough analysis of methods for the statistical processing of simulation results is shown in [
6], which handles problems connected to the estimation of mathematical expectation, variance, and the construction of confidence intervals. Among the optimization methods without having an analytical form of the objective function, evolutionary algorithms—especially evolutionary strategies—play a significant role. Their theoretical basis is presented comprehensively in the works of [
10,
11], examining the mechanisms of mutation, selection, and adaptation of search parameters. Specifically, step-size adaptation is a key element that secures a balance between the exploration of the solution space and the convergence of the algorithm. Regarding the stochastic objective functions, the efficiency of evolutionary methods is further analyzed in the works of [
12,
15], which investigated approaches to manage noisy estimates and enhance algorithm stability. The issue of noise in objective function estimation has also been presented in recent research. Studies by [
7,
13] demonstrated that resampling and averaging are key mechanisms for improving the robustness of evolutionary algorithms in stochastic environments.
As the outputs of simulation models are contingent on random variations, it is essential to use multiple runs (replications) to obtain reliable results. Classic methods for examining output data and planning experiments are presented in the works of [
1,
5], highlighting the demand for using statistical methods to ensure the reliability of the results. In addition, the use of confidence intervals as a measure for determining the number of replicates is theoretically grounded in the work of [
7,
8], proposing sequential techniques that consider adaptive adjustment of the computational load. Further developments in adaptive sampling methods are demonstrated in the works of [
8], which investigated sequential procedures that ensure the number of replications to be dynamically adjusted based on statistical criteria, such as the width of the confidence interval.
The challenge of effectively distributing computational resources among various options has also been extensively investigated in the literature. In their work, ref. [
7] recommended an optimal configuration-based assignment (OCBA) approach aimed at enhancing the effectiveness of comparing alternatives, while [
16] investigated methods for selecting the best system established based on statistical criteria. These studies show that adaptively increasing the number of observations for upcoming solutions can considerably enhance the effectiveness of optimization. More recent studies on simulation budget allocation and stochastic optimization emphasize the importance of balancing computational effort and estimation accuracy under limited computational resources [
3,
7].
An additional consideration is the need to account for the variability of the system’s parameters. Several studies on robust optimization, for instance, by [
17,
18,
19], highlight the significance of accounting for uncertainty in the parameters and input data when formulating the objective function. Methods for decreasing variance and assessing stochastic characteristics are analyzed in detail in [
9], justifying the involvement of penalties for variability in the optimization objective function. Recent studies in stochastic and robust optimization suggest explicitly incorporating variability and uncertainty measures into the objective function in order to obtain more reliable and robust solutions under stochastic conditions [
17,
18,
19]. Similar considerations have also been addressed in noisy multi-objective evolutionary optimization frameworks [
12,
15].
Furthermore, quantitative approaches for uncertainty assessment and robustness evaluation in stochastic optimization problems have been extensively investigated in the literature [
17,
18,
19]. These studies emphasize the importance of evaluating the reliability and stability of the obtained solutions under uncertain operating conditions.
Thus, the existing literature shows that effectively solving simulation-based optimization problems requires a comprehensive approach that includes the use of stochastic optimization methods, statistically sound analysis of output data, and consideration of the variability and robustness of solutions. Although simulation-based optimization, adaptive replication, and evolutionary algorithms have been studied, they are often used separately or within problem-specific implementations. Their combination in a single framework for stochastic manufacturing system optimization remains an area where further investigation is possible. In addition, the integration of discrete-event simulation, external optimization, adaptive confidence interval-based replication, and robustness-oriented objective evaluation for stochastic manufacturing systems within a practical manufacturing framework is still limited in the literature and is less explicitly investigated in the context considered in this study. To treat this gap, this study proposes an integrated optimization framework coupling Siemens Tecnomatix Plant Simulation with MATLAB, providing a practical and computationally efficient approach for robust manufacturing system optimization under uncertainty. The study focuses on the integration and experimental evaluation of established simulation, optimization, and statistical techniques within a single framework for stochastic manufacturing system optimization. The framework is further investigated against fixed-replication strategies to quantify the trade-off between computational effort and solution quality.
3. Methodology
3.1. Framework
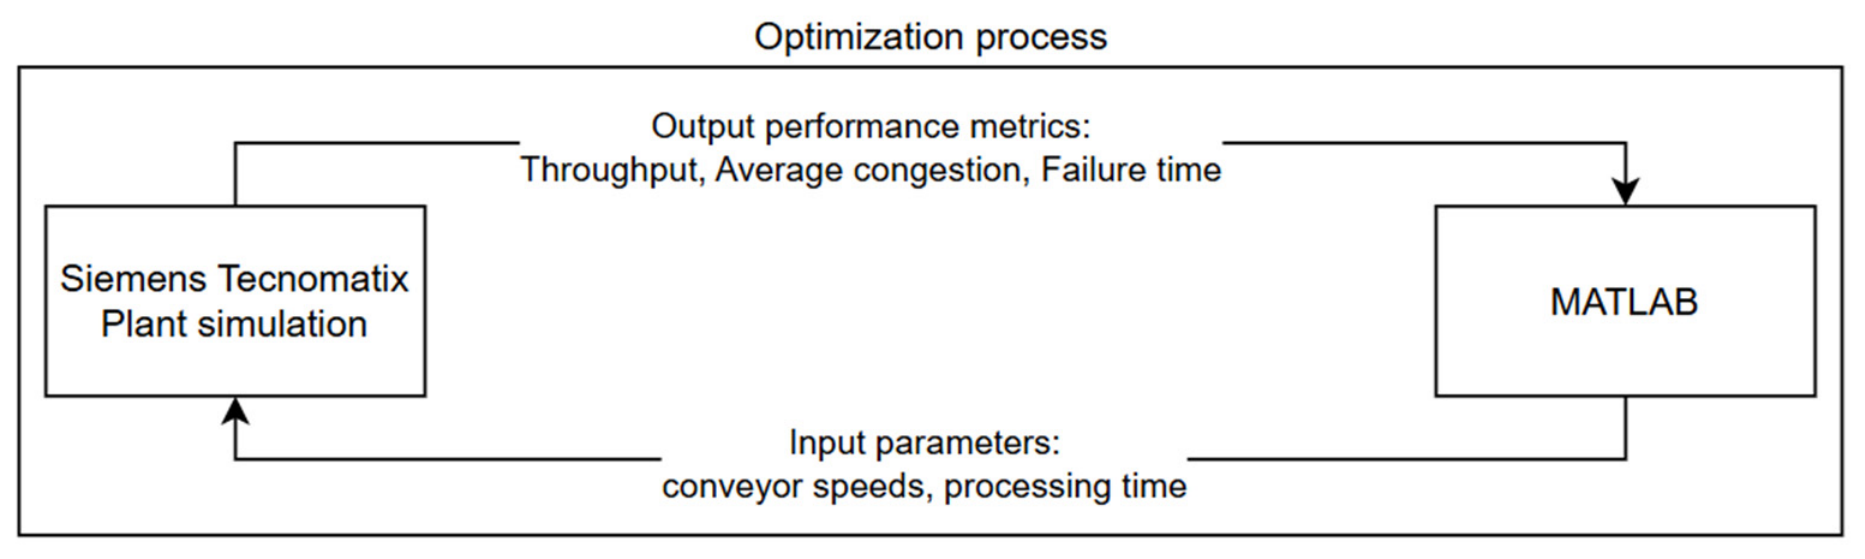
In the proposed framework, a discrete-event simulation environment is integrated with an external optimization engine to assist in the efficient investigation of the decision space of stochastic manufacturing systems. The optimization logic is executed in MATLAB, while the simulation model is realized in Tecnomatix Plant Simulation. Between the two environments, the communication is created through a file-based interface, allowing for the exchange of input parameters and simulation outputs in an automated and iterative manner. The optimization algorithm generates a candidate solution defined by a set of decision variables in every iteration step. These parameters are provided into a simulation model, which evaluates the system performance and outputs key performance indicators. As soon as the termination condition is met, this loop is repeated, allowing advanced optimization techniques to be applied to simulation models without having to change the internal structure of the simulation model.
Figure 1 shows the proposed framework.
The communication between MATLAB and the simulation model is implemented through the Tecnomatix Plant Simulation COM (Component Object Model) RemoteControl interface. MATLAB establishes an ActiveX connection to the Plant Simulation environment, loads the simulation model, and automatically controls the execution of simulation experiments. For each candidate solution produced by the optimization algorithm, the corresponding parameter values are exported to a CSV file, which is subsequently imported by the simulation model via an internal SimTalk procedure. After the simulation run is completed, the resulting performance indicators are exported back to MATLAB through a second CSV file, where statistical evaluation, adaptive replication control, and objective-function computation are performed. This bidirectional communication allows for fully automated iterative optimization without manual intervention.
3.2. Decision Variables and Performance Indicators
The optimization problem is formulated over a set of continuous variables that affect the operation of the production system, including processing time, conveyor speed, or other control parameters specific to the system. The effectiveness of this solution is evaluated using several stochastic performance metrics derived from a simulation model:
throughput (number of manufactured parts),
average congestion levels in the system,
system failure time.
Obviously, other variables and performance metrics can be used generally, describing the system in the best way.
Each performance indicator is subject to fluctuations due to the stochastic nature of the model, which requires multiple iterations for a parameter set to obtain reliable estimates.
3.3. Iterative Optimization
The current framework can naturally be interpreted within the context of an optimization problem based on simulation modeling, where the interaction between MATLAB and the discrete-event model forms an iterative stochastic process. Let
θ ∈
Θ be a vector of controllable parameters (e.g., processing times, conveyor speeds), and let
Y(
θ,
ξ) be the stochastic output of the model given the random factors
ξ. The objective function
J(
θ) is formulated as follows [
2]:
where
g(·) describes system characteristics as function such as throughput, failure time, or congestion levels and
J(
θ) denotes the expected objective value over all possible realizations of the stochastic simulation output. Since this expectation cannot be evaluated analytically, it is approximated using Monte Carlo simulation.
Thus, the optimization of the objective function is:
In this implementation, MATLAB acts as an external optimization module that generates a sequence of parameters
θk, while the simulation model returns noisy estimates of the objective function. The iterative process can be represented as follows [
2]:
where
A is the parameter update rule, and
is the simulation result for
θk. This formulation highlights the stochastic and “black-box” nature of the problem. Consequently, an analytical evaluation of the function
J(
) is not possible, and its value is estimated based on a finite number of stochastic simulations. Let {
ξ1,
ξ2,…,
ξr} be independent realizations of the random factors. An unbiased estimator of
J(
θ) is given by:
This justifies the use of simulation-based optimization methods, as well as the need for multiple iterations and statistical analysis to ensure the reliability and robustness of the resulting solutions. In the remainder of this paper, the function
g(·) is specified as a normalized weighted combination of several performance metrics, with additional consideration given to variance [
2].
3.4. Objective Function
Several performance indicators are combined into a scalar objective function, so the optimization performed is reduced into an objective function. First of all, the input data are normalized relative to a baseline configuration and then summed using a weighted aggregate formula as follows:
where
,
, and
are the average throughput, failure time, and congestion,
,
,
are values of the corresponding metrics for the base configuration, and
w1,
w2,
w3 are user-defined weights considering the relative importance of each performance measure (
w1 = 1,
w2 = 0.8,
w3 = 0.6), ensuring comparability between indicators of different scales, allowing flexible prioritization dependent of the application context.
is a variance-based regularization term, accounting for the robustness. The weight of the variance penalty was chosen empirically to stabilize performance progress and robustness.
To account for stochastic variability, a variance penalty is introduced:
This formulation allows us to account for both the average performance of the system and the stability of the solutions obtained, reflecting a risk-averse optimization strategy, where not only the expected system performance but also its statistical stability is considered.
Evolution Strategy
The optimization process is carried out through a (1, λ)-evolutionary strategy, which is appropriate for continuous optimization problems with objective functions subject to noise. A set of λ offspring solutions is generated in each iteration by adapting Gaussian perturbations to the current parent solution, defined as [
2,
10]:
where
indicates the mutation step size,
is the diagonal scaling matrix accounting for parameter ranges, and
denotes a multivariate normal distribution.
The most effective offspring supersedes the existing solution, and the process is reproduced iteratively. The best candidate is selected based on the value of the objective function [
2,
12]:
The step size can be dynamically modified to secure a balance between exploration and convergence during the search.
3.5. Adaptive Replication Strategy
An adaptive replication mechanism is a key component of the proposed architecture, fashioned to effectively handle the stochastic variability of simulation results.
Rather than using a fixed number of iterations for each possible parameter set, the number of simulation runs is controlled dynamically based on confidence intervals.
For each evaluation metric, the following are calculated as averages:
As new iterations are performed, the sample mean and standard deviation are upgraded incrementally for each performance metric. After achieving the minimum number of repetitions
Nmin, which is selected to secure the statistical stability of the initial estimates, the half-width of the 95% confidence interval is calculated in the following manner:
where
s is the sample standard deviation,
r is the number of replications, and
is the critical value of the Student’s
t-distribution with
r − 1 degrees of freedom in the case of the 95% confidence level (
= 0.05). Since the true variance of the simulation output is unknown and must be approximated from the available replications, the confidence interval is calculated using the Student’s
t-distribution. This offers a more accurate estimate of the confidence interval, significantly when only a limited number of replications is available [
1].
A threshold value
ε is defined as a combination of absolute and relative criteria for each performance metric:
The stopping criterion for adaptive replication is founded on confidence interval half-widths determined relative to the magnitude of the estimated performance metrics. Particularly, a relative precision requirement (e.g., 3–10%) is introduced, together with a minimum absolute threshold to avoid early stopping for small values. These values were chosen empirically based on prior simulations.
The replication process is complete when the half-width of the confidence interval for all performance metrics satisfies the following condition:
or when a maximum number of repetitions
Nmax is fulfilled. This stopping criterion, which takes multiple metrics into account, ensures that all relevant performance metrics are evaluated with sufficient accuracy while evading unnecessary simulation runs.
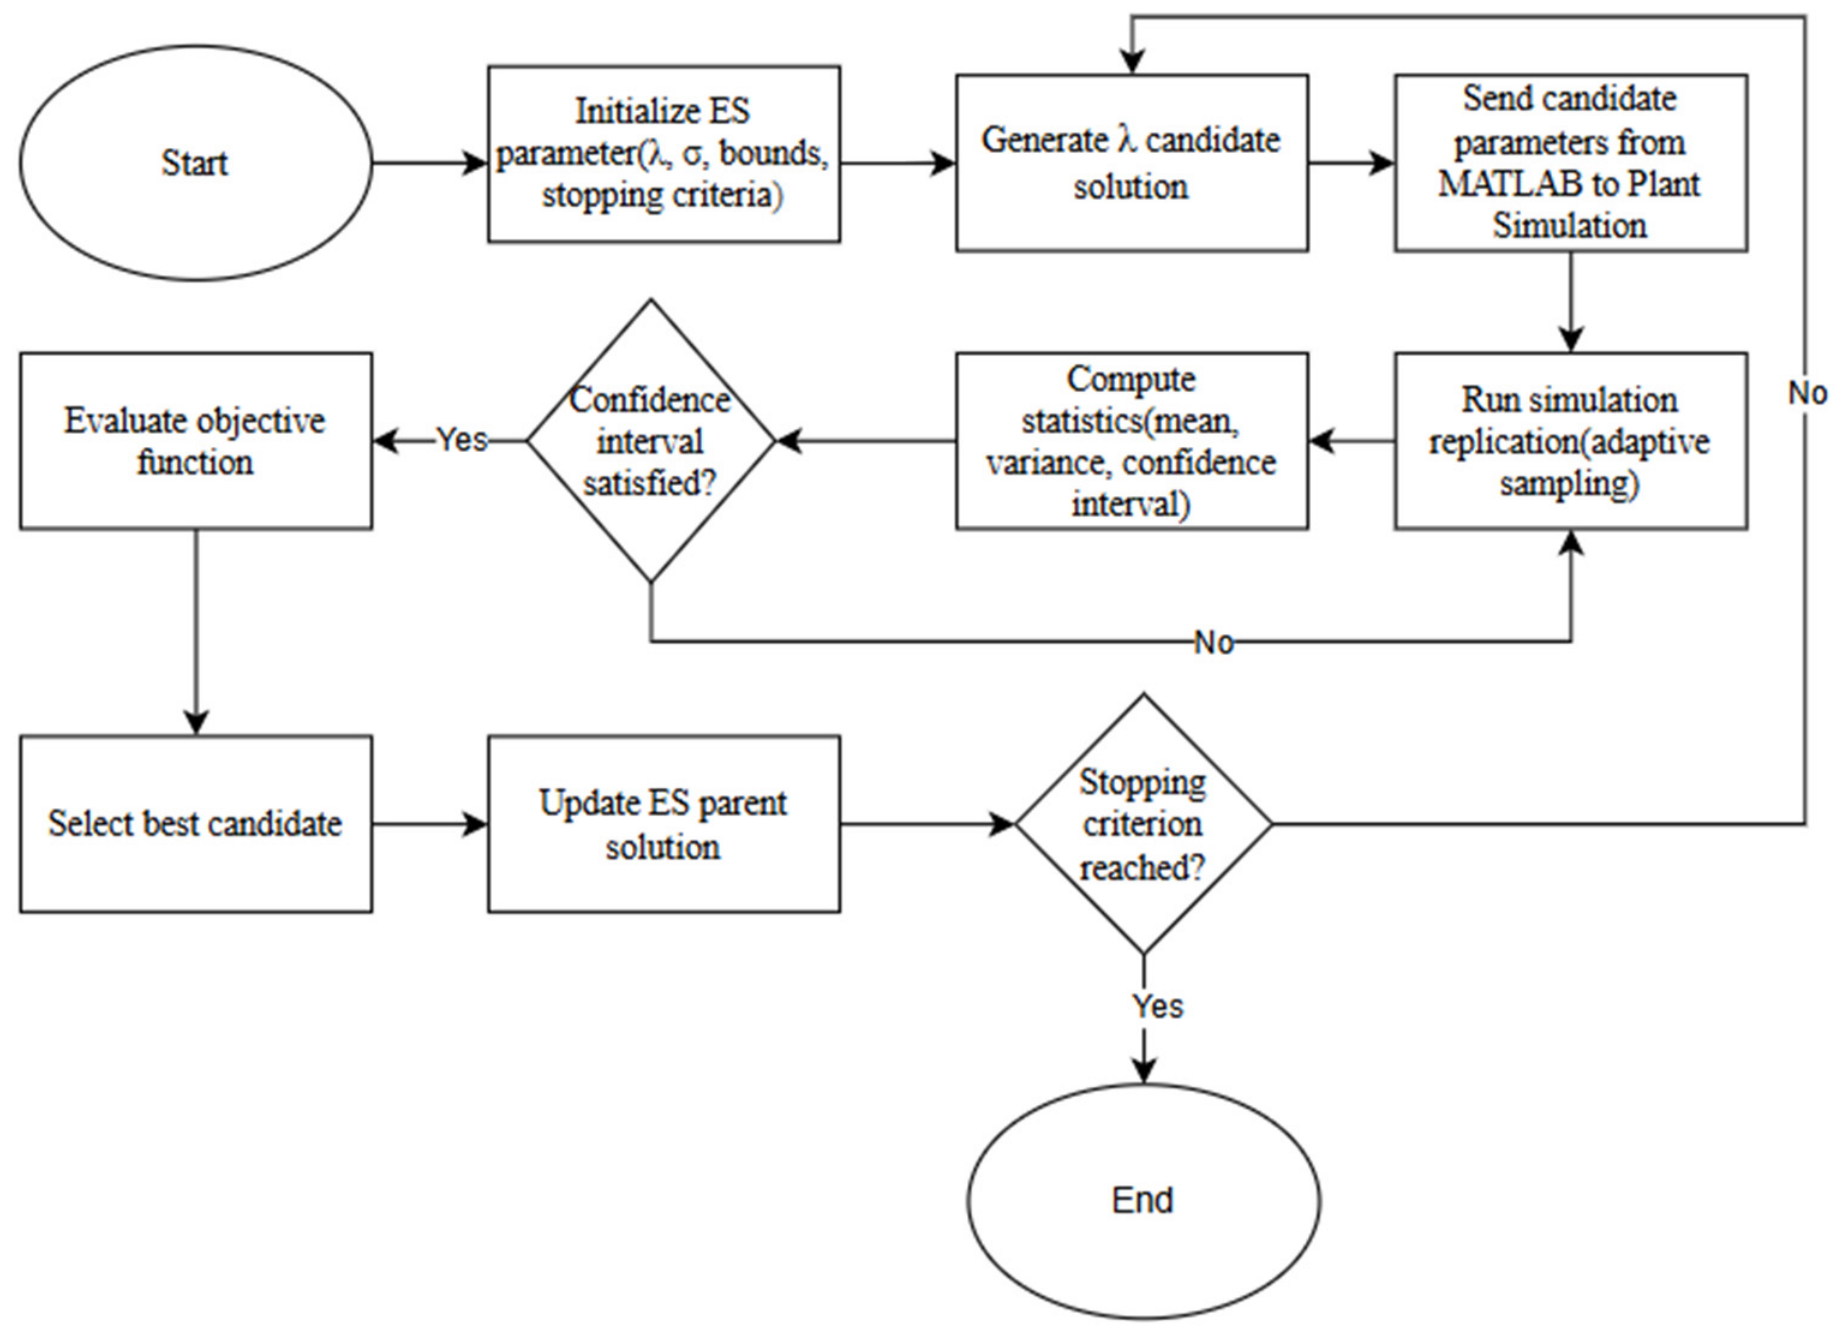
The general optimization procedure can be described as follows:
Initialization of decision variables and strategy parameters;
Evaluation of the baseline solution;
Repetition until complete:
- (a)
Generation of candidate solutions using an evolutionary strategy;
- (b)
Evaluation of each candidate solution employing adaptive replication;
- (c)
Selection of the solution with the best characteristics.
Returning the best solution found during the process.
The flowchart of the optimization process can be seen in
Figure 2.
3.6. Sensitivity Analysis
In order to assess the robustness of the optimized solution, a local sensitivity analysis was performed after the optimization process, which examines how small variations in the optimized input parameter influence the corresponding performance indicators. The analysis was performed by perturbing each decision variable independently while keeping the remaining parameters fixed at their optimized values. Three perturbation levels (−10%, 0%, and +10%) were applied for each parameter. For every perturbed configuration, multiple independent simulation replications were performed, and the corresponding mean values and 95% confidence intervals of throughput, failure time, and average congestion were calculated:
where
denotes the relative perturbation used for a single decision variable, while all remaining variables remain unchanged.
3.7. Benchmark Comparison
To evaluate the proposed framework, benchmark experiments were conducted using fixed replication strategies (10, 20, and 30 replications) together with the proposed adaptive strategy. Furthermore, the complete optimization procedure was repeated six times to evaluate the repeatability and robustness of the obtained solutions.
4. Case Study—Discrete-Event Simulation Model Settings
4.1. System Description
As a demonstration example to showcase the proposed framework, a production system was modeled in the Plant Simulation discrete-event simulation environment. The developed simulation model is inspired by an industrial production line. The layout of the model is based on an existing system, and the conveyor lengths were defined according to the physical dimensions of the real system. Dimensions of the conveyors were (unloading) 1.8 m × 1 m and (bending) 1 m × 1 m. Nevertheless, certain subprocesses for which detailed observations were unavailable were modeled using the default assumptions and parameter settings of the simulation environment. The system consists of a simplified production line comprising a decoiling and punching station, two conveyors, representing unloading and bending, one turnover station, an unloading process, an orientation for packing, and a pallet loading station. The material flow passes sequentially through the production line from left to right.
The representation of the model can be seen in
Figure 3.
During system operation, bottlenecks and downtime may occur due to limited throughput capacity and stochastic machine failures, and processing time is treated as a deterministic decision variable optimized by the proposed framework. In the model, the stochastic behavior is implemented through the built-in object of Tecnomatix Plant Simulation. Time between failures are created based on negative exponential distribution, and repair durations follow an Erlang distribution. The calculations were based on 8-h shifts, so the simulation time was set accordingly. In order to handle initialization effects, each simulation replication was launched from the same system state to ensure a consistent comparison between alternative parameter configurations. As all candidate solutions were assessed under identical initial conditions and simulation length, initialization effects influenced all alternatives equally and therefore did not affect the relative comparison performed during the optimization.
4.2. Decision Parameters
This study examines three controllable parameters:
v1—speed of the first conveyor in [m/s];
v2—speed of the second conveyor in [m/s];
pt—processing time at the turnover station in [s].
The parameters are constrained to the following ranges:
These parameters directly affect system performance, including throughput, congestion, and downtime.
4.3. Performance Measures
The following key metrics are used to evaluate system performance:
Throughput—the number of items processed over a given period of time (maximized);
Failure time—the total system downtime (minimized);
Average congestion—the average load or backlog in the system (minimized).
In the simulation model, availability and MTTR (mean time to repair) stochastic parameters are defined as a function of processing time, meaning that increased cycle times result in lower availability and higher MTTR values. These indicators indicate various aspects of the production system’s efficiency and are often in conflict with one another, validating a multi-criteria approach to the problem.
4.4. Base Configuration
As a starting point, a baseline configuration of the system is used:
This configuration serves as a benchmark for normalizing performance metrics and subsequently comparing optimization results.
Baseline performance metrics can be found in
Table 1.
4.5. Objective Function
The objective is to find a set of parameters
that optimizes the system’s performance while taking several criteria into account. Considering the normalization relative to the baseline configuration, the problem is formulated as the minimization of a composite objective function that defines both the average values of the metrics and their variability (a detailed formalization is provided in the
Section 3). Thus, the problem under consideration is a stochastic multi-criteria “black-box” optimization problem, in which there is no analytical expression for the objective function; it can only be determined through the results of simulation modeling.
4.6. Failure and Maintenance Model
To integrate realism into the simulation model, this study employed a stochastic failure model that depends on the controlled parameter of processing time. The main idea is that reducing the processing time
leads to an increased load on the equipment, which, in turn, triggers more frequent failures and longer recovery times. The mean time between Failures (MTBF) is modeled using an exponential function of processing time [
20,
21,
22], following an exponential hazard formulation commonly used in reliability engineering [
22]:
where
is the basic failure rate,
is the reference processing time, and
is the sensitivity coefficient. This formulation reflects the exponential growth of the failure rate as the processing time decreases, also enabling the stochastic nature of the failure. The reference processing time and MTBF values were initiated as baseline parameters to normalize the failure model. Their values were chosen to represent a nominal operating condition of the system instead of a specific industrial dataset. The sensitivity parameter
controls the effect of processing time on failure rate. Its value was selected within a realistic range commonly reported in the reliability modeling literature, ensuring a moderate but noticeable dependency [
23]. The model is meant to capture qualitative system behavior rather than exact quantitative predictions.
4.7. Repair Time and Availability
The mean time to repair (MTTR) also relies on the processing time and is defined as a simple inverse relationship showing increased repair attempt under higher utilization, consistent with empirical observations in manufacturing systems [
21]:
where
is an empirical constant. This relationship represents the increase in repair time as equipment is used more intensively.
The availability coefficient is computed based on the MTBF and MTTR values [
21]:
In Plant Simulation, this parameter is used to generate stochastic machine failures.
4.8. Interpretation of the Model
The proposed model introduces a nonlinear relationship between system performance and reliability. Reducing processing time may improve throughput, but this is accompanied by an increase in failure rates and downtime. Thus, a natural trade-off arises between performance and reliability, making the optimization problem more realistic and practically significant.
5. Case Study—Experimental Structure
5.1. Optimization Algorithm Settings
In the study, evolutionary strategy was employed in the form of (1, λ) using the MATLAB environment. At each iteration,
candidate solutions are generated based on the current state using Gaussian mutation, which is consistent with the recommendations for low-dimensional continuous optimization problems, providing a good trade-off between exploration and computational effort [
10,
11]. The maximum number of iterations was set to
, which was found to be sufficient to ensure the convergence of the objective function while keeping the computational cost manageable. The initial mutation step size was set to
, according to the evolution strategy literature, chosen relative to the scale of the decision variables to ensure efficient exploration while maintaining search stability [
10,
11]. This was later adaptively adjusted during the optimization process based on improvement of the objective function. The solution is updated by selecting the best candidate at each iteration. Thus, the algorithm implements a greedy optimization strategy with search range adaptation. The parameter
is adapted in accordance with the following rule:
If the objective function improves, the step size increases.
If there is no improvement, the step size decreases.
This allows for a dynamic balance between exploring the solution space and local optimization.
5.2. Evaluation of Solutions and Replications
Whereas the simulation model has a stochastic nature, each parameter configuration is evaluated based on several independent runs (replications). An adaptive replication procedure based on confidence intervals is used to improve computational efficiency. Repeated simulations are performed until the specified estimation accuracy is achieved for each candidate point. Let be the number of repetitions executed. Thus, for each indicator, the following are computed:
As in the previous section it was mentioned, a 95% confidence level, the half-width interval, is defined using Formula (10). The replication process stops when the condition (11) is met considering the (12) inequality, allowing the number of simulations to be automatically increased only for “noisy” solutions, thereby reducing the total computation time.
6. Results
6.1. Optimization Result
In this section, the results of applying the proposed evolutionary optimization approach in combination with a simulation model is presented. The optimization problem is formulated as a stochastic minimization problem, where the objective function concurrently considers several various performance metrics: throughput, failure time, and average congestion. To clarify the stochastic nature of the simulation model, an adaptive replication scheme was applied, allowing the necessary number of runs to be determined dynamically founded on the width of the confidence intervals. The optimization algorithm is based on a (1, λ) evolution strategy, where candidates are created at each iteration using Gaussian mutation. The step size σ is adjusted during the search depending on the success of the objective function improvement. After running the algorithm ( iterations), the following optimal parameter configuration was acquired:
;
;
.
The corresponding system metrics:
The value of the objective function was:
To evaluate the reliability of the solution gained, an additional convergence analysis of the simulation output statistics was carried out, involving adaptive independent runs of the simulation model using the optimal parameters determined. The results showed:
Mean of the throughput = 298.8 parts, Standard deviation = 0.86 parts;
Mean of the congestion = 222.44 s, Standard deviation = 0.58 s;
Mean of the failure time = 543.66 s, Standard deviation = 71.16 s.
To further assess the robustness of the obtained solution, a sensitivity analysis was performed. Sensitivity analysis is widely used in simulation-based optimization to quantify the influence of input parameters on model outputs and evaluate the stability of optimized solutions under parameter perturbations [
24,
25] In this study, the optimized parameter set was perturbed around its nominal values, while all other parameters remained unchanged.
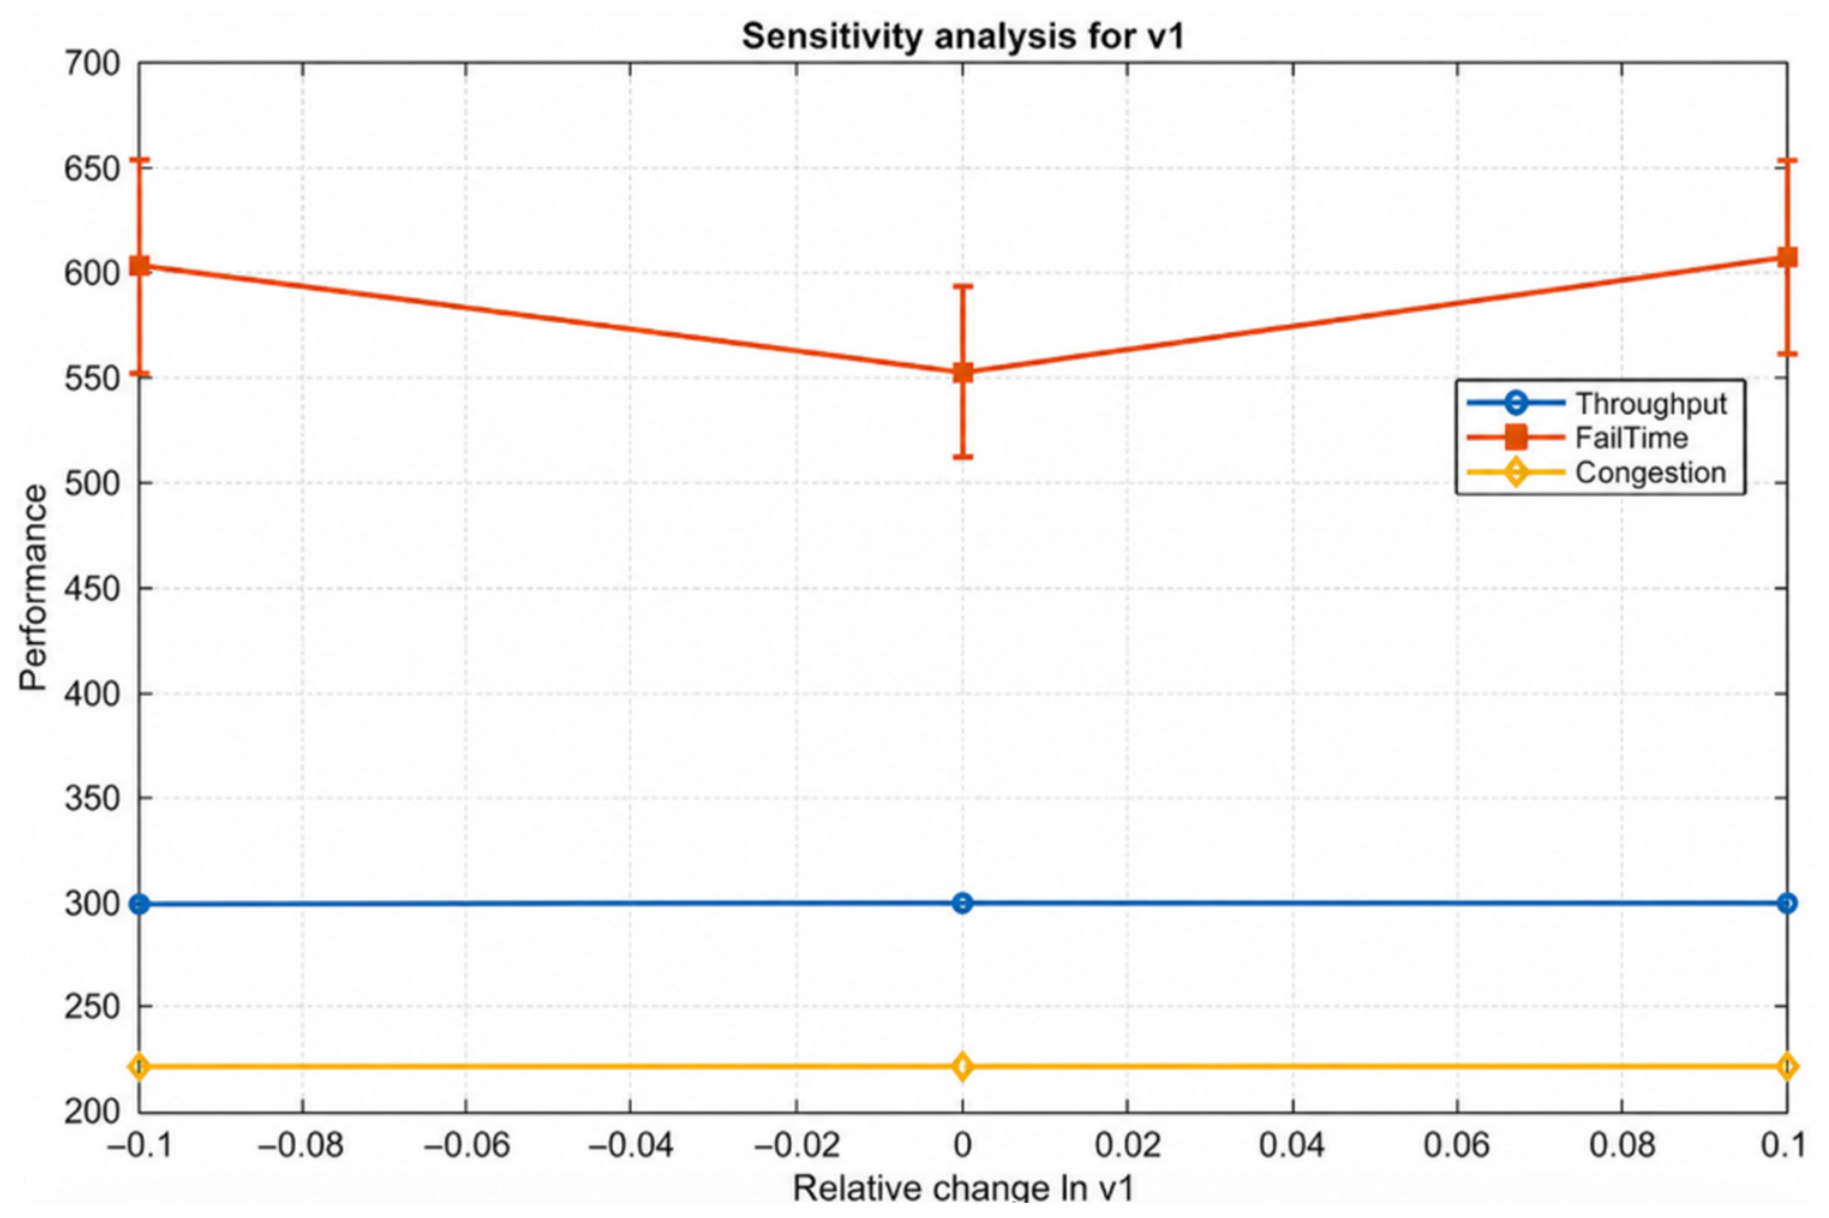
The low standard deviation for throughput and utilization metrics shows that the solution is highly stable in terms of these metrics. Concurrently, there is greater variability in failure times, which is due to the model’s stochasticity and rare but significant failures. In addition, a sensitivity analysis was applied to evaluate how the optimal solution reacts to modifications in the control parameters. Each parameter was varied within a range of ±10%, while the values of the other parameters remained fixed.
The results indicate that:
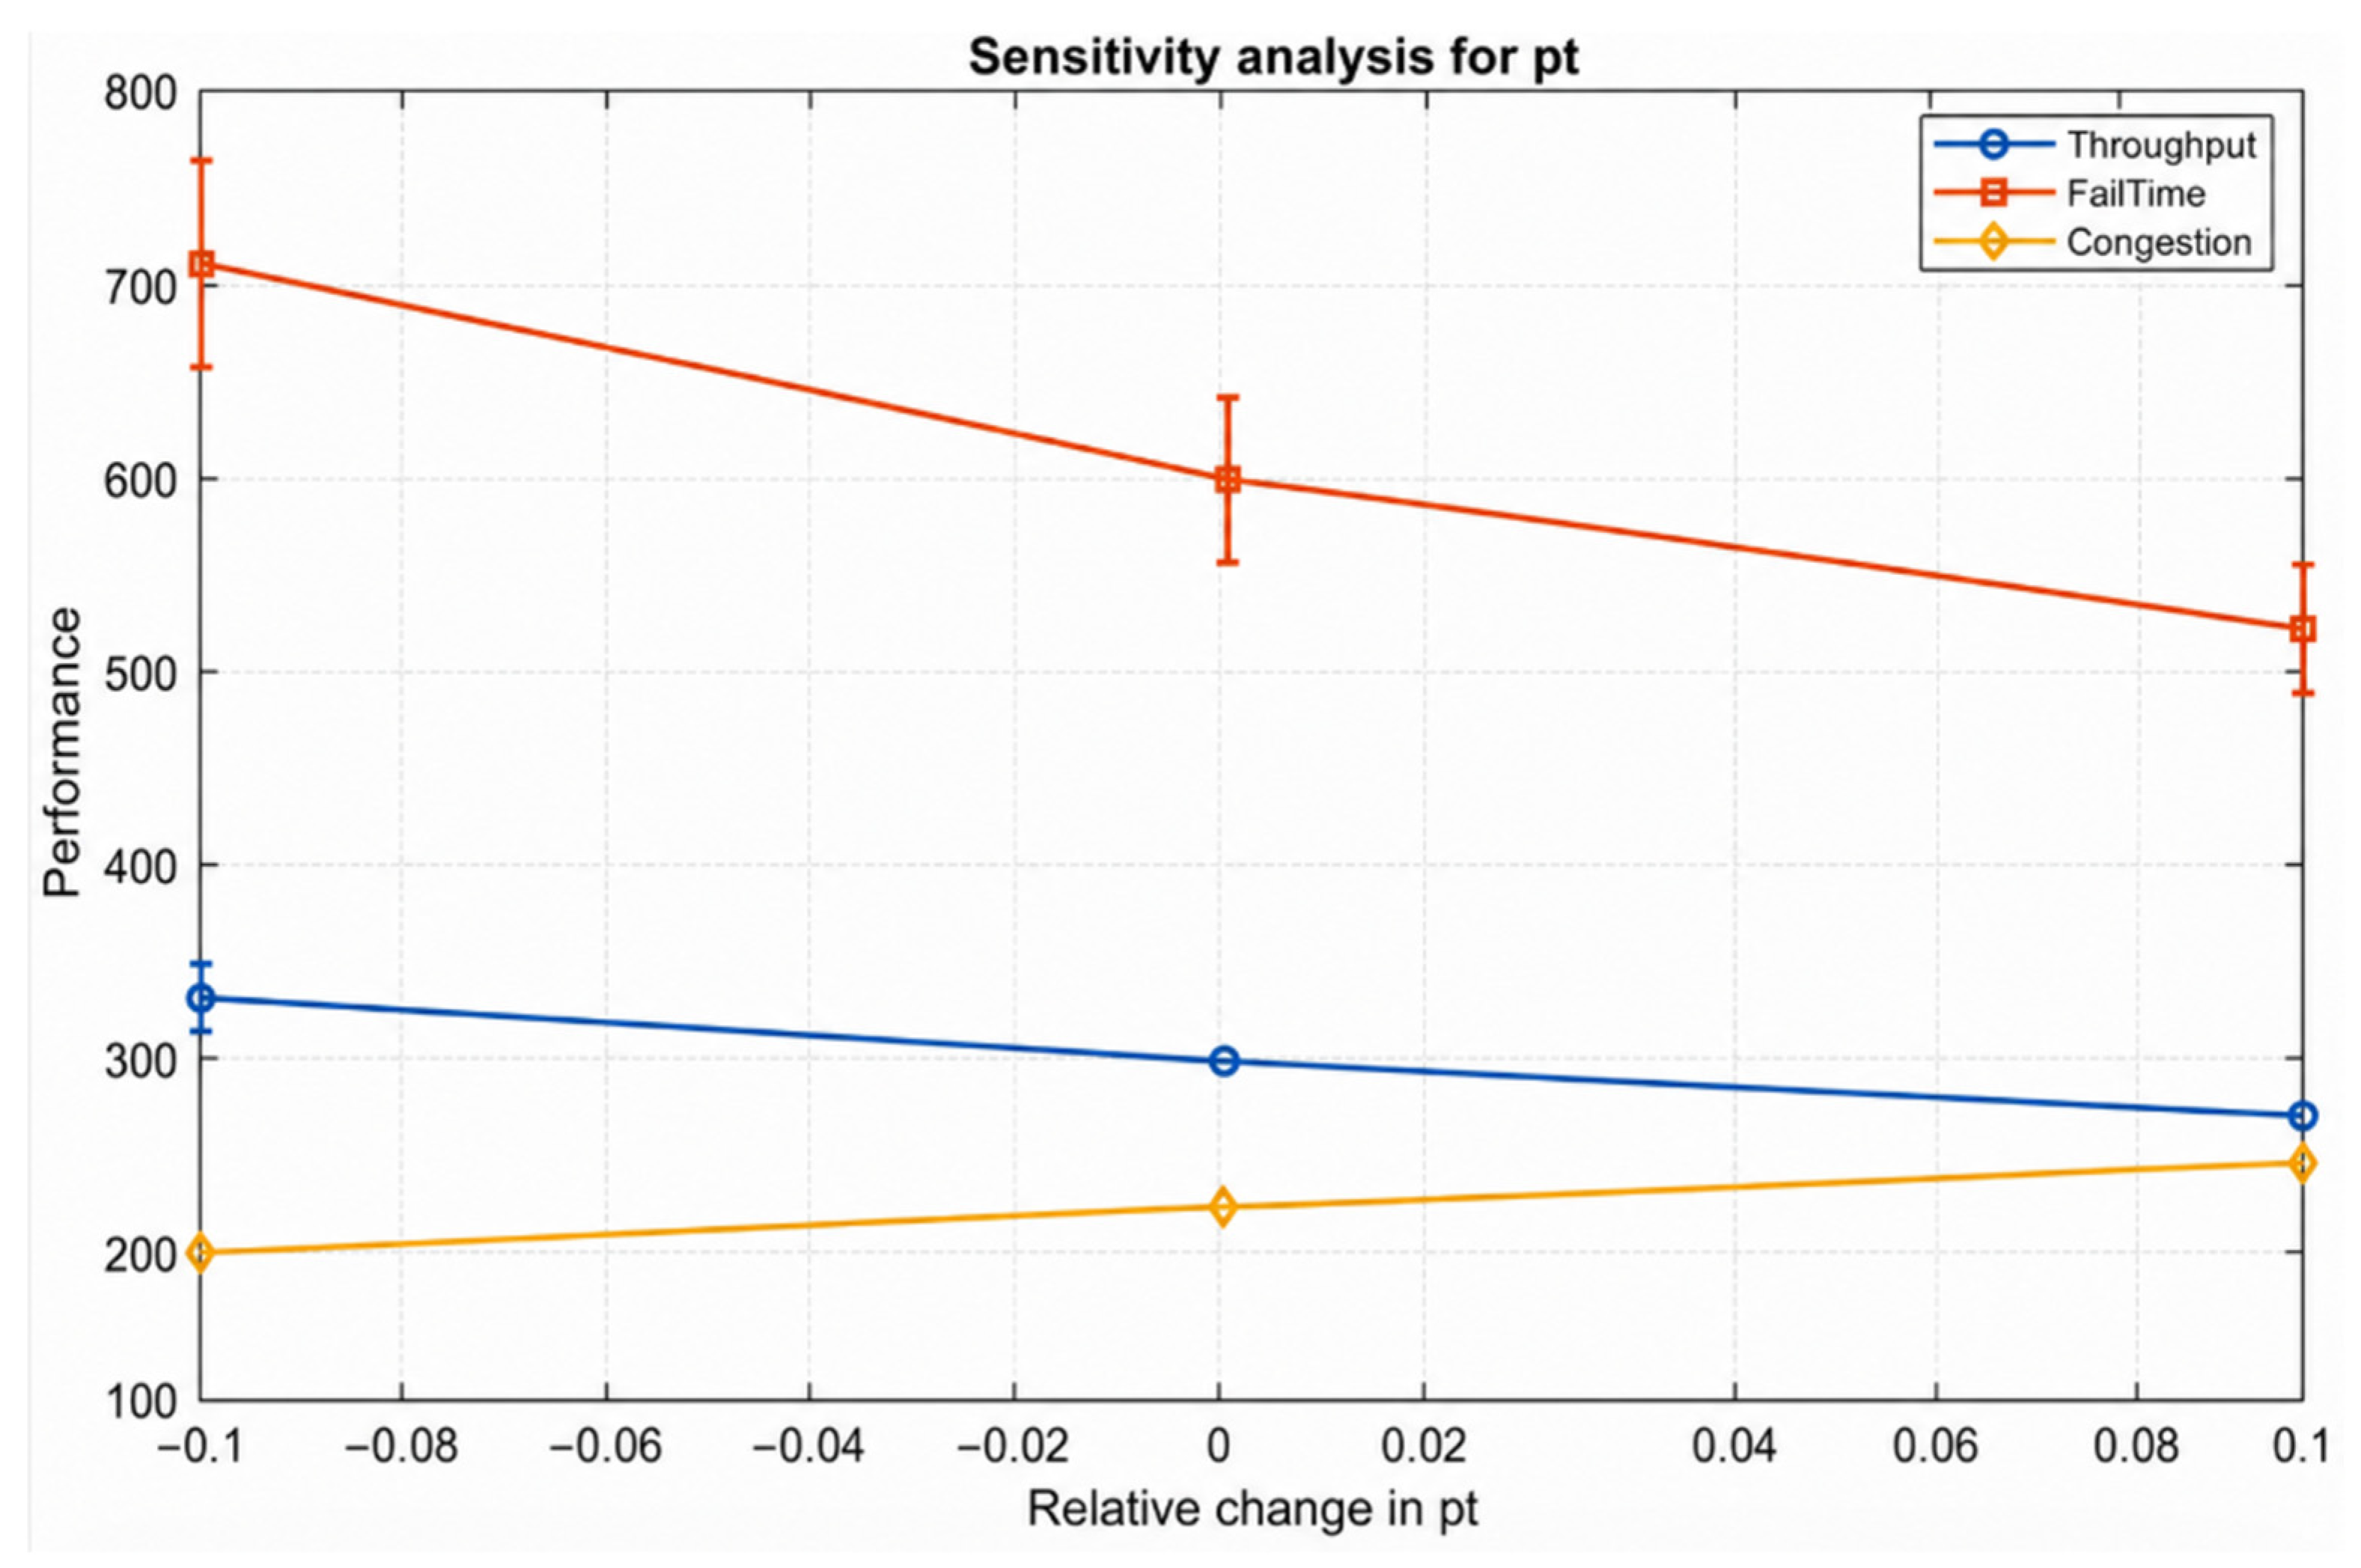
The parameter (processing time) has the greatest impact on the system; increasing it leads to a decrease in throughput and an increase in load;
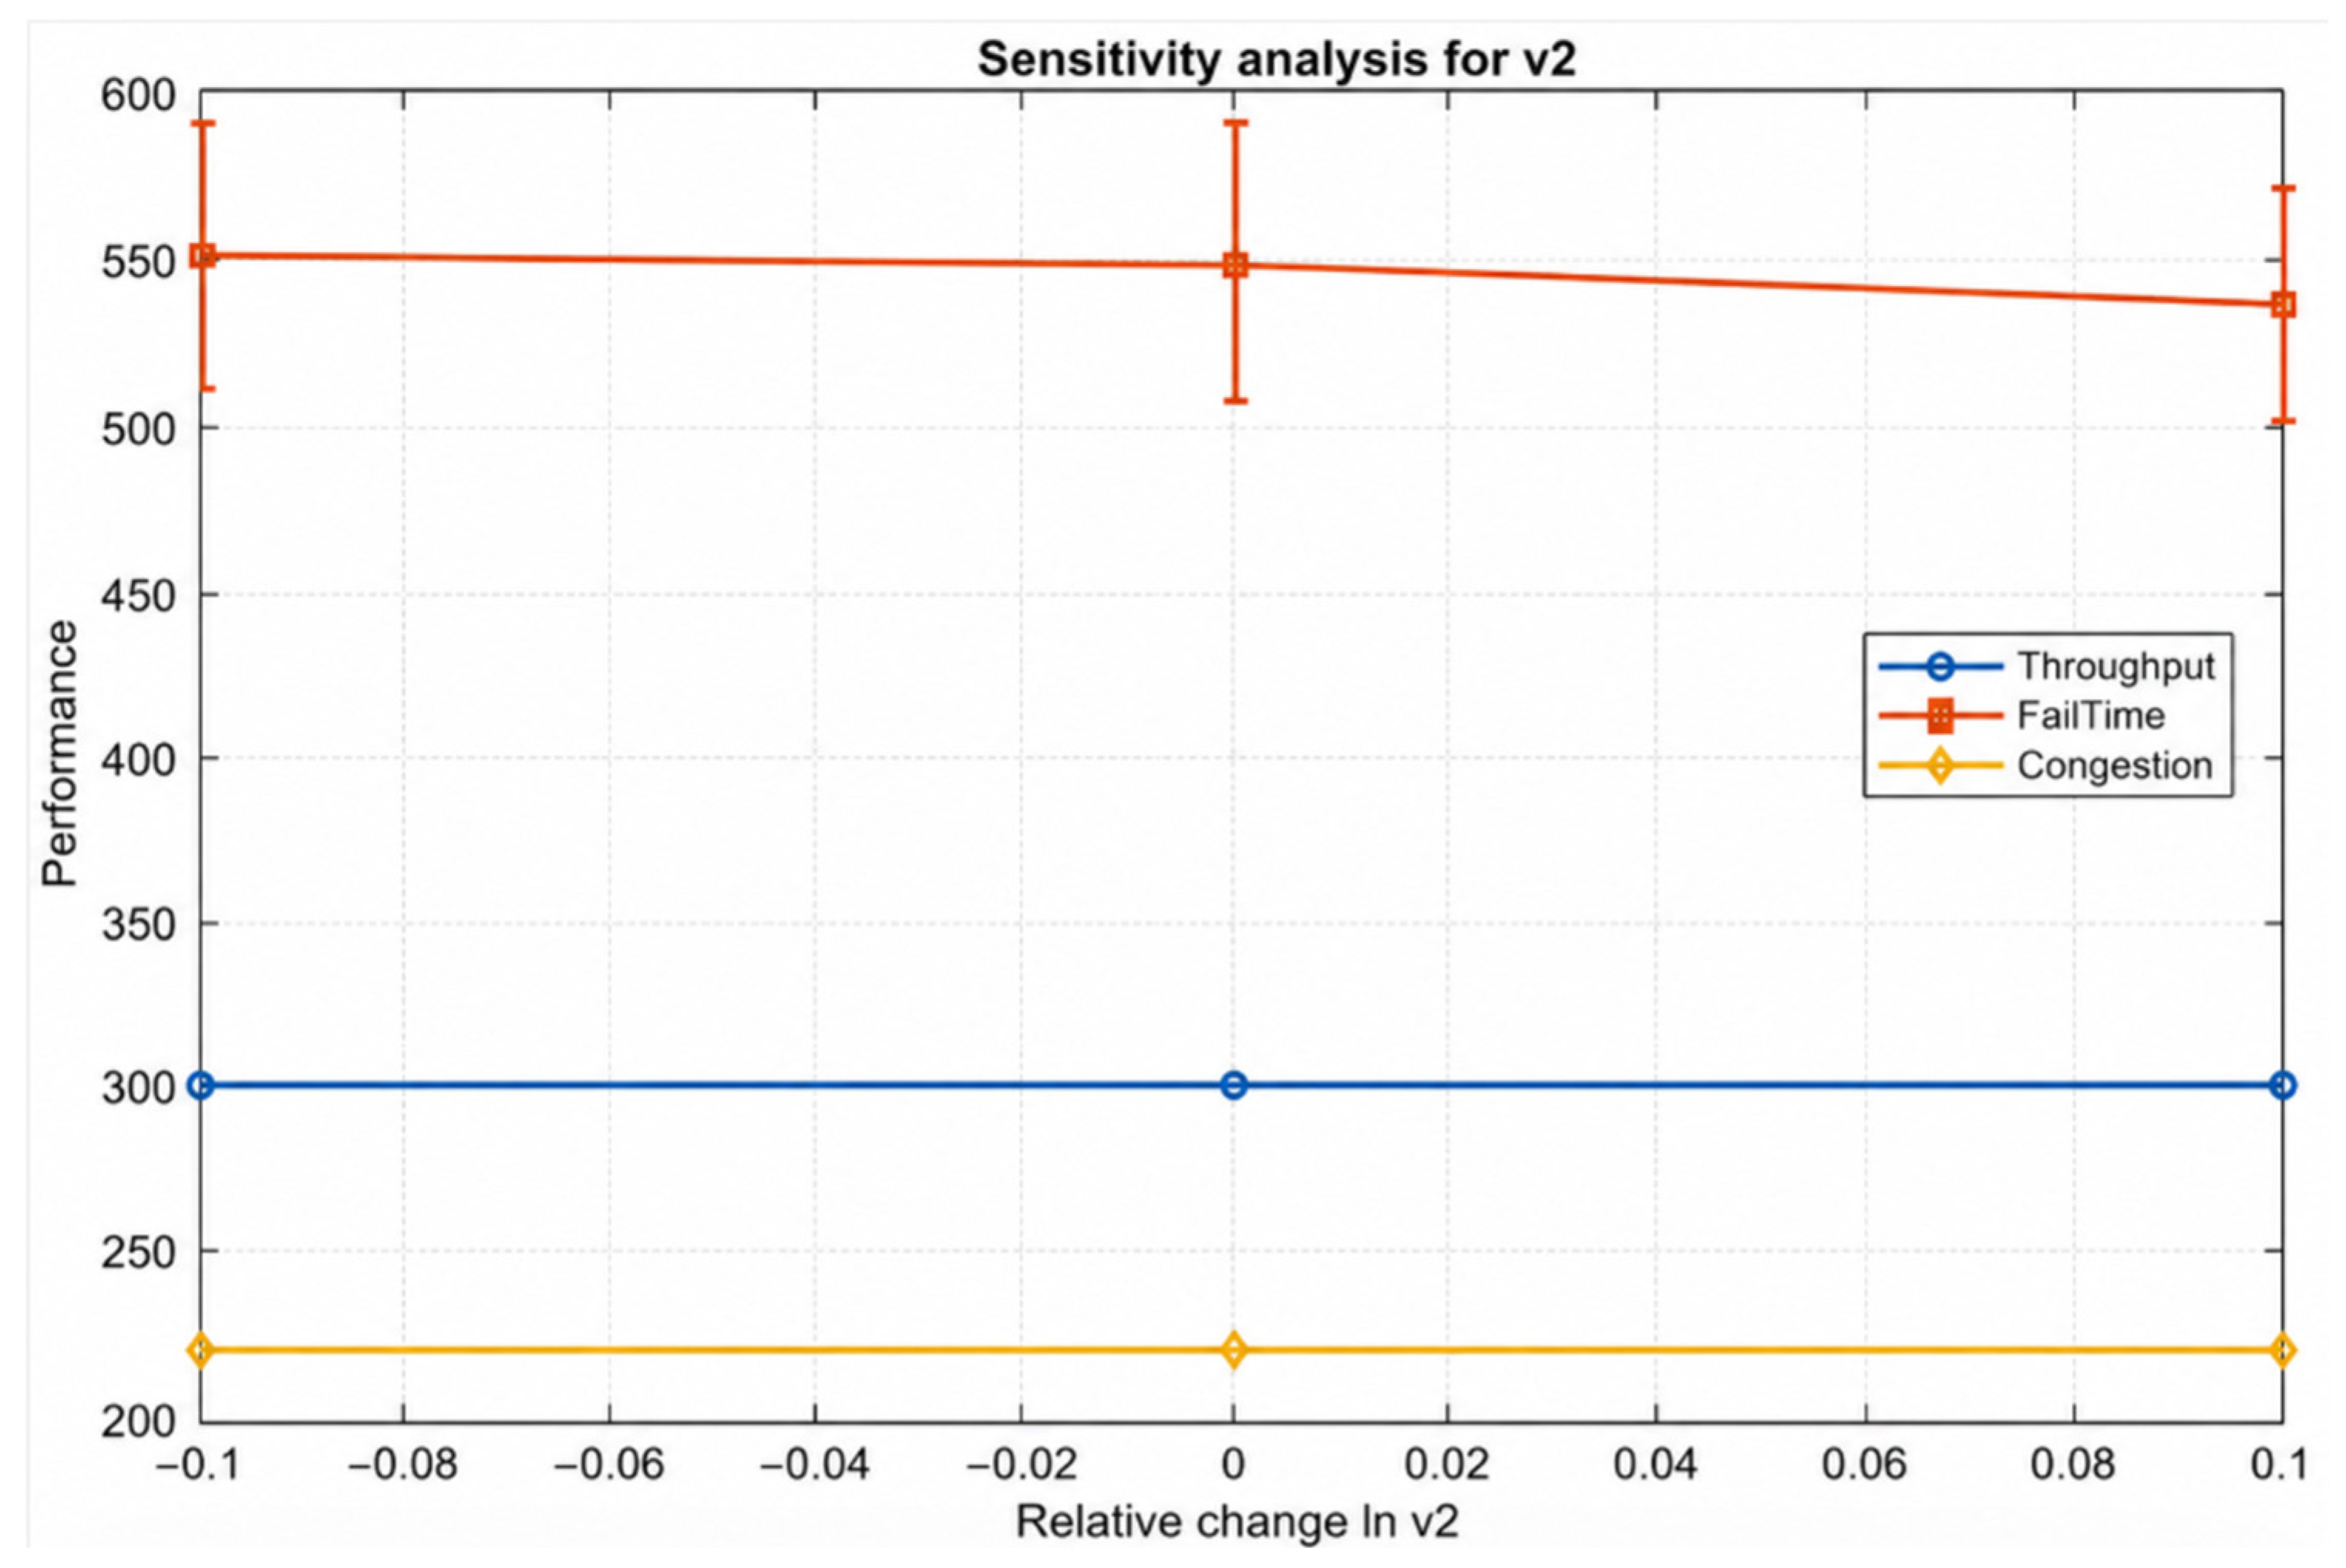
Parameters and have a relatively weak impact on the objective function near the optimum;
The system shows local stability, since small changes in the parameters do not lead to sharp degradations in performance.
The results verify that the proposed approach grants a robust and statistically reliable solution to the optimization problem under stochastic uncertainty. The sensitivity analysis of the input parameters around the optimal solution is shown in
Appendix A. The sensitivity analysis of the input parameters around the optimal solution is shown in
Figure A1,
Figure A2 and
Figure A3.
6.2. Convergence Analysis of the Optimal Solution
To evaluate the statistical convergence of the acquired optimal solution, a convergence analysis was carried out to evaluate the impact of the stochastic variability of the simulation model on the values of the output metrics. In this analysis, an adaptive number of independent model runs () was used with the optimal parameters obtained, allowing us to evaluate the distribution of the output metrics and their statistical features. The analysis generated the following results:
Throughput: mean = 298.8 parts, Standard deviation = 0.86 parts;
Average congestion: mean = 222.44 s, Standard deviation = 0.58 s;
Failure time: mean = 543.66 s, Standard deviation = 71.16 s.
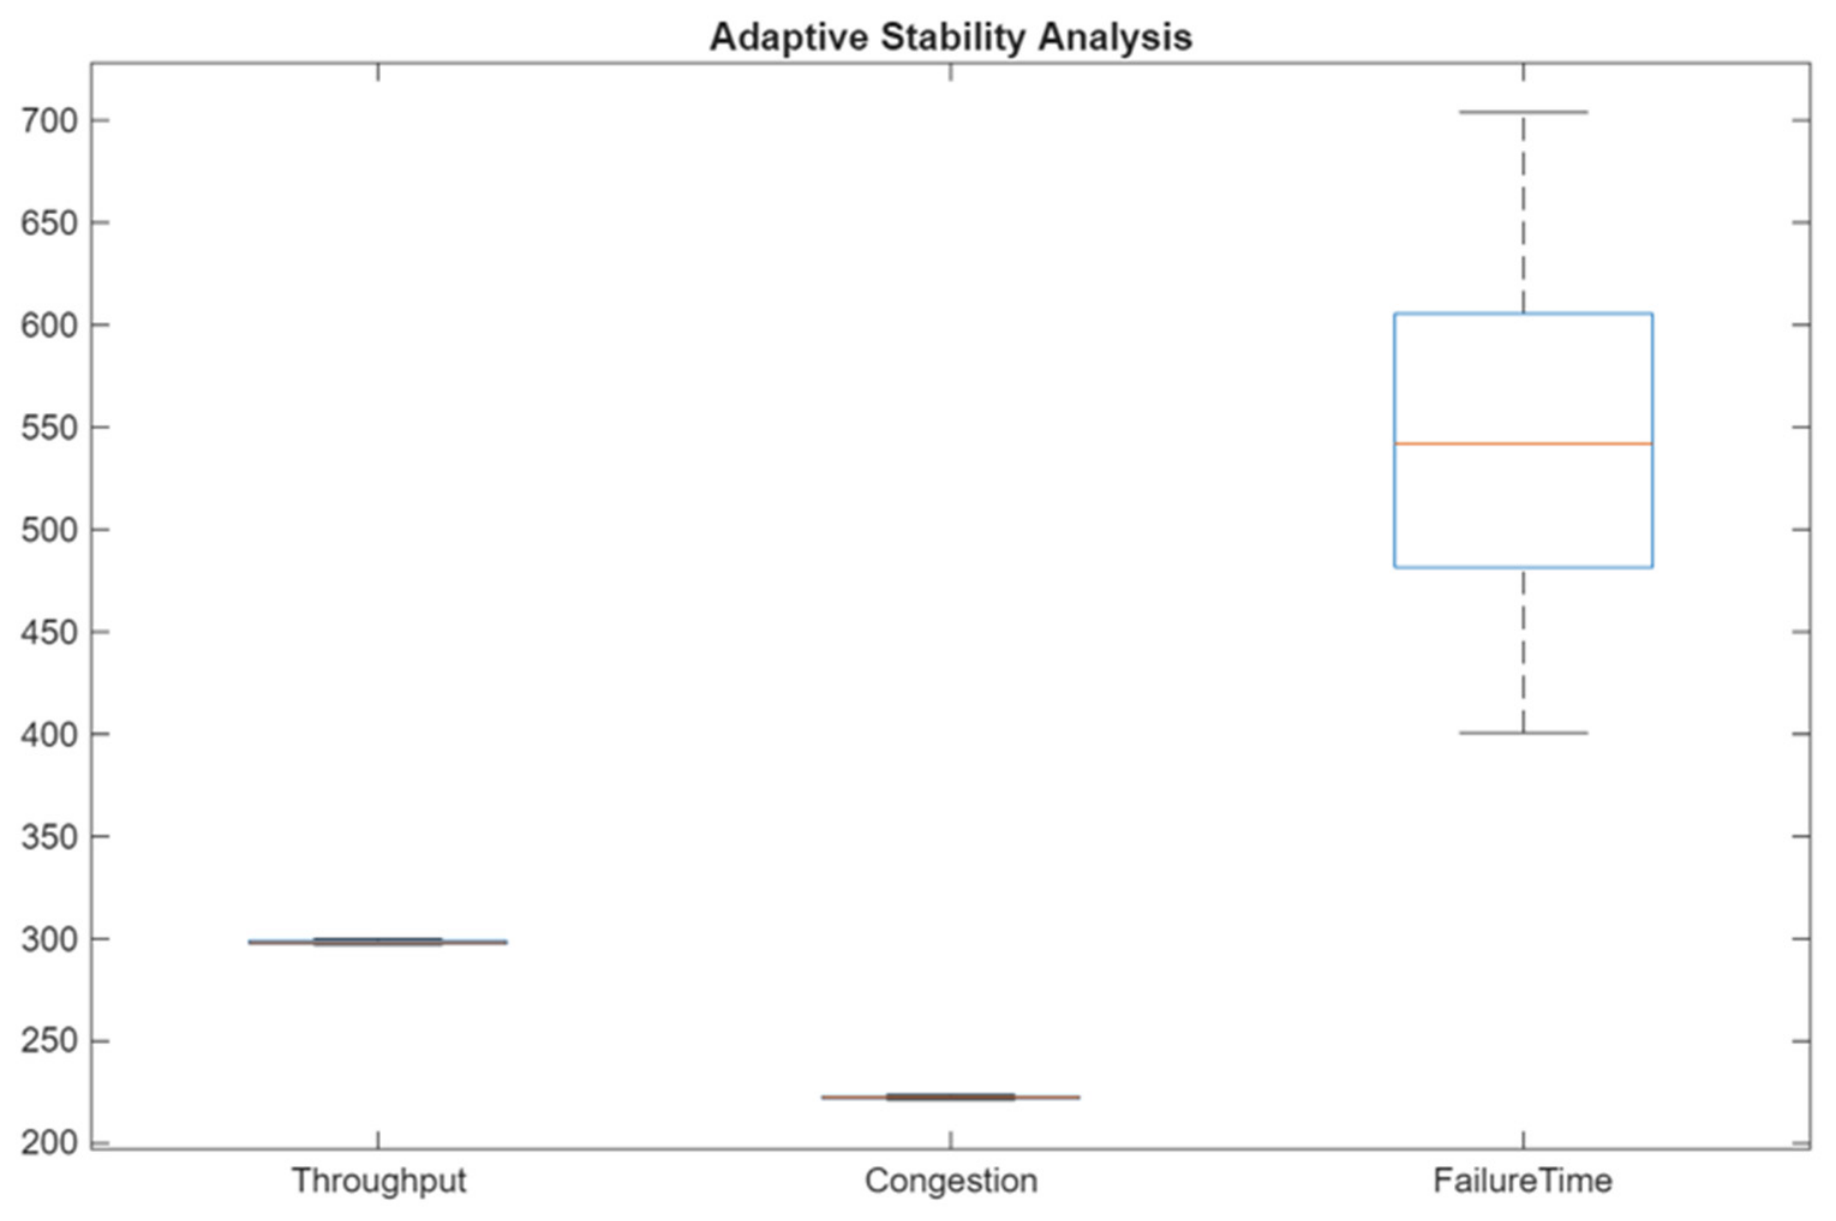
The acquired results showed varying degrees of stability in the system’s indicators. Throughput is characterized by low variance, demonstrating high stability in this metric. A stable behavior with minor fluctuations also appeared in average congestion. Failure time, in contrast, showed significantly greater variability, indicating the presence of rare but significant random events in the model. To offer a clearer analysis of the distribution of data, histograms or box plots can be used to identify potential outliers and asymmetry in the distribution. Generally, the results of the convergence analysis indicate that estimated performance measures are statistically reliable despite the existance of stochastic fluctuations. This is specifically important in the context of simulation modeling, where neglecting variability can result in incorrect management decisions. In
Appendix A, a detailed boxplot figure is provided.
Figure A4 shows the convergence analysis of the optimal solution.
The optimization results are presented in
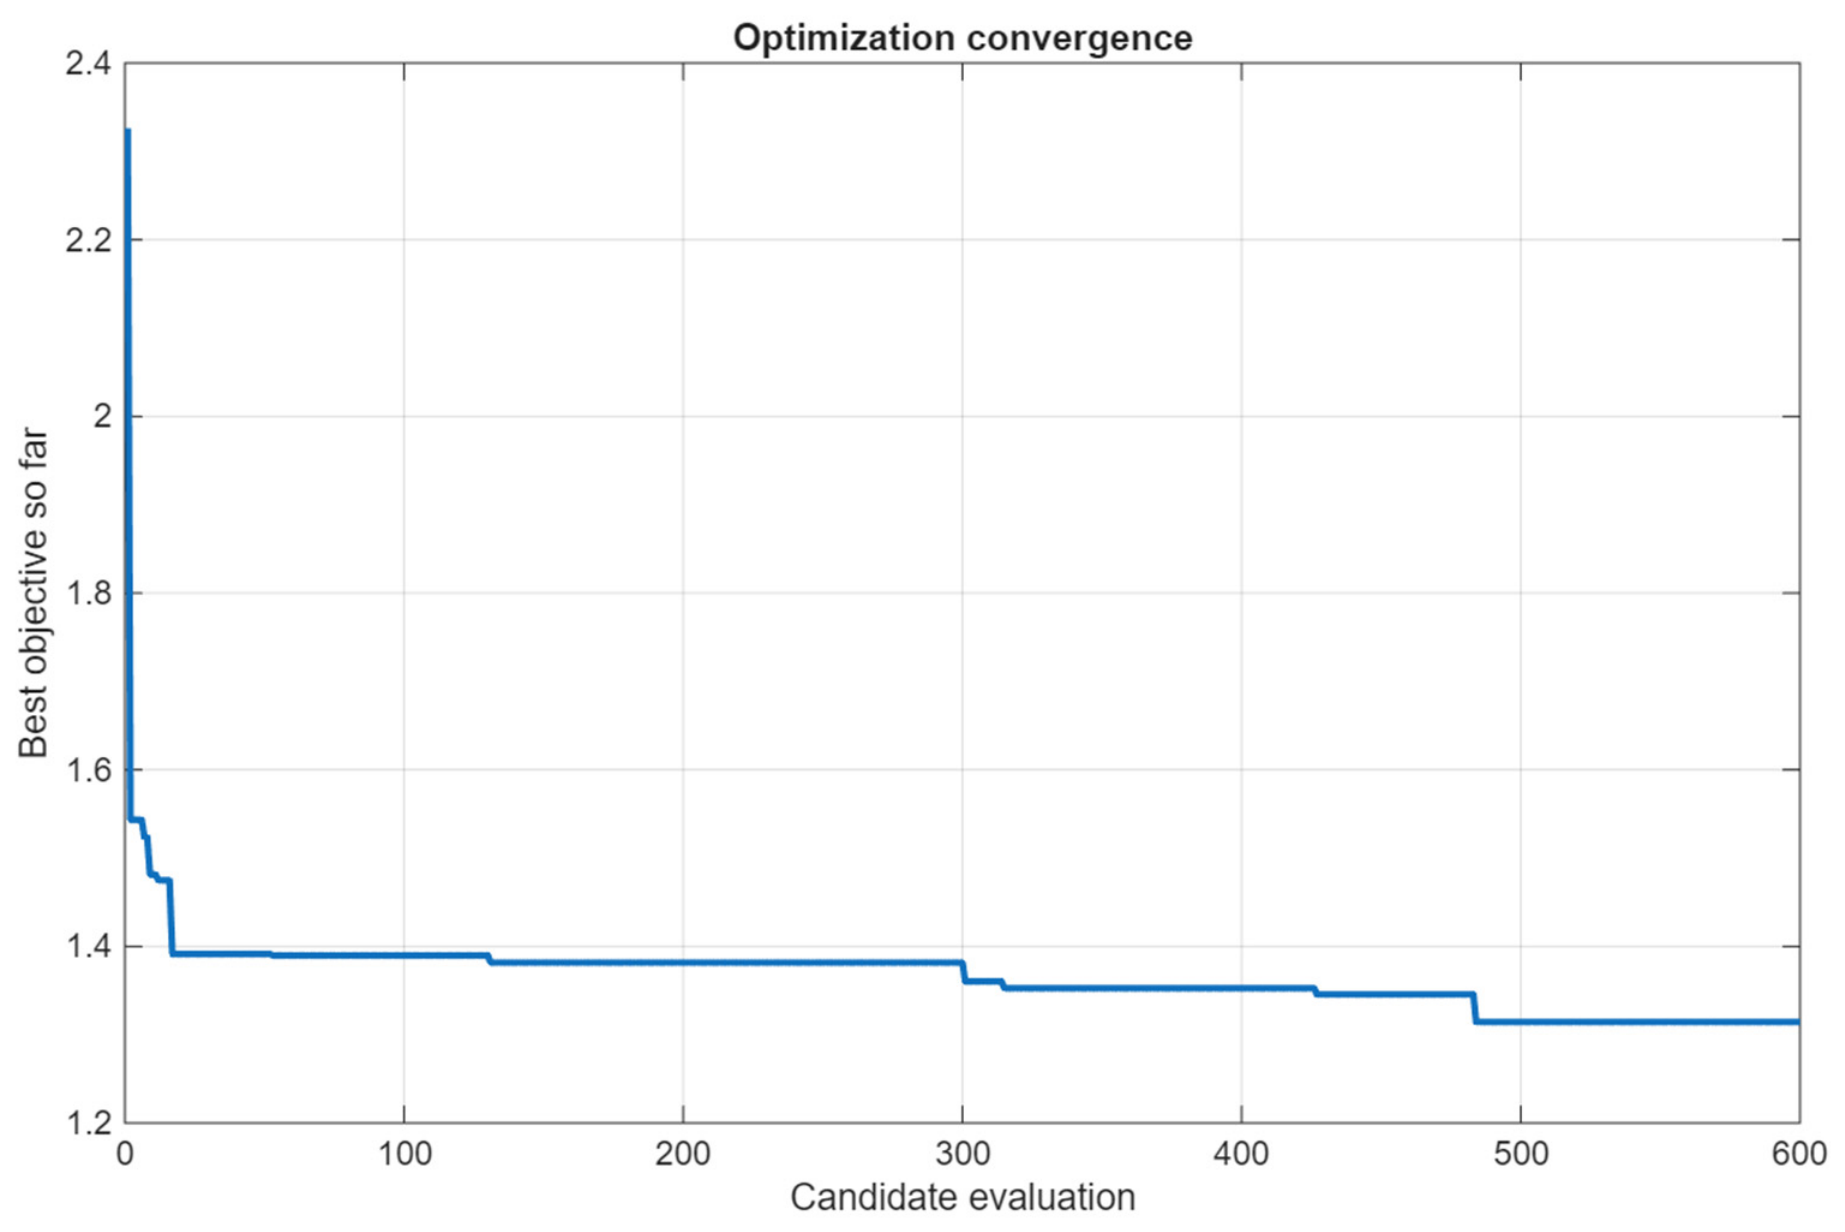
Table 2. The resulting optimal solution considerably enhanced the performance of the simulated production system compared to the baseline configuration. The most essential improvement was noticed in the value of the objective function. The objective function value decreased from 2.32 to 1.314, corresponding to a 43.36% improvement. This verifies the efficiency of the proposed approach, which is based on an evolutionary strategy and adaptive determination of the number of replications. System throughput increased from 236 to 298 units, describing a 26.27% increase. This result indicates a more efficient use of production resources and an improvement in the overall productivity of the system. The average congestion time decreased from 287.425 s to 222.051 s. The relative improvement was 22.74%, demonstrating a reduction in the level of congestion in production areas and a more balanced distribution of material flow. The failure time metric increased from 355.057 s to 494.745 s, representing a 39.34% increase in downtime. This deterioration shows a clear trade-off between production performance and reliability. While the optimized configuration improves throughput and reduces congestion, the more aggressive production conditions also result in increased equipment downtime. Thus, the acquired solution should be interpreted as a weighted compromise among the considered performance measures rather than as an independent optimum for each individual metric. Overall, the results demonstrate that the proposed approach can effectively improve the aggregated system performance while explicitly revealing the associated reliability trade-off.
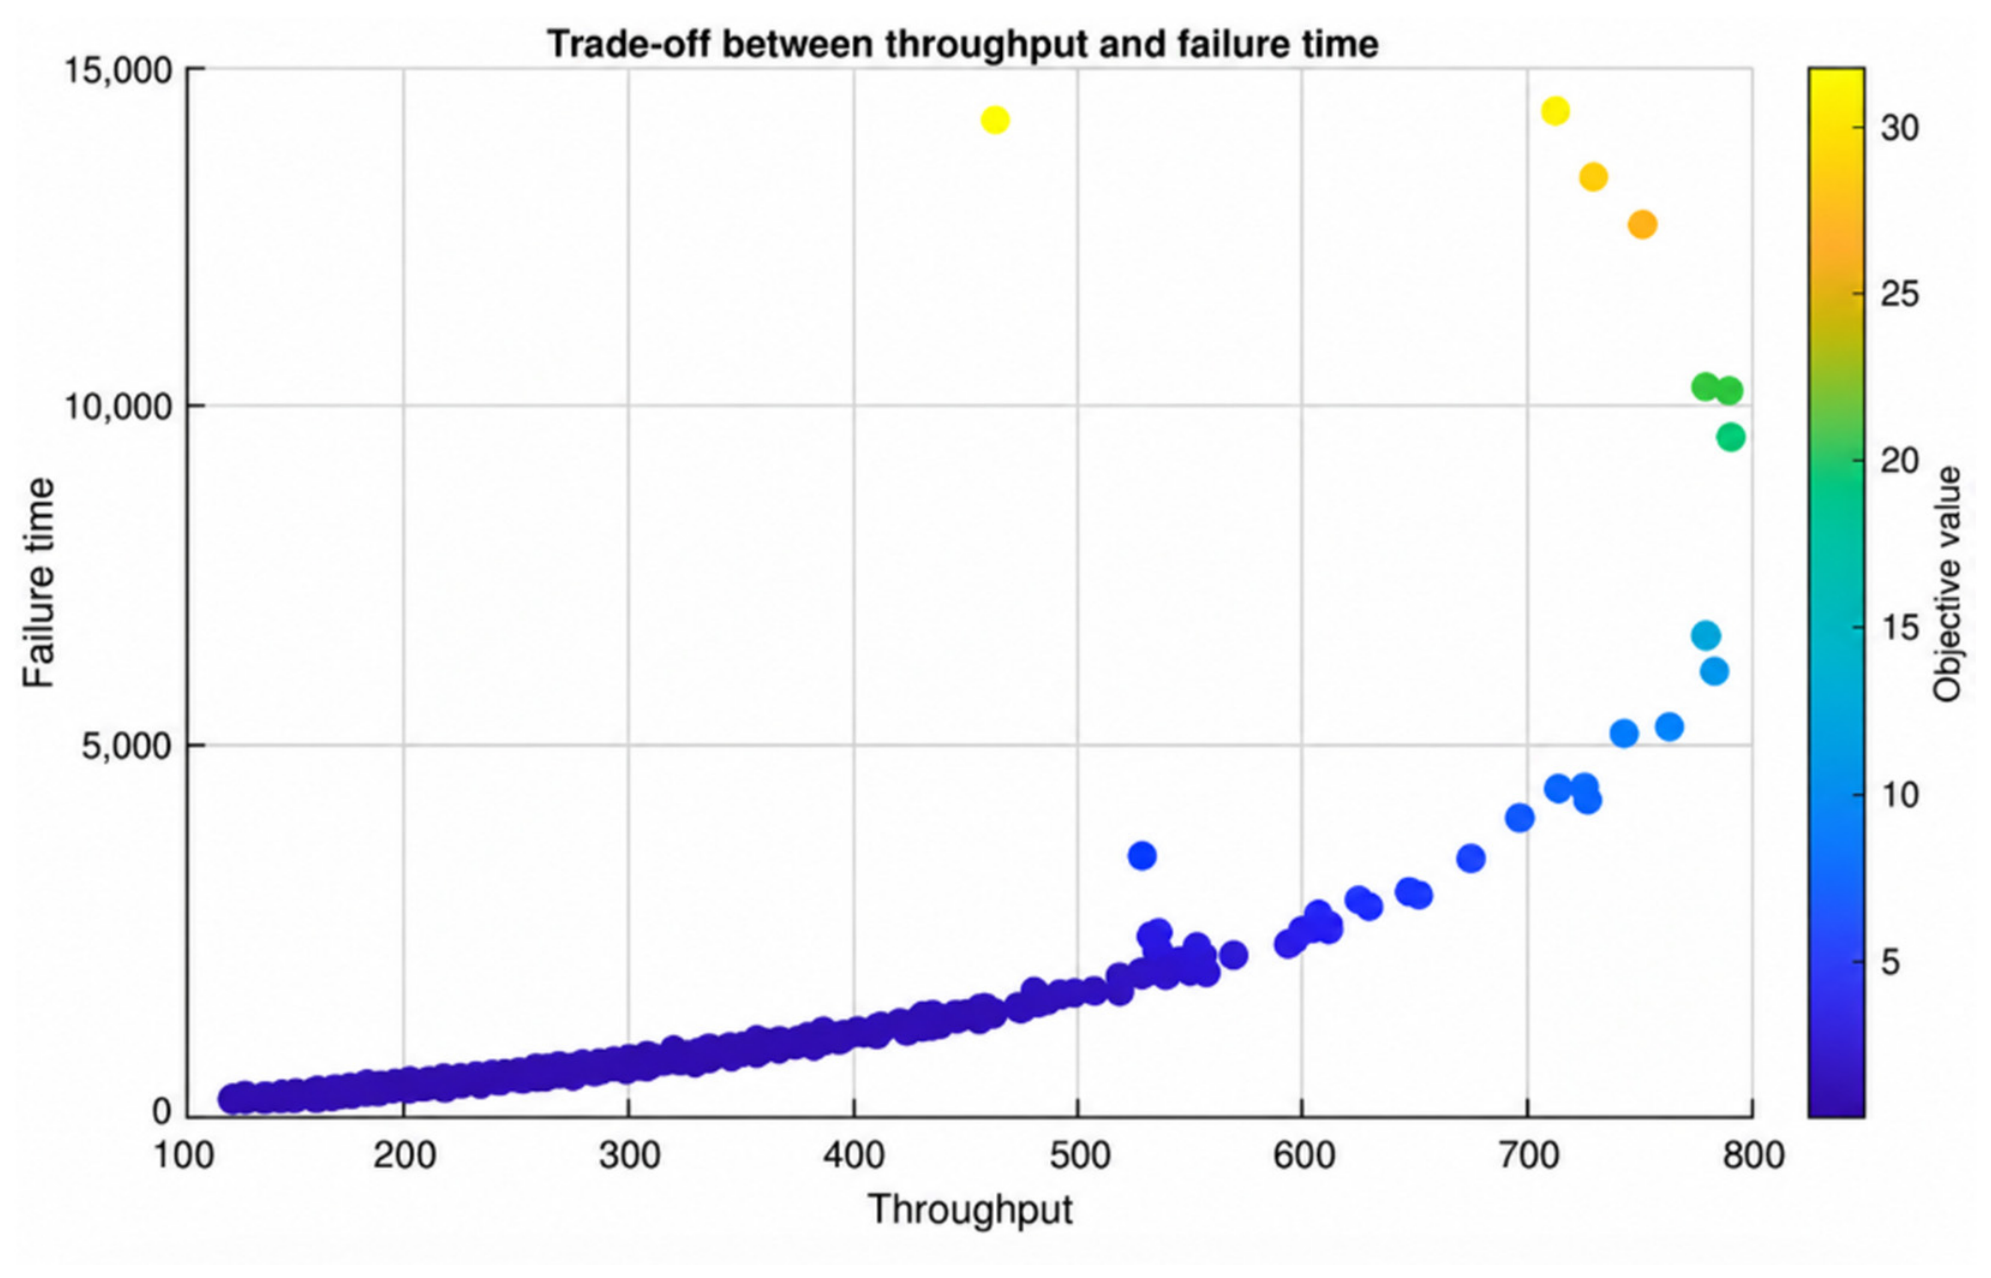
The trade-off between production performance and reliability was further examined by analyzing the relationship between throughput and failure time across the evaluated candidate solutions, which can be found in
Appendix A,
Figure A5. The results showed a clear positive relationship between performance and reliability: increasing throughput is generally associated with increased downtime. This relationship becomes particularly noticeable at higher throughput levels, where relatively small additional improvements in throughput are accompanied by significantly larger increases in failure time.
The optimization process showed quick initial improvement followed by progressive convergence toward a stable solution region. Most of the improvements of the objective function appeared during the early candidate evaluations, while later evaluations mainly refined the solution. Ninety-five percent of the improvement was reached after 301 evaluations. The optimization plot can be seen in
Figure 4.
6.3. Convergence and Adaptive Replication Plots
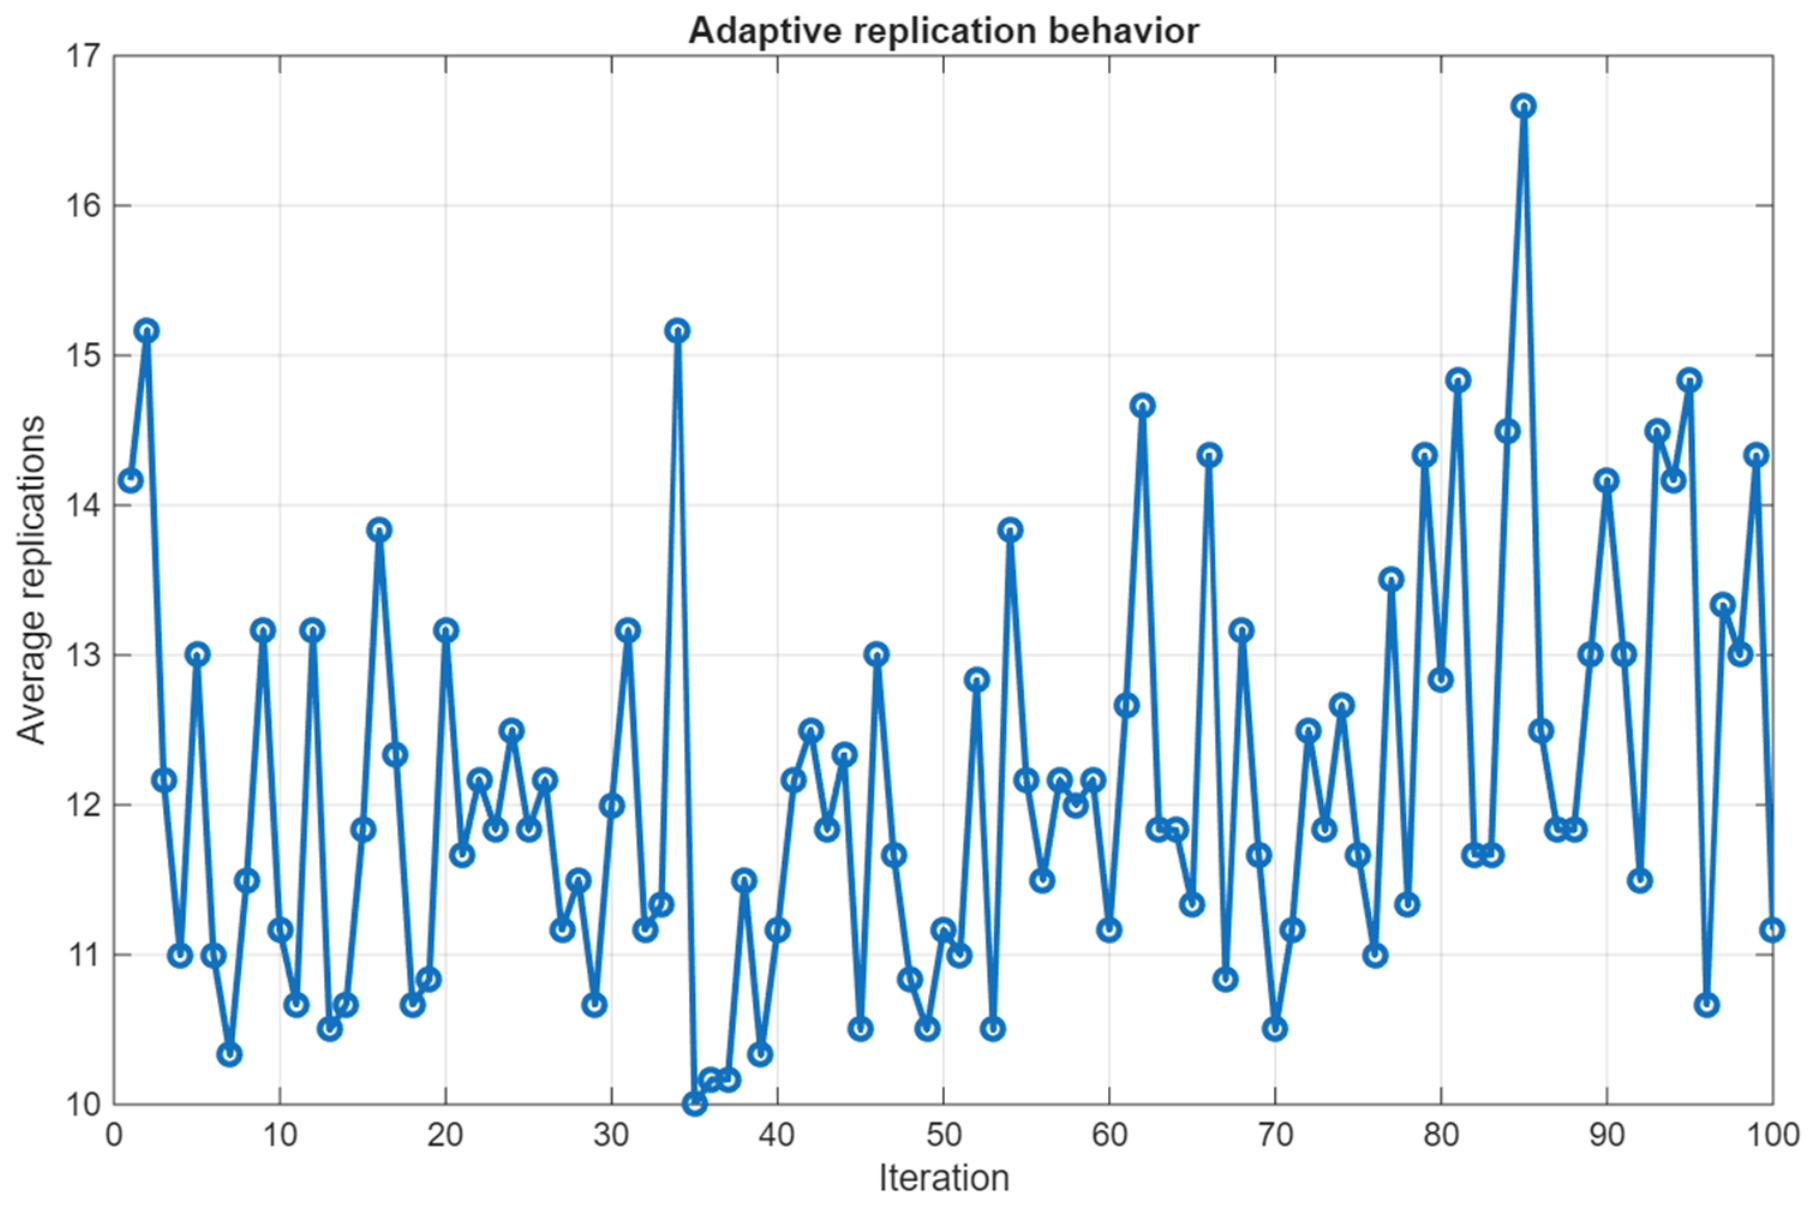
The adaptive replication mechanism dynamically distributed the simulation effort depending on the witnessed variance of the candidate solutions. Stable candidates required fewer replications, while noisy configurations triggered additional evaluations. In some cases, 10–12 replications were adequate, while in others, 24 or more were required. The results of the adaptive replication scheme showed that the average number of simulation runs required to evaluate a single candidate was 12.17. The minimum number of replications was 10, while the maximum reached 26. The standard deviation was 3.12, indicating moderate variability in computational costs across different solutions. An adaptive replication behavior plot can be seen in
Figure 5.
6.4. Parameter Trajectory
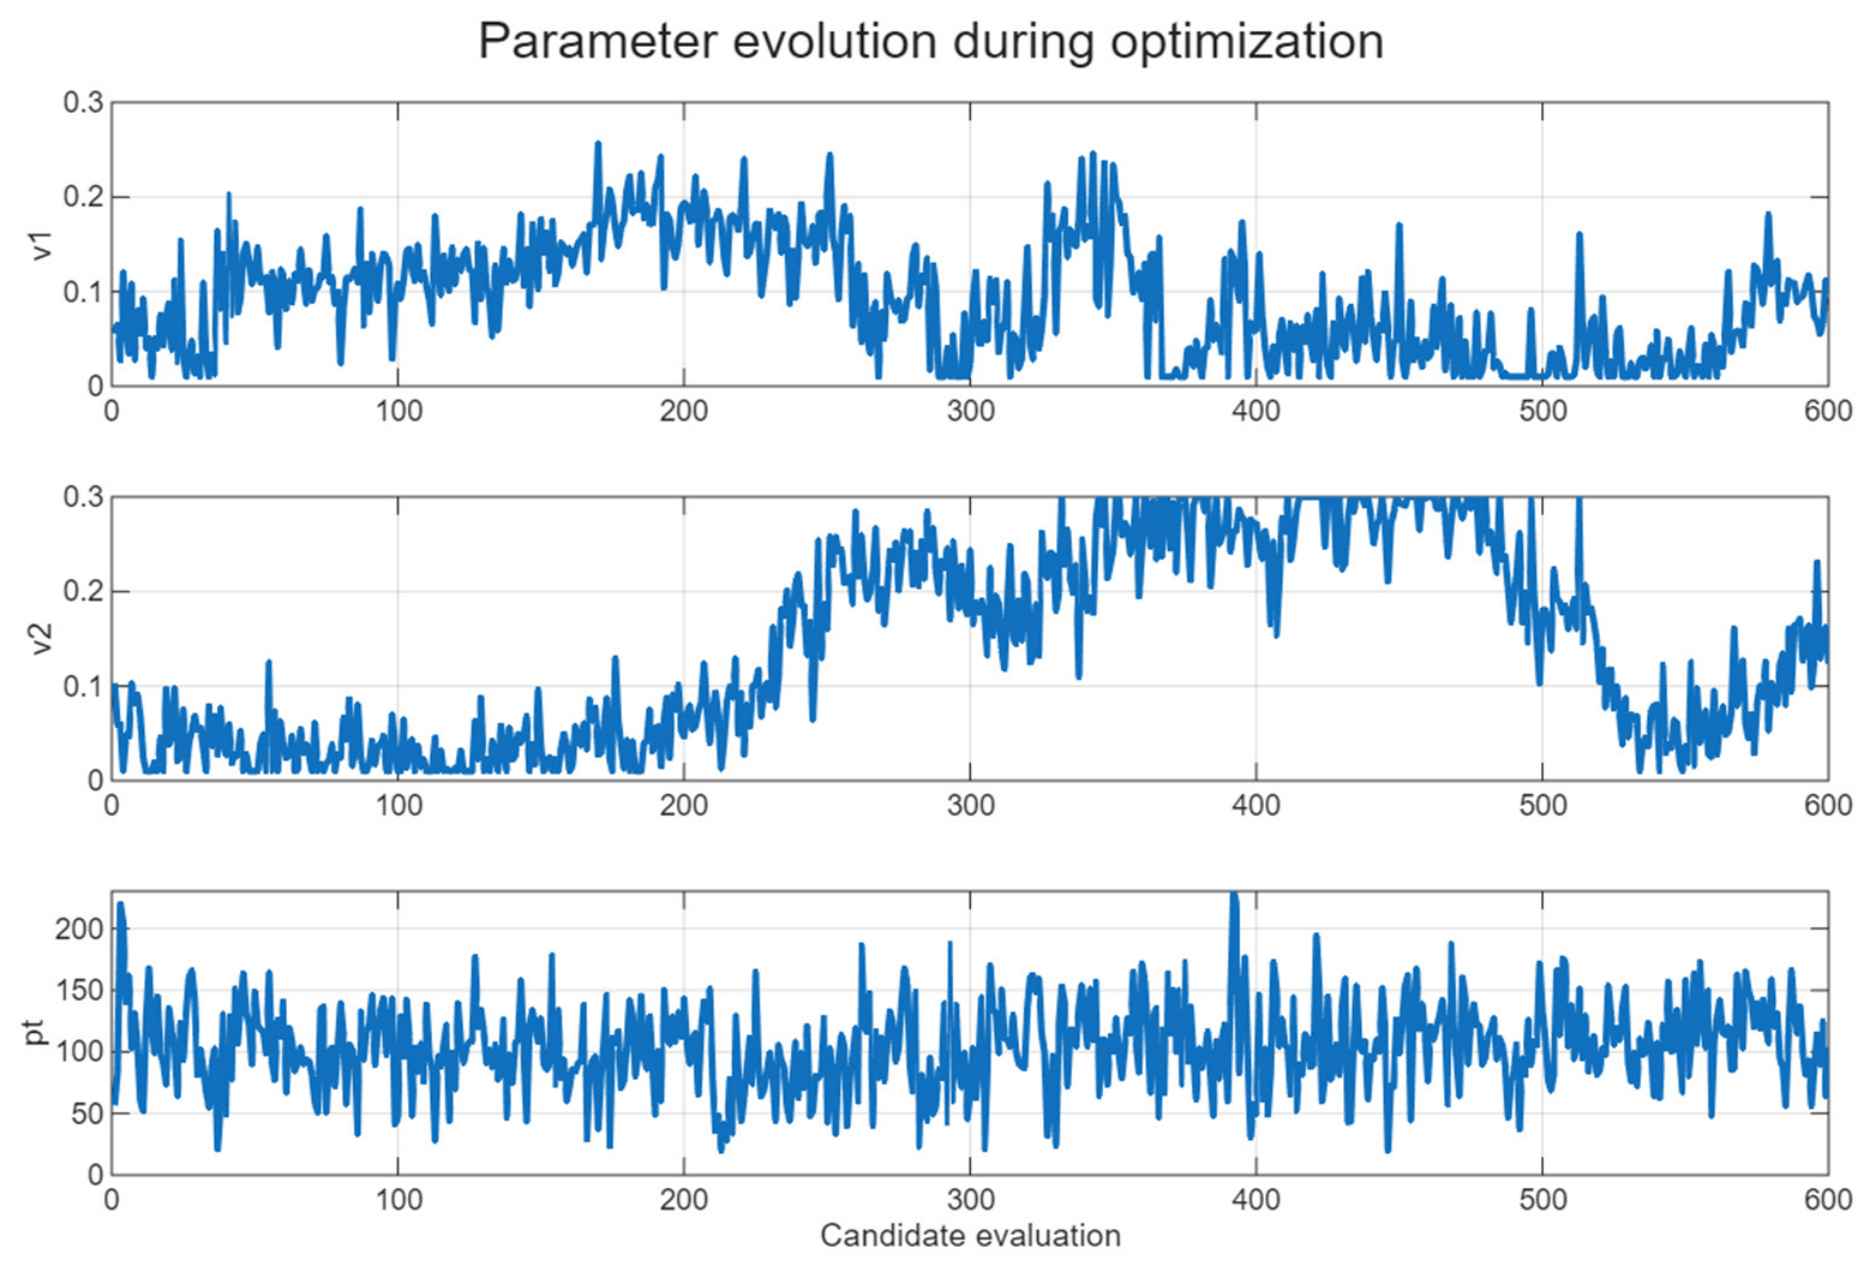
The processing time parameter demonstrated the largest fluctuations throughout the optimization, signifying stronger sensitivity of the objective function to production speed adjustments. The optimizer explored the parameter space, gradually searching different regions. The parameters
and
had less fluctuations, while
varied strongly. The development of parameter configurations can be seen in
Figure 6.
6.5. Benchmark Comparison Between Adaptive and Fixed Replication
The benchmark comparison confirmed that the adaptive replication strategy achieved a lower objective value than the fixed-replication strategies, improving the objective function by 0.45% compared to the corresponding fixed-10 strategy, by 17.20% compared to the corresponding fixed-20 strategy, and by 12.81% compared to the corresponding fixed-30 strategy while requiring fewer simulation replications than the fixed-20 and fixed-30 strategies. The computational time was reduced by 17.72% compared to the corresponding fixed-20 strategy, and 46.94% compared to the corresponding fixed-30 strategy. In comparison with the fixed-10 strategy, the adaptive approach required a longer computational time due to the higher average number of replications; however, it provided substantially better solution quality. The results of the comparison are presented in
Table 3.
6.6. Robustness Analysis
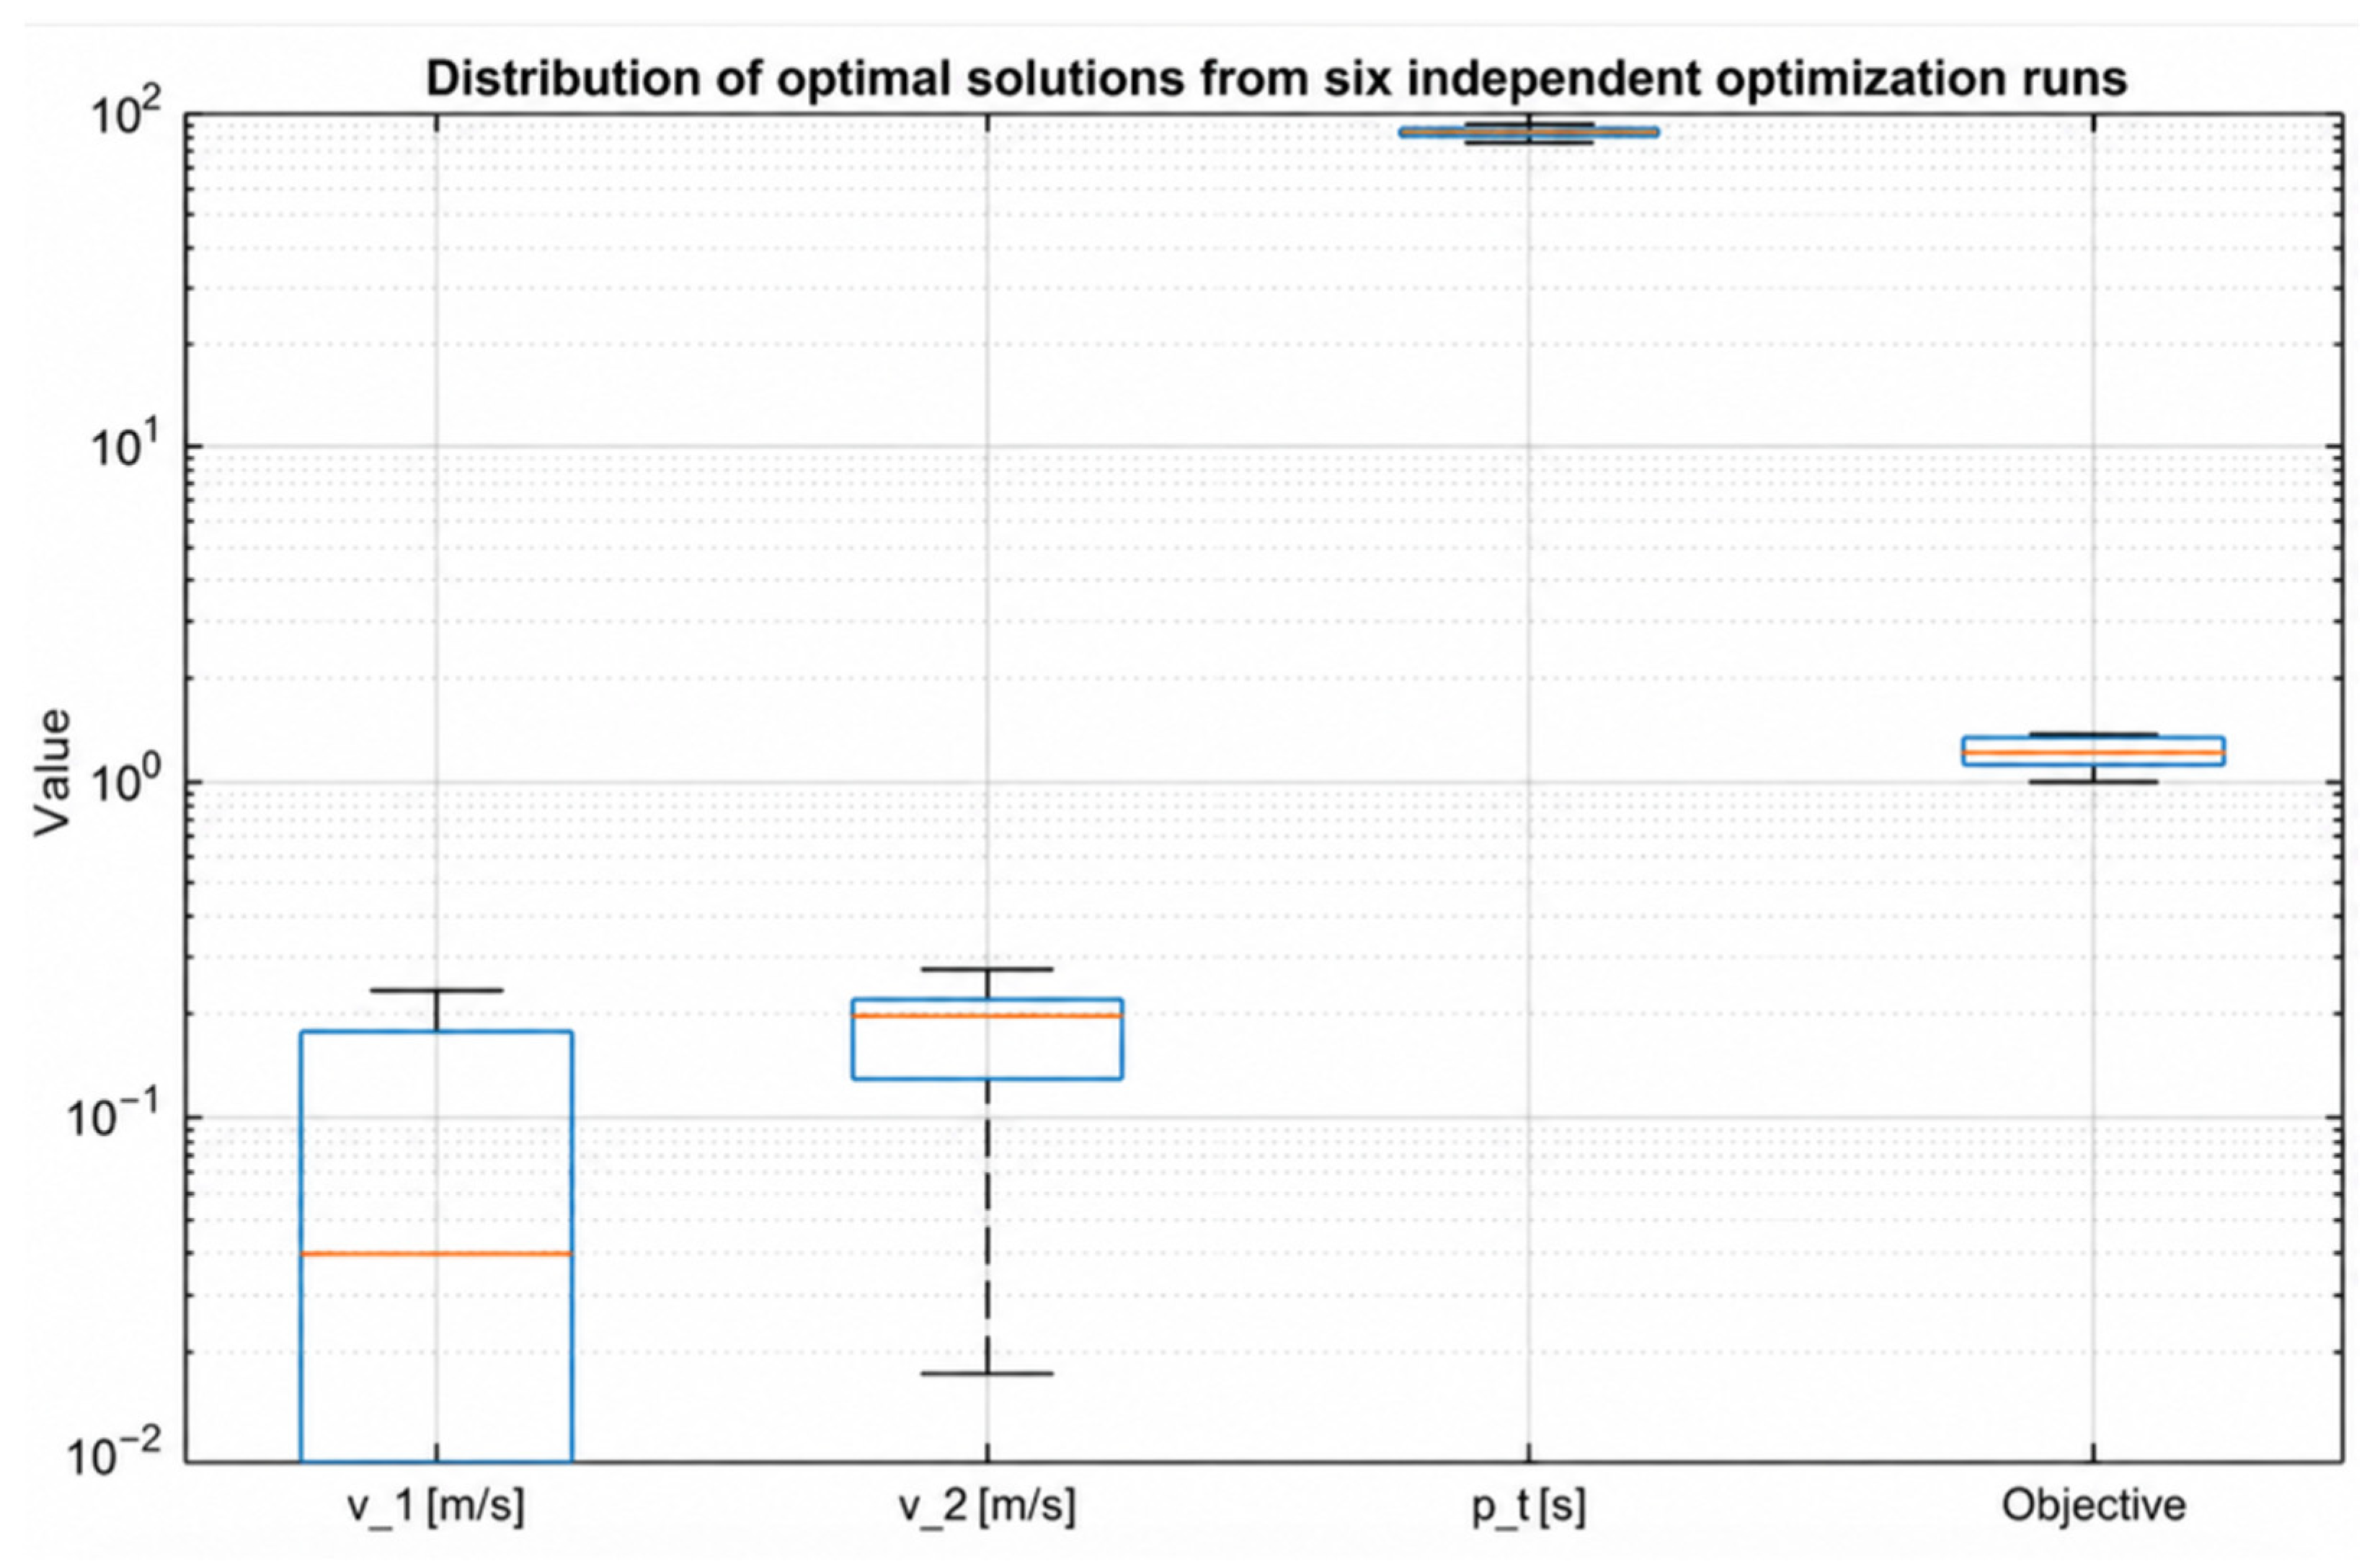
To observe how the optimal solution varied (or fluctuates) among different runs, repeated optimization runs were performed. The complete optimization procedure was independently repeated six times using identical algorithmic settings while allowing different stochastic realizations of the simulation model. The optimal parameter configurations and the corresponding objective values acquired from each run are presented in
Table 4. The results show that the optimization framework consistently recognized solutions of comparable quality despite the stochastic nature of the production system and the evolutionary search process. Although different parameter combinations were gained in individual runs, the resulting objective values remained within a relatively narrow range (0.976–1.314), demonstrating satisfactory repeatability of the optimization process.
The statistical characteristics of the acquired optimal solutions are summarized in
Table 5. The processing time parameter showed the lowest variability, with a coefficient of variation of 4.92%, indicating that the optimization consistently converged to similar processing time values across repeated runs. However, the conveyor speed parameters showed significantly larger variability, particularly
v1 (CV = 113.92%). This suggests that several combinations of conveyor speeds can produce solutions of comparable quality, indicating that these parameters have a lower influence on the optimization objective within the examined design space. The objective function exhibited a coefficient of variation of 10.78%, indicating that repeated optimization runs consistently converged to solutions of similar quality despite the stochastic behavior of the simulation model. This observation is consistent with the sensitivity analysis presented previously, which showed the processing time as the most influential decision variable, whereas the conveyor speeds had a comparatively smaller impact on the overall system performance.
The distribution of the optimal solutions can be seen in
Figure 7.
7. Discussion
The results confirm that coupling discrete-event simulation with an external MATLAB optimization module allows for the effective study and development of production systems under conditions of stochastic uncertainty. Instead of proposing a new optimization algorithm, the core contribution lies in integrating adaptive replication into the optimization loop, allowing the number of simulation replications to be adjusted based on the statistical uncertainty of each candidate solution. This enhances the reliability of objective-function estimation while avoiding needless computational effort.
These findings are consistent with previous studies on simulation-based optimization, which emphasize that stochastic simulation outputs require statistically reliable performance estimation before candidate solutions can be compared [
2,
5,
9]. The proposed framework extends these concepts by demonstrating their practical implementation through the integration of Siemens Tecnomatix Plant Simulation and MATLAB within a unified optimization system.
A sensitivity analysis demonstrated that changing this parameter leads to significant changes in throughput, failure time, and congestion. However, reducing the processing time increases throughput but simultaneously leads to an increase in the rate of equipment failures. This trade-off shows that processing time is the governing decision variable in the examined system. Therefore, the optimization framework does not simply maximize throughput but assists the identification of balanced operating conditions that consider both productivity and reliability.
The convergence analysis confirmed the statistical stability of the solution obtained. In spite of the stochastic nature of the simulation, the variation in throughput and congestion values was moderately small, while the failure time indicator exhibited considerably greater dispersion. The use of an adaptive replication strategy achieved automatically balanced computational costs and the statistical accuracy of the estimates. Occasionally, the algorithm completed its evaluation after a comparably small number of iterations, while configurations with more noise required significantly more simulation runs. In particular, using confidence intervals as a stopping criterion helps prevent both an inadequate and an excessive number of replications.
To assess the effectiveness of the adaptive replication strategy, an additional benchmark was performed using fixed replication schemes with 10, 20, and 30 replications per candidate solution. The comparison considered computational effort (wall-clock time and total number of simulation runs) together with the final objective value obtained by the optimization algorithm. The results indicate that the adaptive strategy achieved a solution quality comparable to the fixed replication schemes while requiring fewer simulation runs on average. This confirms that adaptive replication can reduce computational effort without noticeably degrading the optimization outcome. The robustness analysis showed consistency among different optimization runs.
It is worth mentioning that the proposed approach has certain constraints. First of all, the framework was validated using a single manufacturing case study with three decision variables; thus, its computational performance and optimization behavior for larger-scale industrial systems need to be further investigated. In addition, although the production line was based on a real manufacturing process, several model elements rely on simplified assumptions. Therefore, the quantitative results should be interpreted as a demonstration of the proposed optimization framework rather than as an exact representation of a specific production system. Another limitation concerns the formulation of the optimization problem. The three considered performance measures (throughput, congestion, and failure time) represent potentially conflicting objectives. In the present study, these measures are combined into a weighted single-objective function to provide a unified objective for the stochastic simulation-optimization procedure. This formulation enables the evaluation of the proposed adaptive replication strategy using a single compromise solution; however, it does not explicitly characterize the complete set of Pareto-optimal solutions or allow the trade-offs among different objective preferences to be fully explored. Another limitation concerns the optimization procedure itself. The adopted (1, λ) evolution strategy was selected because of its robustness and simplicity for noisy optimization problems; however, it does not guarantee convergence to the global optimum, and its performance depends on empirically selected control parameters, including the mutation step size, offspring population size, and stopping criterion. Finally, despite the adaptive replication strategy reducing unnecessary simulation evaluations, the computational cost remains significant as each candidate solution needs multiple independent simulation runs. This limitation becomes increasingly important for large-scale optimization problems or computationally expensive simulation models, where additional acceleration techniques such as surrogate models or parallel simulation may be required.
Future research will focus on expanding the proposed framework in numerous ways. First, a more comprehensive benchmarking study will be performed by comparing the adaptive replication strategy with fixed replication schemes under identical optimization settings with reference to solution quality, computational time, and statistical robustness. Second, the current weighted single-objective formulation will be expanded to a multi-objective optimization framework to explicitly examine the trade-offs between throughput, reliability, and congestion through Pareto-optimal solutions. Finally, the framework will be validated using larger industrial production systems with additional decision variables and experimentally calibrated reliability data to assess its scalability and practical applicability.
8. Conclusions
As the main contribution, in this paper, a practical and reusable framework is proposed that combines discrete-event simulation, stochastic optimization, adaptive replication, and statistical analysis into a single automated workflow. The framework is intended for production systems where objective-function evaluations are affected by stochastic variability, and repeated simulations are therefore required to obtain statistically reliable performance estimates.
The proposed methodology was validated through a stochastic manufacturing case study. Compared with the baseline production configuration in one of the optimization runs, the proposed framework reduced the objective function by 43.36% while simultaneously increasing system throughput and reducing congestion. The results also revealed a clear trade-off between production performance and reliability, as reflected by the increase in failure time. Consequently, the optimized solution should be interpreted as a weighted compromise under the adopted single-objective formulation rather than as an independent optimum for each performance indicator. The trade-off analysis across the evaluated candidate solutions further confirmed the relationship between increased production performance and reliability degradation, providing additional insight into the optimization behavior of the proposed framework. To evaluate the effectiveness of the adaptive replication strategy, benchmark experiments were conducted using fixed replication schemes with 10, 20, and 30 simulation replications. The results demonstrated that the adaptive strategy achieved a solution quality comparable to the fixed-replication approaches while requiring fewer simulation evaluations on average, thereby reducing computational effort without compromising statistical reliability. Furthermore, the adaptive strategy improved the objective value by up to 17.20% compared with the fixed-replication strategies and required substantially less computational time than the fixed-20 and fixed-30 configurations. The robustness analysis further demonstrated that the proposed framework consistently converged toward solutions of comparable quality across independent optimization runs despite the stochastic nature of both the simulation model and the evolutionary optimization process. In particular, the objective function exhibited a coefficient of variation of only 10.78%, indicating stable optimization performance. Among the decision variables, the processing time parameter showed the lowest variability (CV = 4.92%), demonstrating that the optimization consistently converged toward similar processing time values. In contrast, the conveyor speed parameters exhibited considerably higher variability, especially v1 (CV = 113.92%), suggesting that multiple conveyor speed combinations can produce solutions of comparable quality. This observation is consistent with the sensitivity analysis, which identified processing time as the dominant decision variable, whereas the conveyor speeds had a comparatively smaller influence on the overall system performance.
The presented framework demonstrates that integrating discrete-event simulation with external optimization and adaptive statistical evaluation provides an effective methodology for improving manufacturing-system performance under uncertainty compared to fixed replication runs.
Author Contributions
Conceptualization, G.R. and L.C.; methodology, G.R. and L.C.; software, G.R.; validation, G.R.; formal analysis, G.R.; investigation, G.R.; resources, G.R.; data curation, G.R.; writing—original draft preparation, G.R.; writing—review and editing, G.R. and L.C.; visualization, G.R.; supervision, L.C. All authors have read and agreed to the published version of the manuscript.
Funding
This research received no external funding.
Data Availability Statement
Acknowledgments
During the preparation of this manuscript, the authors used ChatGPT (OpenAI, GPT-5.5) for language refinement, text drafting, editing support, literature organization, and assistance in the interpretation and presentation of the simulation and optimization results. The authors reviewed, verified, and revised all generated content and take full responsibility for the accuracy, validity, and integrity of the manuscript.
Conflicts of Interest
The authors declare no conflicts of interest.
Abbreviations
The following abbreviations are used in this manuscript:
| OCBA | Optimal configuration-based assignment |
| ES | Evolutionary strategy |
| MTTR | Mean time to repair |
| MTBF | Mean time between failure |
| A | Availability |
Appendix A
Sensitivity and Stability Analysis
Figure A1.
Sensitivity analysis of around the optimal solution.
Figure A1.
Sensitivity analysis of around the optimal solution.
Figure A2.
Sensitivity analysis of around the optimal solution.
Figure A2.
Sensitivity analysis of around the optimal solution.
Figure A3.
Sensitivity analysis of around the optimal solution.
Figure A3.
Sensitivity analysis of around the optimal solution.
Figure A4.
Convergence analysis of the optimal solution.
Figure A4.
Convergence analysis of the optimal solution.
Figure A5.
Trade-off visualization.
Figure A5.
Trade-off visualization.
Table A1.
Simulation model settings.
Table A1.
Simulation model settings.
| Attributes | Decoiling | Punching | Unloading | Orientation for Packing | Pallet Loading |
|---|
| Processing time | 10 s (default) | 10 s (default) | 10 s (default) | 10 s (default) | 10 s (default) |
Table A2.
Optimizer and failure model settings.
Table A2.
Optimizer and failure model settings.
| Parameter | Value | Description |
|---|
| 0.05 | Variance penalty weight |
| 10 | Minimum adaptive replications |
| 100 | Maximum adaptive replications |
| 0.05 | Confidence level parameter |
| 50 s | Reference processing time |
| 300 s | Reference mean time between failures |
| (failure model) | 1.2 | Empirical scaling coefficient |
| c | 1000 | Empirical constant for MTTR |
| λ | 6 | Offspring population size |
| N | 100 | ES iterations |
| 0.1 | Initial mutation step size |
References
- Law, A.M. Simulation Modeling and Analysis, 5th ed.; McGraw-Hill Education: New York, NY, USA, 2014. [Google Scholar]
- Fu, M.C. (Ed.) Handbook of Simulation Optimization; Springer: New York, NY, USA, 2015. [Google Scholar] [CrossRef] [Scilit]
- Amaran, S.; Sahinidis, N.V.; Sharda, B.; Bury, S.J. Simulation optimization: A review of algorithms and applications. Ann. Oper. Res. 2016, 240, 351–380. [Google Scholar] [CrossRef] [Scilit]
- Banks, J.; Carson, J.S.; Nelson, B.L.; Nicol, D.M. Discrete-Event System Simulation, 5th ed.; Pearson: Upper Saddle River, NJ, USA, 2010. [Google Scholar]
- Kleijnen, J.P.C. Design and Analysis of Simulation Experiments; Springer: New York, NY, USA, 2015. [Google Scholar] [CrossRef] [Scilit]
- Nelson, B.L.; Pei, L. Foundations and Methods of Stochastic Simulation, A First Course, 2nd ed.; Springer: New York, NY, USA, 2021. [Google Scholar] [CrossRef] [Scilit]
- Chen, C.H.; Lin, J.; Yücesan, E.; Chick, S.E. Simulation Budget Allocation for Further Enhancing the Efficiency of Ordinal Optimization. Discret. Event Dyn. Syst. 2000, 10, 251–270. [Google Scholar] [CrossRef] [Scilit]
- Heidelberger, P.; Welch, P.D. Simulation run length control in the presence of an initial transient. Oper. Res. 1983, 31, 1109–1144. [Google Scholar] [CrossRef] [Scilit]
- Glasserman, P. Monte Carlo Methods in Financial Engineering; Springer: New York, NY, USA, 2003. [Google Scholar] [CrossRef] [Scilit]
- Beyer, H.G.; Schwefel, H.P. Evolution strategies—A comprehensive introduction. Nat. Comput. 2002, 1, 3–52. [Google Scholar] [CrossRef] [Scilit]
- Bäck, T. Evolutionary Algorithms in Theory and Practice; Oxford University Press: New York, NY, USA, 1996. [Google Scholar] [CrossRef] [Scilit]
- Jin, Y.; Branke, J. Evolutionary optimization in uncertain environments—A survey. IEEE Trans. Evol. Comput. 2005, 9, 303–317. [Google Scholar] [CrossRef] [Scilit]
- Hong, L.J.; Fan, W.; Luo, J. Review on ranking and selection: A new perspective. Front. Eng. Manag. 2021, 8, 321–343. [Google Scholar] [CrossRef] [Scilit]
- Xu, J.; Huang, E.; Chen, C.H.; Lee, L.H. Simulation Optimization: A Review and Exploration in the New Era of Computing and Big Data. Asia-Pac. J. Oper. Res. 2015, 32, 1550019. [Google Scholar] [CrossRef] [Scilit]
- Rakshit, P.; Konar, A.; Das, S. Noisy Evolutionary Optimization Algorithms—A Comprehensive Survey. Swarm Evol. Comput. 2017, 33, 18–45. [Google Scholar] [CrossRef] [Scilit]
- Kim, S.H.; Nelson, B.L. Recent advances in ranking and selection. Proc. Winter Simul. Conf. 2007, 162–172. [Google Scholar] [CrossRef] [Scilit]
- Mulvey, J.M.; Vanderbei, R.J.; Zenios, S.A. Robust optimization of large-scale systems. Oper. Res. 1995, 43, 264–281. [Google Scholar] [CrossRef] [Scilit]
- Ben-Tal, A.; El Ghaoui, L.; Nemirovski, A. Robust Optimization; Princeton University Press: Princeton, NJ, USA, 2009. [Google Scholar]
- Bertsimas, D.; Sim, M. The price of robustness. Oper. Res. 2004, 52, 35–53. [Google Scholar] [CrossRef] [Scilit]
- Elsayed, E.A. Reliability Engineering, 2nd ed.; Wiley: Hoboken, NJ, USA, 2012. [Google Scholar]
- Hopp, W.J.; Spearman, M.L. Factory Physics, 3rd ed.; Waveland Press: Long Grove, IL, USA, 2008. [Google Scholar]
- Ebeling, C.E. An Introduction to Reliability and Maintainability Engineering; McGraw-Hill: New York, NY, USA, 1997. [Google Scholar]
- Lawless, J.F. Statistical Models and Methods for Lifetime Data, 2nd ed.; Wiley-Interscience: Hoboken, NJ, USA, 2003. [Google Scholar] [CrossRef] [Scilit]
- Saltelli, A.; Ratto, M.; Andres, T.; Campolongo, F.; Cariboni, J.; Gatelli, D.; Saisana, M.; Tarantola, S. Global Sensitivity Analysis: The Primer; Wiley: Chichester, UK, 2008. [Google Scholar]
- Iooss, B.; Lemaître, P. A review on global sensitivity analysis methods. In Uncertainty Management in Simulation-Optimization of Complex Systems; Springer: Boston, MA, USA, 2015; Volume 59, pp. 101–122. [Google Scholar] [CrossRef] [Scilit]
| Disclaimer/Publisher’s Note: The statements, opinions and data contained in all publications are solely those of the individual author(s) and contributor(s) and not of MDPI and/or the editor(s). MDPI and/or the editor(s) disclaim responsibility for any injury to people or property resulting from any ideas, methods, instructions or products referred to in the content. |