Article

Influence of Cutting Wedge Geometry Design on Cutting Forces, Chip Formation and Surface Roughness During Free Machining of Aluminum Alloy


Department of Innovative Vehicles and Materials, GAMF Faculty of Engineering and Computer Science, John von Neumann University, Izsáki St. 10., H-6000 Kecskemét, Hungary
*
Author to whom correspondence should be addressed.
J. Manuf. Mater. Process. 2026, 10(8), 292; https://doi.org/10.3390/jmmp10080292
Submission received: 21 June 2026 / Revised: 4 August 2026 / Accepted: 6 August 2026 / Published: 11 August 2026

Abstract

This study investigates the effects of the rake angle and clearance angle of custom-manufactured HSS-E Co5 high-speed steel cutting tools on the Fc main cutting force, the Fp passive force component, the Ra and Rz surface roughness parameters, and chip morphology during orthogonal free cutting of EN AW-7075-T6 aluminum alloy. A dedicated experimental fixture was designed and manufactured for the measurements, providing highly accurate depth-of-cut adjustment and ensuring excellent repeatability of the experiments. A full-factorial experimental design was employed, in which the rake angle varied between 0° and 30°, while the clearance angle ranged from 5° to 15°. Three independent cutting trials were performed for each tool geometry. The results showed that increasing the rake angle significantly reduced both the main cutting force (Fc) and the passive force (Fp), whereas increasing the clearance angle resulted in higher force values. Surface roughness analysis revealed that the clearance angle was the dominant factor affecting surface quality. The highest Ra and Rz values were measured at a clearance angle of 15°. Two-way analysis of variance confirmed that the rake angle, the clearance angle, and their interaction had statistically significant effects on the Fc, Fp, Ra, and Rz results. The clearance angle exhibited the strongest effect on Fc, Ra, and Rz, whereas the rake angle had the strongest influence on Fp. Chip morphology observations demonstrated that larger rake angles promoted smoother chip flow and reduced chip compression, while smaller rake angles resulted in thicker and more tightly curled chips. Overall, the combination of larger rake angles and smaller clearance angles provided the most favorable machining conditions, resulting in lower cutting forces, improved chip formation, and enhanced surface quality.

1. Introduction

Various aluminum alloys are widely used in large quantities in industries such as aerospace, automotive, civil, and electrical engineering due to their low weight, good stiffness, low production cost, and good corrosion resistance; therefore, the investigation of their machinability is of critical importance [1,2]. These alloys are regarded as easily machinable metals, with machining conditions that are substantially more favorable than those encountered when machining high-strength steels or superalloys [3,4,5,6]. This is primarily due to the fact that the strength of these alloys is considerably lower than that of the aforementioned steels or superalloys, resulting in reduced cutting forces and a lower tendency to vibration during machining, which in turn significantly improves tool life. Secondly, owing to their good thermal conductivity, the chip efficiently removes the heat generated during the cutting process, so that it does not load the cutting edge of the tool, and the tool does not lose its strength or wear resistance [7]. In the machining of aluminum alloys, one of the most common issues is built-up edge formation, which occurs due to their relatively low hardness and high ductility. This phenomenon primarily develops at high cutting speeds. Built-up edge deteriorates surface quality [8,9], increases cutting force and tool wear. Another major problem is that, due to their high toughness, long continuous chips are often formed, which can easily wrap around the tool or the workpiece (depending on the machining process) [10]. This negatively affects cooling-lubrication in the cutting zone and is also unfavorable from a chip management perspective. These machining characteristics can be significantly influenced by the selection of cutting parameters, tool geometry, tool coatings, and appropriate cutting fluids (cooling-lubrication media) [11,12].
Previous studies have investigated the influence of tool geometry (wedge angles) on cutting force components, tool wear, surface quality, and chip formation during the machining of aluminum alloys. However, in some of these studies, the experiments were conducted under constrained cutting conditions, where the tool nose also participates in the cutting process. Consequently, the obtained results are influenced not only by the wedge angles themselves but also by the geometry and action of the tool nose. The study conducted by Javidikia et al. revealed that a positive rake angle has a beneficial effect on the main cutting force and feed force, while also reducing the cutting temperature [13]. Daoud et al. also reported that the cutting force decreases with increasing positive rake angle. This behavior was attributed to the reduction in both the tool–chip contact pressure and the frictional force acting at the tool–chip interface [14]. Based on the available literature, no comprehensive experimental study has been reported that systematically examines the isolated influence of the clearance angle on cutting-force components, chip formation, and surface roughness during orthogonal machining of aluminum alloys while excluding the effect of the tool nose radius, since machining characteristics are predominantly affected by the rake angle.
The aim of the present research is to investigate the influence of rake angle and clearance angle, including geometrical values beyond those typically examined in the literature [13,14,15], on cutting-force components, surface roughness, and chip formation during orthogonal free cutting of EN AW-7075-T6 aluminum alloy. To ensure highly accurate and repeatable experimental conditions, a specialized fixture was developed, allowing orthogonal planing-type cutting operations to be carried out on a CNC lathe. Furthermore, a custom Python (3.14.0)-based data-processing algorithm was developed for the evaluation of cutting-force measurements. The algorithm enables the exact determination of the steady-state cutting region, ensuring reliable and objective comparison of the experimental results.

2. Materials and Methods

2.1. Cutting Tool Material and Machining of Cutting Tools

One of the main points of planning the experiment is the selection of the cutting tool material. The selection was influenced by several factors. The most decisive factor was the maximum cutting speed achievable under the experimental conditions, which in this case was vc = 15 m/min. In the case of aluminum alloys, at such a cutting speed, the use of high-speed steel tools is typical. These tool materials occur in the case of drilling and tapping [16,17]. Due to these conditions, the selected tool material became the high-speed steel designated HSS-E Co5 (M35). This high-speed steel is a cobalt-alloyed, molybdenum-based tool steel used for the manufacture of high-performance cutting tools [18]. The chemical composition was determined using a FOUNDRY-MASTER PRO type spectrometer (Hitachi High-Tech Analytical Science, Uedem, Germany). The measurement was taken in 5 times; the average values of chemical composition are illustrated in Table 1. The physical properties of the tool material used are summarized in Table 2, while the mechanical properties are summarized in Table 3.
The HSS-E Co5 tool material was available as a standard bar with a 16 × 16 mm square cross-section, already in a heat-treated condition. The tool profiles were produced by wire electrical discharge machining. The justification for the selection of this technology was the high strength of the base material and the simple two-dimensional profile to be produced.
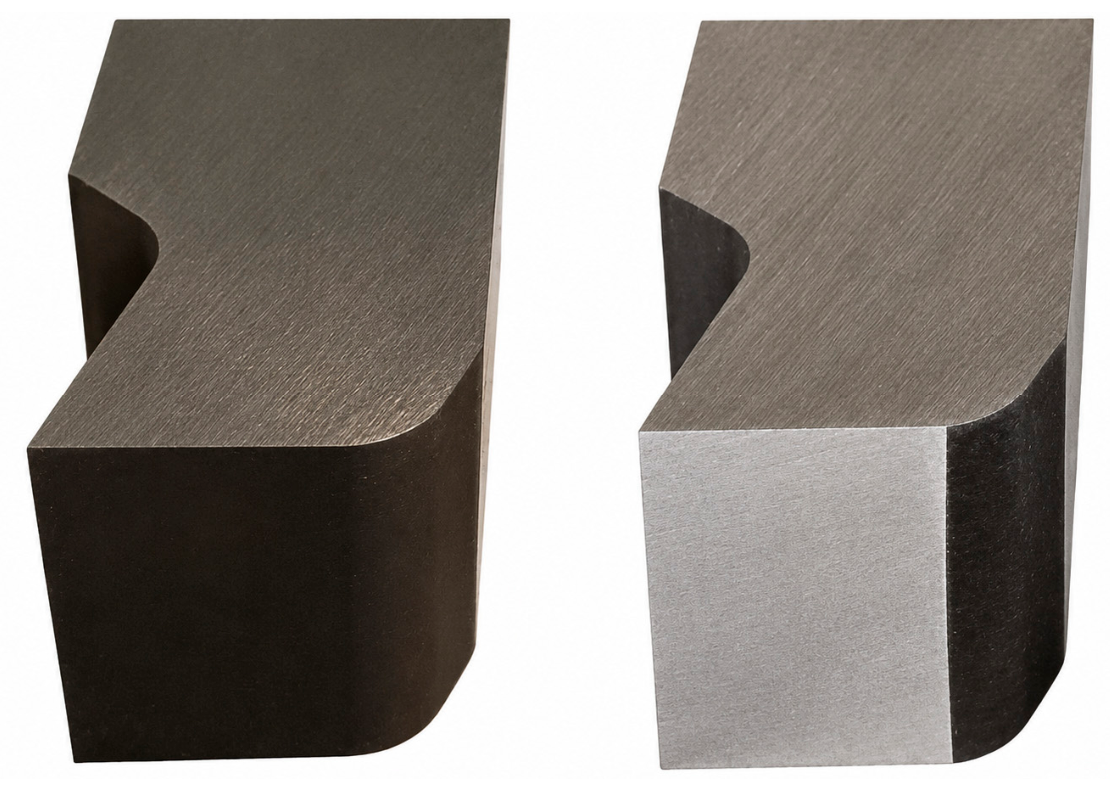
The characteristic feature of the technology is that, because of the discharge of a high-voltage arc, cavitation is generated, and the material of the workpiece is practically burned away. This process occurs extremely quickly, and several arc discharges take place simultaneously through the thickness of the material. During discharge, the temperature of the arc can be as high as 3000 °C. As a result of such a high temperature, the material becomes discolored along the cut, and a very thin layer, a few microns in depth, is hardened. As a result, the surface becomes relatively rough and of poor quality. In the case of a cutting tool, the best possible surface quality must be aimed for. For these reasons, the grinding of the pre-roughened tools is an essential step. By means of grinding, the layer with the altered microstructure can be easily removed, and the surface quality can be the best possible.
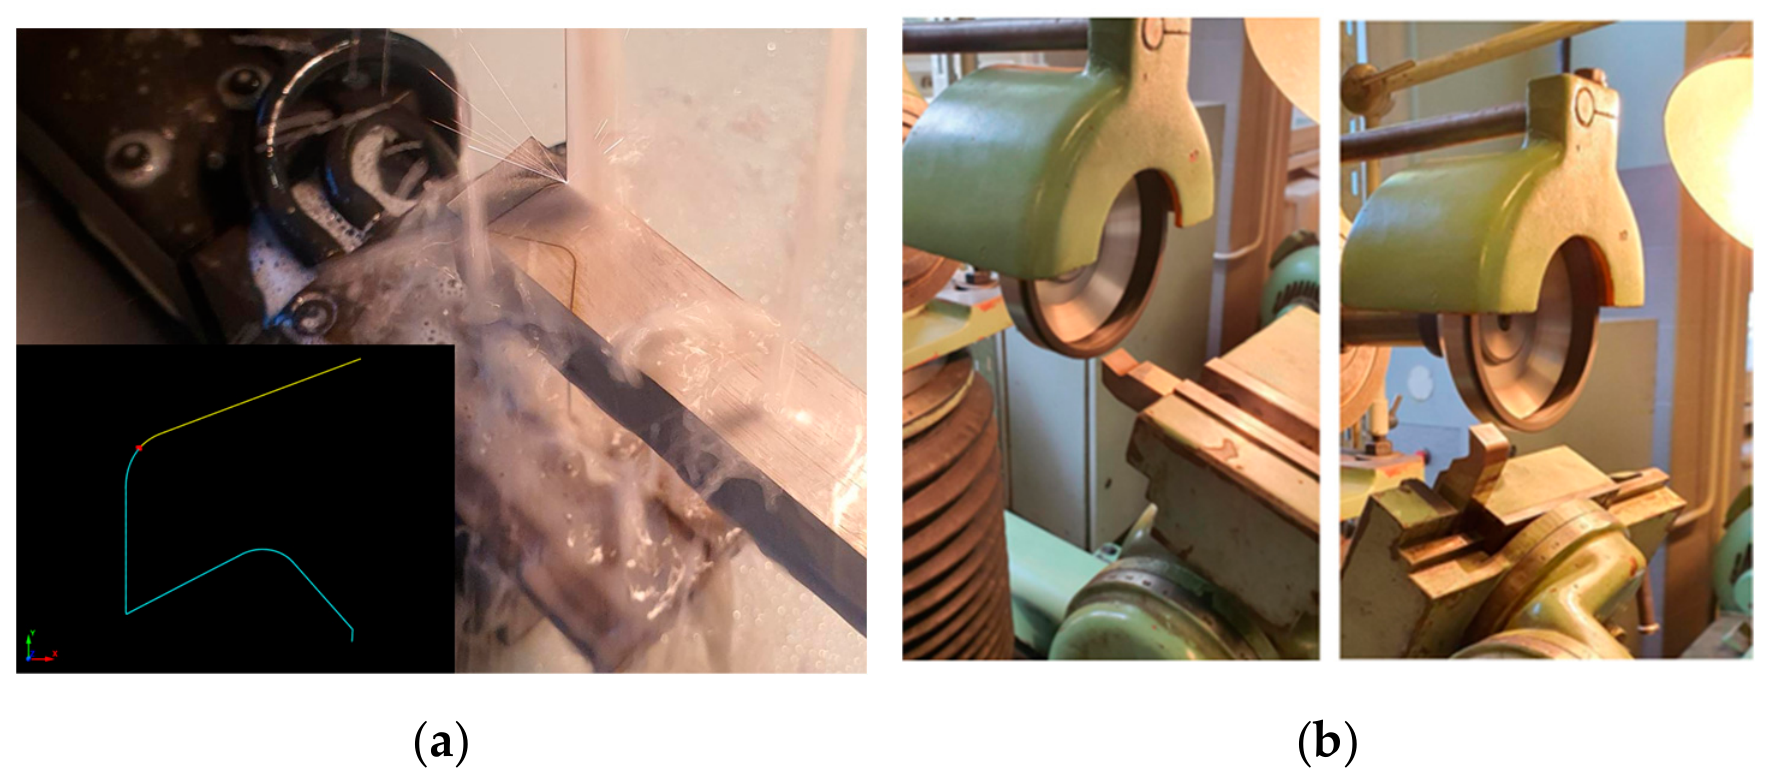
During grinding, the most important factor is the selection of the appropriate grinding wheel. In the case of high-strength tool steels, the best surface quality can be achieved with a grinding wheel containing CBN grains. The machining process of the G15A05 tool is shown in Figure 1.
Grinding was performed on a TOS BN 102 B tool grinder using a CBN wheel. The precise setting of the tool geometries was made possible by the angle-adjustable holders belonging to the machine. The selection of the appropriate grinding wheel and technology made it possible to finish-machine the surfaces of the tools so that they could be used for cutting. The ground tools and the tools pre-roughened by wire EDM are shown in Figure 2. The grinding of the tool shown on the right side of the figure is final. During grinding, machining continued until a homogeneous surface was obtained.

2.2. Design of Tool Holder to Experiments

During the research, the changes occurring as a result of varying the rake angle and the clearance angle of the cutting wedge were investigated. During the experiment, the magnitude and direction of the cutting force, as well as the surface quality of the machined workpiece, were measured.
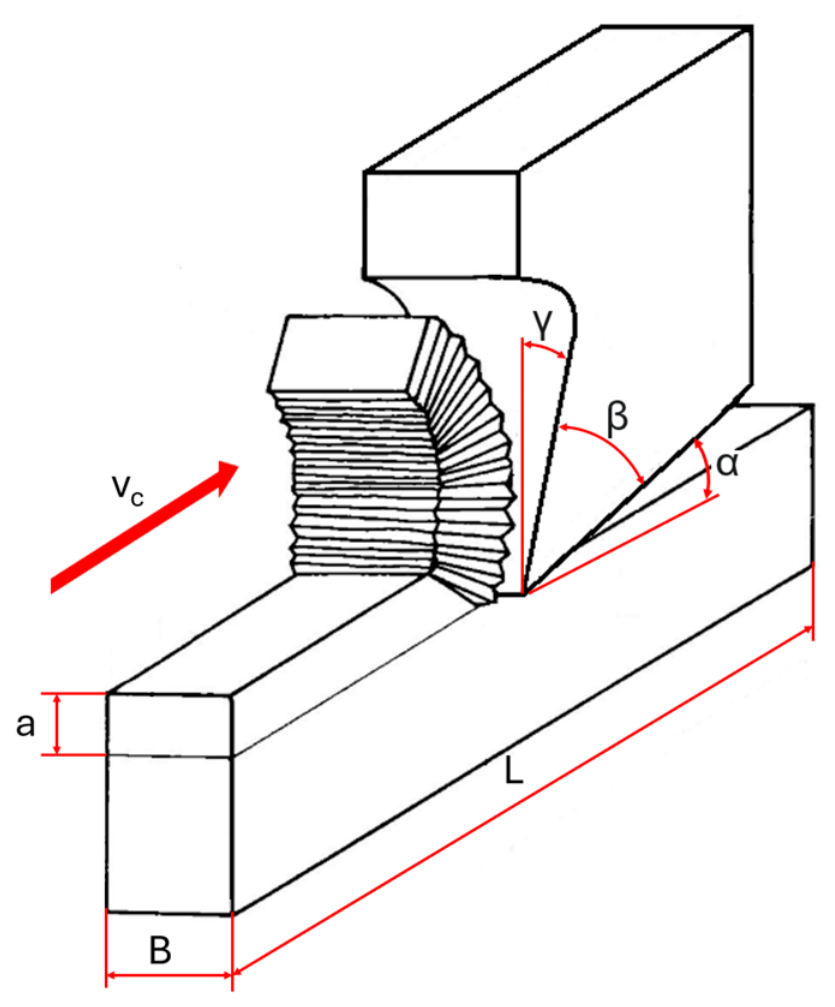
In order for the force measurements to be carried out as accurately as possible and with the lowest possible noise, the machining operations were performed in an orthogonal cutting system. In addition, the system made it possible to measure the force components effectively, so that not only the resultant force, but also the force components, could be compared. The schematic diagram of the machining process is shown in Figure 3.
To perform the machining, the most obvious choice would have been a shaping machine; however, due to the fluctuating feed of these machines, it would not have been suitable. The machine tool used was an NCT BNC-446 flat-bed CNC lathe (NCT Ipari Elektronika Kft, Taksony, Hungary). In order for the machine to be suitable for the machining to be applied during the experiment, it was necessary to design a tool holder.
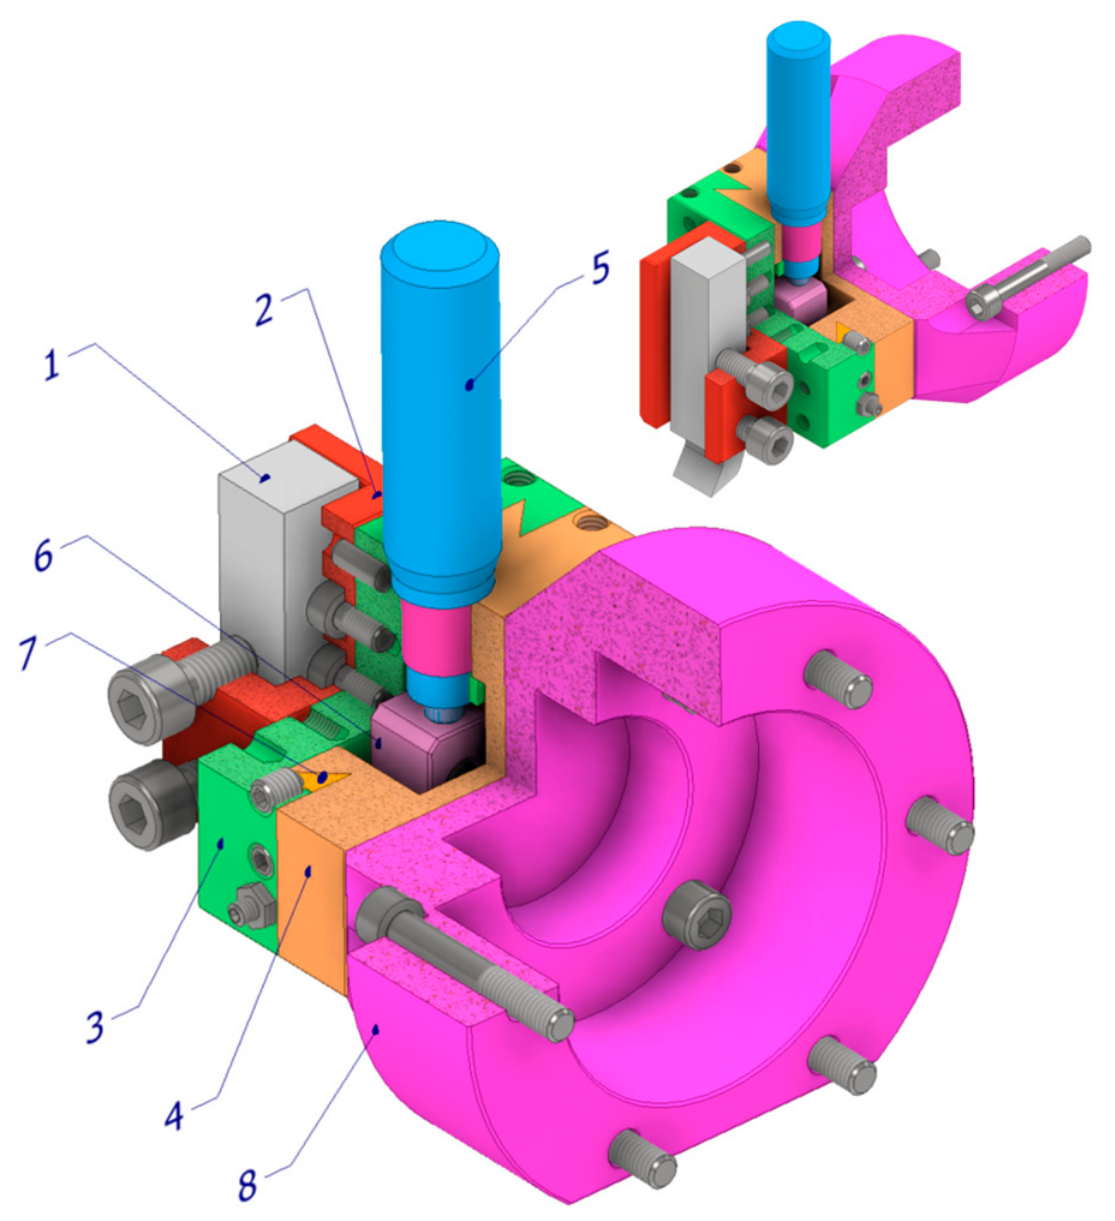
The main purpose of the tool holder is to enable the cutting tools to be fixed on the tailstock of the machine. The function of the holder is to move the tool so that the depth of cut can be set. Therefore, the main criteria are appropriate rigidity, backlash-free operation, and adjustability with an accuracy of 0.01 mm. The structure of the tool holder is shown in Figure 4.
Thanks to the built-in micrometer, the movement of the fixture can be carried out with high accuracy. During cutting, it is necessary to lock the moving side of the fixture in order to prevent it from being displaced by the cutting force, thus ensuring a constant depth of cut. By means of the grub screws located on the side of the fixture, the shim wedge can be pressed against the fixed side of the fixture.

2.3. Experimental Setup

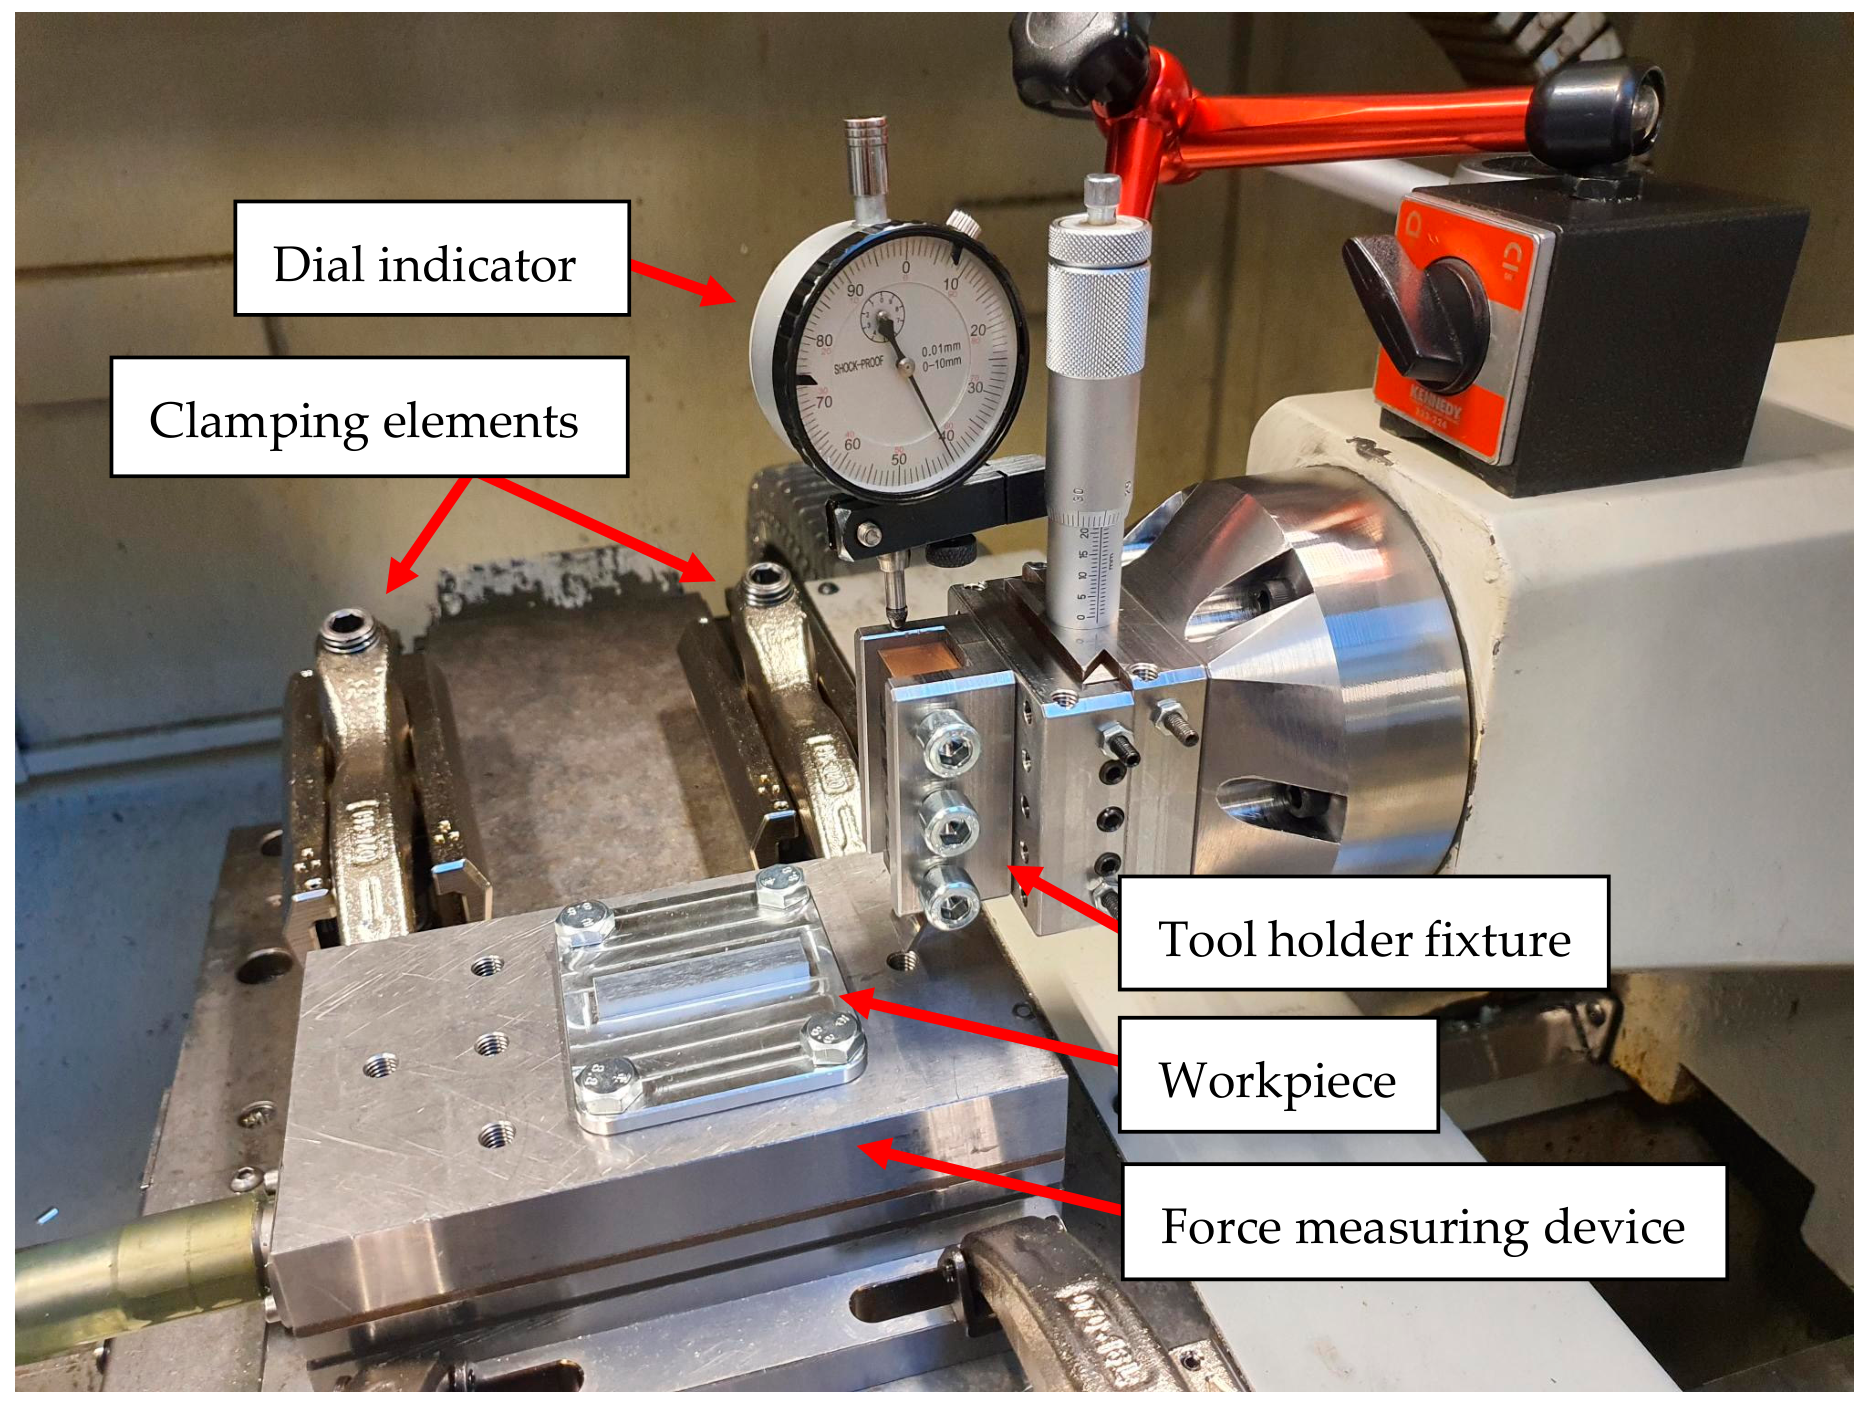
The fixture with the cutting tool was mounted on the tailstock of the flat-bed lathe. It was fixed by means of a bolted connection. The exact position of the fixture was adjusted using a lever-type dial indicator. The complete setup of the measurement environment is shown in Figure 5.
The workpiece used during the experiment was fixed directly onto the force transducer. In order to ensure the accuracy of the measurement, it was a particularly important aspect that the workpiece could be positioned as close as possible to the measuring plane. The width of the workpiece is smaller than that of the tool in order to ensure that the tool tip does not participate in the cutting process. The width of the tool is 16 mm, while that of the workpiece is 10 mm.
Due to the characteristics of the machining process, only a few important technological parameters can be set during cutting. There are altogether 4 parameters, 2 of which result from the geometrical characteristics of the workpiece.
The cutting technology applied during the experiment is as follows: cutting speed, vc = 15 m/min, depth of cut, a = 0.04 mm width of cut, B = 10 mm and machining length, L = 50 mm.
In the case of the cutting speed, the aim was to achieve the highest possible speed that could be realized under the given experimental conditions. The applied cutting speed was determined based by the maximum feed rate of the lathe and was therefore limited to vc = 15 m/min. It should be noted that this cutting speed is lower than the cutting speeds typically used in industrial high-speed machining of aluminum alloys. Therefore, the results of the present study should primarily be interpreted within the framework of low-speed orthogonal cutting using HSS tools.
At the same time, such low cutting speeds may also occur in practical machining operations, particularly when uncoated high-speed steel (HSS) tools are used. Typical examples include reaming, tapping, and, in some cases, drilling with uncoated HSS tools. Therefore, the selected cutting speed can be considered relevant for specific low-speed HSS machining applications. Although the experiments were conducted under orthogonal cutting conditions, the results provide useful insight into the local cutting-edge behavior of HSS tools in machining operations such as drilling, reaming, and tapping. However, the quantitative results should neither be directly generalized to high-speed industrial machining using carbide or PCD tools nor directly transferred to these more complex machining processes, since practical cutting tools involve additional geometrical and process-related factors, including tool point geometry, helical flutes, and varying local cutting conditions along the cutting edge. Further investigations at higher cutting speeds are therefore required to verify whether the observed trends in the cutting-force components, surface roughness, and chip morphology remain valid under industrial high-speed machining conditions.
The depth of cut was also determined from a practical point of view. In the case of HSS milling tools, it was selected based on the feed per tooth, fz.
During the experiment, the generated forces were determined using a Kistler 9257B linear force transducer. The measurement software used was DynoWare® (3.2.5.0), distributed by Kistler (Kistler Bratislava, s.r.o., Bratislava, Slovakia). The measurement frequency was 500 Hz.

2.4. Investigated Parameters

Based on the preliminary literature review, an interval was determined within which the rake angle and the clearance angle should be varied. The selected rake angle range was intended to include both neutral and highly positive cutting-edge geometries, which are relevant for the machining of aluminium alloys with HSS tools. The lower value of 0° represents a neutral rake geometry, while the 15° and 30° values allow the effect of increasingly positive rake angles to be evaluated. The clearance-angle range of 5–15° was selected to include commonly applied and increased clearance values, making it possible to investigate the influence of reduced wedge angle and altered flank-face contact conditions. The rake angle (γ) designed from 0° to 30°, and the clearance angle (α) from 5° to 15° [20,21,22]. The angle values of the tools were modified at 3 levels. During the investigation, a full factorial experimental design was applied; therefore, each level of the rake angle was combined with each level of the clearance angle. The detailed parameters of the tools are summarized in Table 4.
For each of the nine tool geometries, three independent cutting trials were performed under identical cutting conditions.
For each tool, the cutting parameters already mentioned above were applied. During machining, no coolant-lubricant fluid was used.
Due to the nature of the machining process, it is possible to examine the generated chip. Since the machining process takes place quickly, within 0.2 s, it is not possible to measure the heat generated during cutting.
The main objective of the research is to investigate the effects of tools with different edge geometries on the cutting force and surface roughness. The force measurement was carried out using the previously mentioned Kistler device and setup. During force measurement, the cutting force Fc and the passive force Fp are measured. The resultant cutting force F is determined from these two forces. A characteristic feature of the orthogonal cutting system is that there is no third force component.
The roughness measurement was carried out after each machining operation in the machine tool without removing the workpiece, thanks to the portable wireless roughness measuring instrument. During the measurements, a MahrSurf M 310 roughness measuring instrument (Mahr Magyarország Kft, Budaörs, Hungary) was used.

2.5. Measurement of Cutting Tool Geometries and Surface Roughness

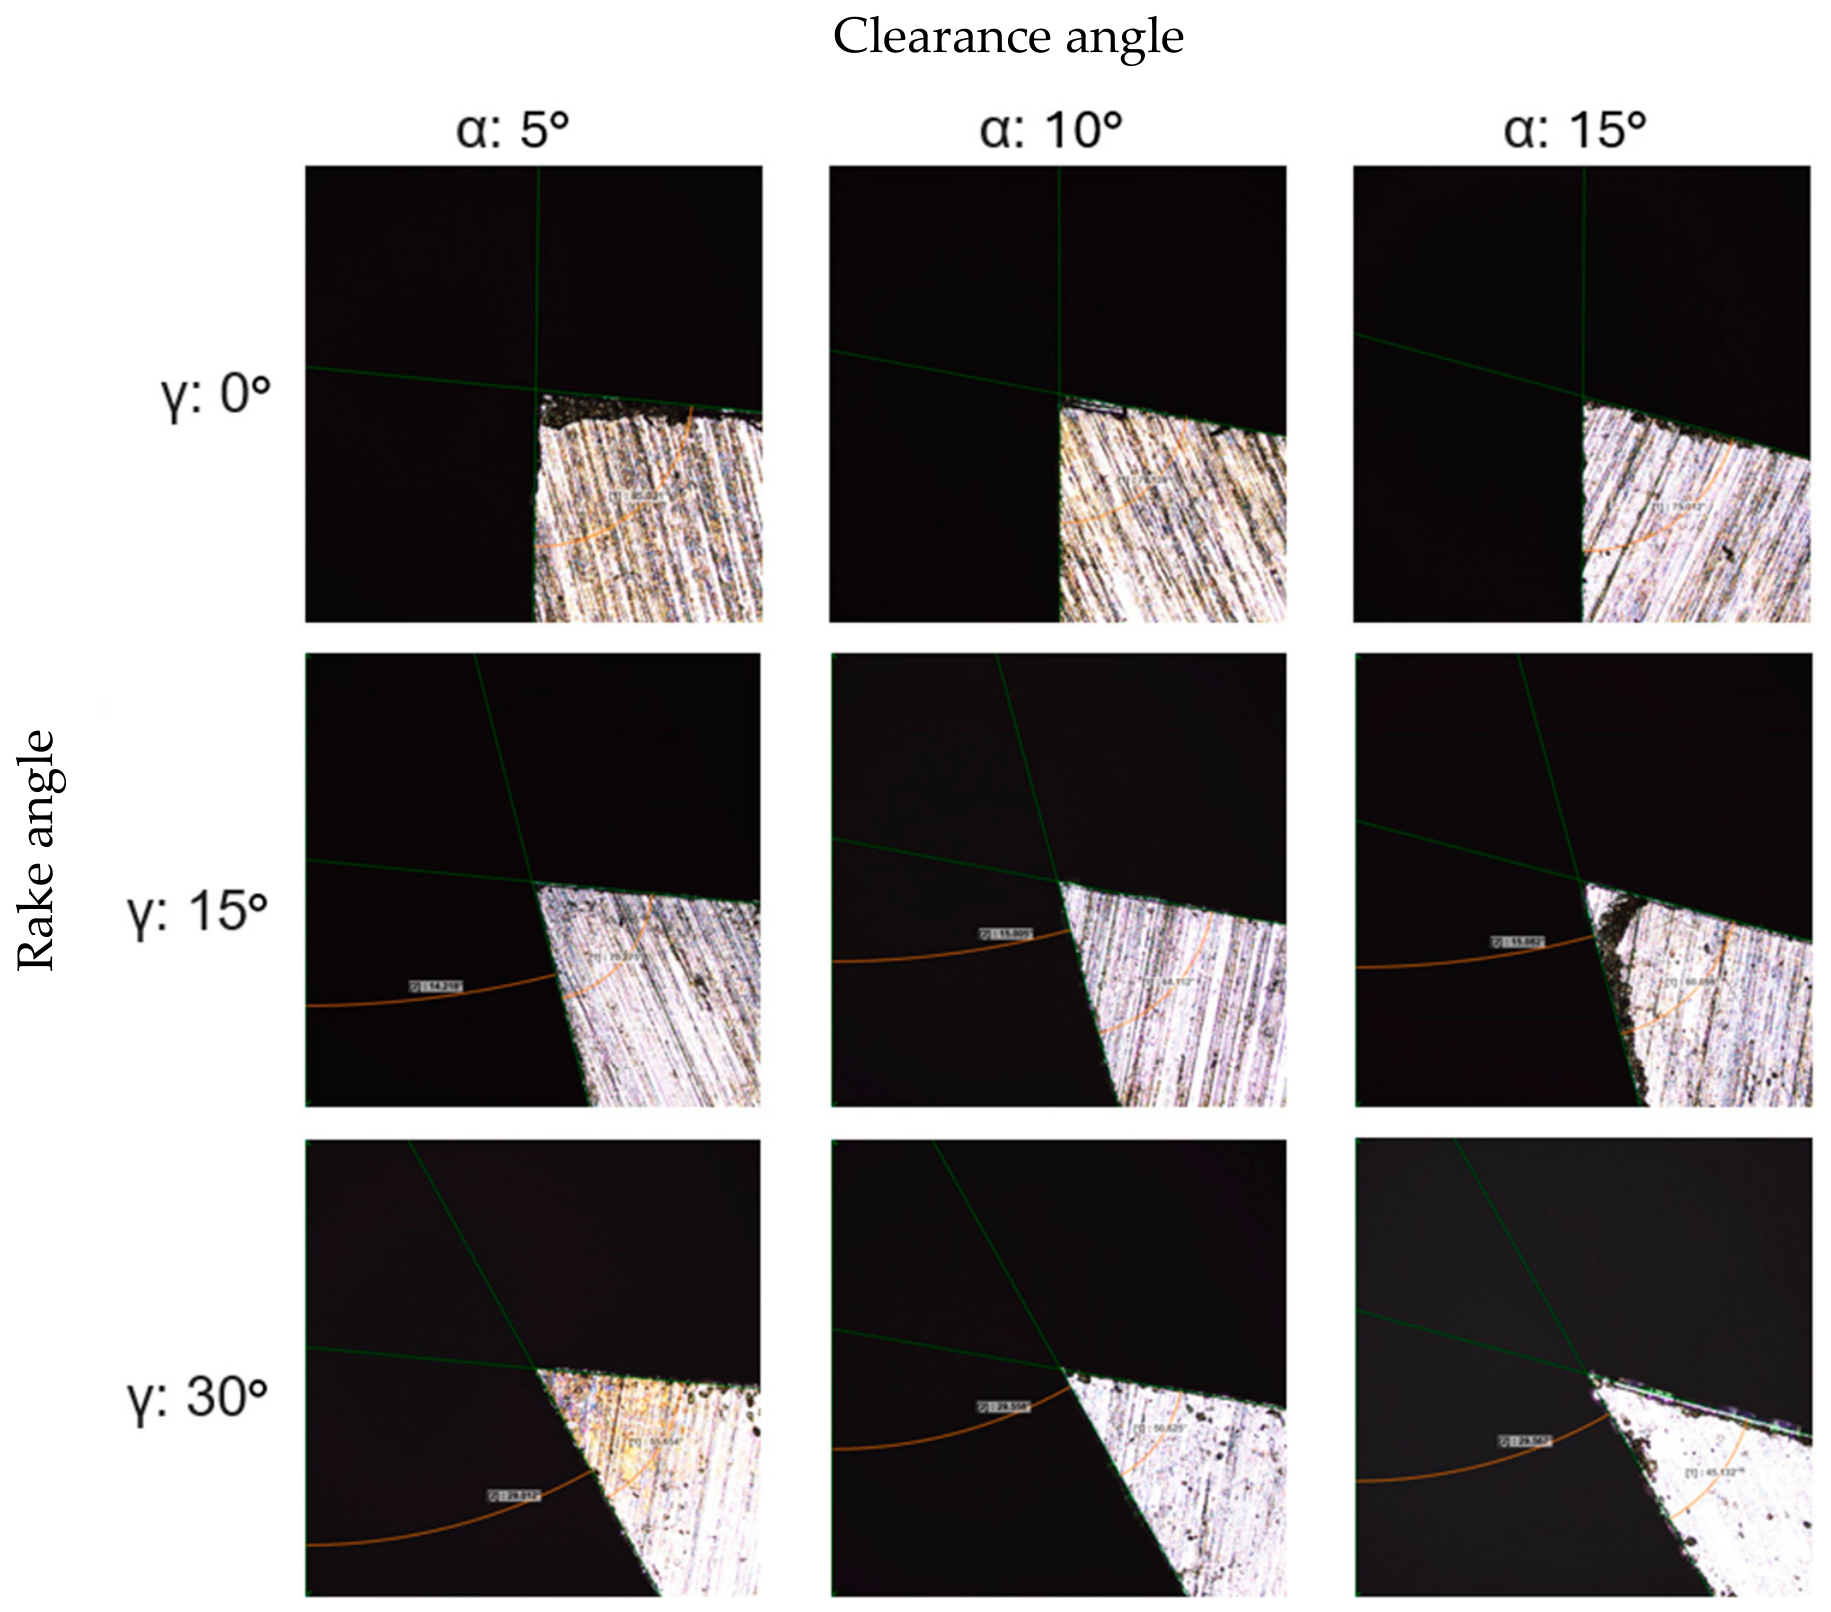
During the grinding of the cutting tools, the machine settings were performed manually. Therefore, the geometries of the manufactured tools had to be checked. During the inspection, not only the angles of the tool, but also the cutting-edge rounding were checked. The measurements were carried out using an Olympus LEXT OLS5000 confocal microscope (Olympus Corporation, Tokyo, Japan). By means of this microscope, it was possible to examine not only the tool geometry, but also the surface quality. Figure 6 shows the microscopic images of the 9 tools with different geometries.
Based on the confocal microscope images, no pronounced cutting-edge rounding could be observed qualitatively. However, the cutting-edge radius was not quantified in the present study. Therefore, the presence of a small edge radius of a few micrometers cannot be completely excluded. Since a relatively small depth of cut was applied in the experiments, even a small cutting-edge radius may influence ploughing effects, the passive force component, chip formation, and the generated surface roughness. Consequently, the possible influence of cutting-edge radius should be considered when interpreting the results. A quantitative characterization of the cutting-edge radius is therefore recommended for future investigations. The indicated angle values correspond to the designed geometry. The image size is 2573 × 2573 microns in each case. The measured angles are presented in tabular form in Table 5.
The data clearly show that the manufacturing of the tools was accurate. Even the largest angular deviation is less than 1°. The reference surface was the shank of the tool, which is fixed in the fixture, and the angle measurement was carried out relative to this surface.
Using the microscope, it was possible to measure the roughness of the ground surface. No scatter was observed in the measured values, since each tool was machined with the same technological parameters. The average surface roughness of the cutting tools was Sa = 0.085 µm, and the maximum height of the surface was Sz = 1.613 µm.

2.6. Material Machined During the Experiment

The material quality of the workpiece machined during the experiment was EN AW-7075-T6 aluminum alloy. This alloy is primarily used in applications where high specific strength and fatigue performance are important. Examples include the aerospace industry and motorsport [23,24]. EN AW-7075-T6 is a high-strength, heat-treatable alloy that exhibits different cutting behavior compared to the softer 5xxx and 6xxx series aluminum alloys. Due to its higher hardness, it is less prone to adhesion to the cutting edge and built-up edge formation; therefore, favorable surface quality can be achieved with appropriate parameters. At the same time, the process is sensitive to feed rate, tool geometry, and the method of cooling and lubrication [25,26,27]. The chemical composition of the alloy was determined using the previously mentioned spectroscope and measurement procedure. The chemical composition of the alloy is summarized in Table 6. The physical properties of the aluminum used are summarized in Table 7, while its mechanical properties are summarized in Table 8.

3. Results

3.1. Cutting Force Measurement and Evaluation

During the experimental series, three independent orthogonal cutting trials were performed for each of the nine investigated tool geometries. Since each measurement was associated with a time-dependent force signal containing a large number of samples, a custom Python-based evaluation program was developed in order to process the raw measurement data in a uniform and reproducible manner. The aim of the program was to determine the cutting force components, as well as the resultant cutting force calculated from them, from each measurement based on the same methodology. By applying the automated evaluation procedure, subjective differences resulting from manual data selection could be reduced, and it was also ensured that the force values corresponding to the different tool geometries could be directly compared.
Before the evaluation of the raw force signals, baseline correction was applied. The purpose of this was to remove the initial offset of the force measurement system, as well as the static signal component present before the measurement. The baseline was determined from the unloaded signal section before the start of the cutting process. The median value of this section was subtracted from the entire measured signal for both force components. As a result, the subsequent calculations were based on the corrected force components originating from the actual cutting process.
After baseline correction, the resultant cutting force was determined for each sampling point. The resultant force was calculated as the vector resultant of the cutting force and the passive force:
F i = F c , i 2 + F p , i 2
where F c , i is the cutting force corresponding to the given sampling point, F p , i is the passive force corresponding to the given sampling point, and F i is the resultant cutting force calculated for the given point.
The actual cutting section was identified automatically based on the resultant force signal. Using a threshold value, the program identified the active cutting range and then selected the longest continuous signal section located above the threshold value. Since the duration of the cutting events was approximately 0.2 s, the automatically identified section was checked relative to this duration.
In order to reduce the entry and exit transient effects, 5–5% was trimmed from the beginning and the end of the selected cutting interval. The average force values and standard deviations presented in the table were determined based on the remaining middle, steady-state section.
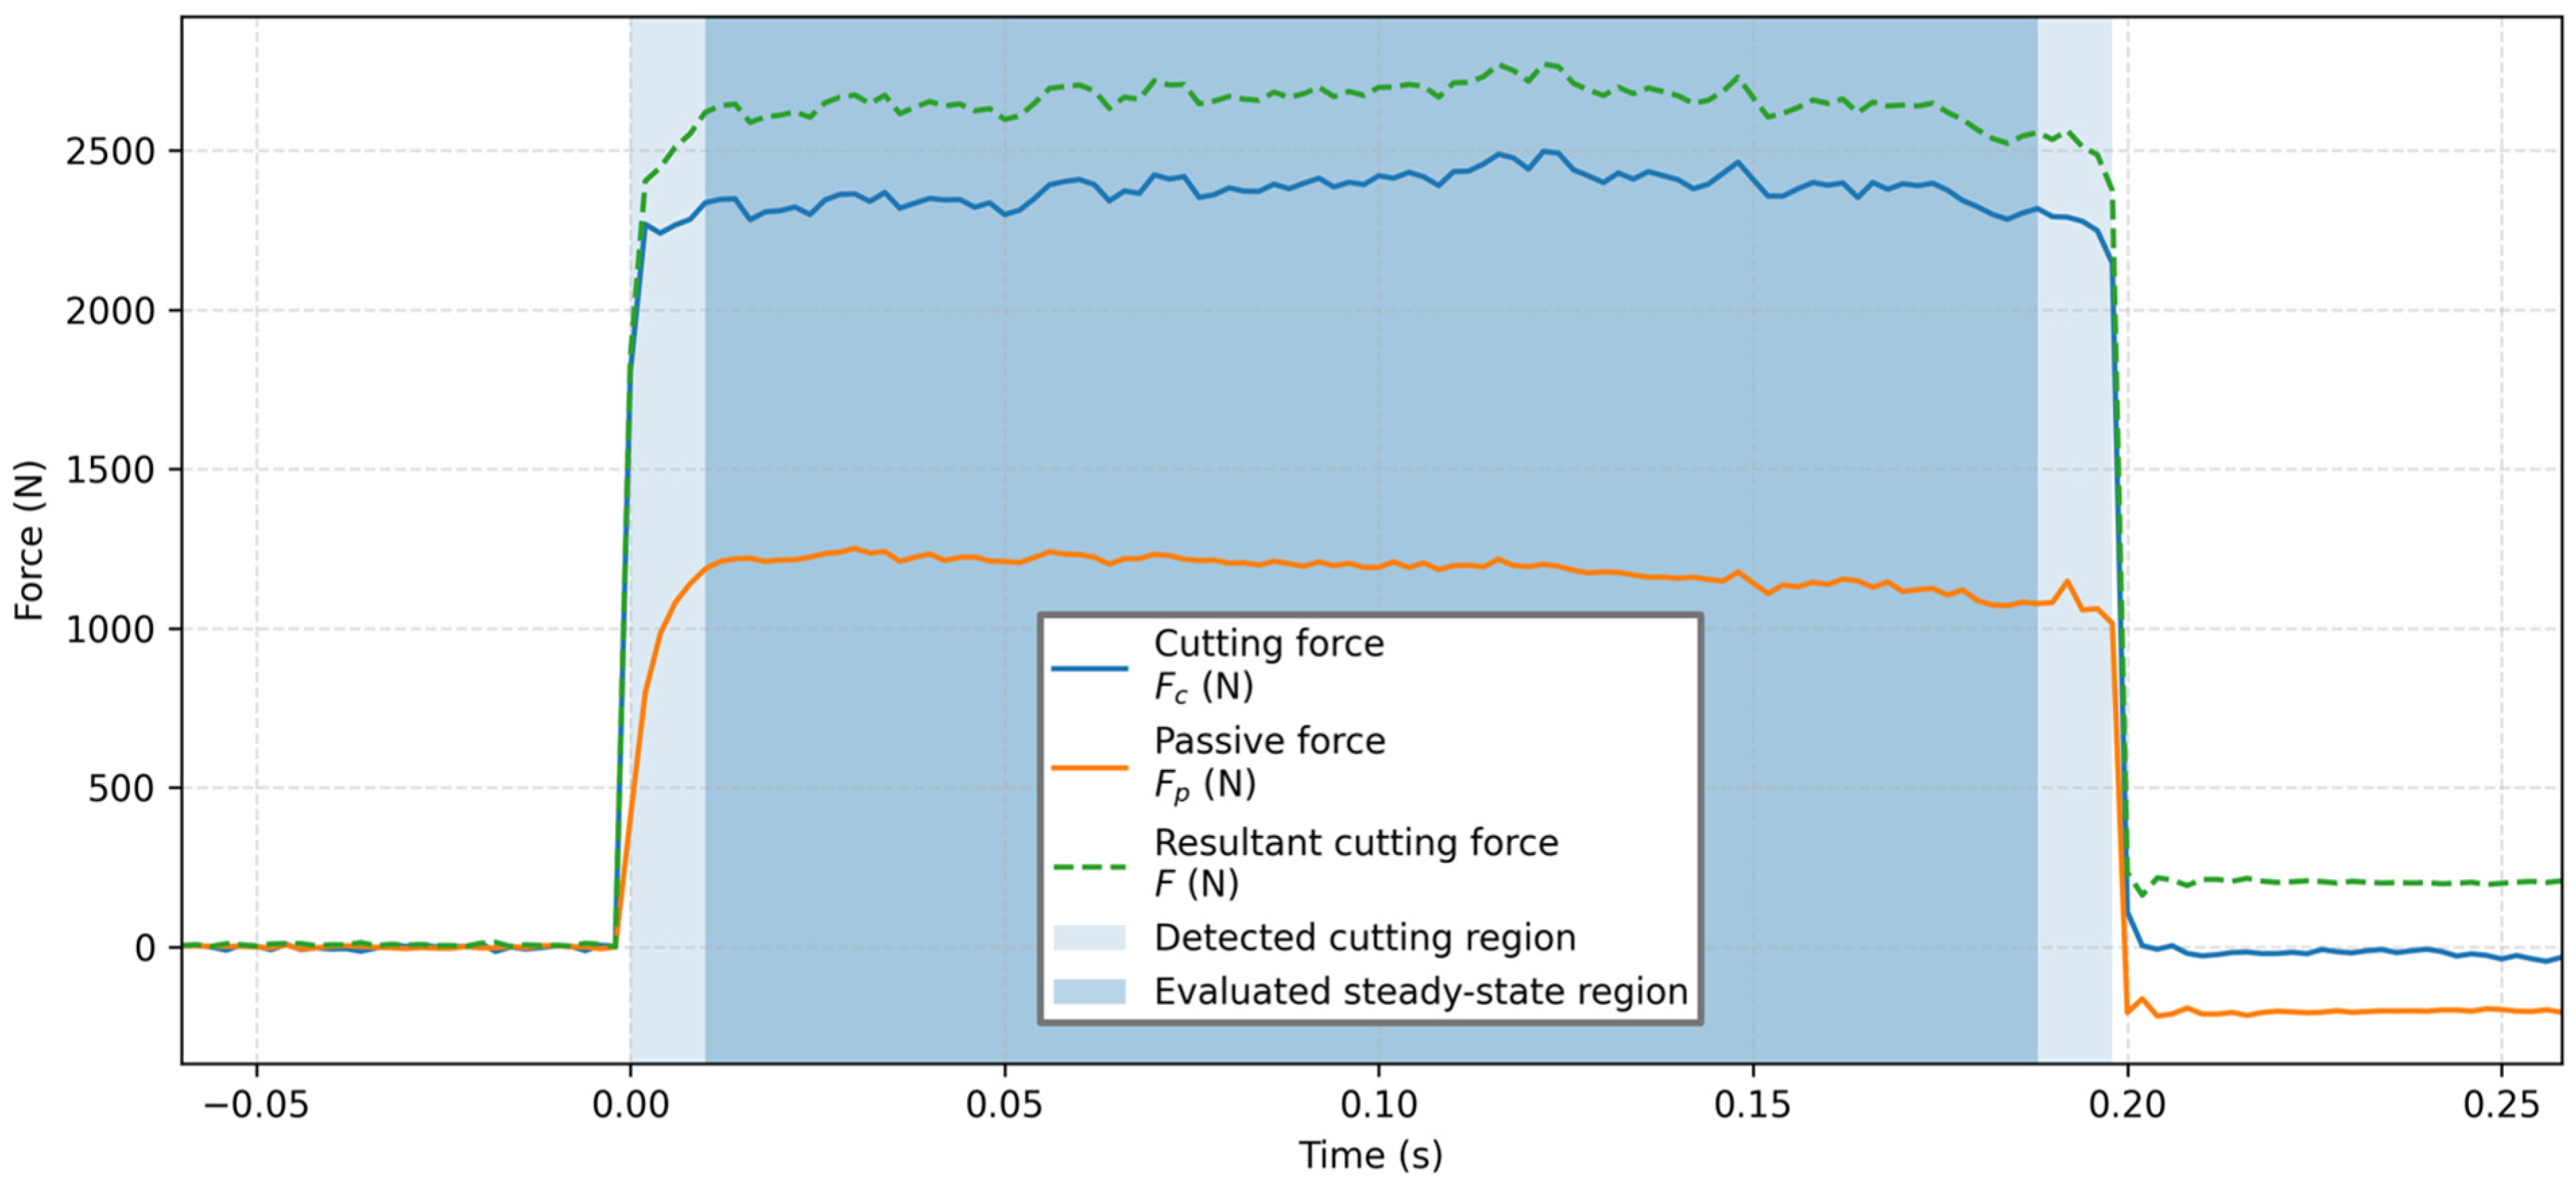
In order to make the evaluation procedure easier to interpret, the time-dependent variation in the force components and the resultant cutting force was also presented in a diagram. Figure 7 illustrates the initial and final transient sections of the cutting process, the automatically identified active cutting interval, as well as the middle, steady-state section based on which the average force values and standard deviations were determined. With the help of this, it can be clearly demonstrated that the force data presented in the table were not calculated from the entire measured signal, but exclusively from the stable cutting range.
Based on Figure 7, the run-up section corresponding to tool entry, the steady-state cutting range, and the decay section associated with tool exit can be clearly distinguished. From the point of view of evaluation, the middle steady-state range can be considered representative, since in this section the force signals fluctuate at an approximately constant level. In this way, the influence of the entry and exit transient effects on the average force values can be reduced.
The standard deviation of the resultant cutting force was not calculated from the standard deviations of the individual components, but from the Fi values determined at each sampling point. Thus, the Fc, Fp, and F values presented in the table characterize the average force level of the steady-state cutting section, while the sFc, sFp, and sF values characterize the signal fluctuation within the given section.
For each tool geometry, three independent cutting trials were performed. The mean Fc and Fp values obtained from each trial were treated as independent observations in the two-way ANOVA. The within-trial standard deviations sFc, sFp, and sF reported in Table 9 were used only to characterize the fluctuation of the force signals within the corresponding steady-state cutting intervals and were not included as independent observations in the statistical analysis. The resultant cutting force F was not subjected to two-way ANOVA because it was calculated from the Fc and Fp components. The numerical data of the force measurements are summarized in Table 9.
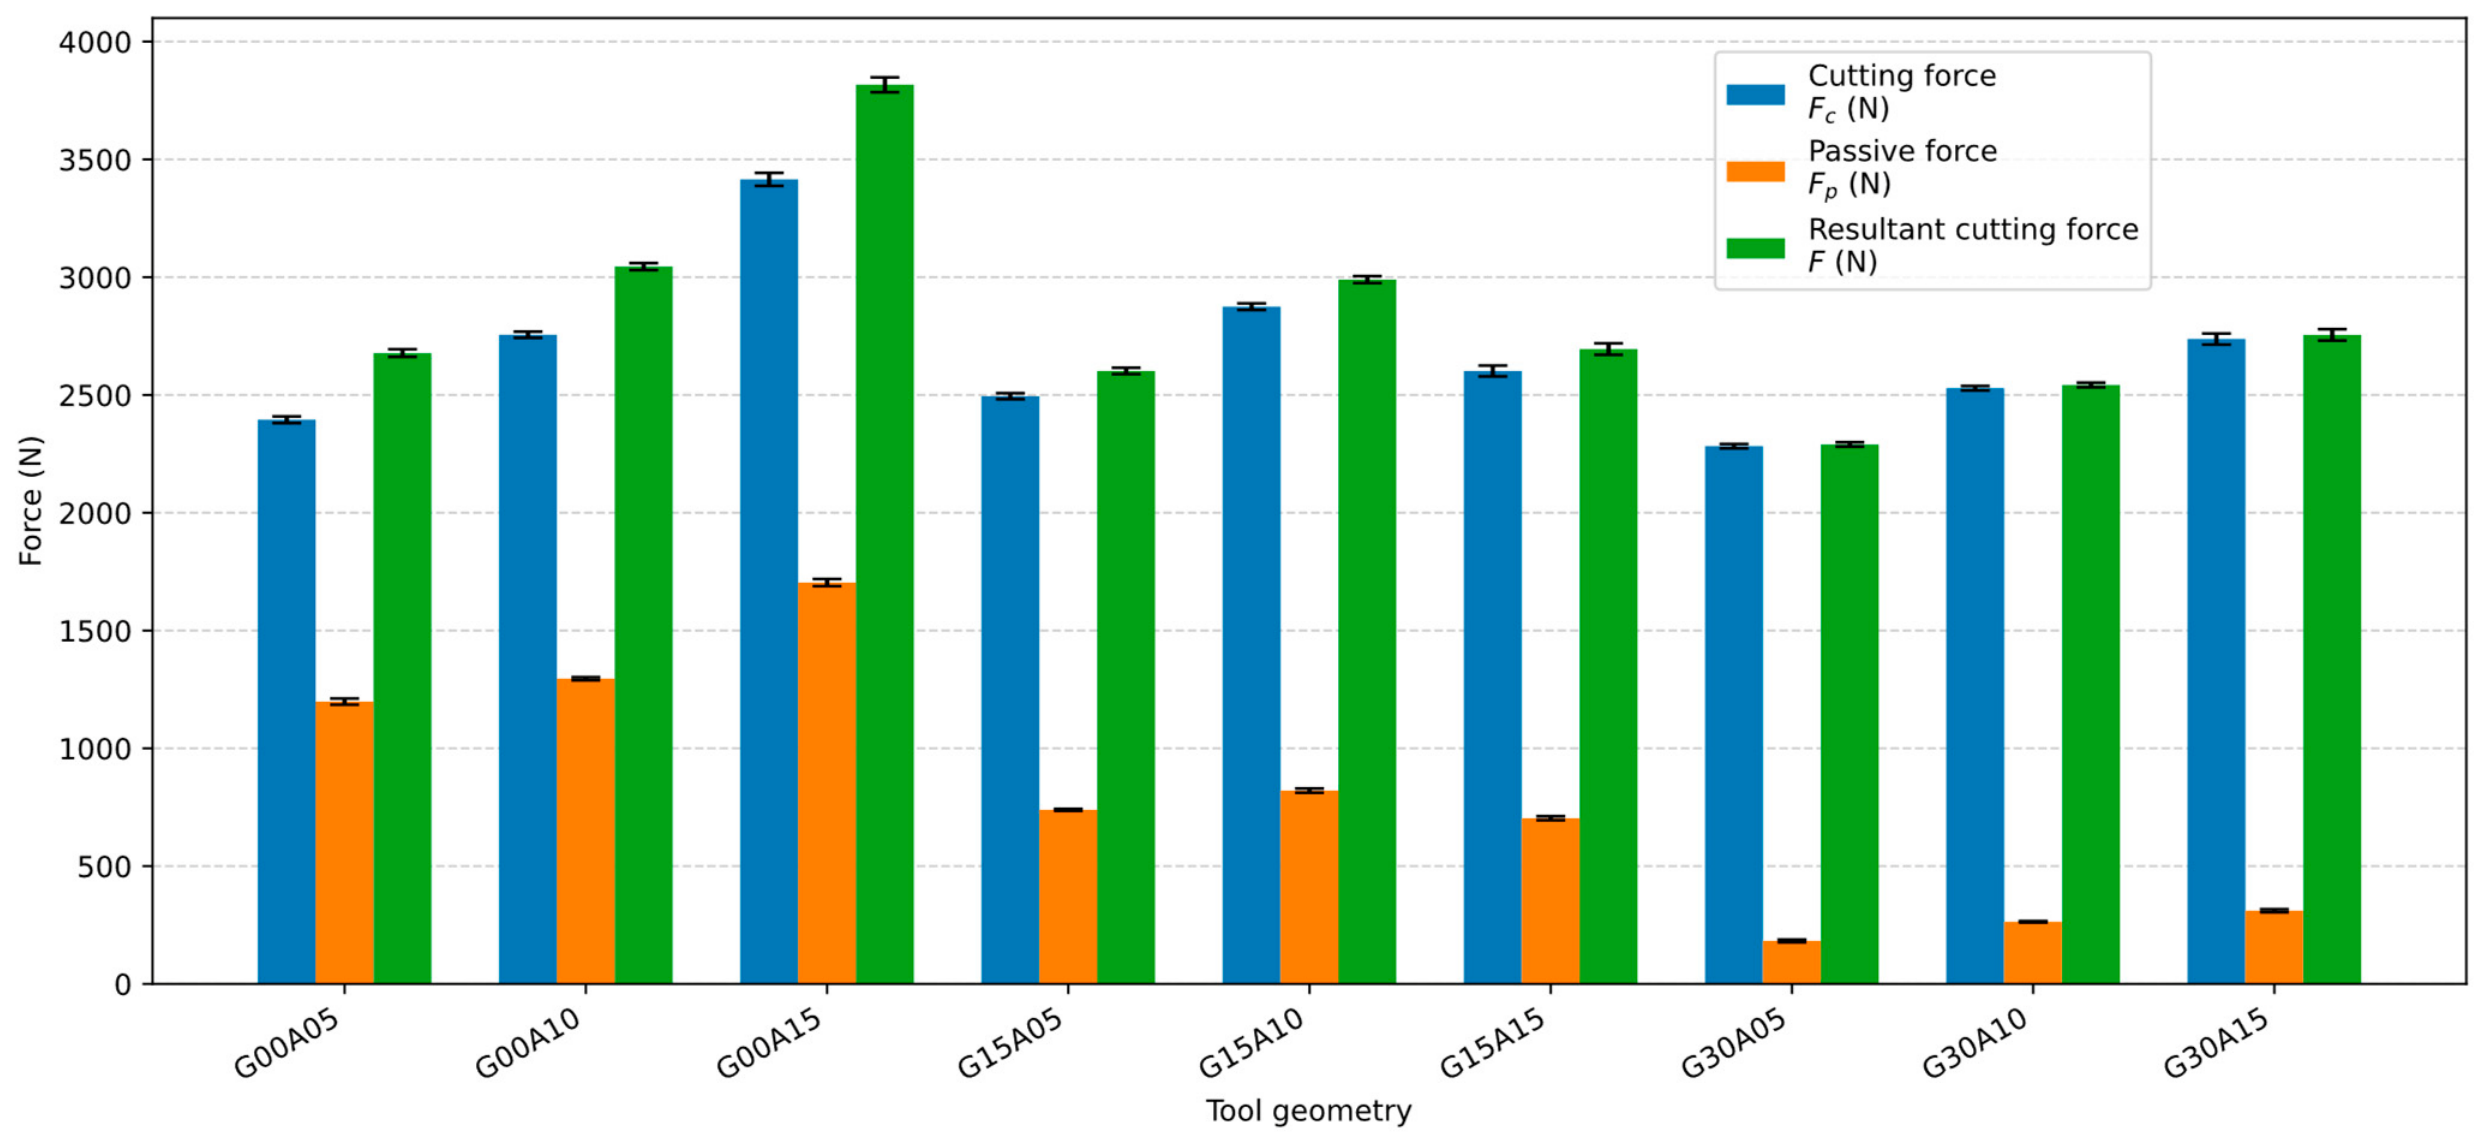
As a supplement to the tabulated results, the force components were also represented in a bar chart, as shown in Figure 8. For each tool geometry, the columns represent the mean values of the Fc, Fp, and F forces obtained from three independent cutting trials. The error bars indicate the standard deviations calculated from these three independent measurements. The figure therefore enables both the tendencies associated with the different tool geometries and the repeatability of the force measurements to be compared.
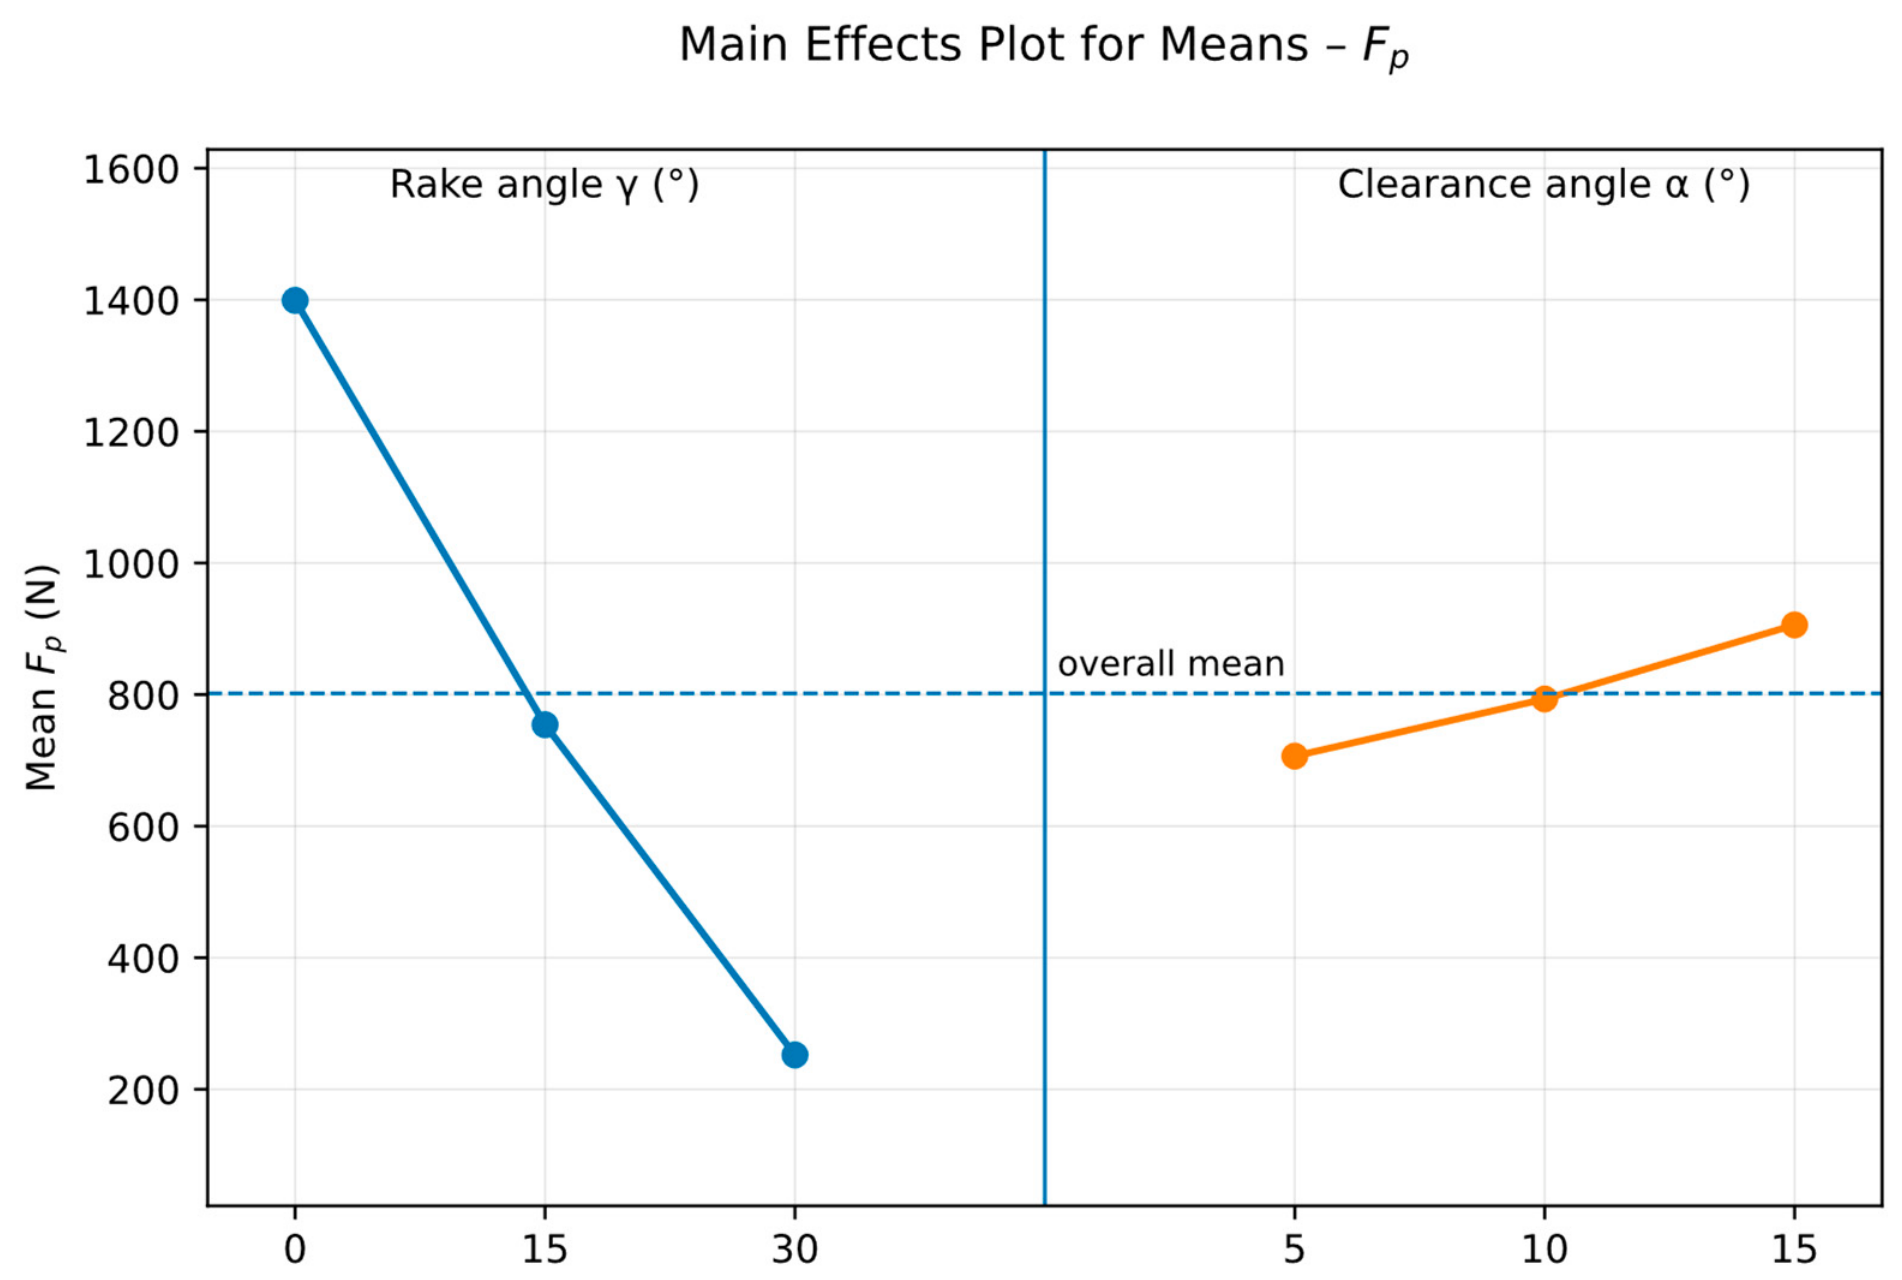
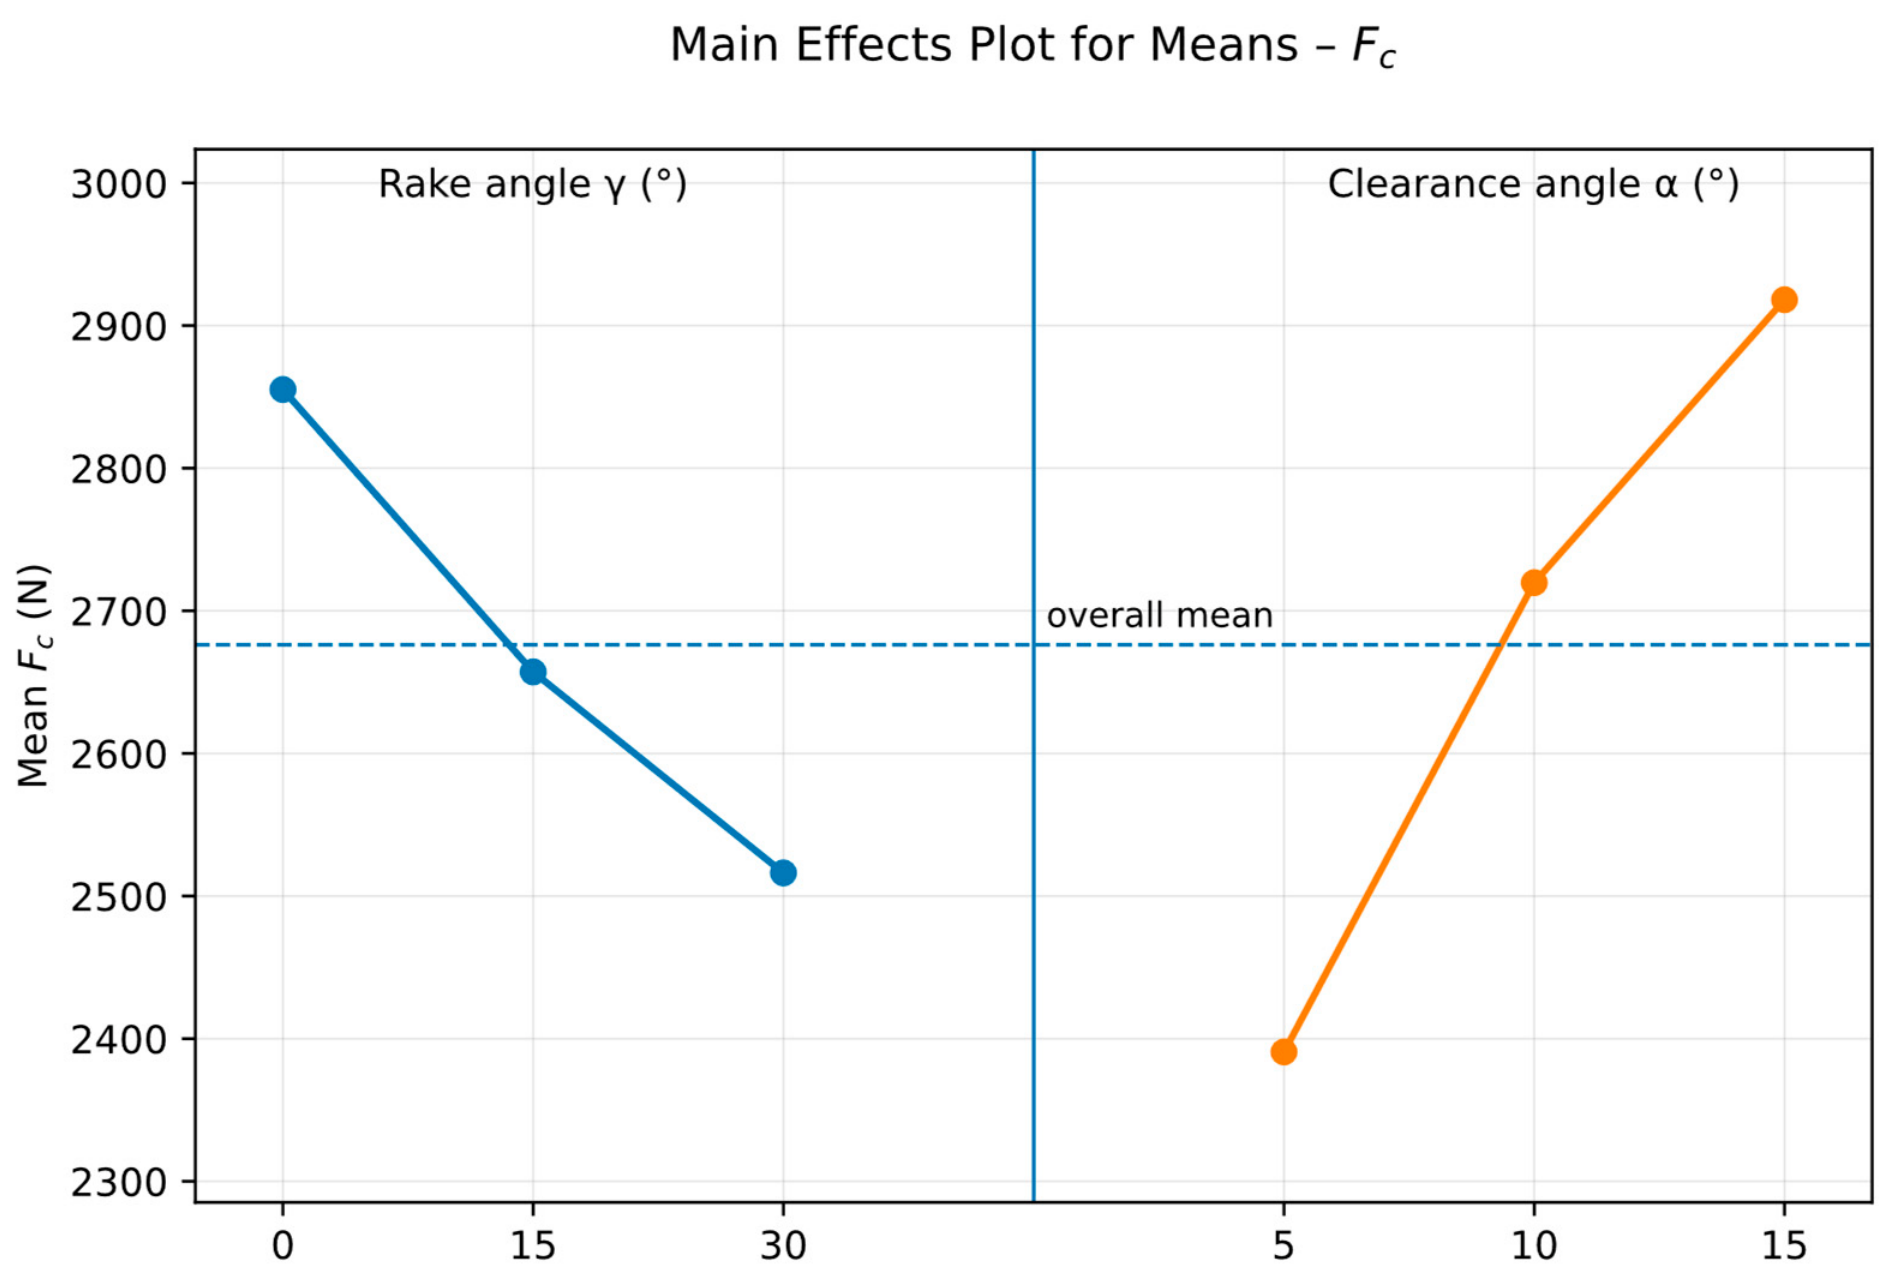
Based on the numerical force measurement results, Taguchi main effects plots were prepared for the cutting force Fc and the passive force Fp. The application of the method was justified by the fact that, during the investigation, the rake angle and the clearance angle were varied at three levels each; therefore, by means of the main effects plots, the effect of the individual geometrical parameters on the force components could be visually evaluated. The resultant force F was not presented in a separate main effects plot, since it is a derived quantity calculated from the Fc and Fp components, and therefore carries independent physical information only to a limited extent. From the point of view of interpreting the effect of tool geometry, the separate investigation of the two mutually perpendicular force components can be considered justified. The main effects plots corresponding to the cutting force Fc and the passive force Fp presented in the table are shown in Figure 9 and Figure 10.
Based on the diagram, it can be concluded that the average main cutting force (Fc) exhibited a decreasing trend with increasing rake angle. The highest average main cutting force was measured at a rake angle of 0°, while the lowest value was observed when a 30° rake angle was applied. This phenomenon can be explained by the fact that a more positive rake angle provides more favorable chip-flow conditions. As the rake angle increases, the deformation work occurring along the shear plane is reduced, and the friction between the chip and the rake face is also diminished. Consequently, less energy is required for chip separation, resulting in lower cutting force values.
In contrast, the effect of the clearance angle on the Fc value exhibited an increasing trend. As the clearance angle was increased from 5° to 15°, the average main cutting force also increased. This suggests that, within the investigated geometrical range, a larger clearance angle resulted in less favorable force conditions. The increase was particularly pronounced in the range between 10° and 15°, indicating that the application of a larger clearance angle cannot be considered advantageous with respect to the Fc main cutting force component. This behavior can be attributed to the fact that increasing the clearance angle reduces the wedge angle of the cutting tool, thereby decreasing the mechanical stiffness of the cutting edge. The reduced edge stiffness may lead to less favorable force conditions and greater localized deformation, which is reflected in the observed increase in the measured force components.
In the case of the passive force Fp, the effect of the rake angle appeared considerably more pronounced than in the case of Fc. With increasing rake angle, the average passive force decreased significantly. The highest Fp values occurred at a rake angle of 0°, while in the case of a 30° rake angle, the magnitude of the passive force was significantly lower. This trend indicates that, under the investigated experimental conditions, a more positive rake angle reduced the passive load acting on the cutting tool, thereby improving the chip-flow conditions.
Increasing the clearance angle resulted in a slight increase in the Fp value; however, its effect was smaller compared to the effect of the rake angle. Based on the main effects plot, the development of the passive force was primarily determined by the variation in the rake angle, while the role of the clearance angle can be considered secondary.
Although the Taguchi main effects plots allow the main tendencies of the force components to be visualized, statistical significance and the interaction between the rake angle and the clearance angle cannot be evaluated from these plots alone. Therefore, the Fc and Fp results were additionally evaluated using two-way ANOVA. Three independent cutting trials were performed for each tool geometry, and the effects of the rake angle, the clearance angle, and their interaction were examined at a significance level of α = 0.05. Effects with p < 0.05 were considered statistically significant. The data corresponding to the two-way analysis of variance for the Fc and Fp results are presented in Table 10 and Table 11.
Based on the two-way ANOVA results for the Fc values, the effects of the rake angle, the clearance angle, and their interaction were all found to be statistically significant p < 0.001. Among the investigated factors, the clearance angle exhibited the strongest effect on the cutting force. The significant interaction indicates that the influence of one geometrical parameter on Fc depended on the level of the other parameter.
Based on the two-way ANOVA results for the Fp values, the effects of the rake angle, the clearance angle, and their interaction were all found to be statistically significant p < 0.001. Among the investigated factors, the rake angle exhibited the strongest effect on the passive force. The significant interaction indicates that the effect of the clearance angle on Fp varied depending on the applied rake-angle level.
Overall, it can be concluded that tool geometry had a statistically significant effect on the force components occurring during cutting. In the case of the cutting force Fc, increasing the rake angle reduced the force value, while increasing the clearance angle increased it. The two-way ANOVA confirmed that the effects of the rake angle, the clearance angle, and their interaction were all statistically significant p < 0.001, with the clearance angle exhibiting the strongest effect on Fc. In the case of the passive force Fp, the effect of the rake angle was dominant, since a larger rake angle resulted in a substantial reduction in the passive force. The ANOVA results also showed that the effects of both geometrical parameters and their interaction were statistically significant for Fp, with the rake angle having the strongest influence. Therefore, within the investigated range, the application of a larger rake angle resulted in more favorable force conditions, particularly with respect to reducing the passive load, while the significant interactions indicate that the effect of one geometrical parameter depended on the level of the other.

3.2. Surface Roughness Evaluation

For each tool geometry, three independent cutting trials were performed. After each cutting trial, the surface roughness of the machined surface was measured at three different positions: at the beginning, in the middle, and at the end of the workpiece. The three profile measurements were averaged, and the resulting Raavg. and Rzavg. values represented one independent observation. Consequently, three independent Raavg. and Rzavg. values were obtained for each tool geometry. The results are summarized in Table 12. The measurements were carried out using the previously mentioned MahrSurf M 310 portable roughness measuring instrument.
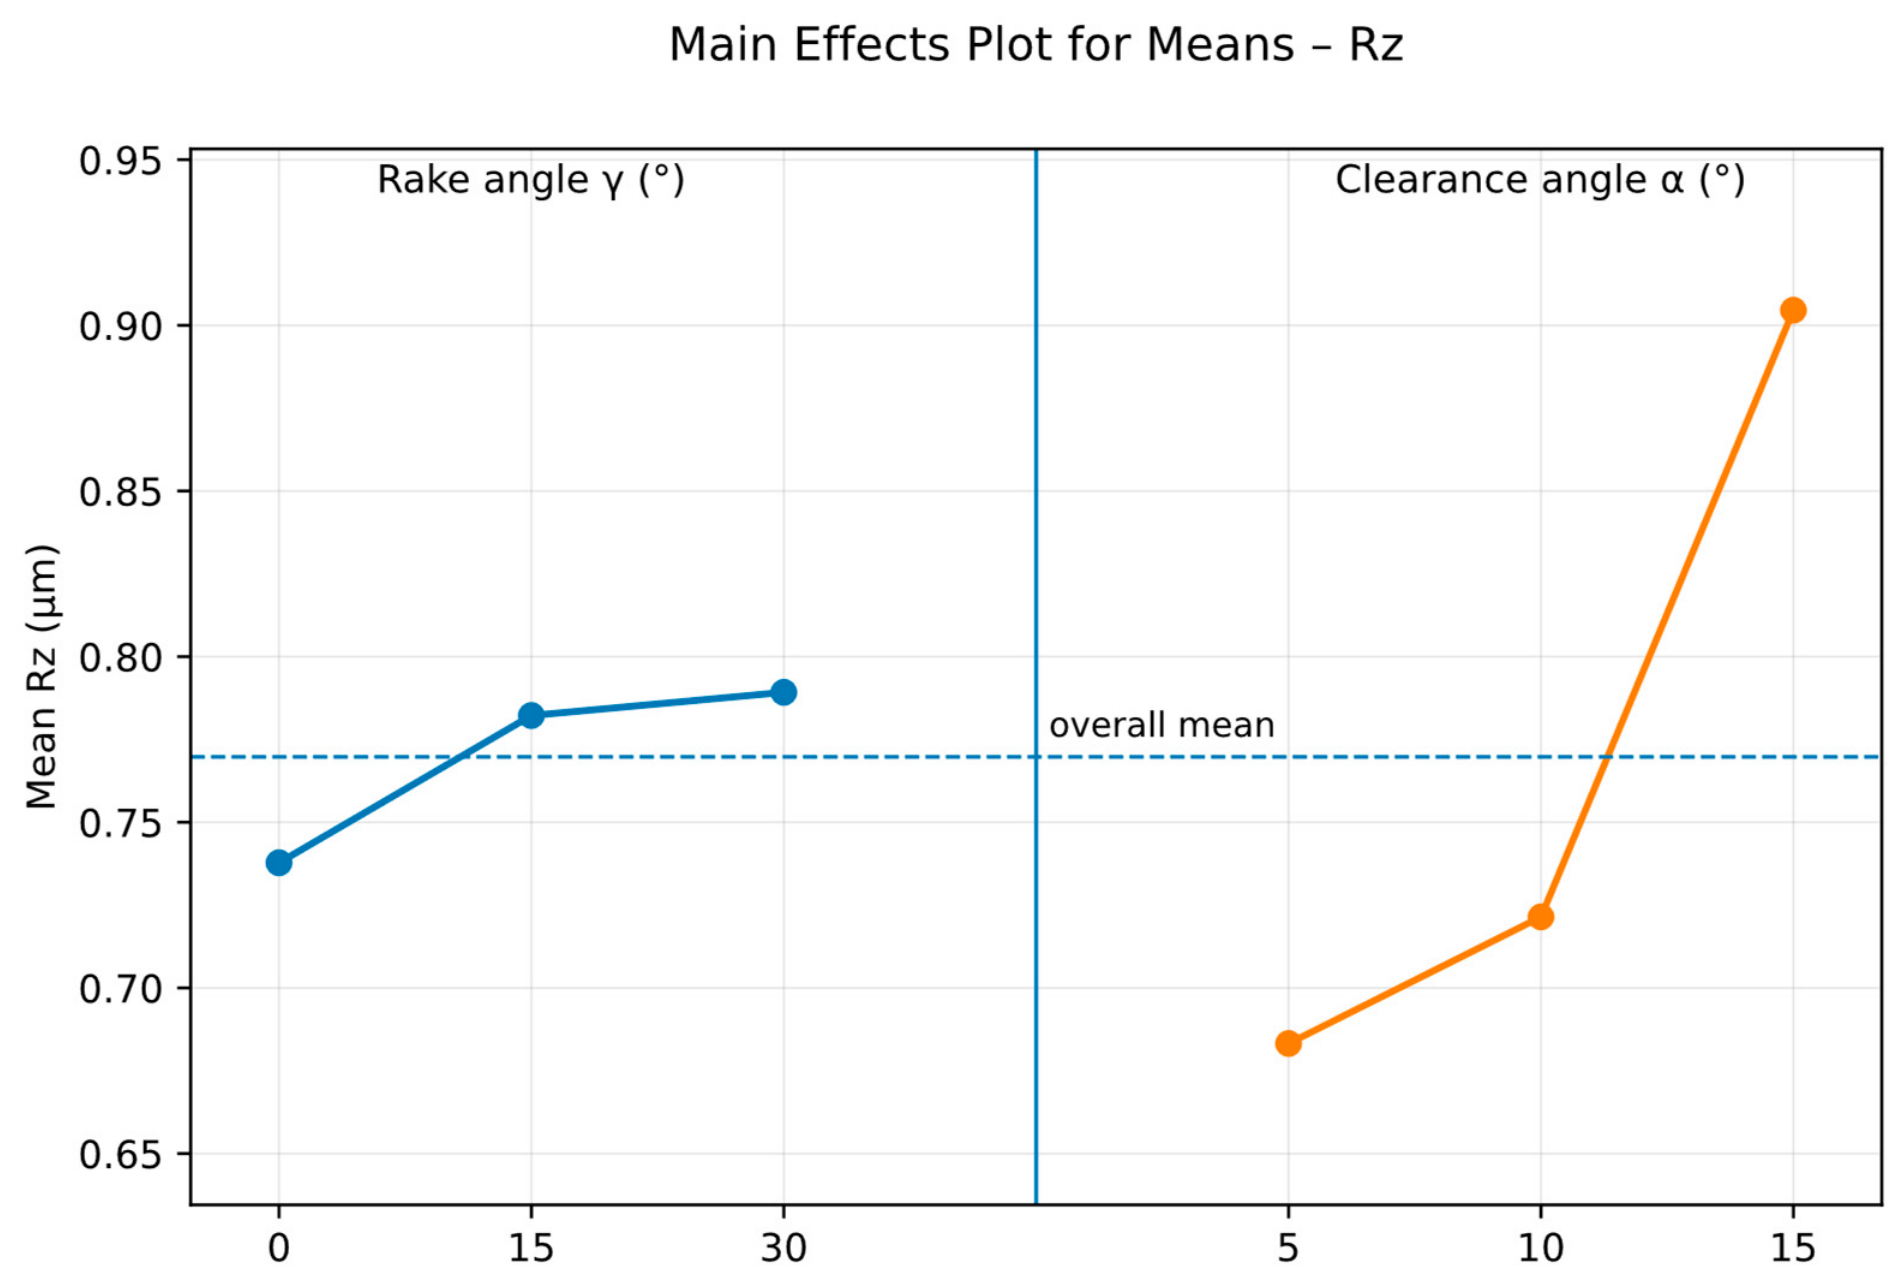
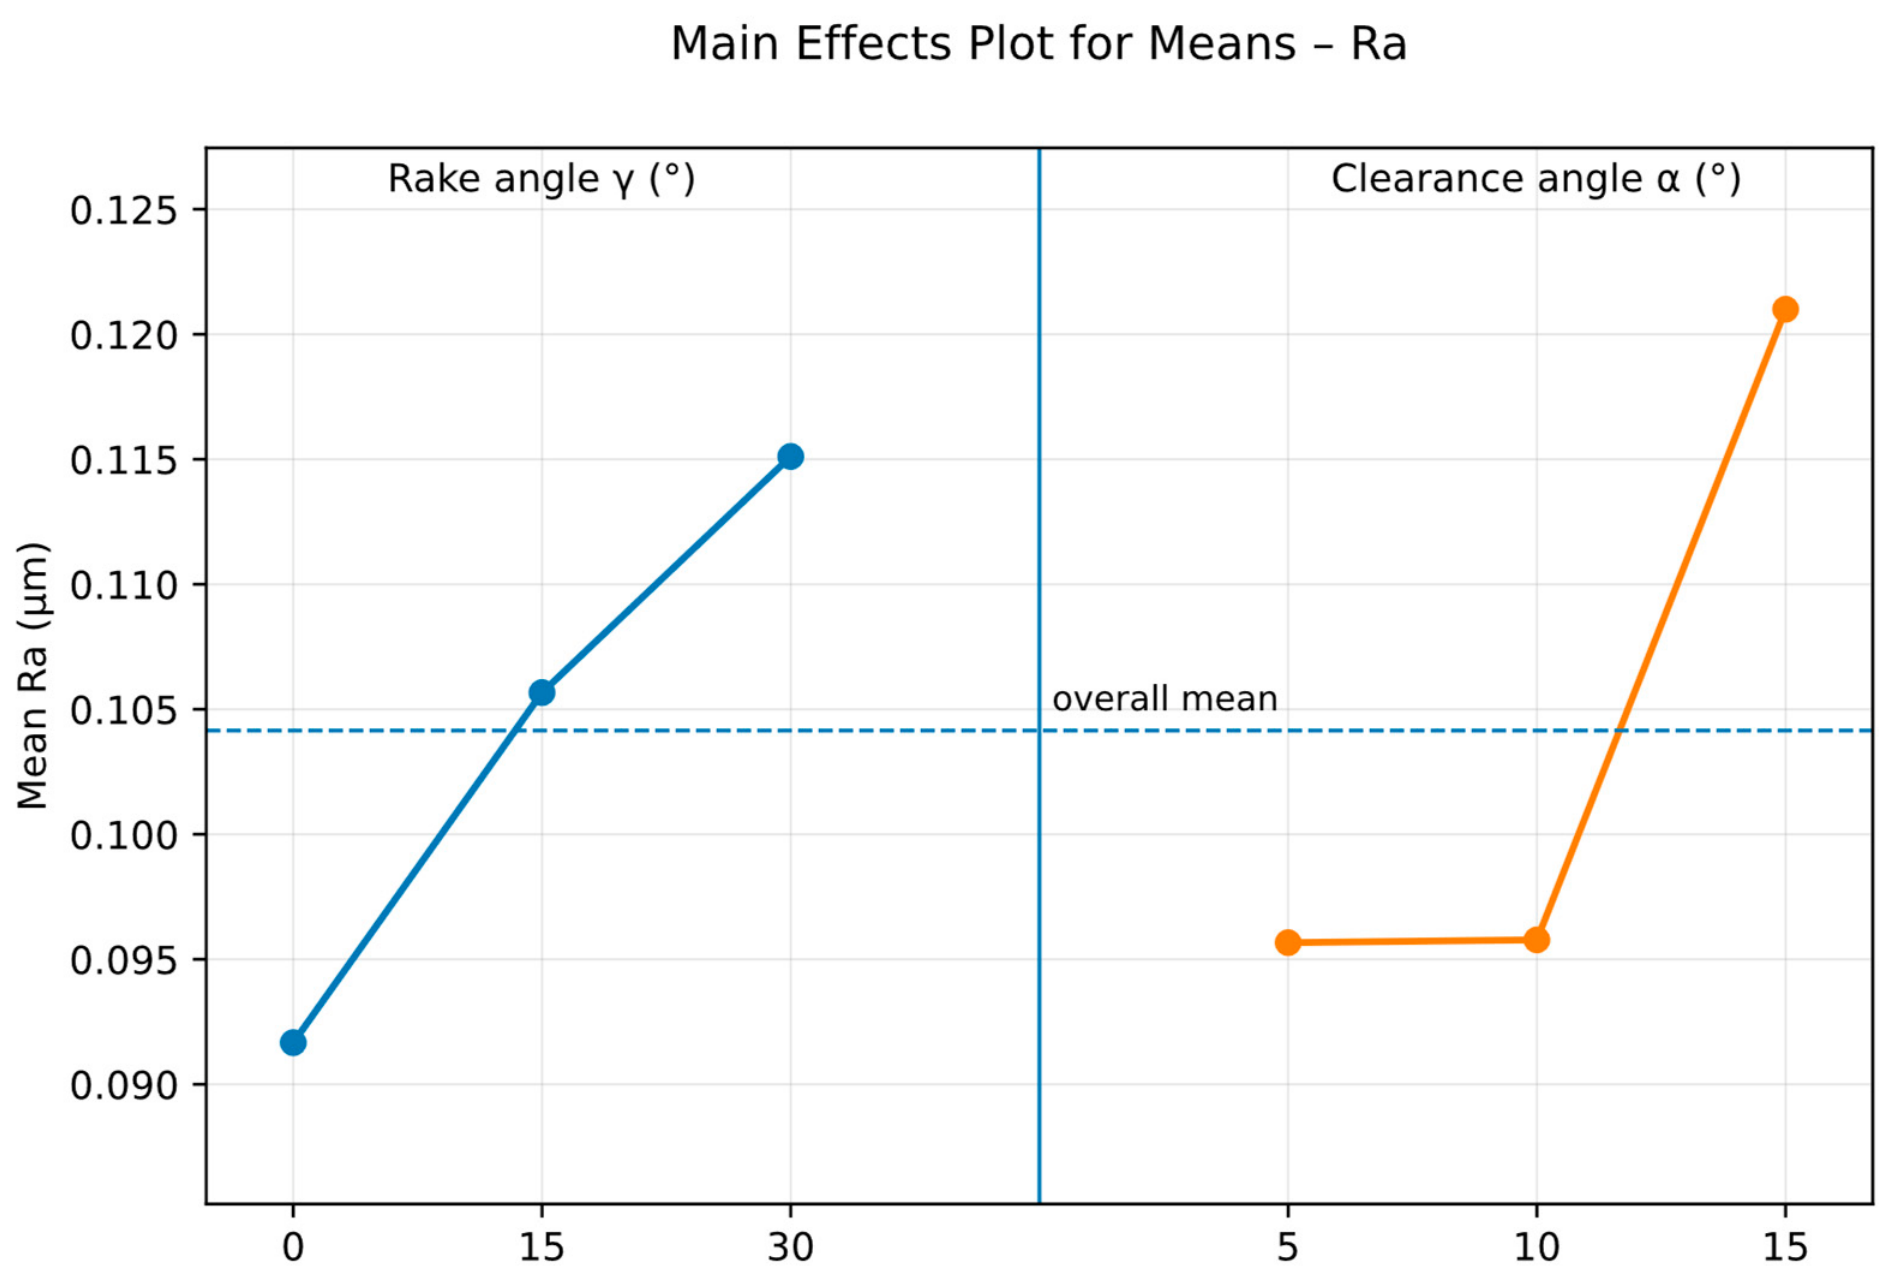
Based on the averaged Ra and Rz values presented in Table 12, Taguchi main effects plots were prepared, the aim of which was to visually present the effect of the tool geometry parameters on surface roughness. By means of the main effects plots, the effect of the variation in the rake angle and the clearance angle on the average Ra and Rz values can be examined separately. The Taguchi main effects plots are shown in Figure 11 and Figure 12.
Based on the analysis of the Ra and Rz values, it can be concluded that the clearance angle had a significant influence on the resulting surface roughness. At a clearance angle of 15°, both roughness parameters increased considerably. This can presumably be explained by the fact that a larger clearance angle reduces the support and mechanical stiffness of the cutting edge, which may increase the instability of the cutting process. The increased tendency for vibration and the microscopic displacement of the cutting edge may have resulted in a less favorable surface topography.
With increasing rake angle, the Ra values also exhibited an increasing trend, although its effect was less pronounced than that of the clearance angle. One possible explanation is that, while a more positive rake angle reduces the cutting forces, it also decreases the wedge angle of the cutting tool, thereby reducing the stiffness of the cutting edge. This may adversely affect the accuracy of surface generation, particularly at low uncut chip thicknesses.
In the case of the Rz parameter, the dominant effect of the clearance angle suggests that the local peaks and valleys formed on the machined surface are primarily related to the stability conditions resulting from the tool geometry. The less favorable cutting conditions associated with a larger clearance angle led to an increase in surface irregularities and, consequently, higher Rz values.
The Taguchi main effects plots are suitable for the visual presentation of the main tendencies; however, they do not provide information by themselves as to whether the effect of each factor can be considered statistically significant. In addition, the main effects plots are also limited in their ability to evaluate the interaction between the rake angle and the clearance angle. Therefore, the evaluation of the surface roughness results was also supplemented with two-way analysis of variance.
For each tool geometry, three independent cutting trials were performed. After each cutting trial, surface roughness was measured at three different positions along the machined surface, namely at the beginning, in the middle, and at the end of the workpiece. The average of these three profile measurements was used as one independent observation. Consequently, the two-way ANOVA was based on three independent Raavg. and Rzavg. values for each combination of rake angle and clearance angle.
The application of two-way ANOVA was justified by the fact that the experimental design had a full factorial arrangement, since the rake angle and the clearance angle were investigated at three levels each. During the analysis, the effects of the rake angle, the clearance angle, and their interaction were examined separately for the Ra and Rz roughness parameters. During the statistical evaluation, the significance level was set at α = 0.05; therefore, the effects of factors with p < 0.05 were considered statistically significant. The data corresponding to the two-way analysis of variance for the Ra and Rz results are presented in Table 13 and Table 14.
Based on the results of the two-way ANOVA performed on the Ra values, it can be concluded that the effects of both the rake angle and the clearance angle are statistically significant. In addition, the interaction between the rake angle and the clearance angle also proved to be significant. This means that the Ra surface roughness is influenced not only by the independent effects of the individual angles, but also by the combination in which the rake angle and the clearance angle occur.
In the case of the Rz values, the effects of the rake angle, the clearance angle, and their interaction were all found to be statistically significant based on the two-way ANOVA results. Among the investigated factors, the clearance angle exhibited the strongest effect. Therefore, although the variation in the Rz values was primarily governed by the clearance angle, it was also significantly influenced by the rake angle and by the specific combination of the two geometrical parameters.
Overall, based on the Taguchi main effects plots and the two-way ANOVA results, it can be concluded that tool geometry had a statistically significant effect on the roughness of the machined surface. The rake angle, the clearance angle, and their interaction significantly influenced both the Ra and Rz parameters. Among the investigated geometrical factors, the clearance angle exhibited the strongest effect on both roughness parameters. The most unfavorable surface roughness values were generally obtained at a clearance angle of 15°; therefore, within the investigated range, smaller clearance angles resulted in more favorable surface quality.

3.3. Investigation of Chip Morphology as a Function of Tool Geometry

The chips generated during the machining operations were analyzed using the previously mentioned confocal microscope. The chip samples presented in Figure 13 were collected during the first independent cutting trial performed with each tool geometry. The microscopic images are arranged according to the variation in the rake angle and clearance angle.
In addition to the chip morphology analysis, the rake and flank faces of the cutting tools were also examined after the cutting tests, with particular attention to the cutting-edge region. No visible tool wear, local cutting-edge damage, adhered workpiece material, or built-up edge formation was observed on the tool tips for the investigated tool geometries. This indicates that, under the applied experimental conditions, the measured force components and surface roughness values were not significantly affected by unstable material adhesion on the cutting edge.
This observation is also supported by the relatively low scatter of the measured Ra and Rz values. If pronounced built-up edge formation had occurred, a higher variation in surface roughness would have been expected due to the repeated formation and detachment of adhered material from the cutting edge. Therefore, the observed tendencies in cutting force, surface roughness, and chip morphology were interpreted primarily as the result of the investigated tool-geometry variations.
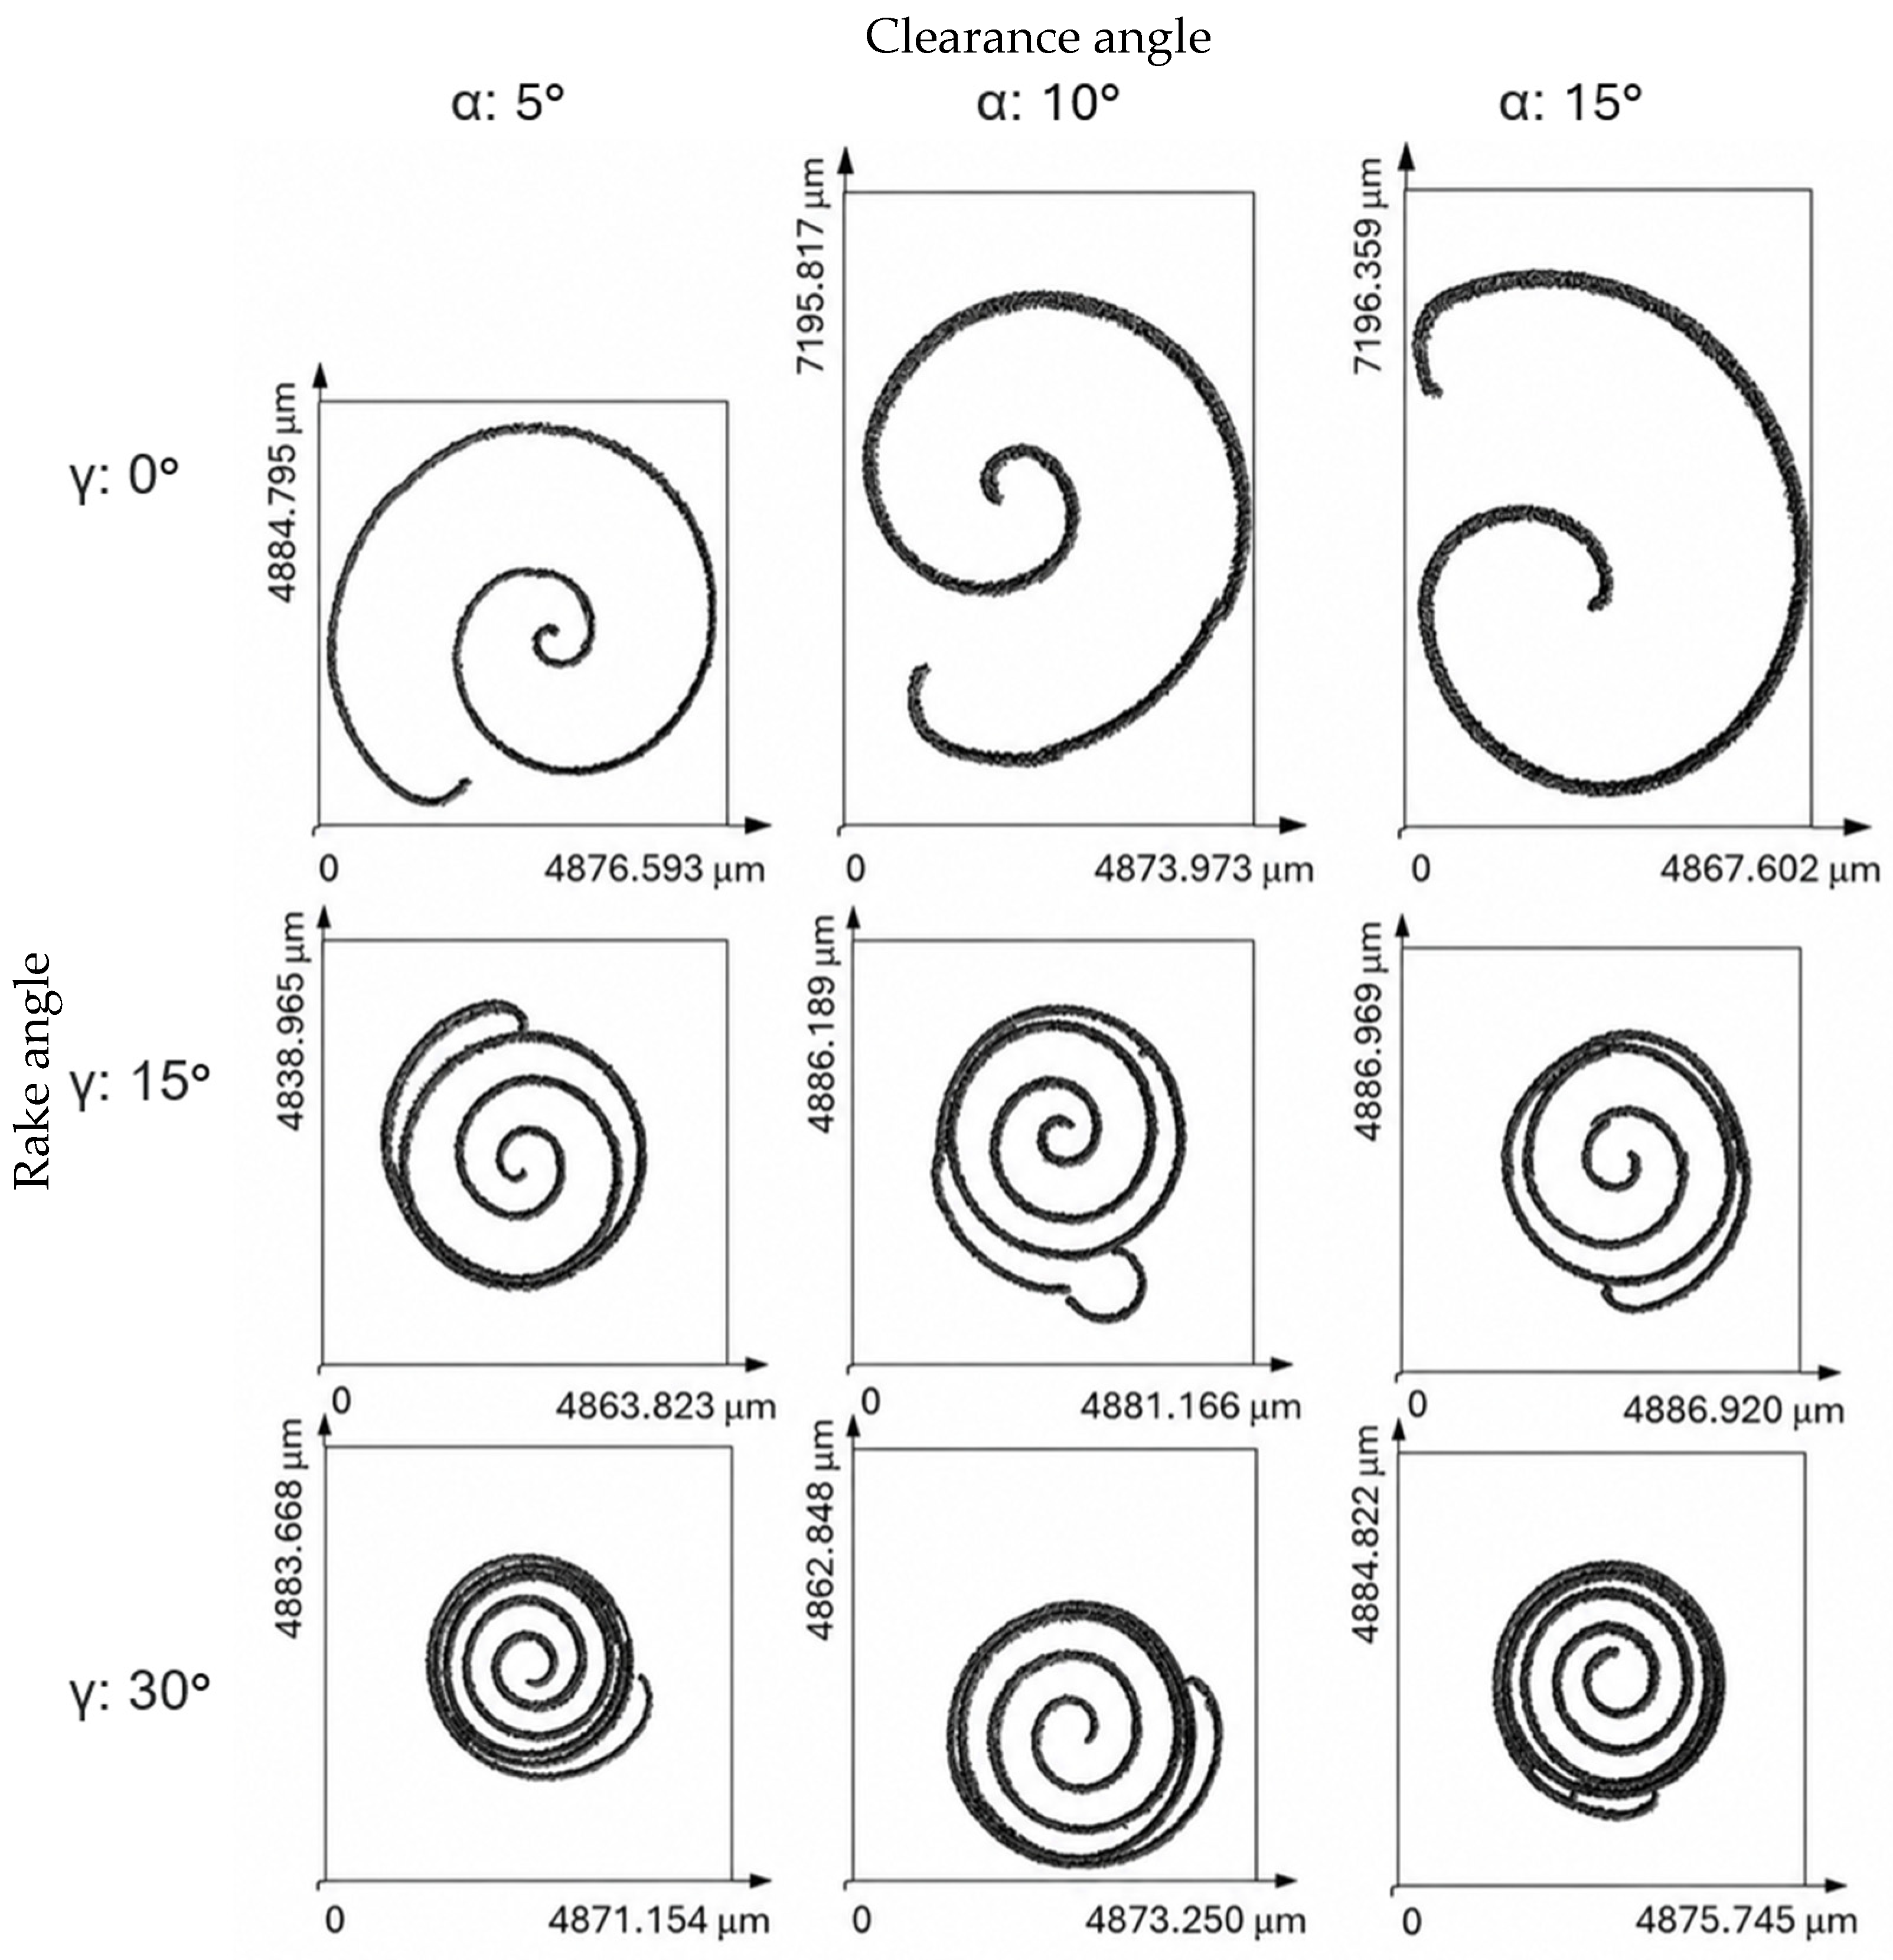
The observed chip morphologies can be explained by the influence of tool geometry on chip flow and on the plastic deformation processes occurring within the cutting zone. Among the investigated geometric parameters, the rake angle exerted the most significant effect on chip formation. Increasing the rake angle promoted smoother chip flow along the rake face and reduced the resistance encountered by the chip during its movement. As a result, the chip experienced less compression and was formed under more favorable deformation conditions.
At lower rake angles, the chip was subjected to greater compression and stronger frictional interaction with the rake face. This intensified the plastic deformation occurring in both the primary and secondary deformation zones, leading to the formation of thicker and more tightly curled chips. The higher cutting forces measured at lower rake angles are consistent with this behavior. These observations are in agreement with findings reported in the literature [28,29].
The influence of the clearance angle on chip formation was less pronounced. Since the clearance angle primarily affects the contact conditions between the flank face and the machined surface, its direct role in chip flow is limited. Nevertheless, variations in the clearance angle may indirectly influence chip formation through their effect on tool rigidity and the stability of the cutting process. Larger clearance angles can reduce the mechanical support of the cutting edge, potentially resulting in less favorable stability conditions, which may affect chip shape and regularity.
Overall, the results indicate that chip formation was governed predominantly by the rake angle. Larger rake angles provided more favorable chip-flow conditions and reduced cutting forces, whereas smaller rake angles increased chip compression and the extent of plastic deformation. These observations are consistent with the force measurement results and support the conclusion that a more positive rake angle improves the machining performance of the investigated aluminum alloy.

4. Conclusions

In the present study, the effects of rake angle and clearance angle of custom-manufactured HSS-E Co5 cutting tools on the Fc main cutting force, the Fp passive force, the Ra and Rz surface roughness parameters, and chip morphology were investigated during orthogonal free cutting of EN AW-7075-T6 aluminum alloy. A full-factorial experimental design was applied, in which the rake angle was varied between 0° and 30°, while the clearance angle ranged from 5° to 15°. To ensure the most accurate evaluation of the effects of tool geometry, a high-precision and high-rigidity measurement system was developed, enabling the desired geometrical parameters and cutting conditions to be established with a high degree of accuracy.
The results confirmed that tool geometry has a significant influence on the cutting process. Increasing the rake angle resulted in a substantial reduction in both the cutting force (Fc) and the passive force (Fp). This effect was particularly pronounced in the case of the passive force, indicating that a more positive rake angle provides more favorable chip-flow conditions and reduces the mechanical load acting on the cutting tool. In contrast, increasing the clearance angle led to an increase in the measured force components. This tendency may be related to the reduction in the wedge angle and the resulting decrease in the mechanical support of the cutting edge; however, this mechanism was not directly verified in the present study. Therefore, it should be interpreted as a possible explanation requiring further validation. Other factors, such as changes in flank-face contact conditions, frictional behavior, effective cutting geometry, and process stability, may have also contributed to the observed force increase. Two-way ANOVA confirmed that the rake angle, the clearance angle, and their interaction had statistically significant effects on both Fc and Fp. The clearance angle exhibited the strongest effect on Fc, whereas the rake angle had the strongest influence on Fp.
The surface roughness analysis revealed that the clearance angle was the dominant factor influencing surface quality. At a clearance angle of 15°, both the Ra and Rz values increased considerably, indicating less favorable surface generation conditions. Two-way ANOVA confirmed that the rake angle, the clearance angle, and their interaction had statistically significant effects on both the Ra and Rz parameters. Among the investigated factors, the clearance angle exhibited the strongest influence on both roughness parameters. The interaction between the two geometrical parameters proved to be statistically significant only in the case of Ra.
The investigation of chip morphology demonstrated that the rake angle exerted the most significant influence on chip formation. Larger rake angles promoted smoother chip flow and reduced chip compression, whereas smaller rake angles resulted in thicker and more tightly curled chips due to increased plastic deformation and friction. The observed chip characteristics were in good agreement with the measured cutting-force results.
Overall, the findings indicate that the application of larger rake angles improves machining performance by reducing cutting forces and enhancing chip-flow conditions. However, excessive reduction in the wedge angle, resulting either from increasing the rake angle or the clearance angle, may adversely affect cutting-edge stiffness and the resulting surface quality. Within the investigated parameter range, the most favorable overall machining performance was achieved by combining larger rake angles with smaller clearance angles, providing an appropriate compromise between reduced cutting forces, stable cutting conditions, and improved surface quality. No built-up edge formation was observed on the rake or flank faces of the tools after the cutting tests. Therefore, the reported trends in cutting force, surface roughness, and chip morphology were considered to be primarily governed by tool geometry rather than by unstable material adhesion at the cutting edge.
As a continuation of the present research, the developed experimental setup will be employed to investigate the influence of various cooling–lubrication strategies in combination with different tool-coating systems. Such investigations may provide a deeper understanding of the interactions between tool geometry, coating characteristics, and cooling–lubrication conditions, thereby contributing to the optimization of machining performance and surface integrity.

Author Contributions

Conceptualization, N.S. and G.K.; methodology, N.S.; software, N.S.; validation, N.S.; formal analysis, N.S. and G.K.; investigation, N.S.; resources, N.S., and G.K.; data curation, N.S.; writing—original draft preparation, N.S. and G.K.; writing—review and editing, G.K.; visualization, N.S.; supervision, G.K.; All authors have read and agreed to the published version of the manuscript.

Funding

This research received no external funding.

Data Availability Statement

All data generated or analyzed during this study are included in this published article.

Conflicts of Interest

The authors declare no conflicts of interest.

References

  1. Musavi, S.H.; Sepehrikia, M.; Davoodi, B.; Niknam, S.A. Performance analysis of developed micro-textured cutting tool in machining aluminum alloy 7075-T6: Assessment of tool wear and surface roughness. Int. J. Adv. Manuf. Technol. 2022, 119, 3343–3362. [Google Scholar] [CrossRef] [Scilit]
  2. Jiang, S.; Qin, Z.; Chen, M.; Xu, J.; Sun, Y.; Deng, P. Explicit geometry framework based dynamic modeling of wave-edge milling and stability investigation on waveform parameters. J. Manuf. Process. 2025, 155, 1026–1048. [Google Scholar] [CrossRef] [Scilit]
  3. Kónya, G.; Kovács, Z.F. Effects of machining parameters, coolant oil composition, and coatings on the output characteristics of turning of X5CrNi18-10 stainless steel. Wear 2025, 570, 205893. [Google Scholar] [CrossRef] [Scilit]
  4. Kónya, G.; Takács, J.; Miskolczi, I.; Kovács, Z.F. Investigation of the effects of machining parameters on cutting conditions during orthogonal turning of austenite stainless steel. Prod. Eng. Arch. 2024, 30, 86–93. [Google Scholar] [CrossRef] [Scilit]
  5. Kónya, G.; Kovács, Z.F. Experimental investigation of the effects of cooling-lubricating methods on the slot milling process of GTD-111 type nickel-based superalloy. J. Manuf. Process. 2024, 119, 98–108. [Google Scholar] [CrossRef] [Scilit]
  6. Jiang, Y.; Yang, Q.; Guo, Q.; Zhao, B.; Li, T.; Niu, Y. Enhancing gear surface integrity: A study of longitudinal-torsional ultrasonic strengthening effect on surface roughness. J. Manuf. Process. 2026, 161, 277–291. [Google Scholar] [CrossRef] [Scilit]
  7. Duan, Z.; Li, C.; Ding, W.; Zhang, Y.; Yang, M.; Gao, T.; Cao, H.; Xu, X.; Wang, D.; Mao, C.; et al. Milling Force Model for Aviation Aluminum Alloy: Academic Insight and Perspective Analysis. Chin. J. Mech. Eng. 2021, 34, 18. [Google Scholar] [CrossRef] [Scilit]
  8. Gupta, M.K.; Niesłony, P.; Sarikaya, M.; Korkmaz, M.E.; Kuntoğlu, M.; Królczyk, G.M. Studies on Geometrical Features of Tool Wear and Other Important Machining Characteristics in Sustainable Turning of Aluminium Alloys. Int. J. Precis. Eng. Manuf.-Green Technol. 2023, 10, 943–957. [Google Scholar] [CrossRef] [Scilit]
  9. Junge, T.; Mehner, T.; Nestler, A.; Schubert, A.; Lampke, T. Surface properties in turning of aluminum alloys applying different cooling strategies. Procedia CIRP 2022, 108, 246–251. [Google Scholar] [CrossRef] [Scilit]
  10. Santos, M.C.; Machado, A.R.; Sales, W.F.; Barrozo, M.A.S.; Ezugwu, E.O. Machining of aluminum alloys: A review. Int. J. Adv. Manuf. Technol. 2016, 86, 3067–3080. [Google Scholar] [CrossRef] [Scilit]
  11. Kónya, G.; Csorba, B.; Szabó, N.; Kovács, Z.F. The Effects of Cutting Parameters on Cutting Force and Tribological Properties of Machined Surface Under Dry Turning of AISI304L Austenitic Stainless Steel. J. Manuf. Mater. Process. 2024, 8, 257. [Google Scholar] [CrossRef] [Scilit]
  12. Kónya, G.; Kovács, Z.F. Effects of Oil Concentration in Flood Cooling on Cutting Force, Tool Wear and Surface Roughness in GTD-111 Nickel-Based Superalloy Slot Milling. J. Manuf. Mater. Process. 2024, 8, 119. [Google Scholar] [CrossRef] [Scilit]
  13. Javidikia, M.; Sadeghifar, M.; Songmene, V.; Jahazi, M. On the impacts of tool geometry and cutting conditions in straight turning of aluminum alloys 6061-T6: An experimentally validated numerical study. Int. J. Adv. Manuf. Technol. 2020, 106, 4547–4565. [Google Scholar] [CrossRef] [Scilit]
  14. Daoud, M.; Chatelain, J.F.; Bouzid, A. Effect of rake angle on Johnson-Cook material constants and their impact on cutting process parameters of Al2024-T3 alloy machining simulation. Int. J. Adv. Manuf. Technol. 2015, 81, 1987–1997. [Google Scholar] [CrossRef] [Scilit]
  15. Khettabi, R.; Songmene, V.; Masounave, J. Effects of Speeds, Materials, and Tool Rake Angles on Metallic Particle Emission During Orthogonal Cutting. J. Mater. Eng. Perform. 2010, 19, 767–775. [Google Scholar] [CrossRef] [Scilit]
  16. Reddy, P.J.; Vinodh, D. Material removal rate comparison of aluminium alloy 6063 machined using HSS tool and novel chromium nitride coated drill tool in CNC drilling. Mater. Today Proc. 2022, 69, 848–852. [Google Scholar] [CrossRef] [Scilit]
  17. Fernandes, G.H.N.; Lopes, G.H.F.; Barbosa, L.M.Q.; Martins, P.S.; Machado, Á.R. Wear Mechanisms of Dia-Mond-like Carbon Coated Tools in Tapping of AA6351 T6 Aluminium Alloy. Procedia Manuf. 2021, 53, 293–298. [Google Scholar] [CrossRef] [Scilit]
  18. Total Materia. High Speed Steels. Available online: https://www.totalmateria.com/en-us/articles/high-speed-steels (accessed on 9 June 2026).
  19. Novotny, P.M. Tool and Die Steels. Encycl. Mater. Sci. Technol. 2001, 9384–9389. [Google Scholar] [CrossRef] [Scilit]
  20. Chen, S.-H.; Pan, C.-H. Influence of Rake Angles of Multi-Position Tool on Cutting Characteristics. Appl. Syst. Innov. 2018, 1, 18. [Google Scholar] [CrossRef] [Scilit]
  21. Günay, M.; Korkut, İ.; Aslan, E.; Şeker, U. Experimental investigation of the effect of cutting tool rake angle on main cutting force. J. Mater. Process. Technol. 2005, 166, 44–49. [Google Scholar] [CrossRef] [Scilit]
  22. Seeholzer, L.; Kneubühler, F.; Grossenbacher, F.; Wegener, K. Tool wear and spring back analysis in orthogonal machining unidirectional CFRP with respect to tool geometry and fibre orientation. Int. J. Adv. Manuf. Technol. 2021, 115, 2905–2928. [Google Scholar] [CrossRef] [Scilit]
  23. Slota, J.; Kubit, A.; Trzepieciński, T.; Krasowski, B.; Varga, J. Ultimate Load-Carrying Ability of Rib-Stiffened 2024-T3 and 7075-T6 Aluminium Alloy Panels under Axial Compression. Materials 2021, 14, 1176. [Google Scholar] [CrossRef] [Scilit] [PubMed]
  24. Béland, J.-F.; D’Amours, G. Hot Forming of 7075 Aluminium Alloy Tubes to Produce Complex and Strong Components; SAE International: Warrendale, PA, USA, 2012. [Google Scholar]
  25. Pul, M. Comparison of Surface Roughness and Tool Wear in Turning of 7075, 6061 and 2024 Aluminum Alloys. Int. J. Eng. Res. Dev. 2017, 9, 65–75. [Google Scholar] [CrossRef] [Scilit]
  26. Khettabi, R.; Nouioua, M.; Djebara, A.; Songmene, V. Effect of MQL and dry processes on the particle emission and part quality during milling of aluminum alloys. Int. J. Adv. Manuf. Technol. 2017, 92, 2593–2598. [Google Scholar] [CrossRef] [Scilit]
  27. Yeganefar, A.; Niknam, S.A.; Songmene, V. Machinability study of aircraft series aluminium alloys 7075-T6 and 7050-T7451. Trans. Can. Soc. Mech. Eng. 2020, 44, 427–439. [Google Scholar] [CrossRef] [Scilit]
  28. Wakjira, M.W.; Ramulu, P.J. Analysis of turning chip morphology with various tool geometries using finite element modeling and simulation to optimize product sustainability. Adv. Mech. Eng. 2022, 14, 16878132221136421. [Google Scholar] [CrossRef] [Scilit]
  29. Lotfi, M.; Farid, A.A.; Soleimanimehr, H. The effect of chip breaker geometry on chip shape, bending moment, and cutting force: FE analysis and experimental study. Int. J. Adv. Manuf. Technol. 2015, 78, 917–925. [Google Scholar] [CrossRef] [Scilit]
Figure 1. Machining of the tool by (a) wire EDM and (b) grinding.
Jmmp 10 00292 g001
Figure 2. Flank face before and after grinding.
Jmmp 10 00292 g002
Figure 3. Schematic of the machining process (The meanings of the notations shown in the figure are as follows: L—machined length, B—width of cut, a—depth of cut, γ—rake angle, β—wedge angle, α—clearance angle, vc—cutting speed).
Jmmp 10 00292 g003
Figure 4. Fixture required for tool clamping (Structure of the tool holder: 1. Cutting tool, 2. Tool holder, 3. Moving side of the fixture, 4. Fixed side of the fixture, 5. Built-in micrometer, 6. Stop, 7. Shim wedge, 8. Connecting adapter).
Jmmp 10 00292 g004
Figure 5. Setup of the measurement environment.
Jmmp 10 00292 g005
Figure 6. Tool geometries measured using a confocal microscope.
Jmmp 10 00292 g006
Figure 7. Force–time diagram and evaluated cutting section for cutting trial No. 1 performed with the G00A05 tool.
Jmmp 10 00292 g007
Figure 8. Mean values and standard deviations of the cutting force, passive force and resultant cutting force for different tool geometries.
Jmmp 10 00292 g008
Figure 9. Main effects plot of Fc cutting force.
Jmmp 10 00292 g009
Figure 10. Main effects plot of Fp passive force.
Jmmp 10 00292 g010
Figure 11. Main effects plot of Ra surface roughness.
Jmmp 10 00292 g011
Figure 12. Main effects plot of Rz surface roughness.
Jmmp 10 00292 g012
Figure 13. Microscopic images of chip samples collected during the first independent cutting trial for each tool geometry.
Jmmp 10 00292 g013
Table 1. Chemical composition of HSS-E Co5 high-speed steel.
C
Carbon
Cr
Chromium
Mo
Molybdenum
W
Tungsten
V
Vanadium
Co
Cobalt
HSS-E Co50.834.194.688.361.814.88
Table 2. Physical properties of HSS-E Co5 high-speed steel [19].
Density
ρ, (kg/m3)
Thermal Conductivity
λ, (W/m·K)
Specific Heat at 20 °C
c, (J/kg·K)
HSS-E Co5815024420
Table 3. Mechanical properties of HSS-E Co5 high-speed steel [19].
Tensile Strength
Rm, (MPa)
Yield Strength
Re, (MPa)
Elongation
A5 (%)
Hardness
(HRC)
HSS-E Co51770–19801475–1665564
Table 4. Geometry of the investigated tools.
Tool DesignationDesigned Tool Geometry
Rake Angle,
γ (°)
Clearance Angle,
α (°)
Wedge Angle,
β (°)
G00A050585
G00A1001080
G00A1501575
G15A0515570
G15A10151065
G15A15151560
G30A0530555
G30A10301050
G30A15301545
Table 5. Angle values of the measured geometry.
Tool DesignationMeasured Tool Geometry
Rake Angle,
γ (°)
Clearance Angle,
α (°)
Wedge Angle,
β (°)
G00A0504.96985.031
G00A10010.86179.139
G00A15014.98875.012
G15A0514.2185.50770.275
G15A1015.00510.88364.112
G15A1515.08214.85960.059
G30A0529.0125.33455.654
G30A1029.5589.81750.625
G30A1529.56715.30145.132
Table 6. Chemical composition of EN AW-7075-T6.
Zn
Zinc
Mg
Magnesium
Cu
Copper
Cr
Chromium
Fe
Iron
Si
Silicon
Mn
Manganese
Ti
Titan
EN AW-7075-T65.472.071.710.1750.1390.0610.050.055
Table 7. Physical properties of EN AW-7075-T6.
Density
ρ, (kg/m3)
Thermal Conductivity
λ, (W/m·K)
Specific Heat at 20 °C
c, (J/kg·K)
EN AW-7075-T6281013096
Table 8. Mechanical properties of EN AW-7075-T6.
Tensile Strength
Rm, (MPa)
Yield Strength
Re, (MPa)
Elongation
A (%)
Hardness
(HB)
EN AW-7075-T657250311150
Table 9. Evaluated force measurement results.
Tool DesignationCutting Trial NumberForce Measurement Results
Cutting Force,sFc (N)Passive Force,sFp (N)Resultant Cutting Force,sF (N)
Fc (N)Fp (N)F (N)
G00A051.2380.347.71185.443.42659.548.2
2.2408.793.11197.869.32690.168.1
3.2395.1137.91211.691.12684.1120.5
G00A101.2768.350.31301.538.03059.152.7
2.2741.9110.41288.259.93029.4104.2
3.2756.497.31296.992.53046.3135.2
G00A151.3415.391.01704.396.73817.4117.6
2.3442.849.51718.528.53847.970.4
3.3387.693.91688.121.93784.9102.8
G15A051.2506.490.4743.331.02614.394.2
2.2481.2133.9734.571.82587.663.8
3.2496.871.5738.193.02603.676.4
G15A101.2860.664.0811.719.72973.661.9
2.2888.487.9820.341.23002.648.3
3.2875.9122.2829.858.62993.296.4
G15A151.2601.895.3703.913.32695.492.4
2.2624.7138.5711.236.72719.3128.2
3.2578.6121.9694.513.62670.582.4
G30A051.2273.0141.0181.639.62280.7137.8
2.2291.5137.3188.751.82299.3101.7
3.2283.274.9176.919.32290.0105.0
G30A101.2538.450.6266.516.62552.549.2
2.2519.670.5260.315.22533.0132.1
3.2528.185.6263.969.02541.8105.0
G30A151.2736.660.2311.428.12754.557.2
2.2761.4140.8316.839.12779.5102.5
3.2714.2109.5303.795.22731.151.1
Table 10. Two-way ANOVA results for Fc cutting force.
SourceSSdfMSF-Valuep-Value
Rake angle, γ521,826.0272260,913.013851.6691.50 × 10−18
Clearance angle, α1,277,394.5692638,697.2842084.8295.01 × 10−22
γ × α interaction871,138.1444217,784.536710.8901.53 × 10−19
Error5514.38718306.355
Table 11. Two-way ANOVA results for Fp passive force.
SourceSSdfMSF-Valuep-Value
Rake angle, γ5,950,364.35222,975,182.17637,781.1572.46 × 10−33
Clearance angle, α179,899.281289,949.6401142.2501.09 × 10−19
γ × α interaction298,506.504474,626.626947.6661.17 × 10−20
Error1417.4601878.748
Table 12. Surface roughness measurement results.
Tool DesignationCutting Trial NumberSurface Roughness Measurement Results
Ra1Ra2Ra3Raavg.sRaRz1Rz2Rz3Rzavg.sRz
(µm)(µm)(µm)(µm)(µm)(µm)(µm)(µm)(µm)(µm)
G00A051.0.0880.0650.0890.0810.0140.6660.5250.5480.580.076
2.0.0790.0710.1020.0840.0160.5890.5620.6580.6030.05
3.0.0720.0990.090.0870.0140.7270.5840.5520.6210.093
G00A101.0.0810.0770.0870.0820.0050.5160.830.8640.7370.192
2.0.0840.0720.0810.0790.0060.9310.7620.470.7210.233
3.0.070.0770.0810.0760.0060.7580.8510.50.7030.182
G00A151.0.0990.1030.1330.1120.0190.7260.960.990.8920.145
2.0.1020.1280.1180.1160.0131.0670.930.7570.9180.155
3.0.1240.1080.0920.1080.0160.7420.841.0130.8650.137
G15A051.0.130.0910.1080.110.020.7570.8870.660.7680.114
2.0.1120.0820.1240.1060.0220.8720.6030.7510.7420.135
3.0.0980.1330.0930.1080.0220.6710.6930.9010.7550.127
G15A101.0.0730.0980.0760.0820.0140.5440.7850.5690.6330.133
2.0.0940.0690.0950.0860.0150.7540.6420.5570.6510.099
3.0.0720.1010.0790.0840.0150.5250.7090.770.6680.128
G15A151.0.1370.1380.10.1250.0221.230.870.7330.9440.257
2.0.140.1330.090.1210.0271.2410.8090.6710.9070.297
3.0.1490.1310.1070.1290.0210.6691.0111.2360.9720.286
G30A051.0.0960.0910.090.0920.0030.6850.690.6420.6720.026
2.0.0950.0970.0930.0950.0020.7240.6780.6830.6950.025
3.0.1020.0950.0970.0980.0040.6940.7290.7160.7130.018
G30A101.0.120.120.1440.1280.0140.7680.7660.8850.8060.068
2.0.1160.1440.1120.1240.0170.7870.7330.8230.7810.045
3.0.1160.1090.1380.1210.0150.6990.8450.8350.7930.082
G30A151.0.1210.1430.1130.1260.0160.8551.010.7750.880.119
2.0.1420.1130.1350.130.0150.9230.8210.9740.9060.078
3.0.1060.1250.1350.1220.0150.7170.8790.9750.8570.13
Table 13. Two-way ANOVA results for Ra surface roughness.
SourceSSdfMSF-Valuep-Value
Rake angle, γ0.00250520.001252118.2204.44 × 10−11
Clearance angle, α0.00383420.001917180.9691.20 × 10−12
γ × α interaction0.00243440.00060957.4555.26 × 10−10
Error0.000191180.000011
Table 14. Two-way ANOVA results for Rz surface roughness.
SourceSSdfMSF-Valuep-Value
Rake angle, γ0.01401320.00700615.2601.33 × 10−4
Clearance angle, α0.25193720.125969274.3753.29 × 10−14
γ × α interaction0.05855140.01463831.8836.02 × 10−8
Error0.008264180.000459
Disclaimer/Publisher’s Note: The statements, opinions and data contained in all publications are solely those of the individual author(s) and contributor(s) and not of MDPI and/or the editor(s). MDPI and/or the editor(s) disclaim responsibility for any injury to people or property resulting from any ideas, methods, instructions or products referred to in the content.