1. Introduction
Aluminum and aluminum alloys have been broadly used in many different applications, such as the aviation and automotive industries, as well as alternatives to steel because of their mechanical properties, low weight, and good corrosion resistance [
1,
2,
3]. The mechanical properties of AA7075 and AA6061 alloys are intrinsically linked to their microstructures, which are shaped during the formation process and play a critical role in defining the strength and plasticity of their primary phases [
4,
5]. These alloys derive their distinct mechanical characteristics from the inclusion of various alloying elements, such as Zn, Mg, and Cu in AA7075, and Si and Mg in AA6061. Additionally, the behavior of these alloys is strongly influenced by the arrangement of eutectic silicon and Fe-containing intermetallic phases formed during eutectic and secondary crystallization, since these phases can affect strength, ductility, and crack susceptibility [
6]. Intermetallic phases, which are commonly found in aluminum alloys, also significantly impact the material properties of these alloys [
7]. Notable secondary phases in AA7075 include the η-phase (MgZn
2), Al
2CuMg, and Al
2Mg
3Zn
3, while in AA6061, they include Mg
2Si, Al
8Fe
2Si, and the β-phase [
8,
9]. The geometry, size, density, and distribution of these phases directly influence mechanical performance and susceptibility to solidification cracking [
10]. Both AA7075 and AA6061 exhibit a notable tendency toward solidification cracking due to their low-melting-point alloying elements, high thermal expansion coefficients, and solidification shrinkage [
11,
12]. Research has demonstrated that this cracking often results from the segregation of alloying elements at grain boundaries and the presence of low-melting-point phases, with similar concerns observed in GMAW processes [
13,
14]. AA6061 and AA7075 were selected because they represent two industrially important heat-treatable aluminum alloy systems with different alloying chemistry, weldability, and cracking susceptibility, allowing the effect of filler-metal selection and welding parameters to be compared under the same GMAW/CPT conditions.
Gas Metal Arc Welding (GMAW) is one of the most commonly employed fusion welding processes due to its high productivity, versatility across materials and thicknesses, ease of automation, and ability to produce clean, high-quality welds with minimal skill requirements [
15,
16,
17]. These attributes make it a preferred choice in industrial applications compared to other welding methods [
18,
19]. However, achieving consistent weld quality can be challenging, primarily due to issues such as hot cracking and the degradation of mechanical properties in the fusion zone (FZ), especially with aluminum alloys [
20,
21,
22]. Solidification cracking susceptibility is strongly influenced by the welding parameters used during the process. Key parameters, such as welding speed, wire feed speed, and heat input, play a crucial role in GMAW by directly affecting the thermal and mechanical conditions during solidification. Selecting the appropriate welding parameters is therefore essential to minimize solidification cracking and ensure weld integrity in aluminum alloys. A substantial body of research has demonstrated the significant impact of these parameters on weld performance, underscoring their critical role in achieving high-quality welds. Samiuddin et al. [
23] studied the effect of TIG welding process parameters, particularly heat input, on the mechanical and microstructural properties of the AA5083 alloy. They found that a medium heat input (1–2 kJ/mm) optimized mechanical properties by minimizing defects such as porosity and grain coarsening. Their findings highlight the critical role of welding parameters in improving weld quality and integrity, especially in structural and cryogenic applications. Similarly, Santosh et al. [
24] investigated the optimization of GMAW parameters for aluminum alloy AA7075-T6 to enhance weld quality. Their research explored the influence of parameters such as current, wire feed speed, gas flow rate, and welding speed on bead geometry and mechanical properties. The results underscore the importance of parameter optimization in achieving high-quality welds, with transient thermal analysis providing valuable insights into temperature and residual stress distribution. Additionally, Liu et al. [
25] analyzed the quenched-in microstructure and microsegregation within the mushy zone to clarify why Al-Mg alloys exhibit lower susceptibility to solidification cracking compared to Al-Cu alloys, despite their considerably wider freezing temperature range. Their findings emphasized that the back diffusion of magnesium during solidification helps mitigate crack formation. Recently, Li et al. [
26] investigated solidification cracking in AA7075 arc welds produced using MIG and CMT-based welding modes. Their study showed that cracking susceptibility was strongly affected by arc mode, cooling rate, microsegregation, and the bridging behavior of α-Al dendrites during the final stage of solidification. They also used EPMA and phase-fraction-based solidification analysis to relate reduced microsegregation and improved dendrite bridging to lower cracking susceptibility. These results highlight the importance of linking welding thermal conditions, alloying-element redistribution, and cracking-susceptibility criteria when analyzing 7xxx aluminum alloy welds.
The filler metals ER5356 and ER4043 were chosen for welding the aluminum alloys in this study based on several critical considerations. ER5356, which is magnesium-rich, was selected for its ability to improve weld strength and enhance corrosion resistance [
27]. In contrast, ER4043, a silicon-rich alloy, was chosen for its effectiveness in minimizing the susceptibility to hot cracking [
28]. These filler metals represent two distinct alloy systems, Al-Mg and Al-Si, providing a comprehensive basis for evaluating their influence on the microstructure and mechanical properties of the resulting welds. Several researchers have investigated how various welding filler wires affect the microstructure and properties of welded aluminum alloys. Ishak et al. [
29] investigated the effect of filler metals ER5356, ER4043, and ER4047 on the weld metal structure and mechanical properties of AA6061 aluminum alloy joined using the TIG welding process. The study analyzed the mechanical properties of weld joints, including the influence of preheating temperatures. Welds using ER5356 exhibited the finest grain structure, highest hardness, and maximum tensile strength compared to those using other fillers. The findings highlight the critical role of filler metal selection and preheating temperature in achieving superior weld quality and mechanical performance. Similarly, Deng et al. [
30] examined the effect of magnesium content in filler materials on porosity formation during laser welding of aluminum alloys using filler wire. Their study focused on keyhole and plume dynamics while evaluating the influence of Mg-rich filler wires. It was observed that higher magnesium content in filler wires increased keyhole instability, plume ejection rates, and recoil pressure, leading to greater porosity formation in the weld. These findings emphasize the critical role of filler composition in controlling keyhole stability and achieving high-quality welds.
Solidification cracking remains a major challenge in the fusion welding of AA6061-T6 and AA7075-T6 aluminum alloys using GMAW. Although the effects of ER4043 and ER5356 filler metals have been studied previously, direct comparison of these fillers for both AA6061 and AA7075 under the same robotic GMAW and CPT restraint conditions remains limited. Compared with recent approaches that focus mainly on cracking mechanisms, microsegregation, or solidification modeling in specific aluminum alloys, the present work contributes an integrated CPT-based comparison of AA6061 and AA7075 welded by GMAW with ER4043 and ER5356 fillers. The novelty of this work lies in linking the cumulative crack length (CCL) response with calculated heat input, filler chemistry, X-ray crack detection, microstructural characterization, SEM/EDS and XRD analysis, microhardness, micro-tensile behavior, DIC strain localization, and SEM fractography. This integrated approach allows the influence of welding parameters and filler chemistry to be related to solidification cracking susceptibility, local microstructural changes, and mechanical performance.
The materials and welding procedure are described in
Section 2, followed by specimen preparation and testing methods in
Section 3. The results and discussion are presented in
Section 4, and the conclusions are provided in
Section 5.
2. Materials and Welding Procedure
Sheets of AA7075-T6 aluminum alloy (Al-Zn-Mg-Cu) and AA6061-T6 aluminum alloy (Al-Si-Mg) with dimensions of 76 mm × 76 mm and a thickness of 2 mm were used in the Circular Patch Test (CPT) welding configurations to investigate the hot cracking sensitivity of both alloys. Filler wires ER4043 (Al-Si) and ER5356 (Al-Mg) with a diameter of 1.2 mm were used. The chemical compositions of the base alloys and filler metals were determined within our institution and are reported in
Table 1 in wt.%.
ER4043 and ER5356 were selected to compare two common filler-metal systems with different metallurgical effects. ER4043 is Si-rich and is commonly used to reduce hot-cracking susceptibility by modifying the weld-metal solidification behavior. ER5356 is Mg-rich and is often used to improve weld strength and compatibility with Mg-containing aluminum alloys. Therefore, these fillers provide a suitable basis for evaluating the influence of Al-Si and Al-Mg filler chemistry on solidification cracking and mechanical performance.
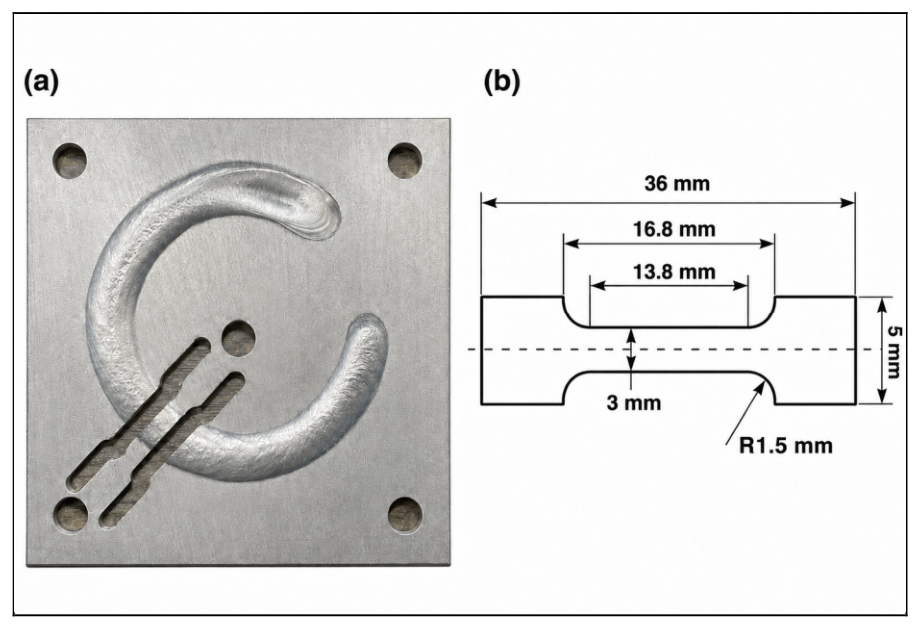
The CPT was conducted with self-restraint implemented through a specially designed specimen and fixturing constraints to achieve the highest level of solidification cracking reproducibility during welding. Square welding specimens measuring 76 mm × 76 mm were used, each bolted through five holes-one at each corner and one in the center. A circular patch weld with a radius of 19.5 mm from the center was then applied to each specimen.
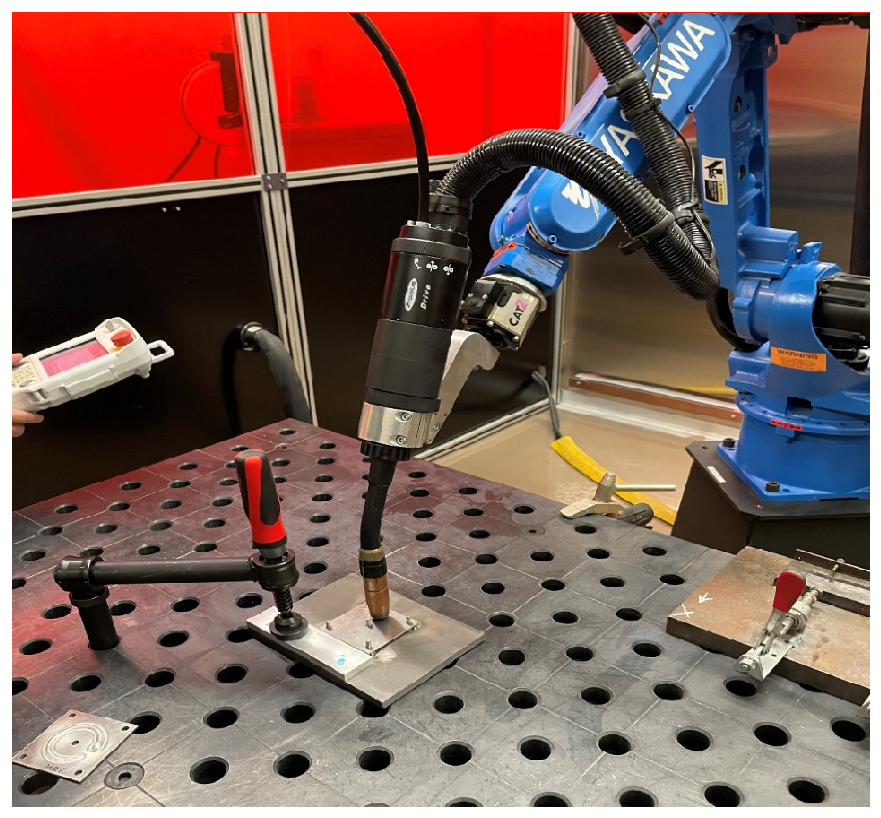
A DX-100 Yaskawa robot (Yaskawa America Inc., Waukegan, IL, USA), integrated with a Fronius TransPlus Synergic 4000 (Fronius International GmbH, Wels, Austria) welding power supply, was used for this investigation, as shown in
Figure 1. During welding, the torch angle was maintained at approximately 40°, and the contact-tip-to-work distance (CTWD) was kept at about 8 mm. These setup parameters, together with the shielding gas flow rate and filler wire diameter, were kept constant for all welding trials to improve process repeatability. Argon gas was supplied at a flow rate of 12 L/min to protect the weld pool. Before welding, the samples were cleaned with a wire brush and acetone to remove oxides and impurities. The cleaned and degreased specimens were used immediately after preparation for welding. The flexibility of robotic welding allows for more consistent weld quality with fewer defects. Bead-on-plate welds were then produced using the GMAW process, with a fixed current and voltage. In order to select suitable welding conditions for AA7075 and AA6061 aluminum alloys, a series of preliminary experiments was conducted using different welding speeds and wire feed speeds. These trials were performed to identify conditions that produced stable bead formation, acceptable weld penetration, and consistent weld quality for each alloy-filler combination. Based on these preliminary trials, the final selected welding parameters used for the CPT experiments are reported in
Table 2a,b. Because welding speed and wire feed speed were not investigated using a full factorial design, the experimental matrix was separated into two parts.
Table 2a presents the welding-speed study conducted at a fixed wire feed speed, including the welding speed, fixed wire feed speed, voltage, current, nominal heat input, and shielding gas flow rate for each alloy-filler combination.
Table 2b presents the wire-feed-speed study conducted at fixed welding speed, including the fixed welding speed, wire feed speed, voltage, current, and shielding gas flow rate for each alloy-filler combination. Only these selected parameter sets were considered in the results and discussion section.
In the welding-speed study, the effect of welding speed was evaluated at fixed wire feed speeds of 6.5 m/min for AA7075 and 7.5 m/min for AA6061. The welding speeds tested were 1, 1.5, 3, and 4 m/min. After identifying the welding speed that produced the lowest CCL for each alloy, the effect of wire feed speed was evaluated at that selected welding speed. In the wire-feed-speed study, wire feed speeds of 5.8, 6.5, 7.2, and 8 m/min were tested for AA7075 at a fixed welding speed of 3 m/min. For AA6061, wire feed speeds of 5.8, 6.5, 7.5, and 8 m/min were tested at a fixed welding speed of 1.5 m/min.
The nominal heat input was calculated using the following equation:
where (Q) is the nominal heat input in J/mm, (V) is the welding voltage, (I) is the welding current, and (S) is the welding speed in m/min. Since no arc efficiency factor was included, the reported values represent nominal heat input rather than actual net heat input.
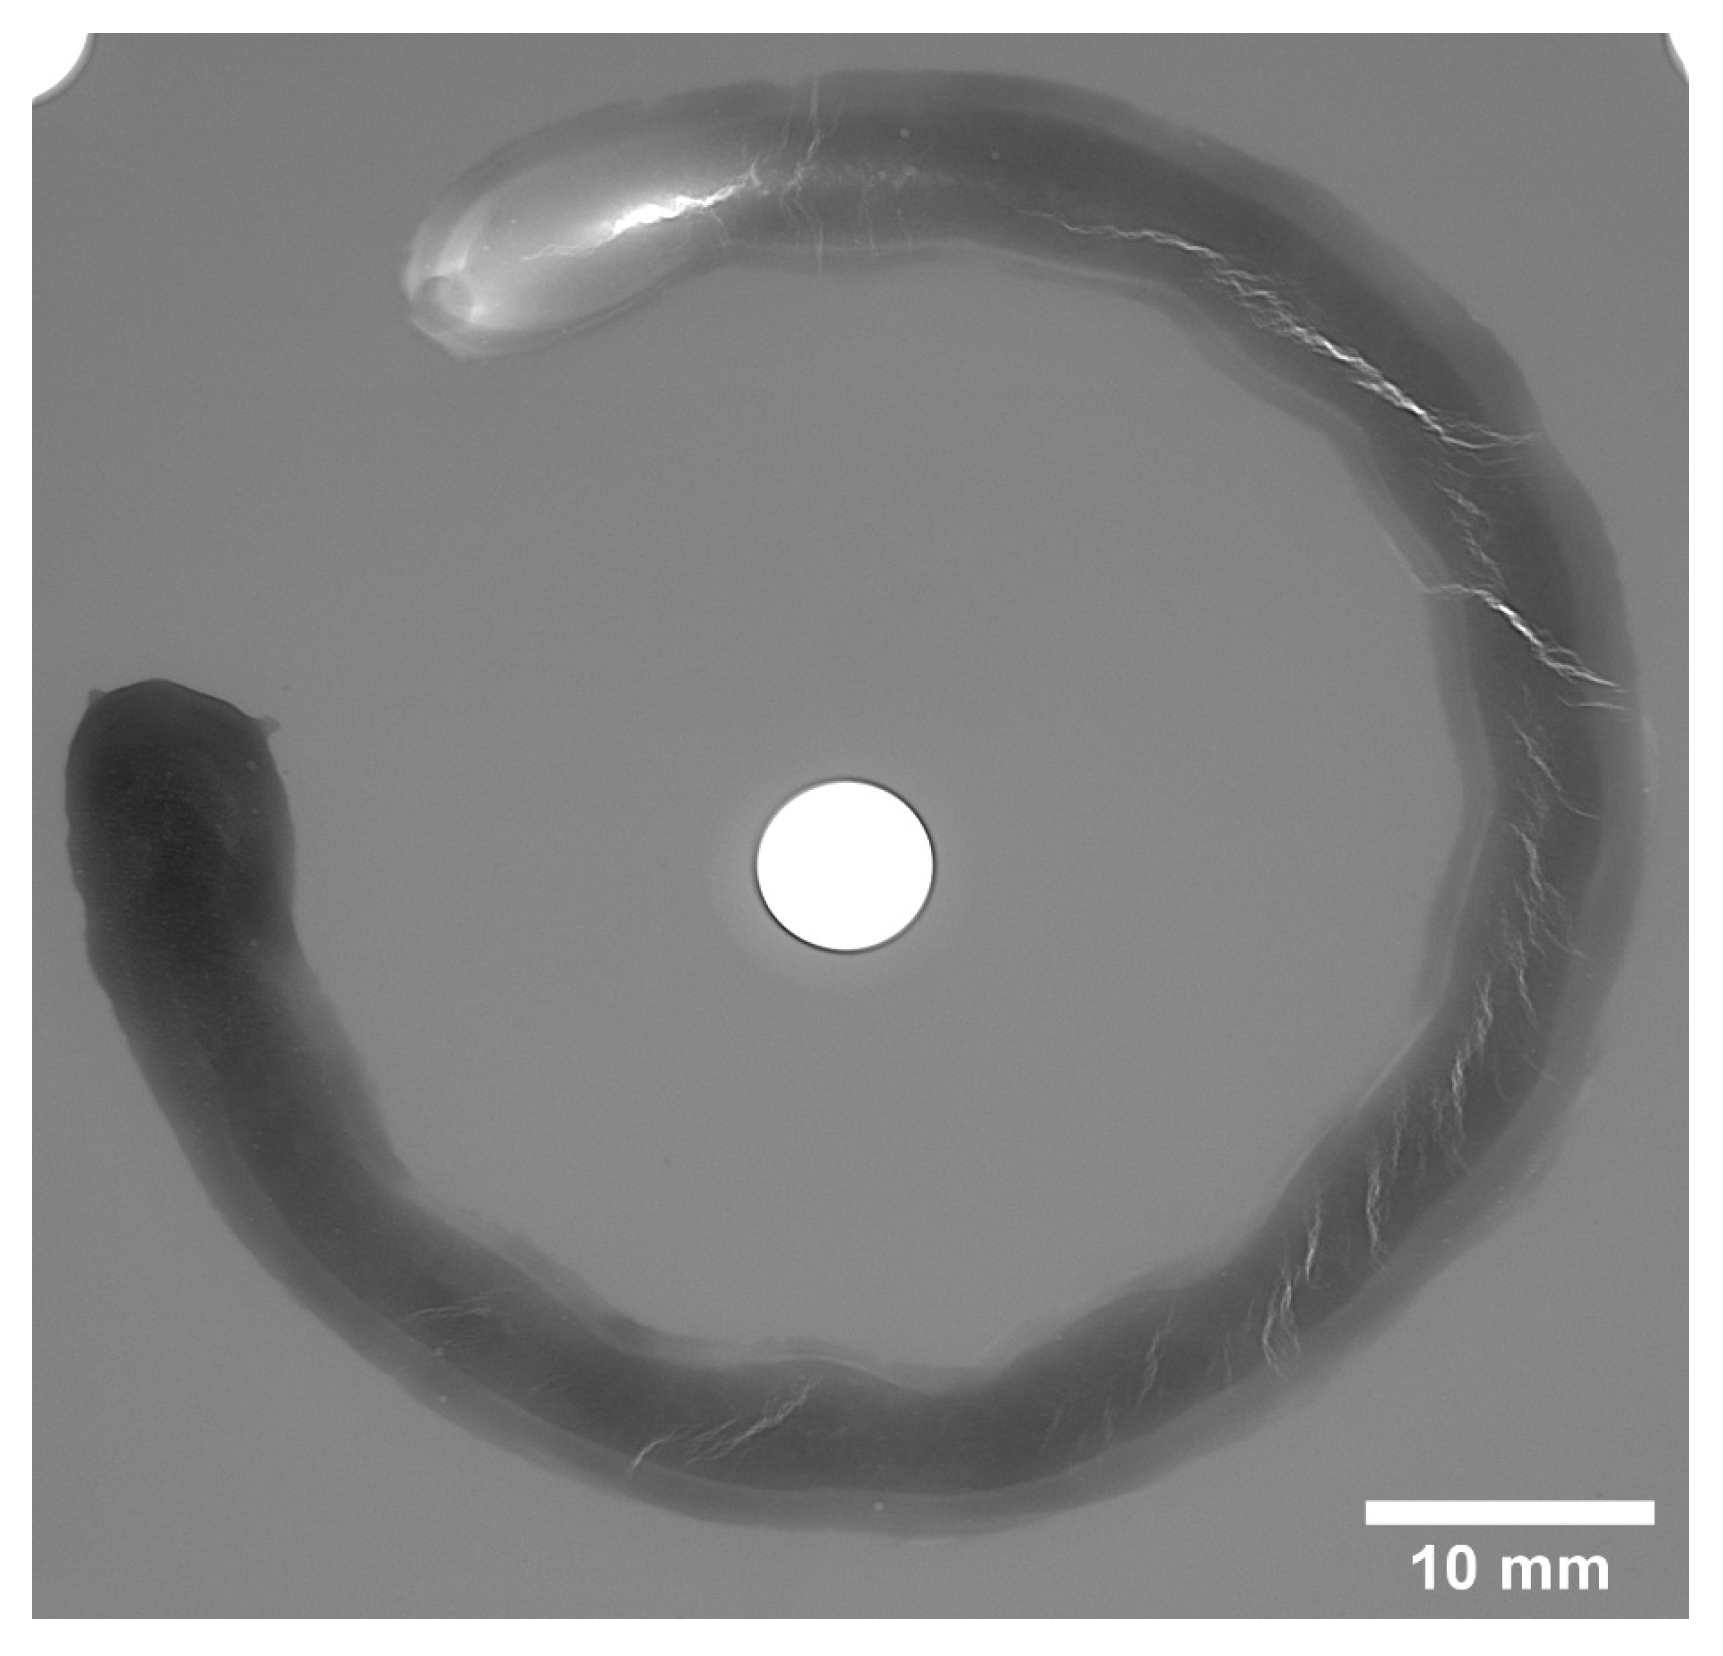
X-ray test was employed to detect surface and internal cracks as well as defects in the fusion zone, as illustrated in
Figure 2. To evaluate the influence of welding parameters and filler-metal selection on solidification cracking, the normalized cumulative crack length index, (Lc), was used as a dimensionless comparative cracking-susceptibility index. Crack segments were identified from calibrated X-ray images as visible linear indications along the circular weld path. The beginning and end of each crack segment were determined by projecting the crack indication onto the welding direction along the midline of the melted weld zone. The individual crack lengths, (Lc
i), were then measured, summed, and divided by the total inspected weld length, (L
tot), using the following equation [
31]:
where (Lc
i) is the measured length of each individual crack segment and (L
tot) is the total weld length examined. A value of (Lc = 0) represents a crack-free weld path, whereas (Lc = 1) indicates cracking along the entire inspected weld length. In this study, (Lc) was used as a comparative index for solidification cracking susceptibility rather than as a pass/fail acceptance criterion.
4. Results and Discussion
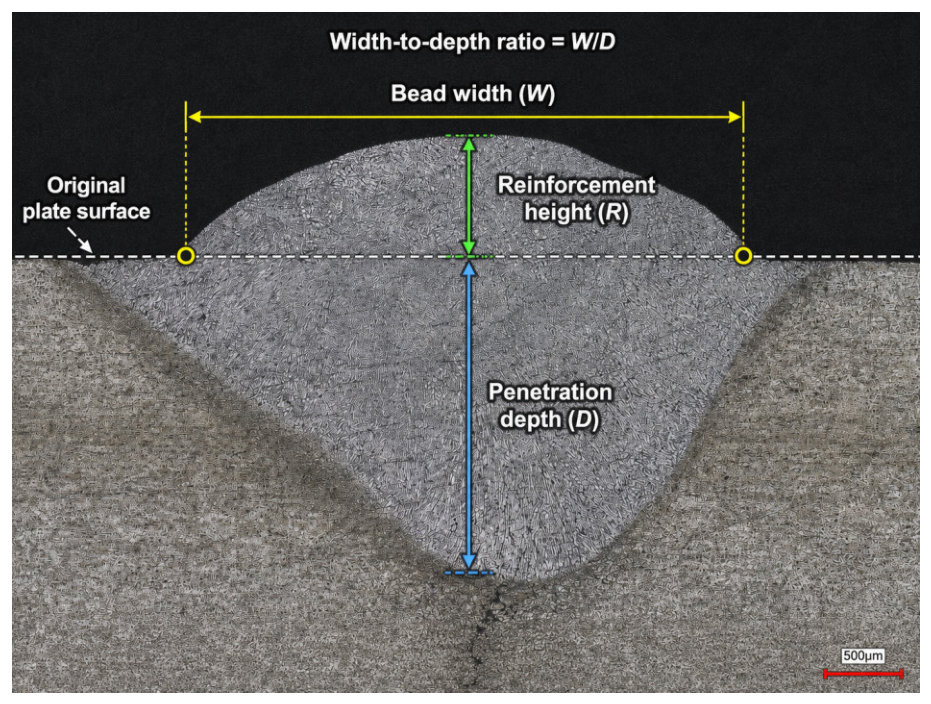
Macroscopic metallographic cross-sections were prepared from the bead-on-plate welds to examine the weld bead geometry. After grinding and etching, the bead width, reinforcement height, penetration depth, and width-to-depth ratio were identified, as shown in
Figure 4. Representative weld bead geometry was measured from calibrated optical macrographs to evaluate the relationship between bead profile and cracking susceptibility. The measured bead width, penetration depth, reinforcement height, and width-to-depth ratio were approximately 6.32 ± 0.60 mm, 2.11 ± 0.05 mm, 1.23 ± 0.10 mm, and 3.01 ± 0.35, respectively. These values indicate that the selected GMAW conditions produced relatively consistent penetration depth, while variations in bead width and reinforcement may affect local thermal gradients, solidification shrinkage, and stress distribution during cooling. Therefore, weld bead geometry should be considered together with heat input, filler composition, and alloy chemistry when interpreting solidification cracking susceptibility. Representative bead-geometry measurements were obtained from three calibrated macrographs, and the reported variability represents the standard deviation among these selected cross-sections.
The calculated heat input values added to
Table 2 show that arc energy decreased as welding speed increased from 1 to 4 m/min. Therefore, the observed solidification cracking behavior should not be attributed only to filler-metal chemistry. Instead, it reflects the combined influence of heat input, filler composition, and dilution. Heat input affects the weld thermal cycle and the extent of the FZ and HAZ, while filler composition modifies the weld-metal chemistry and solidification path. This is consistent with previous studies showing that solidification cracking in aluminum alloys is governed by interacting metallurgical, thermal, and mechanical factors, including solidification range, shrinkage stress, welding parameters, and filler-metal selection [
9,
34,
35]. In the present work, the lowest CCL values observed at intermediate welding speeds suggest that cracking susceptibility was controlled by a balance between thermal conditions and alloy-filler chemical interactions rather than by a single parameter.
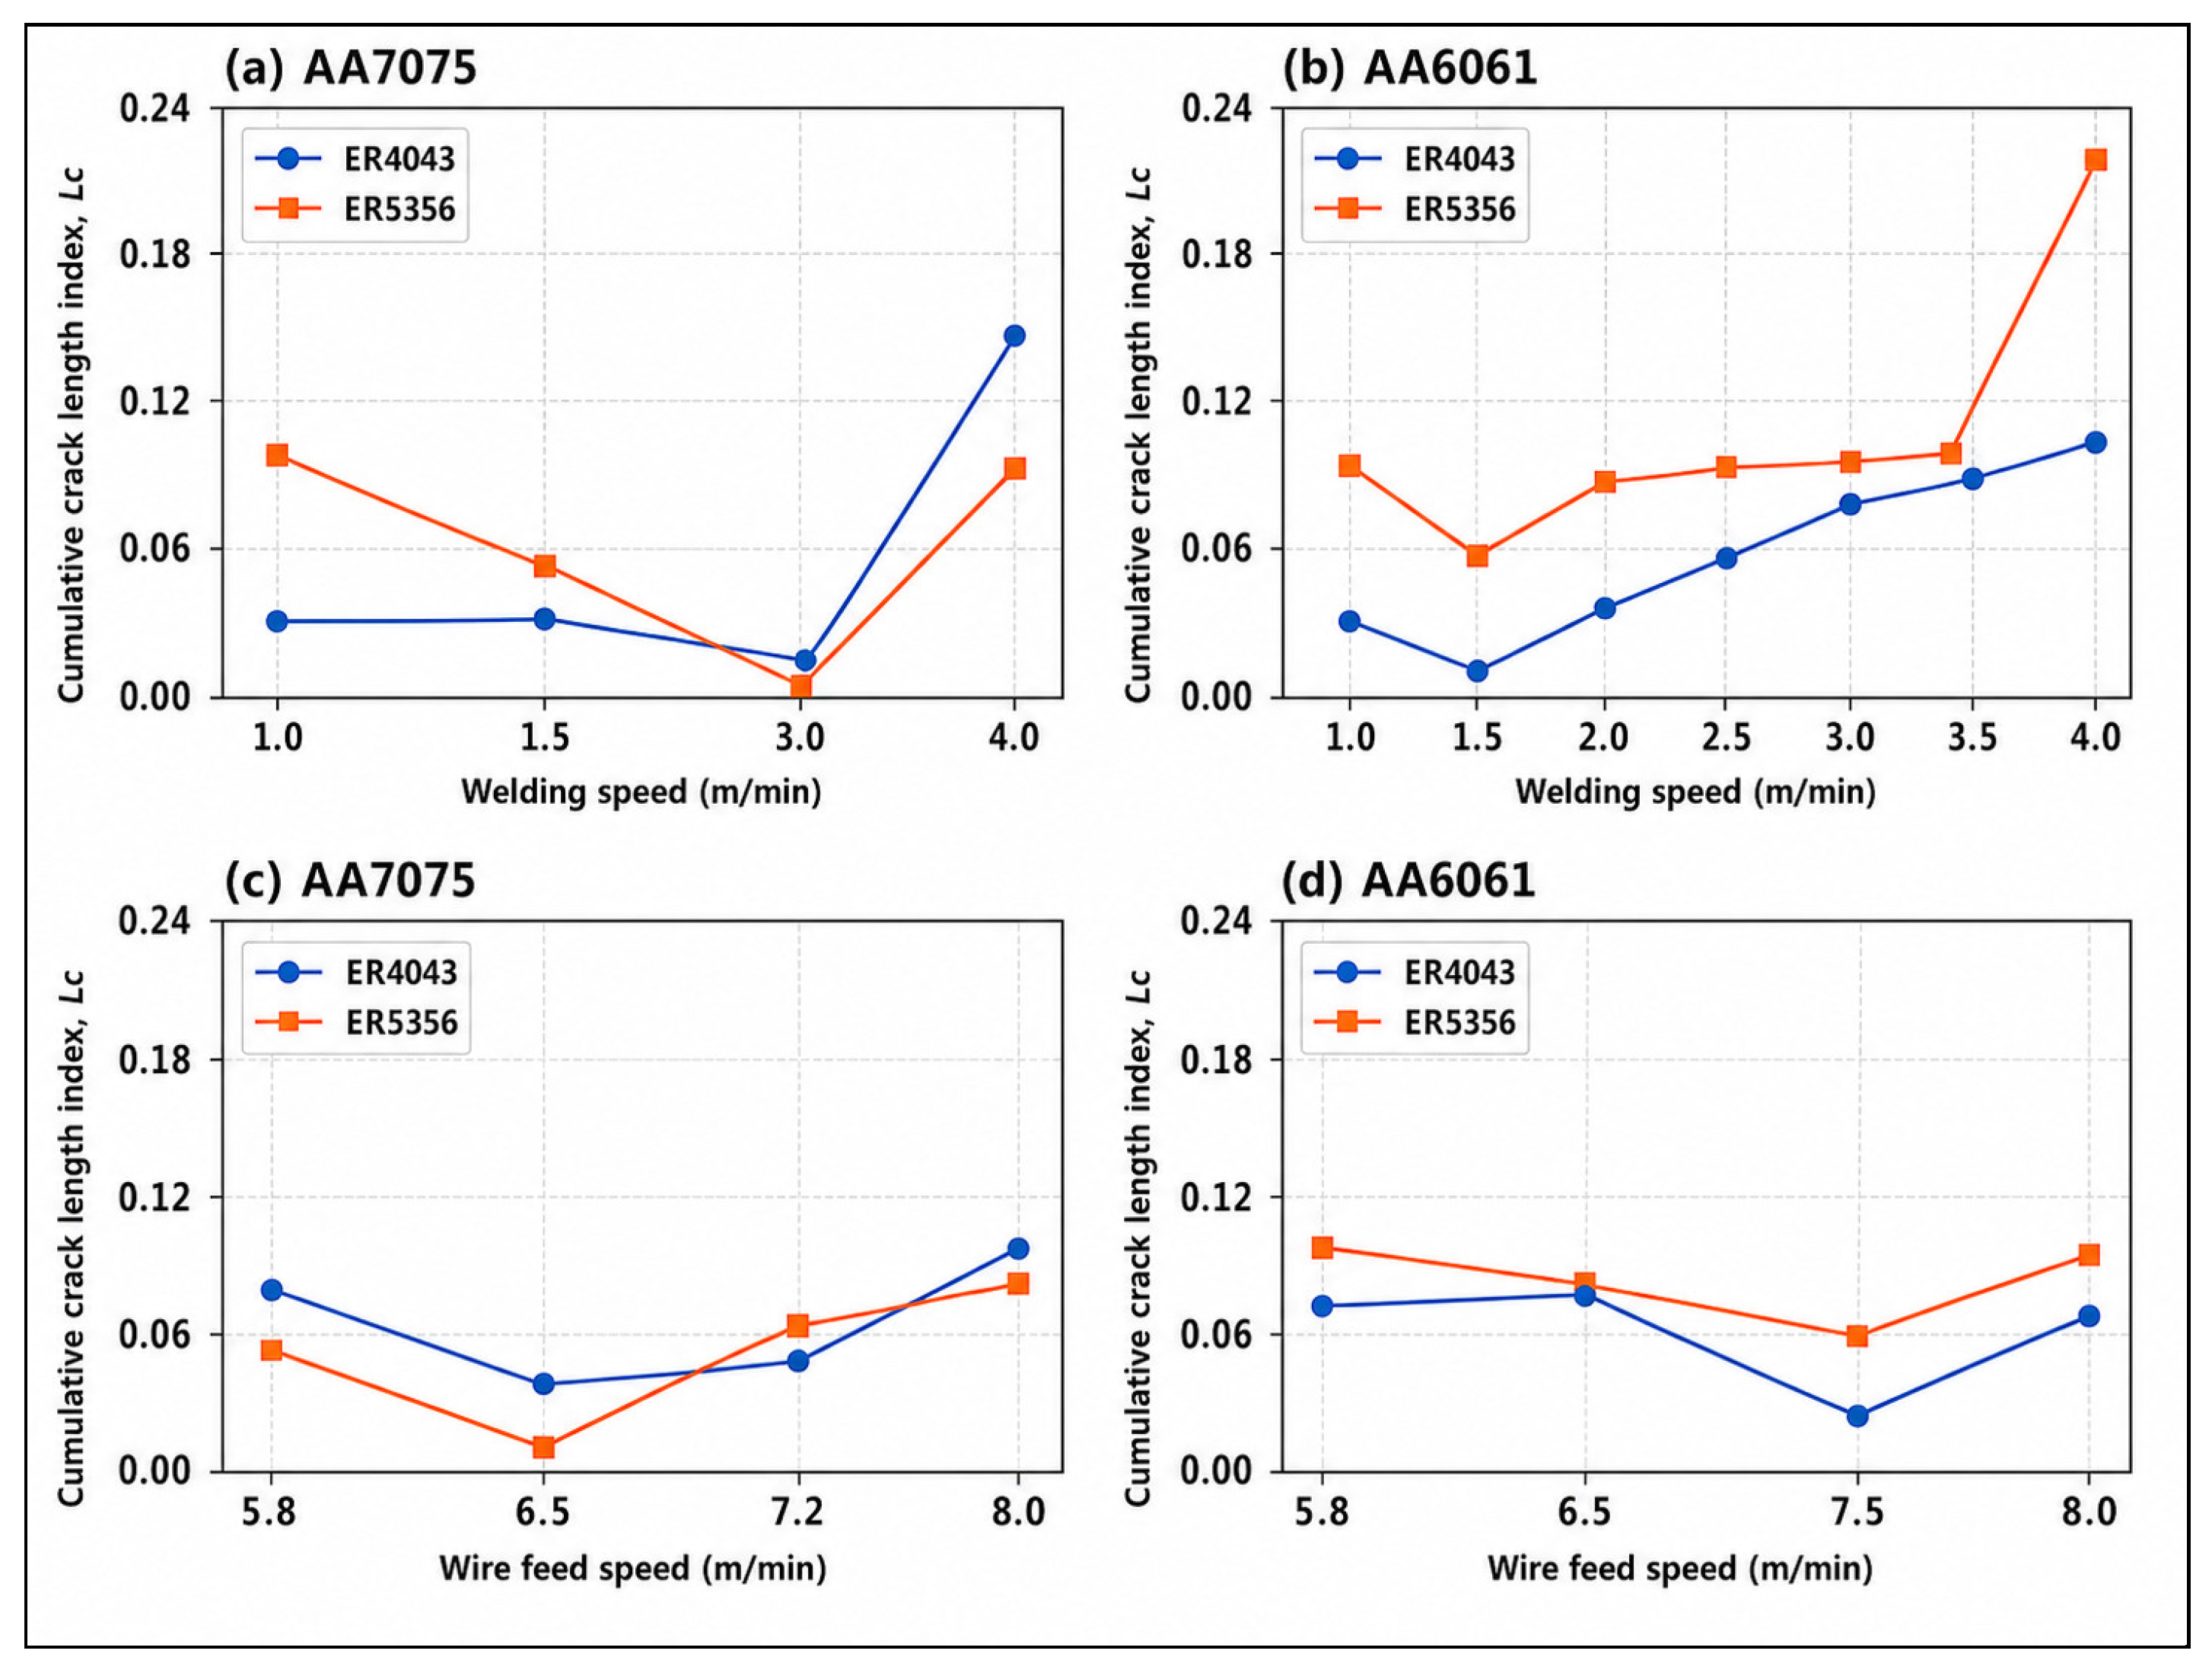
Figure 5a,b illustrates the variation in the CCL as a function of welding speed for alloys AA7075 and AA6061 welded using GMAW with ER5356 and ER4043 filler wires. The results highlight the strong influence of welding speed and filler composition on the occurrence of solidification cracking in both alloys.
For AA7075, the CCL values at low welding speeds of 1 and 1.5 m/min range between 0.10 and 0.055 for the ER5356 filler. The ER4043 filler shows nearly identical values at 1.0 and 1.5 m/min (≈0.031), with a slight improvement at 3 m/min, where the CCL decreases to 0.018. Both fillers exhibit their lowest CCL values at 3 m/min, indicating that this welding speed provides the most favorable thermal conditions for minimizing solidification cracking in AA7075. However, increasing the welding speed to 4 m/min causes a sharp rise in cracking for both fillers, reaching (0.097 and 0.175) for ER5356 and ER4043, respectively, demonstrating a high sensitivity of AA7075 to elevated travel speeds.
For AA6061, the CCL at a low welding speed of 1 m/min is 0.085 for ER5356 and 0.035 for ER4043. The lowest cracking values for both fillers occur at 1.5 m/min, where CCL reaches 0.055 and 0.017 for ER5356 and ER4043, respectively. This indicates that 1.5 m/min produced the lowest CCL for AA6061 within the investigated welding-speed range, with ER4043 showing superior crack resistance. As the welding speed increases beyond 2 m/min, the CCL begins to rise progressively for both fillers. At 4 m/min, the cracking reaches its highest values, measured at 0.22 and 0.10 for ER5356 and ER4043, respectively. This behavior suggests that AA6061 becomes increasingly susceptible to hot cracking at high welding speeds due to rapid heat input and shortened solidification time [
36].
Comparing the two alloys, AA7075 shows a distinct minimum CCL at 3 m/min, whereas AA6061 shows the lowest CCL at 1.5 m/min, demonstrating that the most favorable welding speed within the tested range is alloy-dependent. In both alloys, ER5356 produced the lowest CCL for AA7075 under the selected low-cracking condition, although the relative filler performance varied with welding speed, while ER4043 shows better performance in minimizing solidification cracking for AA6061. This highlights that the most favorable filler-alloy combination depends strongly on the chemical composition of the base metal [
37]. For AA7075, which contains higher Mg and Zn contents and forms Mg/Zn-rich strengthening phases, the ER5356 (Al-Mg) filler performs more effectively, particularly at 3 m/min, where it achieves the lowest CCL value under the tested conditions. In contrast, AA6061, which is an Al-Mg-Si alloy and forms Mg
2Si as its primary strengthening phase, consistently exhibits superior cracking resistance when welded with ER4043 (Al-Si). This confirms that selecting a filler alloy with chemistry compatible with the base metal, Mg-rich for AA7075 and Si-rich for AA6061, is critical to mitigating solidification cracking during GMAW. Conversely, high welding speeds (≥4 m/min) lead to a significant increase in CCL for both alloys and both fillers, indicating that excessive travel speed promotes steep thermal gradients and heightened solidification stresses [
38]. Overall, these findings reinforce the importance of carefully balancing filler composition and welding speed to effectively control hot cracking in aluminum alloys during GMAW.
At a constant welding speed of 3 m/min for AA7075 and 1.5 m/min for AA6061, the variation in CCL with respect to wire feed speed reveals material- and filler-dependent trends, as illustrated in
Figure 5c,d. For AA7075, the use of ER5356 (Mg-rich) filler metal results in a minimum CCL of 0.014 at 6.5 m/min, while a significant increase is observed at 8 m/min, where the CCL peaks at 0.08. A similar trend is seen with the ER4043 (Si-rich) filler, where the lowest CCL of 0.032 also occurs at 6.5 m/min, rising to a maximum of 0.1 at 8 m/min. These findings indicate that higher wire feed speeds increased cracking in AA7075, regardless of filler type, whereas 6.5 m/min was the most favorable wire feed speed within the tested range.
For AA6061, under a slower welding speed of 1.5 m/min, the influence of wire feed speed differs. With ER5356, the lowest CCL of 0.065 is found at 7.5 m/min, while the maximum value of 0.1 is recorded at both 5.8 m/min and 8 m/min, suggesting a narrower operating window for crack minimization. In the case of ER4043, the minimum CCL of 0.035 is achieved at 7.5 m/min, whereas the highest CCL of 0.08 arises at 6.5 m/min. These results suggest that, for AA6061, 7.5 m/min is a more favorable wire feed speed for minimizing cracking, especially when using ER4043.
Overall,
Figure 5c,d shows that the wire feed speed associated with the lowest CCL depends on the base alloy, filler metal composition, and welding speed used during the GMAW process [
39].
Standard deviation error bars are not shown in
Figure 5 because the individual replicate CCL values were not processed statistically. The welded tensile specimens were selected from the lowest-CCL CPT conditions, with sound weld appearance and acceptable weld penetration confirmed by X-ray inspection. Therefore, the tensile results should be interpreted as representative mechanical responses of selected low-cracking welds, rather than as general trends for all welding conditions. The possible presence of minor pre-existing microcracks or weld defects cannot be completely excluded.
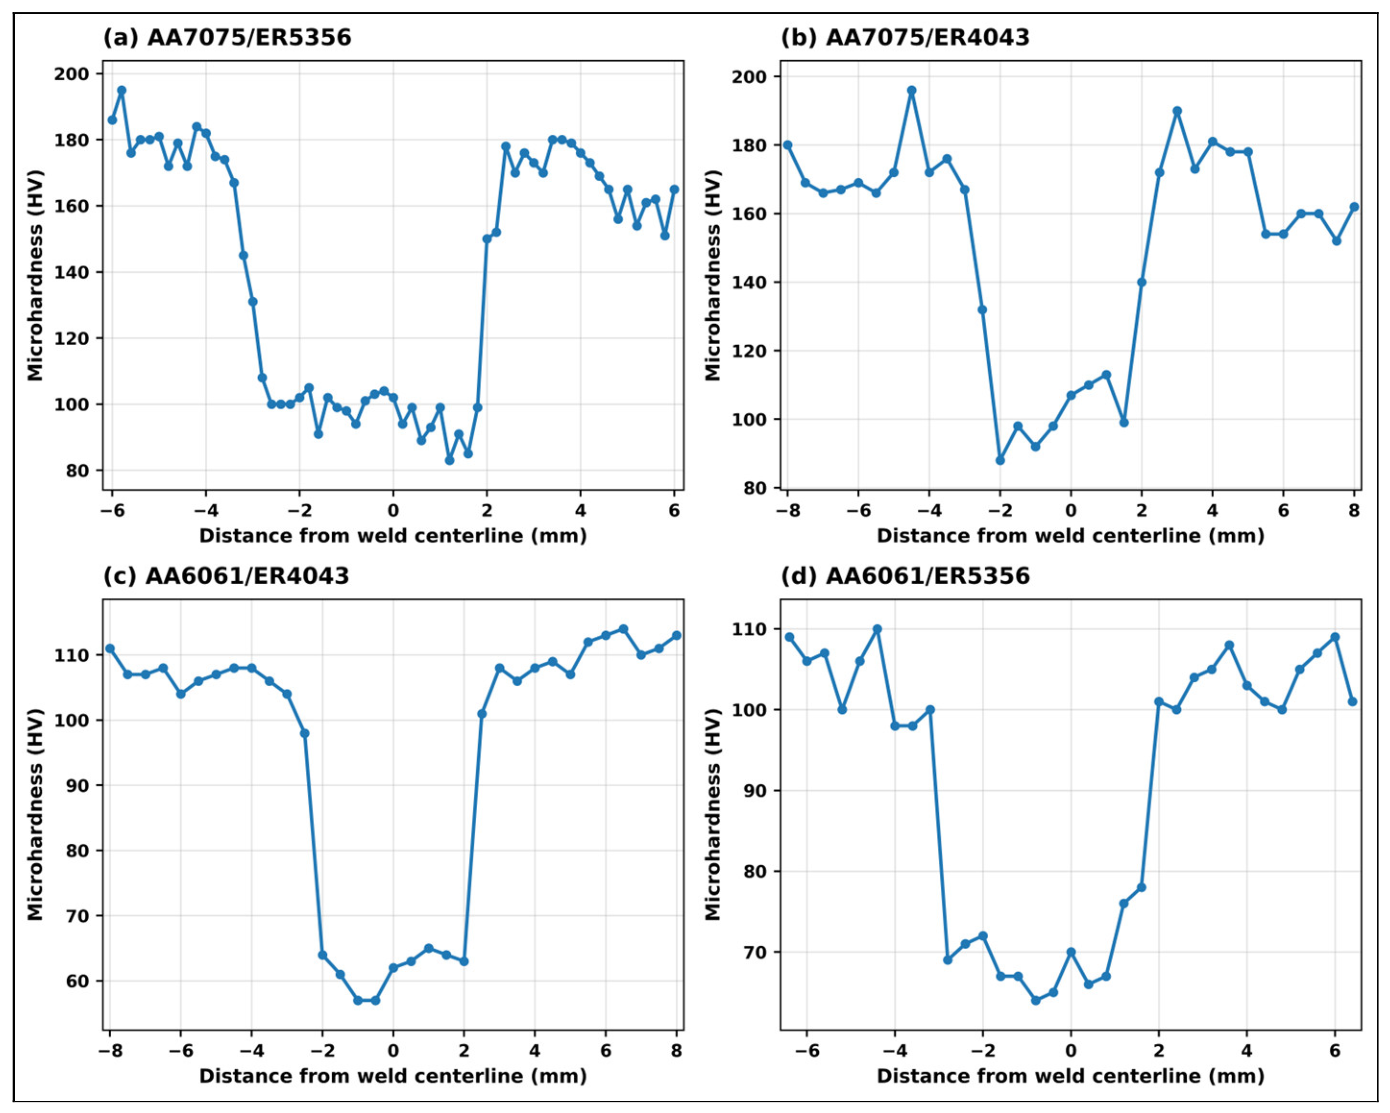
Figure 6 illustrates the transverse microhardness distributions across the weldments of AA7075 and AA6061 alloys using ER5356 and ER4043 filler metals. A distinct drop in microhardness is observed in the FZ for all configurations. This softened region, approximately 5.6 mm wide (±2.8 mm from the weld center), exhibits the lowest hardness values. For AA6061, the FZ hardness ranges from 57 to 70 HV, while AA7075 shows relatively higher values of 76 to 113 HV, reflecting its higher BM strength.
Adjacent to the FZ, the PMZ shows intermediate hardness values of 98–104 HV for AA6061 and 172–196 HV for AA7075, indicating partial preservation of the BM microstructure. The hardness gradually recovers further away from the weld center, returning toward BM levels. The reduction in hardness after welding is mainly attributed to the thermal sensitivity of precipitation-hardened AA6061-T6 and AA7075-T6 alloys. In AA6061-T6, the welding thermal cycle can dissolve, coarsen, or transform Mg2Si-related strengthening precipitates, reducing local hardness in the weld region. In AA7075-T6, the thermal cycle affects MgZn2/η′-related precipitates, which are responsible for the high strength of the T6 condition. The loss or modification of these precipitates reduces precipitation strengthening and contributes to FZ and HAZ softening. Notably, the ER4043 and ER5356 welded beads show similar softening trends; however, the BM hardness of AA7075 remains significantly higher than that of AA6061 throughout the hardness profile.
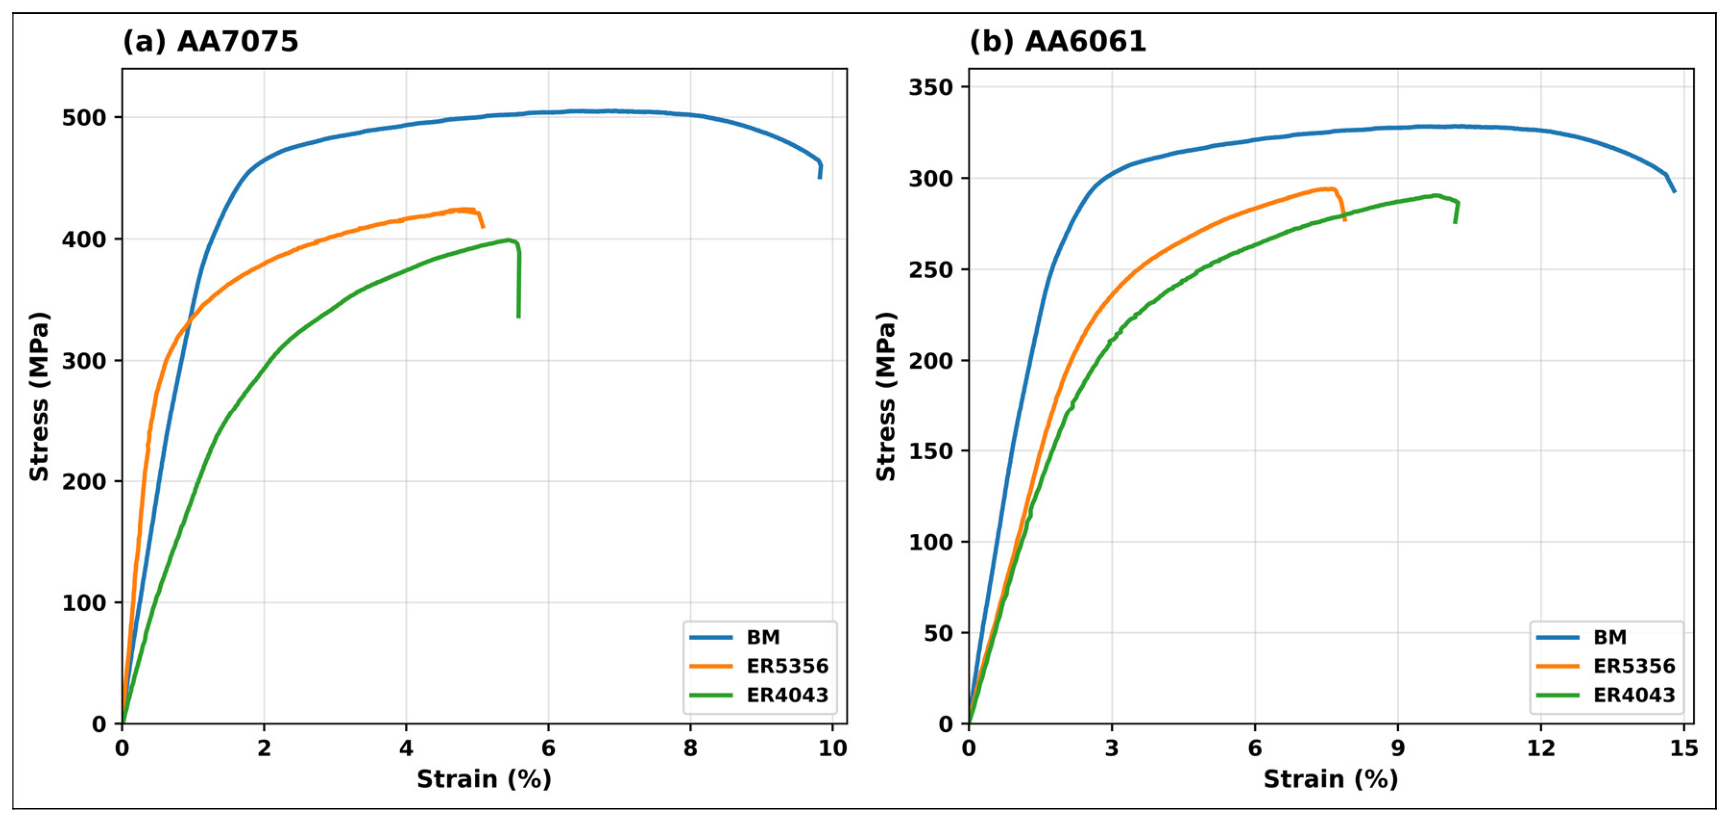
Figure 7a,b illustrate the tensile stress–strain behavior of the BM and welded specimens of AA7075 and AA6061, respectively, using ER5356 and ER4043 fillers. For both alloys, fracture occurred in the plastic region of the curves, specifically within the FZ, reflecting the mechanical integrity of the welds under uniaxial tension. In the AA7075 system, as shown in
Figure 7a, ER5356 filler demonstrated superior tensile strength (424.1 MPa) compared to ER4043 (399 MPa), while ER4043 showed slightly higher ductility, achieving 5.59% elongation versus 5.08% for ER5356. The yield strength (YS
0.2) also followed a similar trend, with ER5356 yielding at a higher stress level. This indicates a trade-off between strength and ductility depending on filler type.
Similarly, for AA6061, as presented in
Figure 7b, the BM exhibited the highest mechanical properties among the selected tested specimens. Among the welded specimens, ER5356 showed higher tensile and yield strengths than ER4043. Specifically, ER5356 resulted in a TS of 294 MPa and YS
0.2 of ~275 MPa, while ER4043 yielded lower values of 290.4 MPa and ~260 MPa, respectively. However, ER4043 again showed enhanced ductility, reaching 10.26% elongation compared to 7.89% for ER5356. These results confirm that although ER5356 improves strength, ER4043 is more effective in retaining elongation, underlining the influence of filler metal selection on the strength-ductility balance in aluminum welds.
The joint efficiency was calculated by comparing the UTS of each welded specimen with that of the corresponding base metal. For AA7075, the base metal showed a UTS of approximately 505.3 MPa, while the AA7075/ER5356 and AA7075/ER4043 welded specimens showed UTS values of approximately 424.1 MPa and 399 MPa, corresponding to joint efficiencies of 83.9% and 79%, respectively. For AA6061, the base metal showed a UTS of approximately 328.5 MPa, while the AA6061/ER5356 and AA6061/ER4043 welded specimens showed UTS values of approximately 294 MPa and 290.4 MPa, corresponding to joint efficiencies of 89.5% and 88.4%, respectively. These results confirm that welding reduced the tensile strength compared with the base metals, mainly due to FZ softening, precipitate modification, local dilution, and filler-dependent microstructural changes. However, the relatively high joint efficiencies indicate that the selected welding conditions retained a significant portion of the BM strength.
The welded specimens used for the tensile curves in
Figure 7 were selected from the parameter sets that produced the lowest CCL for each alloy-filler combination. Therefore, the mechanical response shown in
Figure 7 corresponds to the best cracking-resistance condition identified from the CPT results, rather than to all welding parameters listed in
Table 2. Specifically, the tensile specimens correspond to 3 m/min welding speed and 6.5 m/min wire feed speed for AA7075, and 1.5 m/min welding speed and 7.5 m/min wire feed speed for AA6061.
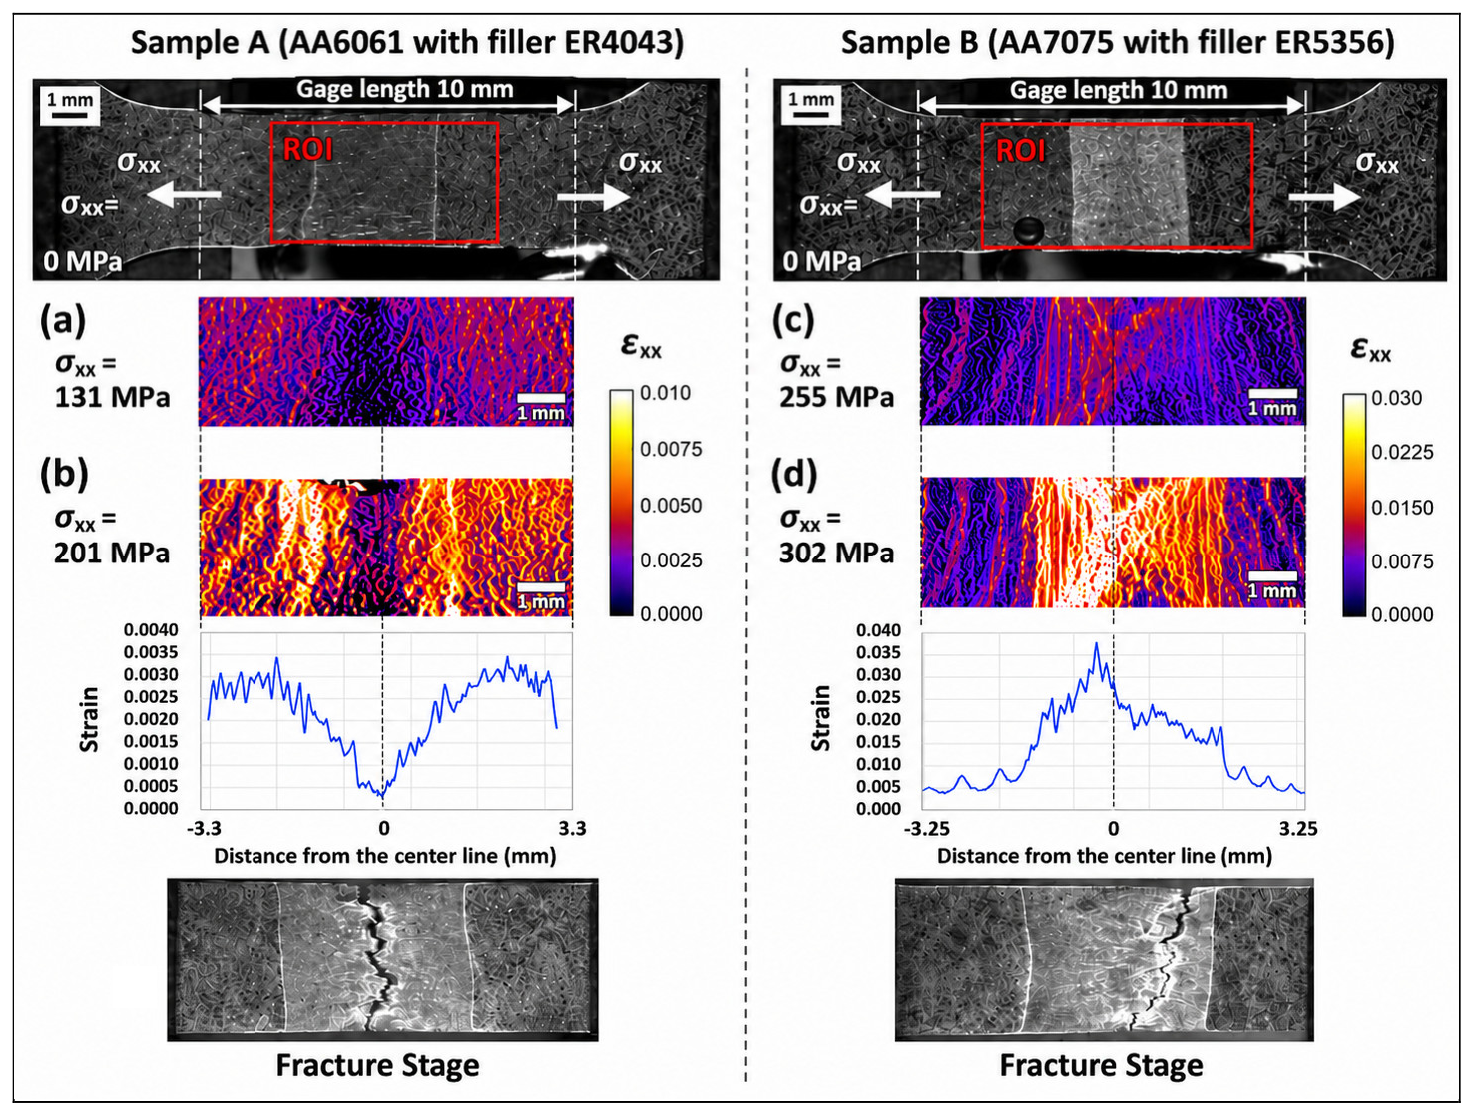
Figure 8 presents the x-direction deformation (εxx) determined using DIC for specimens A (AA6061 with ER4043 filler) and B (AA7075 with ER5356 filler). Strain evolution was tracked along the longitudinal path of the specimens at two loading stages in the plastic deformation region. The recorded fields show the strain distribution across the defined region of interest (ROI) and allow the relationship between macroscopic deformation and final fracture location to be examined. To provide a more quantitative interpretation, the position of the main εxx localization zone was compared with the weld centerline, the FZ-HAZ interface, and the final fracture location for each specimen.
For specimen A, the first loading stage at 131 MPa shows a relatively uniform strain distribution across the ROI, with early localization initiating outside the FZ. At the second stage, 201 MPa, close to the ultimate tensile strength, εxx becomes more pronounced at approximately 0.5 mm on either side of the weld centerline, mainly near the FZ-HAZ interface. This indicates that the main strain localization zone was spatially offset from the final fracture path, which occurred closer to the center of the FZ. However, the final fracture occurred near the middle of the FZ rather than exactly at the region of maximum measured surface strain. This indicates that the fracture location was not governed only by the macroscopic strain magnitude measured by DIC. Instead, the central FZ likely had lower local fracture resistance due to microstructural heterogeneity, brittle/eutectic constituents, or weld-related defects. Therefore, the DIC results should be interpreted together with the local weld microstructure, since regions with lower fracture toughness can fail at lower measured macroscopic strain when their local damage tolerance is limited.
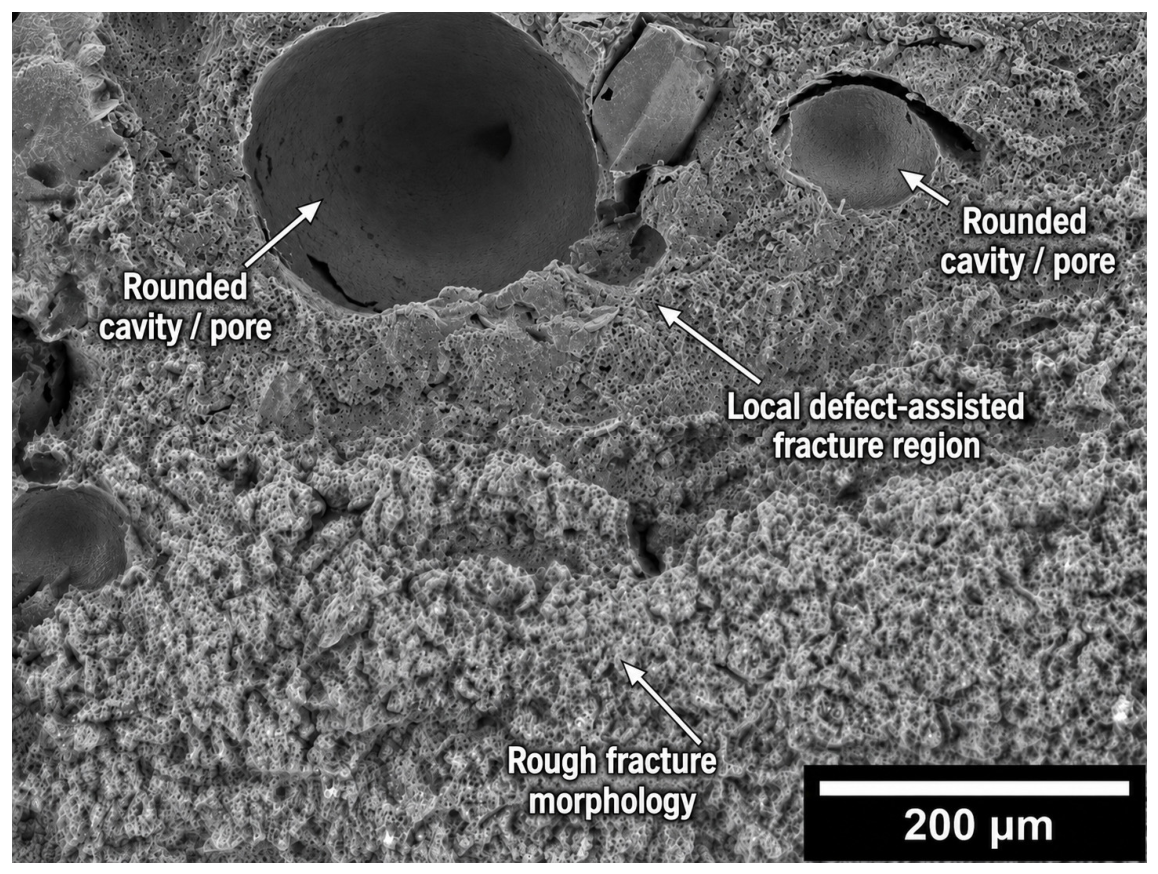
To further support this interpretation, SEM fractography was performed on the fractured AA6061/ER4043 tensile specimen as shown in
Figure 9. The fracture surface shows large rounded cavities/pores and a rough morphology within the fractured region, indicating the presence of local weld defects such as porosity or shrinkage cavities. These defects can act as stress concentrators and reduce the local fracture resistance of the fusion zone. Therefore, although the highest macroscopic εxx values measured by DIC were located near the FZ-HAZ interface, fracture occurred near the center of the FZ because this region was locally weakened by weld defects, microstructural heterogeneity, and Al-Si eutectic constituents.
For specimen B, strain begins to concentrate at a stress level of 255 MPa, with visible localization across the FZ and adjacent HAZ regions. At 302 MPa, εxx increases further and reaches higher localized values, with pronounced strain gradients near the FZ-HAZ boundaries. Unlike specimen A, the region of high εxx localization was closer to the final fracture path, indicating better spatial agreement between the DIC strain field and fracture location. In this case, the final fracture occurred within the highly strained weld region, indicating a stronger correlation between strain localization and fracture location. This suggests that the region of high macroscopic strain also coincided with a locally vulnerable microstructure.
Overall, these results show that fracture behavior in the welded samples cannot be explained by the DIC strain field alone. Instead, the final crack path and fracture location are controlled by the combined effects of macroscopic strain localization, local microstructural resistance, weld defects, and the morphology and distribution of secondary or eutectic phases. The different responses of AA6061/ER4043 and AA7075/ER5356 therefore reflect the influence of alloy-filler interaction and filler chemistry, particularly the effect of Si-rich ER4043 and Mg-rich ER5356 on the weld microstructure and local fracture behavior [
40,
41].
The tensile and DIC results correspond only to selected specimens from the lowest-CCL welding conditions and should therefore be interpreted as representative structure-property observations for low-cracking welds, rather than as general mechanical trends for all welding parameters.
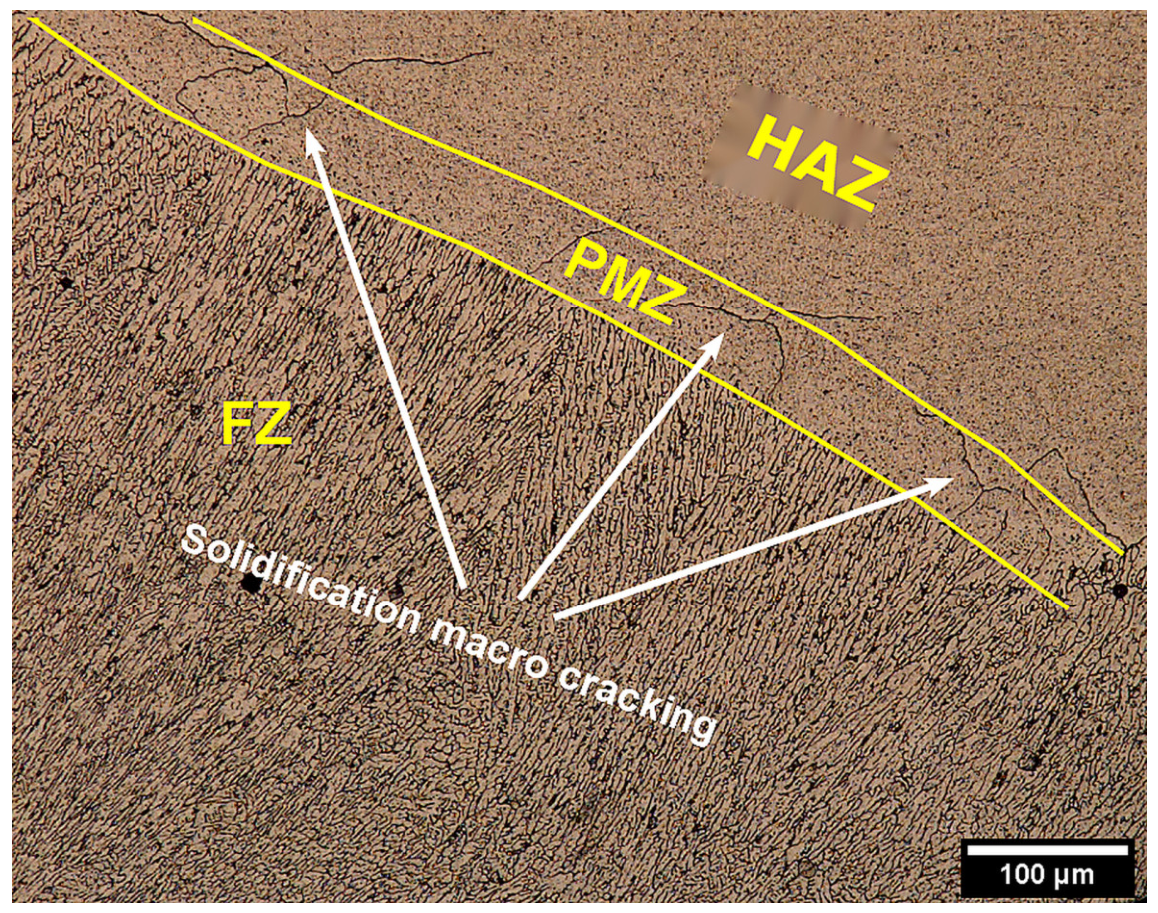
To clarify the observed cracking and defect features, solidification cracking, liquation cracking, and shrinkage porosity were discussed based on their approximate location and morphology. Cracks observed within the FZ are interpreted as being consistent with solidification cracking, which may occur during the final stage of solidification when interdendritic liquid films or low-melting constituents remain along grain-boundary regions. Cracks located in the PMZ or near the FZ-HAZ interface may be associated with liquation cracking, where localized grain-boundary melting can weaken these regions during welding. In contrast, rounded cavities or pores are interpreted as shrinkage porosity or weld defects rather than cracks. However, the SEM fracture-surface image in
Figure 9 shows that these rounded cavities/pores may act as local stress concentrators and reduce fracture resistance. The surrounding rough fracture morphology suggests mixed fracture behavior influenced by macroscopic strain localization, FZ heterogeneity, possible local liquation in susceptible boundary regions, weld defects, and filler-dependent eutectic or secondary constituent formation. Therefore, the mechanism assignment should be considered qualitative and based on the observed microstructural morphology, rather than as a definitive classification.
Figure 10 shows the macrostructure of the bead-on-plate weld in AA6061 using ER4043 filler, describing the fusion zone (FZ), partially melted zone (PMZ), and heat-affected zone (HAZ). Solidification macrocracks are observed within the PMZ, indicating that this region is particularly susceptible to solidification cracking. These cracks are associated with the high thermal contraction and strain that develop during the final stages of solidification, where the mushy zone is vulnerable to feeding difficulties and localized stress accumulation.
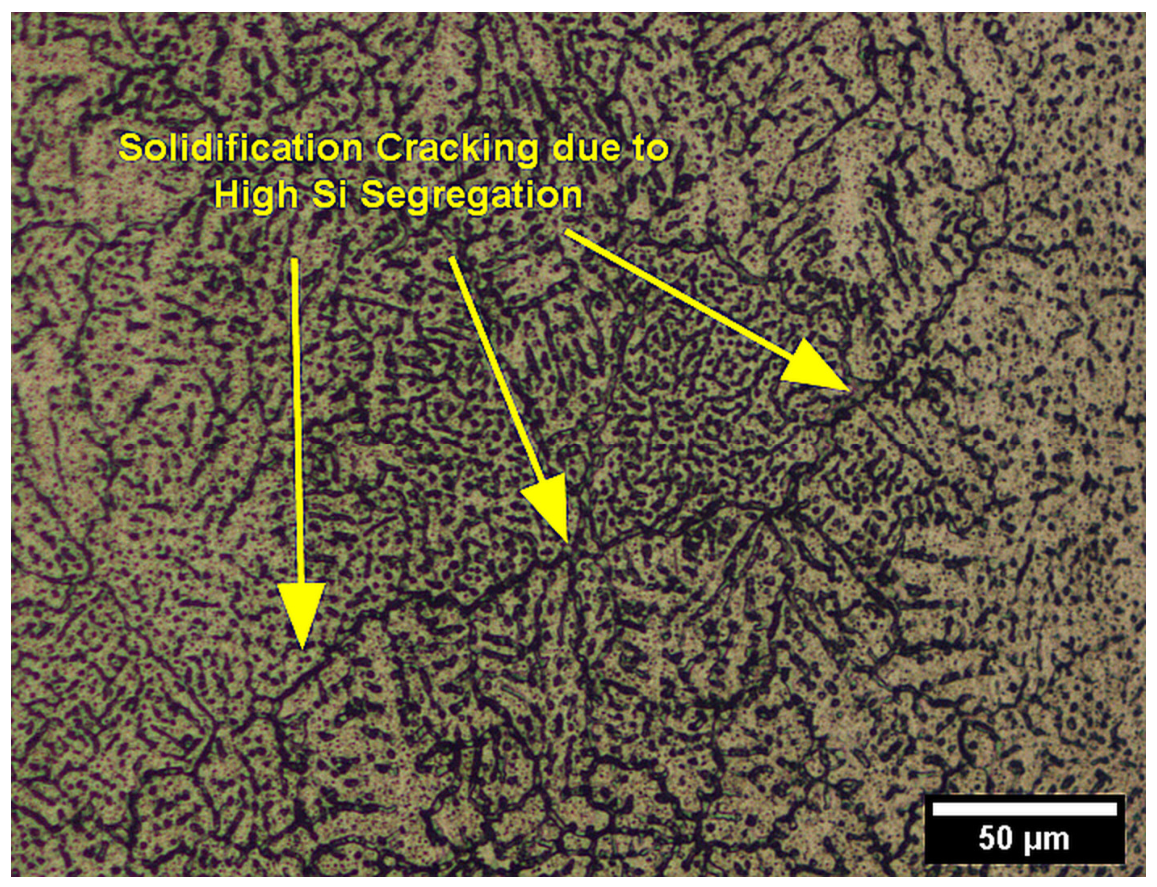
Magnified micrographs reveal further details of the cracking mechanisms. As shown in
Figure 11, the AA7075 welds produced with ER5356 exhibit solidification cracking and micro-shrinkage cavities along FZ grain boundaries.
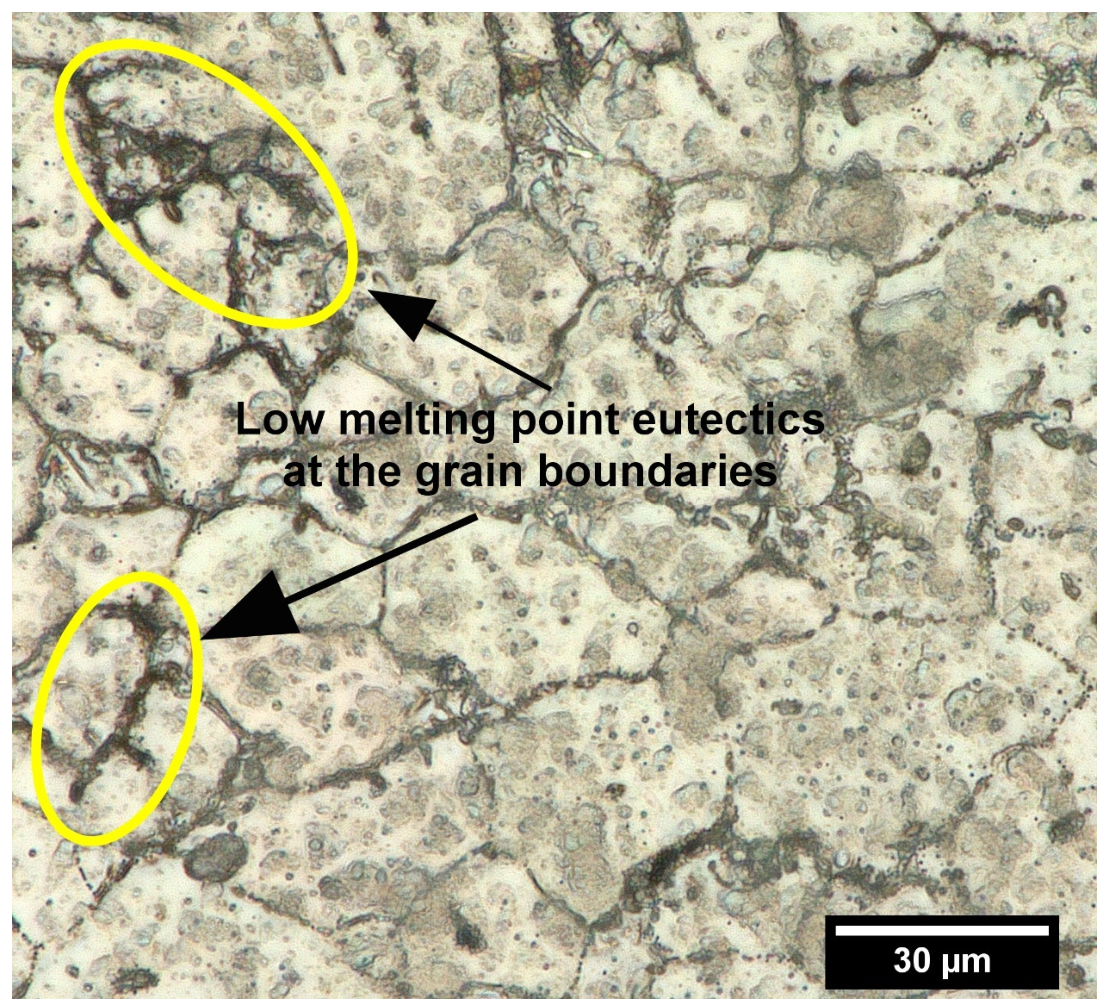
Figure 12 further shows that many cracks are associated with continuous low-melting eutectic films at grain-boundary regions. These eutectic constituents solidify during the final stage of solidification and can promote crack initiation and propagation when interdendritic feeding becomes insufficient and thermal contraction stresses develop [
42,
43]. Grain-boundary liquation near the FZ-HAZ interface may further weaken these regions and contribute to crack formation. Therefore, the observed cracking behavior is consistent with established solidification cracking mechanisms involving low-melting interdendritic films, feeding difficulty, and grain-boundary weakening during the final stage of solidification.
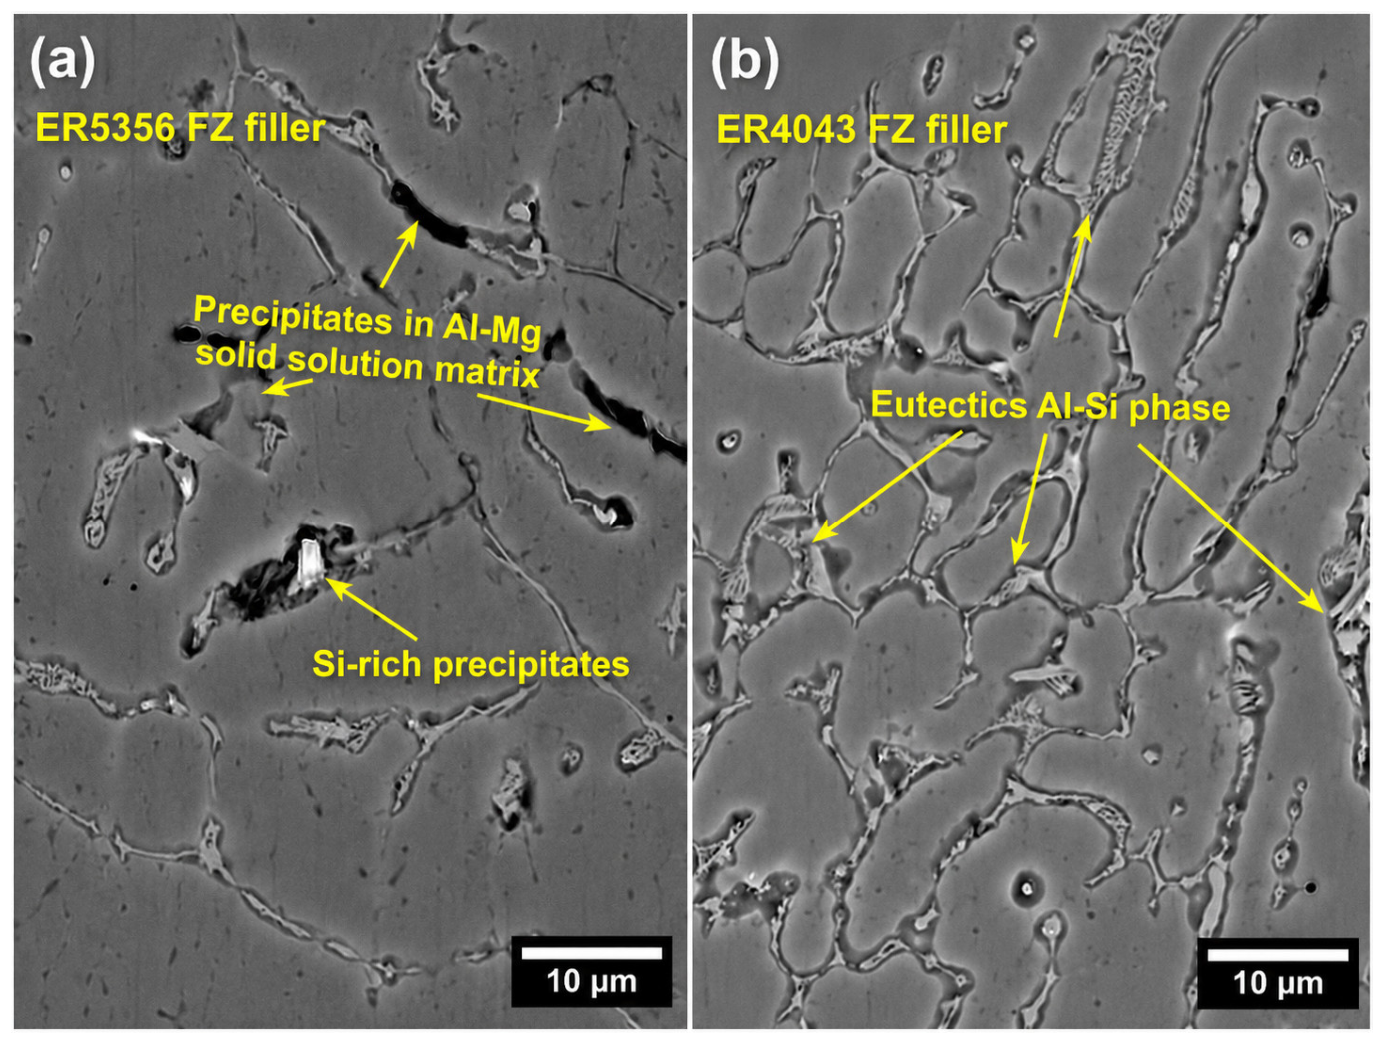
The influence of filler composition on FZ microstructure is highlighted in
Figure 13. With ER5356 filler, the FZ consists of an Al-Mg solid-solution matrix containing fine Al-Mg precipitates and dispersed Si-rich particles. In contrast, welding with ER4043 filler produces an FZ enriched in Al-Si eutectic, particularly at grain boundaries and in the boundary region adjacent to the AA6061 base alloy. In this case, solidification islands surrounded by hairline liquation cracks can be observed at the interface between the AA6061 base metal and the ER4043-rich weld metal, consistent with local enrichment in brittle Mg
2Si and Al-Si eutectics. While the high Si content in ER4043 generally improves the weldability of AA6061 by narrowing the solidification temperature range and reducing hot-cracking susceptibility, compositional mismatch with AA7075 can increase solidification time differences and promote crack formation in regions strongly enriched in ER4043. The role of Mg, Zn, Si, and Cu in cracking susceptibility is associated with their influence on weld-metal solidification behavior, segregation, and the formation of low-melting eutectic or secondary constituents during the final stage of solidification, as reported in previous studies [
34,
35,
38,
39].
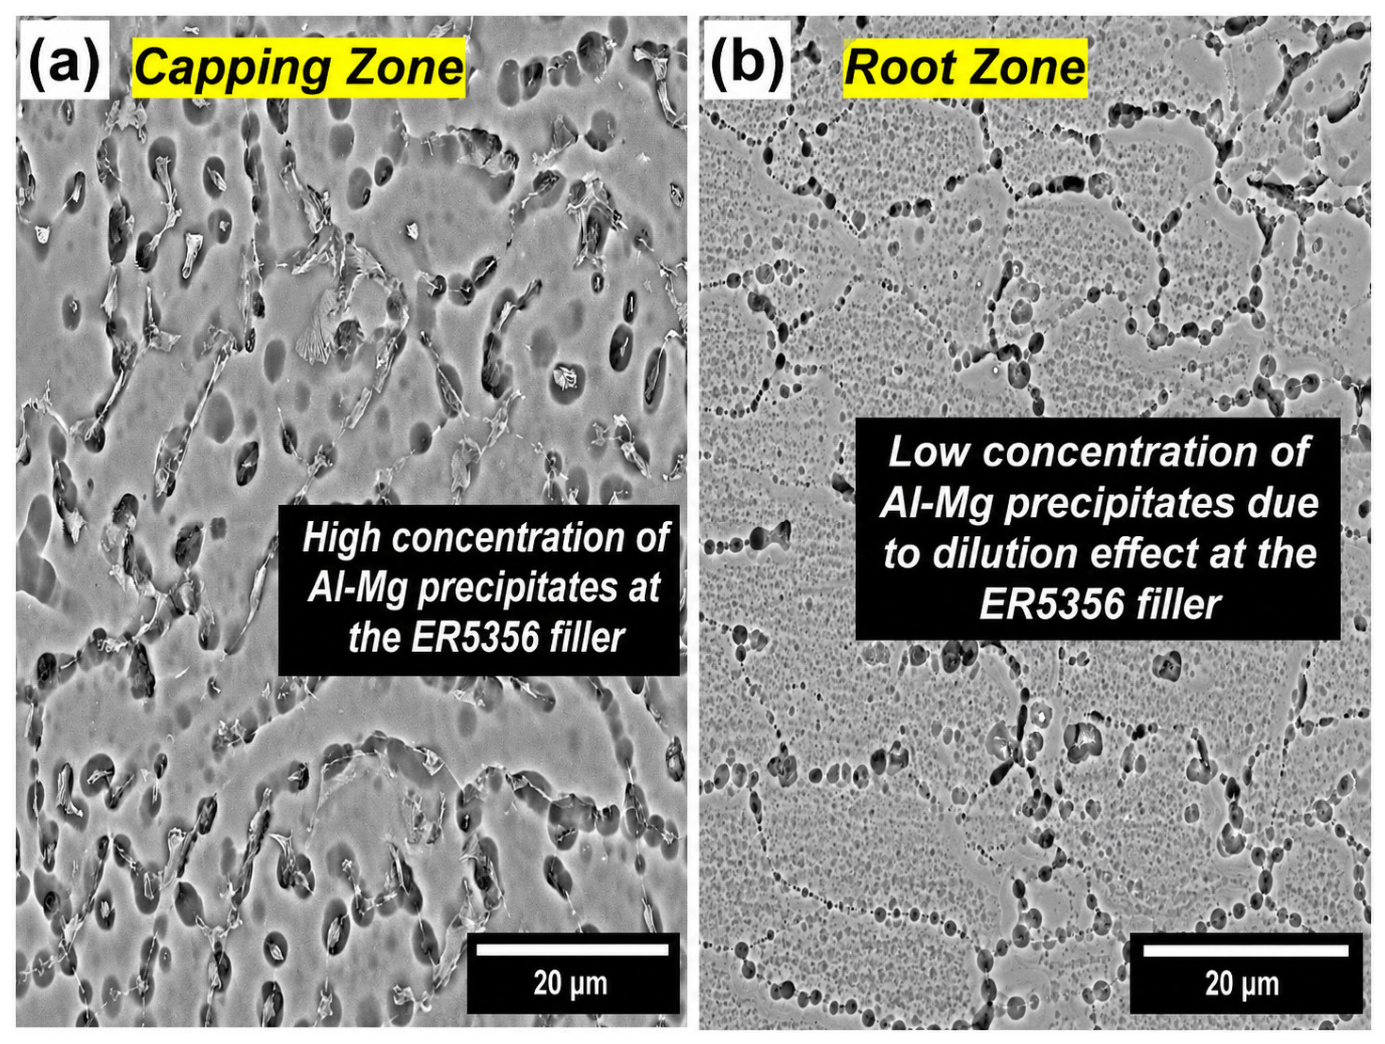
Figure 14a,b compare two different locations within the fusion zone (FZ) of AA6061 welded with ER5356 filler. In this study, the capping region refers to the upper part of the weld bead close to the top surface or weld cap, whereas the root region refers to the lower part of the weld bead near the root side, where weld penetration occurs. The capping region shown in
Figure 14a exhibits a relatively higher density of Al-Mg-rich precipitates, while the root region shown in
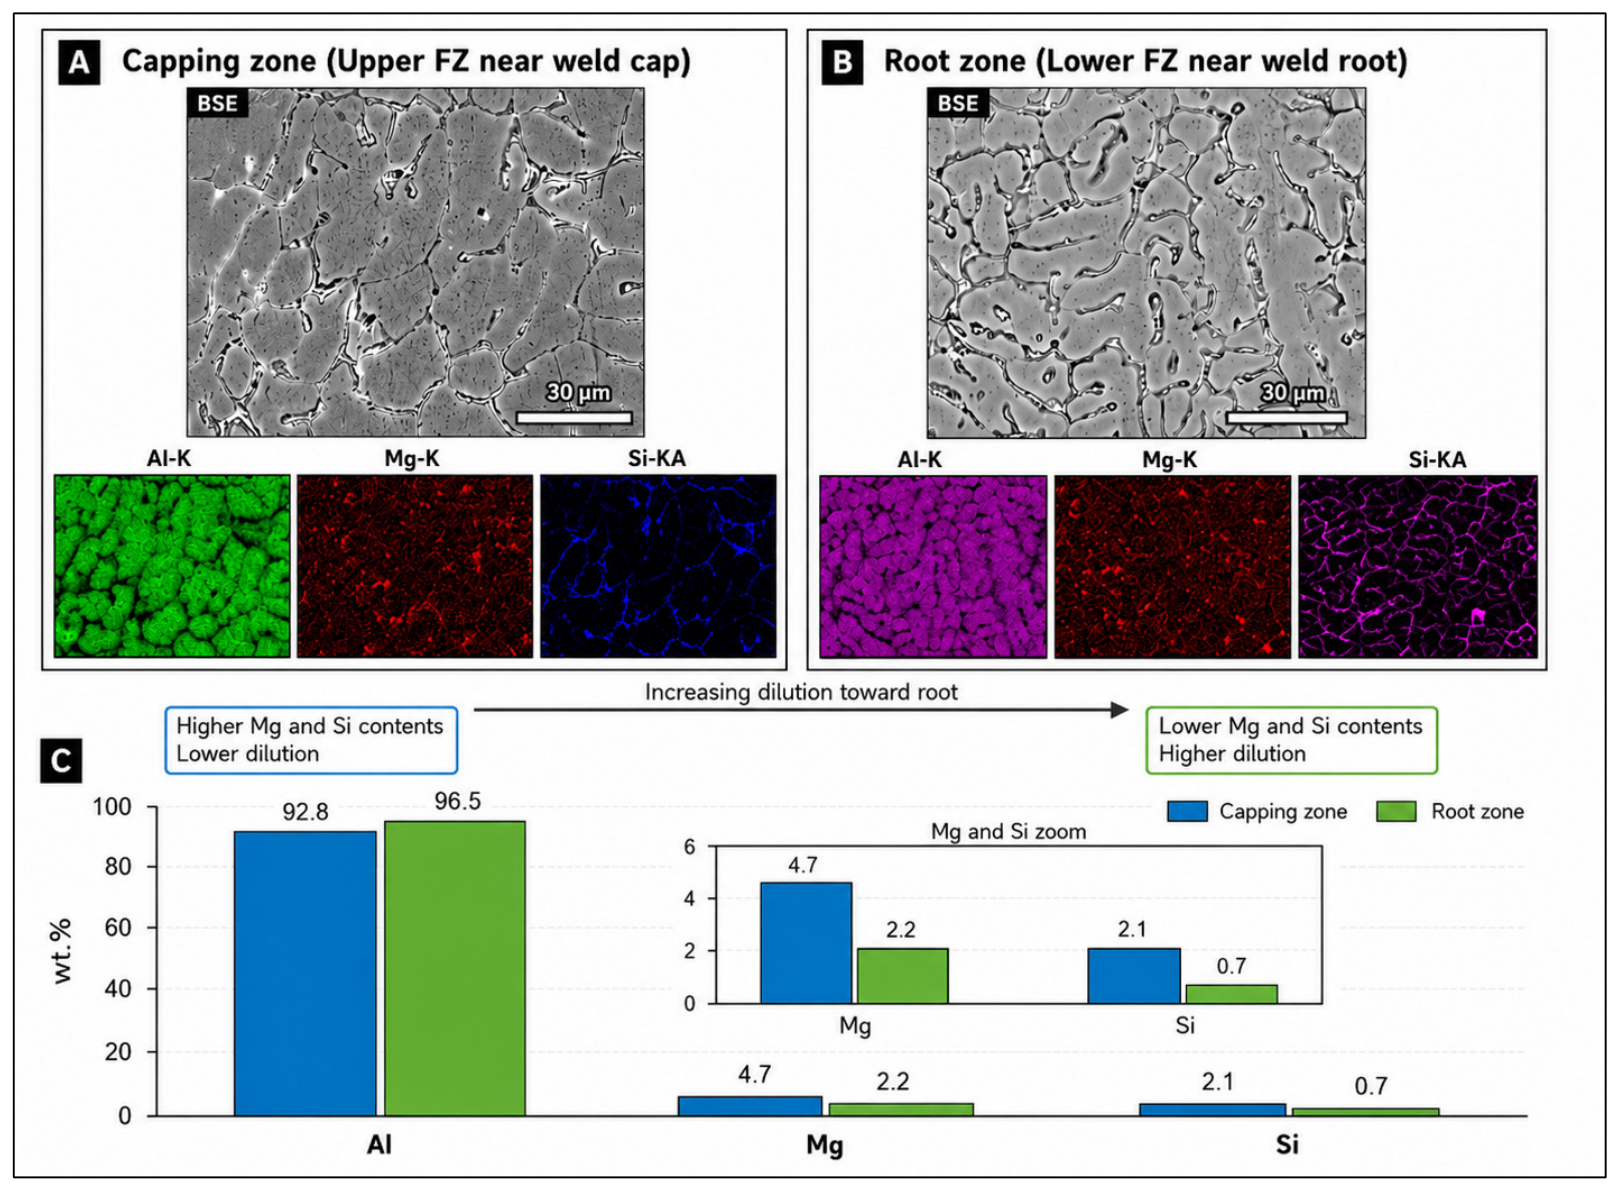
Figure 14b presents a noticeably lower precipitate concentration. To support this observation quantitatively, SEM-EDS area-scan analysis was performed in both regions, as shown in
Figure 15. Local EDS elemental maps and area-scan measurements were obtained for selected capping and root regions; however, continuous elemental mapping across the entire weld cross-section was not performed. The capping region contained approximately 92.8 wt.% Al, 4.7 wt.% Mg, and 2.1 wt.% Si, whereas the root region contained approximately 96.5 wt.% Al, 2.2 wt.% Mg, and 0.7 wt.% Si. The increase in Al content and the simultaneous reduction in Mg and Si contents at the root indicate stronger dilution by the AA6061 base metal in this region. This dilution reduces the local availability of Mg and Si for the formation of Mg- and Si-rich constituents, which is consistent with the lower precipitate density observed in the root zone. Therefore, the microstructural difference between the capping and root regions is attributed to the combined effect of local dilution and solidification conditions across the weld depth. Such dilution-driven compositional variations may influence the local solidification path and contribute to cracking susceptibility by modifying the amount and distribution of interdendritic constituents [
44,
45]. It should be noted that the EDS measurements provide local compositional evidence of dilution trends; they do not represent a full bulk dilution coefficient for the entire weld metal, which would require additional cross-sectional area measurements or full weld-metal chemical analysis.
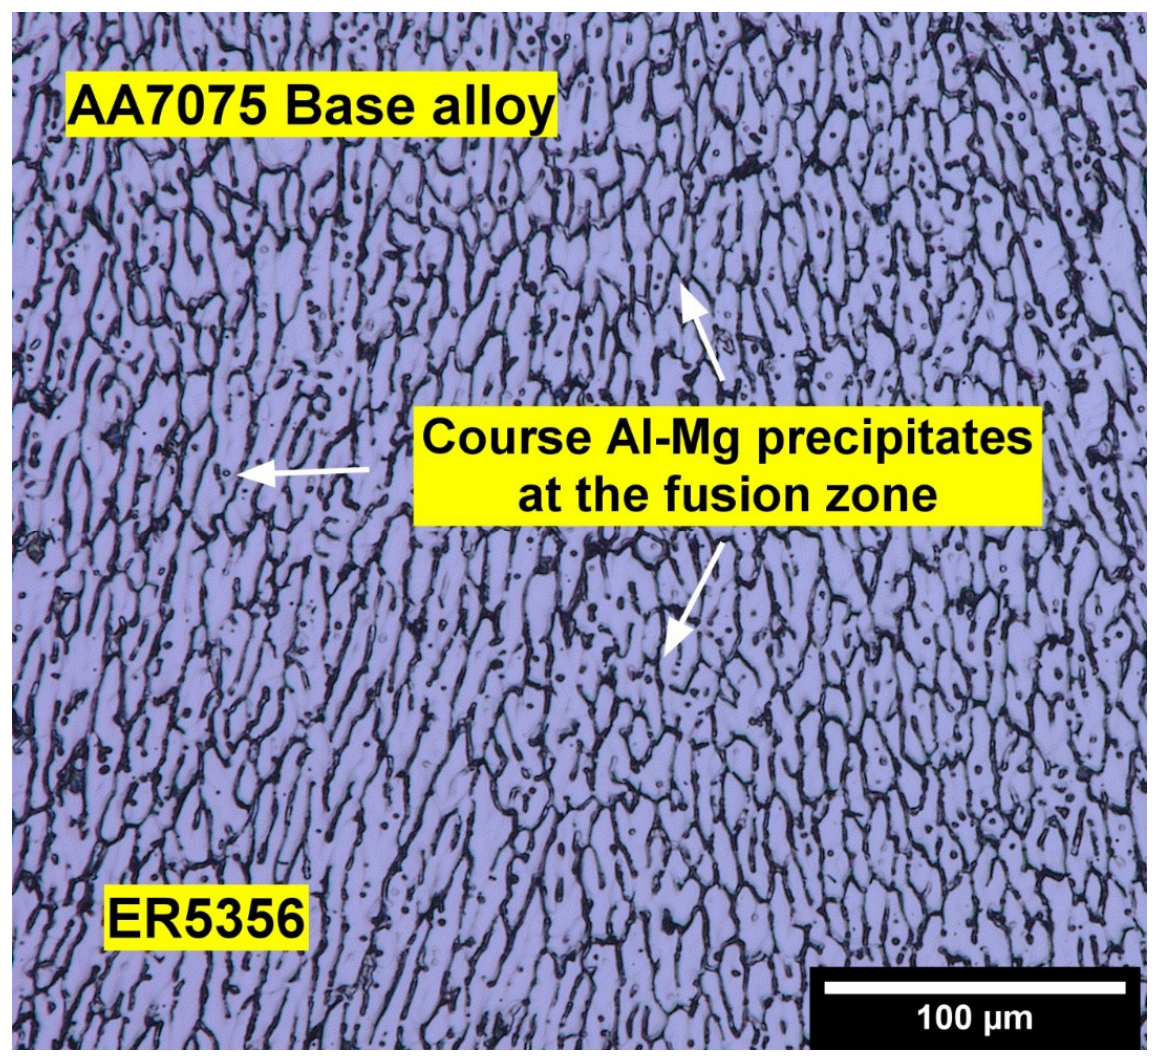
Figure 16 presents the FZ microstructure of AA7075 welded with ER5356. Coarse Al-Mg precipitates are formed near the weld interface, indicating slower local cooling and increased solidification time in this region. These coarse particles, together with the segregation of alloying elements, can reduce local ductility and facilitate crack initiation along grain boundaries, especially when combined with the macro- and micro-shrinkage features previously observed.
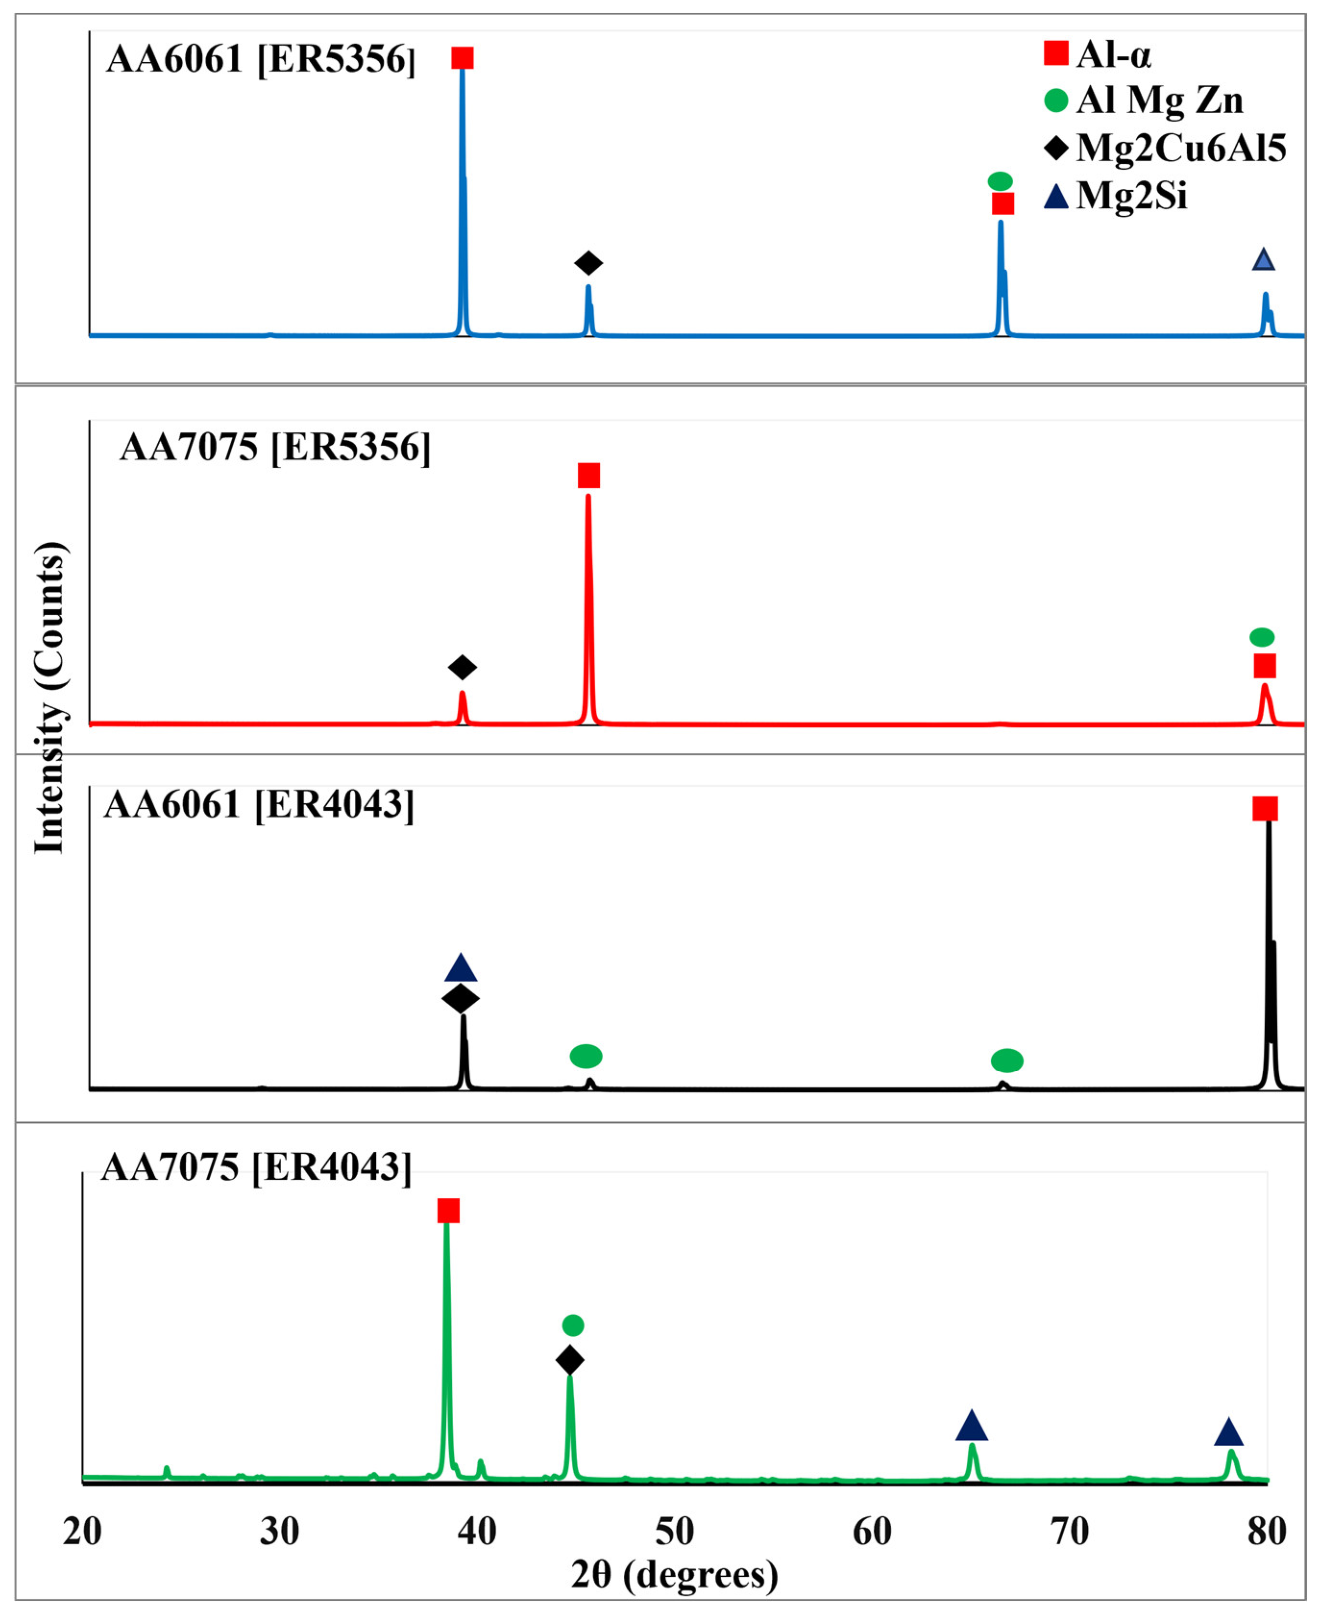
XRD analysis in
Figure 17 shows that the weld regions of AA6061 and AA7075 produced with ER5356 and ER4043 fillers are dominated by the α-Al matrix phase, as expected for welded aluminum alloys. Additional weak peaks were observed and tentatively assigned to possible secondary constituents such as Mg
2Si, Al-Mg-Zn-based intermetallics, and Mg-Cu-Al-containing phases, based on peak positions and comparison with the literature [
16,
43,
46,
47]. However, because aluminum welds may contain overlapping diffraction peaks and low-volume-fraction constituents, these assignments should be interpreted cautiously. Therefore, the XRD results are used only as supporting evidence for the presence of possible secondary constituents in the fusion zone, rather than as definitive quantitative phase identification. Differences in peak intensity indicate variations in the diffraction response of the weld regions; however, quantitative phase fractions were not determined in this study.
From an industrial perspective, the present results may provide useful comparative guidance for selecting filler metals and welding parameters when welding heat-treatable aluminum alloys such as AA6061 and AA7075. However, these findings were obtained using a highly restrained CPT configuration and should therefore be interpreted within the specific experimental conditions used in this study. Further validation using practical joint geometries, different restraint levels, and relevant service conditions is required before direct application to industrial welding procedures.
It should be noted that the CPT configuration provides a highly restrained welding condition that is useful for comparing solidification cracking susceptibility under controlled experimental conditions. However, the restraint level, weld geometry, and stress state in the CPT specimen may differ from those in real industrial joint configurations. Therefore, the present results should be interpreted as comparative cracking-susceptibility data within the tested CPT geometry, rather than as direct predictions for all practical welded structures. Because the CPT configuration is highly restrained, thermal contraction and residual stresses are expected to contribute to crack formation during solidification; however, residual stresses were not directly measured in this study and should be quantified in future work. Although welding speed and calculated heat input were correlated with the measured CCL values, direct cooling-rate measurements were not performed in this study; therefore, future work should include thermal-cycle measurement or numerical simulation to quantify the relationship between cooling rate and solidification cracking susceptibility.
In addition, the tensile, DIC, and detailed microstructural analyses were performed on selected specimens from the lowest-CCL conditions and are used to support the observed structure–property relationships rather than to provide a full statistical comparison across all welding parameters. Although local EDS elemental maps and area-scan measurements were obtained for selected capping and root regions, continuous elemental mapping across the entire weld cross-section was not performed in this study. Therefore, future work should include full cross-section elemental mapping and grain-size measurements to better clarify elemental redistribution, segregation during solidification, and the relationship between grain morphology, mechanical performance, and cracking susceptibility.