Article

Estimation of Burned Fuel Volumes in Heathland Ecosystems Using Multitemporal UAV LiDAR and Superpixel Classification

1
BIO-Research, PXL University College, 3590 Diepenbeek, Belgium
2
Division of Forest, Nature and Landscape, KU Leuven, 3001 Leuven, Belgium
3
Laboratory of Forest Management and Remote Sensing, Aristotle University of Thessaloniki, 54124 Thessaloniki, Greece
4
Centre for Environmental Sciences, Hasselt University, 3590 Diepenbeek, Belgium
*
Author to whom correspondence should be addressed.
Drones 2025, 9(9), 615; https://doi.org/10.3390/drones9090615
Submission received: 22 July 2025 / Revised: 28 August 2025 / Accepted: 29 August 2025 / Published: 1 September 2025
(This article belongs to the Special Issue Drones for Wildfire and Prescribed Fire Science)

Abstract

Highlights

What are the main findings?
  • UAV LiDAR allows us to distinguish between different fuel types and associated fuel consumption rates.
  • Fuel consumption rates of heather vegetation were significantly higher than those of nearby grass vegetation.
What are the implications of the main findings?
  • Such accurate and spatially explicit quantification can support the development of vegetation-specific prescribed burning protocols.
  • These results can be used to support the integration of prescribed burning in overall wildfire management.

Abstract

Accurate quantification of wildland fuel consumption is essential for effective fire management in Northern European heathland ecosystems, yet traditional assessment methods remain spatially limited and labour-intensive. This study combined multitemporal UAV LiDAR with SLIC superpixel-based classification to directly measure fuel consumption following a prescribed burn in a Belgian heathland. Pre- and post-fire LiDAR surveys were conducted to capture vegetation height changes. Superpixel segmentation successfully classified three vegetation types (grassland, heather and trees with understory vegetation) with 97.8% accuracy. Fuel consumption analysis revealed remarkable differences between vegetation types, with heather (mean ± SD: 0.165 ± 0.102 m) exhibiting the highest consumption compared to grass (0.089 ± 0.088 m) and tree understory vegetation (0.091 ± 0.068 m). Statistical analysis confirmed the significant differences between all vegetation types (p-value < 0.001). This methodology provides quantitative evidence for developing vegetation-specific burning protocols by demonstrating the critical importance of both pre- and post-fire remote sensing data. The approach demonstrates the effectiveness of UAV-based multitemporal LiDAR for precise fuel consumption assessment in heathland fire management.

1. Introduction

Wildfires are increasing globally in frequency, intensity and scale. In Europe, wildfire patterns are changing in frequency, intensity and timing. Climate projections indicate that wildfire risk will more than double by 2100 due to intensified droughts and reduced summer precipitation [1]. While wildfire is an ancient phenomenon and an intrinsic ecological process in many landscapes, rising temperatures and changing precipitation patterns, along with structural socio-ecological shifts, are altering traditional fire regimes across diverse ecosystems, including forests, shrublands, grasslands, peatlands, and urban areas [2].
The scale of this challenge is evident: in 2008 alone, 45,000 forest fires burnt around half a million hectares in southern Europe, causing severe ecological and socio-economic impacts [3]. More recently, the European Forest Fire Information System reported that areas burnt in central and northern Europe in the last decade were approximately 60 times larger than the average in the previous decade [4].
Traditional fire management approaches focused on suppression and are nowadays proving inadequate, as wildfire events increasingly exceed suppression capabilities. This has led to calls for a paradigm shift from fire resistance to landscape resilience, essentially, “living with fire” rather than fighting against it [5]. The European Union’s Climate Adaptation Strategy aims to make Europe resilient by 2050, recognizing fire management as a critical component of this goal.
At the landscape level, wildfire ignition and spread result from complex interactions between ignition sources, weather, topography, and land cover [2]. Crucially, land cover represents the only landscape variable influencing fire behaviour that can be directly manipulated through management interventions. Landscapes with continuous fuel loads are prone to large and/or high-intensity fires, whereas fragmented landscapes can limit fire spread, making landscape planning a critical tool for fire risk reduction [1]. In heathland systems, in particular, prescribed burning is typically used as a management activity for biodiversity conservation [6] and to reduce fire risks [7].
Accurate mapping of burnt areas and fuel loads is essential for understanding fire behaviour and emissions, yet fuel load estimation remains the largest source of uncertainty in fire modelling [8]. Traditional ground-based fuel assessment methods are labour-intensive and spatially limited, creating a need for innovative remote sensing approaches. Using pre- and post-fire remote sensing data to estimate consumption of different fuel components provides essential information for understanding biomass consumption and carbon emissions from wildfires. With both components, the full range of fuel consumption across wildland landscapes can be captured, making remote sensing a reliable approach, particularly valuable for adaptive fire management and intervention strategies [9].
Currently, there is a variety of remote sensing technologies, particularly Airborne Laser Scanning (ALS) and Unoccupied Aerial Vehicles (UAVs) equipped with LiDAR (Light Detection and Ranging) and multispectral sensors, offering promising solutions for fuel load mapping. Recent studies have shown to explain 14–71% of variance in fuel consumption with canopy fuel models, consistently outperforming subcanopy models [10]. Other UAV-based approaches have shown superior performance compared to traditional ALS methods with high-density point clouds (>150 points/m2), enabling detailed fuel characterization [11].
Despite all the recent advances, essential knowledge gaps remain in quantifying actual fuel consumption patterns across different vegetation types in European heathland ecosystems using multitemporal UAV LiDAR approaches. Most studies focus on fuel load estimation rather than direct consumption measurements. This paper addresses these gaps by combining pre- and post-fire UAV LiDAR surveys with RGB imagery to directly quantify fuel consumption following a prescribed burn in a Belgian heathland ecosystem. It is hypothesized that (1) superpixel-based classification will effectively identify the different heathland vegetation types using LiDAR-derived structural attributes and spectral data, and (2) structural variability among these vegetation types results in statistically significant differences in fuel consumption. This research provides critical insights for evidence-based prescribed burning strategies and landscape-scale fire management in temperate heathland ecosystems.

2. Materials and Methods

2.1. Study Area

This research was conducted at Mechelse Heide, a heathland ecosystem located on the Belgian Dutch border near Maasmechelen, in the eastern part of Belgium. The region of interest is 1.3 hectares within a larger 400-hectare heathland complex (Figure 1a). The terrain is characterized by relatively flat topography situated on sand deposits, which are typical for the region’s geological history and primarily consists of fluvial and aeolian sands [12]. The heathland vegetation consists primarily of three distinct vegetation types: grass (Molinia caerulea), heather shrubland (Calluna vulgaris), and scattered deciduous trees (mainly Quercus robur and Betula pendula) that were leafless during the study period in March 2025. This specific area was chosen due to its vegetation composition that is representative of the Northern Belgian heathland ecosystems and prescribed burning was executed by the land managers during the study period. In this study, it was chosen to align with the FirEUrisk fuel type classification scheme, which was recently proposed in the context of the FirEUrisk project [13], as part of the project’s overall goal of creating a European-integrated strategy for fire danger assessment, reduction, and adaptation. This scheme employs a hierarchical fuel classification scheme, which provides scalability, ensuring that more detailed or generalized classifications can be used depending on the spatial scale of interest for future research practices. As such, it is a multipurpose classification scheme, being able to accommodate different applications and at different spatial scales, whereas it generalizes all fuel type categories observed in the European continent. Considering the vegetation types of our study area, ‘grass’ is aligned to the ‘low grassland’ FirEUrisk fuel type (code: 31), ‘heather’ to the ‘low shrubland’ fuel type (code: 21) and the trees to the ‘open broadleaf deciduous forest’ one (code: 1121).

2.2. Prescribed Burning Operation

A controlled prescribed burn was conducted in March 2025 as part of routine ecological management practices, aimed at creating a heterogeneous landscape mosaic within the heathland ecosystem. The burning operation was executed under optimal weather conditions characterized by a rainless day with moderate wind conditions. Fire management protocols followed best practices, with ignition points strategically placed at the downwind edge of the treatment area (Southeastern area), allowing the fire to be pulled against the wind direction to maintain control and safety. The entire operation was supervised by certified firefighters and experienced nature managers to ensure both ecological objectives and safety standards were met (Figure 1b).
Two separate drone flights were conducted prior to the prescribed burn to capture baseline conditions. The first flight was conducted with a DJI Mavic 3T (M3T) system with an RGB camera, whereas the second employed a DJI M300 RTK drone carrying a YellowScan Surveyor Ultra (HESAI XT32M2X) LiDAR system. Both flights were executed at an altitude of 70 m above ground level with a flight speed of 5 m/s. During both flights, an RTK (Real-Time Kinematic) connection was established with the reference station network of the Flemish Positioning Service (FLEPOS). The M3T flight mission was set with a forward and side image overlap of 80%, while the LiDAR flight employed an overlap of 50%.
Post-fire data collection was conducted approximately one hour after the completion of the prescribed burn, maintaining identical flight parameters to ensure consistency with pre-fire acquisitions. During this flight, residual burning in portions of the study area created smoke plumes that were subsequently detected by the LiDAR sensor.

2.3. Initial Data Processing

The RGB imagery was processed using Pix4Dmapper software version 4.9.0 (Pix4D S.A., Lausanne, Switzerland) to generate orthomosaics of 20 × 20 cm resolution. The raw LiDAR point clouds were processed in sensor-specific YellowScan’s CloudStation software version 2409.0.0. The trajectory was postprocessed with Applanix’ POSPac MMS (version 8.9), which included the determination of the Smooth Best Estimated Trajectory (SBET) based upon the sensor’s lever arms and the local RTK network FLEPOS. After SBET processing, strip adjustment was performed based on the integrated ‘Robust’ method, and classification of the point cloud (ground vs. non-ground) was carried out with the default values of minimal object height (0.15 m) and point cloud thickness (0.10 m). Smoke contamination in the post-fire LiDAR dataset was effectively removed by filtering points with intensity values of zero, which corresponded to areas obscured by smoke plumes in R-software version 4.3.2 [14] through the lidR package [15].

2.4. Height Difference Calculation and Quality Control

Vegetation height changes were calculated by subtracting pre-fire vegetation heights from post-fire measurements. This was performed based on the corresponding canopy height models with the same resolution as the orthophoto (20 × 20 cm). However, several challenges emerged during this process, including apparent vegetation height increases (negative losses) caused by wind-induced movement between flights and potential co-registration errors between pre- and post-fire datasets. Additionally, extremely high vegetation loss values occurred where tree branches were captured in the initial flight but absent in the post-fire acquisition, likely due to natural movement. These problematic values were identified and removed from the dataset by assigning NA values to affected pixels, ensuring data quality and analytical reliability. This paper relates the fuel consumption volume to the difference in vegetation height before and after burning. If using these variables and relate them to the pixel size, in this case 0.04 m2, then the fuel consumption volume can be calculated by Equation (1):
F C V = C H P r e f i r e C H P o s t f i r e     ×   a r e a
with FCV as the Fuel Consumption Volume, CH as the Canopy Height, either pre-fire and post-fire and the area, being 0.04 m 2 with this project’s properties.

2.5. Fuel Type Classification Using Superpixel Analysis

Fuel type classification was implemented using the supercells package in R, which employs the Simple Linear Iterative Clustering (SLIC) algorithm to generate superpixels based on spectral similarity and spatial proximity. The superpixel approach was chosen to reduce computational complexity while preserving ecologically meaningful spatial patterns in the multispectral data by using the supercells package [16]. The input image consisted of the pre-fire RGB values and the normalized vegetation height. The algorithm was configured with 10,000 superpixels and a compactness parameter of 10, with these values selected to balance computational efficiency with spatial detail retention. This approach was visually validated and deemed suitable.
Following superpixel generation, k-means clustering was applied to the extracted RGB and height values to identify three distinct vegetation types: grassland, heather shrubland, and deciduous trees. This method has been proven to be a good method of classifying high-resolution imagery as it significantly reduces the mixed pixel problem suffered by most pixel-based methods by treating objects as aggregations of spatially proximate pixels rather than individual pixels [17]. The selection of three clusters was based on the distinct fuel characteristics and ecological functions of the three main vegetation types within the heathland: Grass (Molinia caerulea), Heather (Calluna vulgaris) and trees. Classification accuracy was assessed using 229 randomly distributed ground truth points collected across the study area, with 37 points representing trees, 93 points for grassland areas, and 99 points for heather shrubs. These points were used to generate confusion matrices and calculate overall classification accuracy, producer’s accuracy, and user’s accuracy for each vegetation class. The validation process employed spatial join operations to assign predicted vegetation classes to ground truth locations, followed by statistical analysis using the caret package in R-software [18].

2.6. Statistical Analysis

Burnt volume differences between fuel types were analyzed using non-parametric statistical tests due to the non-normal distribution of the data. Kruskal–Wallis tests were employed to assess overall differences between vegetation types, followed by post hoc Dunn’s test using the Benjamini–Hochberg adjustment. All statistical analyses were conducted in R, with significance levels set at p = 0.05.

3. Results

3.1. Superpixel Generation and Vegetation Classification

The superpixel algorithm successfully segmented the 1.3-hectare study area into 2,580 distinct superpixels, each representing homogeneous areas based on height and spectral similarity and spatial proximity. The k-means clustering analysis of the four normalized input variables (red, green, blue, and vegetation height) resulted in three distinct vegetation clusters with markedly different characteristics. Analysis of the cluster centres demonstrated clear differentiation between vegetation types, based on both spectral and structural properties (Table 1). Cluster 1, subsequently classified as low-vegetation (grass), exhibited moderate spectral values and low height. Cluster 2, identified as high-vegetation (trees), showed similar spectral characteristics to grass but was distinguished by greater height. Cluster 3, representing heather shrubs, displayed the lowest spectral reflectance values across all visible bands, combined with low height, consistent with the darker, denser canopy structure typical of heather vegetation.

3.2. Classification Accuracy Assessment

The vegetation classification achieved a high accuracy when validated against 229 ground truth points distributed across the study area. The overall classification accuracy reached 97.8% (95% CI: 94.96–99.28%) with a Kappa coefficient of 0.965, indicating almost perfect agreement between predicted and actual vegetation classes.
Class-specific performance varied slightly among vegetation types. Tree classification demonstrated the highest sensitivity (97.9%) but experienced minor confusion with heather (2 misclassifications). Grass classification achieved perfect specificity and positive predictive value (100%) with high sensitivity (91.9%), with only 3 grass areas misclassified. Heather classification performed exceptionally well with perfect sensitivity (100%) and high specificity (96.9%), though 4 heather areas were misclassified as other vegetation types.
The confusion matrix revealed that most classification errors occurred between heather and other vegetation types, with minimal confusion between grass and trees. This pattern suggests that the spectral characteristics of heather vegetation occasionally overlap with grass and tree signatures, particularly in transition zones or areas with mixed vegetation composition.

3.3. Spatial Distribution of Vegetation Types

The classified vegetation map reveals a heterogeneous landscape mosaic typical of heathland ecosystems (Figure 2). Heather dominated the study area, comprising the largest number of superpixels (1.527, which accounted for 8.015 m2), followed by grass (878 pixels, resulting in 4.115 m2) and tree areas (175, resulting in 694 m2). The spatial arrangement showed distinct patches of each vegetation type rather than a random distribution, reflecting the natural ecological patterns and management history of the site.

3.4. Burnt Volume Analysis

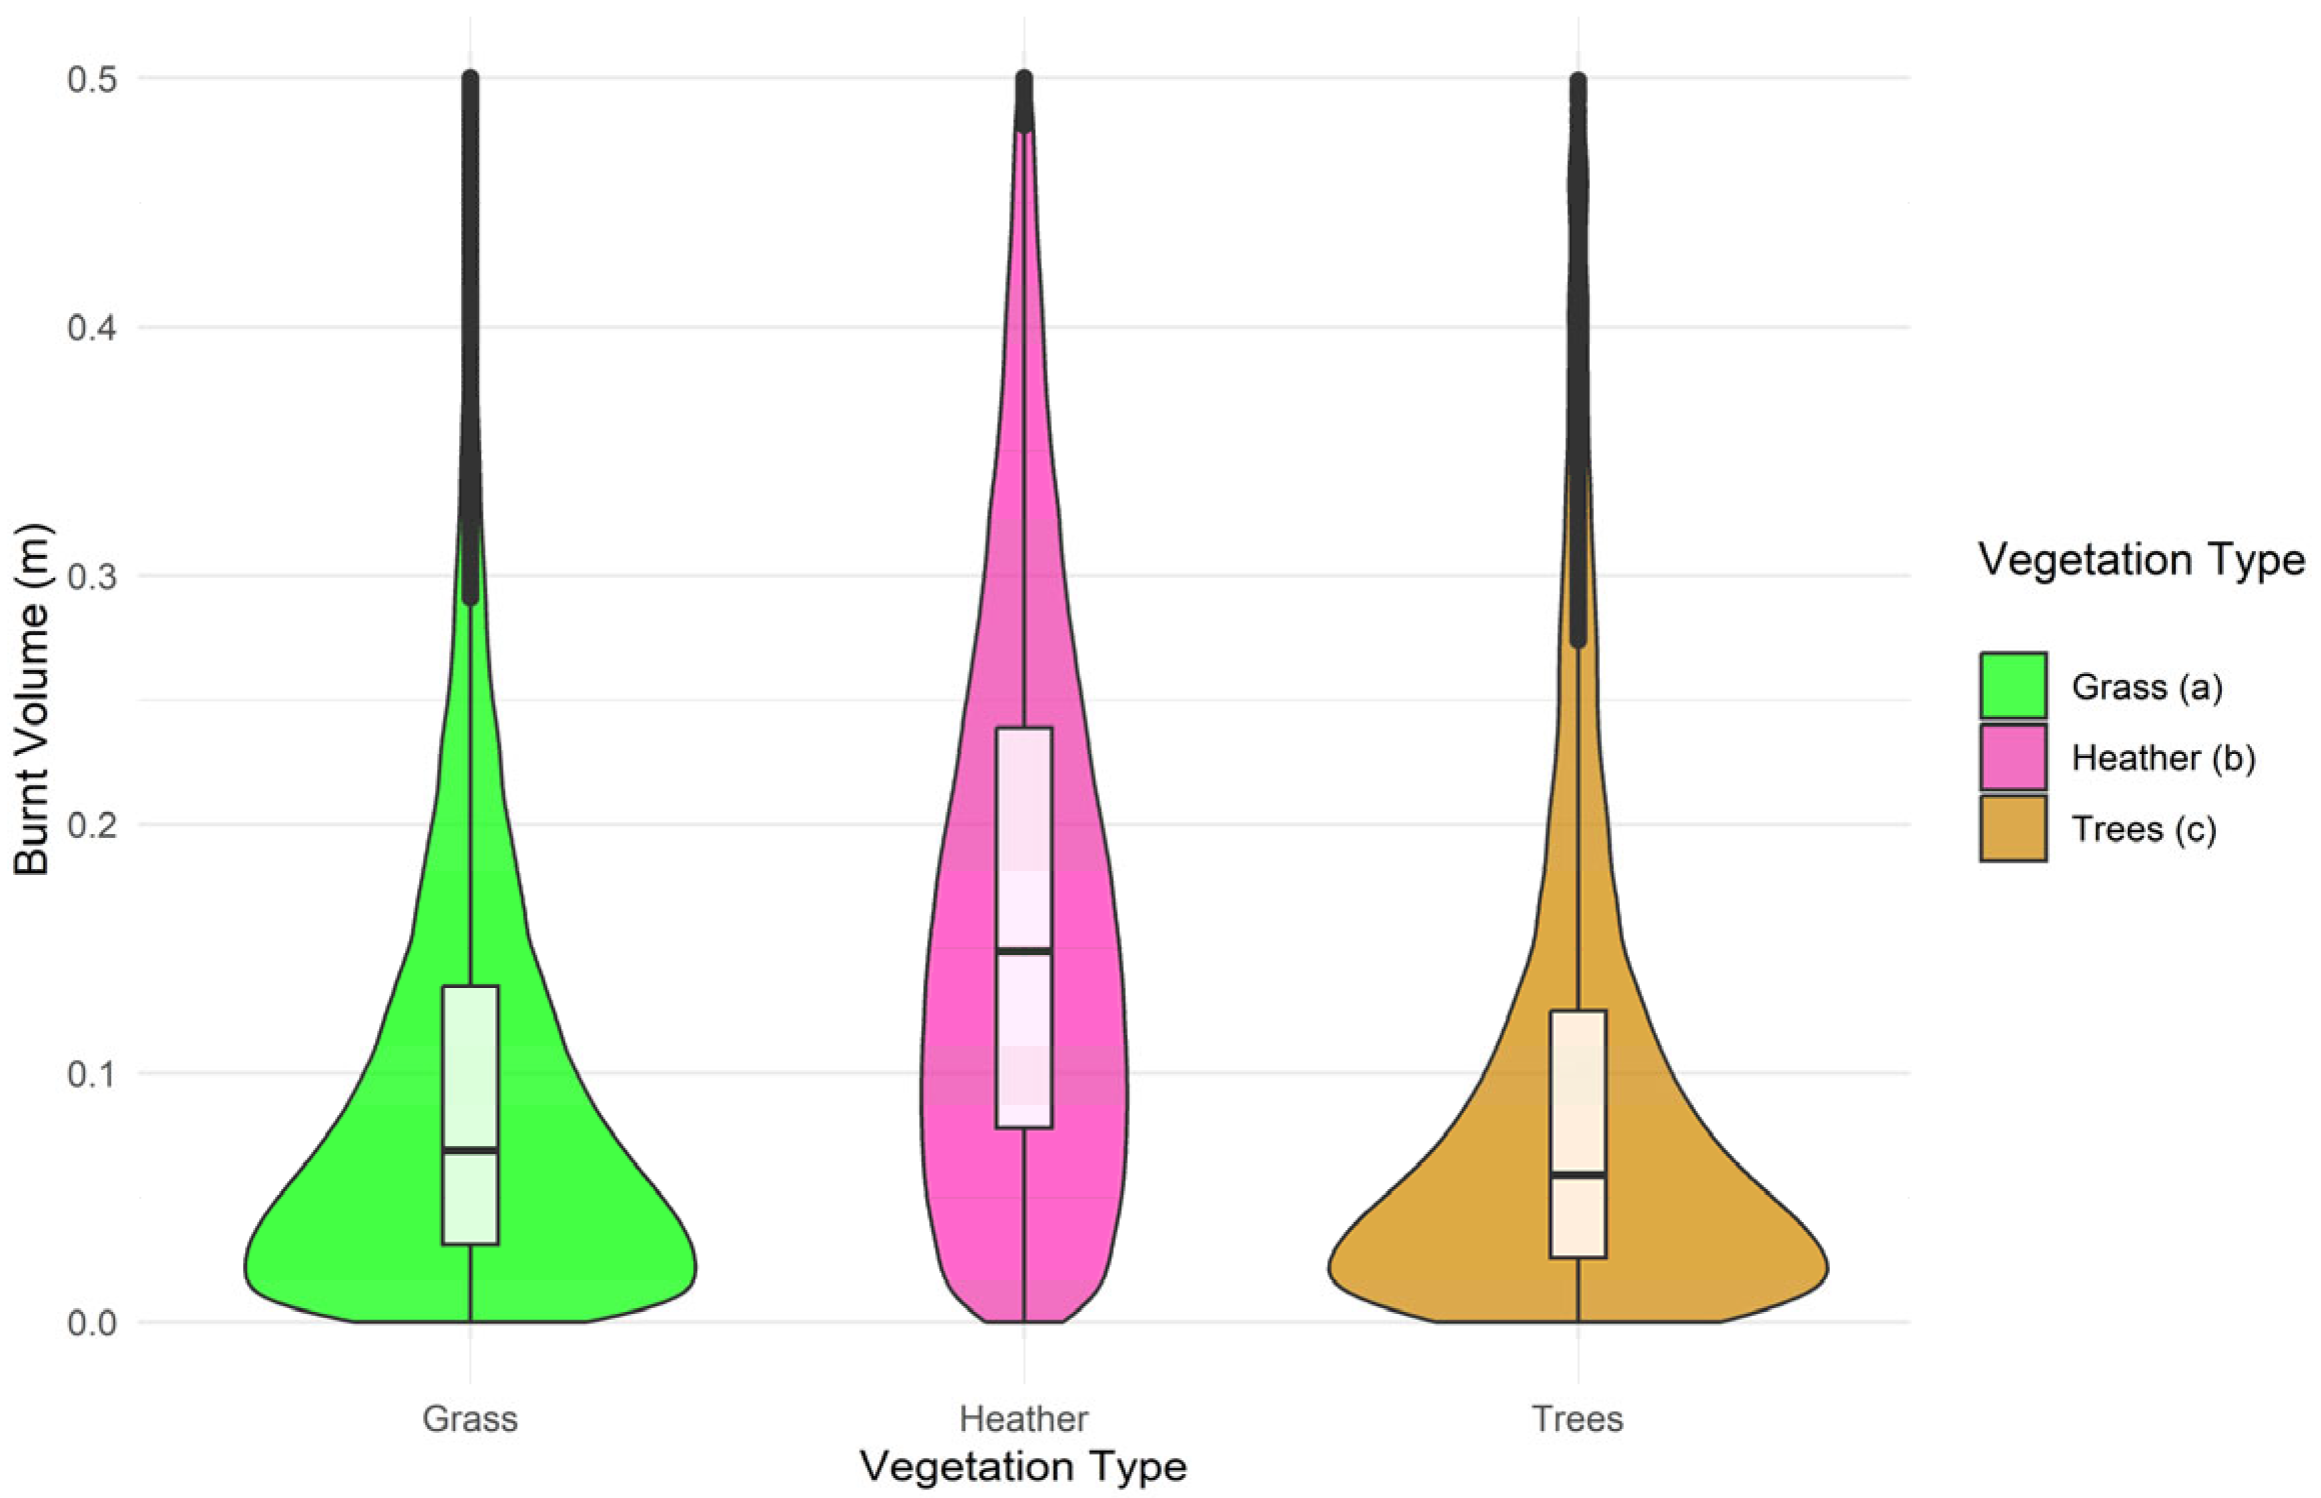
Analysis of fuel consumption patterns revealed remarkable differences between vegetation types in terms of burnt volume. When applying a 0.5 m threshold to remove extreme outliers (Figure 3), heather vegetation exhibited the highest mean fuel consumption (mean ± SD: 0.168 ± 0.113 m), followed by trees (0.097 ± 0.090 m) and grass (0.096 ± 0.103 m). The median values followed a similar pattern, with heather showing 0.149 m of fuel consumption compared to 0.069 m for trees and 0.059 m for grass.
The distribution of burnt volume values differed markedly between vegetation types. Heather demonstrated the most consistent burning pattern with relatively high median values and moderate variability (Figure 4 and Table 2). In contrast, both grass and tree areas showed highly skewed distributions with many areas experiencing minimal fuel consumption but occasional patches of high burning intensity.
The Kruskal–Wallis test revealed significant differences in fuel consumption between vegetation types (χ2 = 25,518, df = 2, p < 0.001). Post hoc pairwise multiple comparisons using Dunn’s mean rank sum tests with Benjamini–Hochberg correction demonstrated that all three vegetation types differed significantly from each other in terms of burnt volume. Specifically, heather exhibited significantly higher fuel consumption than both grass (p < 0.001) and trees (p < 0.001). Additionally, a significant difference was detected between grass and tree fuel consumption (p < 0.001), though the magnitude of this difference was smaller than the differences involving heather.

3.5. Data Quality Considerations

The analysis required substantial data filtering to ensure reliable fuel consumption estimates. Initially, 82,438 observations (representing 0.33 ha of the 1.3 ha study area) were excluded due to co-registration issues, wind effects during data collection, or smoke contamination in the post-fire dataset. The remaining dataset contained 320,588 pixels for analysis. Further filtering was applied to remove extreme values by retaining only burnt volume measurements between 0 and 0.5 m, which resulted in the exclusion of an additional 8446 datapoints. The impact of this filtering varied by vegetation type: trees retained 6545 of 17,355 original datapoints (62.3% data loss), heather retained 163,858 of 200,363 datapoints (18.2% data loss), and grass areas retained 67,747 of 102,870 datapoints (34.1% data loss). The differential data loss across vegetation types reflects varying measurement challenges, with trees experiencing the highest proportion of extreme or unreliable values. While this data cleaning was essential for ensuring reliable fuel consumption estimates, it may have introduced bias by potentially excluding areas with extreme burning conditions or significant measurement challenges, particularly affecting the representativeness of grass vegetation analysis.

4. Discussion

This study aimed to develop and validate a UAV-based approach for directly quantifying wildland fuel consumption patterns across different vegetation types in heathland ecosystems following prescribed burning. One key finding is that heather shrubs consumed significantly more fuel (mean: 0.168 m) compared to grassland (0.096 m) and trees (0.097 m), providing the first direct measurements of differential fuel consumption in Belgian heathlands. This quantitative evidence of vegetation-specific burning patterns has important implications for management strategies, as it enables managers to predict and plan for heterogeneous fuel consumption across heathland landscapes. In addition, it demonstrates the potential of UAV data for detailed mapping of the variety in fuel types within a heathland system. The successful integration of multitemporal UAV LiDAR with superpixel-based classification offers a scalable methodology that can inform evidence-based prescribed burning protocols and improve fuel load assessments for wildfire risk management in temperate European heathlands.

4.1. Effectiveness of Superpixel-Based Vegetation Classification

The exceptional classification accuracy achieved in this study (97.8% overall accuracy, Kappa = 0.965) demonstrates the effectiveness of superpixel-based approaches for vegetation discrimination in heathland ecosystems. Zhang et al. (2016) achieved similar promising results using spatial contextual superpixel models for roadside vegetation classification, demonstrating the effectiveness of superpixel-based approaches [19]. These studies both align with the growing recognition that superpixels can achieve better perceptual representation of images than pixels by adhering to natural image boundaries [20].
The high accuracy obtained in this study can be attributed to several factors. Firstly, the integration of structural (height) along with Red, Green and Blue (RGB) information provided complementary data for vegetation discrimination, consistent with established principles in vegetation mapping, where integration of environmental variables with satellite images enhances regional-scale vegetation classification [21]. Furthermore, the distinct normalized height differences between trees and grass or heather provided a clear structural separator, while the RGB differences enabled discrimination between grass and heather shrubs with similar heights. Future research should include systematic comparison with traditional supervised classification approaches using RGB data alone to quantify the specific contribution of structural information to classification accuracy and validate the added value of the multisensor integration.

4.2. LiDAR-Based Fuel Consumption Assessment

The findings suggest that heather vegetation exhibited significantly higher fuel consumption (0.168 ± 0.113 m) compared to grass (0.096 ± 0.103 m) and trees (0.097 ± 0.090 m) and align with the already established understanding of heathland fire behaviour. In heather-dominated temperate peatland and heathlands, both dead and live vegetation are important for wildfire ignition and spread, with live fuels often comprising the largest component of the fuel load [22,23]. This higher fuel consumption in heather areas reflects the dense, continuous fuel structure characteristic of mature heather stands. The similarity in fuel consumption between grass and tree fuel types can be explained by the conditions set during the prescribed burning. This controlled setting prevented the trees from burning, while only the grasses present in the understory were burnt.
The successful application of LiDAR for fuel consumption quantification supports the growing body of literature demonstrating LiDAR’s effectiveness for fire-related applications. Studies have demonstrated that especially airborne LiDAR has proven useful for landscape-scale fuel load and consumption mapping by directly sensing variation in vegetation height and density [24], while other research has shown the potential of LiDAR data for accurately estimating fine dead fuel loads in forest ecosystems [25]. The pre- and post-fire LiDAR approach in this study extends this capability to direct measurement of actual fuel consumption rather than just fuel load estimation.

4.3. Methodological Considerations and Data Quality

Several limitations of this study should be acknowledged. The relatively small study area (1.3 ha) limits the generalizability of the findings to larger heathland landscapes with greater environmental heterogeneity. Vegetation mapping accuracy is often scale-dependent, with challenges arising from the composite nature of pixels in large-scale mapping applications [26]. Future research should test this methodology across larger and more diverse heathland systems to validate its broader applicability.
Additionally, the temporal aspects of fuel consumption could be better characterized through additional post-fire monitoring campaigns. Multitemporal LiDAR acquisitions can capture heterogeneity in fuel loads and consumption patterns, providing insights into recovery dynamics and long-term ecosystem responses to prescribed burning [24]. Another limitation linked with the fuel load estimation of this study is the absence of ground reference measurements. Future studies should prioritize collecting field measurements of pre- and post-fire fuel depths to validate the innovative method of remote sensing-derived consumption estimates and establish the relationship between LiDAR-measured height differences and actual biomass loss.
The substantial data loss (82,446 observations, approximately 25% of total data) due to co-registration issues, wind effects, and smoke contamination represents a significant methodological challenge that warrants further discussion. Similar challenges have been documented in Mediterranean forest recovery studies, where LiDAR-derived forest variables extrapolated to multispectral imagery achieved moderate accuracy with R2 values ranging from 0.51 to 0.74 [27]. Remarkably, trees experienced the highest data loss (62.3%), primarily due to wind-induced branch movement during the brief period between pre- and post-fire data collection. Given the high spatial resolution (1.69 cm), even minor branch displacement exceeded the pixel resolution, resulting in inconsistent detection of the same branch locations across temporal acquisitions. The removed data is linked to the 0.5m threshold that was established based on the distributional analysis of heather vegetation outliers. Threshold sensitivity analysis could influence the number of removed observations along all vegetation types. While this study successfully demonstrated the potential of multitemporal UAV LiDAR for fuel consumption assessment, future studies could incorporate ground reference measurements to evaluate the elevation accuracy. This wind-induced movement between flights and potential co-registration errors highlight the importance of optimal data collection conditions and robust processing workflows for multitemporal LiDAR analysis.
The normalization approach applied in this study, where RGB values remained in their original 0–255 range while height was normalized, may have introduced bias in the clustering analysis. Accurate vegetation mapping requires careful consideration of data preprocessing methods, as different sensors have different spatial, temporal, spectral and radiometric characteristics that influence classification outcomes [21]. Future studies should implement consistent scaling approaches across all variables to ensure equal contribution to clustering algorithms.

4.4. Implications for Fire Management in Heathland Ecosystems

The differential fuel consumption patterns identified between vegetation types have important implications for prescribed burning strategies in heathland management. Cross-landscape fuel moisture content and fuel characteristics are highly variable but not considered in existing fire danger assessments, making spatially explicit fuel characterization critical for understanding wildland fire behaviour in fire-prone environments [28]. The results from this study suggest that heather-dominated areas may require different burning prescriptions and monitoring protocols compared to grassland or tree-dominated areas.
The spatial distribution of high fuel consumption areas identified through this study’s approach could inform adaptive management strategies. Recent research has demonstrated that forest structure varies significantly in response to fire frequency, with frequent fire reducing vegetation structural complexity [29]. Understanding these patterns at the landscape scale enables area management to design burning rotations that maintain desired habitat mosaics, which is essential in heathland management [30] while minimizing fire risk. These quantitative consumption measurements provide critical calibration data for shrubland fuel category in the FirEUrisk classification. By integrating the consumption values with the standardized FirEUrisk fuel type framework, fire spread models can be parameterized with more accurate fuel consumption coefficients for Northern European heathlands.

4.5. Broader Implications and Applications

While this study demonstrates the effectiveness of UAV-based multitemporal LiDAR for wildland fuel consumption assessment in controlled prescribed burns, the practical challenge of predicting wildfire locations for pre-fire data collection limits direct application to unplanned fires. However, existing digital elevation models offer promising alternatives for broader implementation. While the temporal resolution may be insufficient for capturing rapid vegetation changes, such datasets could serve as baseline elevation models for post-fire fuel consumption assessment when combined with high-resolution post-fire UAV surveys. Similarly, emerging satellite-based LiDAR missions like GEDI offer global coverage at lower spatial resolution, potentially suitable for landscape-scale fuel consumption studies [31]. Furthermore, the integration of hyperspectral imagery with LiDAR data shows another promising pathway for further research, as the enhanced spectral resolution could improve fuel type classification beyond the RGB-based approach, particularly for distinguishing between vegetation types with similar structural characteristics but different spectral properties [32]. Along with the recent advances in UAV technologies such as battery management systems, modelling approaches, state estimations and fault diagnosis [33], larger areas can be investigated with a higher accuracy.
The methodology developed here shows a potential for broader applications across various vegetation types and ecosystems beyond heathlands. The combination of superpixel-based classification, combined with the direct measurement capabilities of multitemporal UAV LiDAR, could be adapted to various fuel types such as grasslands, forests and peatland or different landscape contexts. However, implementation requires validation of fuel consumption relationships and adjustment of classification parameters to accommodate different vegetation structures and spectral characteristics.
This work has great societal implications for fire management and environmental monitoring across Europe. The results show that this near-real-time fuel consumption mapping approach following wildfires could inform post-fire rehabilitation priorities, helping land managers identify areas requiring immediate intervention versus leaving it as natural recovery zones. Insurance companies could utilize quantified fuel consumption data for more accurate risk assessment and damage evaluation in wildland-urban interfaces, while carbon accounting programs could benefit from precise biomass loss measurements, supporting climate change mitigation efforts and carbon credit systems. The approach also supports emergency response coordination by providing rapid assessment of burnt area severity, enabling more effective allocation of firefighting resources during active incidents and guiding post-fire flood and erosion risk assessment.
The spatial fuel consumption data generated by this methodology could enhance existing fire danger rating systems by providing ground-truth data for fuel load models. Current fire danger assessments rely heavily on weather and general vegetation classifications, but spatially explicit fuel consumption patterns could improve the accuracy of fire behaviour predictions and risk assessments at local scales.

5. Conclusions

This study demonstrates that combining multitemporal UAV LiDAR with superpixel-based classification effectively quantifies wildland fuel consumption patterns in heathland ecosystems. The superpixel approach achieved high classification accuracy (97.8%) in distinguishing between grassland, heather shrubs and trees, confirming the first hypothesis. Significant differences in fuel consumption between vegetation types supported the second hypothesis. Heather vegetation showed the highest fuel consumption, significantly exceeding grass and trees. This reflects the dense fuel structure of mature heather stands and provides quantitative evidence for developing vegetation-specific burning protocols. The pre- and post-fire LiDAR approach shows promising results in estimating fuel consumption, offering a valuable tool for fire management.

Author Contributions

Conceptualization, A.W.V.H., S.O., W.D.W., K.V.M., D.S., I.G. and A.C.; methodology, A.W.V.H., A.C. and S.O.; software, A.W.V.H.; validation, A.W.V.H., D.S. and W.D.W.; formal analysis, A.W.V.H. and S.O.; resources, S.O., K.V.M., I.G. and D.S.; data curation, A.W.V.H.; writing—original draft preparation, A.W.V.H.; writing—review and editing, A.W.V.H., S.O., W.D.W., K.V.M., D.S., I.G. and A.C.; visualization, A.W.V.H. and W.D.W.; supervision, S.O., K.V.M., I.G. and D.S.; project administration, A.C. and S.O.; funding acquisition, S.O., K.V.M., I.G. and D.S. All authors have read and agreed to the published version of the manuscript.

Funding

This research was funded by the Belgian Federal Science Policy Office (BELSPO) in the framework of the STEREO IV program: project FUELFUSION (grant number: SR/00/421).

Data Availability Statement

The data presented in this study are not publicly available due to ongoing research using the same datasets.

Acknowledgments

We acknowledge the Agency of Nature and Forest and fire district Brandweerzone Oost-Limburg for safely executing the prescribed burn. We would like to thank Rúna Magnússon from Wageningen University for her valuable suggestions and feedback.

Conflicts of Interest

The authors declare no conflicts of interest.

References

  1. Elmqvist, T.; Valkó, O.; Stoof, C.; Akala, T.; Arianoutsou, M.; Arsava, K.; Ascoli, D.; Bengtsson, J.; Castro, R.; Engelbrecht, J.; et al. Changing Wildfires: Policy Options for a Fire-Literate and Fire-Adapted Europe; EASAC Secretariat: Vienna, Austria, 2025. [Google Scholar]
  2. Pausas, J.G.; Keeley, J.E. Wildfires and Global Change. Front. Ecol. Environ. 2021, 19, 387–395. [Google Scholar] [CrossRef]
  3. Moreira, F.; Viedma, O.; Arianoutsou, M.; Curt, T.; Koutsias, N.; Rigolot, E.; Barbati, A.; Corona, P.; Vaz, P.; Xanthopoulos, G.; et al. Landscape—Wildfire Interactions in Southern Europe: Implications for Landscape Management. J. Environ. Manage 2011, 92, 2389–2402. [Google Scholar] [CrossRef]
  4. San-Miguel-Ayanz, J.; Durrant, T.; Boca, R.; Libertà, G.; Branco, A.; de Rigo, D.; Ferrari, D.; Maianti, P.; Vivancos, T.A.; Oom, D.; et al. Forest Fires in Europe, Middle East and North Africa 2018; Publications Office of the European Union: Luxembourg, 2019; ISBN 9789276112334. [Google Scholar]
  5. Stoof, C.R.; Kettridge, N. Living with Fire and the Need for Diversity. Earth’s Futur. 2022, 10, e2021EF002528. [Google Scholar] [CrossRef]
  6. Smith, B.M.; Carpenter, D.; Holland, J.; Andruszko, F.; Gathorne-Hardy, A.; Eggleton, P. Resolving a Heated Debate: The Utility of Prescribed Burning as a Management Tool for Biodiversity on Lowland Heath. J. Appl. Ecol. 2023, 60, 2040–2051. [Google Scholar] [CrossRef]
  7. Valkó, O.; Török, P.; Deák, B.; Tóthmérész, B. Review: Prospects and Limitations of Prescribed Burning as a Management Tool in European Grasslands. Basic Appl. Ecol. 2014, 15, 26–33. [Google Scholar] [CrossRef]
  8. Eames, T.; Russell-Smith, J.; Yates, C.; Edwards, A.; Vernooij, R.; Ribeiro, N.; Steinbruch, F.; van der Werf, G.R. Instantaneous Pre-Fire Biomass and Fuel Load Measurements from Multi-Spectral UAS Mapping in Southern African Savannas. Fire 2021, 4, 2. [Google Scholar] [CrossRef]
  9. McCarley, T.R.; Hudak, A.T.; Sparks, A.M.; Vaillant, N.M.; Meddens, A.J.H.; Trader, L.; Mauro, F.; Kreitler, J.; Boschetti, L. Estimating Wildfire Fuel Consumption with Multitemporal Airborne Laser Scanning Data and Demonstrating Linkage with MODIS-Derived Fire Radiative Energy. Remote Sens. Environ. 2020, 251, 112114. [Google Scholar] [CrossRef]
  10. McCarley, T.R.; Hudak, A.T.; Bright, B.C.; Cronan, J.; Eagle, P.; Ottmar, R.D.; Watts, A.C. Generating Fuel Consumption Maps on Prescribed Fire Experiments from Airborne Laser Scanning. Int. J. Wildl. Fire 2024, 33, WF23160. [Google Scholar] [CrossRef]
  11. Rodríguez-Puerta, F.; Ponce, R.A.; Pérez-Rodríguez, F.; Águeda, B.; Martín-García, S.; Martínez-Rodrigo, R.; Lizarralde, I. Comparison of Machine Learning Algorithms for Wildland-Urban Interface Fuelbreak Planning Integrating Als and Uav-Borne Lidar Data and Multispectral Images. Drones 2020, 4, 21. [Google Scholar] [CrossRef]
  12. Oosterlynck, P.; De Becker, P.; Denys, L.; Packet, J.; Vandekerkhove, K. PAS-GEBIEDSANALYSE in Het Kader van Herstelmaatregelen Voor BE2200035 Mechelse Heide En Vallei van de Ziepbeek; INBO: Brussel, Belgium, 2018. [Google Scholar]
  13. Aragoneses, E.; García, M.; Salis, M.; Ribeiro, L.M.; Chuvieco, E. Classification and Mapping of European Fuels Using a Hierarchical, Multipurpose Fuel Classification System. Earth Syst. Sci. Data 2023, 15, 1287–1315. [Google Scholar] [CrossRef]
  14. R Core Team. R: A Language and Environment for Statistical Computing; R Core Team: Vienna, Austria, 2023. [Google Scholar]
  15. Roussel, J.; Auty, D.; Coops, N.; Tompalski, P.; Goodbody, T.; Meador, A.; Bourdon, J.; de Boissieu, F.; Achim, A. LidR: An R Package for Analysis of Airborne Laser Scanning (ALS) Data. Remote Sens. Environ. 2020, 251, 112061. [Google Scholar] [CrossRef]
  16. Nowosad, J.; Stepinski, T.F. Extended SLIC Superpixels Algorithm for Applications to Non-Imagery Geospatial Rasters. Int. J. Appl. Earth Obs. Geoinf. 2022, 112, 102935. [Google Scholar] [CrossRef]
  17. Usman, B. Elixir Satellite Imagery Land Cover Classification Using K-Means Clustering Algorithm Computer Vision for Environmental Information Extraction. Sci. Engg 2013, 63, 18671–18675. [Google Scholar]
  18. Kuhn, M. Building Predictive Models in R Using the Caret Package. J. Stat. Softw. 2008, 28, 1–26. [Google Scholar] [CrossRef]
  19. Zhang, L.; Verma, B.; Stockwell, D. Spatial Contextual Superpixel Model for Natural Roadside Vegetation Classification. Pattern Recognit. 2016, 60, 444–457. [Google Scholar] [CrossRef]
  20. MDPI. Remote Sensing: Special Issue Superpixel Based Analysis and Classification of Remote Sensing Images. Available online: https://www.mdpi.com/journal/remotesensing/special_issues/Superpixel_based_Analysis_and_Classification (accessed on 3 July 2025).
  21. Xie, Y.; Sha, Z.; Yu, M. Remote Sensing Imagery in Vegetation Mapping: A Review. J. Plant Ecol. 2008, 1, 9–23. [Google Scholar] [CrossRef]
  22. Davies, G.M.; Legg, C.J. Developing a Live Fuel Moisture Model for Moorland Fire Danger Rating. WIT Trans. Ecol. Environ. 2008, 119, 225–236. [Google Scholar] [CrossRef]
  23. Davies, G.M.; Legg, C.J. Regional Variation in Fire Weather Controls the Reported Occurrence of Scottish Wildfires. PeerJ 2016, 4, e2649. [Google Scholar] [CrossRef]
  24. Bright, B.C.; Hudak, A.T.; McCarley, T.R.; Spannuth, A.; Sánchez-López, N.; Ottmar, R.D.; Soja, A.J. Multitemporal Lidar Captures Heterogeneity in Fuel Loads and Consumption on the Kaibab Plateau. Fire Ecol. 2022, 18, 1–16. [Google Scholar] [CrossRef]
  25. Martin-Ducup, O.; Dupuy, J.L.; Soma, M.; Guerra-Hernandez, J.; Marino, E.; Fernandes, P.M.; Just, A.; Corbera, J.; Toutchkov, M.; Sorribas, C.; et al. Unlocking the Potential of Airborne LiDAR for Direct Assessment of Fuel Bulk Density and Load Distributions for Wildfire Hazard Mapping. Agric. For. Meteorol. 2024, 362, 110341. [Google Scholar] [CrossRef]
  26. Foody, G.M. Land Cover Classification Accuracy Assessment. Springer Geogr. 2001, 80, 105–118. [Google Scholar] [CrossRef]
  27. Viana-Soto, A.; García, M.; Aguado, I.; Salas, J. Assessing Post-Fire Forest Structure Recovery by Combining LiDAR Data and Landsat Time Series in Mediterranean Pine Forests. Int. J. Appl. Earth Obs. Geoinf. 2022, 108, 102754. [Google Scholar] [CrossRef]
  28. Walsh, J.; Wuebbles, D.; Hayhoe, K.; Kossin, J.; Kunkel, K.; Stephens, G.; Thorne, P.; Vose, R.; Wehner, M.; Willis, J.; et al. Chapter 2: Our Changing Climate. In Climate Change Impacts in the United States: The Third National Climate Assessment; U.S. Government Printing Office: Washington, DC, USA, 2014; pp. 19–67. [Google Scholar]
  29. Loudermilk, E.L.; Hiers, J.K.; Pokswinski, S.; O’Brien, J.J.; Barnett, A.; Mitchell, R.J. The Path Back: Oaks (Quercus spp.) Facilitate Longleaf Pine (Pinus Palustris) Seedling Establishment in Xeric Sites. Ecosphere 2016, 7, e01361. [Google Scholar] [CrossRef]
  30. Davies, G.M.; Kettridge, N.; Stoof, C.R.; Gray, A.; Ascoli, D.; Fernandes, P.M.; Marrs, R.; Allen, K.A.; Doerr, S.H.; Clay, G.D.; et al. The Role of Fire in UK Peatland and Moorland Management: The Need for Informed, Unbiased Debate. Philos. Trans. R. Soc. B Biol. Sci. 2016, 371, 20150342. [Google Scholar] [CrossRef]
  31. Leite, R.V.; Silva, C.A.; Broadbent, E.N.; do Amaral, C.H.; Liesenberg, V.; de Almeida, D.R.A.; Mohan, M.; Godinho, S.; Cardil, A.; Hamamura, C.; et al. Large Scale Multi-Layer Fuel Load Characterization in Tropical Savanna Using GEDI Spaceborne Lidar Data. Remote Sens. Environ. 2022, 268, 112764. [Google Scholar] [CrossRef]
  32. Lou, C.; Al-Qaness, M.A.A.; Al-Alimi, D.; Dahou, A.; Elaziz, M.A.; Abualigah, L.; Ewees, A.A. Land use/land cover (LULC) classification using hyperspectral images: A review. Geo-Spat. Inf. Sci. 2025, 28, 345–386. [Google Scholar] [CrossRef]
  33. Zhao, T.; Zhang, Y.; Wang, M.; Feng, W.; Cao, S.; Wang, G. A Critical Review on the Battery System Reliability of Drone Systems. Drones 2025, 9, 539. [Google Scholar] [CrossRef]
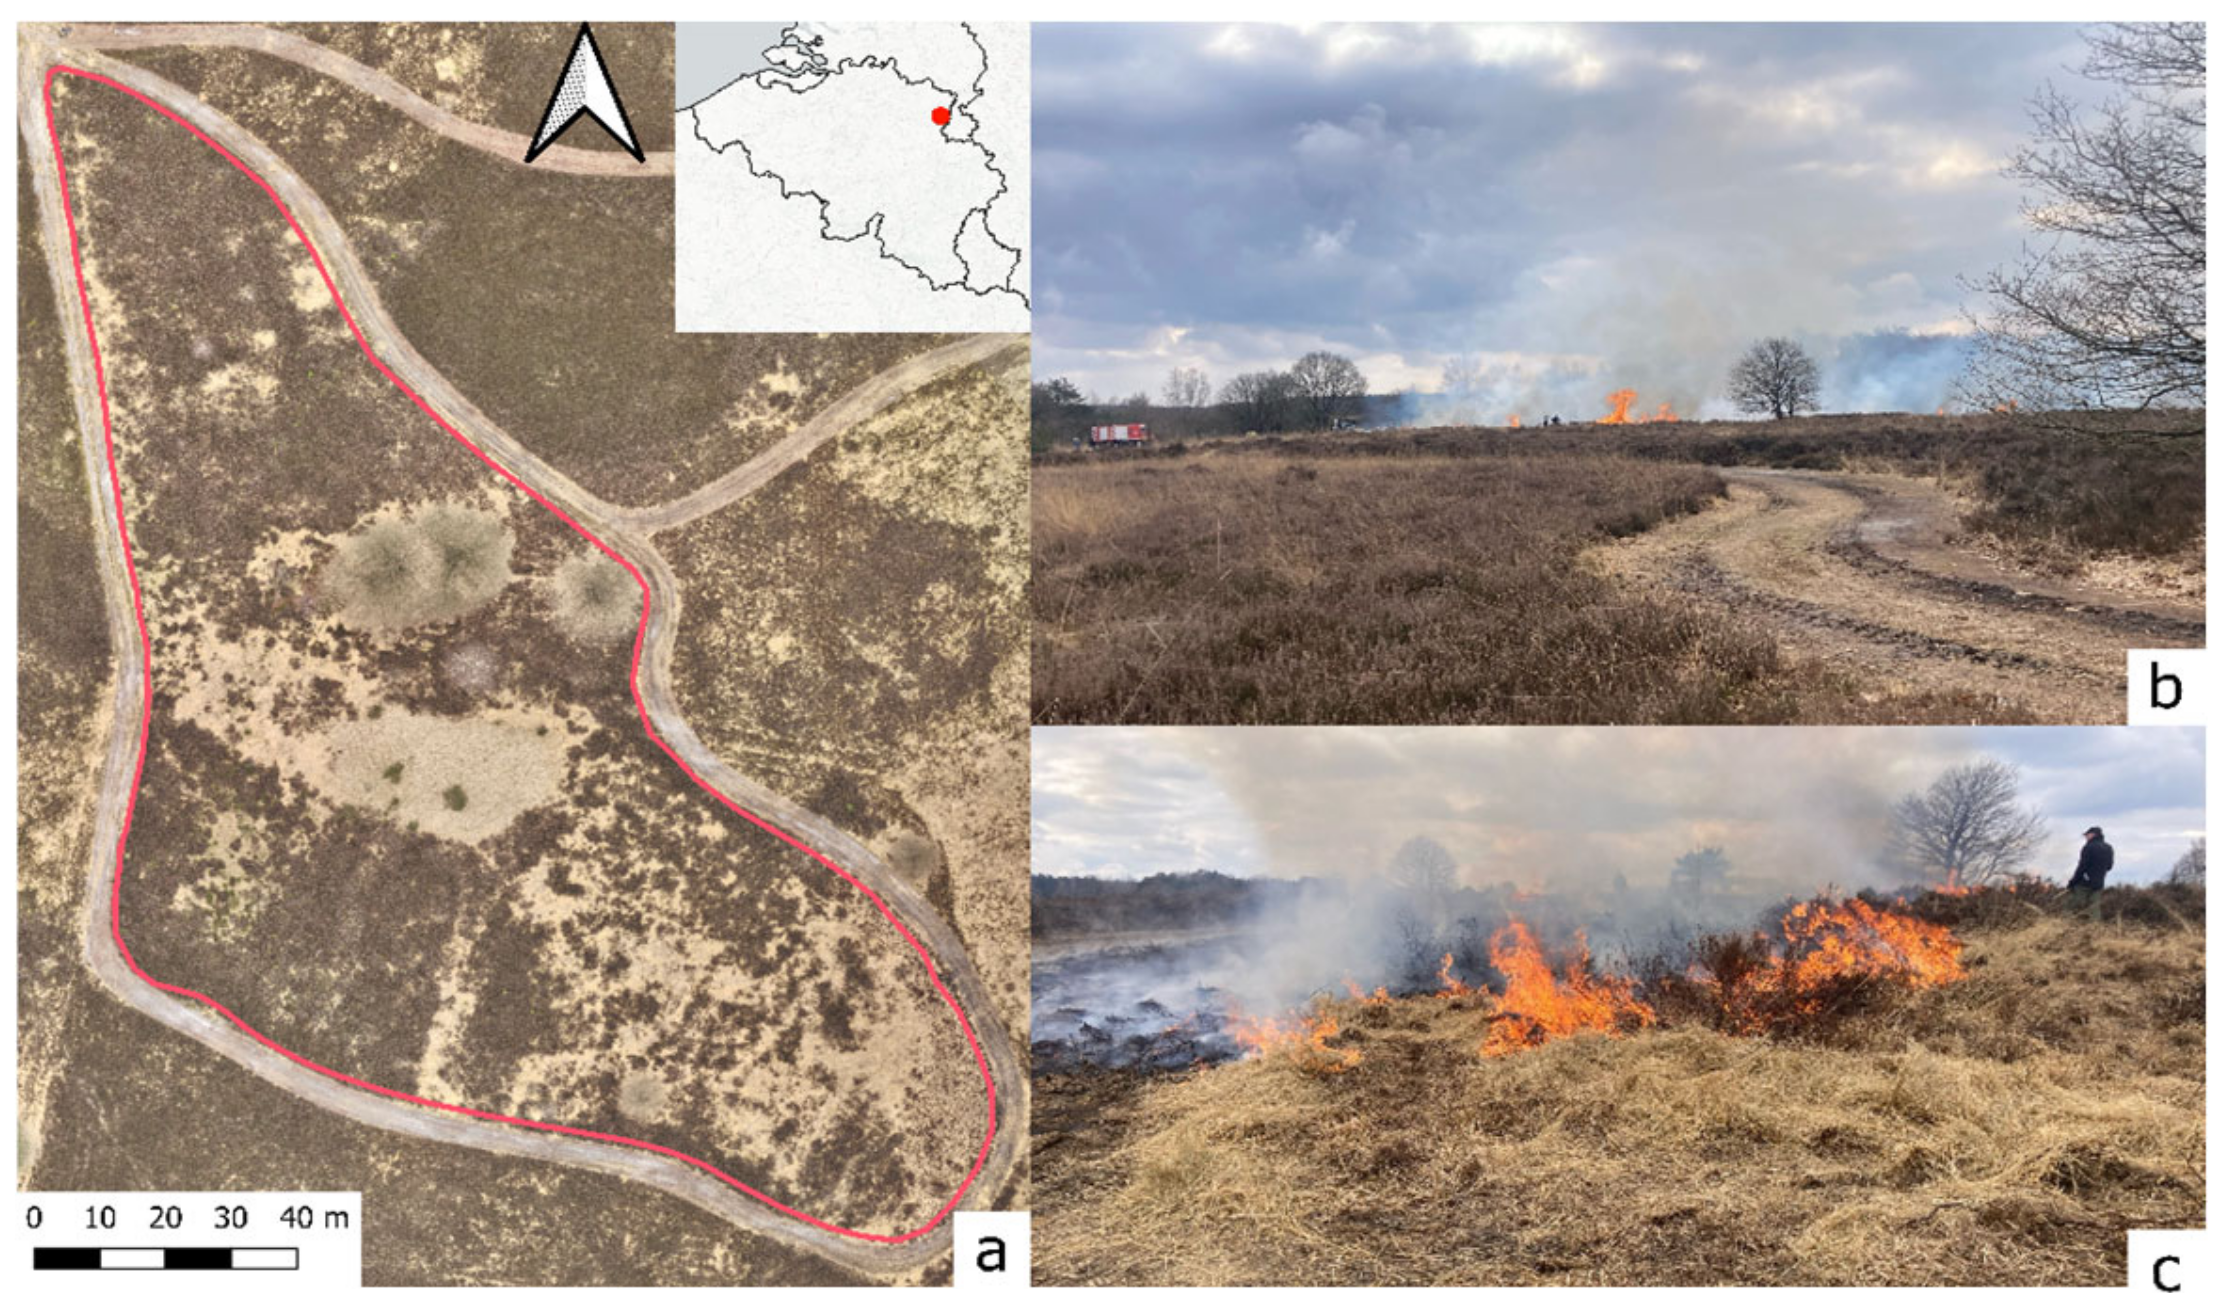
Figure 1. (a) Study area (red line) located in the Mechelse Heide, east of Belgium (b,c) In field picture from the prescribed fire, ignited at the downwind edge of the treated area and pulled in against the wind.
Drones 09 00615 g001
Figure 2. Vegetation identification based on superpixels showing in total 2580 superpixels with a combined area of 12,824 m2. This figure shows the dominant heather (pink coloured) spread out the study area followed by grass (green) and trees (brown) only occurring locally.
Drones 09 00615 g002
Figure 3. Comparing the raw biomass burnt values with the filtered burnt values at 0.5 m. (a) the original burnt values have a continuous distribution across the study region with seemingly high burnt values within the centre and some darker areas spread out. (b) Comparing the original data with the filtered data reveals blank areas which indicates the presence of unnatural values or outliers. These areas are mostly located in the centre where the trees and grass occur when comparing it with Figure 2.
Drones 09 00615 g003
Figure 4. Looking at the distribution of the burnt volume per vegetation type, grass and trees seem to have a similar, more dense distribution with lower valued outliers compared to heather. This vegetation type has a steadier distribution with higher valued outliers (thick black line) along with a higher median value, indicated by the box and line, for burnt volume. All three vegetation types differed significantly, indicated by the labels a, b and c. The effects of the filtering can be seen by the abrupt stop of the distribution of burnt volume in each of the vegetation types.
Drones 09 00615 g004
Table 1. Cluster analysis based on the superpixel properties of the three vegetation types (mean ± Standard Deviation). The Red, Green and Blue band values are represented on a scale from 0 to 255 with the vegetation height in metres.
Vegetation ClusterRed BandGreen BandBlue BandVegetation Height (m)
Cluster 1
Grass
134.4 ± 17.0112.8 ± 15.3 94.2 ± 12.20.29 ± 0.49
Cluster 2
Trees
175.4 ± 20.3155.1 ± 20.2130.6 ± 17.810.6 ± 2.87
Cluster 3
Heather
201.6 ± 19.6176.8 ± 18.9146.1 ± 16.90.33 ± 0.71
Table 2. Description of burnt material per vegetation type for 95% CI (Confidence Interval).
Vegetation ClusterCount (Pixels)Mean (95%)Median (95%)SD (95%)
Cluster 1
Grass
67,7470.0910.0910.068
Cluster 2
Trees
65450.0890.0590.088
Cluster 3
Heather
163,8580.1650.1400.102
Disclaimer/Publisher’s Note: The statements, opinions and data contained in all publications are solely those of the individual author(s) and contributor(s) and not of MDPI and/or the editor(s). MDPI and/or the editor(s) disclaim responsibility for any injury to people or property resulting from any ideas, methods, instructions or products referred to in the content.