Figure 1.
Variations in cardboard targets placed on the environmental background typically encountered in the performed database collection.
Figure 1.
Variations in cardboard targets placed on the environmental background typically encountered in the performed database collection.
Figure 2.
Examples of photographed targets at different GSDs and flight speeds. (a) The GSD is 0.83 cm/px, and the flight speed is 1.20 m/s; (b) the GSD is 2.19 cm/px, and the flight speed is 1.10 m/s; and (c) the GSD is 1.59 cm/px, and the flight speed is 9.00 m/s. The size of each image is 100 × 100 pixels.
Figure 3.
Comparison of YOLOv8 and YOLOv11 detection results. The top row (a–d) shows the detections obtained using YOLOv8, while the bottom row (e–h) presents the detections obtained using YOLOv11. The blue rectangles show the YOLO model detections, while the red rectangles show the manually marked real targets.
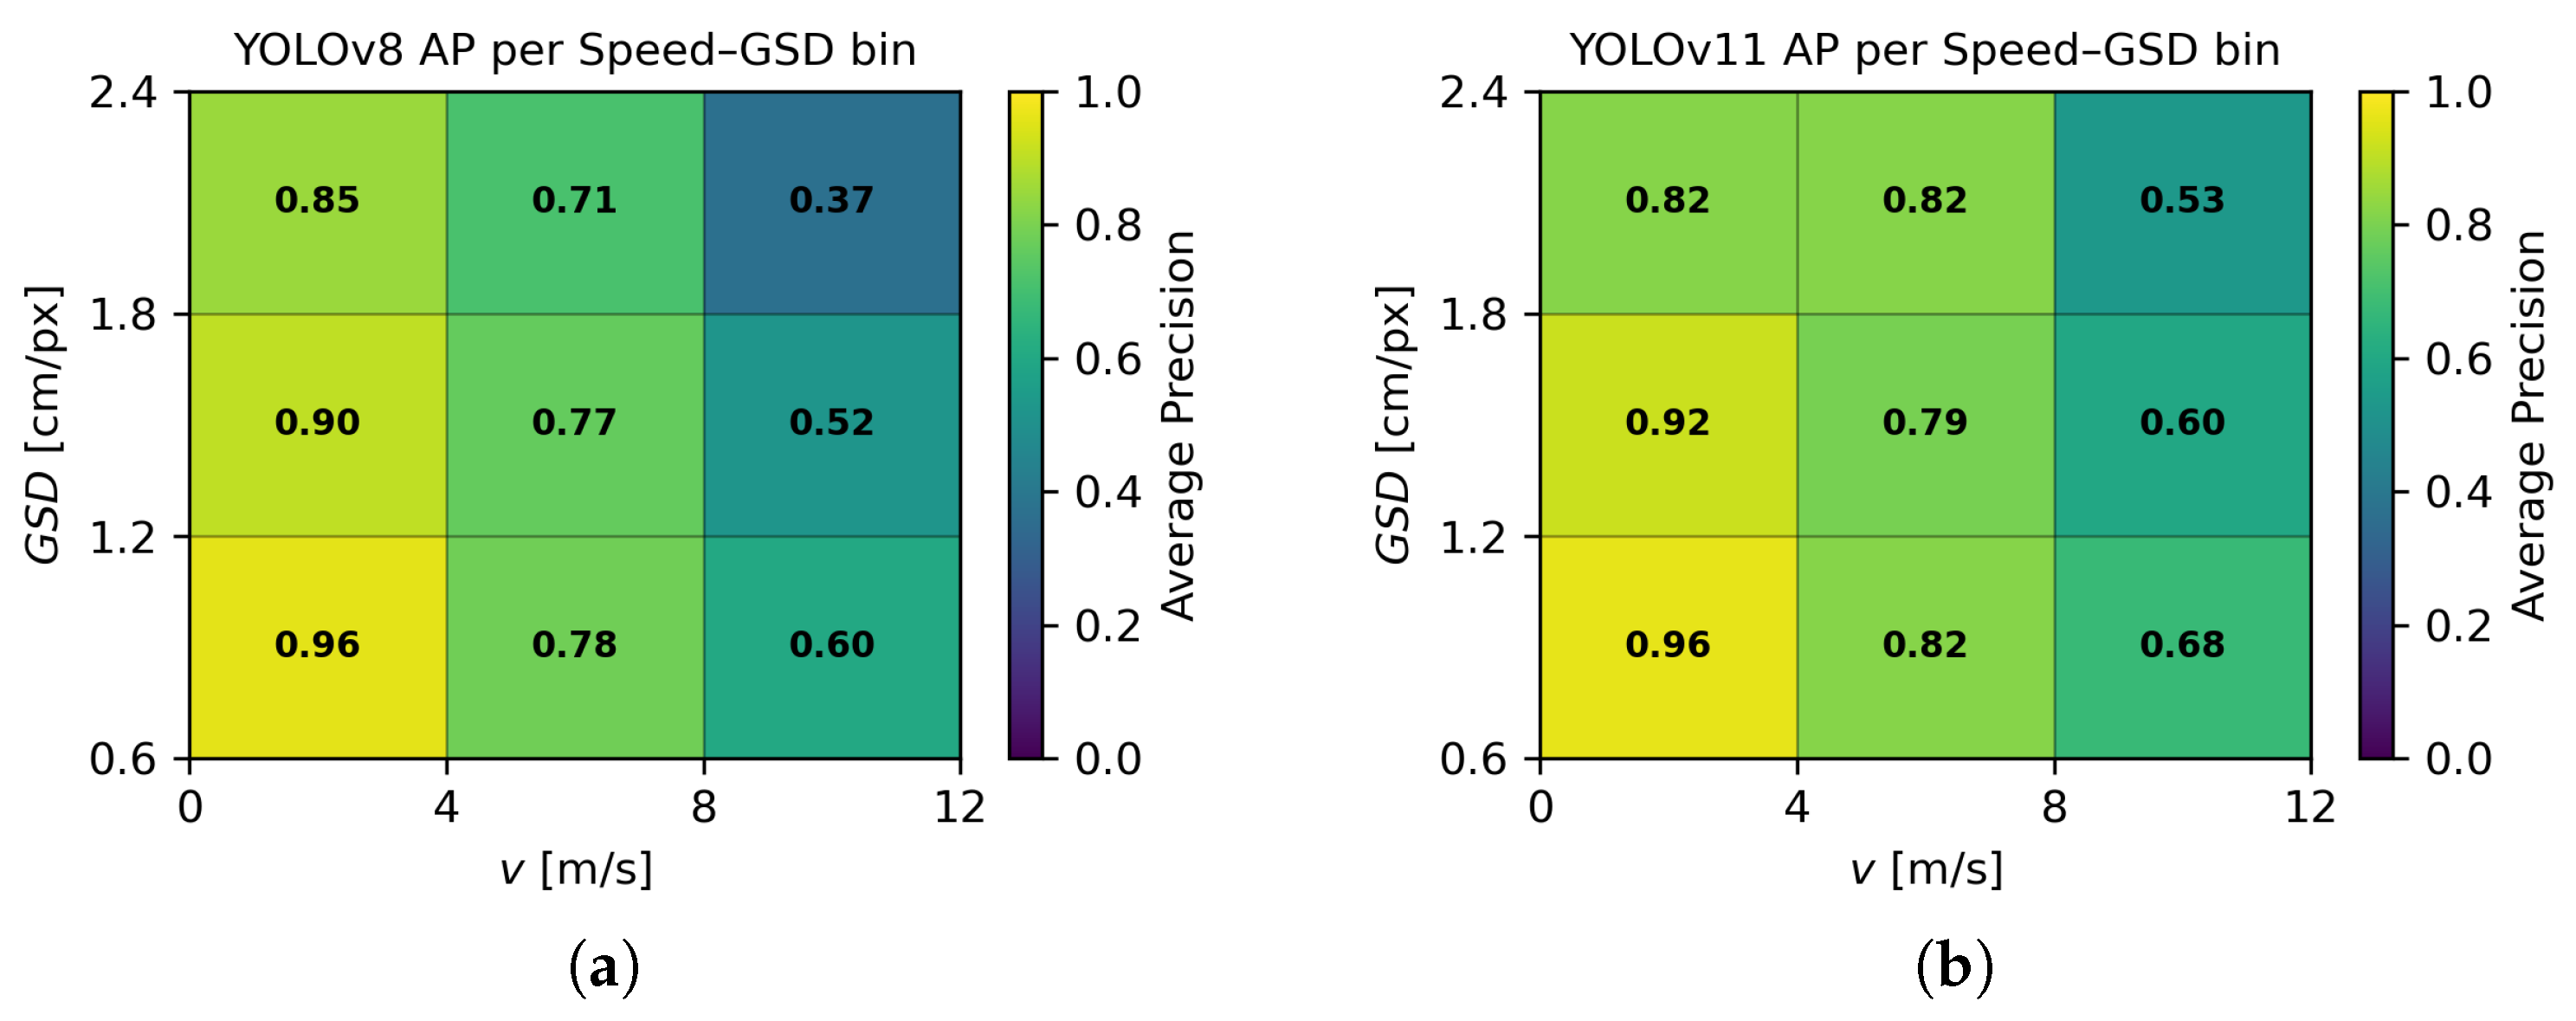
Figure 4.
AP analysis across bins of speed and GSD values for YOLOv8 (a) and YOLOv11 (b).
Figure 4.
AP analysis across bins of speed and GSD values for YOLOv8 (a) and YOLOv11 (b).
Figure 5.
The geometry of the camera’s fields of view and the coverage area with and without overlapping sequential images taken by the UAV.
Figure 5.
The geometry of the camera’s fields of view and the coverage area with and without overlapping sequential images taken by the UAV.
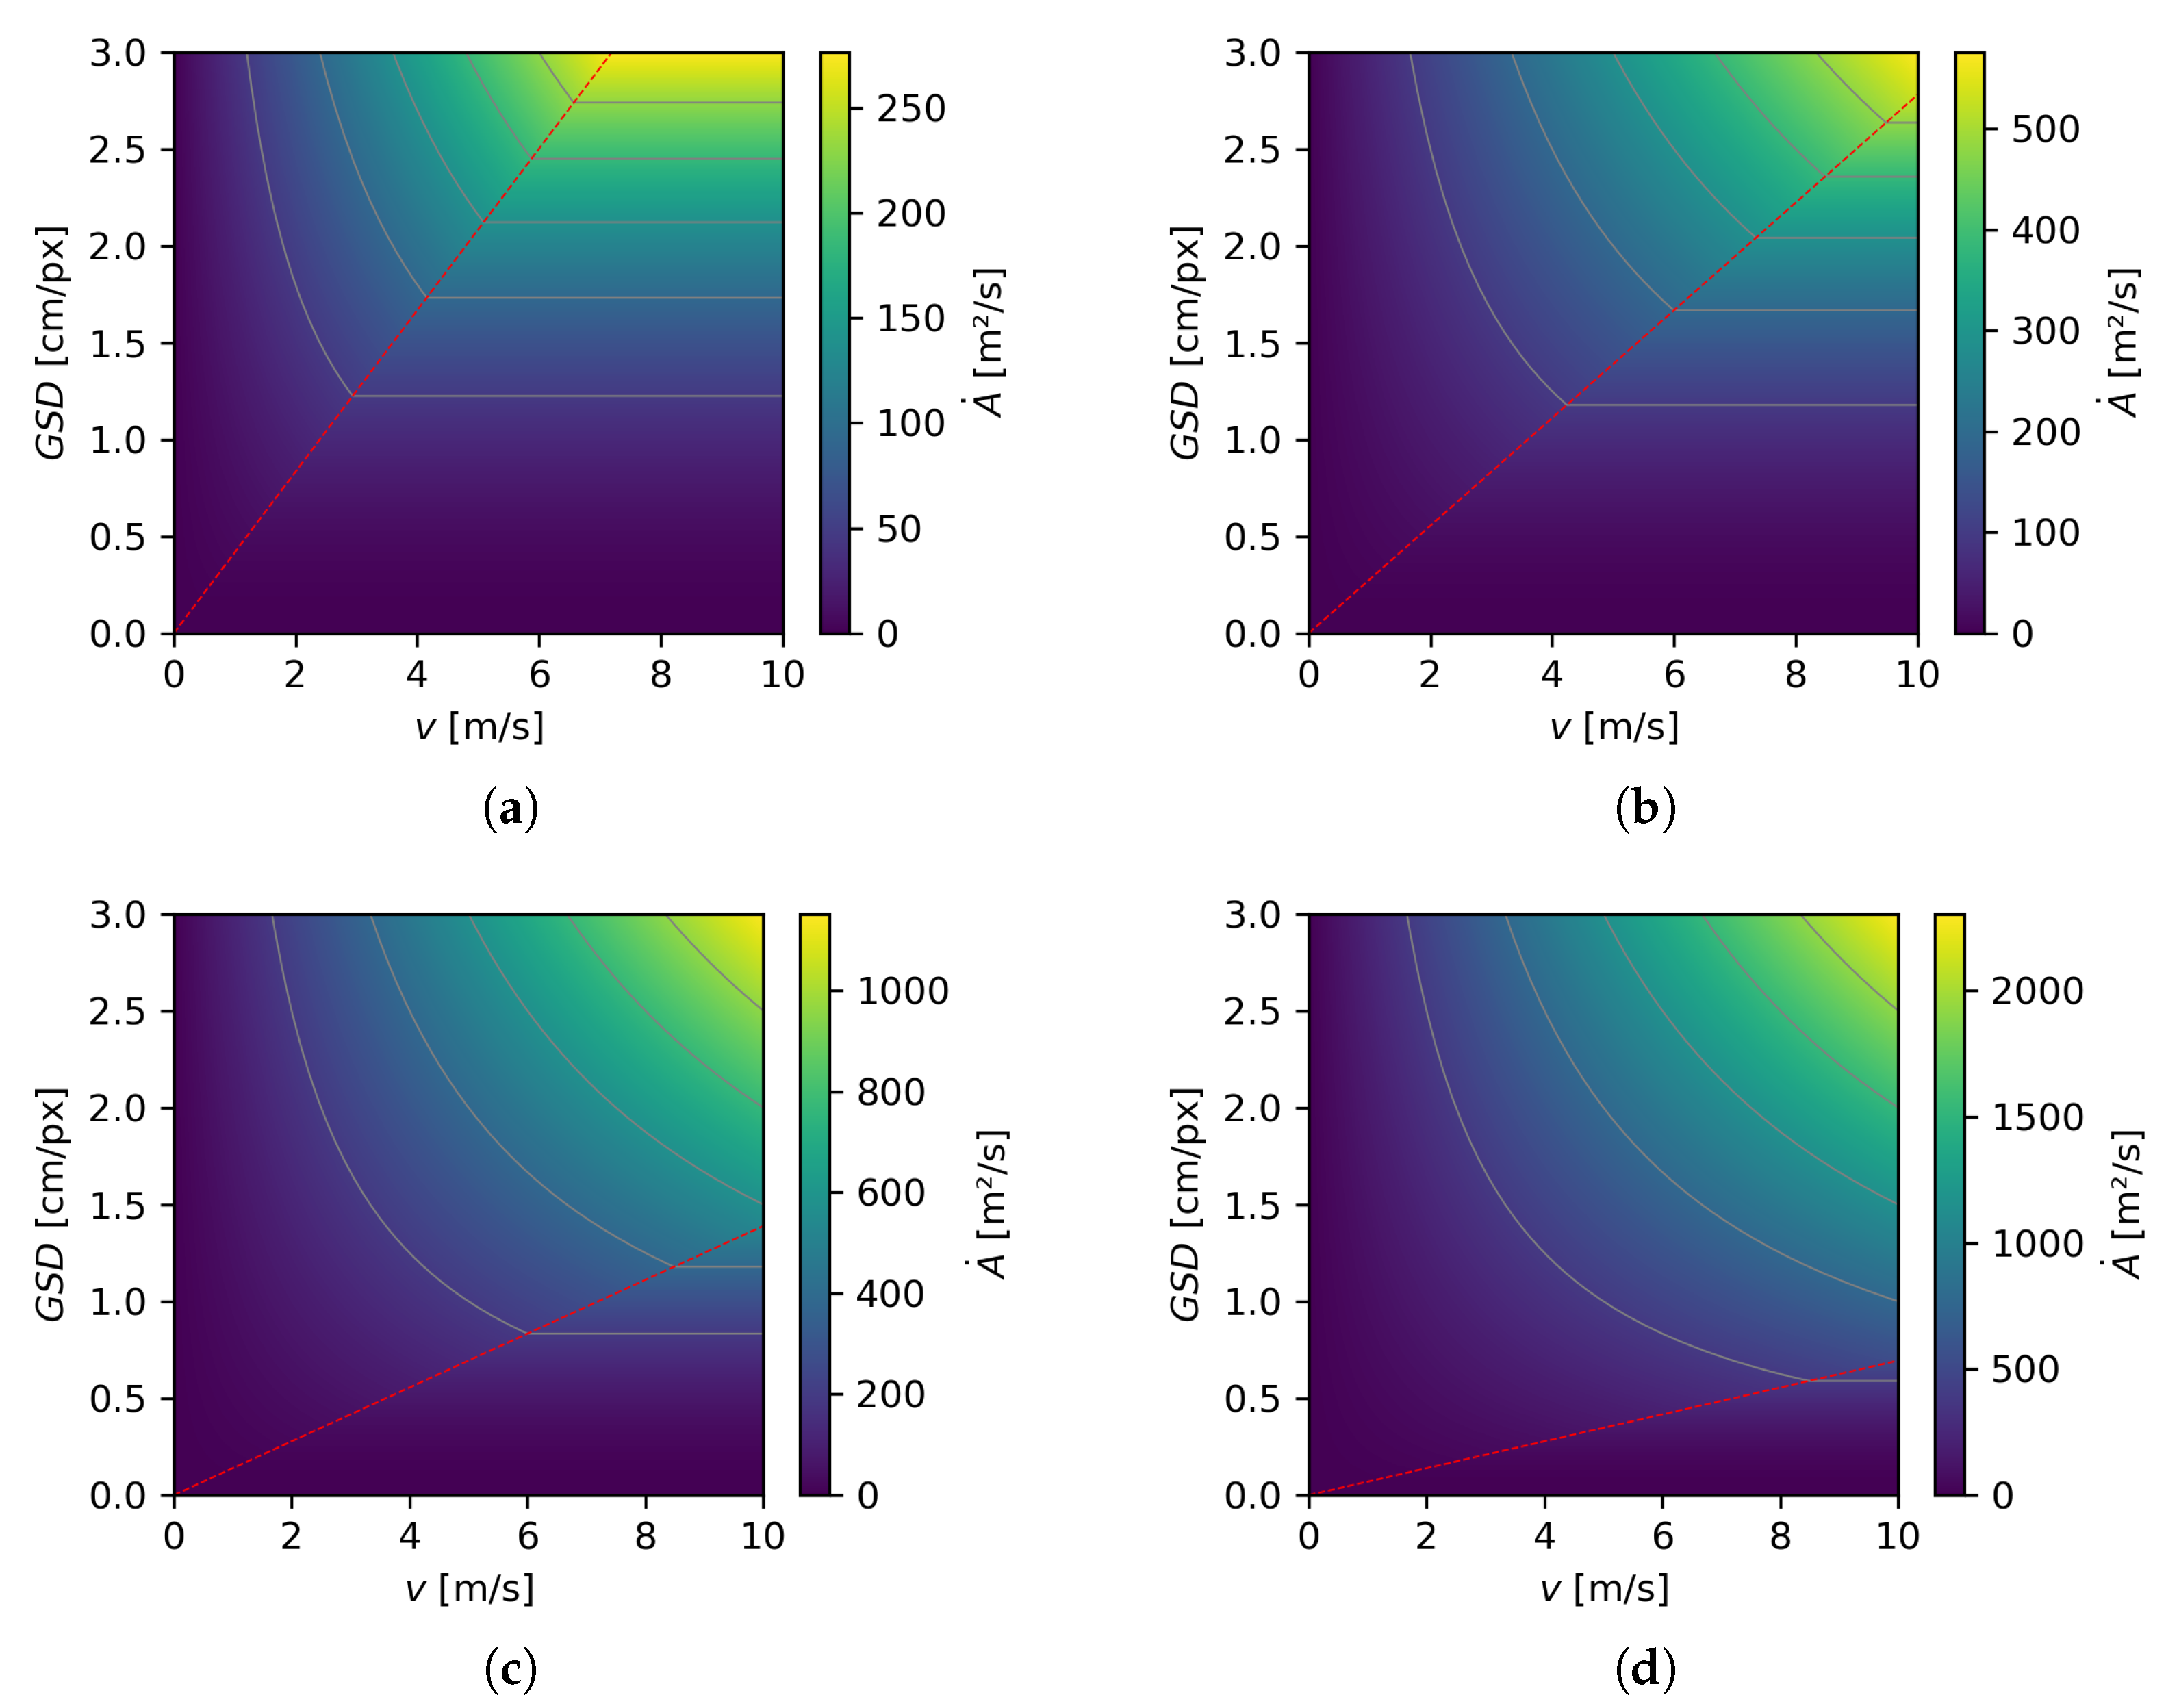
Figure 6.
Covered area per unit of time achieved with four different types of cameras: (a) a camera with a resolution = 1280 × 720 pixels, (b) a camera with a resolution = 1920 × 1080 pixels, (c) a camera with a resolution = 3840 × 2160 pixels, and (d) a camera with a resolution = 7680 × 4320 pixels. The graphs were created for = 3 s because such settings were used during the UAV search from which the data were extracted.
Figure 7.
Three possible detection scenarios are shown: (a) YOLO detected a marker, and there is a marker tag at that location; (b) YOLO detects something that is not a marker; and (c) there is a marker tag that is not detected by YOLO.
Figure 7.
Three possible detection scenarios are shown: (a) YOLO detected a marker, and there is a marker tag at that location; (b) YOLO detects something that is not a marker; and (c) there is a marker tag that is not detected by YOLO.
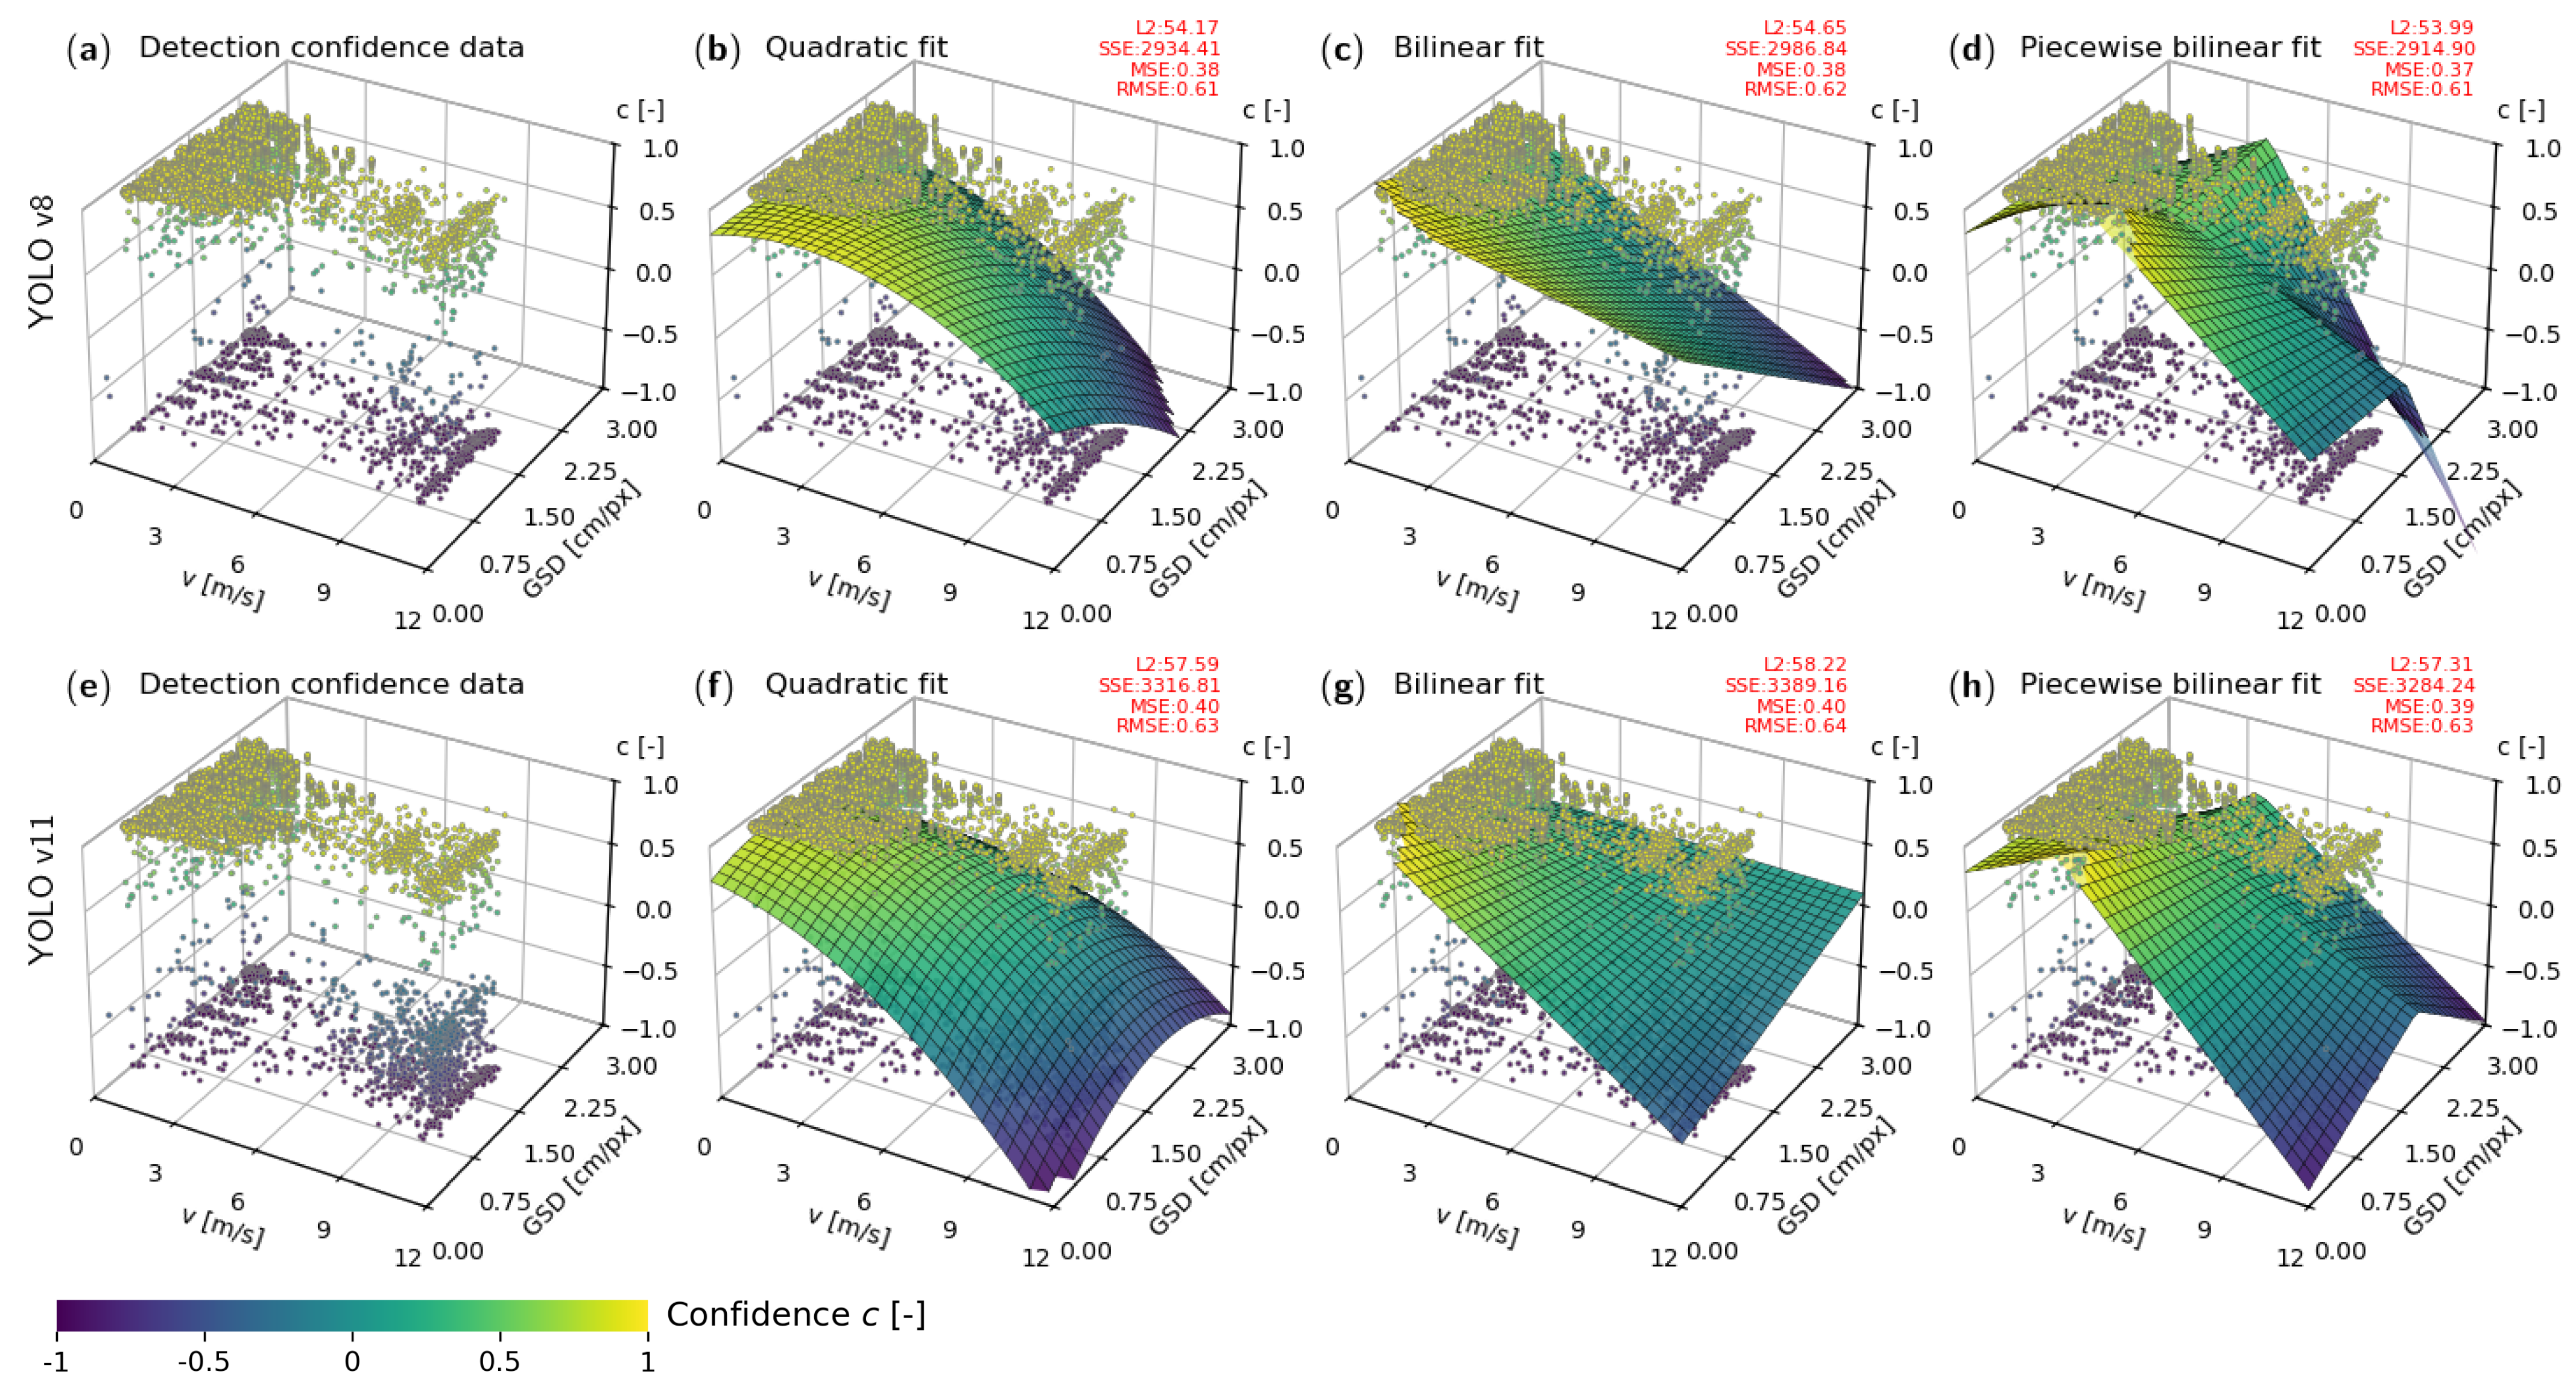
Figure 8.
An analysis of the confidence data for the YOLOv8 (a) and YOLOv11 (e) detection models. Quadratic fit captures the overall trends with smooth curvature (b,f). Bilinear fit (c,g) and piecewise bilinear fit (d,h) confirm similar trends while bringing slightly greater regression errors with and non-smooth regression functions without a clear maximum, respectively.
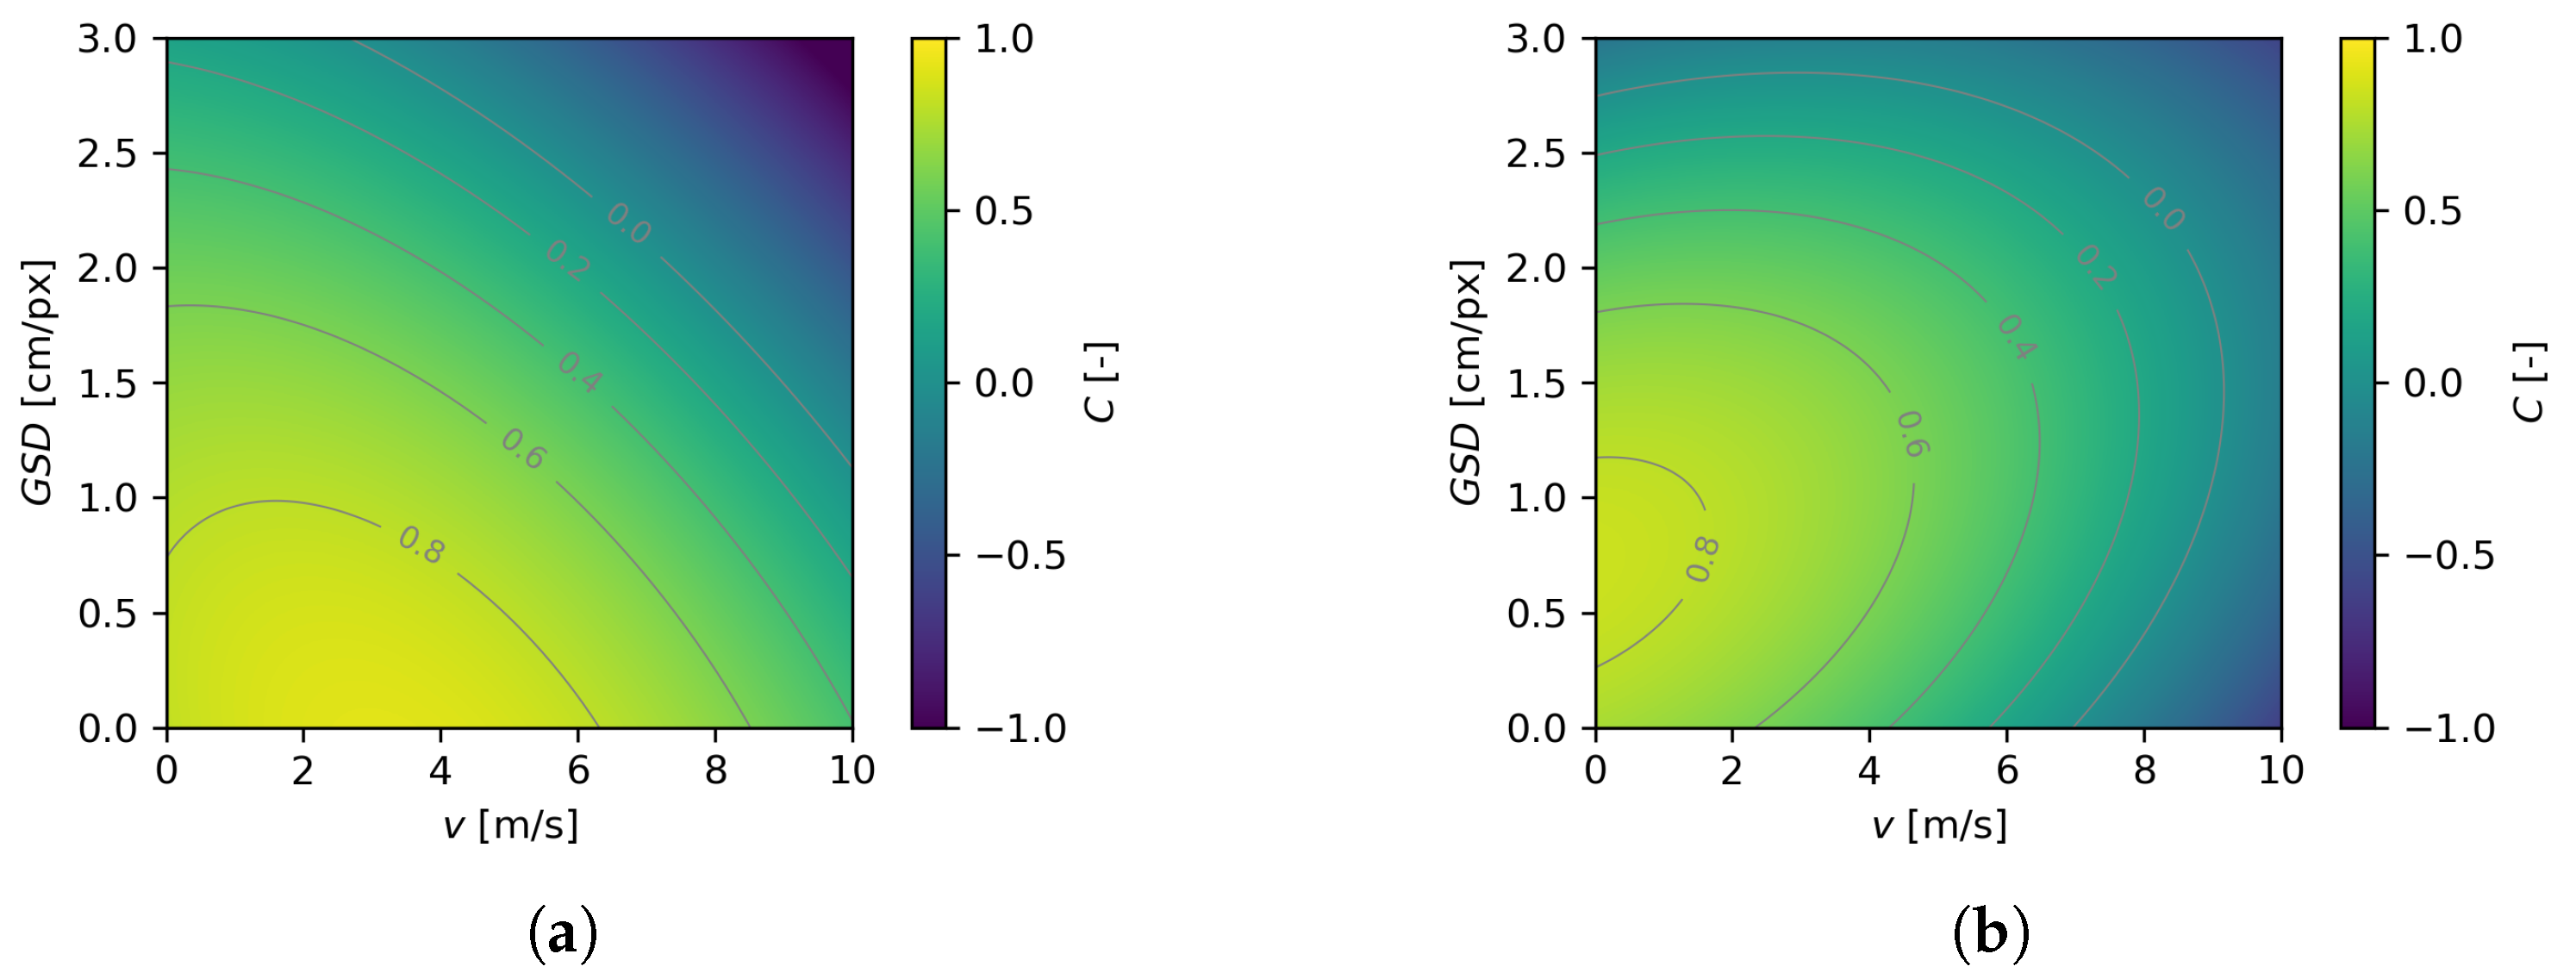
Figure 9.
A graphical representation of the quadratic regression functions for the YOLOv8 (a) and YOLOv11 (b) models.
Figure 9.
A graphical representation of the quadratic regression functions for the YOLOv8 (a) and YOLOv11 (b) models.
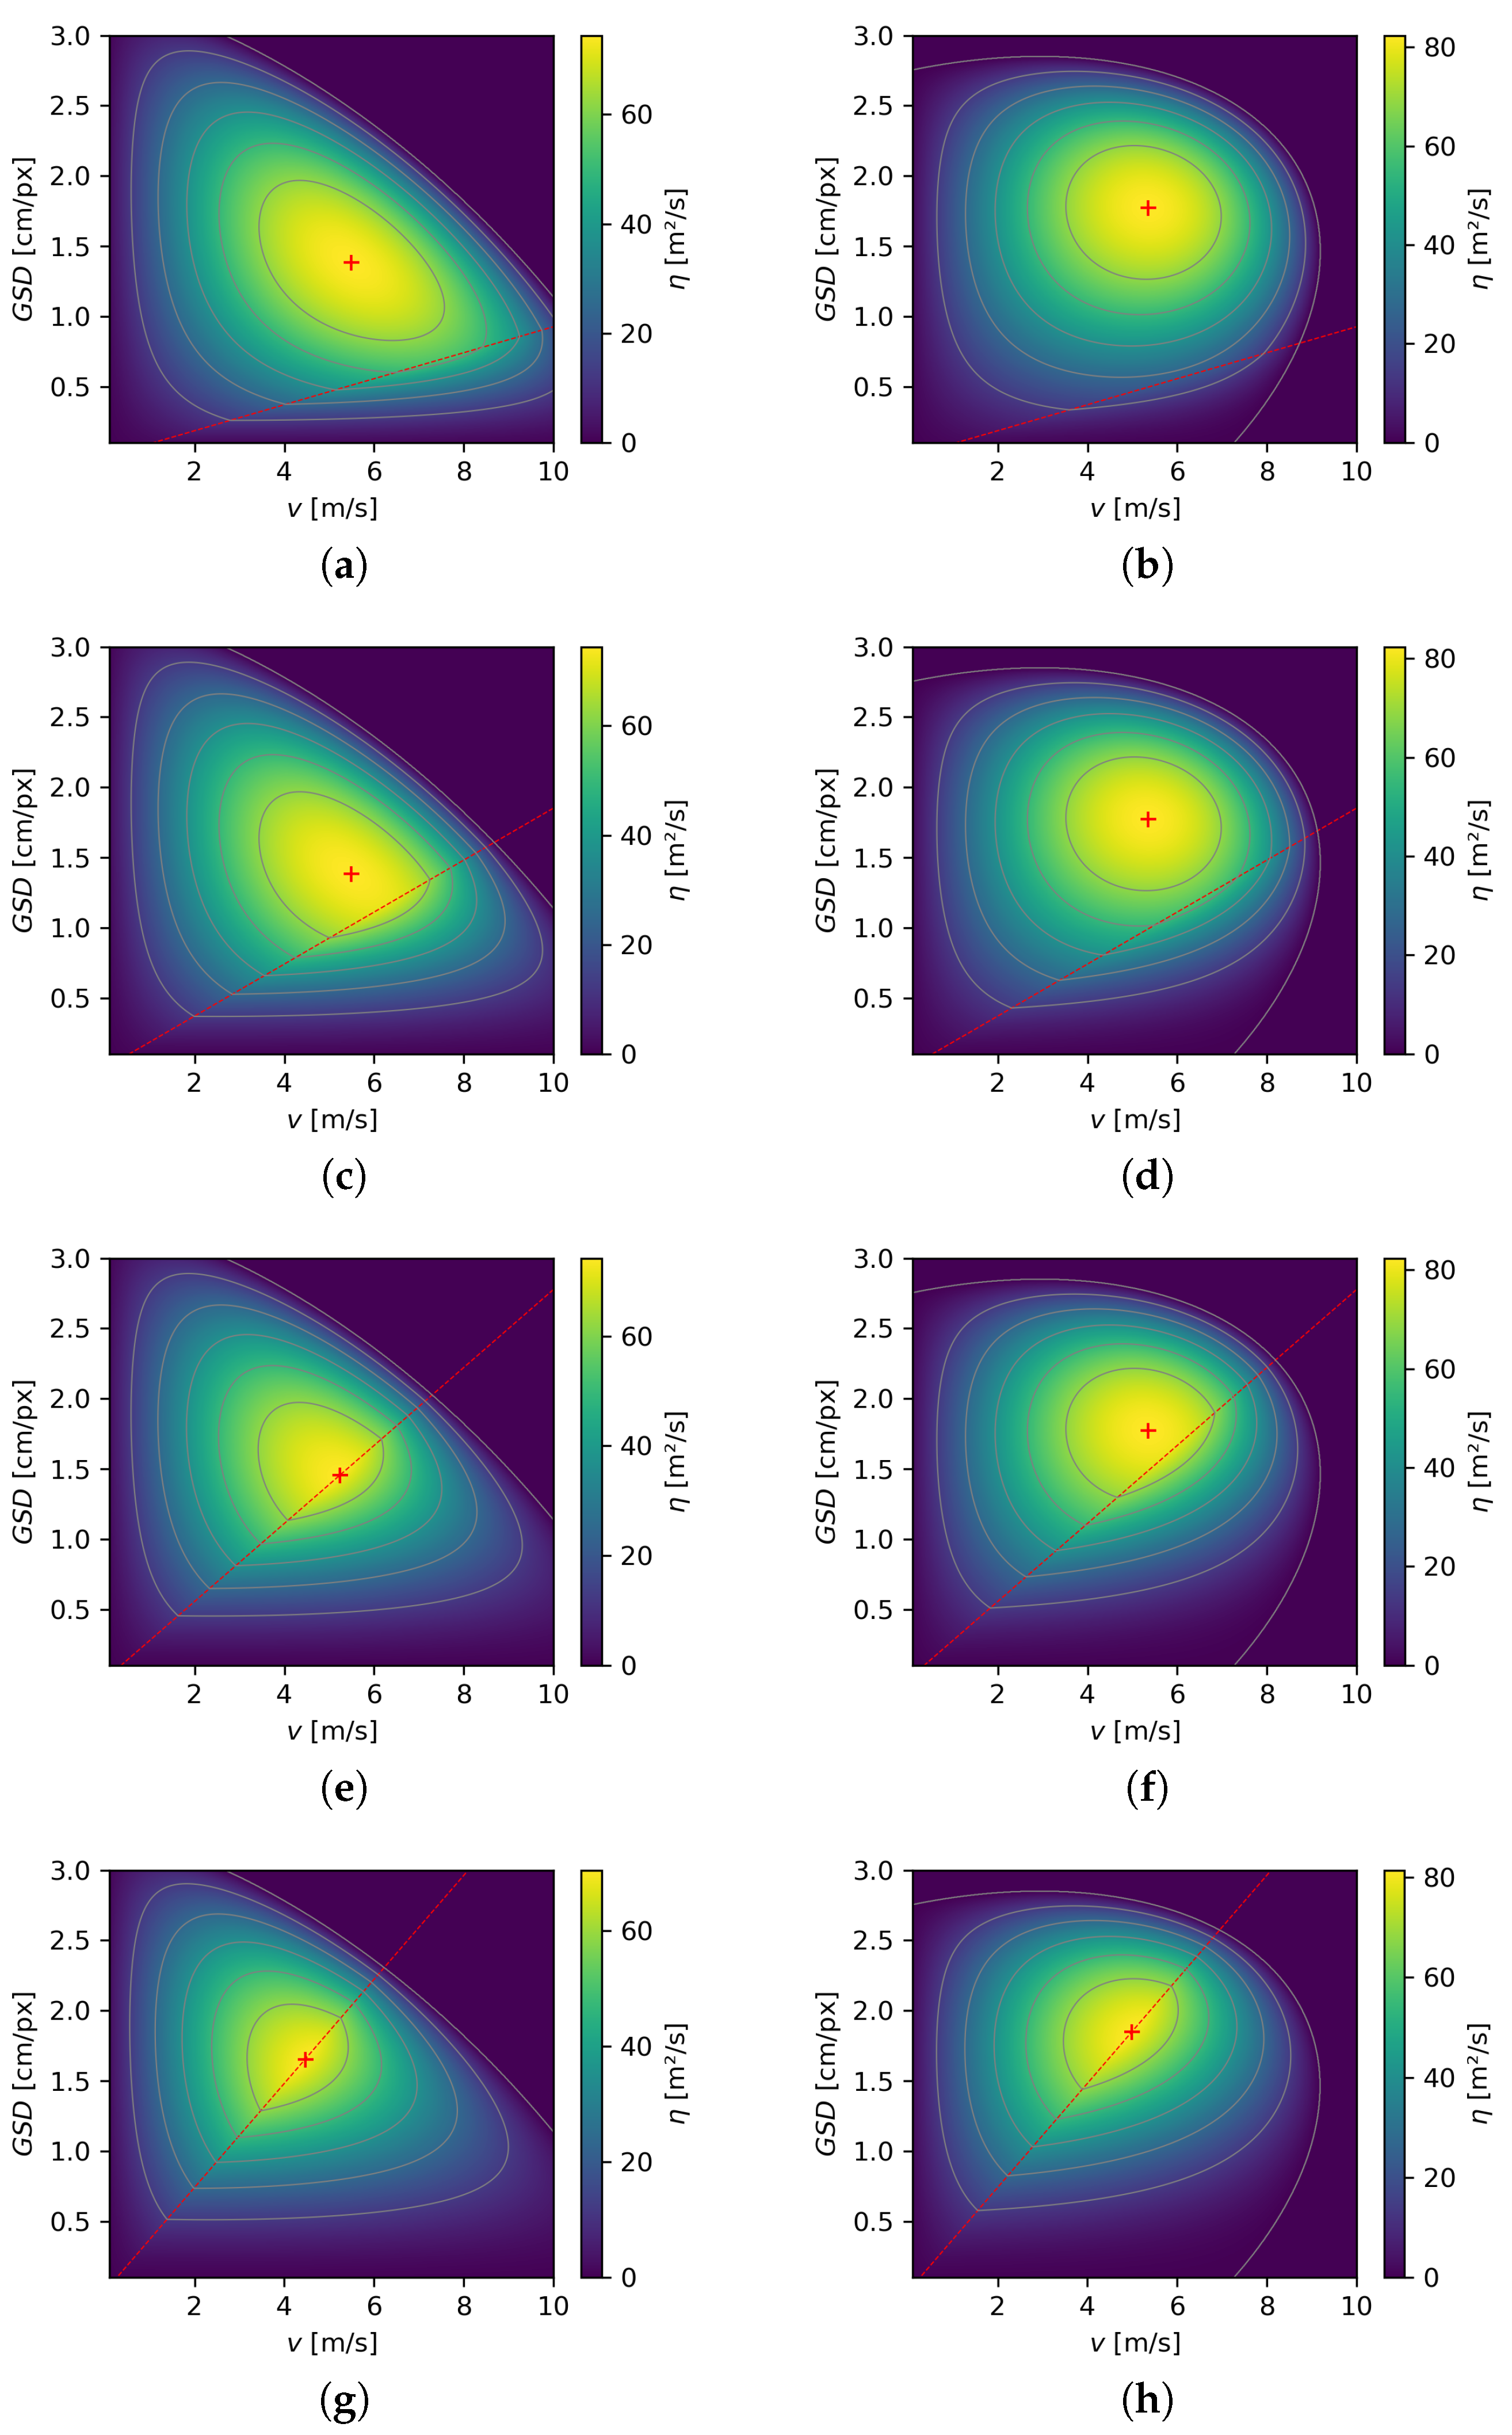
Figure 10.
Graphs of the product function of the covered area and confidence for four different camera resolutions. The plots in the left column (a,c,e,g) correspond to the YOLOv8 model, while those in the right column (b,d,f,h) correspond to YOLOv11. The analyzed camera resolutions are 1280 × 720 (a,b), 1920 × 1080 (c,d), 3840 × 2160 (e,f), and 7680 × 4320 pixels (g,h). The graphs were created for of 3 s because such settings were used during the UAV search from which the images were extracted. The red cross shows the maximum value reached on the graph.
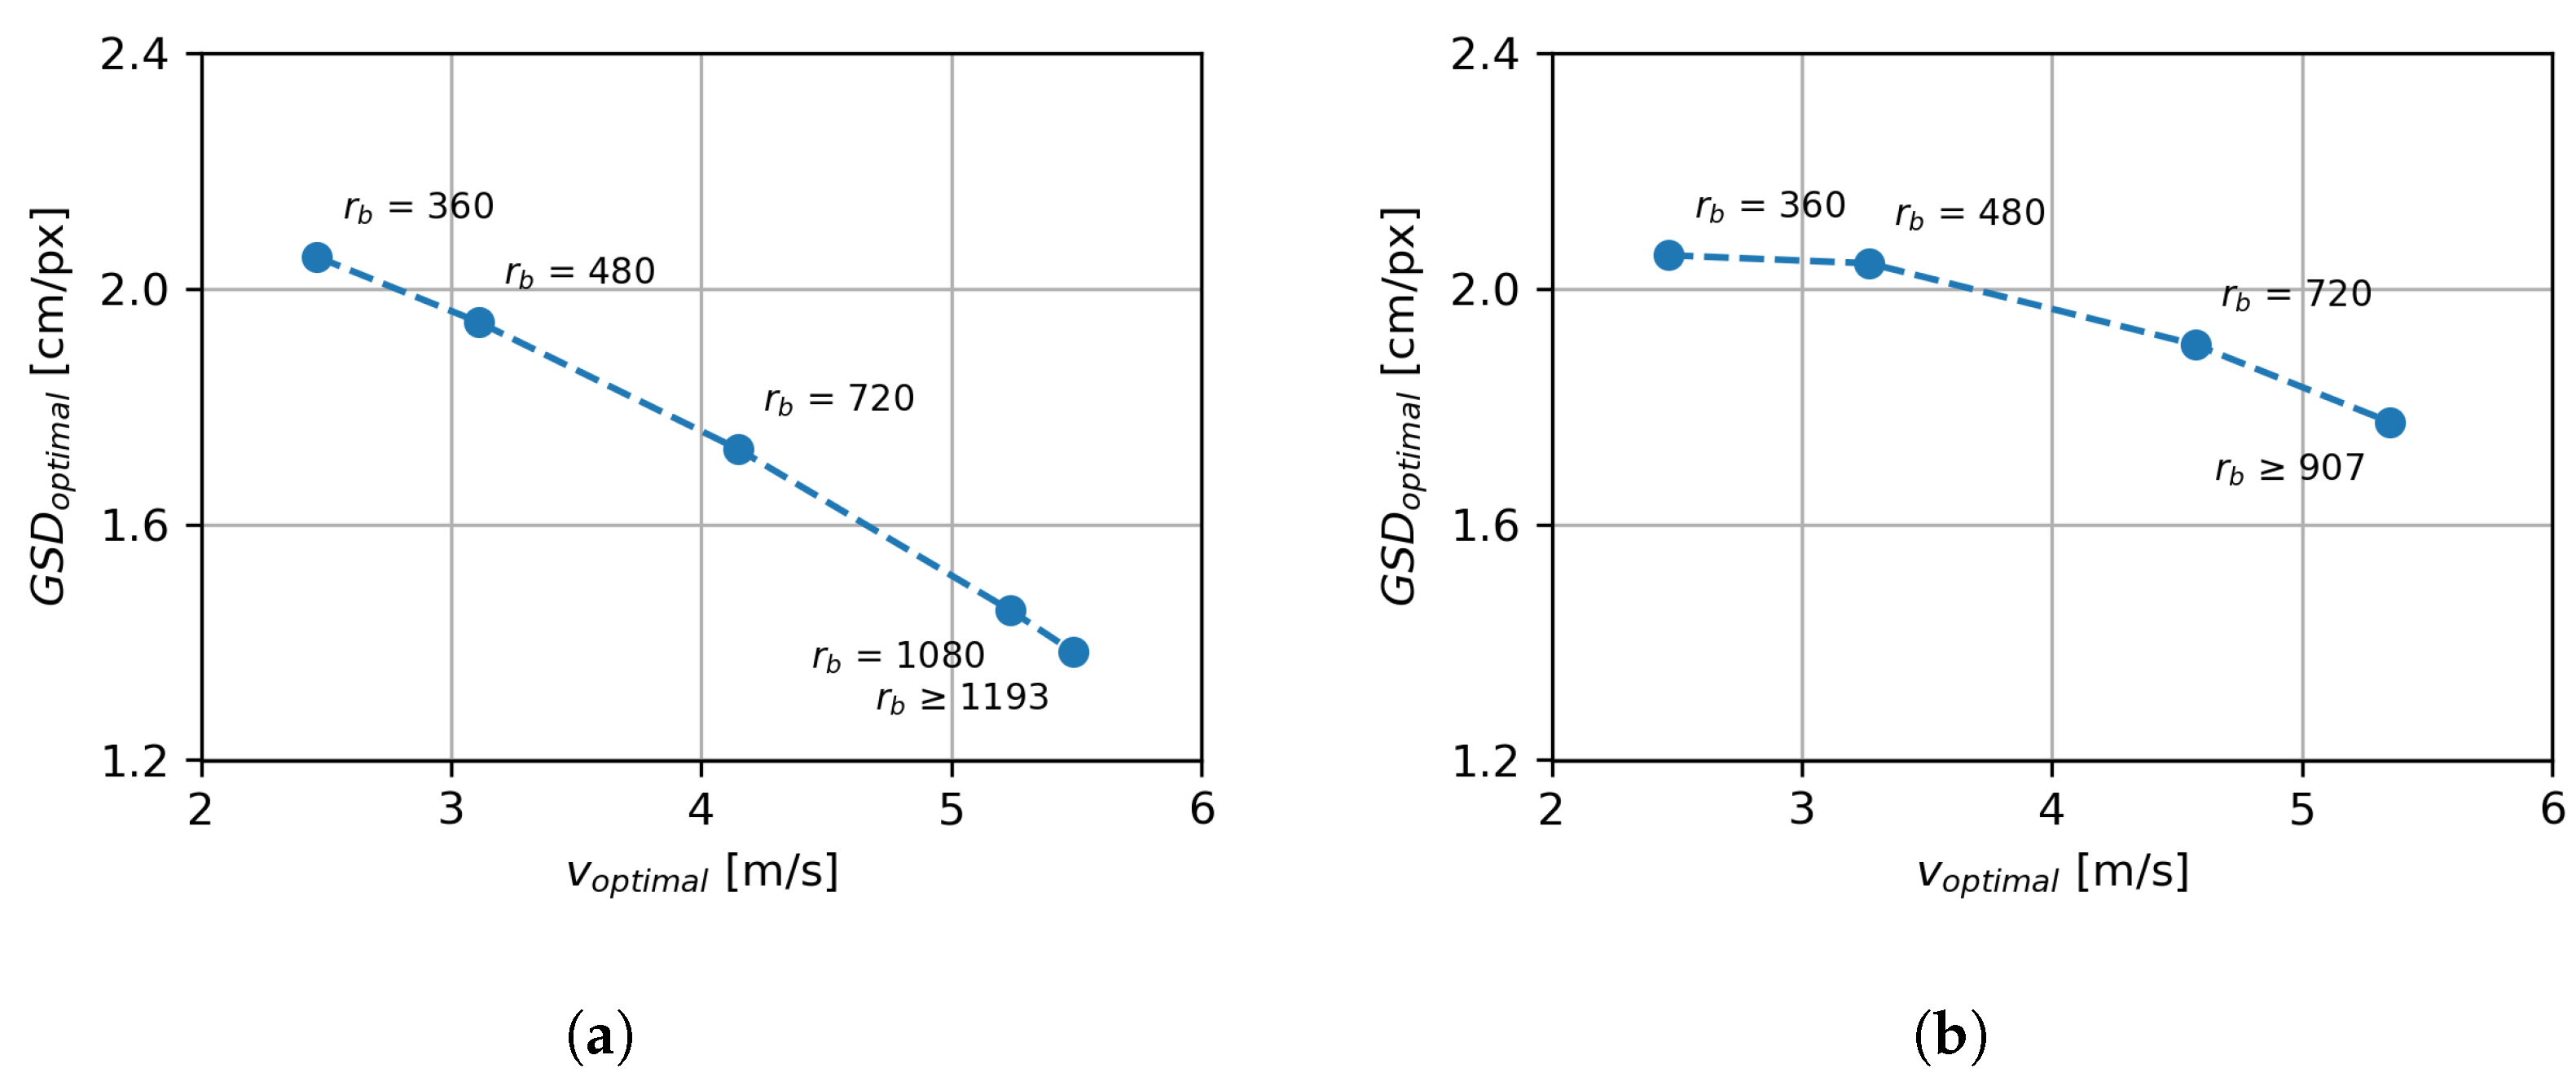
Figure 11.
The optimal flight speed and GSD when the image overlap condition is not satisfied. The graph shows the results for a value of 3 s. Graph (a) shows the results for the YOLOv8 model. Graph (b) shows the results for the YOLOv11 model.
Figure 11.
The optimal flight speed and GSD when the image overlap condition is not satisfied. The graph shows the results for a value of 3 s. Graph (a) shows the results for the YOLOv8 model. Graph (b) shows the results for the YOLOv11 model.
Figure 12.
The graphs show the product of the covered area and detection confidence in relation to the time interval between consecutive images for both models. All graphs show the situation for a camera with a resolution of 1920 × 1080 pixels. The graphs in the left column (a,c,e,g) correspond to the YOLOv8 model, while those in the right column (b,d,f,h) correspond to YOLOv11. Different image capture intervals are shown in rows: s (a,b), s (c,d), s (e,f), s (g,h).
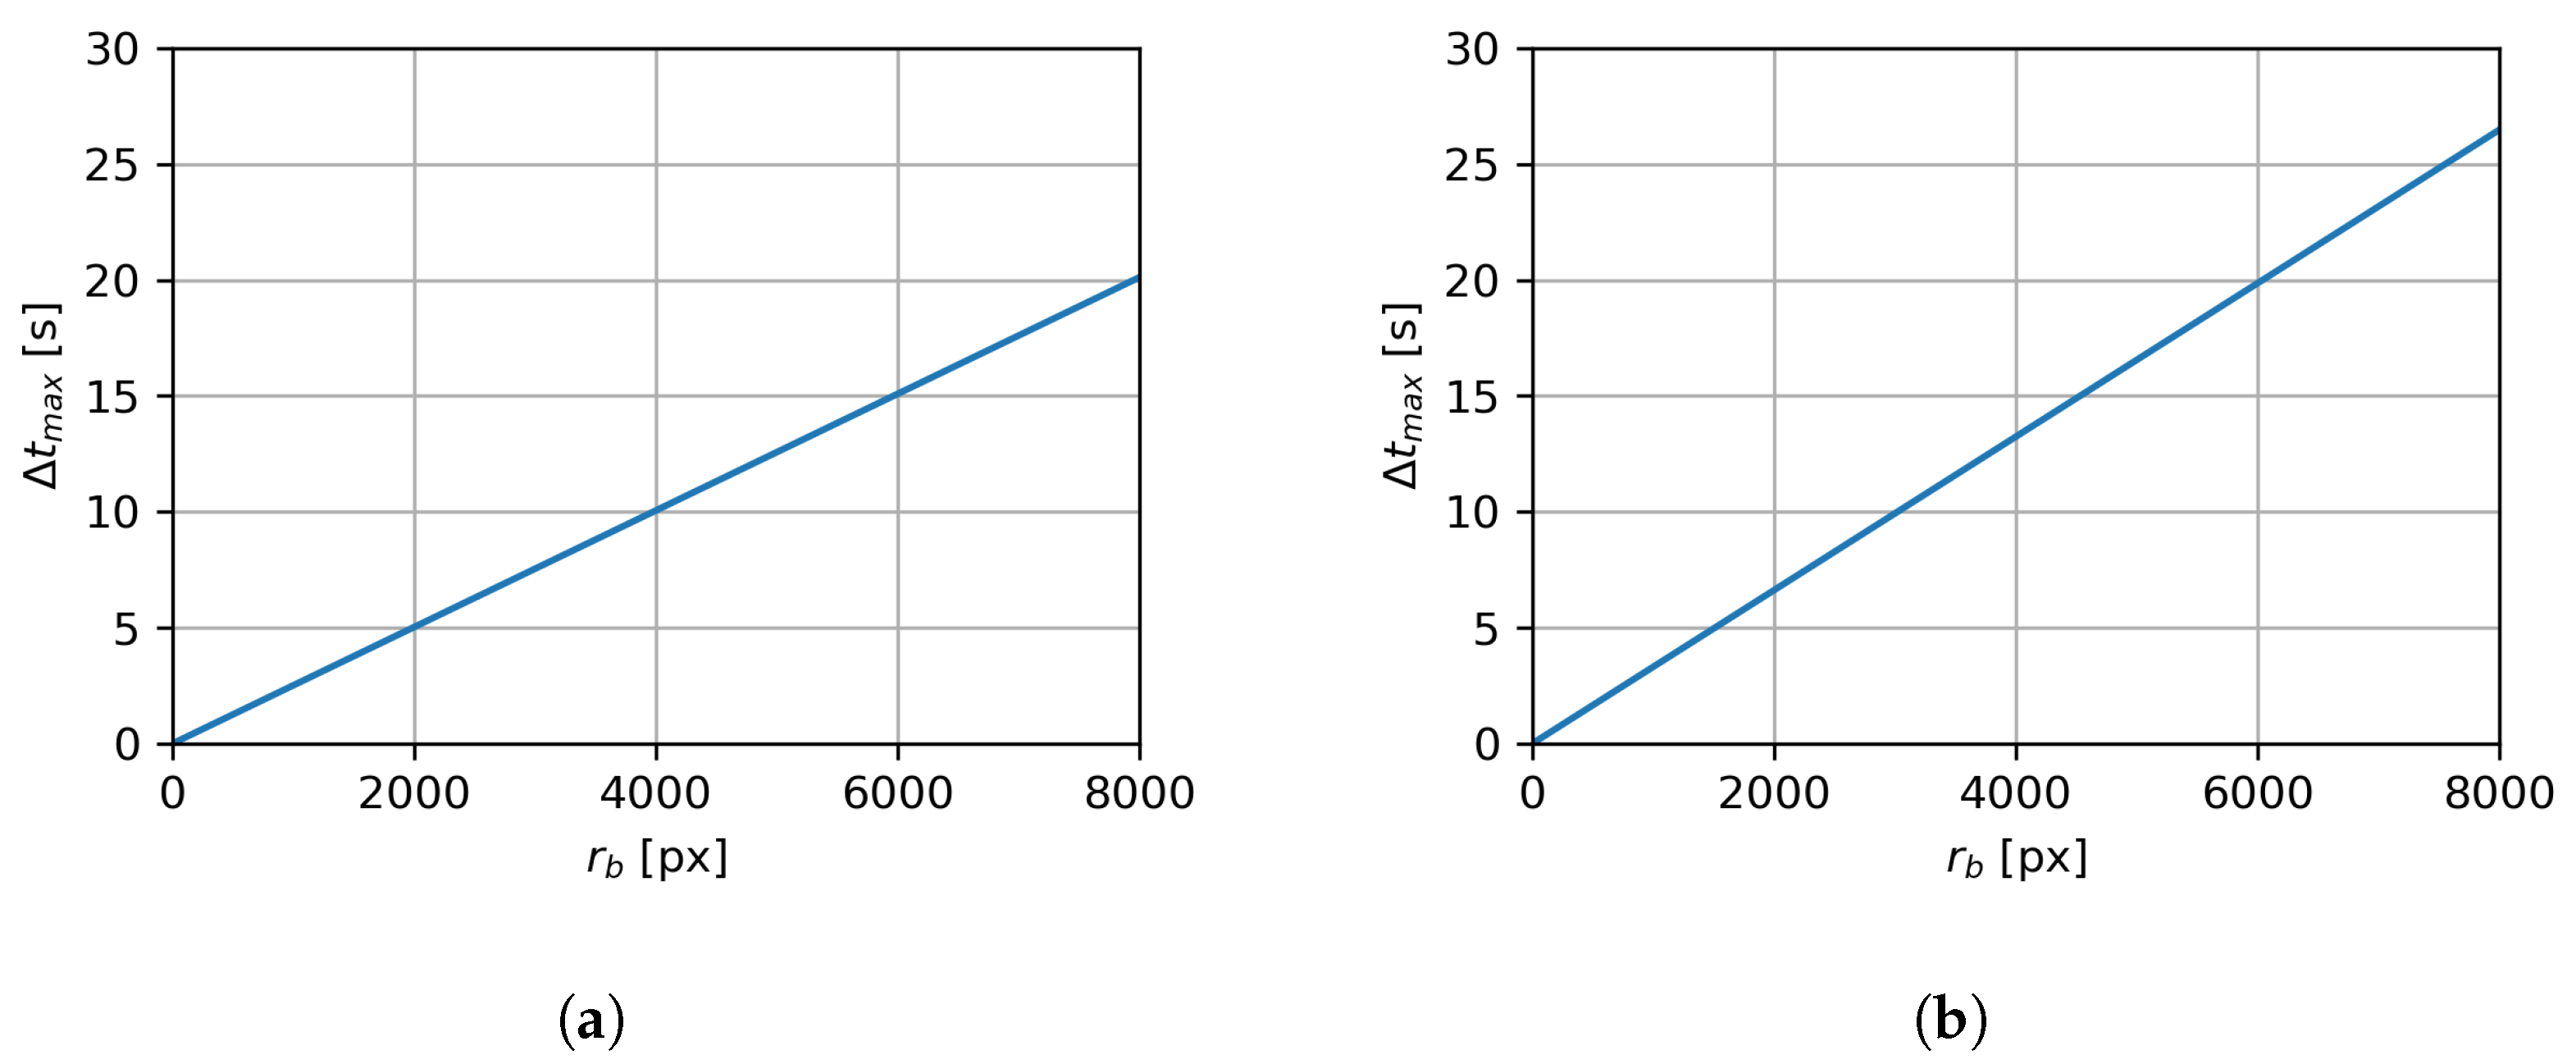
Figure 13.
The maximum allowed time interval between two images as a function of the vertical image resolution to ensure no uncovered area remains between images. Graph (a) shows the results for the YOLOv8 model, with the optimal values for a GSD = 1.38 cm/px and flight speed = 5.49 m/s. Graph (b) shows the results for the YOLOv11 model, with the optimal values for a GSD = 1.77 cm/px and flight speed = 5.35 m/s.
Table 1.
Specifications of UAVs and cameras used for image collection.
Table 1.
Specifications of UAVs and cameras used for image collection.
| UAV Model | DJI Matrice 210 V2 | DJI Matrice 30T |
|---|
| Max speed [m/s] | 22.5 | 23 |
| Camera | DJI Zenmuse X5S | Integrated wide camera |
| Resolution [px] | [5280, 3956] | [4000, 3000] |
| Diagonal FOV angle [°] | 76.7 | 84 |
Table 2.
Performance metrics for YOLOv8.
Table 2.
Performance metrics for YOLOv8.
| Confidence Threshold | YOLOv8 Precision | YOLOv8 Recall | YOLOv8 F1 |
|---|
| 0.25 | 0.978 | 0.854 | 0.912 |
| 0.50 | 0.988 | 0.808 | 0.889 |
| 0.75 | 0.994 | 0.715 | 0.831 |
| 0.90 | 0.998 | 0.241 | 0.389 |
Table 3.
Performance metrics for YOLOv11.
Table 3.
Performance metrics for YOLOv11.
| Confidence Threshold | YOLOv11 Precision | YOLOv11 Recall | YOLOv11 F1 |
|---|
| 0.25 | 0.902 | 0.862 | 0.881 |
| 0.50 | 0.943 | 0.824 | 0.880 |
| 0.75 | 0.977 | 0.752 | 0.850 |
| 0.90 | 0.998 | 0.326 | 0.492 |
Table 4.
Adjusted confidence calculations for three possible scenarios.
Table 4.
Adjusted confidence calculations for three possible scenarios.
| Case | YOLO Confidence | Adjusted Confidence |
|---|
| Marker tag and YOLO detection | n | n |
| Only YOLO detection | n | |
| Only marker tag | – | |
Table 5.
YOLOv8—optimal flight speed and GSD for different camera resolutions.
Table 5.
YOLOv8—optimal flight speed and GSD for different camera resolutions.
| [px] | [s] | v [m/s] | [cm/px] | [m2/s] | [-] | [m2/s] |
|---|
| 1280 × 720 | 3 | 4.15 | 1.73 | 91.72 | 0.49 | 45.24 |
| 1920 × 1080 | 3 | 5.23 | 1.45 | 145.68 | 0.51 | 74.18 |
| 3840 × 2160 | 3 | 5.49 | 1.38 | 291.63 | 0.51 | 148.86 |
| 7680 × 4320 | 3 | 5.49 | 1.38 | 583.27 | 0.51 | 297.73 |
Table 6.
YOLOv11—optimal flight speed and GSD for different camera resolutions.
Table 6.
YOLOv11—optimal flight speed and GSD for different camera resolutions.
| [px] | [s] | v [m/s] | [cm/px] | [m2/s] | [-] | [m2/s] |
|---|
| 1280 × 720 | 3 | 4.59 | 1.91 | 112.16 | 0.47 | 52.52 |
| 1920 × 1080 | 3 | 5.35 | 1.77 | 182.27 | 0.45 | 82.34 |
| 3840 × 2160 | 3 | 5.35 | 1.77 | 364.54 | 0.45 | 164.68 |
| 7680 × 4320 | 3 | 5.35 | 1.77 | 729.07 | 0.45 | 329.37 |
Table 7.
YOLOv8—optimal flight speed and during UAV flight for different times between images.
Table 7.
YOLOv8—optimal flight speed and during UAV flight for different times between images.
| [px] | [s] | v [m/s] | [cm/px] | [m2/s] | [-] | [m2/s] |
|---|
| 1920 × 1080 | 1 | 5.49 | 1.38 | 145.82 | 0.51 | 74.43 |
| 1920 × 1080 | 2 | 5.49 | 1.38 | 145.82 | 0.51 | 74.43 |
| 1920 × 1080 | 3 | 5.23 | 1.45 | 145.68 | 0.51 | 74.18 |
| 1920 × 1080 | 4 | 4.46 | 1.65 | 141.68 | 0.50 | 70.48 |
Table 8.
YOLOv11—optimal flight speed and during UAV flight for different times between images.
Table 8.
YOLOv11—optimal flight speed and during UAV flight for different times between images.
| [px] | [s] | v [m/s] | [cm/px] | [m2/s] | [-] | [m2/s] |
|---|
| 1920 × 1080 | 1 | 5.35 | 1.77 | 182.27 | 0.45 | 82.34 |
| 1920 × 1080 | 2 | 5.35 | 1.77 | 182.27 | 0.45 | 82.34 |
| 1920 × 1080 | 3 | 5.35 | 1.77 | 182.27 | 0.45 | 82.34 |
| 1920 × 1080 | 4 | 4.99 | 1.85 | 177.03 | 0.46 | 81.46 |
Table 9.
Optimal flight speeds and heights and resulting metrics for most used cameras during UAV terrain search. Calculated values are valid for YOLOv11 detection model.
Table 9.
Optimal flight speeds and heights and resulting metrics for most used cameras during UAV terrain search. Calculated values are valid for YOLOv11 detection model.
| Camera and Lens | [px] | [°] | [°] | v [m/s] | [cm/px] | h [m] | [s] | [m2/s] | [-] | [m2/s] |
|---|
| Sony Alpha 7R IV (24 mm) | 9504 × 6336 | 73.7 | 84 | 5.35 | 1.77 | 112.23 | 20.96 | 899.98 | 0.45 | 407.59 |
| Sony Alpha 7R IV (35 mm) | 9504 × 6336 | 54 | 63 | 5.35 | 1.77 | 165.08 | 20.96 | 899.98 | 0.45 | 407.59 |
| Sony Alpha 7R IV (55 mm) | 9504 × 6336 | 36.3 | 43 | 5.35 | 1.77 | 256.58 | 20.96 | 899.98 | 0.45 | 407.59 |
| Sony Alpha 6000 (20 mm) | 6000 × 4000 | 83.5 | 94 | 5.35 | 1.77 | 59.49 | 13.23 | 568.17 | 0.45 | 257.31 |
| Sony Alpha 6000 (24 mm) | 6000 × 4000 | 73.7 | 84 | 5.35 | 1.77 | 70.85 | 13.23 | 568.17 | 0.45 | 257.31 |
| DJI Zenmuse P1 (24 mm) | 8192 × 5460 | 73.7 | 84 | 5.35 | 1.77 | 96.74 | 18.06 | 775.74 | 0.45 | 351.32 |
| DJI Zenmuse P1 (35 mm) | 8192 × 5460 | 54.5 | 63.5 | 5.35 | 1.77 | 140.77 | 18.06 | 775.74 | 0.45 | 351.32 |
| DJI Zenmuse X5S (15 mm) | 5280 × 3956 | 64.7 | 76.7 | 5.35 | 1.77 | 73.77 | 13.09 | 499.99 | 0.45 | 226.44 |
| DJI Zenmuse X7 (24 mm) | 6016 × 4008 | 52.2 | 61 | 5.35 | 1.77 | 108.68 | 13.26 | 569.69 | 0.45 | 258.00 |
| DJI Zenmuse X7 (35 mm) | 6016 × 4008 | 37.1 | 43.9 | 5.35 | 1.77 | 158.66 | 13.26 | 569.69 | 0.45 | 258.00 |
| DJI Mavic 2 Zoom (24 mm) | 4000 × 3000 | 70.6 | 83 | 5.35 | 1.77 | 50.00 | 9.93 | 378.78 | 0.45 | 171.54 |
| DJI Mavic 3 Pro (24 mm) | 5280 × 3956 | 71.6 | 84 | 5.35 | 1.77 | 64.79 | 13.09 | 499.99 | 0.45 | 226.44 |
| DJI Matrice 30T (Wide) | 4000 × 3000 | 71.6 | 84 | 5.35 | 1.77 | 49.08 | 9.93 | 378.78 | 0.45 | 171.54 |
| Phase One iXM-100 (80 mm) | 11,664 × 8750 | 30.7 | 37.9 | 5.35 | 1.77 | 376.04 | 28.95 | 1104.52 | 0.45 | 500.22 |
| Phase One iXM-100 (150 mm) | 11,664 × 8750 | 16.6 | 20.7 | 5.35 | 1.77 | 707.59 | 28.95 | 1104.52 | 0.45 | 500.22 |
| Canon EOS R (24 mm) | 6720 × 4480 | 73.7 | 84 | 5.35 | 1.77 | 79.35 | 14.82 | 636.35 | 0.45 | 288.19 |
| Canon EOS R (35 mm) | 6720 × 4480 | 54 | 63 | 5.35 | 1.77 | 116.72 | 14.82 | 636.35 | 0.45 | 288.19 |
| MAPIR Survey3W RGB (19 mm) | 4000 × 3000 | 87 | 99.7 | 5.35 | 1.77 | 37.30 | 9.93 | 378.78 | 0.45 | 171.54 |
| MAPIR Survey3N RGB (47 mm) | 4000 × 3000 | 41 | 50.1 | 5.35 | 1.77 | 94.68 | 9.93 | 378.78 | 0.45 | 171.54 |
| Parrot Anafi (Wide) | 5344 × 4016 | 84 | 96.8 | 5.35 | 1.77 | 52.53 | 13.29 | 506.05 | 0.45 | 229.18 |
| Parrot Anafi (Rectilinear) | 4608 × 3456 | 75.5 | 88.1 | 5.35 | 1.77 | 52.67 | 11.43 | 436.35 | 0.45 | 197.62 |


