Highlights
- What are the main findings?
- Proposes a two-stage multi-UAV task allocation framework integrating graph theory and a Learning-Inspired Immune Algorithm (LIA).
- Develops a heterogeneous network model for multi-UAV systems, quantifying edge performance in sensing, communication, and decision-making to optimize defense loops.
- What is the implication of the main finding?
- Introduces Pareto-optimized solutions via LIA, resolving multi-objective conflicts (path length, workload balance, priority scheduling) with 6 non-dominated opera-tional strategies.
- Identifies critical hub nodes through edge quality heatmaps, enhancing resilience in dynamic mission environments.
Abstract
Unmanned aerial vehicle (UAV) systems offer significant advantages in terms of rapid decision-making processes, precise operational execution, and robust performance in complex environments. With the evolution of security paradigms and advancements in equipment systems, collaborative multi-UAV operations have become essential for modern protection frameworks and represent a key developmental direction. To address the need for coordinated multi-objective operations within complex network environments—and to overcome the limitation in current research where single operational loops can only handle individual objectives—this study proposes an innovative intelligent loop recommendation method. By formulating the operational loop recommendation problem as a network flow shortest-path model, we implement an exact algorithm to generate operational loops that enable coordinated multi-UAV operations. Additionally, we develop a learning-inspired algorithm (LIA) incorporating Pareto optimization strategies and specialized learning mechanisms to effectively resolve multi-objective conflicts in UAV task allocation. This research integrates complex network theory with operational loop optimization concepts, providing new technical support for intelligent mission management systems.
1. Introduction
The collaborative multi-UAV protection network emphasizes integrated coordination across sensing, communications, decision making, and operational execution. This framework combines intelligence gathering, command decisions, dynamic response, and outcome analysis into a unified defense architecture. The mission planning loop problem for multi-target cooperative UAMS under this framework involves multi-agent system interaction with two or more stakeholders. It aims to recommend optimal operational decision loops for mission-critical objectives, enabling dynamic adaptation and facilitating multi-UAV coordination and command integration. The mission planning challenge for multi-target cooperative UAMS exhibits hybrid linear–non-linear characteristics, mathematical modeling complexities, conflicting optimization objectives, and stringent real-time requirements [1]. Given its exceptional adaptability, self-organization capacity, and operational resilience, existing mission planning and optimization methodologies cannot be directly applied to this problem domain. In this context, how to recommend the optimal operational decision loop through intelligent methods is a key research frontier in advanced autonomous systems.
Current research predominantly formulates the mission planning optimization problem as a combinatorial optimization challenge. Yang et al. solved this by weighted edge assignment and logarithmic transformation in network flows to derive shortest-path solutions, thereby mapping to optimal mission planning solutions [2]. Xia et al. constructed redundancy indicators, risk indicators, and agility indicators based on the characteristics of a networked engagement framework and solved the system configuration scheme based on a heuristic algorithm [3]. Li et al. converted the mission planning problem into a mathematical model based on multi-warehouse path planning and proposed an improvement strategy for the original ant colony algorithm’s slow convergence speed in the early stage. They show that the algorithm parameters have a large impact on the results and it is easy to fall into a local optimum [4]. The above methods have two major limitations: they only support single-objective engagements and the algorithms are not efficient enough.
Both the mission planning loop problem and the asset deployment planning problem are inherently optimization challenges, whose solving algorithms can be categorized into exact optimization algorithms and approximate optimization algorithms, as classified by solution optimality [5]. Exact algorithms such as branch-and-bound (B&B) [6,7,8,9] and dynamic programming (DP) [10] are limited to small-to-medium-scale practical applications due to their prohibitive time complexity. Inspired by network flow theory [11], this study formulates a linear evaluation function to equivalently transform the problem into a shortest-path problem. Compared with traditional combinatorial optimization methods, the transformation effectively reduces the state space dimension, which allows accurate algorithms such as the branch-and-bound method to maintain computational efficiency while considering actual system constraints, and it solves the problem of modeling multi-objective coordinated operations.
Approximate optimization algorithms are a class of algorithms that search for an approximate optimal solution in a finite amount of time by ‘trial and error’ and can be divided into heuristic algorithms [12,13,14,15,16,17], which are based on the characteristics of a specific problem, and meta-heuristic algorithms [18,19,20,21], which are independent of the specific problem. However, the task allocation problem of UAV multi-objective coordinated operations requires the simultaneous optimization of multiple conflicting targets, which cannot be directly handled by traditional single-objective optimization algorithms. For multi-objective optimization problems, one approach is to transform the problem into multiple single-objective optimization problems [22], and another commonly used approach stems from the idea of finding all non-dominated solutions for the current population by means of a Pareto-based fitness allocation strategy [23]. However, in UAV mission assignment, an achievement is considered accomplished once the UAV enters the effective engagement radius of a target. This leads to identical operational solutions for multiple colinear target nodes, posing new challenges in balancing operational effectiveness versus computational efficiency while maintaining solution diversity during evolutionary optimization. In this regard, this paper is inspired by the learning properties of immune mechanisms [24] and proposes an improved learning-inspired immune algorithm (LIA). The algorithm employs Pareto-optimal strategies to resolve objective conflicts and incorporates specificity learning mechanisms to discriminate between equivalent solutions, demonstrating effective adaptation to UAV collaborative task allocation scenarios.
The main contributions of this paper are as follows:
- (1)
- In the task allocation process for multi-objective coordinated UAV protection, we integrate complex network theory with operational loop optimization scenarios. Previous studies on UAV system modeling, evaluation, and optimization typically focused solely on task allocation and path planning techniques, without organic integration with protection frameworks.
- (2)
- The proposed multi-objective UAV coordination system overcomes the limitations of existing methods that can only handle single-node protection tasks in operational cycle recommendations. This advancement provides theoretical and methodological support for future security management system development.
- (3)
- As an applied innovation, this work creatively adapts existing methods to new problems by reformulating UAV path planning as a patrol optimization problem, solved using an improved learning-inspired optimization algorithm.
2. Problem Statement
To enable a single operational cycle recommendation to accomplish protection tasks for multiple target nodes based on UAV capabilities, this paper will formulate the problem from two perspectives: heterogeneous complex network modeling and path planning.
2.1. Heterogeneous Networked System Modeling
Multi-UAV collaborative protection constitutes a complex safeguarding framework comprising multiple functional networks, including surveillance networks, communication networks, command-and-control networks, and protection networks. These networks involve numerous equipment nodes and interconnecting edges. The development of a capability model for protection-oriented networks aims to enable the rapid computational assessment of protection capabilities in operational environments.
The core of system modeling lies in establishing and integrating the logical relationships and constraint rules among system components to construct a computable and evaluable protection system model. Building upon prior work on multifunctional fusion networks [25], multilayer networks, and operational network modeling [26], this study employs a heterogeneous network representation to characterize the diverse equipment types and edge relationships within protection networks, incorporating their unique features.
As defined in [3], a heterogeneous network comprises multiple node types or relationship types and can be represented as a directed graph . For operational relevance, denotes equipment nodes, with key attributes including the kind, attribute, communication channel capacity, operational radius, capability metrics, and geographic coordinates. These node characteristics are formally expressed via Equation (1):
In the formula,
represents the agent group, where the same indicates different equipment belonging to the same team—this paper only considers system interaction scenarios between two distinct agent groups;
represents the attributes of the corresponding equipment, i.e., the basic core functions of the UAV, namely detection, energy management, and protection, where the same UAV can integrate multiple core functionalities;
Parameter characterizes the nodal degree constraint of a UAV, defining the maximum allowable inter-agent communication edges for maintaining stable network connectivity;
indicates the operational radius of the node, where the UAV can complete protective operations within the coverage ranges of designated objectives;
represents the protection capabilities of the UAV. This paper primarily considers the core capabilities relevant to the defense loop: sensing capabilities, communication capabilities, coordination and decision capabilities, and protection capabilities, which are expressed as .
represents the spatial location of the UAV, which is a crucial factor in mission protection and determines both inter-UAV coordination and collaborative effectiveness.
denotes the connecting edge relationship between nodes.
Sensing edge (): Our UAV systems acquire dangerous object signatures through active sensing (radar wave emission) or passive detection (infrared signal reception).
Communication edge (): Detection-capable UAVs transmit environmental signatures to decision-making units, where data processing converts raw signals into operational data.
Coordination and decision edge (): Our control systems analyze and evaluate decision support information, formulate protection plans, and disseminate operational commands to task execution UAVs.
Task execution edge (): Upon receiving execution directives, our protection-capable UAVs perform assigned tasks using platform-specific operational methods in accordance with mission requirements.
2.2. Description of the Path Planning Problem
A set of protective equipment (red team) remains on standby at designated positions, prepared to execute safeguarding tasks. During each operational cycle, the equipment departs from and returns to these predefined locations. To verify task completion, every incoming target node’s effective interception zone must be traversed by at least one protective unit. Based on the real-time positional data of adversarial target nodes—collected via reconnaissance systems—along with their priority levels, optimal interception paths are planned for the protective equipment.
The task allocation problem primarily aims to minimize the total path length, thereby reducing energy consumption. However, if this were the sole objective, the optimized solution would assign all interception tasks to a single unit, resulting in prolonged operational durations and missed optimal interception windows for high-priority targets. To enhance mission timeliness, a secondary objective is introduced: distributing tasks across multiple units while minimizing the longest individual path length.
Furthermore, the varying priority levels of adversarial target nodes influence interception sequences and response dynamics. For instance, prioritizing the interception of a ground command center may degrade the responsiveness of secondary targets, thereby increasing the mission success rates. Higher-priority targets are therefore assigned elevated interception precedence.
These three objectives—(1) total path minimization, (2) workload balancing, and (3) priority-based scheduling—interact and constrain one another, necessitating concurrent optimization. Thus, the formulated task allocation scenario constitutes a multi-objective optimization problem (MOP).
The mathematical model is represented as follows.
A group of UAV protection systems performs coordinated multi-node safeguarding operations. Departing from initial positions , the systems follow predetermined paths to visit a set of target nodes distributed in non-cooperative zones before returning to their origin. During path planning, the current positions of target nodes , obtained through reconnaissance systems, are denoted by coordinates , with effective protection ranges represented by . The initial position is located at .
In order to describe the defense relationship between the interdictor units and the designated objective node, the assignment parameter is introduced; if the interdictor unit is assigned to the target node , and otherwise. Define as the set of designated objective nodes that the task execution unit is assigned to interdict, and the set of all destinations of protective unit is denoted as . For , denotes the transition of protective asset from location to location . The task sequence of protective asset is denoted as . Based on the above definition, the task allocation problem can be formulated as
Of these, constraints (5) and (6) ensure that each target node is interdicted by only one UAV; constraint (7) maintains flow conservation with both incoming and outgoing flows; constraints (8) and (9) guarantee that each target node is assigned to a UAV for servicing with no omissions. Due to the payload and range limitations of the UAV protective assets, constraints (10)–(12) limit the maximum number of nodes and operational range per UAV; constraint (11) restricts mission participation to designated protective UAVs.
3. Proposed Framework
The overall framework flowchart of this work is shown in Figure 1. The green box on the right illustrates the process framework for task allocation in defensive unmanned equipment using the LIA algorithm. The computational results of the LIA are used as input for the edge quality calculation. Through the edge quality calculation process, shown in the blue box at the upper left of Figure 1, the quality of each edge is computed and then serves as input for the defensive loop recommendation process. The gray framework at the bottom of Figure 1 corresponds to the defensive loop recommendation procedure.
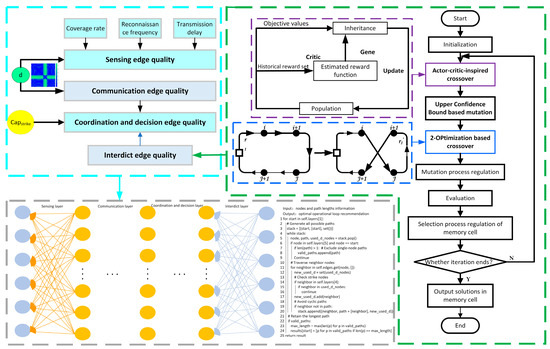
Figure 1.
Flowchart of mission planning cycle optimization issues.
3.1. Calculation of Edge Mass
3.1.1. Quality of Sensing Edge
Han Chi et al. obtained the underlying indicator data of aerospace sensing systems through joint simulation with MATLAB6.5 and STK5.0, discovered the association information between indicators based on the FP-Tree (Frequent Pattern-Tree) algorithm, removed redundancies, and determined the type of indicator association. This was combined with the Marichal entropy to establish an optimization model to determine the contributions of key performance indicators. The experiment concluded that the coverage rate, detection frequency, and transmission delay had large contributions to the performance of the space monitoring platform system [27]. Therefore, in this paper, we derive the quality of sensing edges between equipment nodes by the weighted summation of the coverage, detection frequency, and transmission delay. A schematic diagram of the defensive loop is shown in Figure 2.
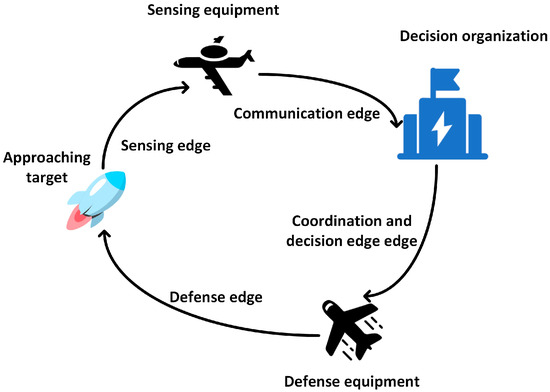
Figure 2.
The schematic diagram of the defensive loop.
- Probability of Coverage
Probability of coverage () refers to the proportion of the region of interest covered by sensing devices to the total monitoring area at a given time. In this paper, the covered area is geometrically simplified as a circular domain centered at the monitoring platform with the sensing range as the radius, calculated as per Equation (13):
where is the maximum horizontal coordinate of the target node and is the maximum vertical coordinate of the target node.
- Frequency of detection
Detection frequency () refers to the number of temporal coverages achievable by a sensing platform over a specified area per unit time, influenced by multiple factors, including the sensor performance, platform altitude, operational velocity, and scanning rate.
- Transmission delay
Transmission delay () refers to the time required for sensor data transmission from the remote sensing platform to the base station. The sensing platform emits sensing signals through its measurement system and analyzes the reflected signals to determine the object’s position, characteristics, etc.
In sensing signal propagation, the time delay is linearly proportional to the distance. Drawing upon established formulations for the sensing probability in signal theory [28,29], this study simplifies the transmission delay as the product of the sensor’s ranging capability and the distance between the sensor and the object to quantify the sensing performance (i.e., the sensing edge quality), as formalized in Equation (14):
where represents the sensing performance of sensor unit , and denotes the distance between the sensor and the target object. The data for these metrics were normalized and processed to be dimensionless. The coefficient of variation method (CVM) was selected to aggregate the metrics, based on their statistical characteristics, among the available weighting methods for multi-metric comprehensive evaluation [30].
where is the mean value of each indicator, is the standard deviation of each indicator, is the weight of the indicator, and is the total number of indicators.
Therefore, the sensing edge metric is calculated via formula (16):
3.1.2. Quality of Communication Edge
The quality of the data edge is determined by the corresponding equipment at each end of the connection that enables information exchange [31]. Communication between units in field deployments is predominantly wireless, and the information edge quality depends on the communication equipment at both the transmitting and receiving ends. The fundamental requirement for establishing a connection is that the signal energy reaching the receiver exceeds the minimum acceptable power of the receiver’s communication equipment [32]. Based on established communication theories, the connection probability is primarily affected by the signal propagation loss. Assuming favorable propagation conditions, in this study, the relationship between the propagation loss and distance is given by Equation (17):
where is the transmission frequency of the device, is the speed of light, and represents the distance between the two communication nodes. From Equation (17), it can be observed that, when the transmission frequency and the speed of light are constant, the signal attenuation is inversely proportional to the distance between the transceiver units. Therefore, when mapping the signal attenuation to the communication edge quality, the inter-node distance is normalized and subjected to inverse transformation to characterize the edge quality.
3.1.3. Quality of Coordination and Decision Edge
The quality of the command coordination edge reflects a control node’s capacity to direct task-performing UAVs. The generation of mission directives is the primary function of this edge, dependent on the information processing and control capabilities of the command units. Therefore, the coordination-and-decision edge quality corresponds to the node’s decision control capability and its communication reliability with the UAV mission systems (UAMS), as quantified in Equation (19):
3.1.4. Defense Edge
The quality of the interdict edge depends on both the interdictor range of the UAMS to complete assigned missions and the number of designated objectives. Thus, we calculate a dimensionless normalized metric through the weighted summation of the path distance of effector drones optimized by the immunity algorithm and the quantity of mission waypoints to quantify the mission execution edge quality.
where represents the travel distance of operational asset to complete its assigned mission j.
3.2. Improved Learning-Inspired Immunity Algorithm (LIA)
The immune algorithm (IA) is an intelligent optimization algorithm inspired by the biological immune system in natural science [33]; it introduces an immune operator based on the framework of the original standard genetic algorithm [34]. The learning-inspired immune algorithm (LIA) was developed from the non-dominated immune–endocrine short feedback algorithm (NISFA) proposed by L. Huang et al. [35]. The non-dominated immune–endocrine short feedback algorithm (NISFA) analyzes the relationships between the patrol paths of multiple robots and produces two types of undesired solutions: ‘redundant patrols’ and ‘overlapping patrols’. In addition, after calculating the crowding distance, only a few individuals are retained, and most of the individuals that may contain important information beneficial to the evolution of the population are discarded. To address the above problem, studies [36,37] have incorporated a Bayesian-based mechanism in the mutation process, which improves the search capabilities of the immune algorithm when used to plan robot patrol paths, as well as storing historical population information to retain potentially important information. In [38,39], the authors solve the problem of dealing with the balance between exploration and exploitation in the face of uncertainty based on the upper confidence bound-based (UCB) variant [40], which retains genes with high target values or genes with a lower frequency of occurrence in the offspring and incorporates the actor–critic idea based on the historical reward values at the same locus, constructing a reward function to evaluate the genes inherited from two parent individuals. All of the above algorithmic improvements focus on the global search algorithm; in this paper, we add an opt-2 local search operator after the mutation operation to balance the global exploration and local exploitation capabilities.
3.3. Defense Loop Optimization Algorithm
The defense loop optimization problem is a typical combinatorial optimization problem whose mathematical essence is to select an optimal defense loop from the set of candidate defense loops. In this paper, the effectiveness of each edge on a defense loop is aggregated into the loop performance metric, making the problem equivalent to finding the longest admissible cycle containing the target in the operational network. Thus, the defense loop optimization problem can be transformed into a shortest circuit problem in graph theory, allowing the design of an optimization algorithm using exact graph-theoretic methods.
4. Case Studies
In order to verify the feasibility and effectiveness of the above-recommended method of combat loops, the equipment information is obtained by consulting the data. Then, based on the concepts and conceptual ideas of systematic combat, unmanned equipment combat, and multi-domain joint combat, a sample red and blue confrontation engagement network in line with the actual situation is simulated and generated to carry out the application research.
4.1. Experimental Settings
4.1.1. Example Illustration and Data Description
The study adopts a scenario where the red side faces potential adversarial actions from the blue side, prompting the red side to initiate defensive measures. First, the red side employs real-time reconnaissance methods to acquire operational entity and system architecture data from the blue side. Based on a capability model for dynamic operational networks, the reconnaissance data are used to dynamically reconstruct the adversarial operational system that may pose a threat. This case study involves 18 defensive entities on the red side and 6 entities on the blue side.
4.1.2. Recommended Method of Calculating Defense Loops
Based on the computed capabilities of each functional edge, the algorithm employs a reverse chaining strategy to construct mission execution cycles. Starting from the task execution capabilities of UAVs, it sequentially integrates command coordination edges and sensing edges to form complete operational sequences. Nodes not included in these cycles are assigned to individual UAV operations during planning, with their paths determined using conventional shortest-path algorithms.
The defense loop optimization algorithm follows an exclusive task assignment principle, ensuring that each UAV is allocated to only one defense loop at any given time. This methodology achieves closed-loop mission coordination through the backward integration of functional layers (execution → control → perception), while discrete targets are assigned via graph-theoretic shortest-path allocation. Ultimately, this approach maximizes system efficiency under strict UAV resource scheduling constraints.
4.2. Experimental Results and Analysis
4.2.1. Improved LIA Algorithm
The improved LIA algorithm yielded six non-dominated solutions, as shown in Table 1. An analysis of the Pareto frontier’s objective space distribution reveals characteristic multi-objective trade-offs: solution 3 achieves optimal performance in (total path length) but shows relatively higher values in ; solutions 2 and 5 demonstrate superior performance in at the expense of increased values (308 and 314 units, respectively); while solutions 1, 4, and 6 maintain a consistent response level of 0.747046 in (emergency degree orientation), while exhibiting differentiated balancing patterns between the and dimensions. This distribution clearly illustrates the inherent compromise relationships in multi-objective optimization problems.

Table 1.
Pareto front solutions computed via the LIA.
The six non-dominated solutions form the Pareto front, with their three-dimensional objective function values distributed as shown in Figure 3a,b. Subfigures (a) and (b) in Figure 3 represent two views of the same subject from different observation angles. The visualization presents the convex hull boundary of the Pareto front solutions obtained through the LIA algorithm for this multi-objective optimization problem. The solution set exhibits a non-linear distribution, with dense clusters concentrated in the and intervals, indicating significant trade-off relationships between objectives. Solution r4 represents an extreme preference for optimizing (minimizing total path length), while solution r5 demonstrates an extreme preference for optimizing (minimizing the longest sub-path length). The blue-marked convex hull boundary displays strict convexity, verifying the conflicting nature of the objective functions. The changing slope of the boundary reveals that, for every 1-unit improvement in , requires a sacrifice of 0.02–0.05 units, with the marginal rate of substitution varying dynamically according to the solution positions. Frontier analysis identifies distinct ‘knee point’ solutions r1 and r6, where abrupt changes in the marginal rate of substitution occur before and after these points, serving as critical boundaries for decision-makers when evaluating preference trade-offs. The visualization intuitively demonstrates the fundamental contradictions inherent in multi-objective optimization, providing a quantitative foundation for the selection of Pareto-optimal solutions.
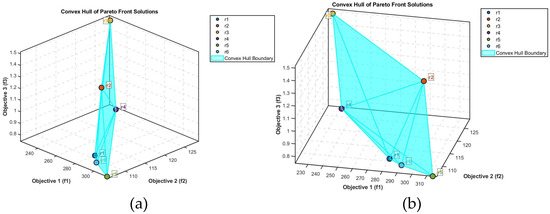
Figure 3.
Spatial distribution characteristics of the Pareto solution set.
The task allocation and path planning diagrams corresponding to the Pareto solution set are illustrated in Figure 4. Specifically, sub-figures (a), (b), (c), (d), (e), and (f) demonstrate solutions that prioritize engaging the high-priority objective B601, as evidenced by their corresponding lower priority scores (time sensitivity index).
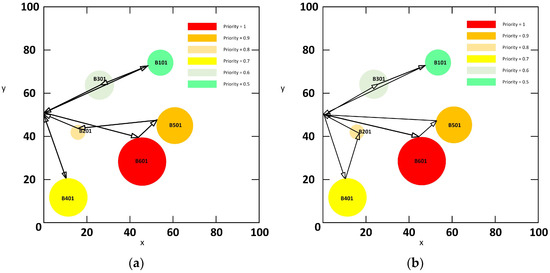
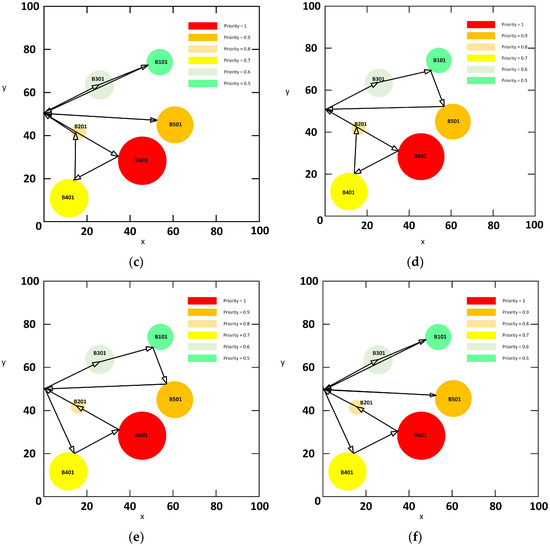
Figure 4.
Task assignment visualization path diagram.
The multi-objective task execution sequence for UAV mission systems (UAMS), derived from the route optimization graph in the LIA Pareto-optimal solution set, is presented in Table 2.
Table 2.
Combinatorial target engagement sequence.
4.2.2. Algorithm Stability Analysis
After independently executing the proposed algorithm 30 times, we calculated the mean ± standard deviation and coefficient of variation for each objective in the Pareto frontier, as presented in Table 3.
Table 3.
The mean ± standard deviation and coefficient of variation for each objective in the Pareto frontier.
The coefficient of variation (CV = standard deviation/mean) is a standardized metric for evaluating data dispersion, where lower values indicate better stability. CV < 0.15 signifies good stability, 0.15 ≤ CV < 0.3 indicates moderate fluctuations, and CV ≥ 0.3 reflects poor stability.
For objective f1 (CV = 0.0422), the extremely low CV (<0.05) demonstrates that the algorithm’s output mean is highly stable, with solution sets from different runs exhibiting strong consistency in f1. Objective f2 (CV = 0.0269) shows an even lower CV than f1, confirming optimal stability and robust algorithmic control over this objective.
In contrast, objective f3 exhibits a broader distribution of Pareto solutions (e.g., some solutions cluster at 0.747 and 1.494, differing by a factor of two). Consequently, f3’s CV approaches 0.2, falling within the moderate fluctuation range, indicating some variability in the mean values across different runs.
In summary, these results validate the stability of the proposed heuristic algorithm.
4.2.3. Computed Results for Heterogeneous Edge Quality Metrics
Based on the computational framework described in Section 3.1, we evaluate the sensing link performance between Group A and Group B platforms, along with the data transmission efficiency and coordination effectiveness among Group A units. The operational effectiveness of Group A platforms against Group B objectives is calculated using the coordinated single-objective optimization methodology from Section 3.2. These heterogeneous link metrics are presented in the heatmaps in Figure 5, where darker shading represents higher performance levels.
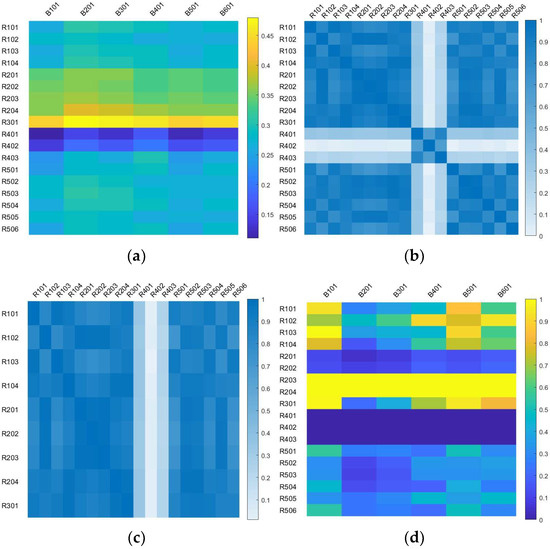
Figure 5.
Heatmaps of mass values for each edge: (a) mass of sensing edge, (b) mass of communication edge, (c) mass of coordination and decision edge, (d) mass of task execution edge.
An analysis of the communication heatmap reveals that node R301 demonstrates the strongest overall sensing capabilities, evidenced by its darker-shaded data transmission and coordination ranges. Nodes R203 and R204 show particularly high task execution performance.
Furthermore, when disregarding platform reuse constraints and optimizing for maximum link performance, the results (Table 4) show that R301 and R204 appear in every recommended operational sequence for objective engagement. These nodes are therefore classified as high-value components within the networked operational system.
Table 4.
Constraint-free engagement loop recommendation enables identification of critical nodes.
4.2.4. Recommended Results for Combat Loops
The defense loop optimization problem incorporating multi-domain link performance metrics is addressed through a two-phase optimization process. In Phase 1, the algorithm generates optimal defense loops for multi-criteria operational quality assessment, while Phase 2 processes cycle recommendations for the remaining objective nodes not assigned to task-performing UAV platforms. The proposed methodology prioritizes high-value and composite objectives, resulting in a sequential processing approach that first addresses priority objectives B601, B401, and B201, followed by B101 and B501, with B301 processed last.
A fundamental constraint common to both phases stems from the sequential nature of operations—UAV mission systems (UMS) assigned to one objective cannot simultaneously serve as sensing, communication, or coordination nodes for other objectives. Working within this constraint framework, the algorithm successfully identifies the most efficient operational cycles for each objective node, yielding a solution with a total defense loop length of 2.29 units, as shown in Table 5.
Table 5.
Multi-node target package defense loop recommendations.
The two-phase architecture ensures complete coverage of all designated objectives, optimal resource allocation under operational constraints, and quantifiable performance metrics.
Traditional defense loop optimization methods can only complete one operational cycle for a single objective under the non-reuse constraint for task-performing platforms. As shown in Table 6, this conventional approach results in a total defense loop length of 5.14 units. In contrast, the proposed multi-objective coordinated cycle optimization method reduces the total path length from the baseline value of 5.14 to 2.29 units, demonstrating a 55.45% improvement in operational efficiency.
Table 6.
Single-node target defense loops recommendation.
The defense loops for processing objectives B101/B501 in the table demonstrate how platform R201 operates with combined sensing and task execution functionalities. If these nodes lose their multifunctional capacity, the corresponding link metrics are reset to the baseline values before cycle optimization precomputation. The multi-objective coordinated operation results are presented in Table 7, while single-objective operation sequences are documented in Table 8.
Table 7.
Multi-node target package defense loop recommendations under R201, R202, R203 detection degradation.
Table 8.
Single-node target package defense loop recommendations under R203 detection degradation.
The developed multi-criteria integrated approach reduces the total path length from the baseline 5.30 units to 2.35 units, representing a 55.66% improvement in system efficiency. Both the original and adjusted cycle configurations show significantly enhanced operational performance, confirming the effectiveness of the proposed methodology.
The computational efficiency analysis reveals that the task allocation experiments executed on an Windows 11 system with an Intel(R) Core(TM) i5-12600kf CPU platform completed 100 generations of optimization in 555.50 s, averaging 5.55 s per generation. The crossover operation emerged as the dominant computational component, consuming 96.6% of the runtime (5.36 s/generation) with complexity of O() = O(7200), while the mutation operation accounted for 1.3% (0.07 s/generation) and the repair operation required 0.11 s/generation. Notably, the defense loop recommendation process demonstrated high efficiency, with a completion time of merely 1.34 s. For the current problem scale involving 18 UAVs and 6 targets, the complete task planning cycle can be executed within 10 min, satisfying the temporal requirements characteristic of military decision-making processes and confirming the algorithm’s suitability for real-time mission-critical applications. This performance profile substantiates the method’s practical viability in operational scenarios where a rapid response is paramount. The balanced distribution of the computational load across different operations, coupled with the efficient defense loop recommendation, ensures timely solutions without compromising solution quality.
4.2.5. Algorithm Comparison
The Non-Dominated Sorting Genetic Algorithm II (NSGA-II) is a widely used multi-objective optimization method that improves upon the original NSGA. It sorts solutions into Pareto fronts to handle competing objectives, uses a crowding distance to maintain solution diversity, and implements elitism to preserve high-quality solutions. This efficient approach makes NSGA-II a standard benchmark in comparing optimization algorithms across various fields.
This paper compares the LIA algorithm with the NSGA-II algorithm. The Pareto-optimal solution set obtained by the NSGA-II algorithm is presented in Table 9.
Table 9.
The Pareto-optimal solution set obtained by the NSGA-II algorithm.
To quantitatively evaluate the solution sets, four performance metrics were calculated: the hypervolume (HV) to measure the volume enclosed by the solution set and a reference point, spacing (SP) to assess the uniformity of solution distribution, spread (Δ) to quantify the extent of mutual dominance between solution sets, and the C-metric to evaluate the mutual dominance relationship between the two solution sets. The computational results are presented in Table 10.
Table 10.
Parameter comparison of the Pareto front solutions for the two algorithms.
The coefficient of variation (CV = standard deviation/mean) serves as a standardized metric in assessing data dispersion, with lower values indicating superior stability, where CV < 0.15 denotes good stability, 0.15 ≤ CV < 0.3 suggests moderate fluctuations, and CV ≥ 0.3 reflects poor stability. The analysis demonstrates outstanding stability in f1 optimization (CV = 0.0422, <0.05), with the solution sets exhibiting high consistency across independent runs, while f2 shows even better algorithmic robustness (CV = 0.0269). For f3, the moderate CV ≈ 0.2 corresponds to its broader Pareto solution distribution (e.g., values clustered at 0.747 and 1.494, differing by 100%), reflecting inherent multi-objective trade-offs. These results collectively validate the algorithm’s stable performance, with all objectives maintaining CVs below the moderate fluctuation threshold, confirming its reliability in handling complex optimization challenges while achieving consistent solutions across multiple runs.
4.2.6. Sensitivity Analysis
This paper further verifies the algorithmic stability by examining how different weight selections influence the resulting pathways. The entropy weight method (EWM) is employed to calculate the weights. As an objective weighting approach, the entropy weight method determines weights through data standardization and entropy value computation. Its core steps and formulas are as follows.
Step 1: Data Standardization—Positive Indicators (, )
Step 2: Data Standardization—Negative Indicators ()
Step 3: Proportion Calculation
Step 4: Information Entropy Calculation
When , .
Step 5: Calculation of Discrepancy Coefficient
Step 6: Weight Determination
The weights calculated through the entropy weight method (EWM) and the contingent valuation method (CVM) are presented in Table 11.
Table 11.
The weights calculated through the Entropy Weight Method (EWM) and the Contingent Valuation Method (CVM).
The recommended defensive ring results based on the entropy weight method (EWM)-derived weights are presented in Table 12.
Table 12.
The recommended defensive ring results based on entropy weight method (EWM)-derived weights.
The path optimization results under the two weighting schemes reveal three key findings: (1) total cost stability—under identical node groupings, the EWM and CVM yield nearly identical total costs (2.27 vs. 2.29, Δ = 0.02, 0.87% relative difference), demonstrating system-level robustness to weight selection; (2) structural consistency—both schemes converge on critical paths (R301→R204) and maintain the functional chain; (3) localized trade-offs—minor variations reflect expected algorithm responses to weighted performance criteria (transmission delay weights favoring R203’s superior communication performance over geometric proximity). This analysis confirms the model’s dual capabilities: maintaining core solution stability while allowing mission-specific tuning through weight adjustments.
5. Conclusions
This study first constructs a networked engagement system model using heterogeneous network modeling based on operational unit attributes. Subsequently, it quantifies edge performance metrics for sensing, data transmission, and command coordination between Group A assets and Group B objectives, as well as among Group A assets. An enhanced learning-inspired algorithm (LIA) is then employed to determine optimal task node combinations and routing paths for operational platforms, thereby deriving engagement performance metrics. Finally, a defense loop optimization algorithm generates objective-specific operational sequences, improving the engagement efficiency by 56.8% compared to single-objective node-based optimization methods.
The edge performance quantification process enables the identification of critical hub nodes within the operational network through data-driven analysis, with the results cross-validated against unconstrained single-objective engagement recommendations. As a heuristic approach, the proposed task allocation and path planning methodology demonstrates substantial computational resource requirements when scaling to complex, large-scale problems. Additionally, the modified learning-inspired algorithm (LIA) currently does not incorporate heterogeneity in unmanned aerial combat framework (UACF) parameters during asset assignment. In field deployment scenarios, variations in payload capacity and operational range across task-performing platforms may impact allocation effectiveness. Future research directions include (1) the development of optimized intelligent algorithms to enhance the computational efficiency and (2) the incorporation of UACF heterogeneity parameters for realistic mission planning.
Author Contributions
Conceptualization, S.Z.; Methodology, S.Z.; Validation, M.L., S.Z., C.H. and Z.X.; Formal analysis, S.Z.; Data curation, S.Z.; Writing—original draft, S.Z.; Writing—review and editing, S.Z., C.H., D.Z. and Z.X.; Visualization, S.Z.; Supervision, M.L., C.H., D.Z. and K.Y.; Project administration, M.L. and K.Y.; Funding acquisition, M.L. and K.Y. All authors have read and agreed to the published version of the manuscript.
Funding
This research was funded by Simulation Modeling and Decision Theory for Intelligent Manufacturing Integrated Management Based on Digital Twin, grant number 72231011.
Data Availability Statement
Data sharing is not applicable (only appropriate if no new data is generated or the article describes entirely theoretical research).
DURC Statement
The current research is limited to the Advances in Cartography, Mission Planning, Path Search, and Path Following for Drones, which is beneficial to defensive system construction and does not pose a threat to public health or national security. The authors acknowledge the dual-use potential of the research involving mission loop generation for unmanned aerial mission systems (UAMS) in collaborative defense and confirm that all necessary precautions have been taken to prevent potential misuse. As an ethical responsibility, the authors strictly adhere to relevant national and international laws about DURC. The authors advocate for responsible deployment, ethical considerations, regulatory compliance, and transparent reporting to mitigate misuse risks and foster beneficial outcomes.
Conflicts of Interest
The authors declare no conflicts of interest.
References
- Bakirci, M. A novel swarm unmanned aerial vehicle system: Incorporating autonomous flight, real-time object detection, and coordinated intelligence for enhanced performance. Trait. Du Signal 2023, 40, 2063–2078. [Google Scholar] [CrossRef]
- National University of Defense Technology. Combat Loop Recommendation Method, System, Device, and Storage Medium Based on Graph Theory Algorithm. CN202111084085.2[P], 22 October 2021. [Google Scholar]
- Xia, B.Y.; Yang, K.W.; Yang, Z.W.; Zhang, X.K.; Zhao, D.L. Multi-objective optimization of equipment combination based on kill web assessment. Syst. Eng. Electron. 2021, 43, 399–409. [Google Scholar] [CrossRef]
- Li, J.; Tan, Y.J. A combat loop recommendation method based on integrated improved ant colony algorithm. Syst. Eng. Electron. 2024, 46, 2002–2012. [Google Scholar]
- Brailsford, S.C. Constraint Satisfaction Problems: Algorithms and Applications. Eur. J. Oper. Res. 1999, 119, 557–581. [Google Scholar] [CrossRef]
- Wolsey, L.A.; Nemhauser, G.L. Integer and Combinatorial Optimization; John Wiley & Sons: New York, NY, USA, 1999. [Google Scholar] [CrossRef]
- Morrison, D.R.; Jacobson, S.H.; Sauppe, J.J.; Sewell, E.C. Branch-and-bound algorithms: A survey of recent advances in searching, branching, and pruning. Discret. Optim. 2016, 19, 79–102. [Google Scholar] [CrossRef]
- Achterberg, T.; Koch, T.; Martin, A. Branching rules revisited. Oper. Res. Lett. 2005, 33, 42–54. [Google Scholar] [CrossRef]
- Rossi, F.; Van Beek, P.; Walsh, T. Handbook of Constraint Programming; Elsevier: Amsterdam, The Netherlands, 2006. [Google Scholar]
- Bellman, R.; Kalaba, R. Dynamic Programming and Statistical Communication Theory. Proc. Natl. Acad. Sci. USA 1957, 43, 749–751. [Google Scholar] [CrossRef]
- Tian, F.; Ma, Z.F. Graph and Network Flow Theory; Operations Research Series; Science Press: Beijing, China, 1987; p. 269. ISBN 13031-3656. [Google Scholar]
- Wen, J.; Yang, J.; Wang, T. Path Planning for Autonomous Underwater Vehicles Under the Influence of Ocean Currents Based on a Fusion Heuristic Algorithm. IEEE Trans. Veh. Technol. 2021, 70, 8529–8544. [Google Scholar] [CrossRef]
- Ghahramani, M.; Zhou, M.; Molter, A.; Pilla, F. IoT-based route recommendation for an intelligent waste management system. IEEE Internet Things J. 2022, 9, 11883–11892. [Google Scholar] [CrossRef]
- Lei, Z.; Gao, S.; Zhang, Z.; Zhou, M.; Cheng, J. MO4: A Many-Objective Evolutionary Algorithm for Protein Structure Prediction. IEEE Trans. Evol. Comput. 2022, 26, 417–430. [Google Scholar] [CrossRef]
- Gad, A.G.; Houssein, E.H.; Zhou, M.; Suganthan, P.N.; Wazery, Y.M. Damping-assisted evolutionary swarm intelligence for Industrial IoT task scheduling in cloud computing. IEEE Internet Things J. 2023, 11, 1698–1710. [Google Scholar] [CrossRef]
- Feng, O.; Zhang, H.; Tang, W.; Wang, F.; Feng, D.; Zhong, G. Digital Low-Altitude Airspace Unmanned Aerial Vehicle Path Planning and Operational Capacity Assessment in Urban Risk Environments. Drones 2025, 9, 320. [Google Scholar] [CrossRef]
- Ma, B.; Ji, Y.; Fang, L. A Multi-UAV Formation Obstacle Avoidance Method Combined with Improved Simulated Annealing and an Adaptive Artificial Potential Field. Drones 2025, 9, 390. [Google Scholar] [CrossRef]
- Glover, F. Future paths for integer programming and edges to artificial intelligence. Comput. Oper. Res. 1986, 13, 533–549. [Google Scholar] [CrossRef]
- Zhan, S.; Lin, J.; Zhang, Z.; Zhong, Y. List-Based Simulated Annealing Algorithm for Traveling Salesman Problem. Comput. Intell. Neurosci. 2016, 2016, 1712630. [Google Scholar] [CrossRef]
- Kennedy, J.; Eberhart, R. Particle swarm optimization. In Proceedings of the ICNN’95—International Conference on Neural Networks, Perth, WA, Australia, 27 November–1 December 1995; Volume 4, pp. 1942–1948. [Google Scholar] [CrossRef]
- Bassolillo, S.R.; D’Amato, E.; Notaro, I.; D’Agati, L.; Merlino, G.; Tricomi, G. Bridging ACO-Based Drone Logistics and Computing Continuum for Enhanced Smart City Applications. Drones 2025, 9, 368. [Google Scholar] [CrossRef]
- Trivedi, A.; Srinivasan, D.; Sanyal, K.; Ghosh, A. A Survey of Multiobjective Evolutionary Algorithms Based on Decomposition. IEEE Trans. Evol. Comput. 2017, 21, 440–462. [Google Scholar] [CrossRef]
- Goldberg, D.E.; Korb, B.; Deb, K. Messy genetic algorithms: Motivation, analysis, and first results. Complex Syst. 1989, 3, 493–530. [Google Scholar]
- Farmer, J.D.; Packard, N.H.; Perelson, A.S. The immune system, adaptation, and machine learning. Phys. D Nonlinear Phenom. 1986, 22, 187–204. [Google Scholar] [CrossRef]
- Yang, Y.H.; Li, J.H.; Shen, D.; Nan, M.L.; Cui, Q. Dynamic evolution model for complex networks with multiple edge fusion. J. Xi’an Jiaotong Univ. 2016, 50, 132–139. [Google Scholar] [CrossRef]
- Zhu, T.; Liang, W.T.; Huang, S.H.; Zhang, J. Research on modeling and analyzing method of task-oriented network information system of systems. J. Syst. Simul. 2020, 32, 727–737. [Google Scholar] [CrossRef]
- Li, J.C.; Zhao, D.L.; Ge, B.F.; Yang, K.W.; Chen, Y.W. A link prediction method for heterogeneous networks based on BP neural network. Phys. A Stat. Mech. Its Appl. 2018, 495, 1–17. [Google Scholar] [CrossRef]
- Guo, Z.X.; Jiang, J. A model for calculating radar detection probability at different distances. J. Air Force Radar Coll. 2003, 17, 7–9. [Google Scholar]
- Lv, Z.Y.; Zhong, C.F. Calculation method of radar detection probability distribution. In Proceedings of the Zhuhai Aviation Symposium on Aeronautical Communication and Navigation, Zhuhai, China, 30 May–1 June 1998; Aviation Society of China: Beijing, China, 1998. [Google Scholar]
- Yang, Y. Evaluation of assignment methods in multi-indicator comprehensive evaluation. Stat. Decis. 2006, 17–19. [Google Scholar]
- Xia, M. Research on Reliability Assurance Technology for Wireless Sensor Network Systems. Ph.D. Thesis, Zhejiang University, Hangzhou, China, 2009. [Google Scholar]
- Aznar, F.; Pujol, M.; Rizo, R.; Pujol, F.A.; Rizo, C. Energy-Efficient Swarm Behavior for Indoor UAV Ad-Hoc Network Deployment. Symmetry 2018, 10, 632. [Google Scholar] [CrossRef]
- Chen, R. Fundamentals of Immunology; People’s Medical Publishing House: Beijing, China, 1982. [Google Scholar]
- Wang, L.; Pan, J.; Jiao, L.C. Immunity algorithm. J. Electron. 2000, 74–78. [Google Scholar]
- Huang, L.; Zhou, M.C.; Hao, K. Non-dominated immune-endocrine short feedback algorithm for multi-robot maritime patrolling. IEEE Trans. Intell. Transp. Syst. 2020, 21, 362–373. [Google Scholar] [CrossRef]
- Xu, N.; Ding, Y.; Ren, L.; Hao, K. Degeneration recognizing clonal selection algorithm for multimodal optimization. IEEE Trans. Cybern. 2018, 48, 848–861. [Google Scholar] [CrossRef] [PubMed]
- Huang, L.; Ding, Y.; Zhou, M.; Jin, Y.; Hao, K. Multiplesolution optimization strategy for multirobot task allocation. IEEE Trans. Syst. Man Cybern. Syst. 2020, 50, 4283–4294. [Google Scholar] [CrossRef]
- Huang, L.; Zhou, M.; Han, H.; Wang, S.; Albeshri, A. Learning-Inspired Immune Algorithm for Multiobjective-Optimized Multirobot Maritime Patrolling. IEEE Internet Things J. 2023, 11, 9870–9881, early access. [Google Scholar] [CrossRef]
- Hao, B.T.; Abbasi-Yadkori, Y.; Wen, Z.; Cheng, G. Bootstrapping Upper Confidence Bound. Statistics 2019, 2, 12123–12133. [Google Scholar] [CrossRef]
- Auer, P.; Fischer, P.; Cesa-Bianchi, N. Finite-time Analysis of the Multiarmed Bandit Problem. Mach. Learn. 2002, 47, 235–256. [Google Scholar] [CrossRef]
Disclaimer/Publisher’s Note: The statements, opinions and data contained in all publications are solely those of the individual author(s) and contributor(s) and not of MDPI and/or the editor(s). MDPI and/or the editor(s) disclaim responsibility for any injury to people or property resulting from any ideas, methods, instructions or products referred to in the content. |
© 2025 by the authors. Licensee MDPI, Basel, Switzerland. This article is an open access article distributed under the terms and conditions of the Creative Commons Attribution (CC BY) license (https://creativecommons.org/licenses/by/4.0/).