Article

An Aircraft Skin Defect Detection Method with UAV Based on GB-CPP and INN-YOLO

1
Faculty of Civil Aviation and Aeronautics, Kunming University of Science and Technology, Kunming 650500, China
2
Yunnan Technology Innovation Center of Low-Altitude Economy and UAV, Kunming 650500, China
3
Faculty of Civil Engineering and Mechanics, Kunming University of Science and Technology, Kunming 650500, China
4
School of Aeronautic Science and Engineering, Beihang University, Beijing 100191, China
*
Authors to whom correspondence should be addressed.
Drones 2025, 9(9), 594; https://doi.org/10.3390/drones9090594
Submission received: 21 July 2025 / Revised: 17 August 2025 / Accepted: 21 August 2025 / Published: 22 August 2025
(This article belongs to the Section Artificial Intelligence in Drones (AID))

Abstract

Highlights

What are the main findings?
  • In the task of using drones for aircraft skin inspection, a coverage path planning method based on greedy algorithm and breadth-first search (GB-CPP) was proposed.
  • The proposed INN-YOLO algorithm, based on YOLOv11, demonstrated superior performance in comparative experiments on three public datasets.
What is the implication of the main finding?
  • Proposes a collaborative framework integrating geometry-guided coverage path planning with a lightweight detection network to optimize UAV inspection routes and enable real-time defect identification, thereby enhancing operational efficiency and intelligence levels.
  • The INN-YOLO detection model meets the onboard low-latency requirements, supporting immediate decision-making and feedback during the inspection process.
  • The proposed collaborative framework promotes a closed-loop system of “precise path planning—efficient image acquisition—onboard real-time recognition,” providing a replicable industrial solution for automated inspection of large-scale infrastructure such as aviation facilities.

Abstract

To address the problems of low coverage rate and low detection accuracy in UAV-based aircraft skin defect detection under complex real-world conditions, this paper proposes a method combining a Greedy-based Breadth-First Search Coverage Path Planning (GB-CPP) approach with an improved YOLOv11 architecture (INN-YOLO). GB-CPP generates collision-free, near-optimal flight paths on the 3D aircraft surface using a discrete grid map. INN-YOLO enhances detection capability by reconstructing the neck with the BiFPN (Bidirectional Feature Pyramid Network) for better feature fusion, integrating the SimAM (Simple Attention Mechanism) with convolution for efficient small-target extraction, as well as employing RepVGG within the C3k2 layer to improve feature learning and speed. The model is deployed on a Jetson Nano for real-time edge inference. Results show that GB-CPP achieves 100% surface coverage with a redundancy rate not exceeding 6.74%. INN-YOLO was experimentally validated on three public datasets (10,937 images) and a self-collected dataset (1559 images), achieving mAP@0.5 scores of 42.30%, 84.10%, 56.40%, and 80.30%, representing improvements of 10.70%, 2.50%, 3.20%, and 6.70% over the baseline models, respectively. The proposed GB-CPP and INN-YOLO framework enables efficient, high-precision, and real-time UAV-based aircraft skin defect detection.

1. Introduction

Aircraft skin, as a key structure directly exposed to the external environment, is prone to defects such as cracks and dents during service due to aerodynamic loads and foreign object impacts. If left untreated, these defects can not only shorten the lifespan of the aircraft but also potentially lead to serious safety accidents. Therefore, to control skin aging and prevent structural failures, regular and efficient detections are crucial [1]. However, traditional manual detections are time-consuming, inefficient, highly subjective, and prone to high missed detection rates, making them inadequate for meeting the demands of modern aviation maintenance and limiting the reliability and efficiency of detection tasks.
Unmanned Aerial Vehicles (UAVs), due to their flexibility and maneuverability, have become ideal tools for image acquisition in high-altitude or hard-to-reach areas, making them suitable for the rapid detection of cracks and dent damages on aircraft skin surfaces [2,3,4]. To ensure comprehensive and efficient collection of image information from the entire target aircraft surface, the primary task is to design a UAV flight trajectory that covers the whole surface—that is, to solve the Coverage Path Planning (CPP) problem [5,6,7,8]. Jing et al. [9] proposed combining the artificial potential field method [10] with random sampling methods [11] to generate and optimize viewpoints for achieving visual coverage. Jung et al. [12] performed 3D structure detection using hierarchical viewpoint extraction and layer-by-layer path planning. Tong et al. [13] generated rotating viewpoints based on the target’s geometry, solved the set cover problem to find the optimal viewpoint set, and then transformed it into a traveling salesman problem to determine the shortest path. Almadhoun et al. proposed the SSCPP method based on graph search algorithms [14] and improved the viewpoint sampling strategy by designing the ASSCPP algorithm [15] to meet predefined coverage requirements. Papaioannou et al. [16] treated CPP as a constrained open-loop optimal control problem and used mixed-integer programming to optimize and generate the best detection trajectory. Jing et al. [17] generated viewpoints and path primitives through voxel operations, constructed a coverage graph, and completed the detection task via graph search algorithms. However, existing studies have not fully covered the entire outer surface of the aircraft in viewpoint selection. Moreover, most approaches fail to consider the impact of shooting distance on detection accuracy, neglect the computational complexity and time consumption of the proposed path planning algorithms, and do not ensure that the UAV camera remains constantly oriented toward the object under detection.
With the advancement of technology, structural detection methods have evolved from traditional manual patrols to fully automated intelligent detections. Vision-based detection systems utilizing UAV platforms have garnered widespread attention in structural health monitoring due to their advantages of high efficiency, safety, and strong scalability [18,19,20,21,22]. Current primary detection models include Faster R-CNN [23], YOLO [24], and SSD [25]. Zhang et al. [26] proposed the FC-YOLO algorithm for aircraft skin defect detection; Malekzadeh et al. [27] utilized Deep Neural Networks (DNN) for detecting defects on aircraft; Ramalingam et al. [28] combined SSD with MobileNet on a reconfigurable robot to enhance the detection of stains and defects on aircraft skin. Li et al. [29] introduced YOLO-FDD specifically targeting defects in aircraft skin fasteners; Wang et al. [30] improved the YOLOv8n model for ASD detection; Bouarfa et al. [31] applied Mask R-CNN along with transfer learning to automatically identify dents in aircraft structures, while Doğru et al. [32] integrated data processing and enhancement techniques, significantly improving dent detection accuracy. Ding et al. [33] enhanced the Mask Scoring R-CNN algorithm to achieve pixel-level detection of surface defects on skins. However, existing research has largely focused on optimizing network architectures and designing data augmentation strategies to achieve higher detection accuracy [34,35]. Although these methods perform well in laboratory environments, their real-time performance and deployability are often overlooked in practical UAV-based detection scenarios. This is due to the limited computational resources and power constraints of onboard edge devices; many improved models have a large number of parameters and slow inference speeds, making it difficult to meet the low-latency response requirements during flight. Therefore, how to build a lightweight and efficient detection framework while maintaining detection accuracy, and to optimize path planning to reduce redundant image acquisition, remains a key challenge in current UAV-assisted structural detection [36].
To address the aforementioned issues, this paper proposes a collaborative framework that integrates geometrically guided coverage path planning (GB-CPP) with a lightweight INN-YOLO detection network, aiming to balance detection completeness, accuracy, and real-time performance, thereby enhancing the intelligence and automation level of aircraft skin detection. Specifically, we first developed a CPP method based on a combination of the greedy algorithm and the Breadth-First Search (BFS) algorithm, enabling the UAV to efficiently complete detection tasks along an optimal flight path. Subsequently, the state-of-the-art YOLOv11n architecture was improved. The enhanced model, while maintaining high accuracy, was deployed onto the Jetson Nano [37], enabling near real-time defect analysis of aircraft skin images during UAV detection missions. Specifically, as the UAV flies along the planned route and continuously captures images, the improved lightweight detection model can perform defect identification on a single frame within approximately 3 milliseconds, meeting the low-latency inference requirements of the onboard platform and supporting immediate feedback and decision-making throughout the detection process. The proposed method facilitates the closed-loop system of “precise path planning–efficient image acquisition–onboard real-time detection” and provides a replicable technical solution for the automated detection of large-scale infrastructure such as aircraft, wind turbines, and bridges, thus promoting the industrialization and large-scale application of intelligent detection.
The remainder of this paper is structured as follows: In Section 2, an overview of the GB-CPP method, the strategies for improving the network model, and the model deployment approach are presented. Section 3 introduces the results of CPP and model training. Section 4 discusses the feasibility and limitations of the proposed method, supported by visualized results. Section 5 provides a brief summary of the conclusions drawn.

2. Methodology

The primary objective of this study is to integrate GB-CPP with INN-YOLO for the automatic detection of aircraft skin defects. The proposed methodological framework is illustrated in Figure 1. First, a UAV flight path covering the aircraft’s surface is planned using a greedy algorithm and the Breadth-First Search (BFS) algorithm. Subsequently, an improved target detection model with higher accuracy was built based on the YOLOv11n model. Finally, the developed network model was deployed on a Jetson Nano.

2.1. UAV Coverage Path Planning

To address the detection of aircraft skin defects, this study proposes a UAV-based detection method utilizing GB-CPP. As shown in Figure 2, a 3D aircraft model is used to illustrate the UAV path planning process in this research. First, the model is voxelized and represented using an octree structure. Subsequently, the model space is discretized into a grid, and the grid attributes are labeled based on the voxel model to identify and extract the grid regions representing the aircraft surface for viewpoint sampling. After viewpoint sampling, the visibility direction is generated using the probabilistic potential field method. Finally, the set of labeled viewpoints is used to explore the space under distance constraints through a BFS algorithm, and the greedy algorithm is applied to connect all the viewpoints, forming a complete coverage flight path over the aircraft surface, thereby achieving efficient and comprehensive detection of skin defects.

2.1.1. Model Voxelization

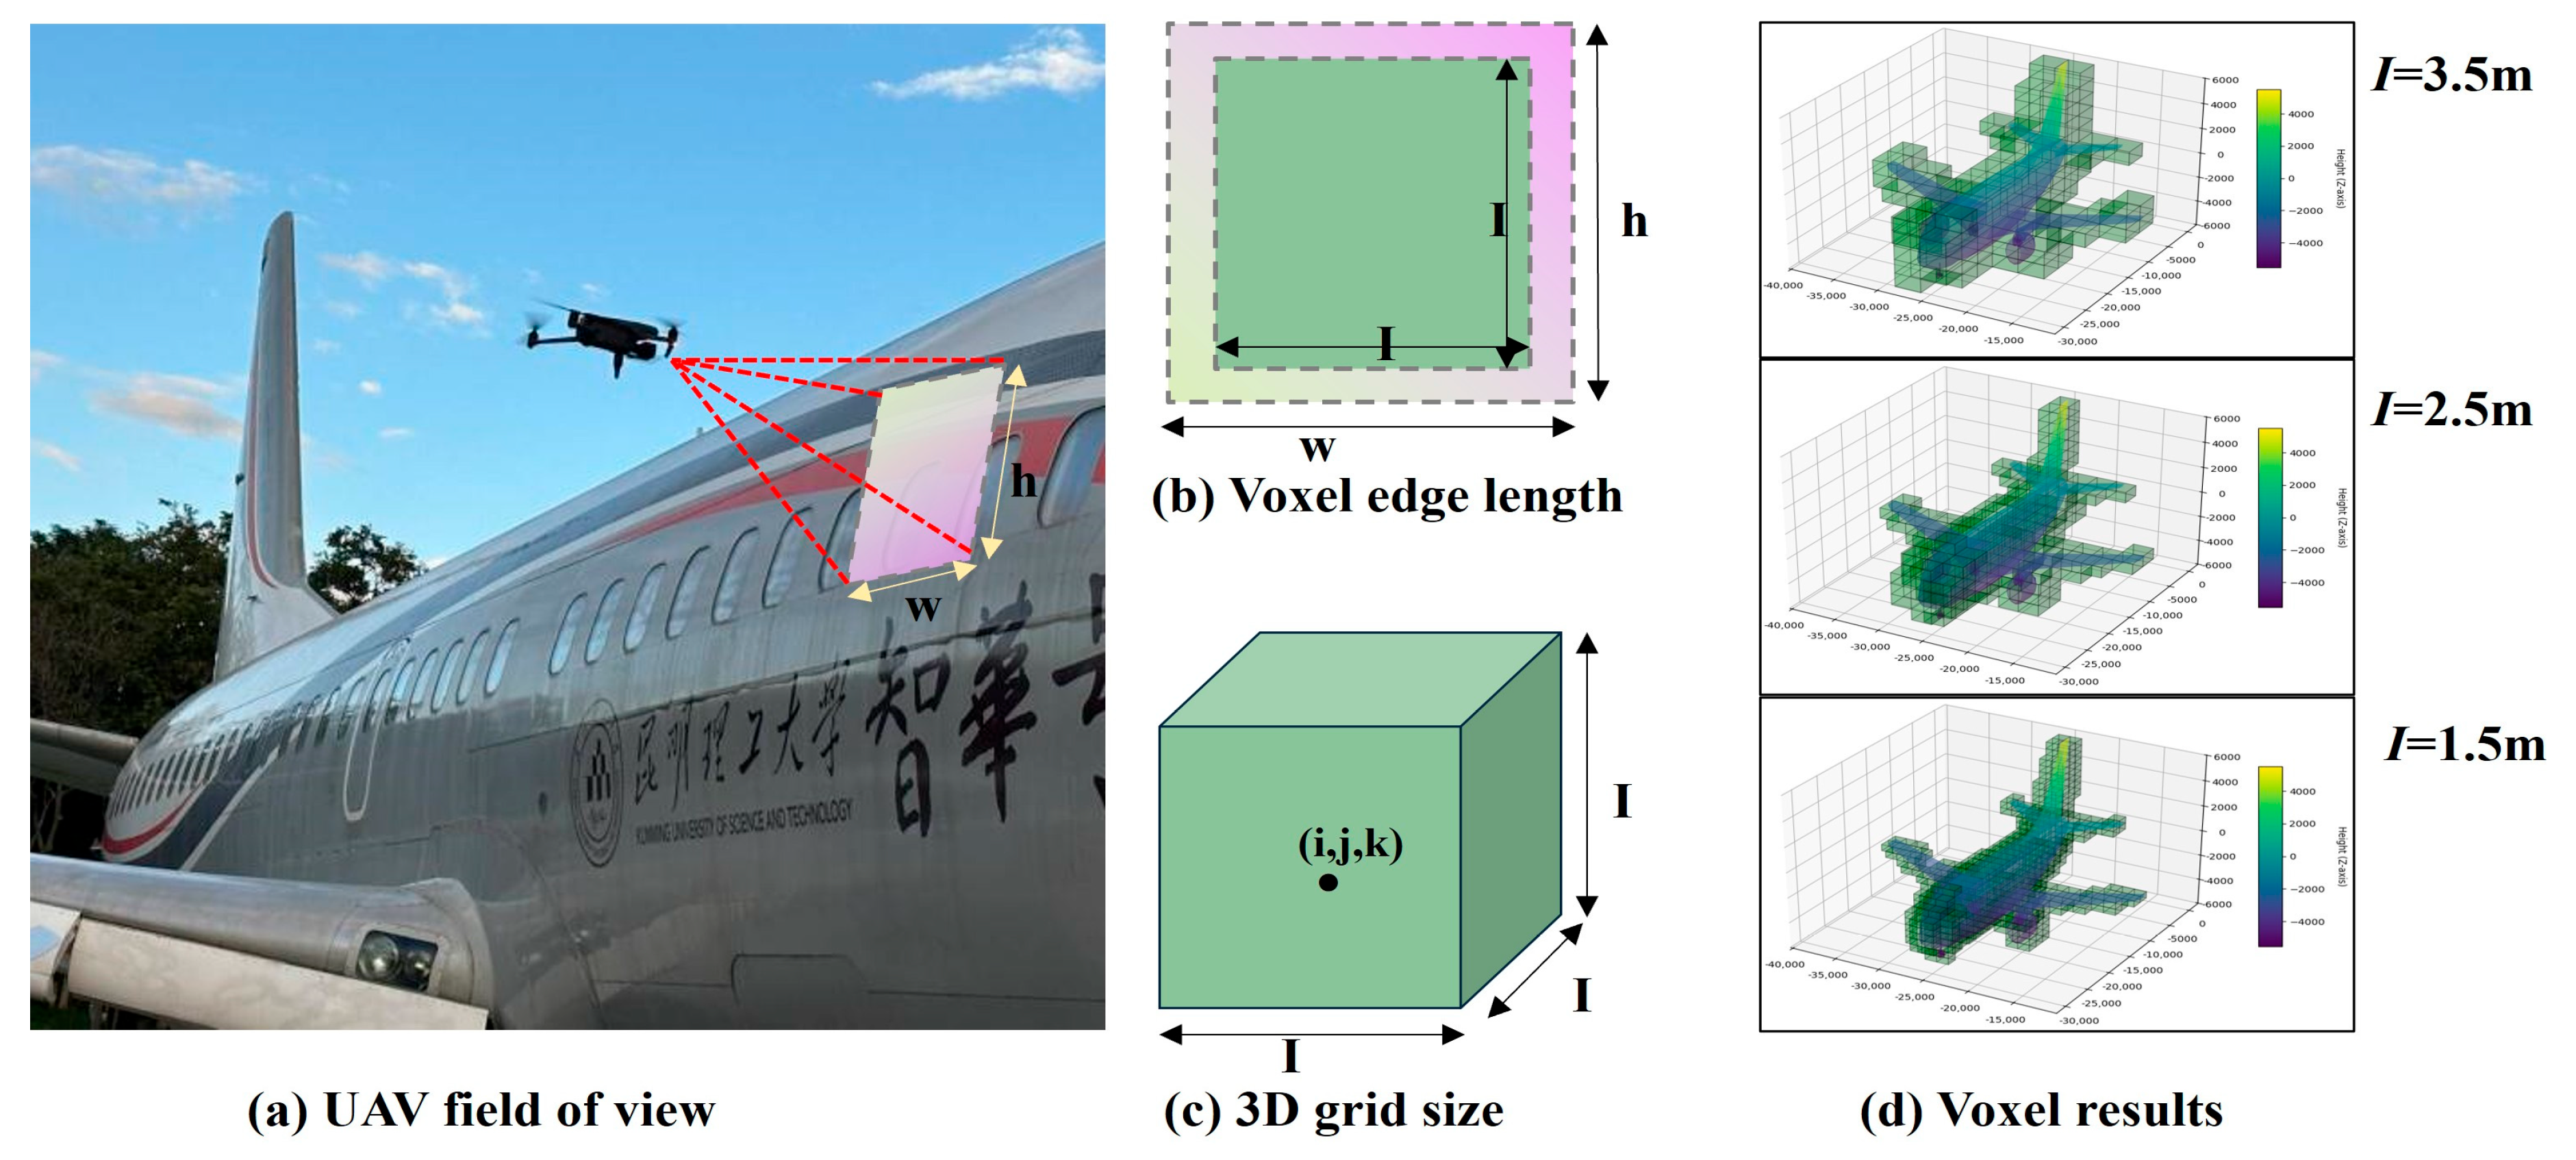
In UAV coverage path planning, the coverage task essentially involves dynamic sensing and data collection over the target area along a planned trajectory using an onboard vision sensor (a camera). To enable efficient spatial modeling and path optimization, the task area must be partitioned into 3D space units. The voxels in the 3D map must cover the camera’s field of view (FOV) onboard the UAV. As shown in Figure 3a, the UAV carries a camera as the vision sensor and performs data collection at a certain height above the ground. The camera’s FOV is projected onto the target surface, forming a rectangular coverage area of size h × w . This dimension is determined jointly by the camera’s intrinsic parameters (focal length, pixel size) and the shooting height; it is calculated through a perspective projection model from the world coordinate system to the camera coordinate system.
To ensure that each voxel can be effectively covered by the sensor and to avoid information loss, the voxel edge length I is defined to be no greater than the smaller side of the FOV projection, i.e., satisfying I     m i n ( h ,   w ) [38]. This ensures that the camera’s FOV completely covers at least one voxel unit, while allowing moderate overlap between adjacent FOVs to enhance the robustness and completeness of data collection. As illustrated in Figure 3b, this resolution selection strategy aligns the voxel grid with the sensor’s perception capability, thereby reducing spatial representation redundancy while ensuring perception quality.
Considering that the task object is a complete aircraft, whose fuselage has a complex spatial curved surface structure, traditional 2D grid partitioning cannot accurately describe the 3D surface coverage relationship. Therefore, we adopt an octree-based voxelization method [39] to recursively subdivide the 3D model point set P R 3 of the aircraft. Each leaf node corresponds to a cubic unit (voxel) with edge length I, indexed as ( i ,   j ,   k ) , as shown in Figure 3c. We define V ( P ) as the set of all voxels, i.e., the collection of all small cubes corresponding to the 3D model point set P . Figure 3d shows the voxelized result of the aircraft model constructed via the octree, represented at different resolutions.

2.1.2. Viewpoint Labeling

To simplify the complete CPP in a 3D space, we construct a discrete grid map [40]. First, a cube with side length L is used to contain the 3D model, ensuring that it can also accommodate the UAV’s field of view outside the surface of the 3D model. It requires that L m a x ( l e n ( x ) , l e n ( y ) , l e n ( z ) ) + 2 I , where l e n ( x ) , l e n ( y ) and l e n ( z ) are the differences between the maximum and minimum coordinates of the point P set along the X-axis, Y-axis, and Z-axis, respectively, and L / I must be an integer. Then, the direction vector ( x d , y d , z d ) was calculated from the center of the model to the center of the cubic box. Using the formula P = { P + x d , y d , z d } , update the coordinates by adding this direction vector to all model vertices. Finally, divide the cube into smaller cubes with side length I . Define the set of these small cubes as V , where V ( P ) V , thereby discretizing the 3D model space into a grid map, as shown in Figure 4a.
After the 3D model is discretized into a grid map, the object to be inspected is defined as an obstacle, while the empty grid cells located on the aircraft surface are marked as viewpoints. The remaining empty grid cells that are neither viewpoints nor obstacles are referred to as nodes. According to Equation (1), all grids are assigned indices as m a p ( i , j , k ) , where ( i , j , k ) are integers satisfying 0 < i ,   j ,   k n   ( n = L I ) . Each grid cell has a corresponding label value l a b e l ( i , j , k ) : nodes are labeled “0”, viewpoints are labeled “−1”, and obstacles are labeled “1”. Figure 4b,c show the labeling results of the aircraft model’s viewpoints, where red cubes represent the viewpoints on the aircraft surface. Figure 4d illustrates a cross-sectional view of the labeling process, where cubes labeled “−1” lie on the surface of the aircraft. These viewpoints collectively form the search space for the UAV.
l a b e l i , j , k = 0               e m p t y 1       v i e w p o i n t 1       o b s t a c l e

2.1.3. Generation of Viewing Direction

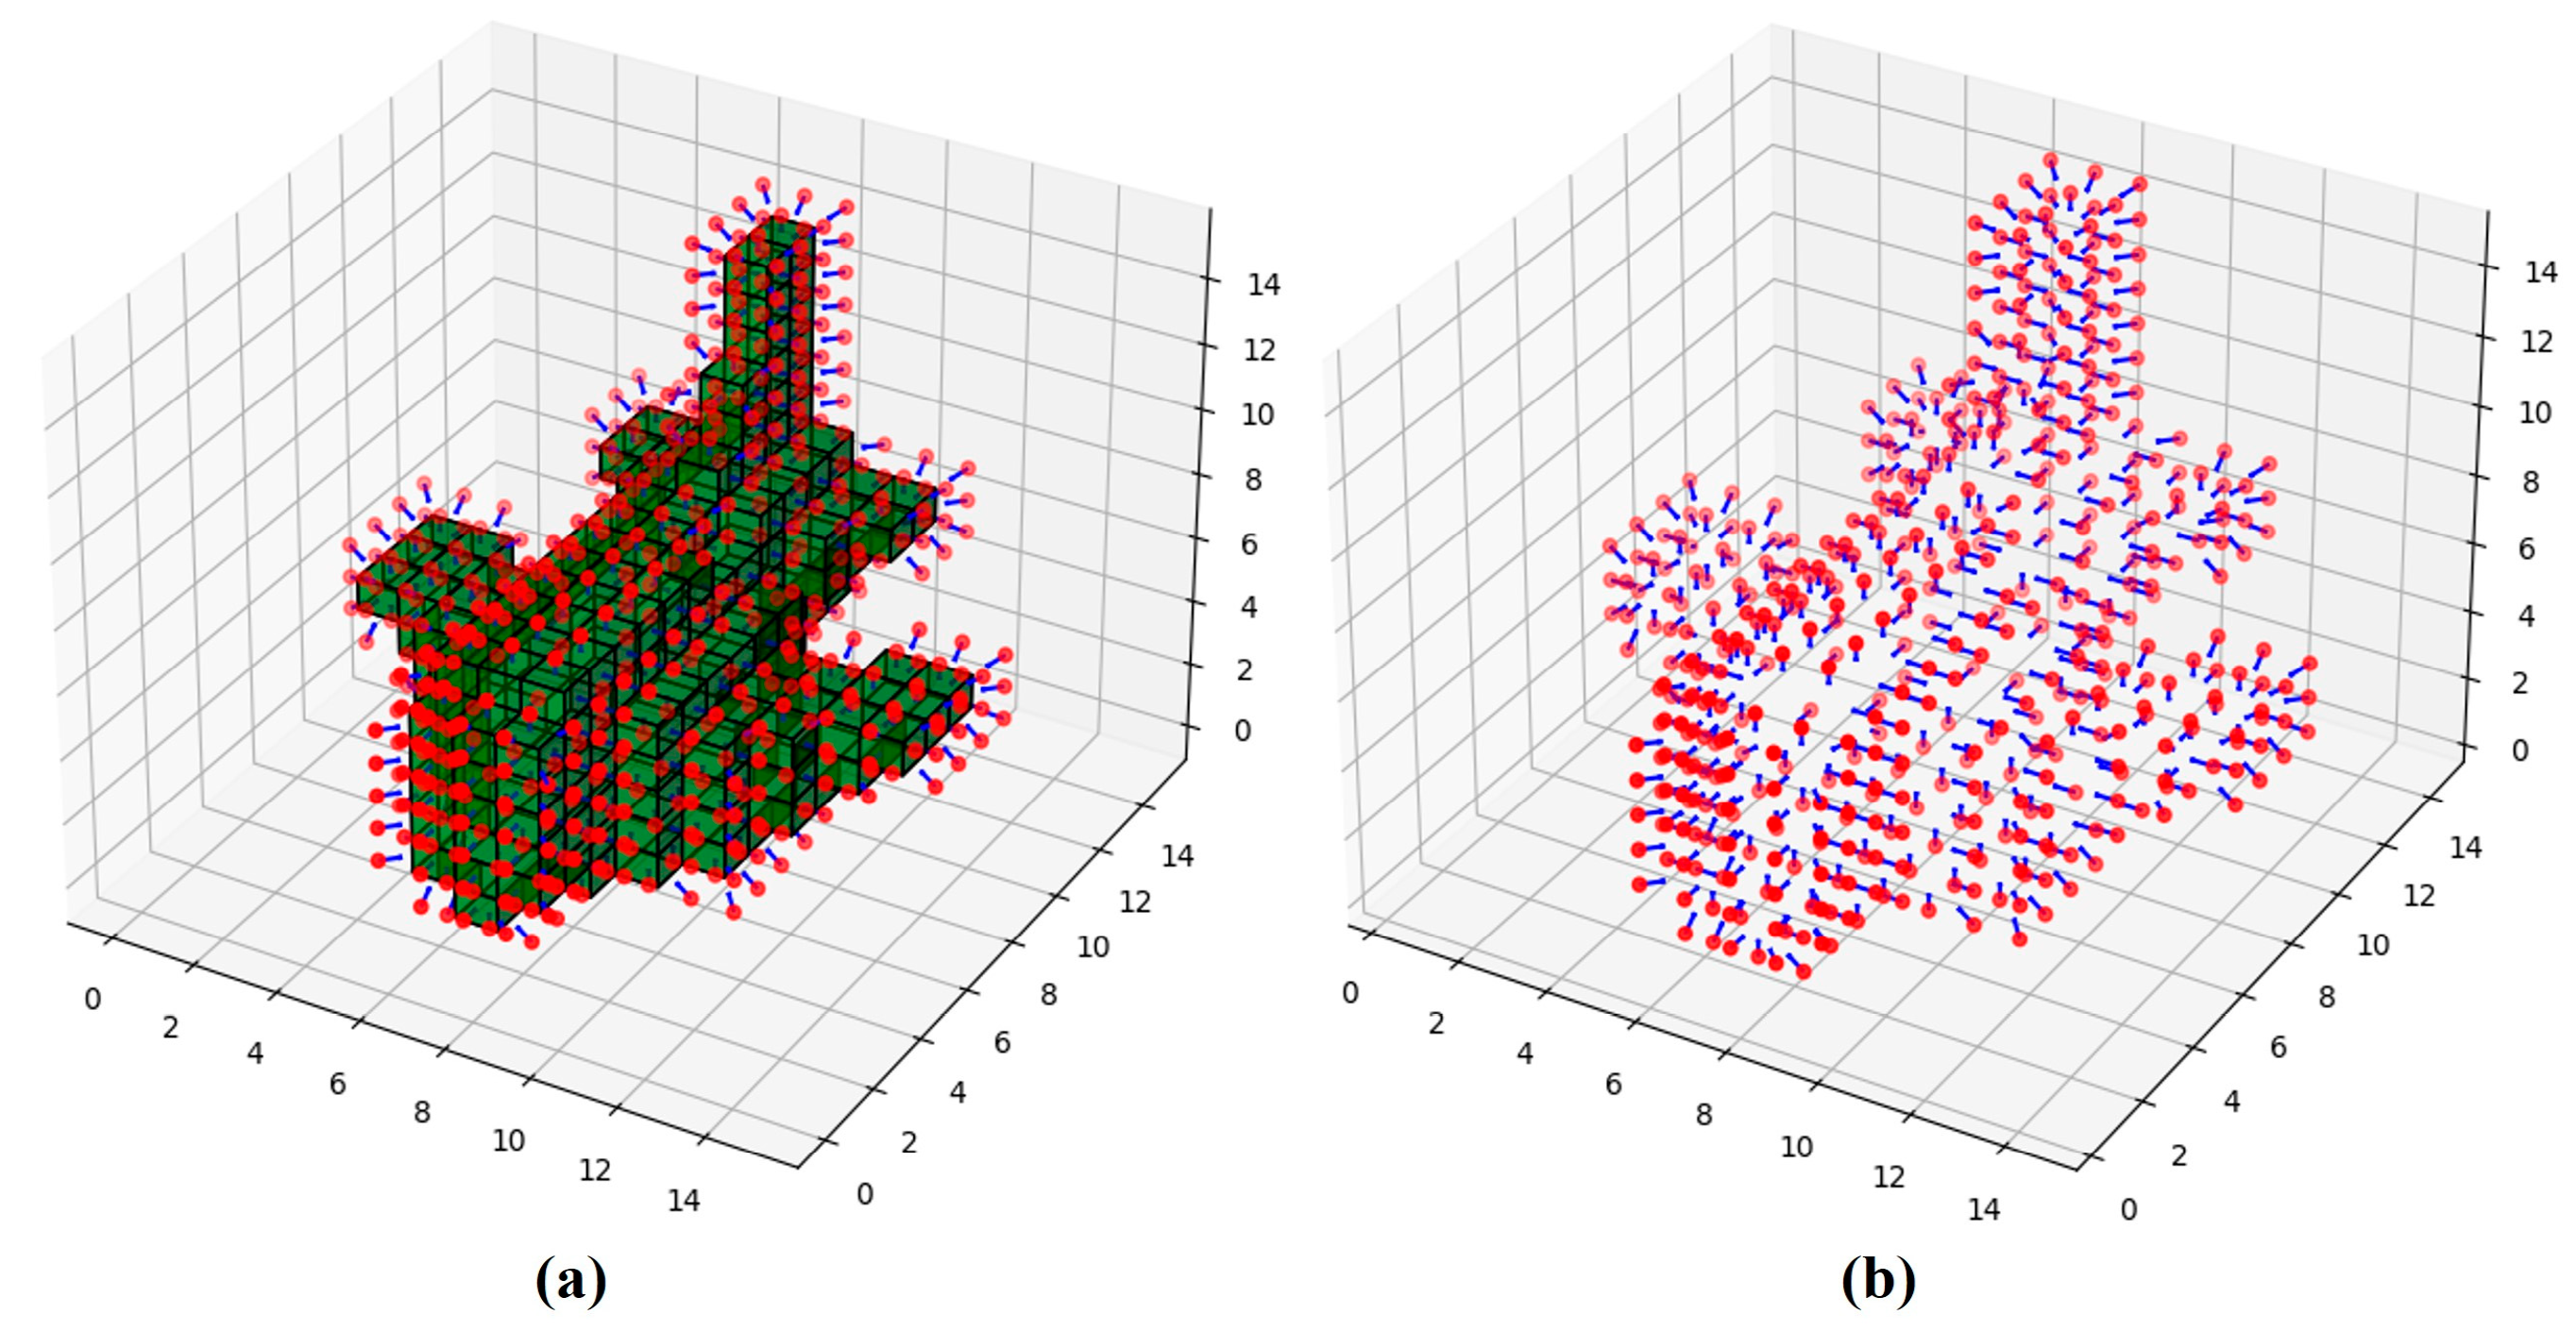
After the viewpoints are determined, the viewing directions are generated using the probabilistic potential field method (as shown in Figure 5). In this method, the attractive force between a viewpoint and its neighboring cubes is inversely proportional to the square of the distance—meaning the closer a cube is to the viewpoint, the stronger the attraction. The specific steps include calculating the distance and corresponding attraction strength between each cube and the viewpoint; determining the unit vector of the attraction force, pointing from the cube’s center toward the viewpoint; and summing all the attraction vectors and normalizing the result to obtain the final viewing direction unit vector, as given by Equation (2).
v = i = 1 N a p t i p y p t i p y 3 i = 1 N a p t i p y p t i p y 3 f m i n < p t i p y < f m a x
In the equation, v represents the unit vector of the line of sight, describing the direction of the line of sight; a is a constant used to adjust the calculation of attraction. Its value needs to be set according to specific application scenarios; p y represents the position of the viewpoint, i.e., the location where the UAV takes photos, and p t i represents the center position of the i t h cube. Only cubes located within the sensor’s visible range will be considered in the calculation of the average observation direction for viewpoints. N is the number of cubes that satisfy f m i n < p t i p y < f m a x , when i { 1,2 , , N } ; f m i n and f m a x represent the minimum and maximum values of attraction, respectively.

2.1.4. Path Planning

In order to efficiently detect aircraft skin defects, the UAV must design a flight trajectory based on the viewpoints to cover the entire target surface. This involves selecting an optimal path that traverses all viewpoints, which is typically addressed using a CPP algorithm and is often related to the Traveling Salesman Problem (TSP) [41]. Since the UAV may encounter structural obstacles when flying from one viewpoint to another, making direct paths infeasible, this problem corresponds to a TSP on a non-complete graph.
When dealing with the TSP on a non-complete graph, the first step is to identify all pairs of viewpoints ( v i , v j ) that are separated by a distance no greater than the maximum allowable gap d m a x and do not conflict with the aircraft structure or obstacles. An adjacency matrix l { 0,1 } ( k × k ) is used to indicate whether two viewpoints can be connected ( l i j = 1 means connection is possible), and a distance cost matrix D i , j R ( k × k ) is defined to represent the distances between viewpoints. The Euclidean distance d i j is calculated when l i j = 1 ; otherwise, it is set to , as shown in Equation (3). Based on this information, a non-complete graph G = ( V , E ) is constructed, where V is the set of viewpoints and E is the set of feasible paths (as defined in Equation (4)).
D i , j = d i , j ,       |       l i , j = 1   ,       |       l i , j = 0
E = e i j e i j = v i , v j , l i j = 1 , i 1,2 , , k , j 1,2 , , k
For the non-complete graph, a greedy strategy is adopted to optimize the connection logic between viewpoints, prioritizing the direct connection to the nearest unvisited viewpoint. If a direct connection is not feasible, the Breadth-First Search (BFS) algorithm is applied to find an indirect path, ensuring that all viewpoints can be effectively connected. For two points P ( x 1 , y 1 , z 1 ) and Q ( x 2 , y 2 , z 2 ) in 3D space, the distance between them is calculated according to Equation (5).
d P , Q = x 2 x 1 2 + y 2 y 1 2 + z 2 z 1 2

2.1.5. GB-CPP Experimental Evaluation Metrics

To validate the effectiveness of the path planning algorithm for UAVs in aircraft fuselage defect detection tasks, simulation experiments were conducted in this paper based on a Boeing 737-300 aircraft model, using Python programming language on the Windows 10 Pro operating system. To quantitatively analyze the performance of the path planning algorithm, evaluation metrics such as total coverage path count, redundant coverage area, redundancy coverage rate [38], and algorithm runtime were defined to analyze the simulation results. The total coverage path count refers to the number of viewpoints covered during the path planning process; the redundant coverage area indicates the number of viewpoints revisited during path planning, while the redundancy coverage rate is the proportion of the redundant coverage area relative to the total coverage path.

2.2. Improved YOLOv11 Algorithm

2.2.1. YOLOv11 Overview

The YOLOv11 model is an object detection algorithm developed by Ultralytics and released on 30 September 2024 [42]. It includes five versions with increasing model parameters: n (nano), s (small), m (medium), l (large), and x (extra large). As the model size increases, so does its accuracy. Since the algorithm in this paper will be deployed on embedded devices and needs to maintain real-time detection speed, improvements will be made based on the lightweight YOLOv11n model. YOLOv11n refers to the standard feature fusion structure in the nano version of the YOLOv11 architecture.
The YOLOv11 model is composed of three parts: the backbone network (Backbone), the neck network (Neck), and the prediction head (Head). The backbone network adopts an improved CSPDarknet53, generating multi-scale feature maps from P1 to P5 through five downsampling processes, and introduces C3K2, CBS, SPFF, and C2PSA modules to enhance feature extraction capabilities. The neck network utilizes a PAN-FPN structure to merge shallow and deep information, improving localization accuracy. The prediction head adopts a decoupled structure, predicting categories and locations separately. Classification uses the BCELoss loss function, while bounding box regression combines DFL and CIoU, and DWConv operations are added to reduce computational load and the number of parameters.

2.2.2. INN-YOLO Algorithm

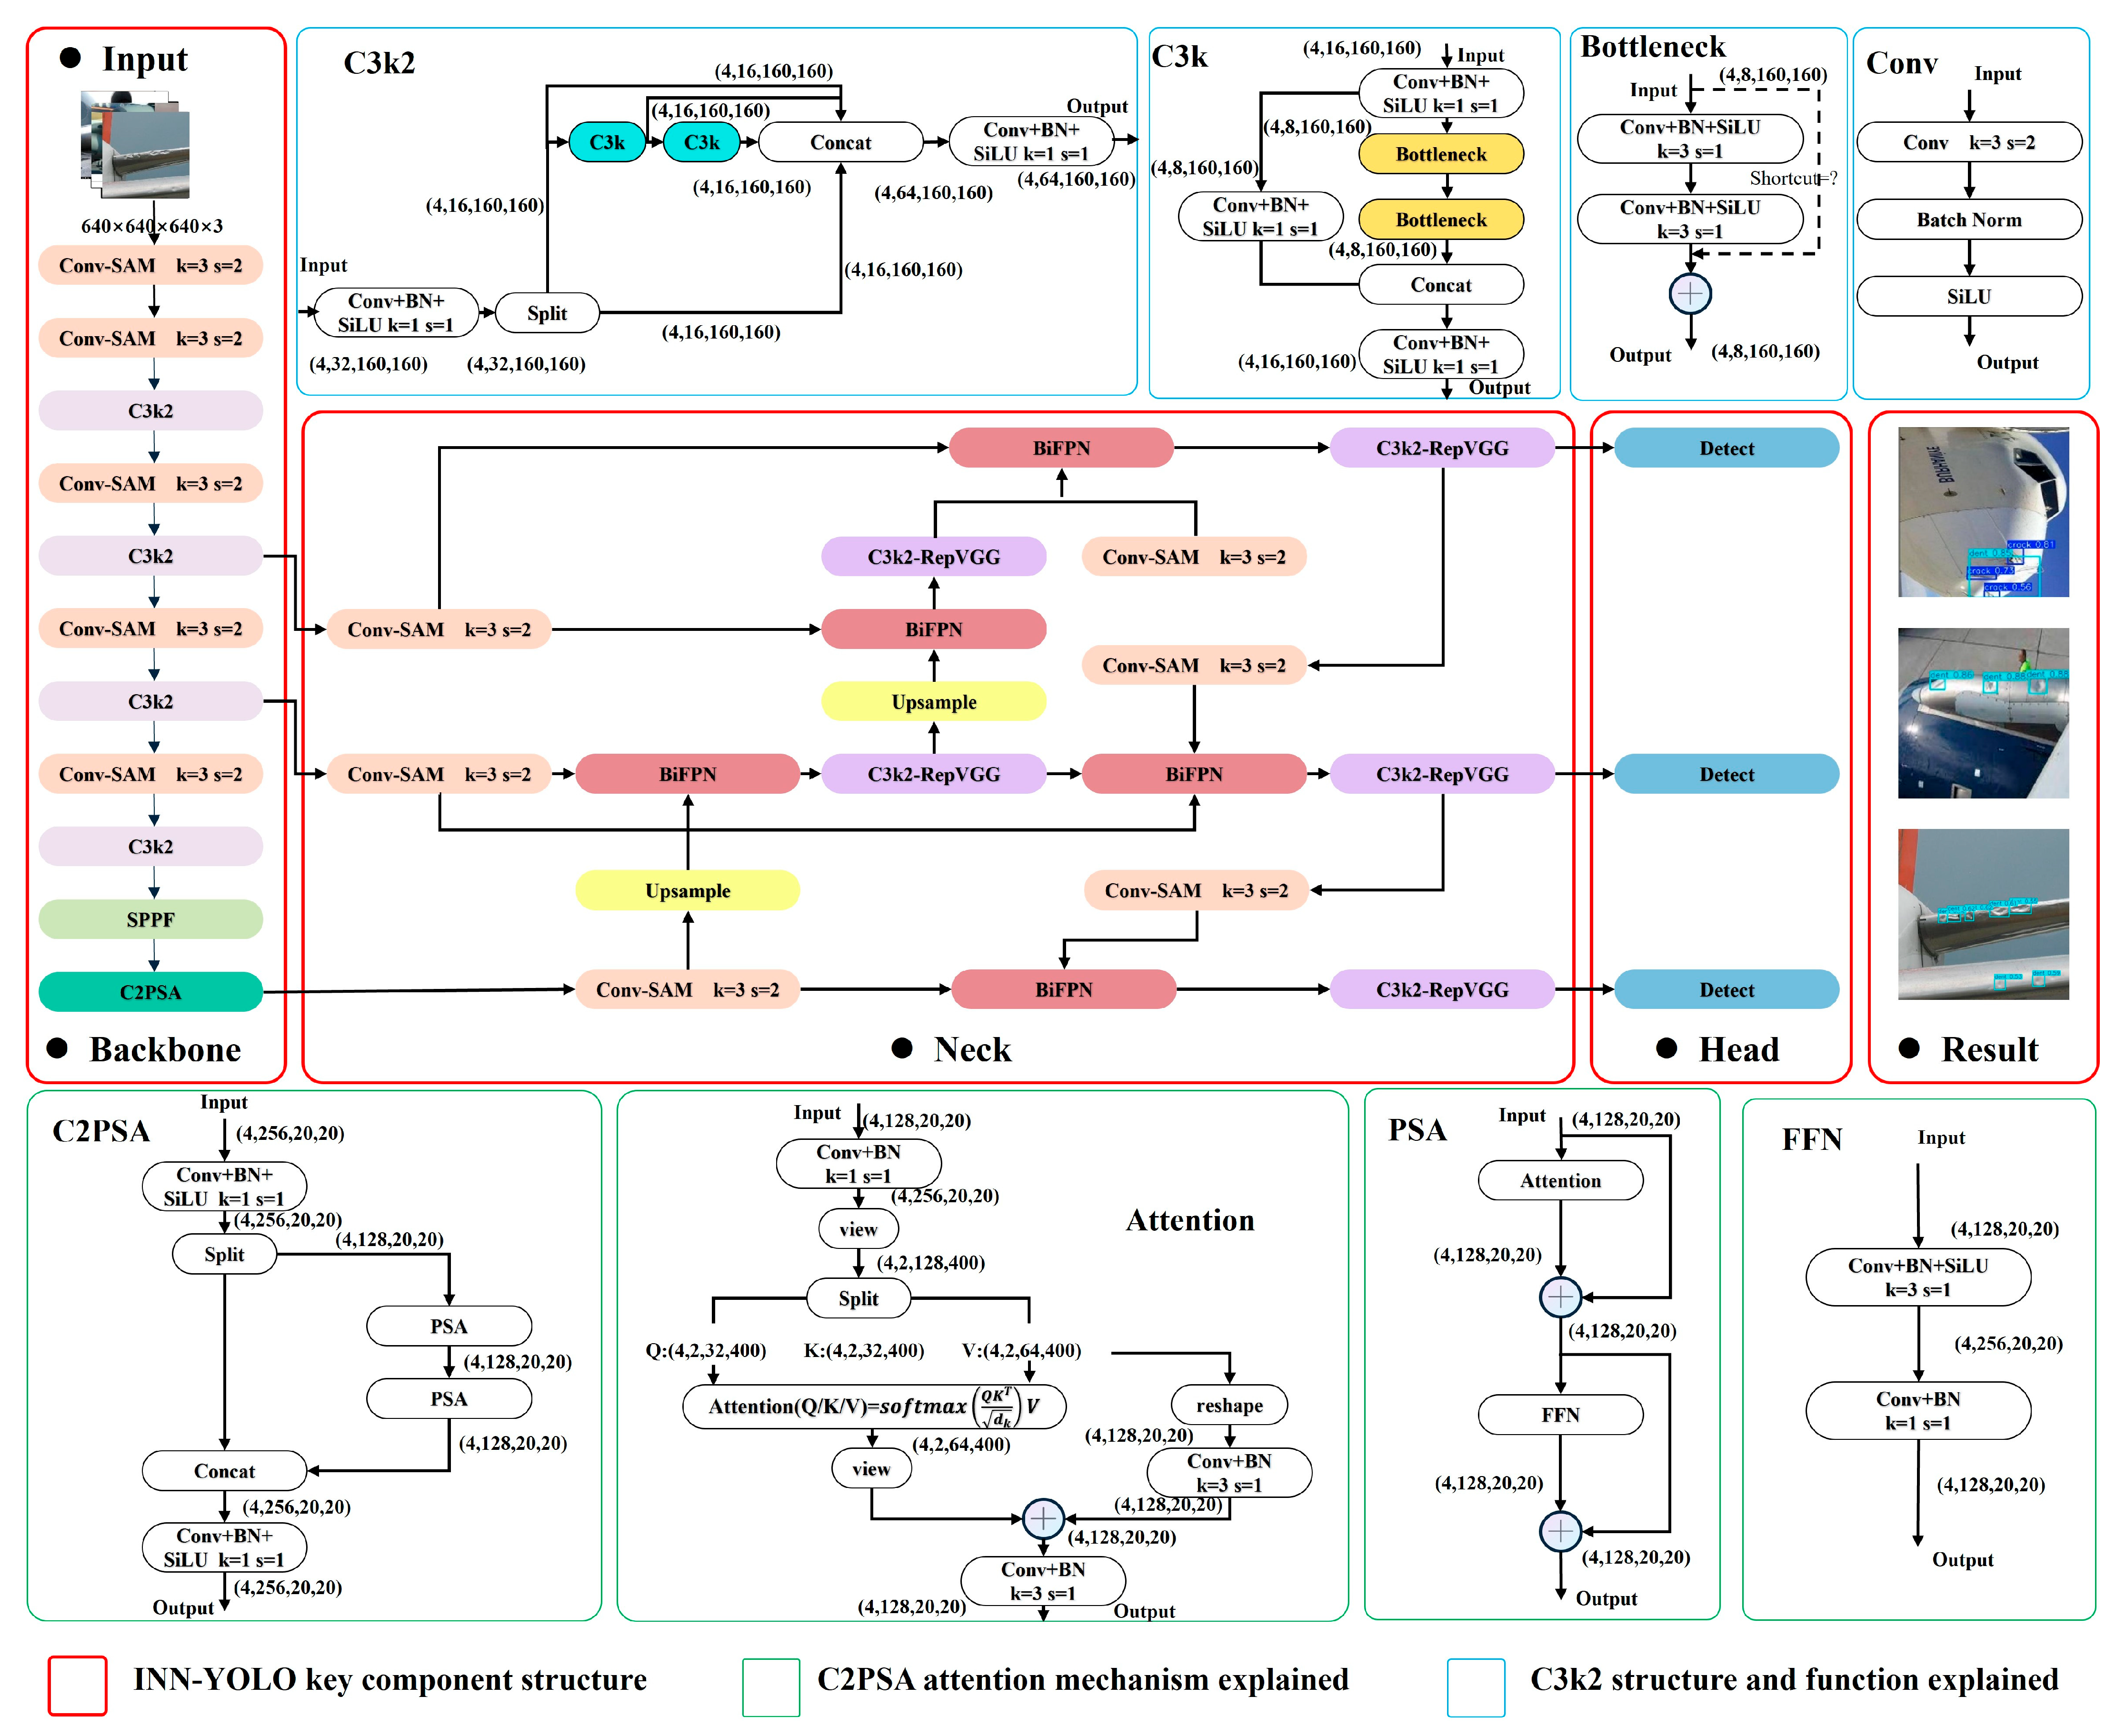
In aerial images of aircraft skin defects taken by UAV, issues such as non-concentrated target distribution, significant variations in size, indistinct features, and complex backgrounds are prevalent. Using YOLOv11n for the detection of aircraft skin defects often results in a considerable number of missed and false detections. However, employing a larger model would significantly increase computational load and parameter costs. To address these challenges while considering performance and resource consumption, an INN-YOLO network based on YOLOv11n is proposed, aiming to improve the algorithm’s robustness in detecting skin defects. The network architecture is illustrated in Figure 6.

2.2.3. Multi-Scale Fusion of the Neck

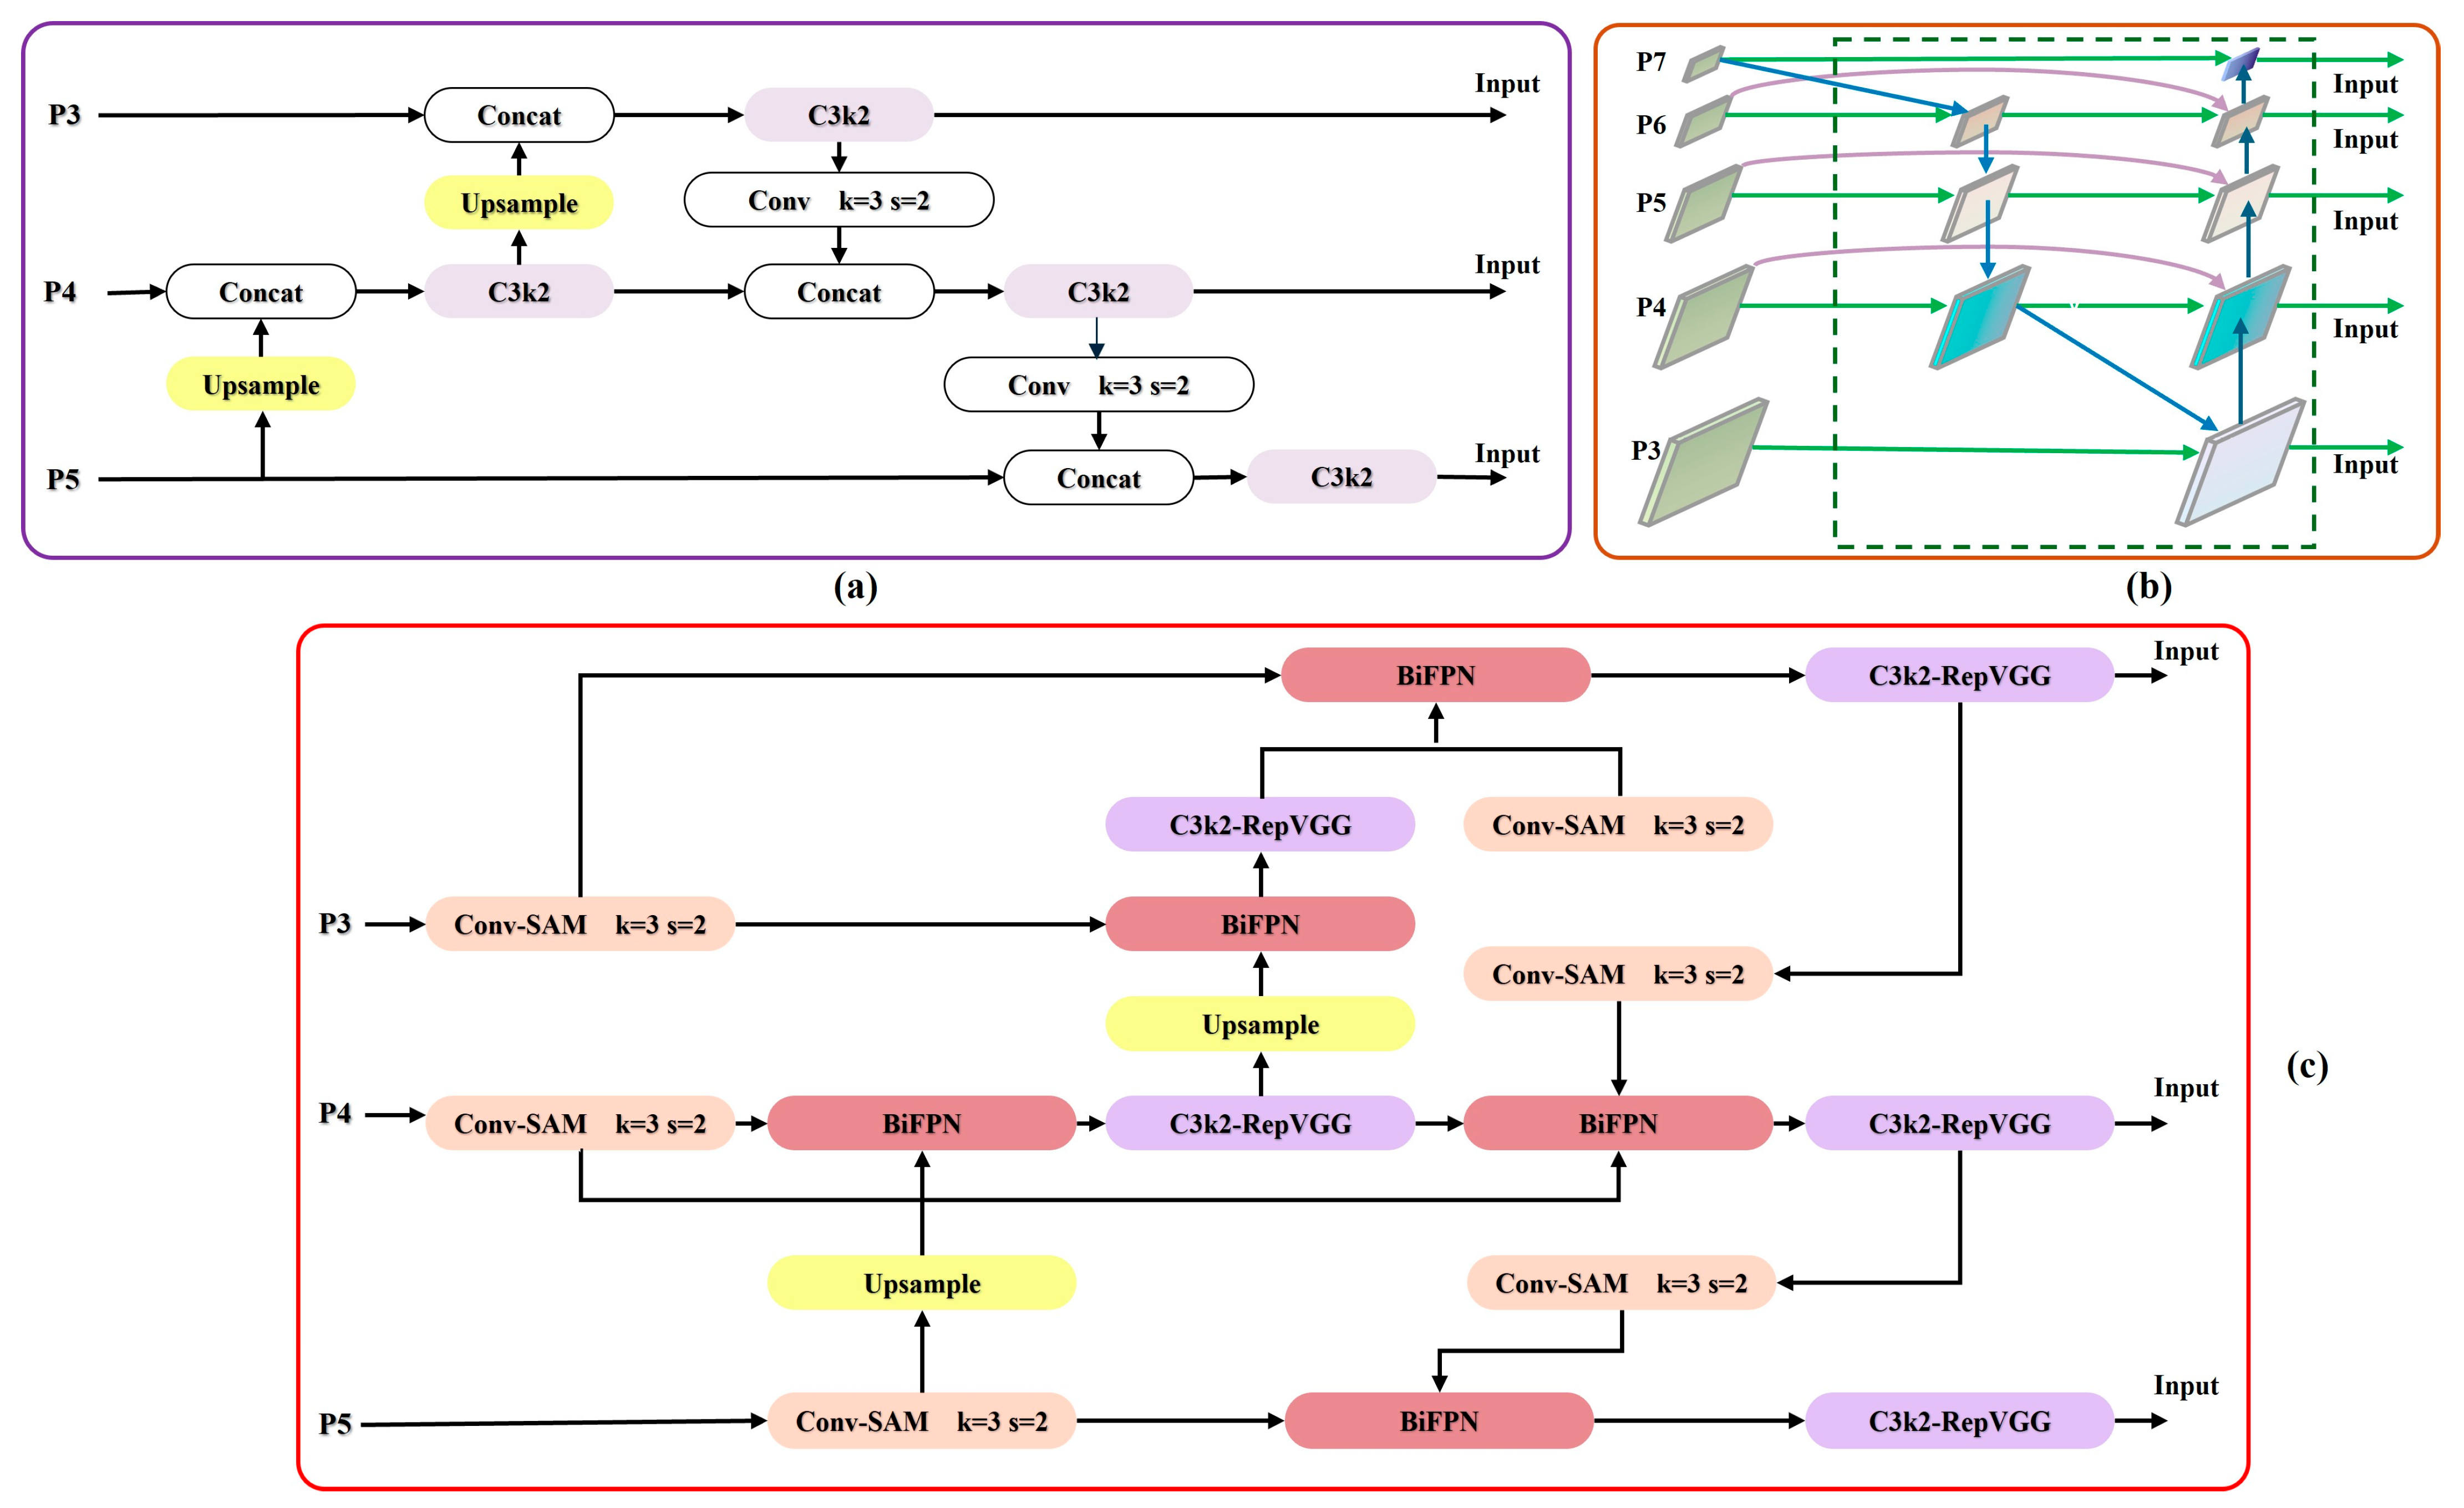
To address the issues of insufficient semantic information, severe information loss, inefficient parameter utilization, and inadequate feature fusion in the baseline model YOLOv11n for aircraft skin defect detection, the neck portion of the baseline model is reconstructed, as shown in Figure 7a,c. The structure is built in the style of a Bidirectional Feature Pyramid Network (BiFPN) [43], as illustrated in Figure 7b. Unlike PANet (Path Aggregation Network) [44], which is limited to unidirectional fusion either top-down or bottom-up, BiFPN allows information to flow and interact more freely across different levels. It enables lateral connections at intermediate layers (e.g., layers 20 and 26), optimizes upsampling and concatenation operations on feature maps (e.g., layers 14, 17, and 20), and adjusts the application of the C3k2 module (e.g., layers 16, 19, 22, 25, and 28). These improvements help capture ambiguous features, reduce background interference, and accurately handle multi-scale defect characteristics, thereby enhancing detection accuracy and robustness. Additionally, BiFPN can significantly improve network performance with minimal computational cost. Taking the computation at the P6 level as an example, the calculation expressions are as follows (Equations (6) and (7)): P 6 t d represents the intermediate top-down feature of the sixth layer; P 6 o u t represents the bottom-up output feature of the sixth layer; ω is a learnable weight parameter between 0 and 1; ϵ is a small constant used to avoid numerical instability.
P 6 t d = C o n v ω 1 · P 6 i n + ω 2 · R e s i z e P 7 i n ω 1 + ω 2 + ϵ
P 6 o u t = C o n v ω 1 · P 6 i n + ω 2 · P 6 t d + ω 3 R e s i z e P 5 o u t ω 1 + ω 2 + ω 3 + ϵ

2.2.4. Conv-SAM Module

The SimAM (Simple Attention Mechanism) [45] is a lightweight self-attention mechanism model, where the energy function for each neuron in the model is expressed as shown in Equation (8), as follows:
e t w t , b t , y , x i = 1 M 1 i = 1 M 1 1 w t x i + b t 2 + 1 w t t + b t 2 + λ w t 2
Here, w t represents the linear transformation weight of the target neuron; b t denotes the linear transformation bias of the target neuron; and y is the ideal output label for the target neuron t and other neurons x i . By taking partial derivatives with respect to w t and b t , the minimum energy is obtained as:
e t * = 4 σ t 2 + λ t u t 2 + 2 σ t 2 + 2 λ
Finally, the importance of the neuron is calculated using Equation (10):
1 e t * = t μ ^ 2 + 2 σ 2 + 2 λ 4 σ ^ 2 + λ = t μ ^ 2 4 σ ^ 2 + λ + 0.5
In the above equations: λ is a regularization coefficient used to regularize the weight w t in the energy function, preventing overfitting and enhancing the generalization ability of the model; σ t 2 represents the variance of all other neurons x i except the target neuron t ; u t represents the mean value of all other neurons x i except the target neuron t ; μ ^ represents the mean value of all neurons on the channel (including the target neuron t ); σ ^ 2 represents the variance of all neurons on the channel (including the target neuron t ).
SimAM takes into account both spatial and channel dimensions, obtaining 3D feature weights by optimizing the energy function of the feature maps rather than increasing network parameters. This reflects its lightweight characteristic, making it suitable for deployment on embedded devices, as shown in Figure 8a.
To enhance the convolutional neural network’s processing capability while maintaining efficiency and lightweight characteristics, we integrate SimAM into the Conv module of the baseline model, resulting in the Conv-SAM module with slicing operations. First, the input data X is divided into four sub-blocks: X = [ X 1 , X 2 , X 3 , X 4 ] . Then, the mean μ i of each sub-block X i is calculated:
μ i = 1 H × W i = 1 H j = 1 W x i j
Here, H and W represent the height and width of the sub-block, respectively. Next, the squared difference between each sub-block and its mean is computed, followed by normalization to accelerate training, stabilize gradients, and enhance model generalization. As shown in Equation (12), ϵ is a constant:
Y N o r m = ( X μ ) 2 4 × 1 H × W i = 1 H j = 1 W y i j + ϵ + 0.5
Subsequently, the normalized result is activated using the Sigmoid function. The activated result σ ( y ) is multiplied by the original sub-block to obtain the enhanced sub-block X i · σ ( y ) . Finally, the four enhanced sub-blocks are concatenated to form the output, as follows: Y = [ Y 1 , Y 2 , Y 3 , Y 4 ] . This process is illustrated in Figure 8b.

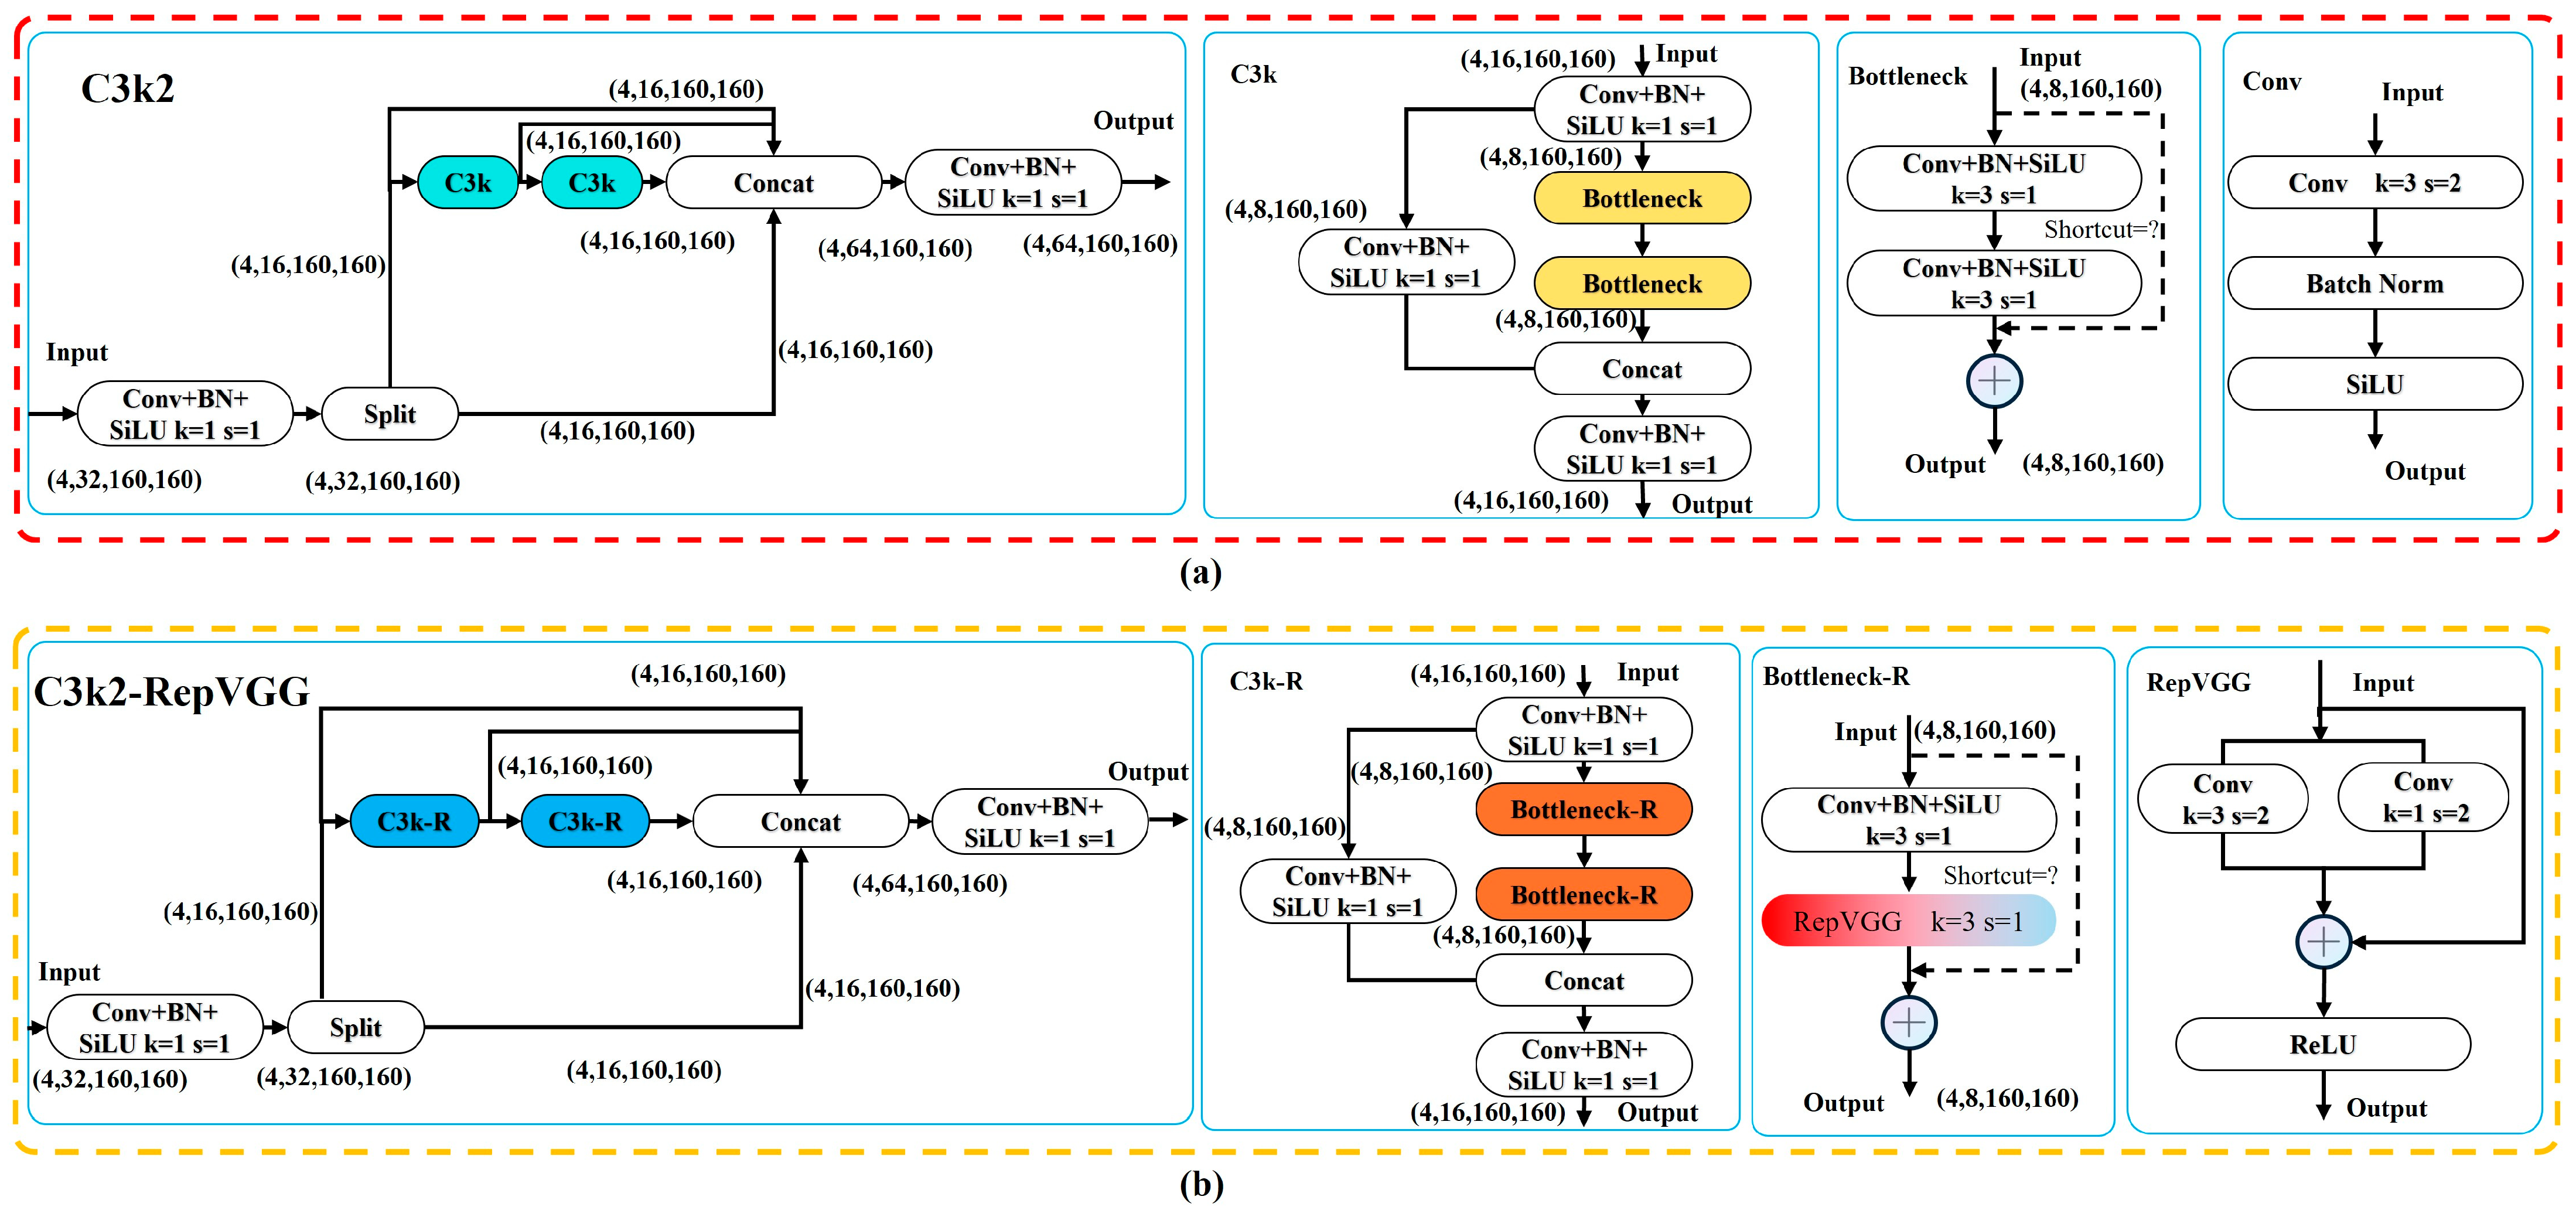
2.2.5. Lightweight C2f-RepVGG Block

The feature fusion module in the C3k2 block is based on multiple 3 × 3 convolutional layers, which introduce a certain computational burden when extracting multi-scale features. We have studied a simple yet powerful convolutional neural network architecture called RepVGG proposed by Ding et al. [46]. RepVGG decomposes the feature extraction and information integration processes into multiple branches, enabling the model to more comprehensively capture features of the input data, thereby enhancing its capability in modeling complex problems. Each branch can specialize in extracting features of different scales or orientations, improving the model’s flexibility and adaptability. By integrating the Cross Stage Partial (CSP) structure with the characteristics of RepVGG, we introduce RepVGG into the C3k2 module of the neck network, as shown in Figure 9. Leveraging the advantages of the CSP structure, cross-stage partial connections reduce computational load. At the same time, the properties of the RepVGG module are utilized: during training, a multi-branch structure is used to enhance the model’s representational capacity, while during inference, the multi-branch structure can be merged into a single convolutional layer to improve inference speed. This design enables the module to effectively extract multi-scale features while maintaining high computational efficiency, making it suitable for tasks that require both real-time performance and accuracy.

2.2.6. Indicators for Model Evaluation

A trained model needs to be evaluated using specific metrics to assess and verify its accuracy. Commonly used metrics include Precision, Recall, AP (average precision), and mAP (mean average precision). Additionally, the model size and computational cost are important evaluation factors, which are measured by the number of parameters and GFLOPs. The calculation formulas are as follows:
P r e c i s i o n = T P T P + F P
R e c a l l = T P T P + F N
A P = 0 1 P R d r
m A P = 1 n i = 0 n A P i
where T P represents the number of positive samples correctly detected, F P represents the number of positive samples that were missed, and F N represents the number of negative samples incorrectly classified as positive. P denotes Precision, R denotes Recall, and A P i is the average precision for the i t h target category, with i being the total number of target categories. A P is the area under the curve plotted with Precision and Recall as the coordinate axes. m A P is the mean of the average precision values (AP) across all target categories, used to describe the model’s detection performance for all target categories. A higher m A P value indicates better detection performance and recognition accuracy.
Parameters are used to evaluate the size and complexity of the model. A smaller number of parameters typically indicates a lighter model. GFLOPs (Giga Floating-point Operations Per Second) is used to assess the computational complexity and execution efficiency of the model; a higher value indicates a greater computational load, resulting in longer training and inference times.

2.3. Datasets

Due to the influence of aerodynamic loads and foreign object impacts, defects such as cracks and dents may occur on aircraft skin. Collecting aircraft skin defect data for training and testing forms the foundation of related research work. This study utilized four datasets to validate the effectiveness and generalizability of the proposed algorithm: three were developed from public datasets after preprocessing, and the fourth was constructed by our team and publicly published on the Kaggle website. Detailed information about these datasets is provided in Table 1.
The dataset specifically built for this study consists of 247 images captured by a DJI Mavic 3 UAV equipped with a camera under varying lighting conditions, distances, and viewing angles. The images primarily depict two types of defects: cracks and dents, with each image having a resolution of 5280   ×   3956 pixels. After labeling, the images were resized to dimensions of 320   ×   320 and 2098   ×   2796 pixels. For labeling purposes, the open-source tool LabelMe [47] was employed, and the labeled information was saved as JSON files containing detailed metadata such as the image name, defect type, label point positions, and other relevant details. The information extracted from these JSON files was used for model training. Given the relatively small size of the collected dataset, 29 images were randomly selected from the 247 images to form the test set, while the remaining images were subjected to five data augmentation strategies to expand the sample size and prevent model overfitting. These strategies included brightness adjustment, cropping, rotation, translation, and mirror flipping. After applying these augmentations, the dataset expanded to a total of 1559 sample images.

2.4. Experimental Environment and Deployment for INN-YOLO

The configuration of the experimental environment included: the operating system was Windows 10 Professional, the graphics card was NVIDIA GeForce RTX 3090, the deep learning environment used PyTorch 1.13.1, and the Python version was 3.9.21. The integrated development environment included Anaconda, CUDA 11.6, and PyCharm (Version 2023.3.4). During model training, the parameters were configured as follows: batch size was set to 16, epochs were set to 200, and image size was set to 640 × 640 . Currently, single-board computers such as the NVIDIA Jetson Nano development kit are becoming increasingly popular in edge computing applications, such as artificial intelligence and deep learning.
The Jetson Nano features a quad-core ARM Cortex A57 CPU, a 128-core Maxwell GPU, 4 GB of 64-bit LPDDR4 memory, and Gigabit Ethernet connectivity, and it runs on the Ubuntu operating system. This device delivers outstanding computing performance while typically consuming only 5 W to 10 W of power. This study fully leverages the advantages of this embedded edge computing device, particularly applying it to model inference. Considering that model training requires more computing resources compared to the testing phase, we choose to complete the specific model training tasks on a cloud-based workstation equipped with a GPU. Subsequently, the generated weight files are deployed onto the edge device to enable real-time detection of aircraft skin defects. Table 2 provides a detailed evaluation of the INN-YOLO model on the NVIDIA Jetson Nano platform.

3. Results

We conducted a quantitative evaluation of multiple indicators for CPP to verify the effectiveness of the path planning algorithm. Three public datasets were selected to complete the training of the INN-YOLO network model. Comparative experiments and ablation experiments were carried out for assessment and comparison. Finally, generalization experiments were conducted on our own self-built dataset.

3.1. Experimental Validation and Analysis of UAV Coverage Path Planning

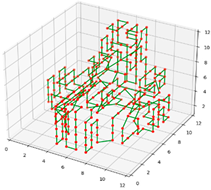
Viewpoints are extracted from the aircraft surface within a discrete grid map, transforming the three-dimensional path planning problem into a point-to-point full coverage problem, ensuring no area is missed during detection while maintaining a safe distance. Path planning experiments were conducted on grids with different resolutions for the same model. As shown in Table 3, as the resolution decreases from 3.5 to 1.5, the number of viewpoints increases from 326 to 1042, and the total coverage path count rises from 344 to 1098, indicating more refined paths. Although the overlapping coverage area remains relatively stable, the overlapping coverage ratio decreases from 5.23% to 5.1%, showing a slight improvement in efficiency. However, the algorithm runtime increases from 3.00 s to 11.69 s, demonstrating that higher resolution brings greater computational burden.

3.2. Analysis of INN-YOLO Experimental Results

3.2.1. Comparison Experiment

Table 4 presents the detection performance of the most lightweight models from the recently popular YOLO series algorithms on three public datasets. Considering the hardware limitations of UAV platforms, the algorithm needs to maintain high accuracy while minimizing the number of parameters and computational load as much as possible. The results show that the improved INN-YOLO algorithm exhibits excellent detection performance. Specifically, on Public Dataset-1, INN-YOLO achieved a Precision of 67.00%, Recall of 41.00%, mAP@0.5 of 42.30%, and mAP@0.5–0.95 of 21.50%, representing improvements of 2.50%, 10.70%, 10.70%, and 6.60% over the baseline YOLOv11n model, respectively. On Public Dataset-2, these metrics reached 90.90%, 76.60%, 84.10%, and 57.30%, improving by 3.80%, 2.50%, 2.50%, and 2.30% over the baseline YOLOv11n model. On Public Dataset-3, Precision, Recall, mAP@0.5, and mAP@0.5–0.95 reached 64.80%, 59.70%, 56.40%, and 27.90%, respectively, improving by 6.10%, 7.00%, 3.20%, and 2.60% over the baseline YOLOv11n model. Although INN-YOLO does not hold an absolute advantage in GFLOPs and parameter count, its performance gains demonstrate that the model effectively balances model performance with resource consumption. Furthermore, INN-YOLO consistently outperforms common algorithms such as YOLOv5n, YOLOv6n, YOLOv8n, YOLOv9t, YOLOv10n, and YOLOv11n across various metrics, confirming its strong design value and potential advantages for practical applications.
To validate the reliability of the improved detection metrics, we used an independent samples t-test to compare YOLOv11n and INN-YOLO across different metrics and employed a non-parametric Bootstrap resampling method with 1000 iterations to calculate the 95% confidence interval of the performance improvement. Taking the Public dataset-1 as an example, our method achieved a 2.50% improvement in the Precision metric, with p = 2.23 × 10⁻³ < 0.05, indicating statistical significance; the 95% confidence interval was (1.68%, 3.88%), which does not include zero, further demonstrating that the performance improvement is stable and reliable.

3.2.2. Ablation Experiment

To validate the contribution of each improved module to the model’s performance, this paper conducted ablation experiments on Public Dataset-1, Public Dataset-2, and Public Dataset-3. Based on YOLOv11n, the Conv-SAM, BiFPN, and C3k2-RepVGG modules were gradually integrated into the baseline model to evaluate their impact on detection accuracy and efficiency. Different combinations of modules correspond to cases (a) through (h), where Case (a) is the baseline model, and subsequent cases progressively incorporate the improved modules to analyze their individual contributions and synergistic effects, as shown in Table 5.
When SimAM is efficiently integrated with the convolution operation, Recall, mAP@0.5, and mAP@0.5–0.95 on Public Dataset-1 improved by 2.80%, 1.60%, and 0.90%, respectively; Precision on Public Dataset-2 increased by 2.10%; and Precision, Recall, mAP@0.5, and mAP@0.5–0.95 on Public Dataset-3 improved by 3.00%, 2.40%, 2.30%, and 1.10%, respectively. These results indicate that the improved module enhances the model’s ability to adapt to multi-scale objects. After reconstructing the neck network with BiFPN, Recall, mAP@0.5, and mAP@0.5–0.95 on Public Dataset-1 increased by 5.00%, 6.10%, and 1.10%, respectively; and Precision and mAP@0.5–0.95 on Public Dataset-3 improved by 9.60% and 0.70%, respectively, demonstrating that BiFPN effectively enhances multi-scale feature fusion capability. When RepVGG is introduced into the C3k2 module, Recall and mAP@0.5 on Public Dataset-1 increased by 2.30% and 1.90%, respectively; Precision and mAP@0.5–0.95 on Public Dataset-2 improved by 0.20% and 0.10%, respectively; and Precision, Recall, mAP@0.5, and mAP@0.5–0.95 on Public Dataset-3 increased by 3.00%, 3.10%, 0.40%, and 1.10%, respectively. This indicates that while the module increases computational cost, it improves detection accuracy and overall performance. However, certain module combinations exhibit negative effects on specific metrics. For example, in case (e), using both Conv-SAM and BiFPN simultaneously led to decreased Precision and Recall on Public Dataset-2, dropping to 86.30% and 64.50%, respectively, along with reductions in mAP@0.5 and mAP@0.5–0.95. This situation may arise because the two modules conflict during feature extraction and fusion, causing information loss or increased redundancy. Additionally, in case (f) on Public Dataset-3, using both Conv-SAM and C3k2-RepVGG improved Precision but slightly reduced Recall, mAP@0.5, and mAP@0.5–0.95, possibly because the introduction of RepVGG altered the feature representation, affecting the model’s ability to recognize certain details.
Finally, when all three modules are fully integrated, detection metrics (Precision, Recall, mAP@0.5, and mAP@0.5–0.95) on all datasets outperform the baseline model, indicating strong synergistic and complementary effects among the modules; however, no significant advantage is observed in computational resources (parameters and GFLOPs). Although the introduction of individual modules has both positive and negative impacts on model performance, the overall improvement strategy effectively enhances the model’s detection capabilities. To further understand these negative interactions, we conducted a detailed analysis of experimental results across different datasets. We found that module compatibility and dataset characteristics are key factors. For instance, the combination of BiFPN and RepVGG may be more effective in datasets with complex backgrounds and multi-scale objects, whereas the combination of Conv-SAM and BiFPN might be better suited for datasets with more uniform object distributions. Therefore, future research should consider optimizing module combinations for different application scenarios to achieve optimal performance.

3.2.3. Visualization Analysis of Detection Results

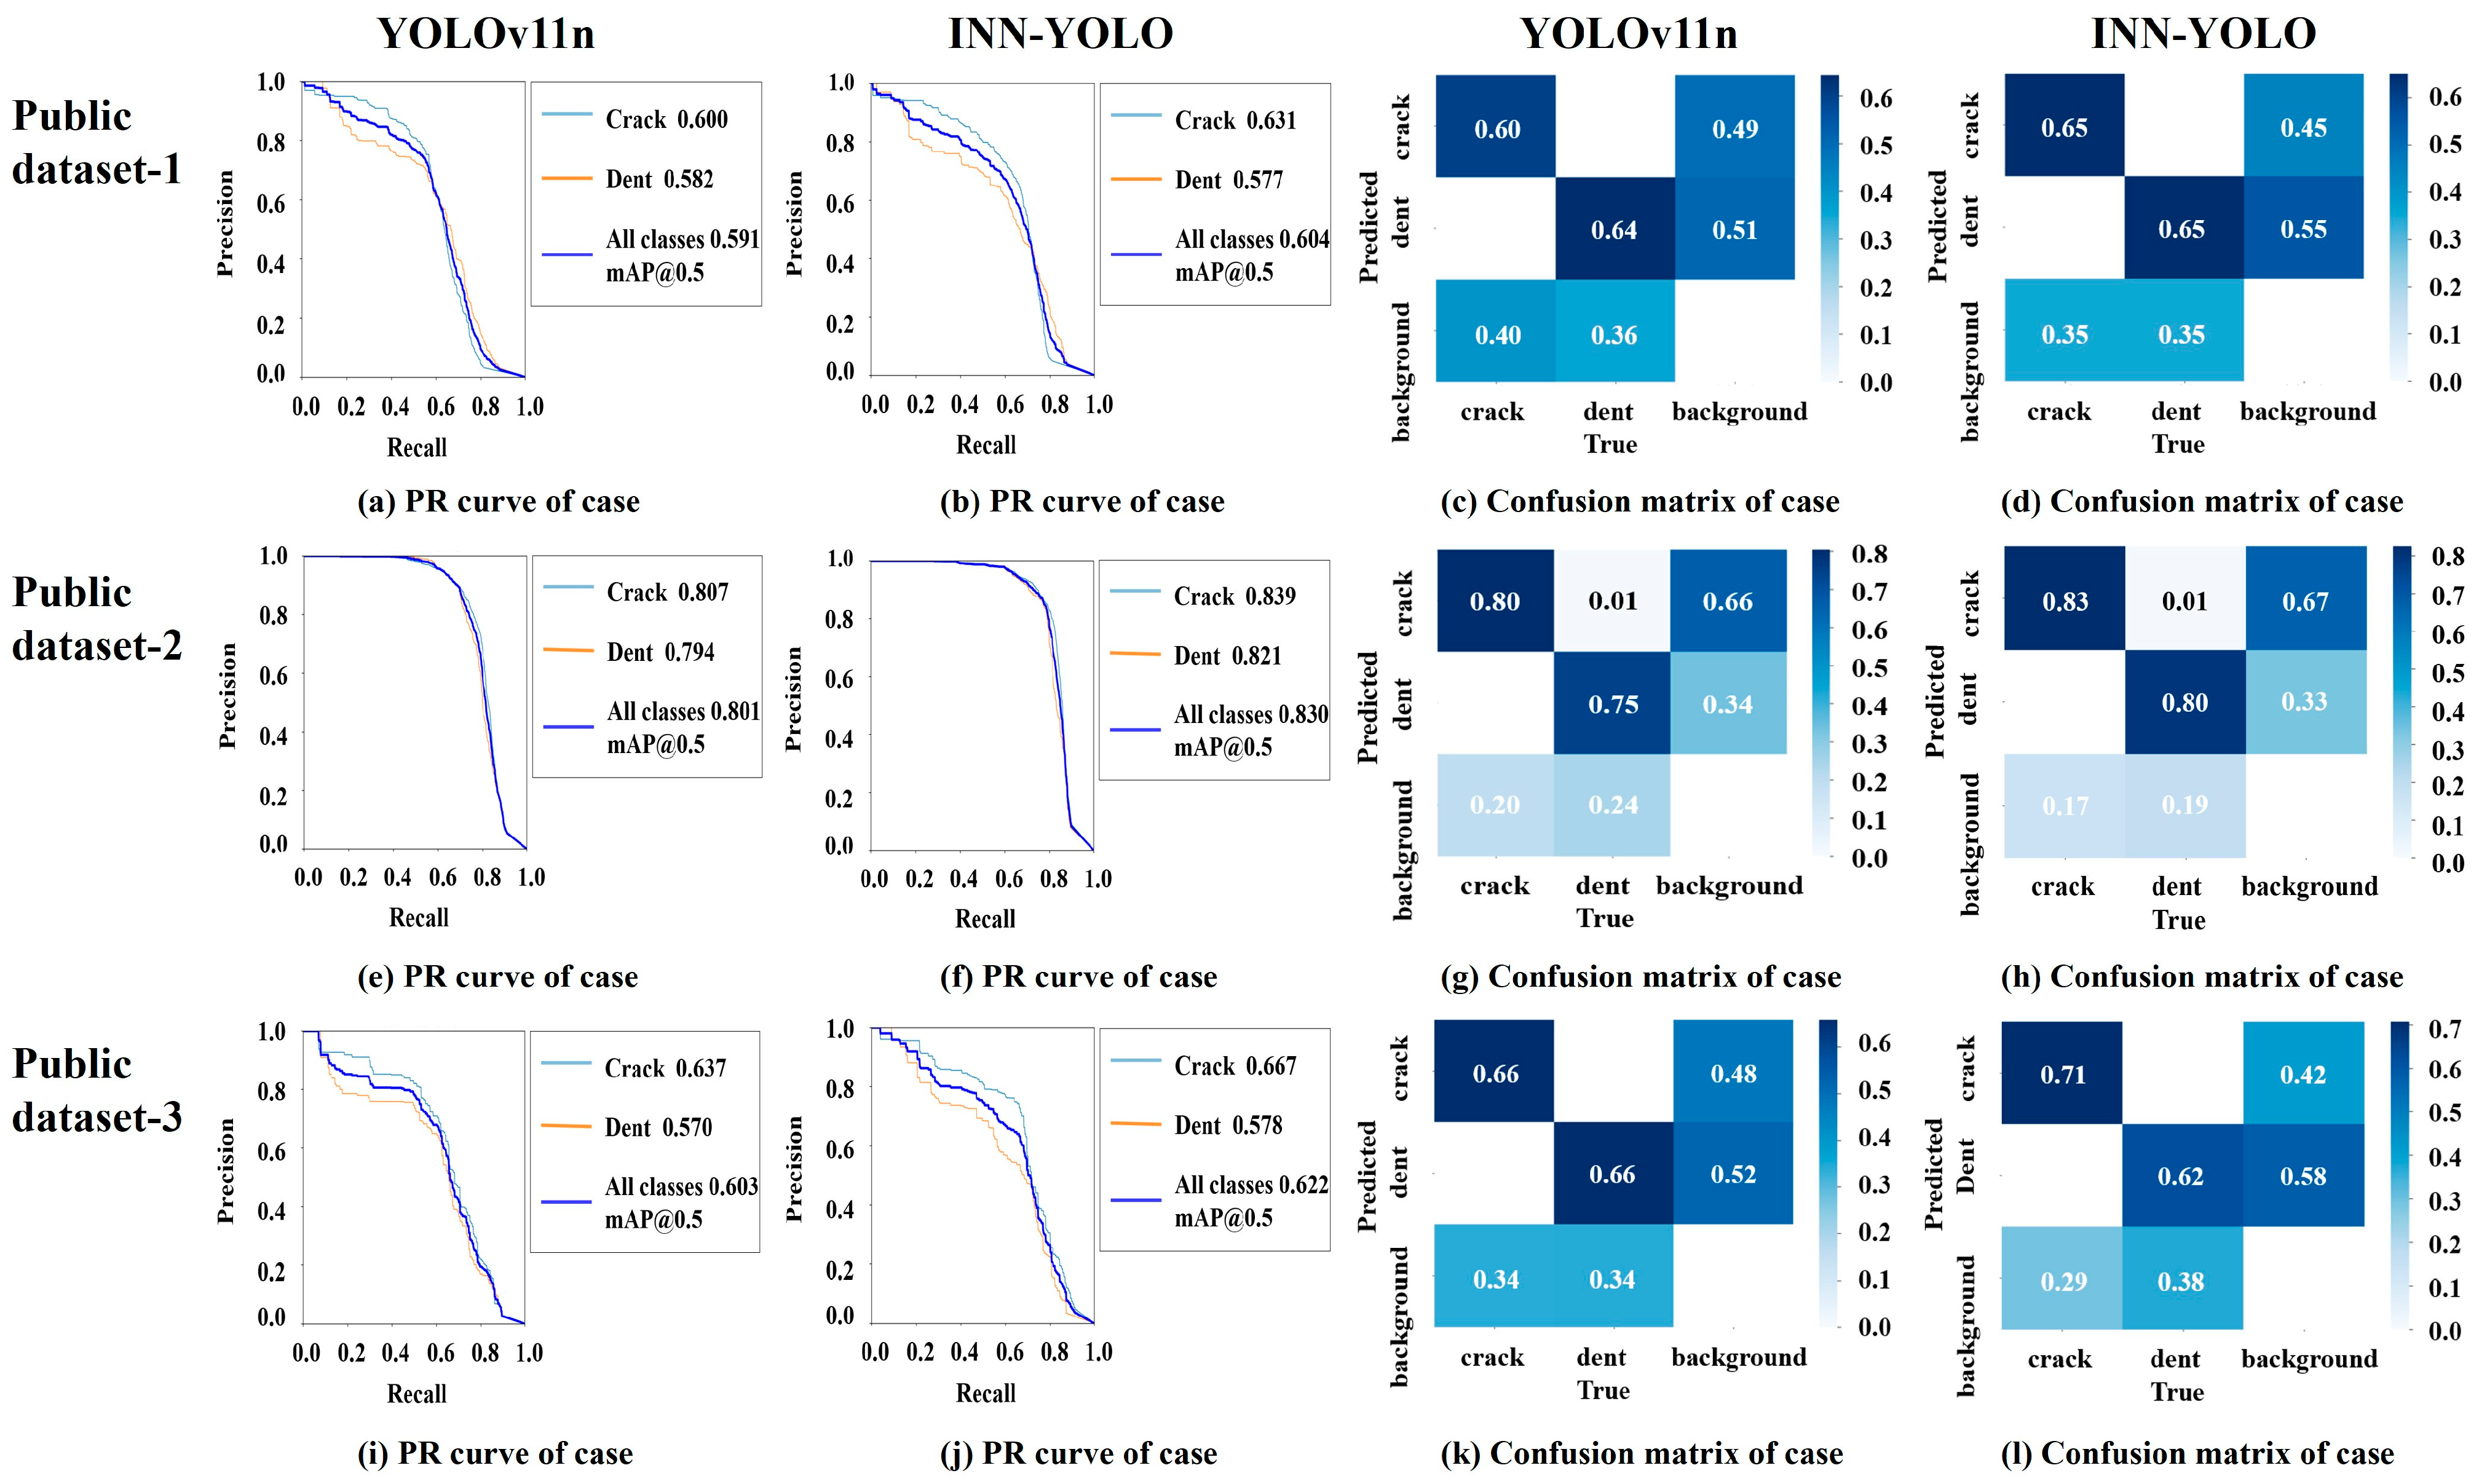
To intuitively demonstrate the detection performance of INN-YOLO, this paper presents an analysis using PR curves and a confusion matrix. Figure 10 compares the performance of YOLOv11n and INN-YOLO on three public datasets, showing that INN-YOLO achieves higher average precision and maintains better accuracy across different recall levels. Additionally, the diagonal values in its confusion matrix are higher, indicating lower false positive and false negative rates.
Figure 11 presents four images of aircraft skin defects, including cracks and dents, to qualitatively compare the performance of different detection algorithms. The results show that: In Image 1, models from YOLOv5n to YOLOv11n could barely detect any defects, while YOLOv9t had issues with misclassifying and missing cracks. In Image 2, all comparative models (YOLOv5n to YOLOv11n) failed to detect cracks and exhibited misclassification. For Image 3, YOLOv6n, YOLOv8n, YOLOv9t, and YOLOv11n faced misclassification problems; YOLOv10n missed the defects; YOLOv5n performed relatively better. In Image 4, YOLOv6n and YOLOv9t were almost incapable of detecting defects, whereas other models (YOLOv5n, YOLOv8n, YOLOv10n, YOLOv11n) showed high rates of misclassification and missed detections. In contrast, INN-YOLO demonstrates significantly higher accuracy and comprehensiveness in detecting aircraft skin defects, with lower rates of missed and false detections. It also provides more precise object localization and higher confidence scores, making it suitable for practical detection scenarios. This confirms its superiority in this application domain.

3.2.4. Model Generalization Validation

To validate the effectiveness and generalizability of the improved aircraft skin defect detection algorithm, comparative experiments were conducted on a self-built dataset with YOLOv11n and other mainstream algorithms. As shown in Table 6, the improved algorithm achieved increases of 6.50%, 4.60%, 6.70%, and 11.70% in Precision, Recall, mAP@0.5, and mAP@0.5–0.95, respectively, outperforming YOLOv5n, YOLOv6n, YOLOv8n, YOLOv9t, and YOLOv10n across all metrics. Table 7 presents the results of ablation experiments for various improved modules of the model: after combining SimAM with convolution efficiently, mAP@0.5 and mAP@0.5–0.95 improved by 0.20% and 1.30%, respectively; introducing BiFPN to reconstruct the neck network resulted in enhancements of 0.10%, 3.10%, 2.90%, and 1.10% in Precision, Recall, mAP@0.5, and mAP@0.5–0.95, respectively; incorporating the RepVGG structure into C3k2 further boosted Precision, Recall, mAP@0.5, and mAP@0.5–0.95 by 0.50%, 2.30%, 0.50%, and 1.60%, respectively. A series of experiments confirmed that the improved algorithm enhances performance on the self-built dataset and demonstrates certain generalization capability and adaptability, making it suitable for various detection scenarios. Although some metric improvements are relatively small, overall, these modifications contribute positively to the algorithm’s performance.

4. Discussion

This section discusses the path planning and object detection algorithms for UAV in aircraft skin defect detection, along with a feasibility analysis in real-world scenarios. Additionally, the limitations of the proposed methods are also discussed.

4.1. Discussion of the Coverage Path Planning Results

To address the path planning problem for UAV in aircraft skin defect detection, this paper proposes a three-dimensional space full-CPP method. The approach constructs an octree-based 3D aircraft model through voxelization and combines discrete grid partitioning with viewpoint line-of-sight annotation, transforming trajectory planning into an optimized point-to-point problem, thereby improving planning accuracy and efficiency. Additionally, the method introduces a probabilistic potential field approach to simulate visual perception, and employs a greedy strategy combined with Breadth-First Search (BFS) for path generation, achieving comprehensive coverage while ensuring safety. According to the results shown in Table 2, the proposed method can quickly plan paths with low repeat coverage rates and simple directional patterns under different resolutions, significantly enhancing detection efficiency. In conclusion, this method provides new insights and a practical foundation for the efficient application of UAV in the field of aviation detection.

4.2. Discussion of Target Detection Results of Aircraft Skin Defects

To more precisely evaluate the detection performance of the proposed method across different defect categories, this paper conducts a comparative analysis of multiple network models on both public and self-collected datasets, focusing on the detection of cracks and dents. As shown in Table 8, although INN-YOLO outperforms other models in overall performance, it still exhibits notable shortcomings in detecting dents. Specifically, on the Public dataset-1, INN-YOLO achieves a detection accuracy of 66.70% for dents, significantly lower than the baseline model’s 70.90%. This gap is not due to random fluctuations or minor variations but reflects INN-YOLO’s relatively weak capability in recognizing dent features on this dataset.
The disparity in performance between crack and dent detection reveals current models’ limitations when handling specific defect types. Possible reasons include an imbalanced distribution of dent samples in the training data and the inherently greater complexity of dents in terms of morphology and texture compared to cracks, making feature extraction more challenging. To effectively improve dent detection performance, future research should focus on optimizing data-level strategies, such as increasing the number of dent defect samples or designing targeted data augmentation methods to enrich their feature representation. These efforts would help alleviate the data imbalance issue, enhance the model’s ability to learn dent features, and thereby improve its generalization and robustness in diverse real-world scenarios.
Randomly selected images of aircraft skin defects from real-world scenarios were tested, and the detection results are shown in Figure 12. Most defects were correctly identified; however, some false detections were inevitable. This is due to the subtle features of certain defects and the similarity between the detected defects and other defect-like information in the background, making it difficult for the algorithm to accurately distinguish between targets and the background. These false detections highlight a limitation of INN-YOLO, indicating that its defect detection performance still requires continuous improvement and refinement to meet higher detection standards.

4.3. Feasibility Analysis

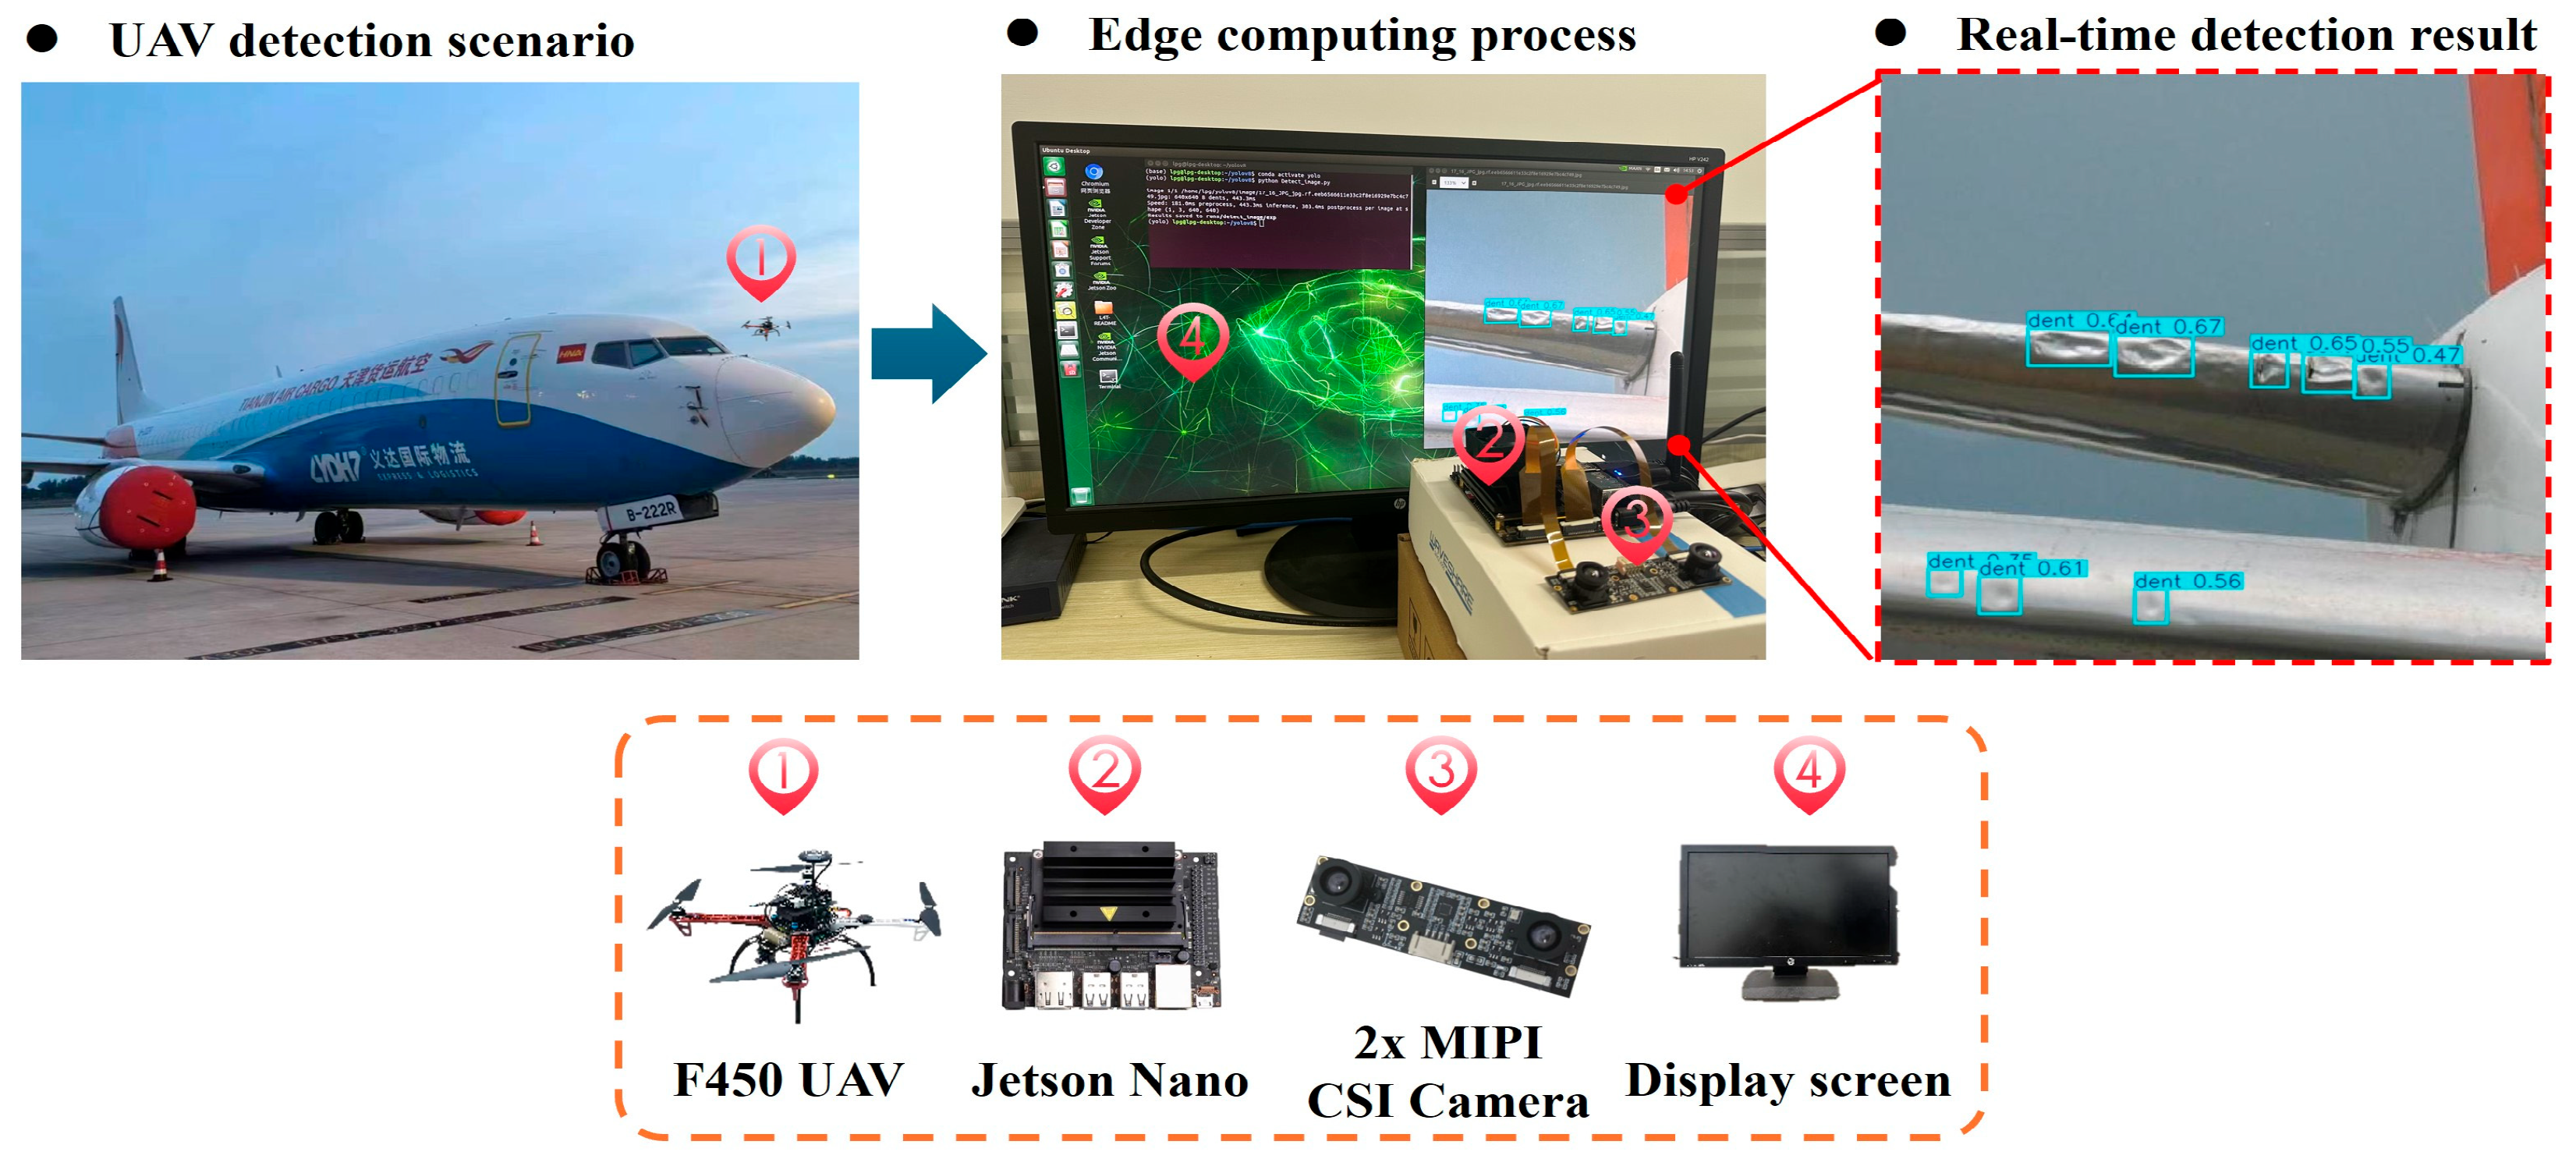
The deployment effectiveness of the algorithm in a real-world system was validated by establishing an aircraft surface detection scenario on an F450 UAV, as illustrated in Figure 13. The prerequisite for implementation is the generation of an automated detection path for the UAV. First, a full-coverage viewpoint planning algorithm was designed based on the aircraft model. Then, a detection path for executing automated UAV detections was generated according to the viewpoint planning results, enabling the UAV’s automatic detection functionality. The results demonstrate that the proposed algorithm is fundamentally feasible in terms of real-time performance and accuracy, addressing the practical requirements of automated detection tasks.
In the implementation process, we faced technical challenges in identifying skin defects and multi-scale irregular surface defects. By improving the feature extraction and fusion design of the proposed algorithm, the detection performance was effectively enhanced. These enhancements were critical for the practical deployment of our method, ensuring its ability to handle the complexities of real-world detections. Meanwhile, tests on the actual system also revealed some pressing issues that require further optimization to facilitate demonstration and promotion in practical application scenarios.

4.4. Limitations Analysis

Although the proposed method has achieved good results in aircraft skin defect detection, several limitations remain to be addressed. In terms of detection and deployment, the following limitations exist: ① The camera focal length affects the number of viewpoints and image resolution. Long-distance imaging reduces the number of viewpoints but makes defect targets smaller, thereby increasing the difficulty of detection. ② UAVs are susceptible to wind-induced vibrations, which can cause image blur and increase the risk of missed detections or false alarms. To mitigate this issue, a future solution could integrate an IMU module onto the drone to enhance imaging stability. This IMU would consist of an MPU6000 gyroscope, an IST8310 magnetometer, and a high-resolution barometer, the MS5611. The MPU6000 features low noise ( 0.05 ° / s / H z for the gyroscope and 400   μ g / H z for the accelerometer) and low temperature drift ( ± 0.02 ° / s / ° C for the gyroscope and ±35–60 mg for the accelerometer), supports an 8   k H z output rate, and employs a 16-bit ADC to provide high-dynamic-response data. The IST8310 magnetometer has a measurement range of ± 1600   μ T on the X and Y axes and ± 2500   μ T on the Z axis, with a resolution of 0.3   μ T / L S B and a zero-bias RMS of ± 0.3   μ T , effectively suppressing yaw drift and improving heading stability. The MS5611 barometer integrates a 24-bit ADC and temperature compensation to enable precise altitude sensing. ③ Environmental factors such as sunlight, glare, and rain pose additional challenges. Intense sunlight can cause glare on the aircraft skin surface, obscuring defect features and reducing image contrast, directly affecting the accuracy of defect identification. Rain not only causes water droplets on the camera lens leading to image blur but also alters the reflective properties of the skin surface, making it difficult for algorithms to distinguish true defects from water-induced artifacts. Regarding image blur, deep learning-based image deblurring algorithms could also be introduced in the post-processing stage, such as using pre-trained convolutional neural networks to enhance low-quality images and restore critical defect texture information, thereby improving detection robustness. ④ Although real-time inference has been achieved, further model compression and speed optimization are required when deploying on edge devices. Computational complexity can be reduced through techniques such as pruning and knowledge distillation. ⑤ The validation of path planning and autonomous detection functions in this study was primarily conducted on simulation platforms. While simulation results indicate good coverage performance and real-time capability, flight experiments on real UAV platforms have not yet been carried out. Future work will focus on conducting small-scale flight experiments in actual hangar environments to further verify the system’s robustness and practicality under real-world conditions.
In terms of algorithm design: ① Voxelization and grid division in path planning involve high computational costs, especially at high resolutions, leading to reduced efficiency. Challenges also exist in viewpoint extraction and path optimization, such as solving the incomplete graph TSP (Traveling Salesman Problem). ② The current model’s detection accuracy still struggles to meet industrial requirements, with missed detections and false alarms occurring in real-world scenarios due to subtle defects, complex backgrounds, and environmental interference, indicating insufficient generalization capability. Future efforts will systematically enhance robustness: introducing domain adaptation and multimodal fusion to strengthen feature discriminability, integrating prior knowledge to optimize post-processing, and improving deployment feasibility through lightweight design and efficient path planning, thus advancing the method toward practical application.
The currently proposed GB-CPP and INN-YOLO frameworks are not specifically designed to address the “base rate fallacy,” a cognitive bias or statistical inference issue. The base rate fallacy refers to the tendency in probabilistic judgment to ignore the prior probability (i.e., the base rate) of an event occurring, while over-relying on specific observed evidence, leading to erroneous decisions. In the defect detection task of this system, genuine defects on aircraft skin occur very infrequently (i.e., have an extremely low base rate). If the model makes independent judgments based solely on local image features without considering global prior probabilities—such as historical failure rates of specific regions or structural stress distributions—it may produce an excessively high false alarm rate under such low base rate conditions, especially when encountering texture patterns resembling defects or illumination artifacts. The current frameworks lack explicit modeling of defect prior probabilities and Bayesian inference mechanisms during the decision-making stage, thus remaining vulnerable to the influence of the base rate fallacy. Future work could explore integrating prior knowledge into the detection framework, for instance, by developing a decision module based on probabilistic graphical models or Bayesian deep learning, incorporating structural health monitoring data and historical maintenance records to enable more statistically realistic intelligent interpretation, thereby enhancing the system’s reliability and credibility in low base rate scenarios.

5. Conclusions

This paper combines GB-CPP and INN-YOLO to achieve automatic detection of aircraft skin defects. First, based on a 3D discrete grid map, viewpoints on the aircraft surface are obtained, and GB-CPP is used to plan a flight path covering the aircraft surface. Subsequently, the INN-YOLO network is employed to recognize images captured by the UAV, addressing challenges such as complex background, large scale variation, small target size, and edge deployment encountered in UAV-based aircraft skin defect detection. Finally, the improved INN-YOLO network is deployed on the edge device Jetson Nano, enabling real-time synchronization of aircraft skin defect data collection and analysis. The main conclusions are as follows:
(a)
The proposed detection method achieves efficient and comprehensive aircraft skin defect detection without missions. Based on a voxel model of the aircraft and leveraging the relationship between voxel space and grid maps, viewpoints on the aircraft surface are generated. GB-CPP are used to generate coverage paths, ensuring the UAV flight path fully covers the aircraft surface.
(b)
The proposed INN-YOLO network model demonstrates superior precision in detecting aircraft skin defects. Comparative experiments on three public datasets show that the proposed model outperforms others in Precision, Recall, mAP@0.5, and mAP@0.5–0.95 metrics, exhibiting the best overall performance.
(c)
Ablation experiments reveal that training the dataset using only YOLOv11n or individually modifying the baseline network yields unsatisfactory recognition results. Only by effectively combining all the improved modules on the baseline model to enhance the capability of target feature extraction could the model’s detection performance be effectively improved.
(d)
Generalization validation of INN-YOLO on a self-built dataset achieved Precision, Recall, mAP@0.5, and mAP@0.5–0.95 values of 90.20%, 74.70%, 80.30%, and 55.10%, respectively, representing improvements of 6.50%, 4.60%, 6.70%, and 11.70% over the baseline model. These results demonstrate the strong generalization capability of the model.
The current work still faces challenges such as limited computing resources on edge devices and insufficient generalization capability in defect detection. Future efforts will explore lighter yet high-precision network architectures, leveraging MobileNet series models to lightweight the backbone network of the baseline model, thereby reducing computational complexity while maintaining detection performance. Meanwhile, focusing on limited datasets, data augmentation using the Imgaug library will be employed to enrich the data resources.

Author Contributions

Conceptualization, Y.S., J.X. (Jinwu Xiang) and H.X.; Formal analysis, Y.S.; Funding acquisition, J.X. (Jinwu Xiang) and H.X.; Methodology, J.X. (Jinhong Xiong) and P.L.; Project administration, J.X. (Jinwu Xiang); Supervision, Y.S. and H.X.; Validation, P.L.; Visualization, J.X. (Jinhong Xiong); writing—original draft, J.X. (Jinhong Xiong); Writing—review and editing, P.L. and H.X. All authors have read and agreed to the published version of the manuscript.

Funding

This project is supported by the Natural Science Foundation of China (No. 12262015), Yunnan Province Major Science and Technology Special Plan (No. 202402AG050005), Yunnan Province Science and Technology Talent and Platform Plan (No. 202505AK340006, No. 202505AT350001), and Science and Technology Projects of Yunnan Province’s Higher Education Institutions Serving Key Industries (No. FWCY-BSPY2024062).

Data Availability Statement

The data presented in this study are openly available in https://doi.org/10.5281/zenodo.16792216.

Conflicts of Interest

The authors declare no conflicts of interest.

Abbreviations

The following abbreviations are used in this manuscript:
h × w The camera’s field of view is projected onto the target surface, forming a rectangular coverage area.
I The voxel edge length.
( i ,   j ,   k ) Each leaf node corresponds to the index of a cubic cell (voxel) with side length I .
P The 3D model point set.
V ( P ) The set of all voxels
L The side length of the cubic box that contains the 3D model.
v A unit vector representing the line of sight, describing the direction of the line of sight.
a A constant used to adjust the calculation of attraction, whose value needs to be set according to the specific application scenario.
p y The location where the UAV takes photos.
p t i The center position of the i t h voxel; only voxels within the sensor’s visible range are considered in the calculation of the average viewing direction of the viewpoint.
f m i n The minimum values of attraction.
f m a x The maximum values of attraction.
l Adjacency matrix
D i , j Distance cost between viewpoints
G Incomplete graph
E Set of feasible paths
d P , Q Distance between two viewpoints in 3D space
P 6 t d Middle features of the sixth layer from top to bottom.
P 6 o u t Output features of the sixth layer from bottom to top.
ω A weight parameter between 0 and 1.
ϵ A constant used to avoid numerical instability.
w t Linear transformation weight of the target neuron
b t Linear transformation bias of the target neuron
y Ideal output labels of target neuron t and other neurons
λ A regularization coefficient used to regularize weights in the energy function, preventing overfitting and enhancing the model’s generalization capability.
σ t 2 The variance of neurons other than the target neuron t .
u t The mean of neurons other than the target neuron t .
μ The mean of all neurons on the channel (including the target neuron t ).
σ ^ 2 The variance of all neurons on the channel (including the target neuron t ).
APAverage Precision.
mAPmean Average Precision.
T P The number of positive samples correctly detected.
F P The number of positive samples that were missed.
F N The number of negative samples incorrectly classified as positive.
A P i The average precision for the i t h target category.

References

  1. Huang, B.; Ding, Y.; Liu, G. ASD-YOLO: An aircraft surface defects detection method using deformable convolution and attention mechanism. Measurement 2024, 238, 115300. [Google Scholar] [CrossRef]
  2. Liu, Y.; Dong, J.; Li, Y.; Gong, X.; Wang, J. A UAV-based aircraft surface defect inspection system via external constraints and deep learning. IEEE Trans. Instrum. Meas. 2022, 71, 5019315. [Google Scholar] [CrossRef]
  3. Deane, S.; Avdelidis, N.P.; Ibarra-Castanedo, C. Development of a thermal excitation source used in an active thermographic UAV platform. Quant. InfraRed Thermogr. J. 2022, 20, 198–229. [Google Scholar] [CrossRef]
  4. Saha, A.; Kumar, L.; Sortee, S.; Dhara, B.C. An Autonomous Aircraft Inspection System using Collaborative Unmanned Aerial Vehicles. In Proceedings of the 2023 IEEE Aerospace Conference, Big Sky, MT, USA, 4–11 March 2023; pp. 1–10. [Google Scholar] [CrossRef]
  5. Fevgas, G.; Lagkas, T.; Argyriou, V.; Sarigiannidis, P. Coverage Path Planning Methods Focusing on Energy Efficient and Cooperative Strategies for Unmanned Aerial Vehicles. Sensors 2022, 22, 1235. [Google Scholar] [CrossRef]
  6. Dogru, S.; Marques, L. ECO-CPP: Energy constrained online coverage path planning. Robot. Auton. Syst. 2022, 157, 104242. [Google Scholar] [CrossRef]
  7. Abou-Bakr, E.; Alnajim, A.M.; Alashwal, M.; Elmanfaloty, R.A. Chaotic sequence-driven path planning for autonomous robot terrain coverage. Comput. Electr. Eng. 2025, 123, 110032. [Google Scholar] [CrossRef]
  8. Kyriakakis, N.A.; Marinaki, M.; Matsatsinis, N.; Marinakis, Y. A cumulative unmanned aerial vehicle routing problem approach for humanitarian coverage path planning. Eur. J. Oper. Res. 2022, 300, 992–1004. [Google Scholar] [CrossRef]
  9. Jing, W.; Polden, J.; Lin, W.; Shimada, K. Sampling-based view planning for 3D visual coverage task with Unmanned Aerial Vehicle. In Proceedings of the International Conference on Intelligent Robots and Systems (IROS), Daejeon, Republic of Korea, 9–14 October 2016; pp. 1808–1815. [Google Scholar] [CrossRef]
  10. Bircher, A. Structural inspection path planning via iterative viewpoint resampling with application to aerial robotics. In Proceedings of the 2015 IEEE International Conference on Robotics and Automation (ICRA), Seattle, WA, USA, 26–30 May 2015; pp. 6423–6430. [Google Scholar] [CrossRef]
  11. Abdi, A.; Ranjbar, M.H.; Park, J.H. Computer Vision-Based Path Planning for Robot Arms in Three-Dimensional Workspaces Using Q-Learning and Neural Networks. Sensors 2022, 22, 1697. [Google Scholar] [CrossRef]
  12. Jung, S.; Song, S.; Youn, P.; Myung, H. Multi-Layer Coverage Path Planner for Autonomous Structural Inspection of High-Rise Structures. In Proceedings of the International Conference on Intelligent Robots and Systems (IROS), Madrid, Spain, 1–5 October 2018; pp. 1–9. [Google Scholar] [CrossRef]
  13. Tong, H.W.; Li, B.; Huang, H.; Wen, C. UAV Path Planning for Complete Structural Inspection using Mixed Viewpoint Generation. In Proceedings of the International Conference on Control, Singapore, 11–13 December 2022; pp. 727–732. [Google Scholar] [CrossRef]
  14. Almadhoun, R.; Taha, T.; Dias, J. Coverage path planning for complex structures inspection using unmanned aerial vehicle (UAV). In Intelligent Robotics and Applications; Springer: Cham, Switzerland, 2019; pp. 243–266. [Google Scholar] [CrossRef]
  15. Almadhoun, R.; Taha, T.; Gan, D.; Dias, J.; Zweiri, Y.; Seneviratne, L. Coverage Path Planning with Adaptive Viewpoint Sampling to Construct 3D Models of Complex Structures for the Purpose of Inspection. In Proceedings of the International Conference on Intelligent Robots and Systems (IROS), Madrid, Spain, 1–5 October 2018; pp. 7047–7054. [Google Scholar] [CrossRef]
  16. Papaioannou, S.; Kolios, P.; Theocharides, T.; Panayiotou, C.G.; Polycarpou, M.M. UAV-based Receding Horizon Control for 3D Inspection Planning. In Proceedings of the 2022 International Conference on Unmanned Aircraft Systems (ICUAS), Dubrovnik, Croatia, 21–24 June 2022; pp. 1121–1130. [Google Scholar] [CrossRef]
  17. Jing, W.; Deng, D.; Xiao, Z.; Liu, Y.; Shimada, K. Coverage Path Planning using Path Primitive Sampling and Primitive Coverage Graph for Visual Inspection. In Proceedings of the International Conference on Intelligent Robots and Systems (IROS), Macau, China, 3–8 November 2019; pp. 1472–1479. [Google Scholar] [CrossRef]
  18. Panigati, T.; Zini, M.; Striccoli, D.; Giordano, P.F.; Tonelli, D.; Limongelli, M.P.; Zonta, D. Drone-based bridge inspections: Current practices and future directions. Autom. Constr. 2025, 173, 106101. [Google Scholar] [CrossRef]
  19. Liu, Y.; Moghaddas, S.A.; Shi, S.; Huang, Y.; Kong, J.; Bao, Y. Review on applications of computer vision techniques for pipeline inspection. Measurement 2025, 252, 117370. [Google Scholar] [CrossRef]
  20. Liu, Y.; Zhang, H.; Li, Y.; Cheng, Z.; Li, R. High efficiency and high precision measurement method for the volume of weights using computer vision. Measurement 2025, 252, 117353. [Google Scholar] [CrossRef]
  21. Cheng, Y.; Tian, Z.; Ning, D.; Feng, K.; Li, Z.; Chauhan, S.; Vashishtha, G. Computer vision-based non-contact structural vibration measurement: Methods, challenges and opportunities. Measurement 2025, 243, 116426. [Google Scholar] [CrossRef]
  22. Niu, Y.; Li, Z.; Li, J.; Sun, B. Accelerometer-assisted computer vision data fusion framework for structural dynamic displacement reconstruction. Measurement 2025, 242, 116021. [Google Scholar] [CrossRef]
  23. Girshick, R. Fast R-CNN. In Proceedings of the 2015 IEEE International Conference on Computer Vision (ICCV), Santiago, Chile, 7–13 December 2015; pp. 1440–1448. [Google Scholar] [CrossRef]
  24. Redmon, J.; Divvala, S.; Girshick, R.; Farhadi, A. You only look once: Unified, realtime object detection. In Proceedings of the IEEE Conference on Computer Vision and Pattern Recognition, Las Vegas, NV, USA, 27–30 June 2016; pp. 779–788. [Google Scholar] [CrossRef]
  25. Liu, W.; Anguelov, D.; Erhan, D.; Szegedy, C.; Reed, S.; Fu, C.-Y.; Berg, A.C. Ssd: Single shot multibox detector. In Proceedings of the Computer Vision–ECCV 2016: 14th European Conference, Amsterdam, The Netherlands, 11–14 October 2016; pp. 21–37. [Google Scholar] [CrossRef]
  26. Zhang, W.; Liu, J.; Yan, Z. FC-YOLO: An Aircraft Skin Defect Detection Algorithm Based on Multi-Scale Collaborative Feature Fusion; IOP Publishing Ltd.: Bristol, UK, 2024. [Google Scholar] [CrossRef]
  27. Malekzadeh, T.; Abdollahzadeh, M.; Nejati, H. Aircraft Fuselage Defect Detection using Deep Neural Networks. arXiv 2017, arXiv:1712.09213. [Google Scholar] [CrossRef]
  28. Ramalingam, B.; Manuel, V.H.; Elara, M.R. Visual inspection of the aircraft surface using a teleoperated reconfigurable climbing robot and enhanced deep learning technique. Int. J. Aerosp. Eng. 2019, 2019, 5137139. [Google Scholar] [CrossRef]
  29. Li, H.; Wang, C.; Liu, Y. Yolo-fdd: Efficient defect detection network of aircraft skin fastener. Image Video Process. 2024, 18, 3197–3211. [Google Scholar] [CrossRef]
  30. Wang, H.; Fu, L.; Wang, L. Detection algorithm of aircraft skin defects based on improved YOLOv8n. Signal Image Video Process. 2024, 18, 3877–3891. [Google Scholar] [CrossRef]
  31. Bouarfa, S.; Doğru, A.; Arizar, R. Towards Automated Aircraft Maintenance Inspection. A use case of detecting aircraft dents using Mask R-CNN. In Proceedings of the AIAA Scitech 2020 Forum, Orlando, FL, USA, 6–10 January 2020; p. 0389, Information and Command and Control Systems. [Google Scholar] [CrossRef]
  32. Doğru, A.; Bouarfa, S.; Arizar, R.; Aydoğan, R. Using Convolutional Neural Networks to Automate Aircraft Maintenance Visual Inspection. Aerospace 2020, 7, 171. [Google Scholar] [CrossRef]
  33. Ding, M.; Wu, B.; Xu, J.; Kasule, A.N.; Zuo, H. Visual inspection of aircraft skin: Automated pixel-level defect detection by instance segmentation. Chin. J. Aeronaut. 2022, 35, 254–264. [Google Scholar] [CrossRef]
  34. Ameri, R.; Hsu, C.-C.; Band, S.S. A systematic review of deep learning approaches for surface defect detection in industrial applications. Eng. Appl. Artif. Intell. 2024, 130, 107717. [Google Scholar] [CrossRef]
  35. Pan, H.; Guan, S.; Zhao, X. LVD-YOLO: An efficient lightweight vehicle detection model for intelligent transportation systems. Image Vis. Comput. 2024, 151, 105276. [Google Scholar] [CrossRef]
  36. Modi, T.M.; Venkateswararao, K.; Swain, P. Integration of SDN into UAV, edge computing, & Blockchain: A review, challenges, & future directions. Comput. Sci. Rev. 2025, 58, 100790. [Google Scholar] [CrossRef]
  37. Aishwarya, N.; Kannaa, G.S.Y.; Seemakurthy, K. YOLOSkin: A fusion framework for improved skin cancer diagnosis using YOLO detectors on Nvidia Jetson Nano. Biomed. Signal Process. Control 2025, 100, 1746–8094. [Google Scholar] [CrossRef]
  38. Dai, J.; Gong, X.; Wang, J. Unmanned Aerial Vehicle Coverage Path Planning Method for Aircraft External Surface Inspection Tasks. J. Mech. Eng. 2023, 59, 243–253. [Google Scholar]
  39. Meagher, D. Geometric modeling using octree encoding. Comput. Graph. Image Process. 1982, 19, 129–147. [Google Scholar] [CrossRef]
  40. Melo, A.G.; Pinto, M.F.; Marcato, A.L.M.; Honório, L.M.; Coelho, F.O. Dynamic Optimization and Heuristics Based Online Coverage Path Planning in 3D Environment for UAVs. Sensors 2021, 21, 1108. [Google Scholar] [CrossRef] [PubMed]
  41. Tan, C.S.; Mohd-Mokhtar, R.; Arshad, M.R. A Comprehensive Review of Coverage Path Planning in Robotics Using Classical and Heuristic Algorithms. IEEE Access 2021, 9, 119310–119342. [Google Scholar] [CrossRef]
  42. Khanam, R.; Hussain, M. Yolov11: An overview of the key architectural enhancements. arXiv 2024, arXiv:2410.17725. [Google Scholar] [CrossRef]
  43. Tan, M.; Pang, R.; Le, Q.V. EfficientDet: Scalable and Efficient Object Detection. In Proceedings of the 2020 IEEE/CVF Conference on Computer Vision and Pattern Recognition (CVPR), Seattle, WA, USA, 13–19 June 2020; pp. 10778–10787. [Google Scholar] [CrossRef]
  44. Liu, S.; Qi, L.; Qin, H.; Shi, J.; Jia, J. Path Aggregation Network for Instance Segmentation. In Proceedings of the 2018 IEEE/CVF Conference on Computer Vision and Pattern Recognition (CVPR), Salt Lake City, UT, USA, 18–23 June 2018. [Google Scholar] [CrossRef]
  45. Yang, L.; Zhang, R.Y.; Li, L. SimAM: A Simple, Parameter-Free Attention Module for Convolutional Neural Networks. Int. Conf. Mach. Learn. 2021, 139, 11863–11874. Available online: https://api.semanticscholar.org/CorpusID:235825945 (accessed on 6 June 2025).
  46. Ding, X.; Zhang, X.; Ma, N.; Han, J.; Ding, G.; Sun, J. RepVGG: Making VGG-style ConvNets Great Again. In Proceedings of the 2021 IEEE/CVF Conference on Computer Vision and Pattern Recognition (CVPR), Nashville, TN, USA, 20–25 June 2021; pp. 13728–13737. [Google Scholar] [CrossRef]
  47. Russell, B.C.; Torralba, A.; Murphy, K.P. LabelMe: A Database and Web-Based Tool for Image Annotation. Int. J. Comput. Vis. 2008, 77, 157–173. [Google Scholar] [CrossRef]
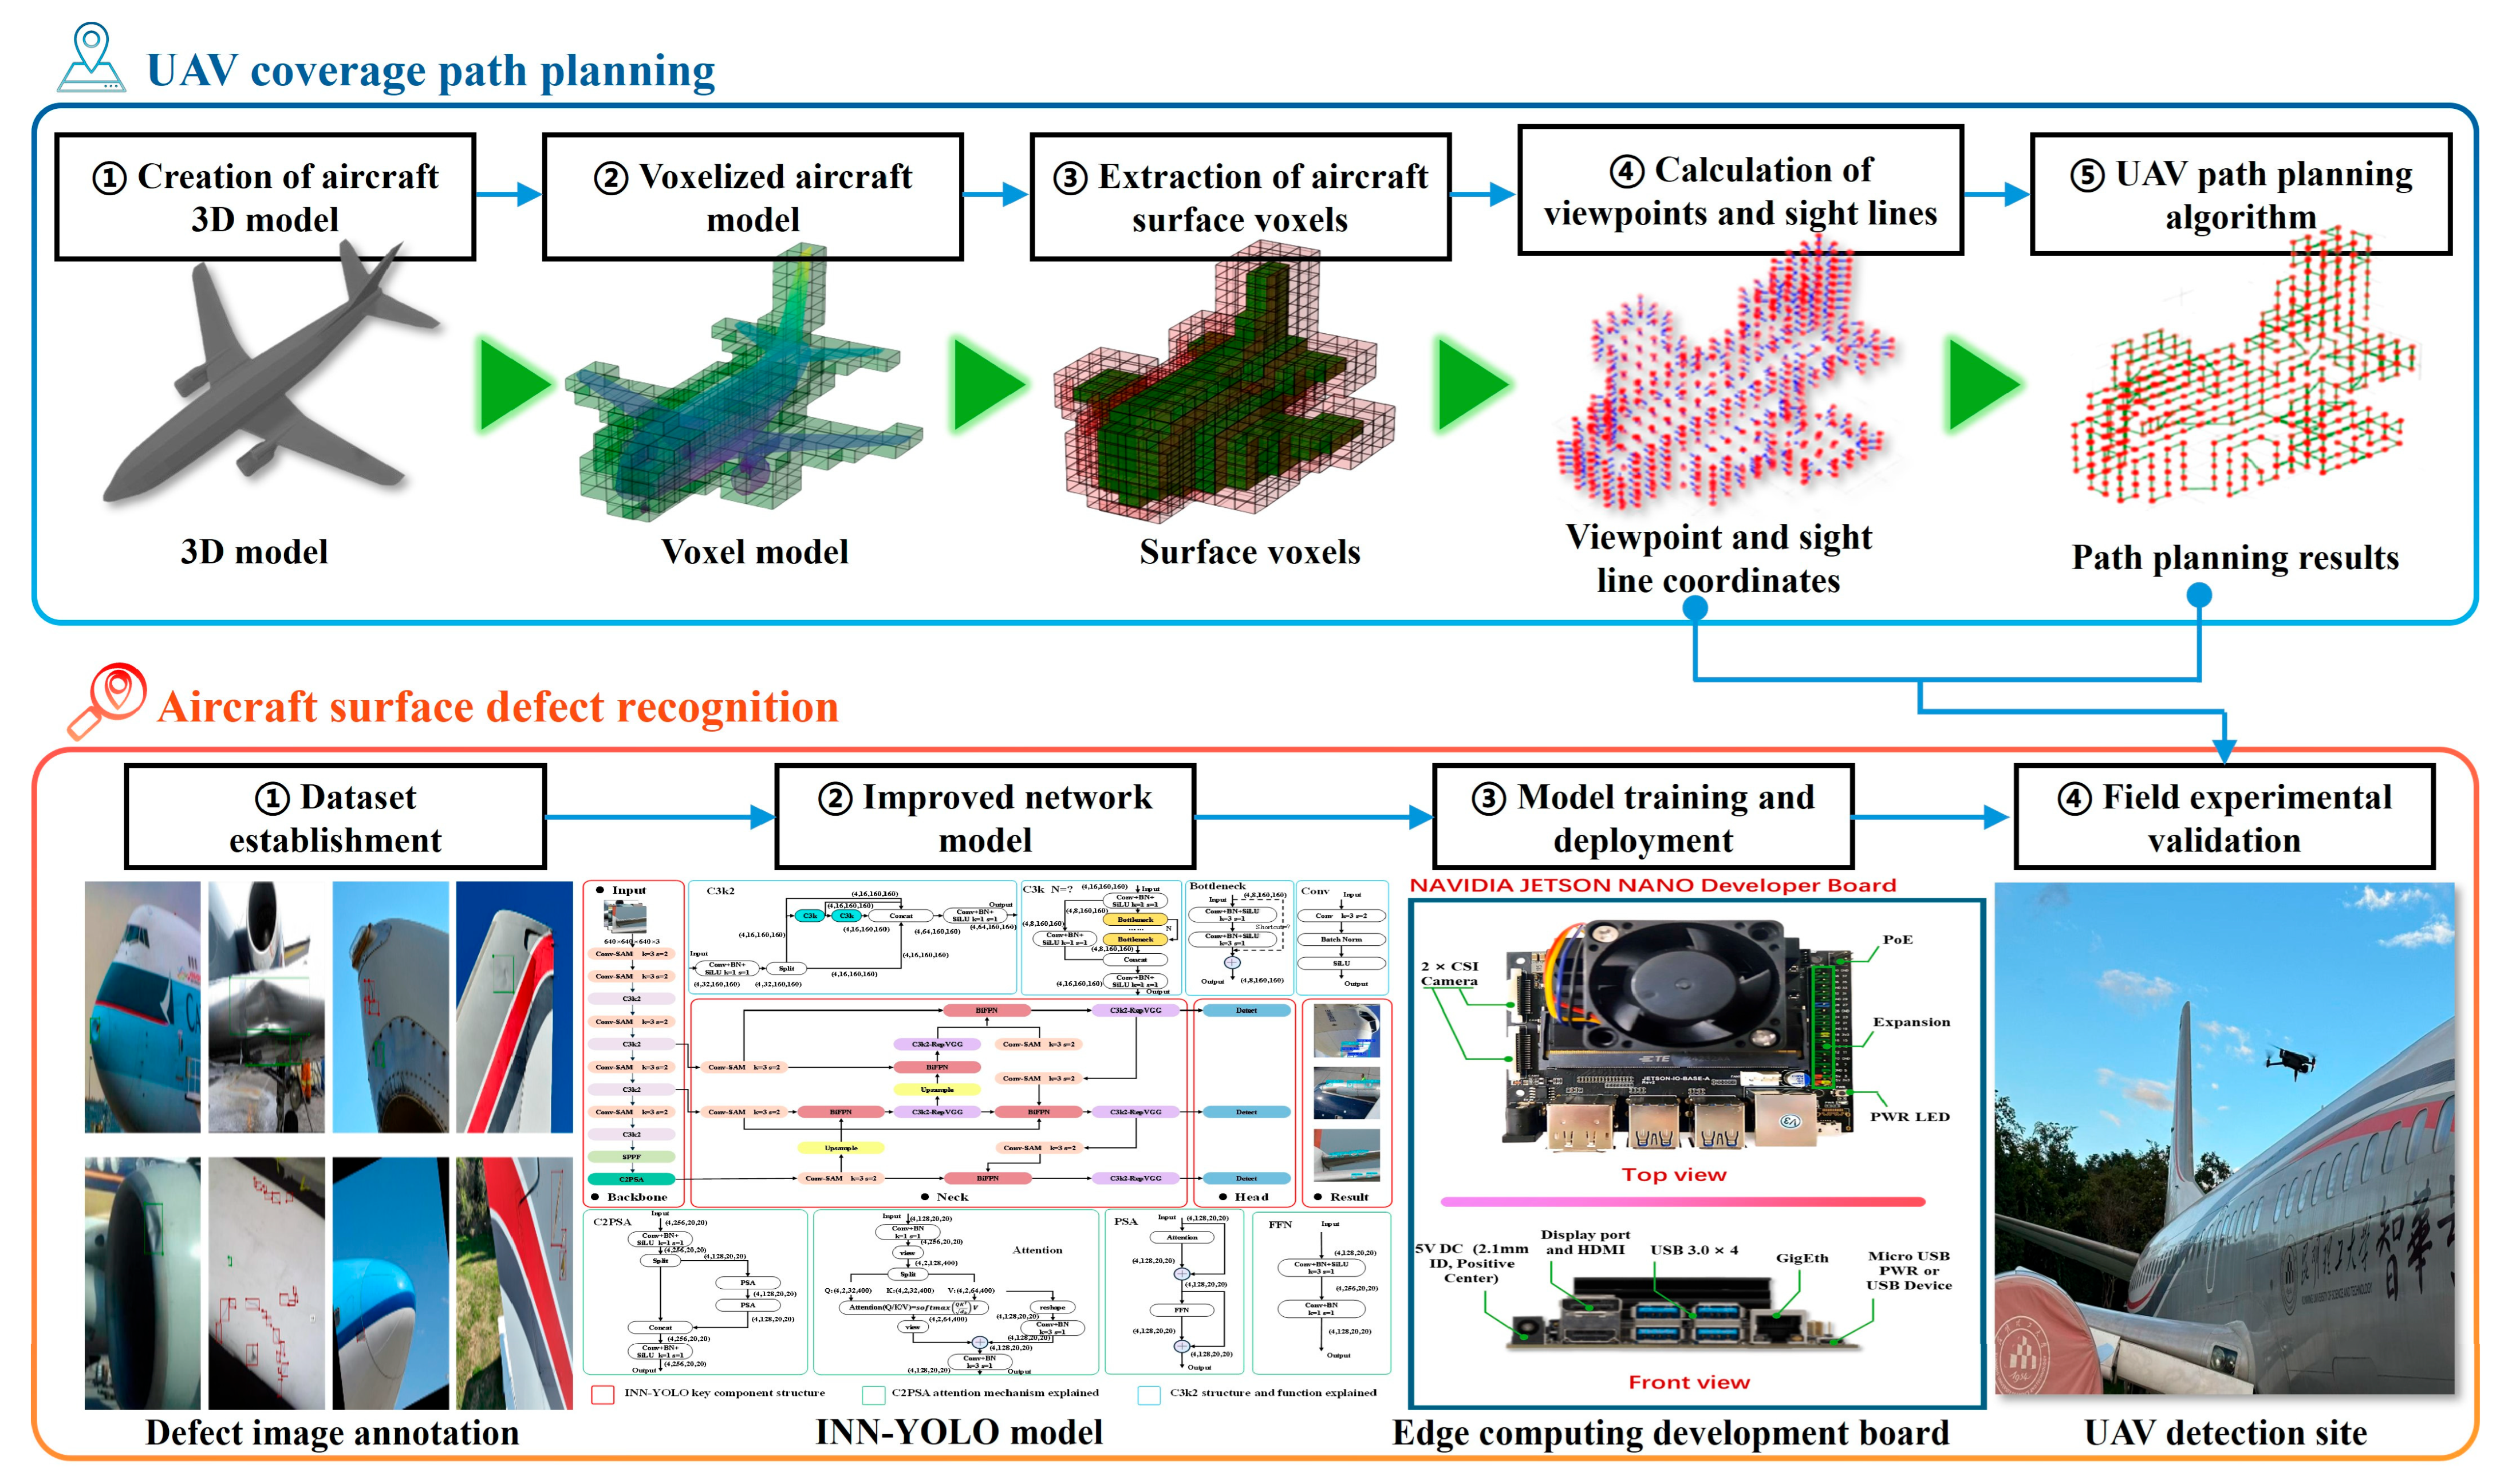
Figure 1. Overall framework of the automatic detection method for aircraft skin defects.
Drones 09 00594 g001
Figure 2. Flowchart of UAV path planning.
Drones 09 00594 g002
Figure 3. Schematic of UAV field of view and grid. (a) UAV field of view, (b) voxel edge length, (c) 3D gride size, (d) voxel results.
Drones 09 00594 g003
Figure 4. Viewpoint labeling results: (a) discrete grid map, (b) aircraft surface voxel, (c) aircraft surface viewpoint, (d) schematic plan of the labeled values.
Drones 09 00594 g004
Figure 5. Results of viewing direction generation. (a) Calculation results of viewing direction and internal voxels, (b) calculation results of viewing direction.
Drones 09 00594 g005
Figure 6. INN-YOLO network architecture.
Drones 09 00594 g006
Figure 7. Multi-scale fusion of the neck: (a) Baseline network of the neck, (b) BiFPN structure, (c) Network reconstruction of the neck.
Drones 09 00594 g007
Figure 8. SimAM attention module and Conv-SAM module. (a) SimAM attention module, (b) Conv-SAM module.
Drones 09 00594 g008
Figure 9. Structure of the C3k2-RepVGG model. (a) C3k2, (b) C3k2-RepVGG.
Drones 09 00594 g009
Figure 10. PR curve and confusion matrix diagram. (a) PR curve of case: This represents the precision-recall curve of the YOLOv11n model on Public Dataset 1. (b) PR curve of case: This is the precision-recall curve of the INN-YOLO model on Public Dataset 1. (c) Confusion matrix of case: This shows the confusion matrix of the YOLOv11n model on Public Dataset 1. (d) Confusion matrix of case: This is the confusion matrix of the INN-YOLO model on Public Dataset 1. (e) PR curve of case: This represents the precision-recall curve of the YOLOv11n model on Public Dataset 2. (f) PR curve of case: This is the precision-recall curve of the INN-YOLO model on Public Dataset 2. (g) Confusion matrix of case: This shows the confusion matrix of the YOLOv11n model on Public Dataset 2. (h) Confusion matrix of case: This is the confusion matrix of the INN-YOLO model on Public Dataset 2. (i) PR curve of case: This represents the precision-recall curve of the YOLOv11n model on Public Dataset 3. (j) PR curve of case: This is the precision-recall curve of the INN-YOLO model on Public Dataset 3. (k) Confusion matrix of case: This shows the confusion matrix of the YOLOv11n model on Public Dataset 3. (l) Confusion matrix of case: This is the confusion matrix of the INN-YOLO model on Public Dataset 3.
Drones 09 00594 g010
Figure 11. Qualitative comparison of detection results.
Drones 09 00594 g011
Figure 12. Example of defect detection results.
Drones 09 00594 g012
Figure 13. Algorithm application scenario diagram.
Drones 09 00594 g013
Table 1. Information on public datasets.
DatasetQuantityDefects (Number)Image Size (Pixels)Sample Images
Public dataset-1 atraining set: 3659
validation set: 416
test set: 94
crack: 5970
dent: 3787
640 × 640Drones 09 00594 i001
Public dataset-2 btraining set: 2530
validation set: 712
test set: 352
crack: 8141
dent: 3477
416 × 416
640 × 640
Drones 09 00594 i002
Public dataset-3 ctraining set: 2948
validation set: 168
test set: 58
crack: 3800
dent: 3309
640 × 640
416 × 416
Drones 09 00594 i003
Self-built datasets dtraining set: 1338
validation set: 192
test set: 29
crack: 3833
dent: 3271
320 × 320
2098 × 2796
Drones 09 00594 i004
a The URL of the dataset: https://universe.roboflow.com/youssef-donia-fhktl/aircraft-damage-detection-2 (accessed on 21 May 2024). b The URL of the dataset: https://universe.roboflow.com/ke-project/yolo-tb1l6 (accessed on 23 May 2024). c The URL of the dataset: https://universe.roboflow.com/youssef-donia-fhktl/aircraft-damage-detection-1j9qk (accessed on 28 May 2024). d The URL of the dataset: https://doi.org/10.5281/zenodo.16792216 (accessed on 20 April 2025).
Table 2. INN-YOLO model deployment process.
Algorithm: Deploy INN-YOLO on Jetson NanoJetson Nano Physical Image
Input: ModelPath, ImagePath
Output: DetectionResults
  ① Initialize INN-YOLO model with TensorRT:
    network = Initialize_INN-YOLO(ModelPath)
  ② Load input image:
    img = LoadImage(ImagePath)
  ③ Perform object detection:
    DetectionResults = net.Detect(img)
  ④ For each detection in DetectionResults:
    Extract class ID, confidence score, and bounding box.
Drones 09 00594 i005
Table 3. Table of simulation experiment results.
Path Planning SchematicPath Evaluation IndicatorsPath Evaluation Values
Drones 09 00594 i006
(a) I = 3.5 m
Resolution3.5
Number of viewpoints (number)326
Total number of paths covered (number)344
Duplicate coverage areas (number)18
Repeat coverage (%)5.23
Time consumption/s3.00
Drones 09 00594 i007
(b) I = 2.5 m
Resolution2.5
Number of viewpoints (number)443
Total number of paths covered (number)475
Duplicate coverage areas (number)32
Repeat coverage (%)6.74
Time consumption/s4.00
Drones 09 00594 i008
(c) I = 1.5 m
Resolution1.5
Number of viewpoints (number)1042
Total number of paths covered (number)1098
Duplicate coverage areas (number)56
Repeat coverage (%)5.1
Time consumption/s11.69
Table 4. Algorithm comparison experiments.
DatasetMetricsYOLOv5nYOLOv6nYOLOv8nYOLOv9tYOLOv10nYOLOv11nINN-YOLOp95%CI
Public dataset-1Precision (%)58.8051.3065.8065.0055.6064.5067.002.23 × 10−3(1.68, 3.88)
Recall (%)33.3024.7032.5024.8029.6030.3041.005.84 × 10−8(9.48, 11.38)
mAP@0.5 (%)33.1023.2032.7024.9029.8031.6042.303.18 × 10−7(9.10, 11.40)
mAP@0.5–0.95 (%)15.3010.3015.6011.2013.9014.9021.504.01 × 10−6(5.02, 6.88)
parameters2,182,0544,155,2222,684,7581,730,2142,695,1962,582,5422,634,330--
GFLOPs5.811.56.86.48.26.37.1--
Public dataset-2Precision (%)87.4084.9088.0082.9081.9087.1090.903.00 × 10−4(2.40, 4.56)
Recall (%)69.0054.6069.1065.7070.2074.1076.605.79 × 10−6(2.34, 3.26)
mAP@0.5 (%)78.1065.4079.7073.6077.6081.6084.106.48 × 10−5(2.62, 4.18)
mAP@0.5–0.95 (%)51.8043.4054.5048.3052.2055.0057.301.75 × 10−5(2.06, 3.00)
parameters2,182,0544,155,2222,684,7581,730,2142,695,1962,582,5422,634,330--
GFLOPs5.811.56.86.48.26.37.1--
Public dataset-3Precision (%)60.1065.5060.7064.3058.2058.7064.805.96 × 10−8(6.10, 7.36)
Recall (%)52.9049.0059.3052.0049.0052.7059.708.54 × 10−7(5.92, 7.70)
mAP@0.5 (%)53.3048.0052.3051.0047.0053.2056.403.36 × 10−5(2.74, 4.14)
mAP@0.5–0.95 (%)27.4021.9025.0024.9023.7025.3027.904.72 × 10−5(2.16, 3.42)
parameters2,182,0544,155,2222,684,7581,730,2142,695,1962,582,5422,634,330--
GFLOPs5.811.56.86.48.26.37.1--
Table 5. Ablation experiment.
DatasetMethodMetrics
CaseYOLOv11nConv-SAMBiFPNC3k2-RepVGGPrecision
(%)
Recall
(%)
mAP@0.5
(%)
mAP@0.5–0.95 (%)ParametersGFLOPs
Public dataset-1(a) 64.5030.3031.6014.902,582,5426.3
(b) 62.4033.1033.2015.802,583,2306.3
(c) 64.2035.3037.7016.002,670,5387.0
(d) 63.3032.6033.5014.502,598,0786.4
(e) 54.0032.3029.8013.102,671,4187.0
(f) 59.7030.4030.6013.902,697,0347.0
(g) 61.7032.4035.4015.802,598,7666.4
(h)67.0041.0042.3021.502,634,3307.1
Public dataset-2(a) 87.1074.1081.6055.002,582,5426.3
(b) 89.2071.5081.0053.702,583,2306.3
(c) 83.0070.2076.3053.402,670,5387.0
(d) 87.3072.9079.0055.102,598,0786.4
(e) 86.3064.5074.3050.602,671,4187.0
(f) 85.7064.2073.8049.802,697,0347.0
(g) 88.5070.2077.5052.002,598,7666.4
(h)90.9076.6084.1057.302,634,3307.1
Public dataset-3(a) 58.7052.7053.2025.302,582,5426.3
(b) 61.7055.1055.5026.402,583,2306.3
(c) 68.3050.4051.8026.002,670,5387.0
(d) 61.7055.8053.6026.402,598,0786.4
(e) 58.8058.7055.7025.102,671,4187.0
(f) 65.7050.4050.7025.002,697,0347.0
(g) 60.8054.8051.7025.802,598,7666.4
(h)64.8059.7056.4027.902,634,3307.1
Table 6. Comparative experiments on the self-built dataset.
MethodMetrics
Precision (%)Recall (%)mAP@0.5 (%)mAP5@0.5–0.95 (%)
YOLOv5n80.7072.2074.3044.10
YOLOv6n72.8065.4065.9037.00
YOLOv8n84.3070.6072.8042.80
YOLOv9t87.1071.1075.1045.80
YOLOv10n83.2067.3071.8042.70
YOLOv11n83.7070.1073.6043.40
INN-YOLO90.2074.7080.3055.10
Table 7. Ablation experiments on the self-built dataset.
MethodMetrics
CaseYOLOv11nConv-SAMBiFPNC3k2-RepVGGPrecision
(%)
Recall
(%)
mAP@0.5 (%)mAP@0.5–0.95 (%)
(a) 83.7070.1073.6043.40
(b) 83.5069.9073.8044.70
(c) 83.8073.2076.5044.50
(d) 84.2072.4074.1045.00
(e) 87.2071.4075.4043.00
(f) 83.4068.9070.5042.30
(g) 82.4072.2074.4045.10
(h)90.2074.7080.3055.10
Table 8. Comparative experiments on datasets.
DatasetMetricsDefect TypeYOLOv5nYOLOv6nYOLOv8nYOLOv9tYOLOv10nYOLOv11nINN-YOLO
Public dataset-1Precision
(%)
crack56.8046.6059.4061.1047.0058.1067.30
dent59.6056.1072.1068.9064.2070.9066.70
Recall
(%)
crack40.7029.3040.0032.0036.0038.0046.30
dent25.9020.1025.0017.6023.1022.6035.60
mAP@0.5
(%)
crack40.2026.6039.8032.1035.1037.9048.90
dent25.9019.9025.6017.7024.5025.2035.80
mAP@0.5–0.95
(%)
crack17.3011.5017.8013.3015.3017.8022.80
dent13.209.1613.409.0412.6011.9020.20
Public dataset-2Precision
(%)
crack86.1084.3089.2082.3079.4085.7089.60
dent88.6085.4086.8083.5084.4088.5092.10
Recall
(%)
crack65.9051.2065.7063.9069.3071.9074.00
dent72.1057.9072.4067.5071.0076.2079.20
mAP@0.5
(%)
crack76.3062.5078.2070.8077.1080.1083.00
dent79.9068.2081.1076.4078.2083.1085.10
mAP@0.5–0.95
(%)
crack49.0041.5051.5046.0049.6051.8054.50
dent54.6045.2057.5050.6054.8058.2060.10
Public dataset-3Precision
(%)
crack61.0065.5061.3064.0058.7062.3064.30
dent59.2065.5060.1064.6057.8055.0065.30
Recall
(%)
crack58.1054.8067.7054.8056.5050.0061.00
dent47.7043.1050.9049.2041.5055.4058.50
mAP@0.5
(%)
crack56.5056.4054.9051.2051.5052.5057.70
dent50.1039.6049.8050.8042.4053.9055.10
mAP@0.5–0.95
(%)
crack27.5024.8024.7025.0025.2023.6026.20
dent27.2019.1025.4024.7022.2027.1029.60
Self-built datasetPrecision
(%)
crack84.6077.6083.8087.5087.7088.7089.90
dent76.9068.0084.7086.9078.6078.8090.60
Recall
(%)
crack70.7068.3072.3073.3068.3069.7071.40
dent73.8062.6068.9068.9066.3070.5077.90
mAP@0.5
(%)
crack78.9072.4074.7077.2078.3079.5081.70
dent69.7059.3070.9072.9065.3067.6078.90
mAP@0.5–0.95 (%)crack52.1046.3050.3054.0051.3052.9060.60
dent36.1027.8035.3037.7034.1034.0049.70
Disclaimer/Publisher’s Note: The statements, opinions and data contained in all publications are solely those of the individual author(s) and contributor(s) and not of MDPI and/or the editor(s). MDPI and/or the editor(s) disclaim responsibility for any injury to people or property resulting from any ideas, methods, instructions or products referred to in the content.