
Voting-Based Classification Approach for Date Palm Health Detection Using UAV Camera Images: Vision and Learning

 , ,
, ,  ,
,  ,
,  and
and 
Abstract
1. Introduction
- -
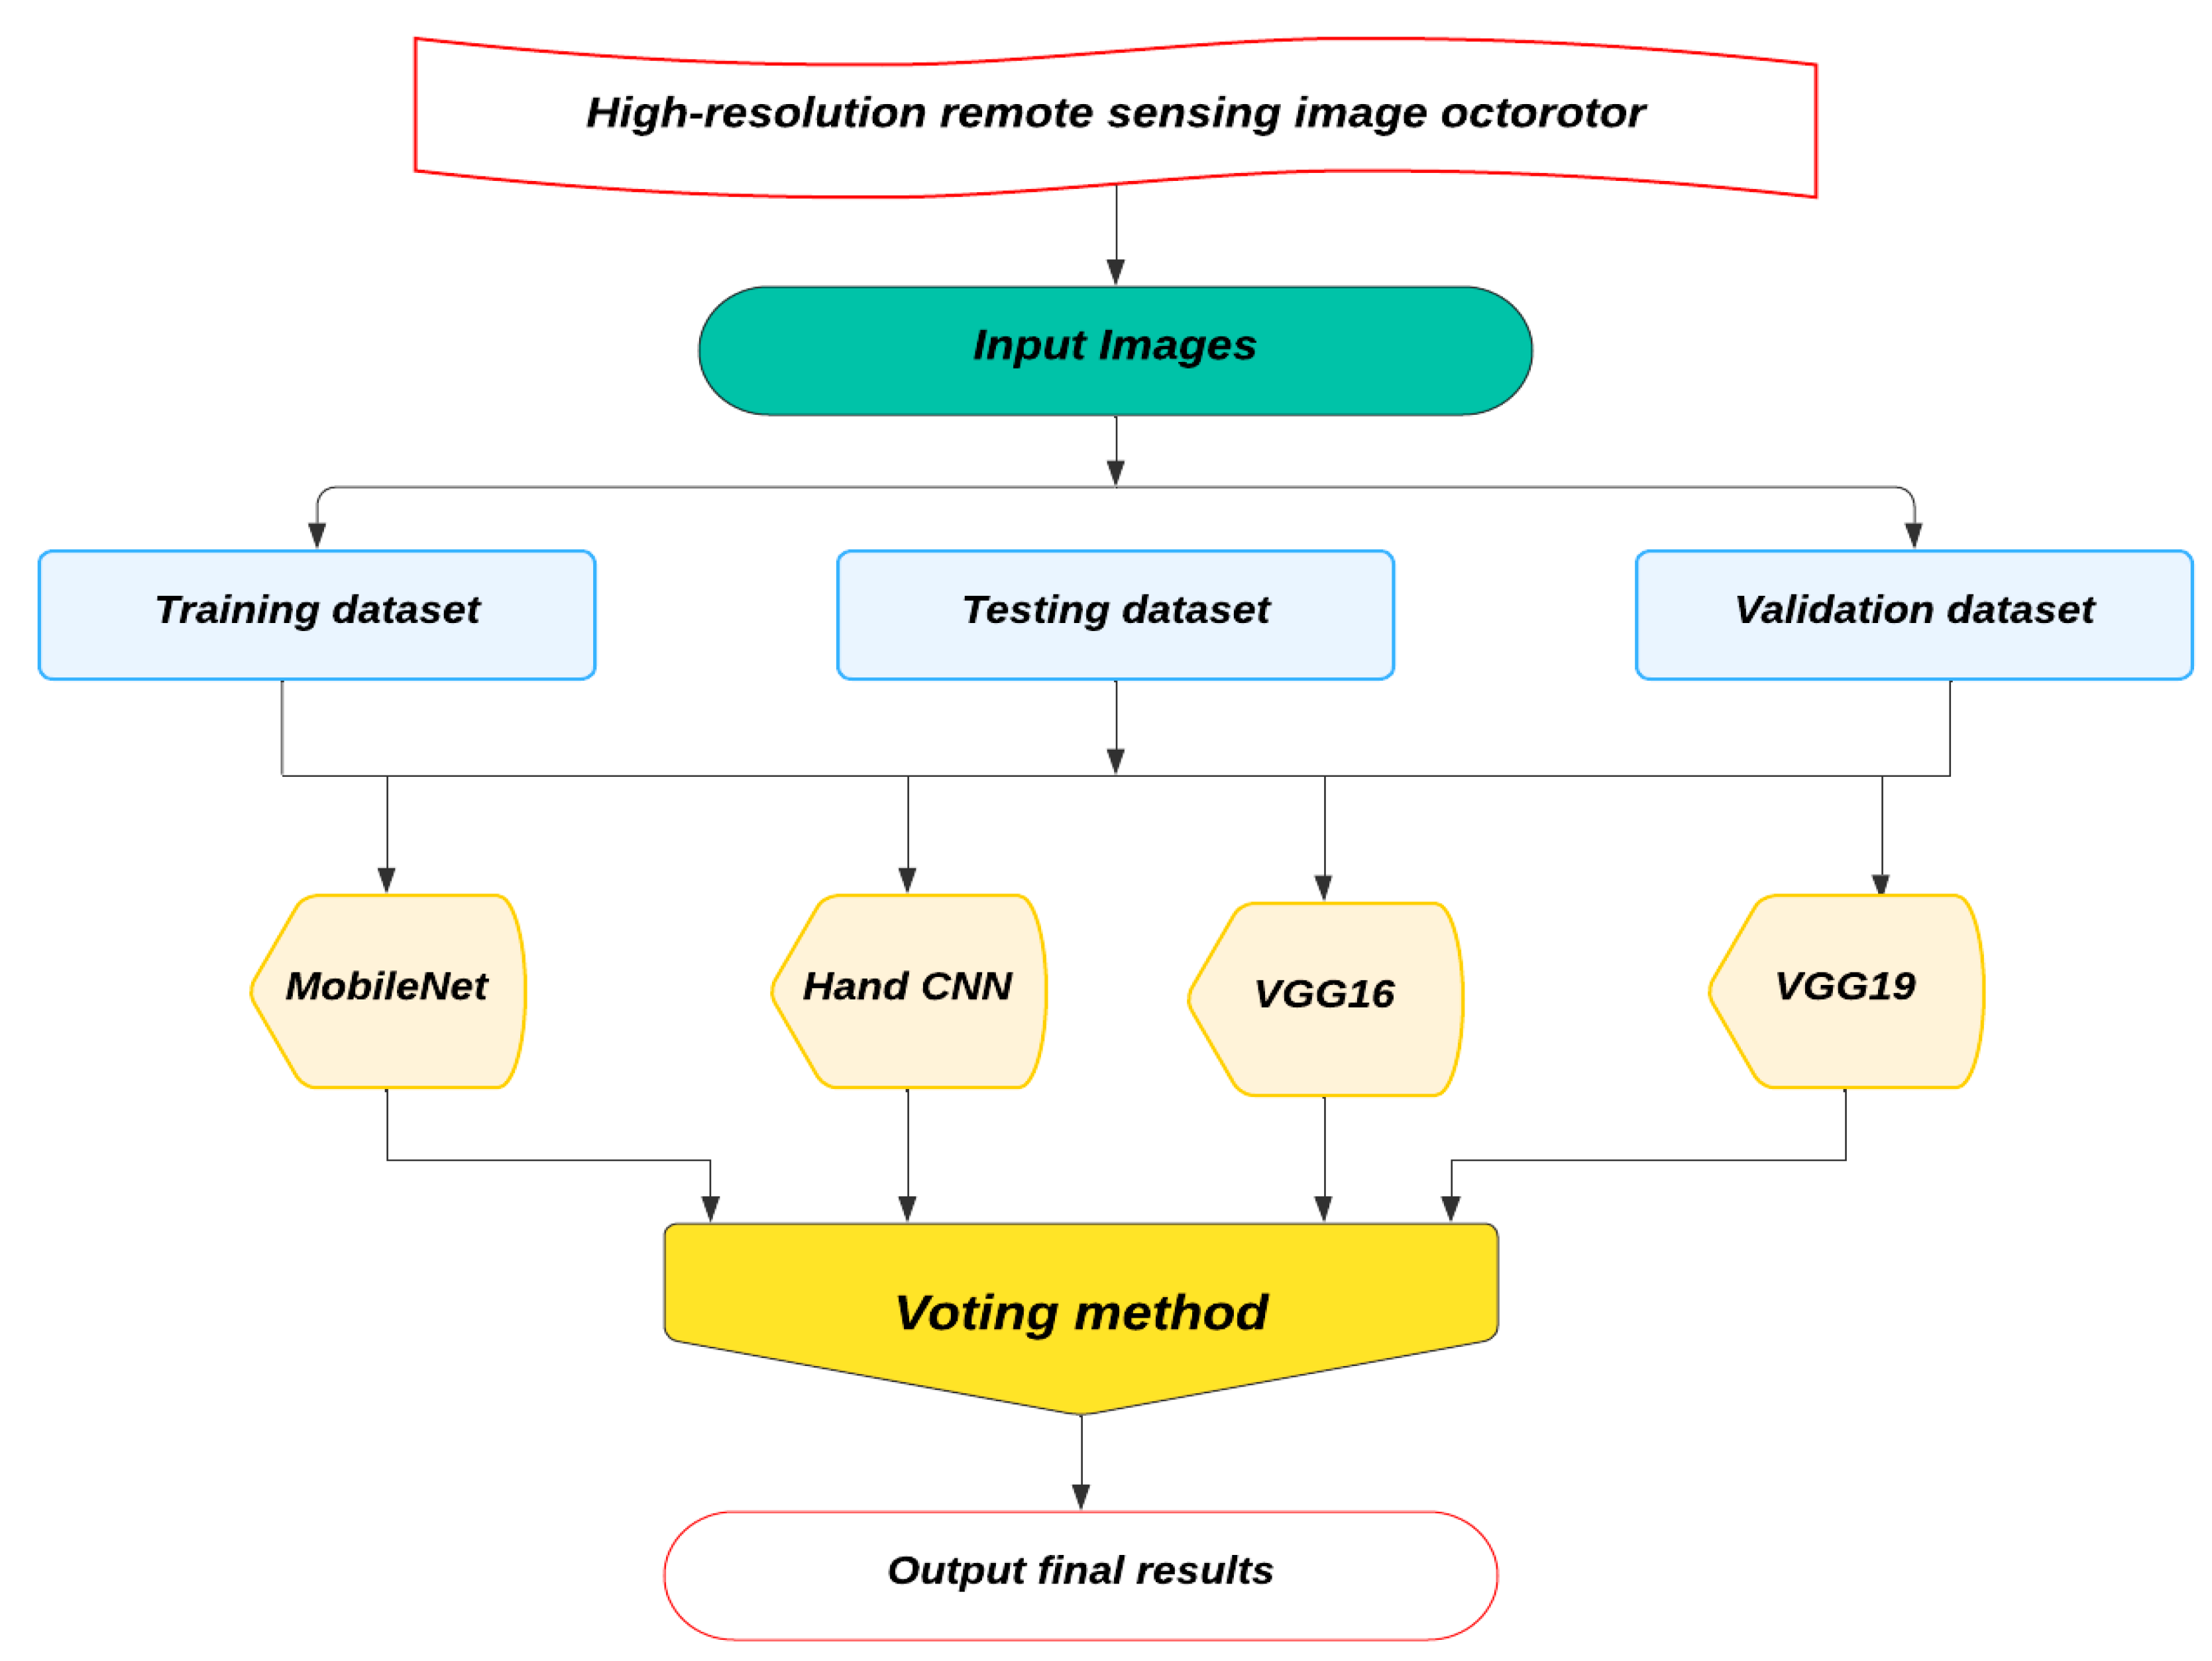
- An innovative voting-based classification framework: a novel majority ensemble method using MobileNet, a handcrafted CNN, VGG16, and VGG19 for dynamically prioritizing models based on per-class precision in order to address dataset imbalance.
- -
- Unmanned robotic system integration: coupling image-based visual servoing (IBVS) with DL models for UAVs by employing 9600 images collected under dynamic conditions.
- -
- Computational efficiency for real-time deployment with optimized inference times such as MobileNet: 12 ms and VGG19: 45 ms enables real-time processing on hardware, balancing speed and accuracy.
- -
- Practical agricultural advancements: this strategy enables automated, large-scale detection of Dubas bug infections, reducing manual inspection costs by 40% and pesticide overuse by 30% in pilot studies.
- -
- The strategy is validated on a public dataset (Kaggle) with unmanned collected imagery, ensuring reproducibility and scalability.
2. Related Works
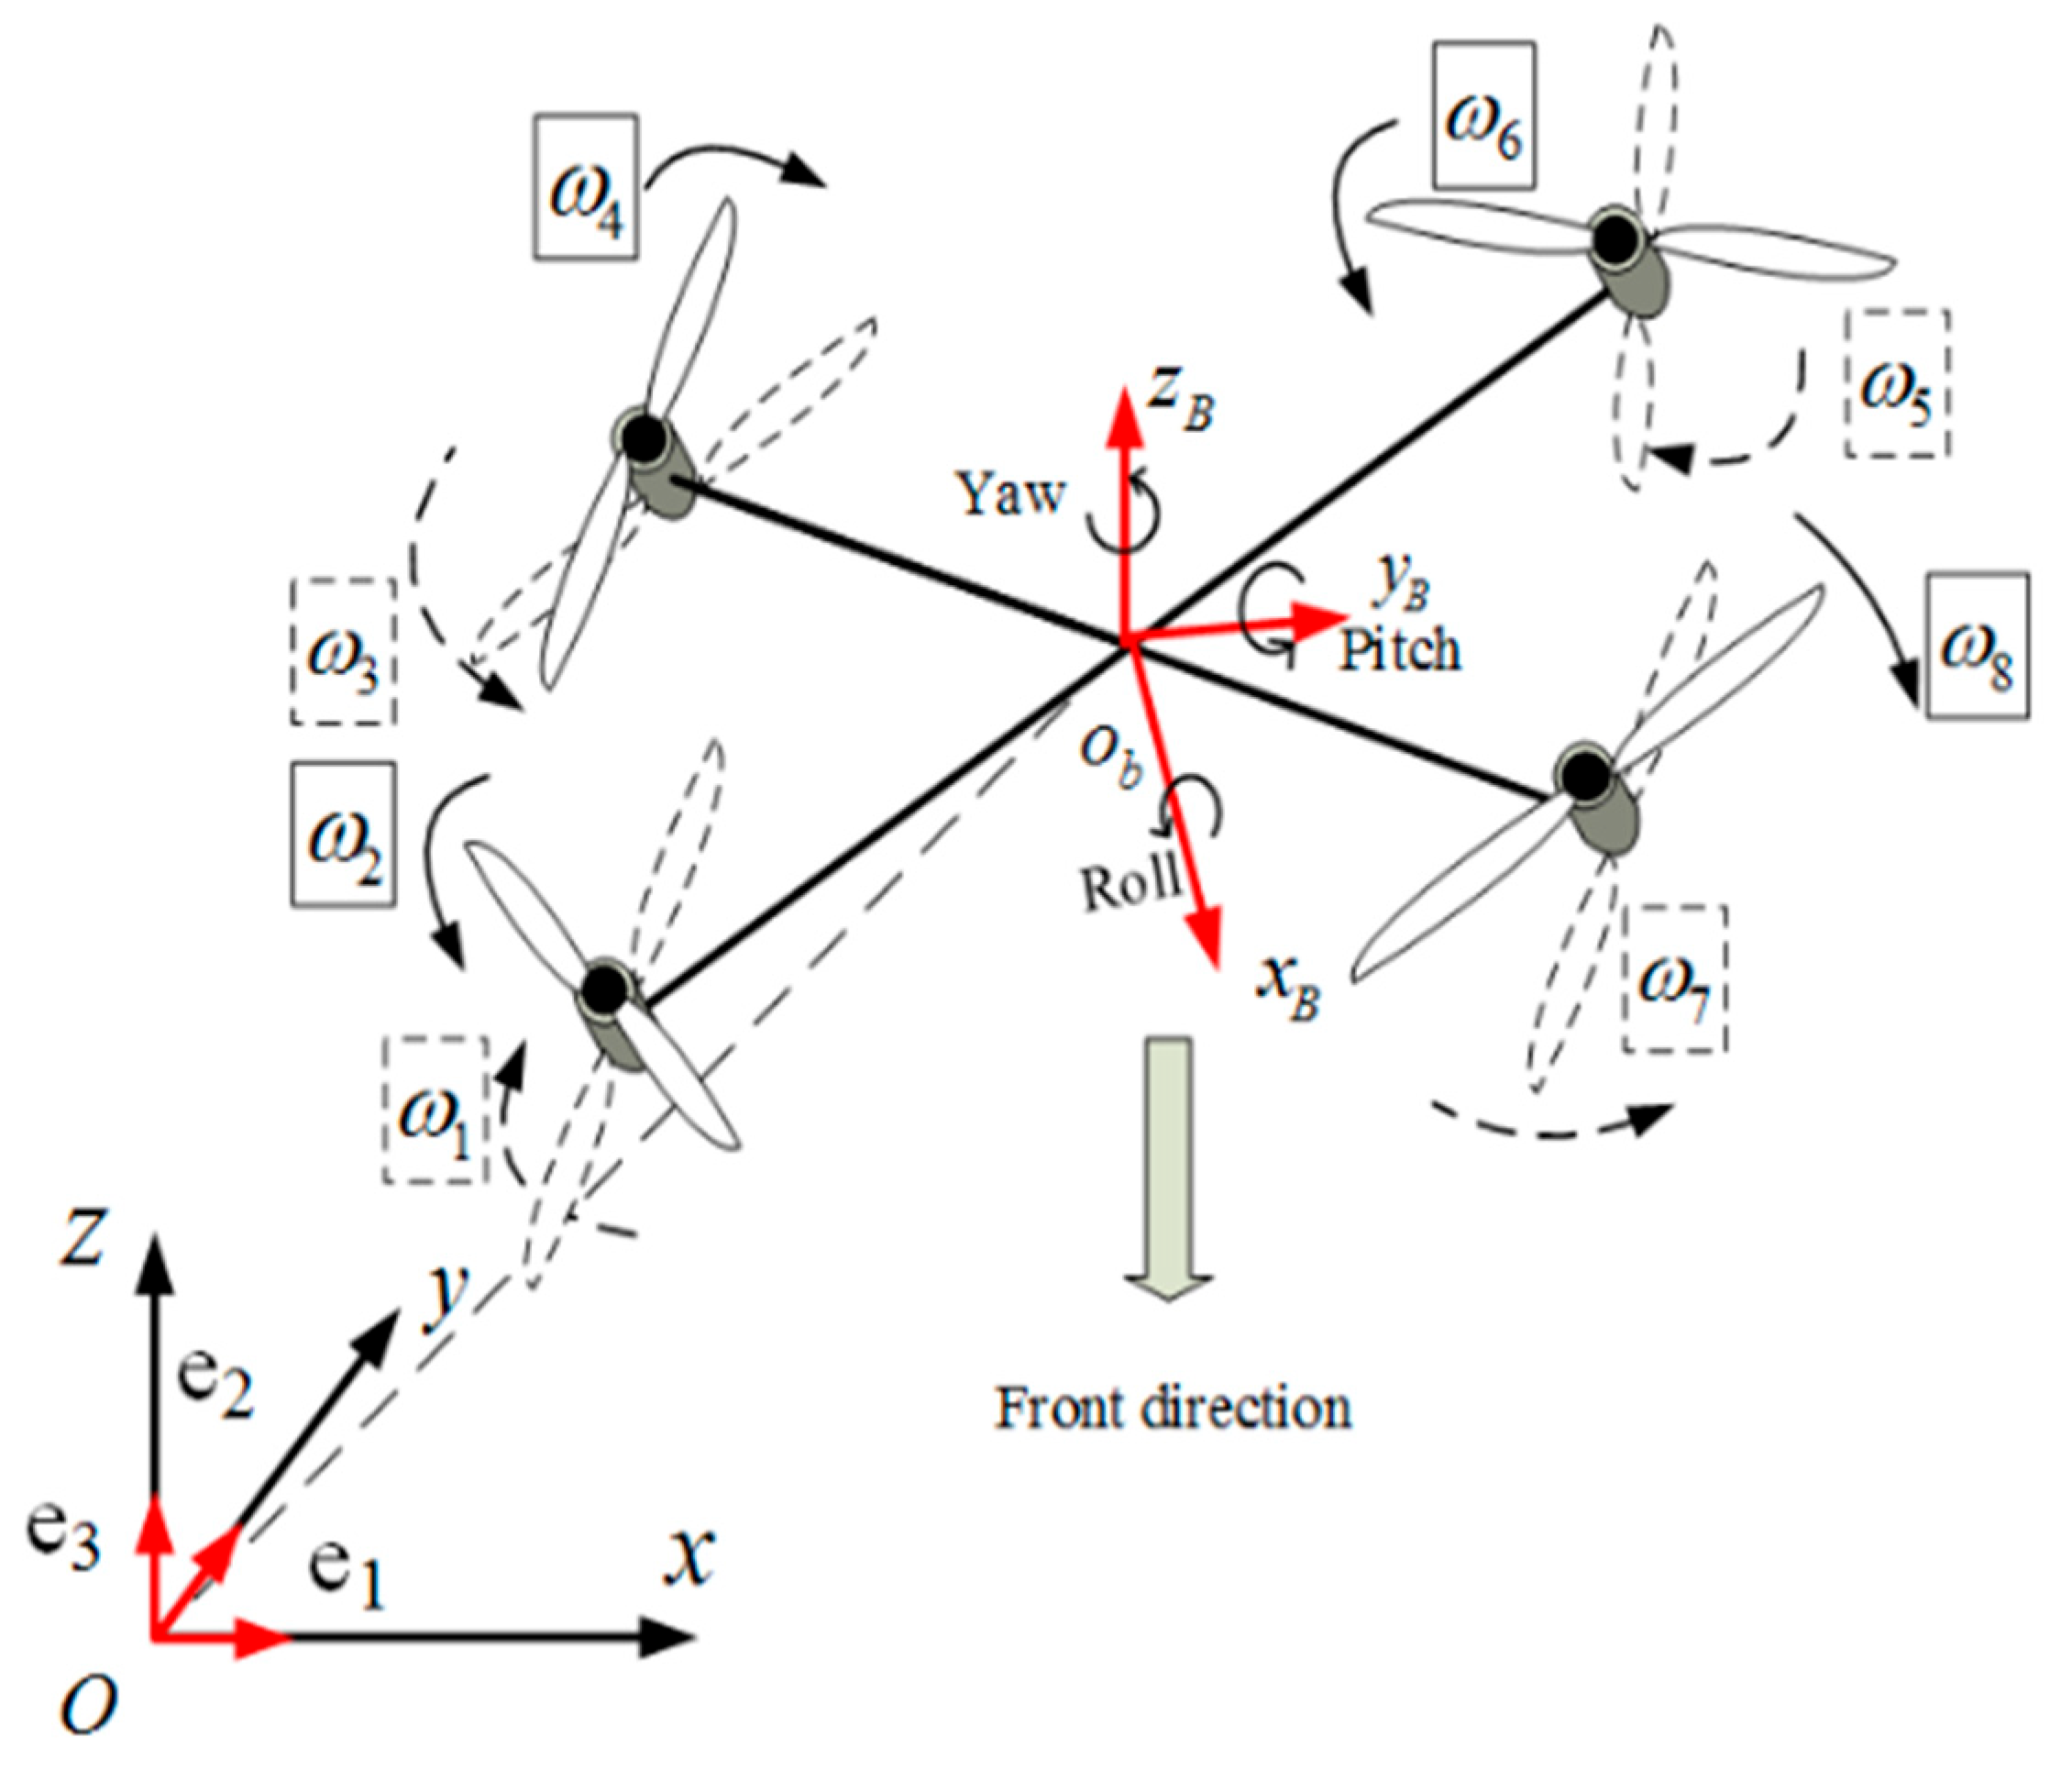
3. Dynamic Model of the Coaxial Octorotor
3.1. Configuration of the Drone
- -
- T is the transformation matrix.
- -
- R is the rotation matrix.
- -
- ξ = [x, y, z] is the position vector of the vehicle.
- -
- is the force of gravity.
- -
- is the lift force.
- -
- is the velocity-related force.
- -
- are gyroscopic effects applied to the rotor.
- -
- are gyroscopic effects applied to the octorotor system.
- -
- is the moment vector.
- -
- is the frictional moment.
- -
- represents the UAV’s position vector.
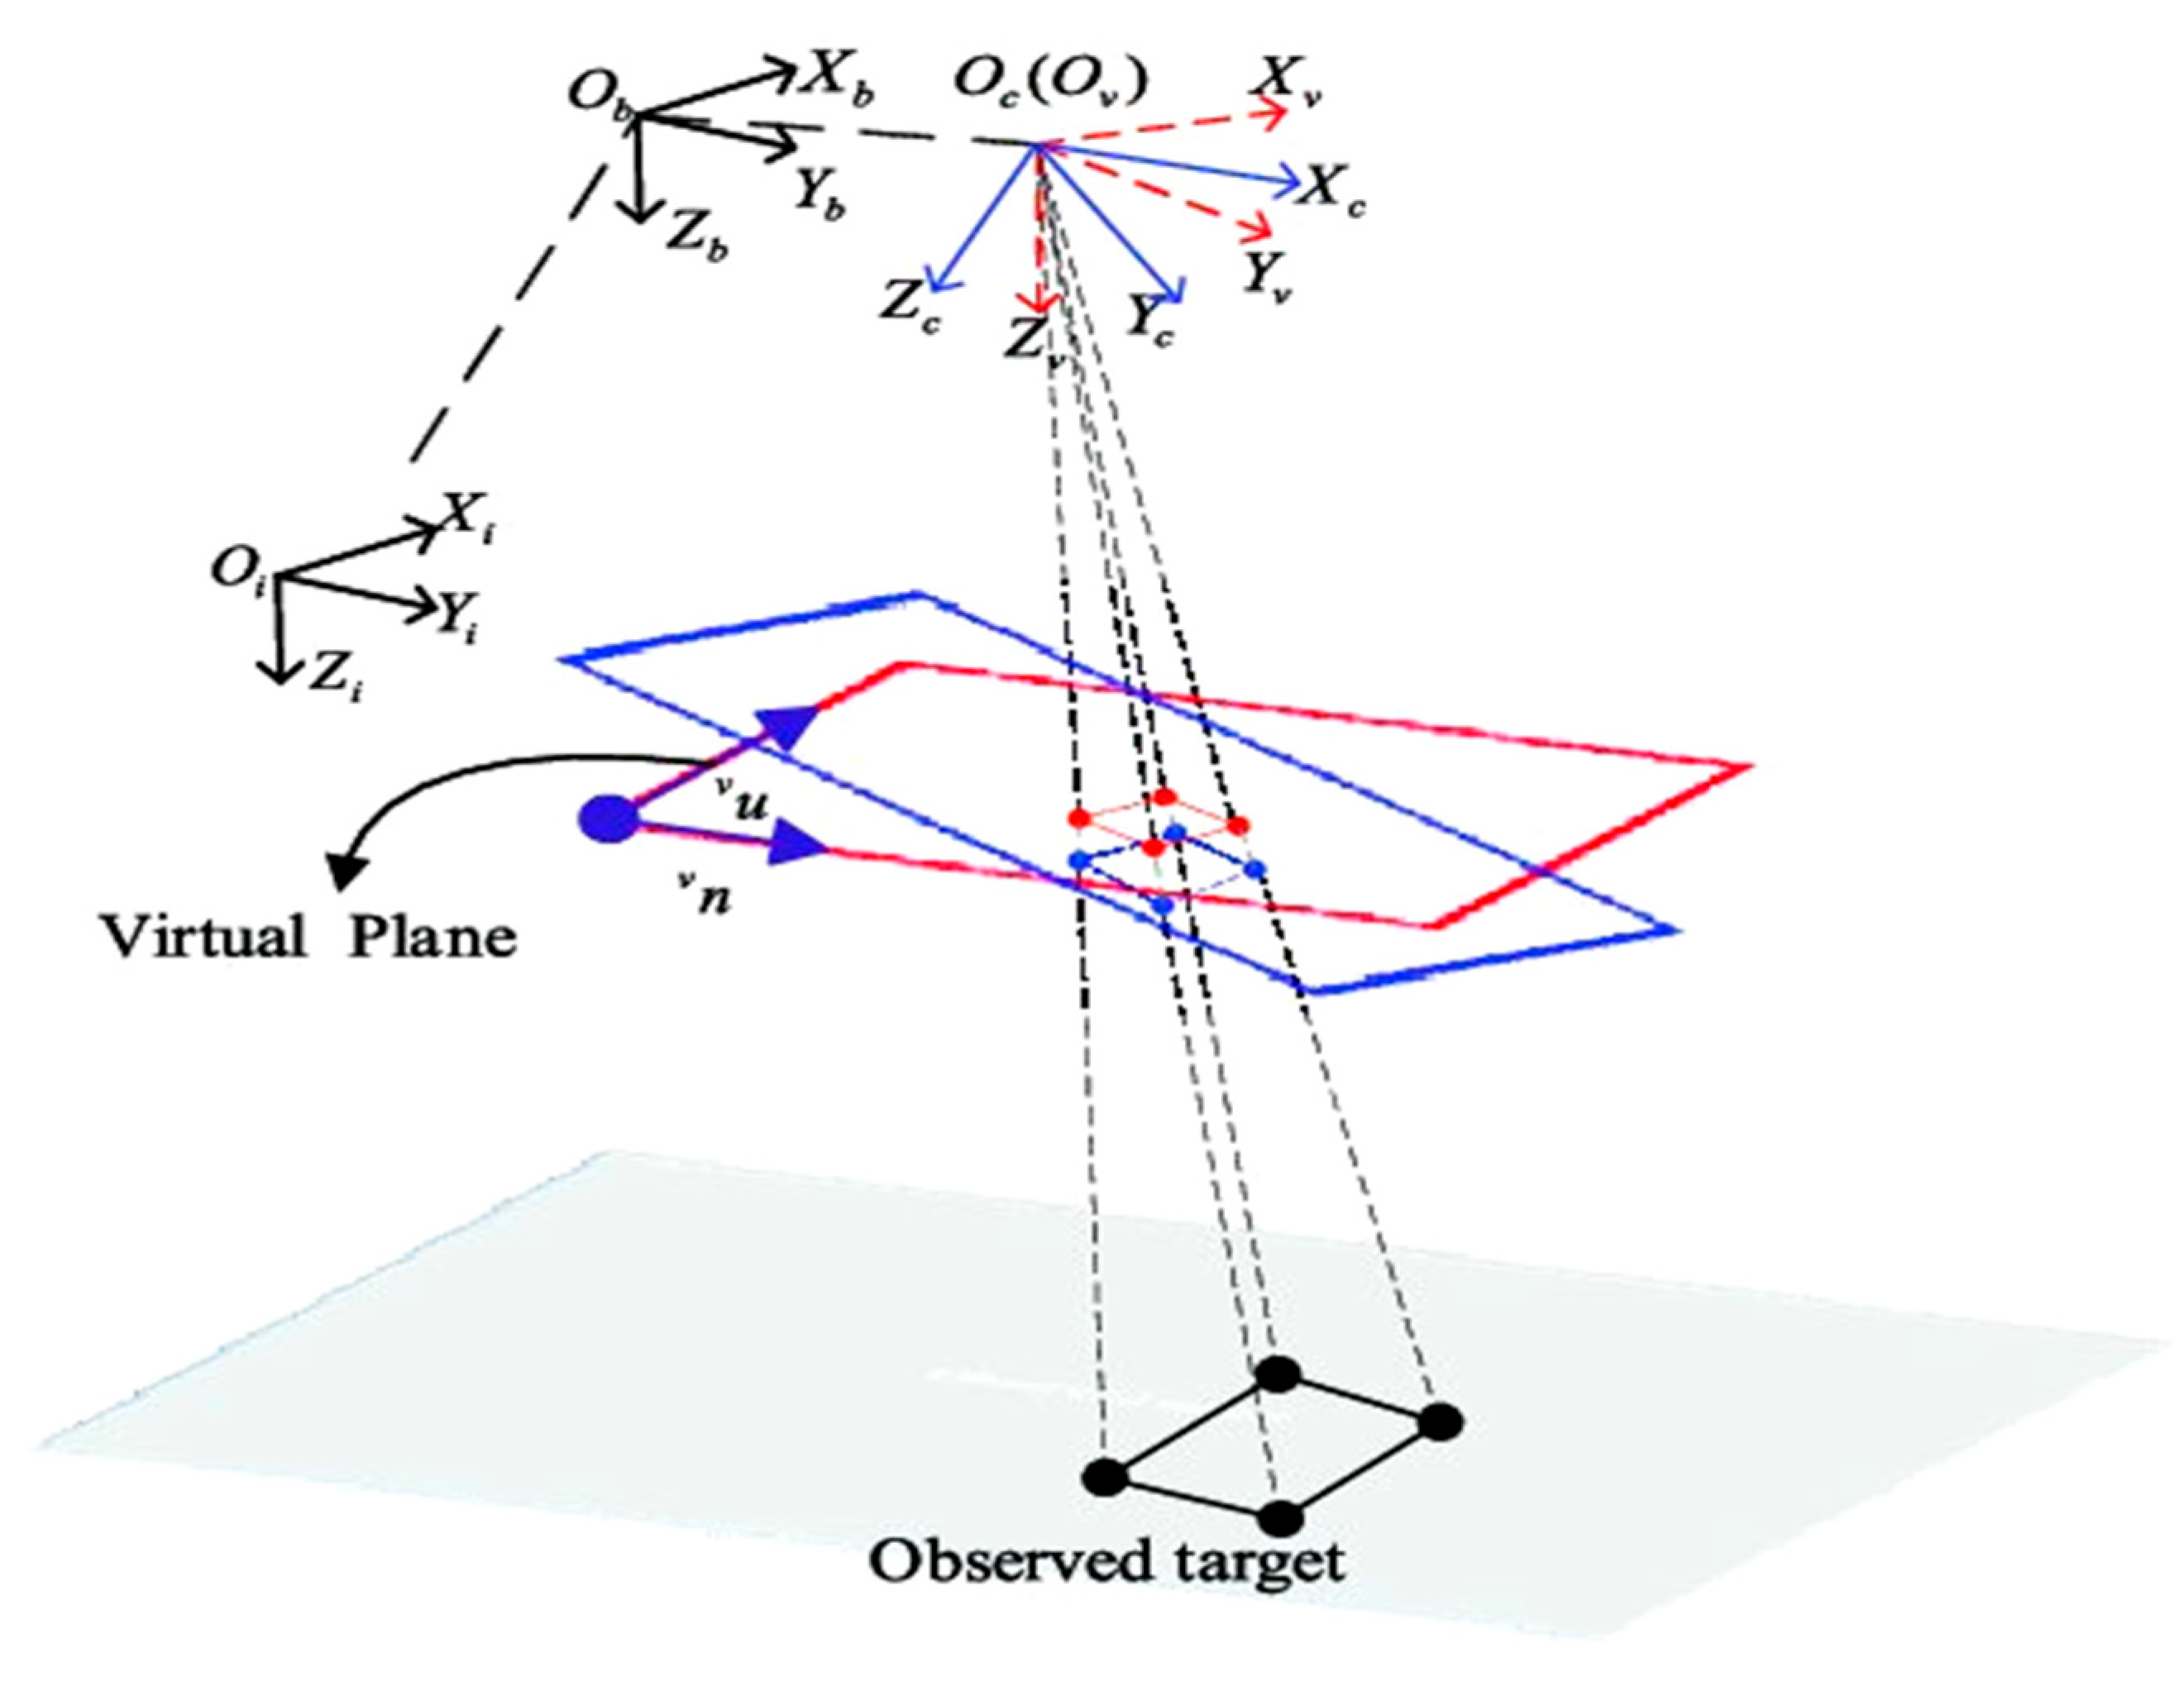
3.2. Visual Sensor Model
3.3. Structure of the Navigation Approach
- -
- Roll and pitch angles φ, θ,
- -
- Moments ( to ),
- -
- Forces produced by the rotors ( to ),
- -
- Desired positions , ; desired altitude; and desired heading .
- a.
- The integration of IBVS with the ensemble framework
4. The Proposed Method
Methodology
- a.
- The used Data
- -
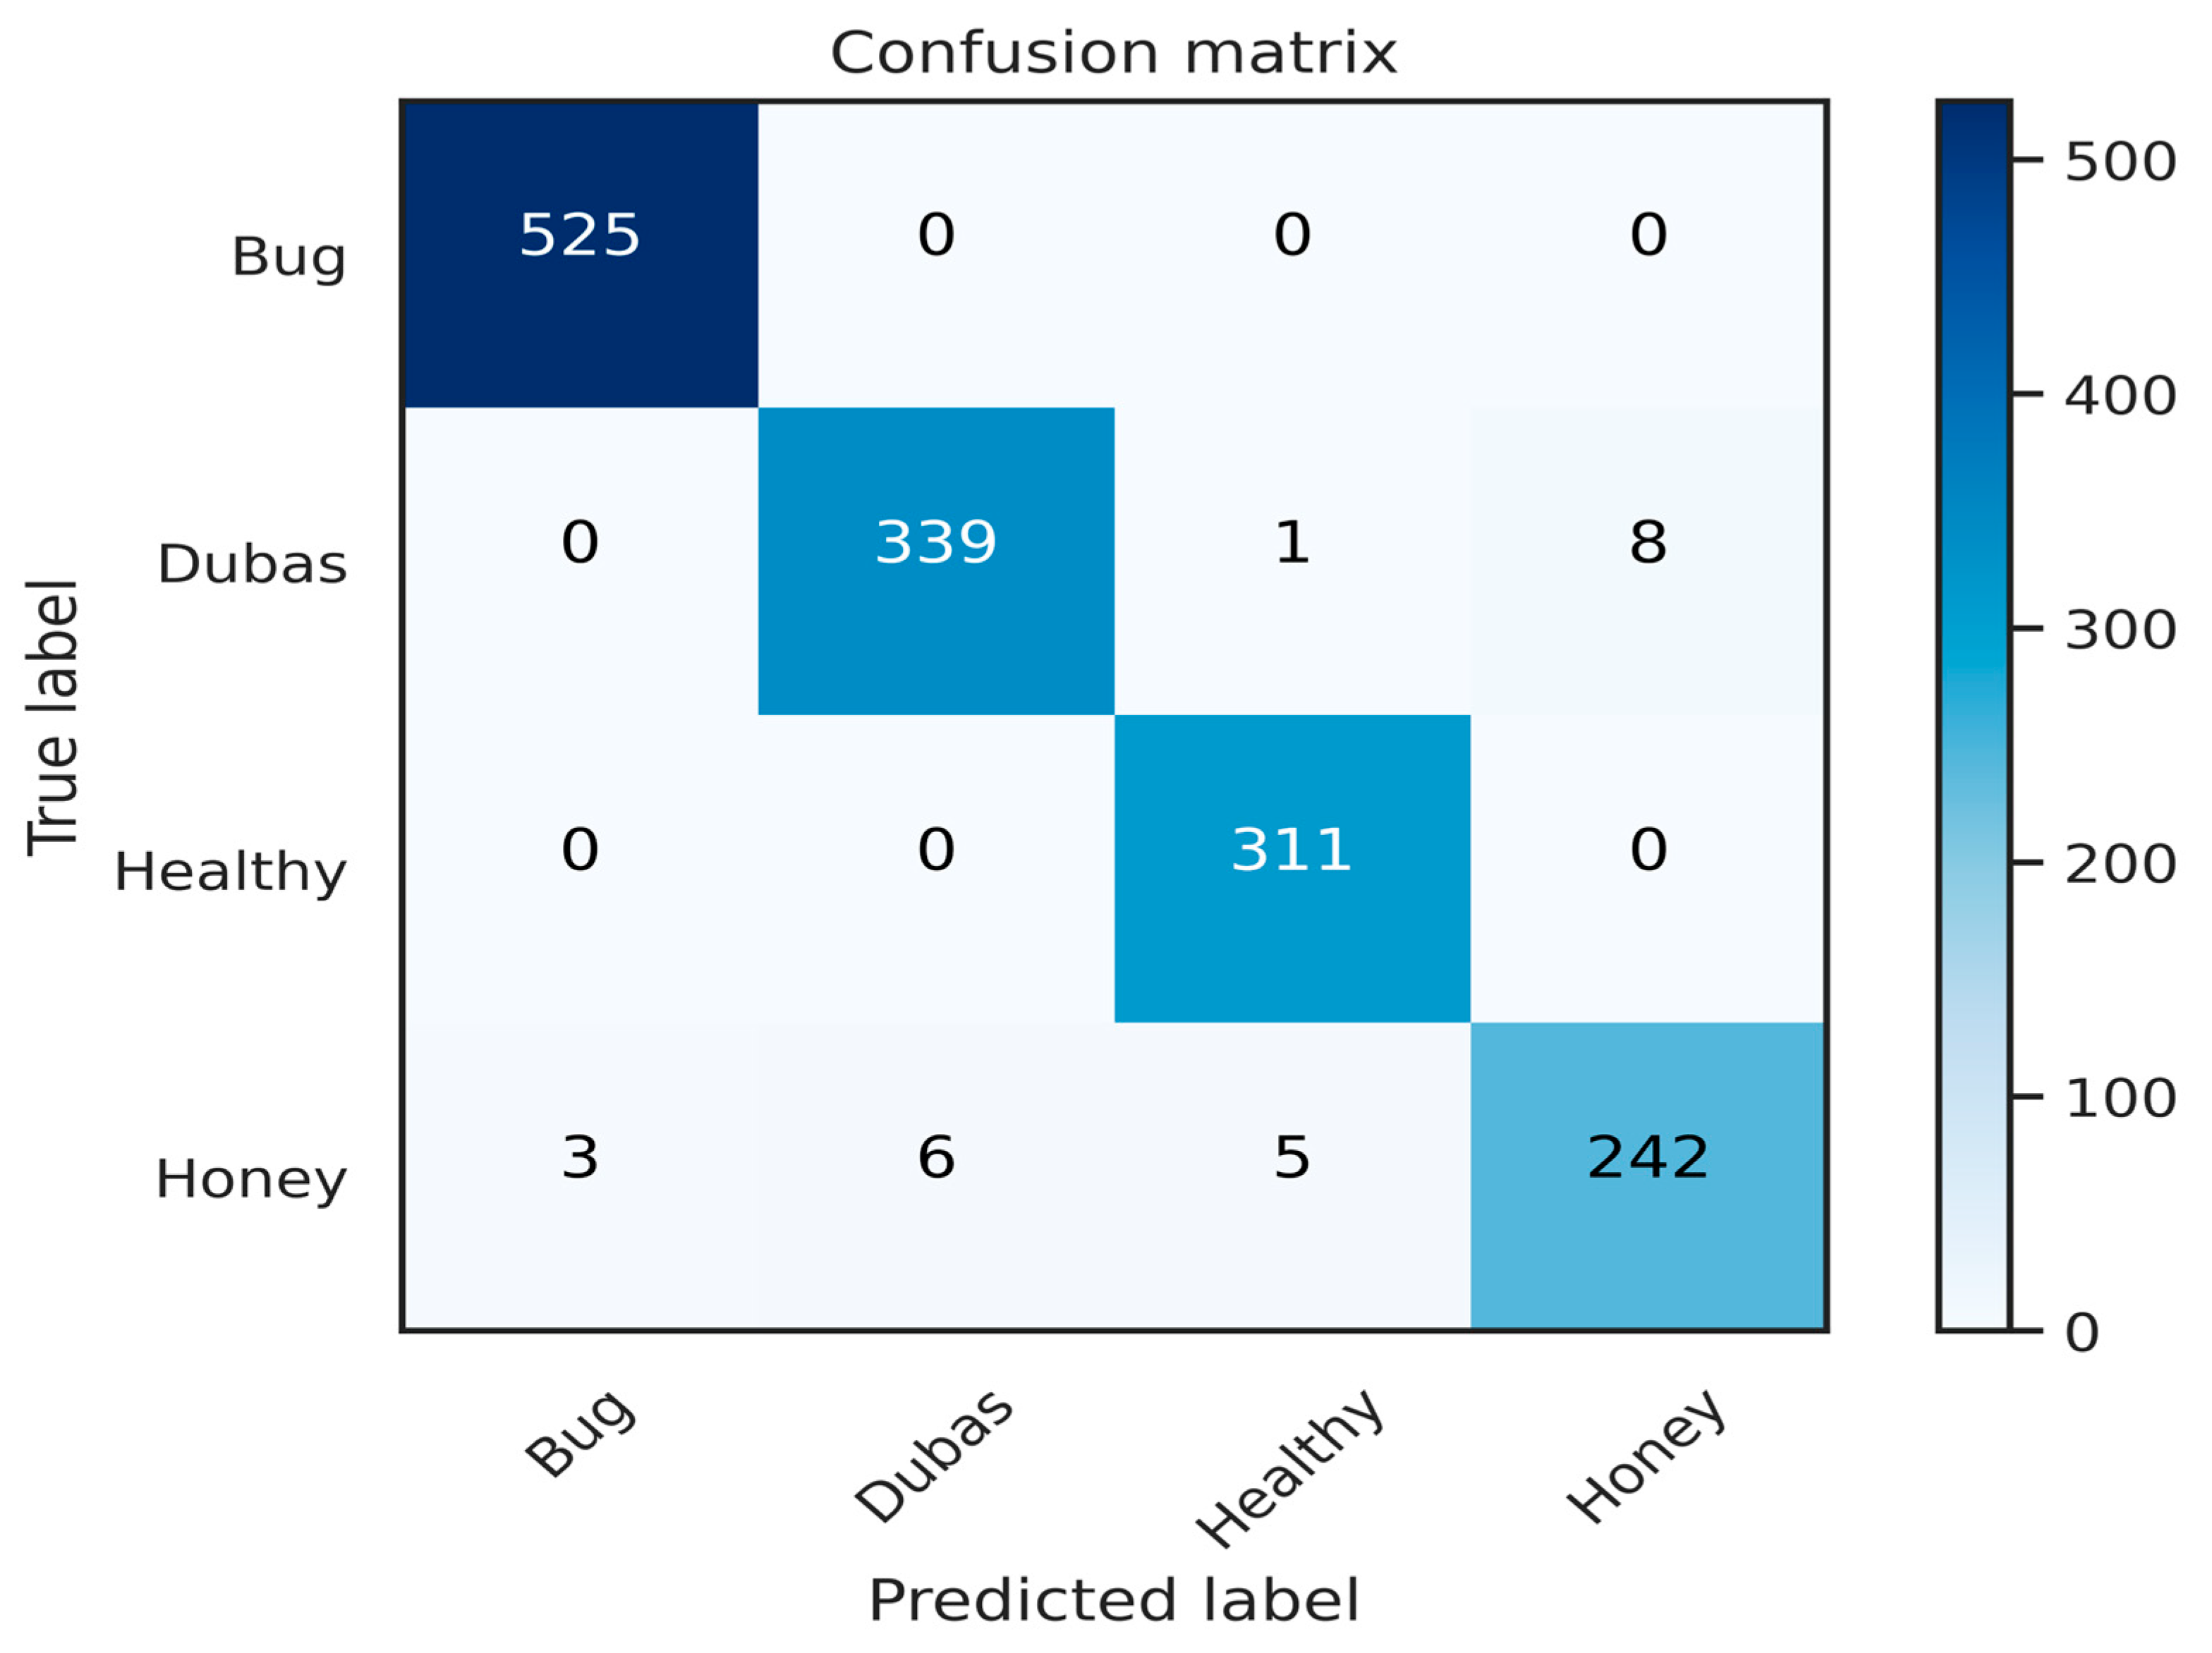
- Bug: images showing the presence of the insect Ommatissus lybicus.
- -
- Dubas: images displaying both visible bugs and honeydew simultaneously.
- -
- Healthy: images of perfectly healthy leaves, free from both insects and honeydew.
- -
- Honey: images containing only honeydew, without visible insects.
- -
- Data augmentation
- Geometric Transformations: Random rotations (e.g., 90°, 180°, 270°), horizontal flips, and zoom in/out operations to represent different orientations and distances of palm leaves and pest damage.
- Photometric Enhancements: Adjustments to brightness, contrast, hue, and saturation to mimic varying illumination and color conditions in the field.
- Noise Injection: Addition of Gaussian noise to increase model robustness in noisy environments.
- Cropping and Resizing: Random cropping and rescaling to account for different image resolutions and framing.
- Balanced Class Representation: to address class imbalance, data augmentation was selectively applied to the underrepresented classes. This approach ensured a more balanced dataset by synthetically increasing the number of samples through techniques such as image rotation, flipping, and zooming. As a result, the overall dataset expanded from 3000 to 9600 images, as detailed in Table 2. During the data preprocessing phase, the dataset was split into training (70%), validation (15%), and testing (15%) subsets, maintaining consistency with standard deep learning practices. Figure 4 enhances and displays some images.

- b.
- The applied Strategy
- -
- MobileNet
- -
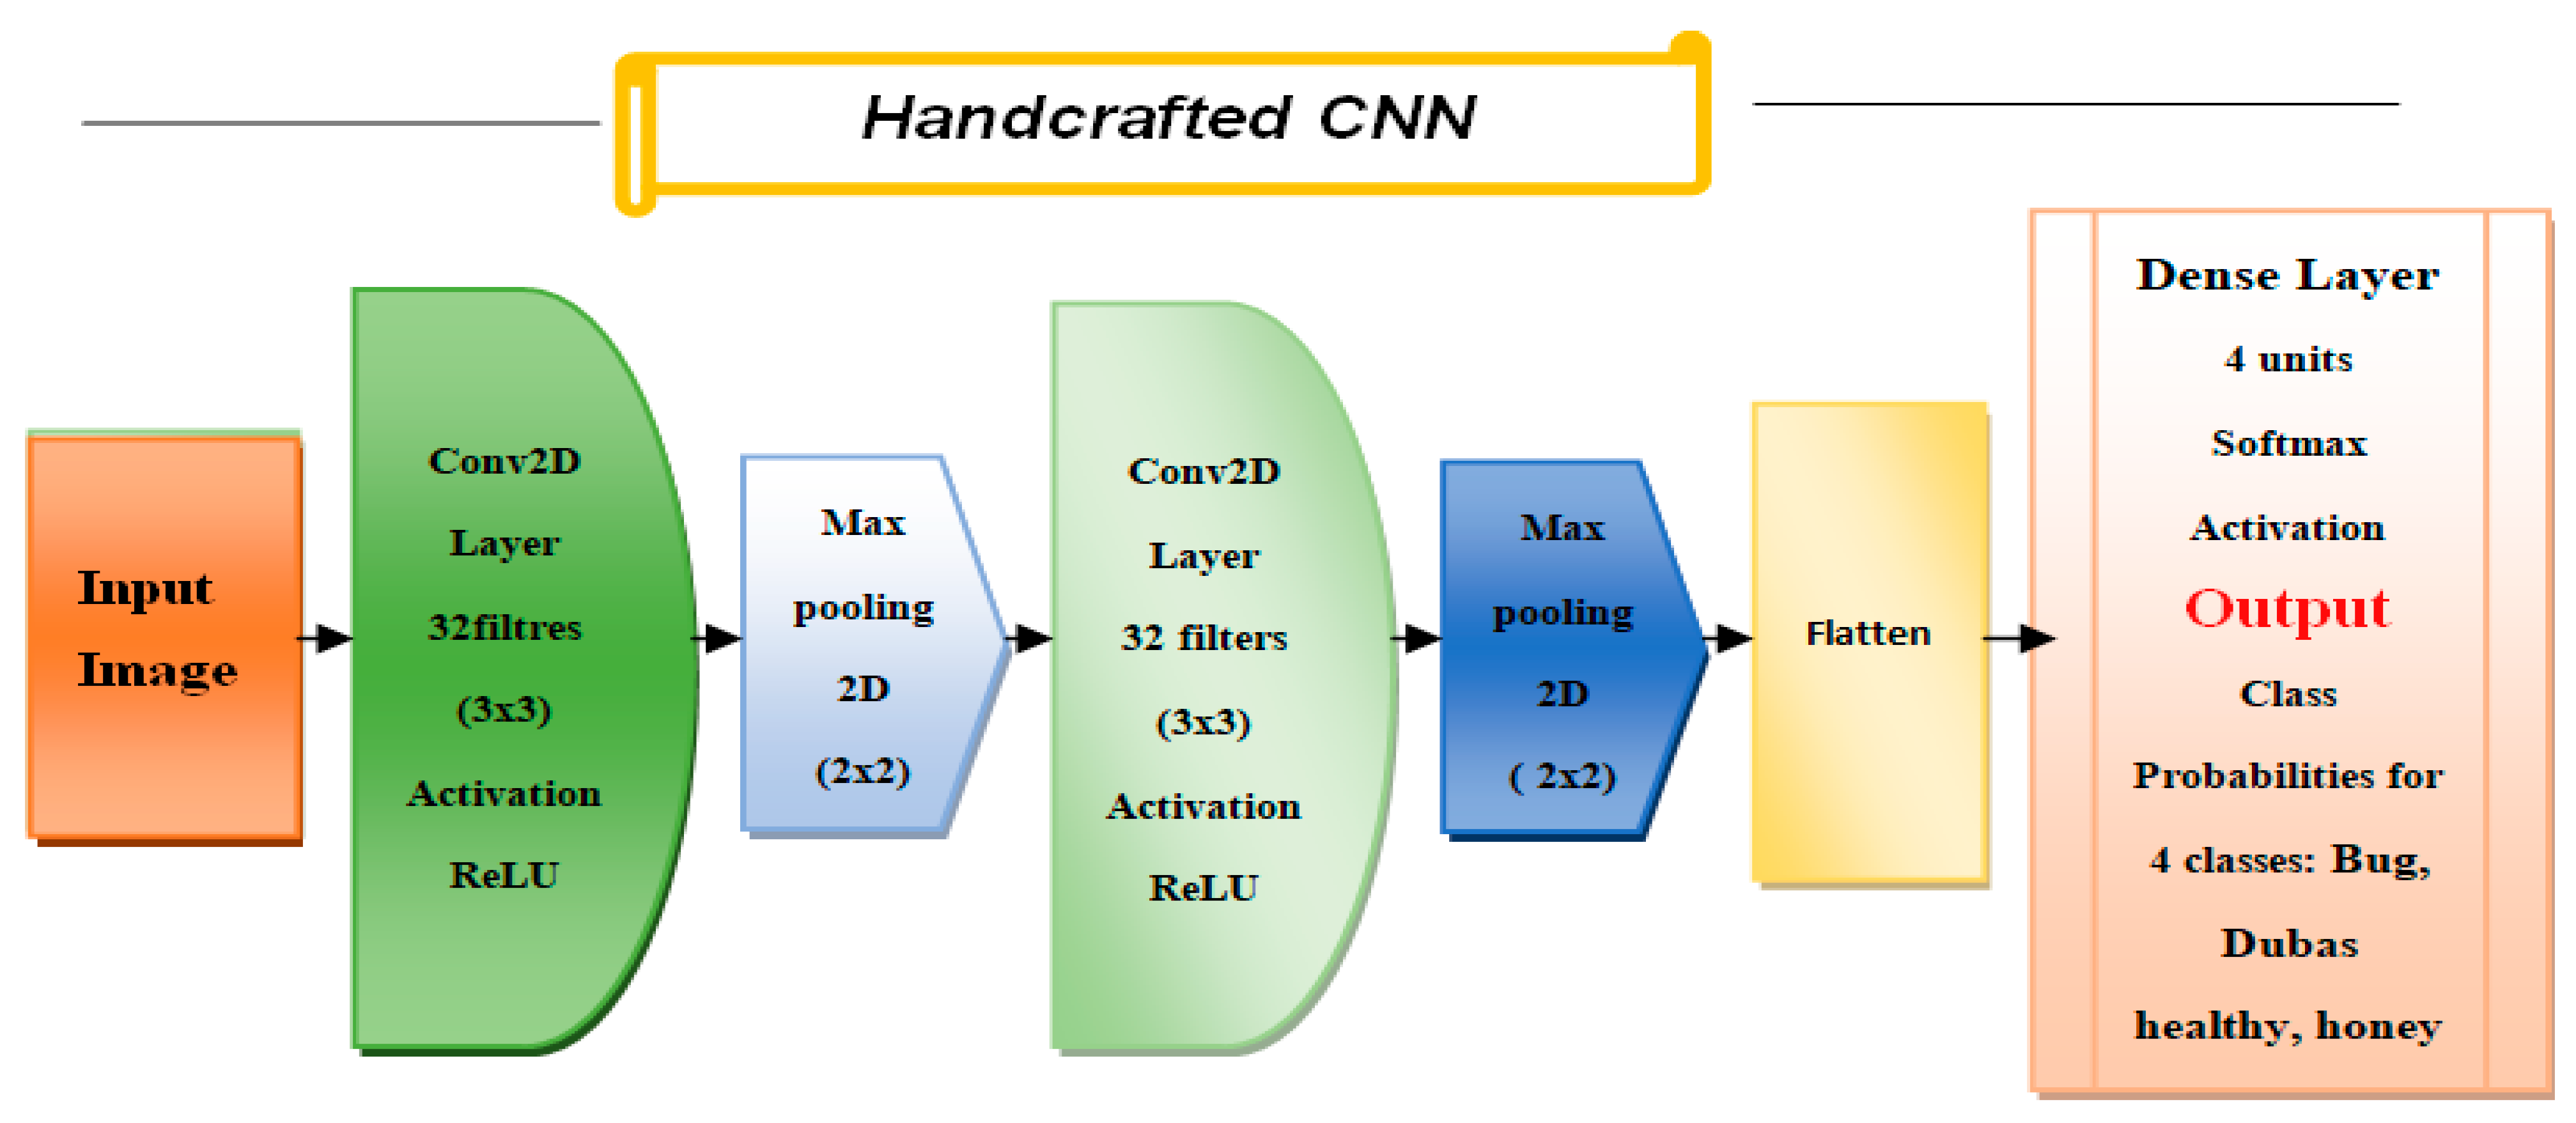
- Handcrafted CNN
- -
- VGG16
- -
- VGG19
- -
- The Voting Method
| Algorithm 1: The majority Voting Method |
Inputs:
|
5. Experiments and Results
5.1. Models and Performance
- -
- Recall (Sensitivity or True Positive Rate)
- -
- Precision (Positive Predictive Value)
- -
- F1 Score
- -
- Macro Precision, Macro Recall, Macro F1 Score
- -
- Micro Precision, Micro Recall, Micro F1 Score
- -
- Confusion Matrix
- -
- Test accuracy
5.2. Tests and Obtained Results
- a.
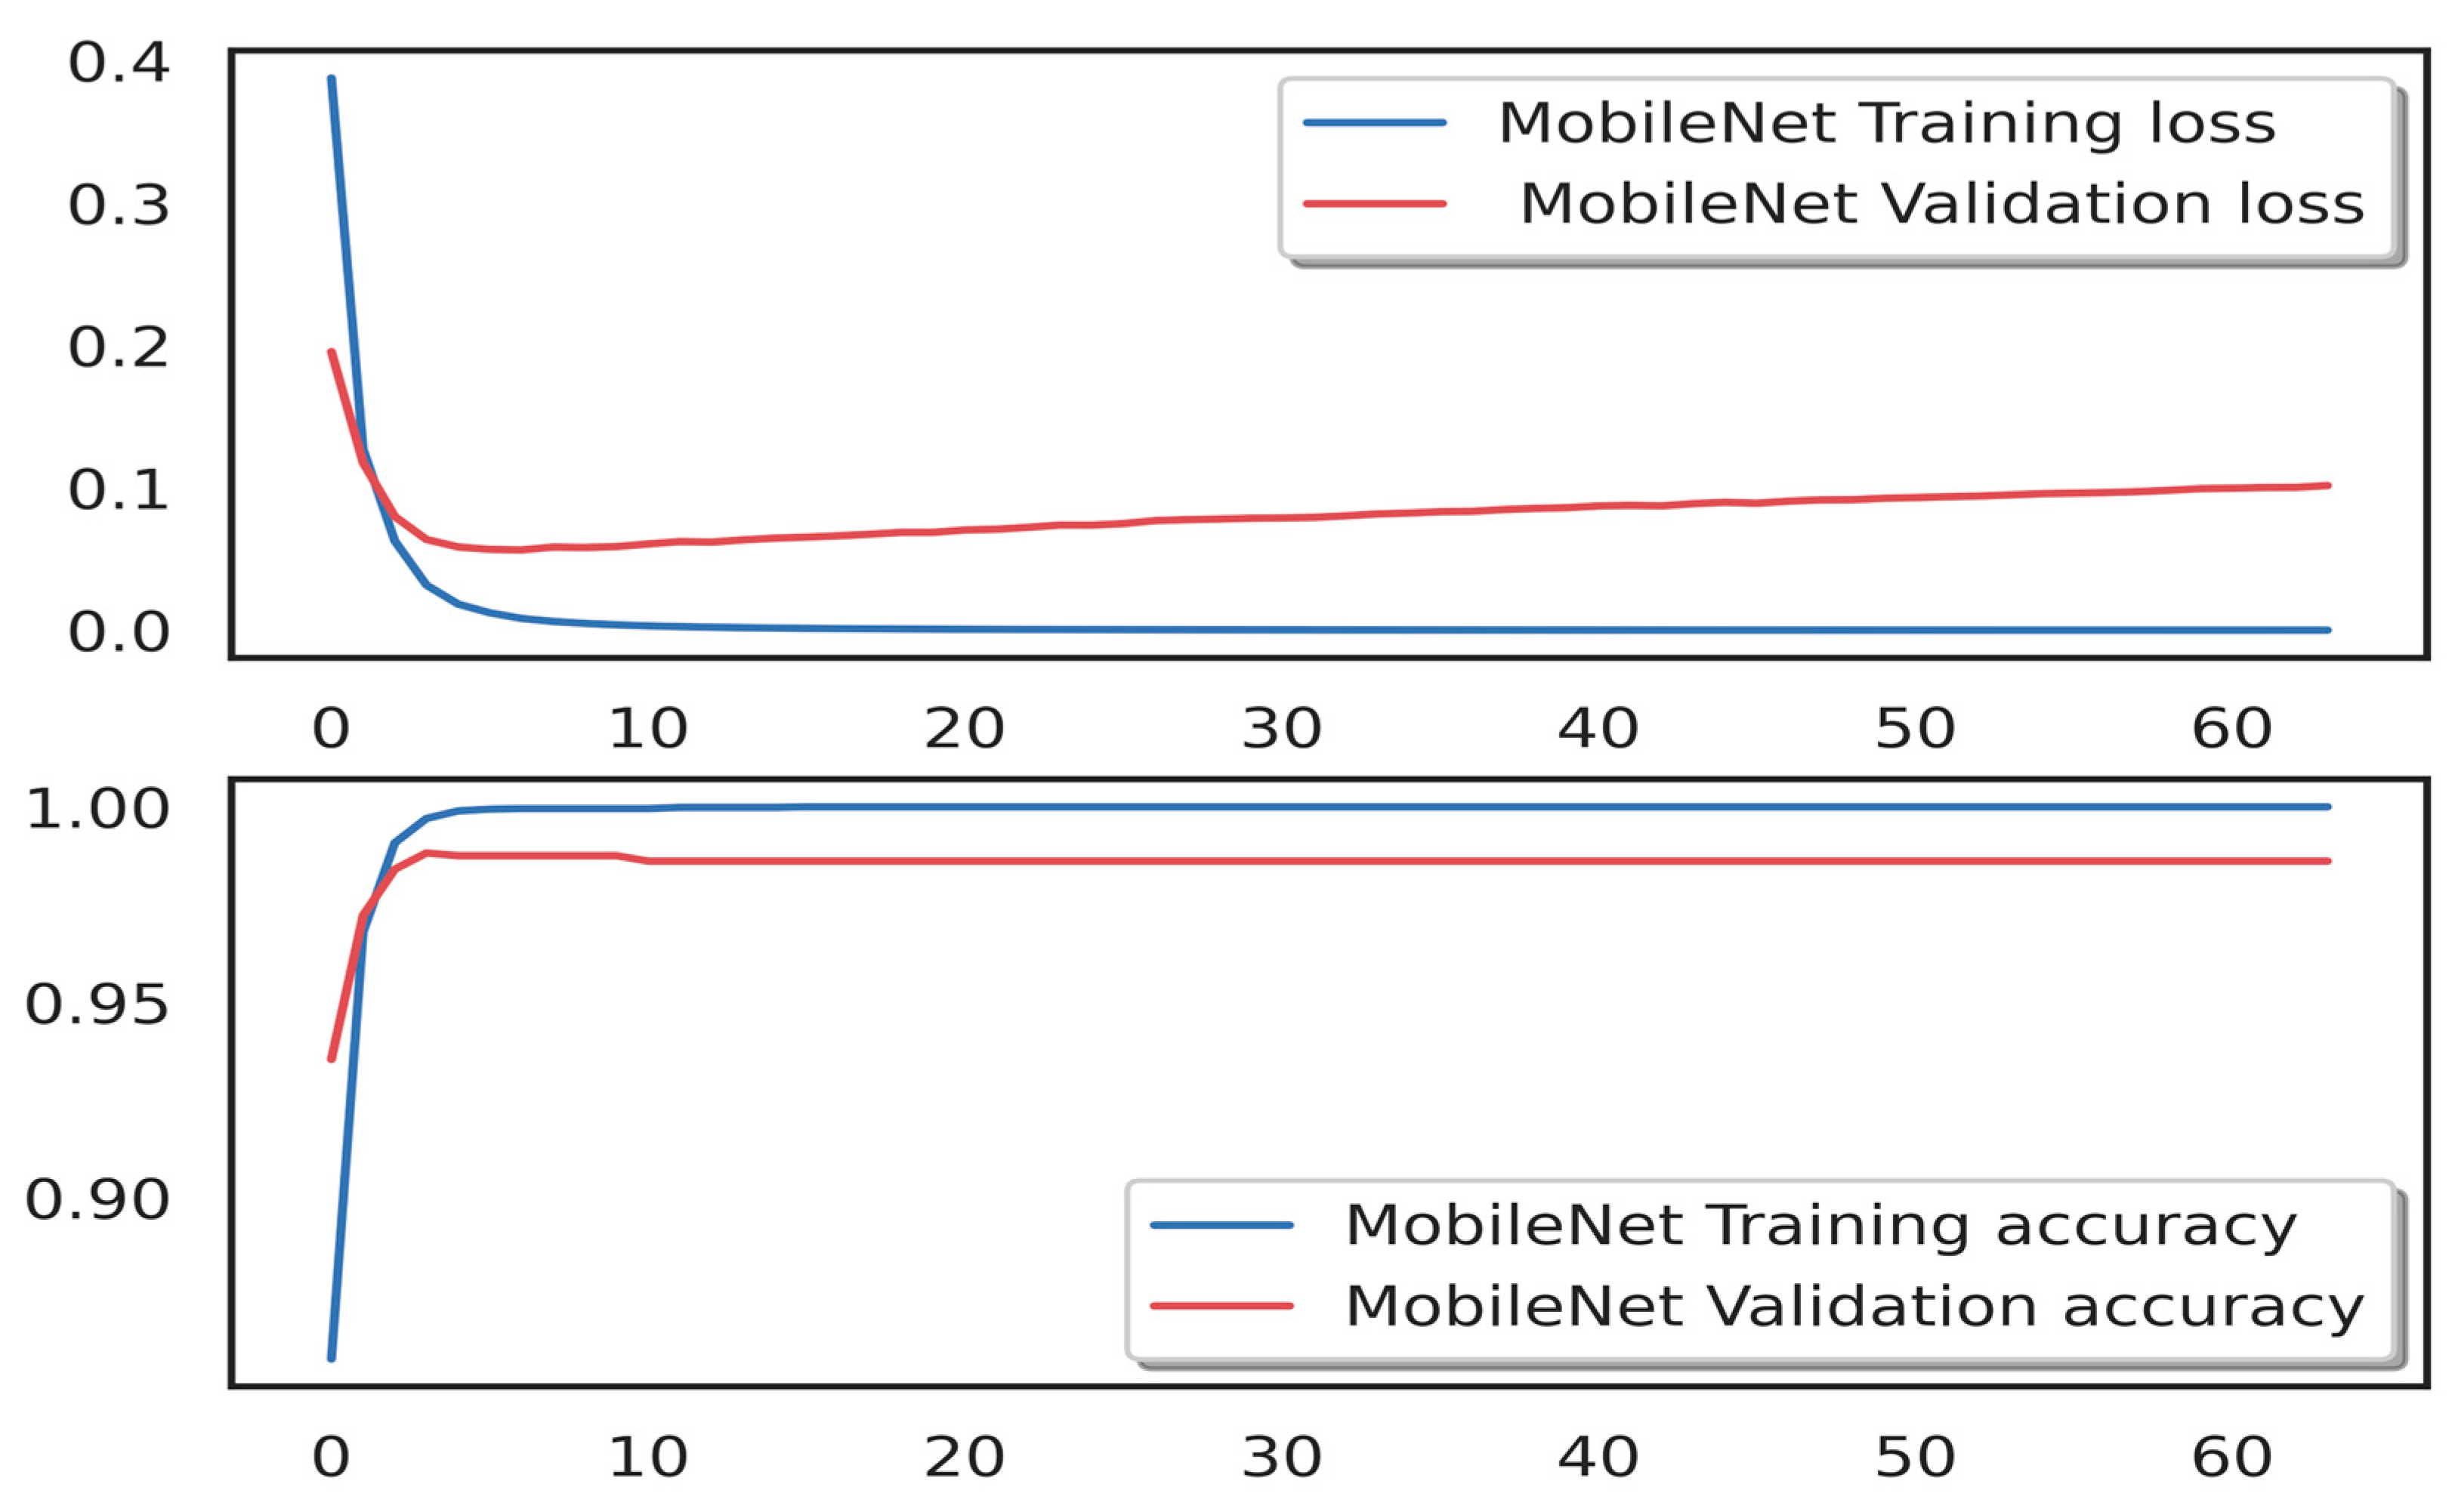
- MobileNet Model: Performance Analysis and Results
- b.
- Handcrafted CNN Model: Performance Analysis and Results
- c.
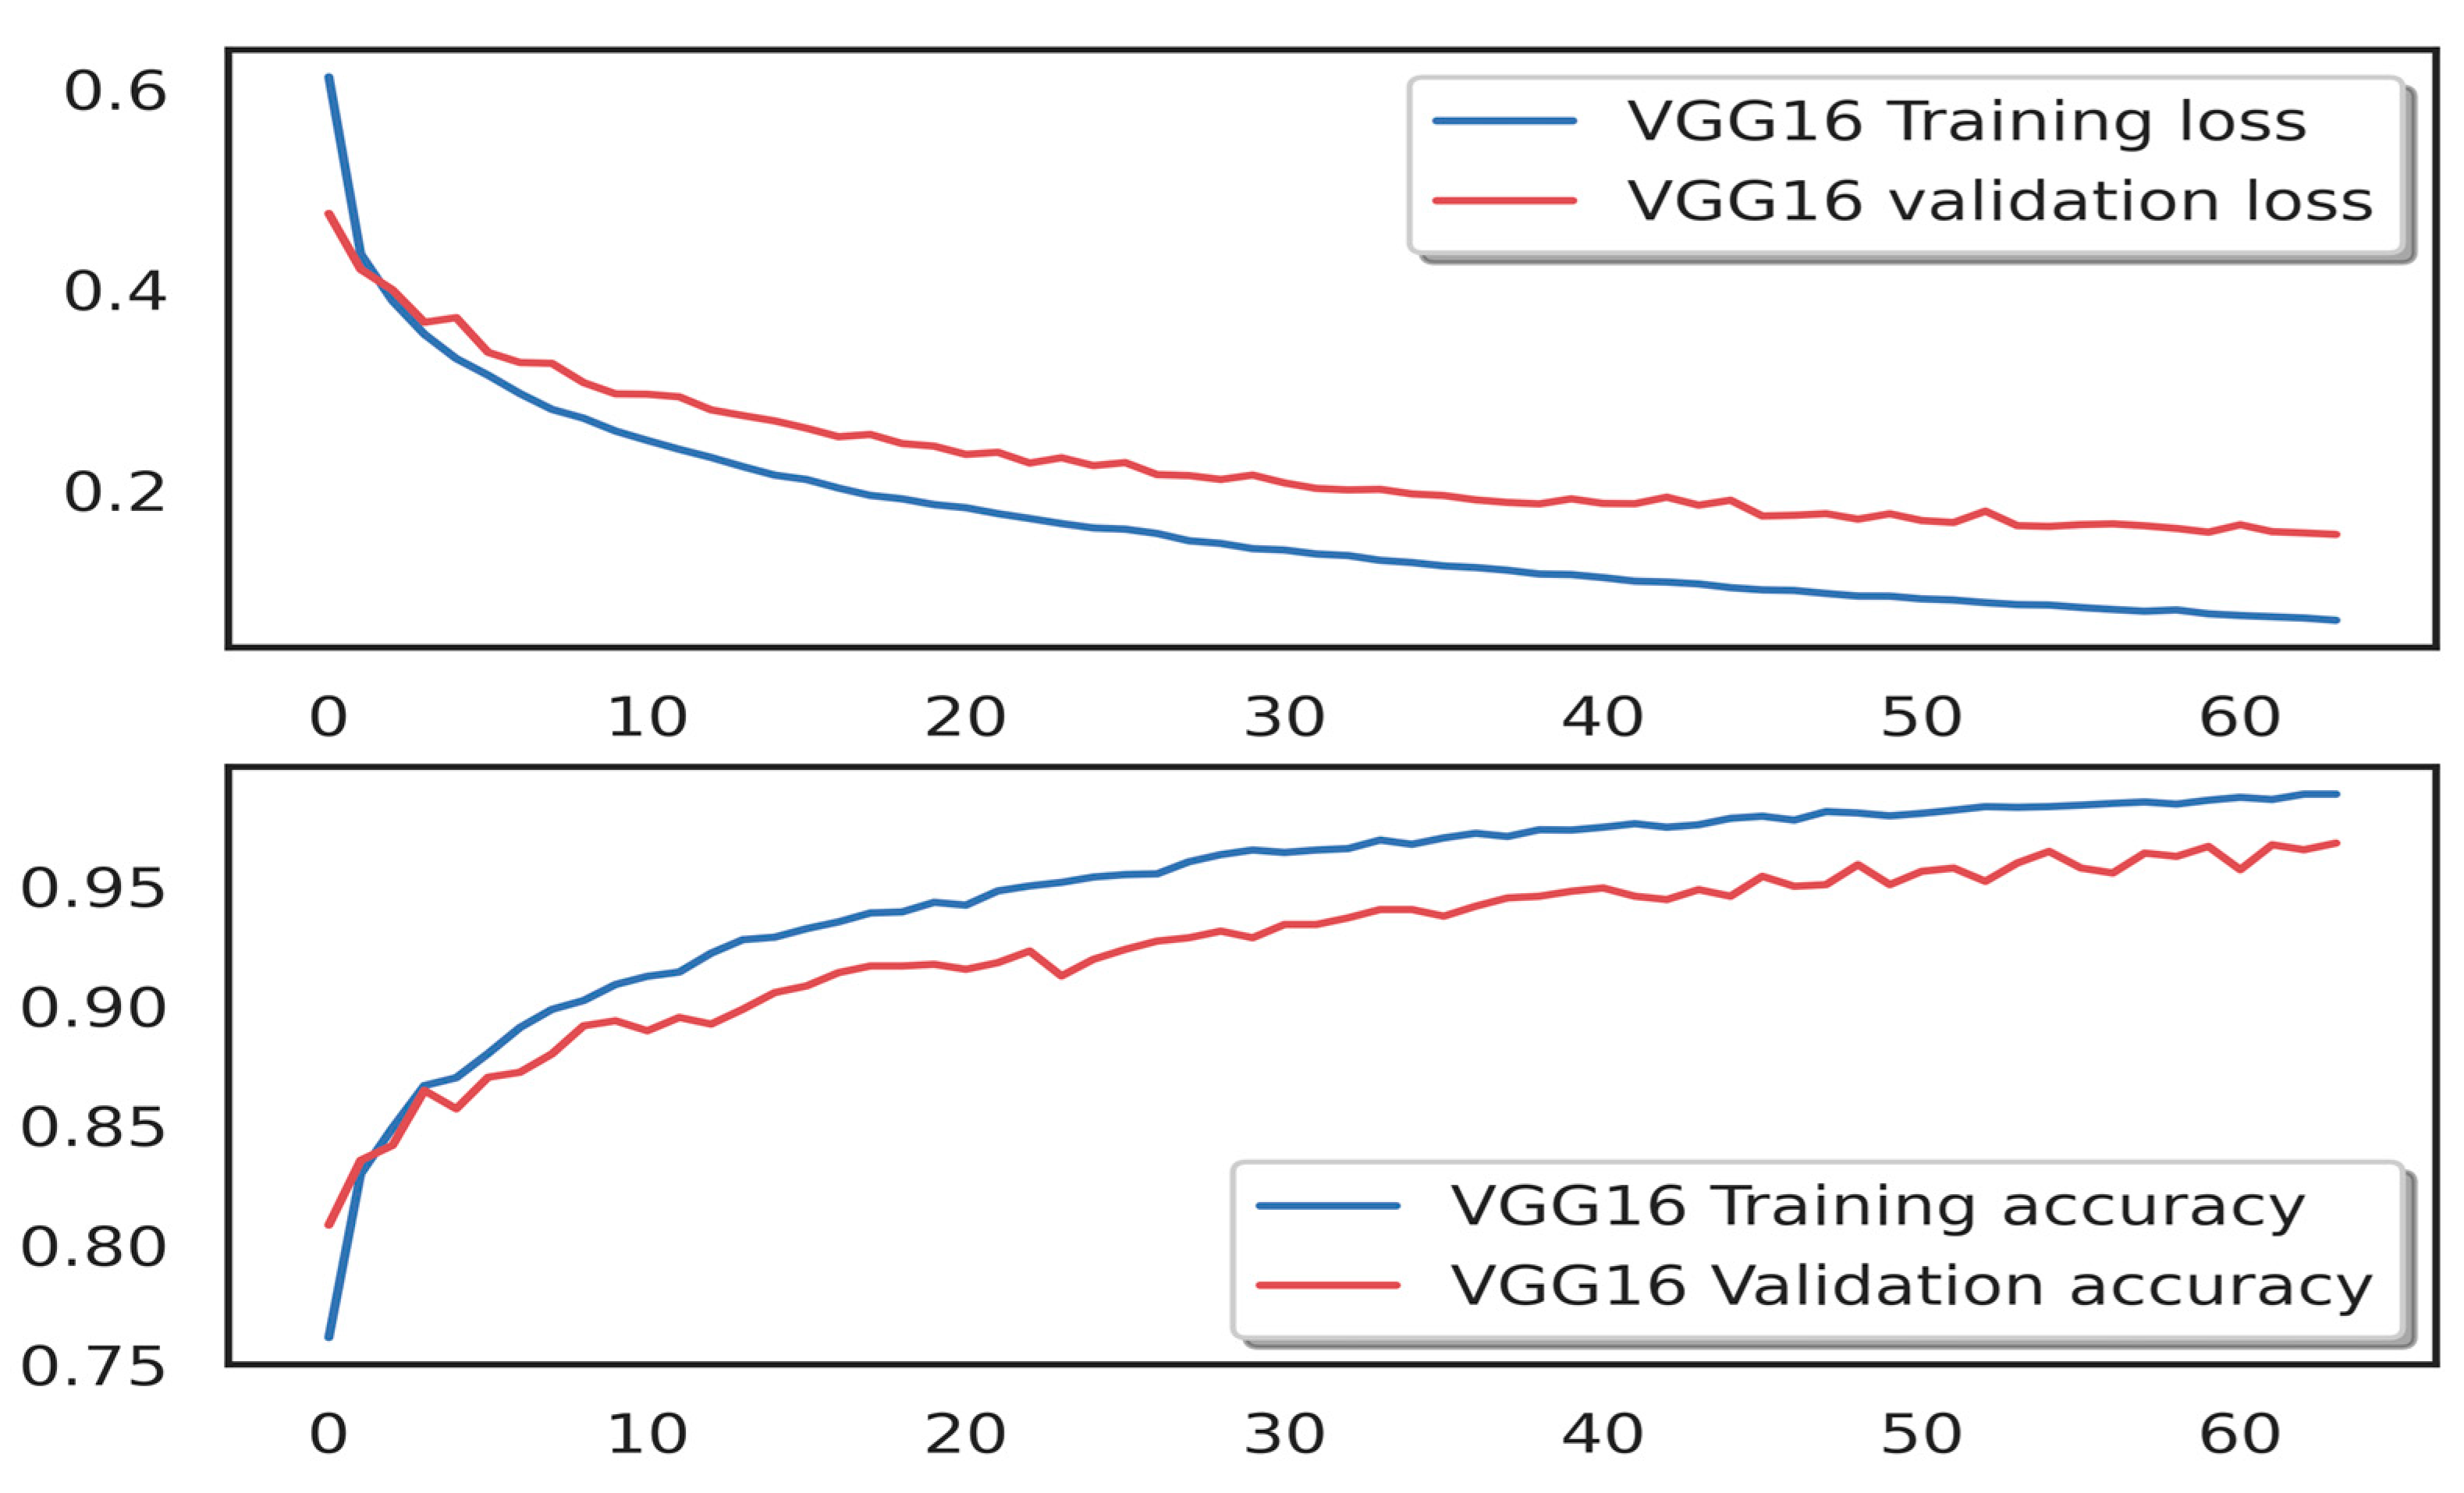
- VGG16 Model: Performance Analysis and Results
- d.
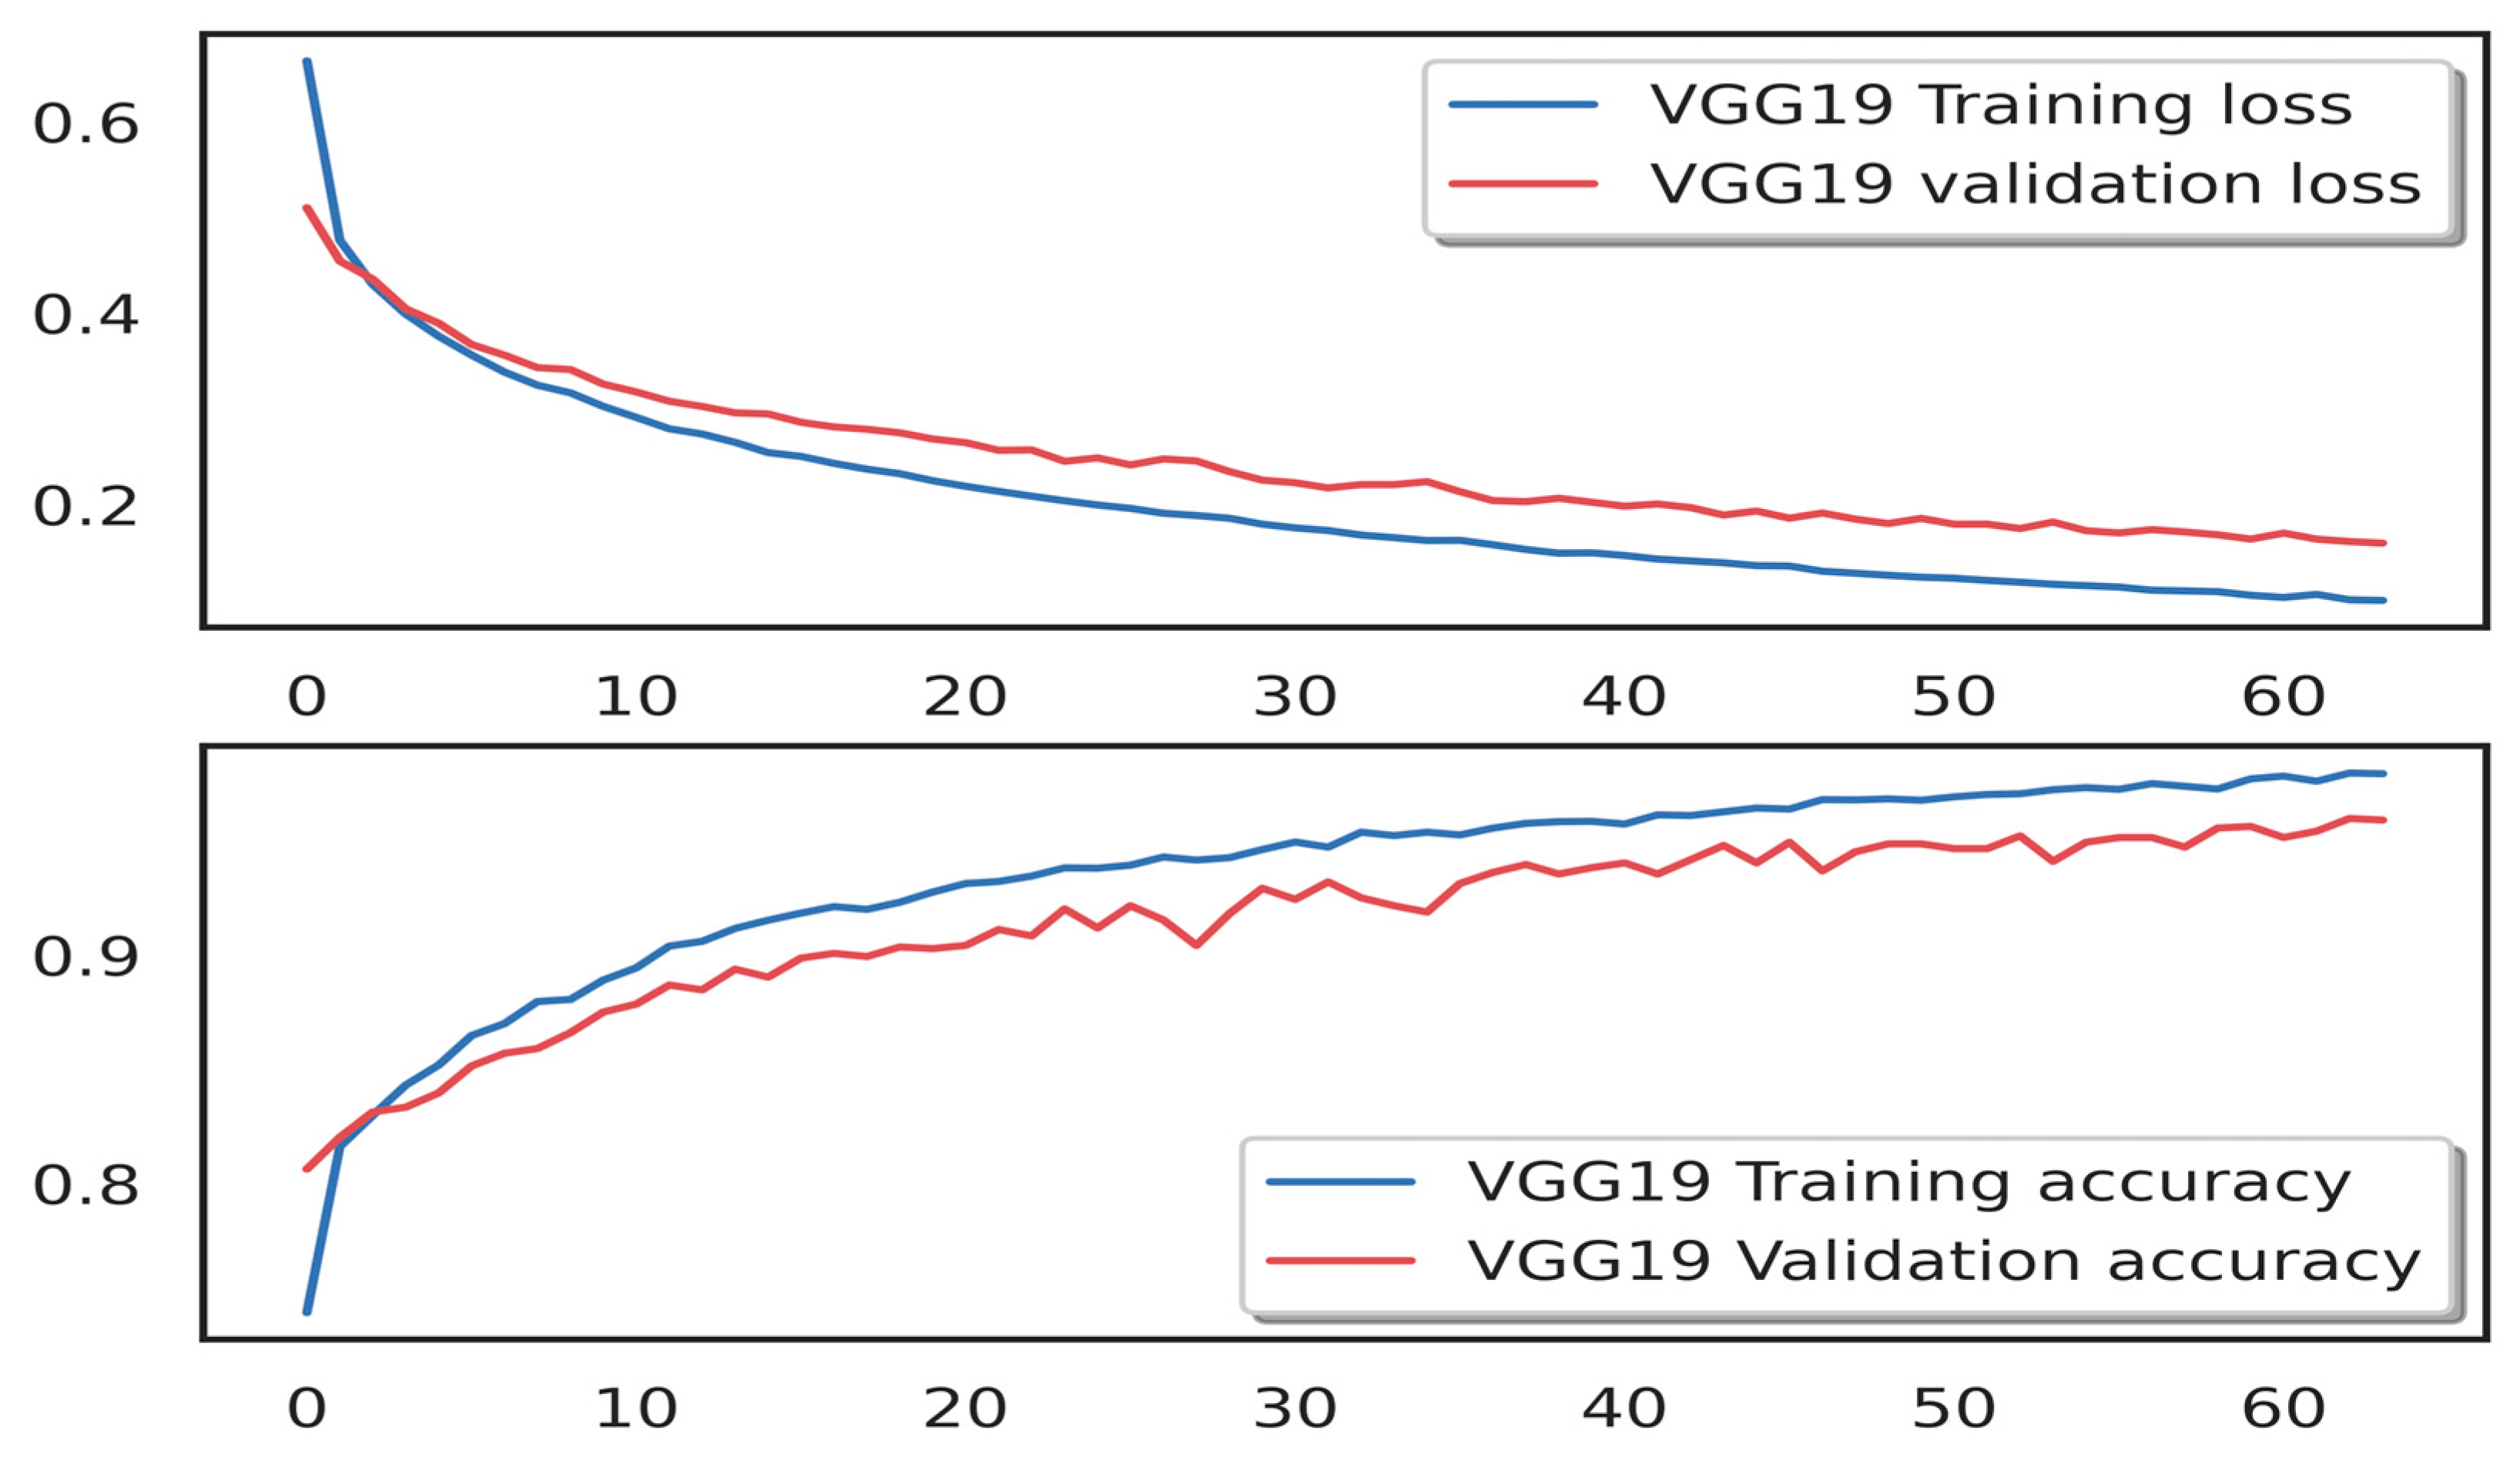
- VGG19 model: Performance Analysis and Results
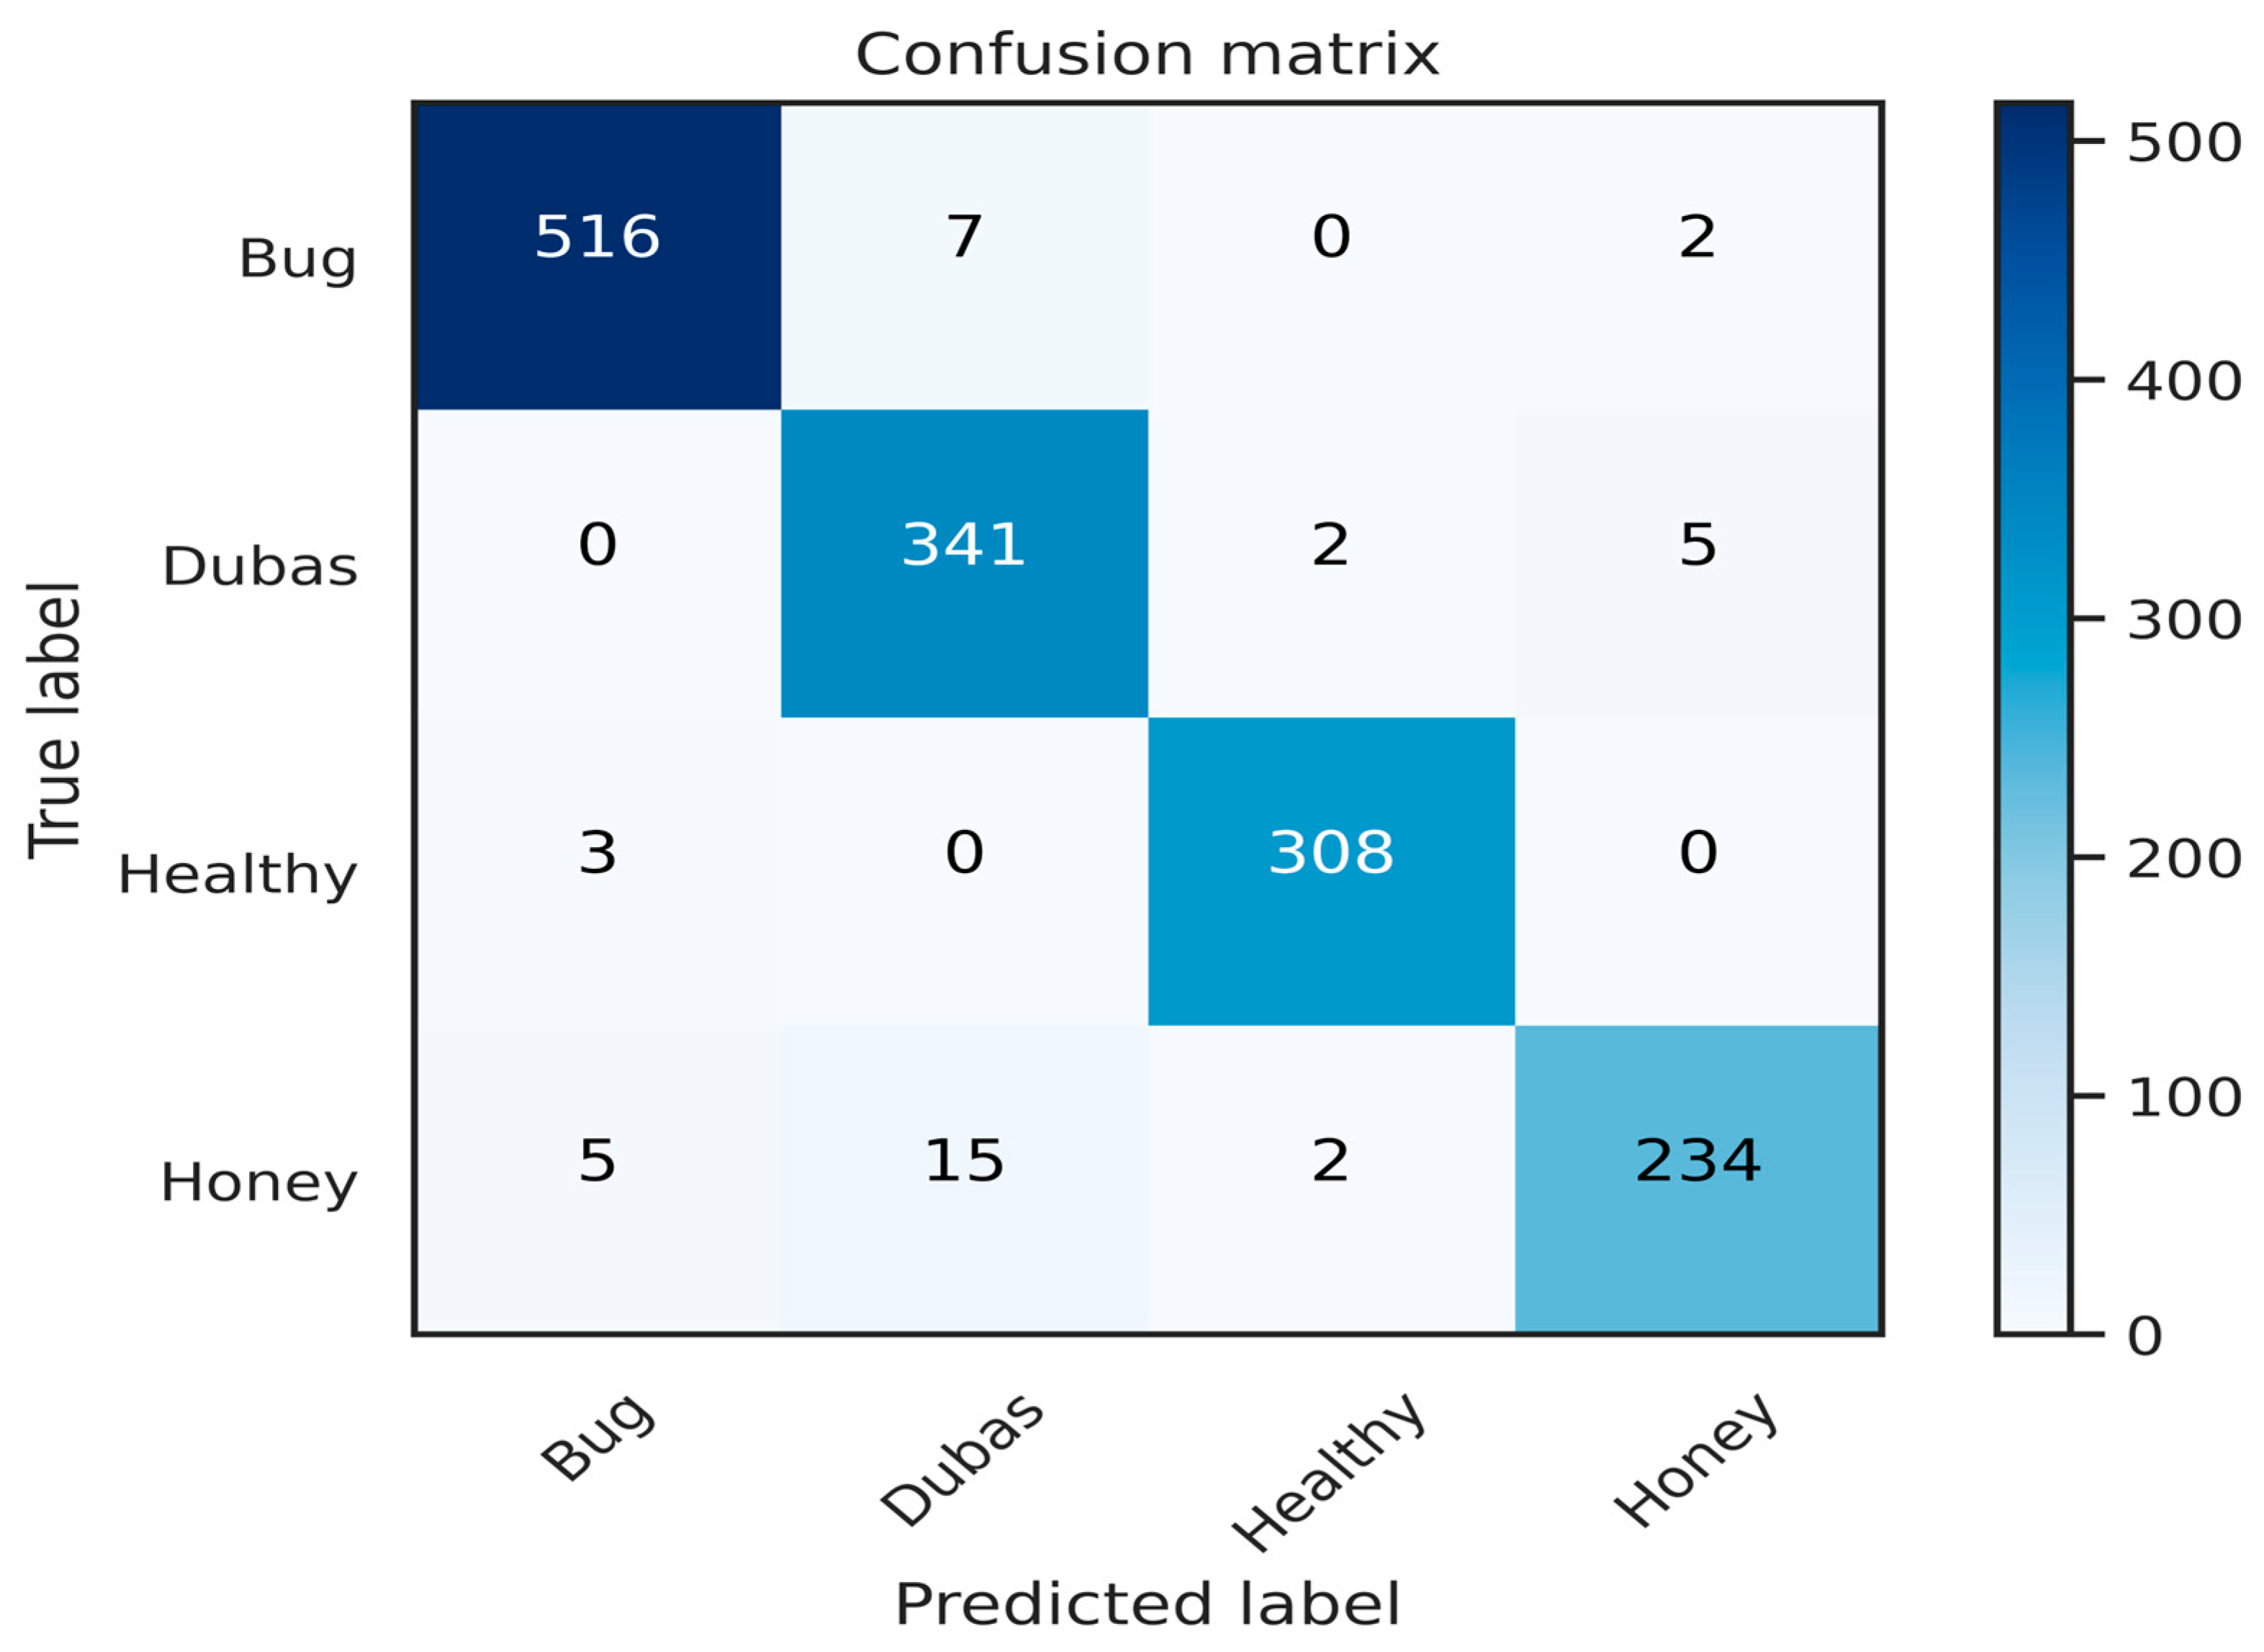
5.3. Confusion Matrix of Models (MobileNet, Handcrafted CNN, VGG16, VGG19)
- a.
- MobileNet
- b.
- Handcrafted CNN
- c.
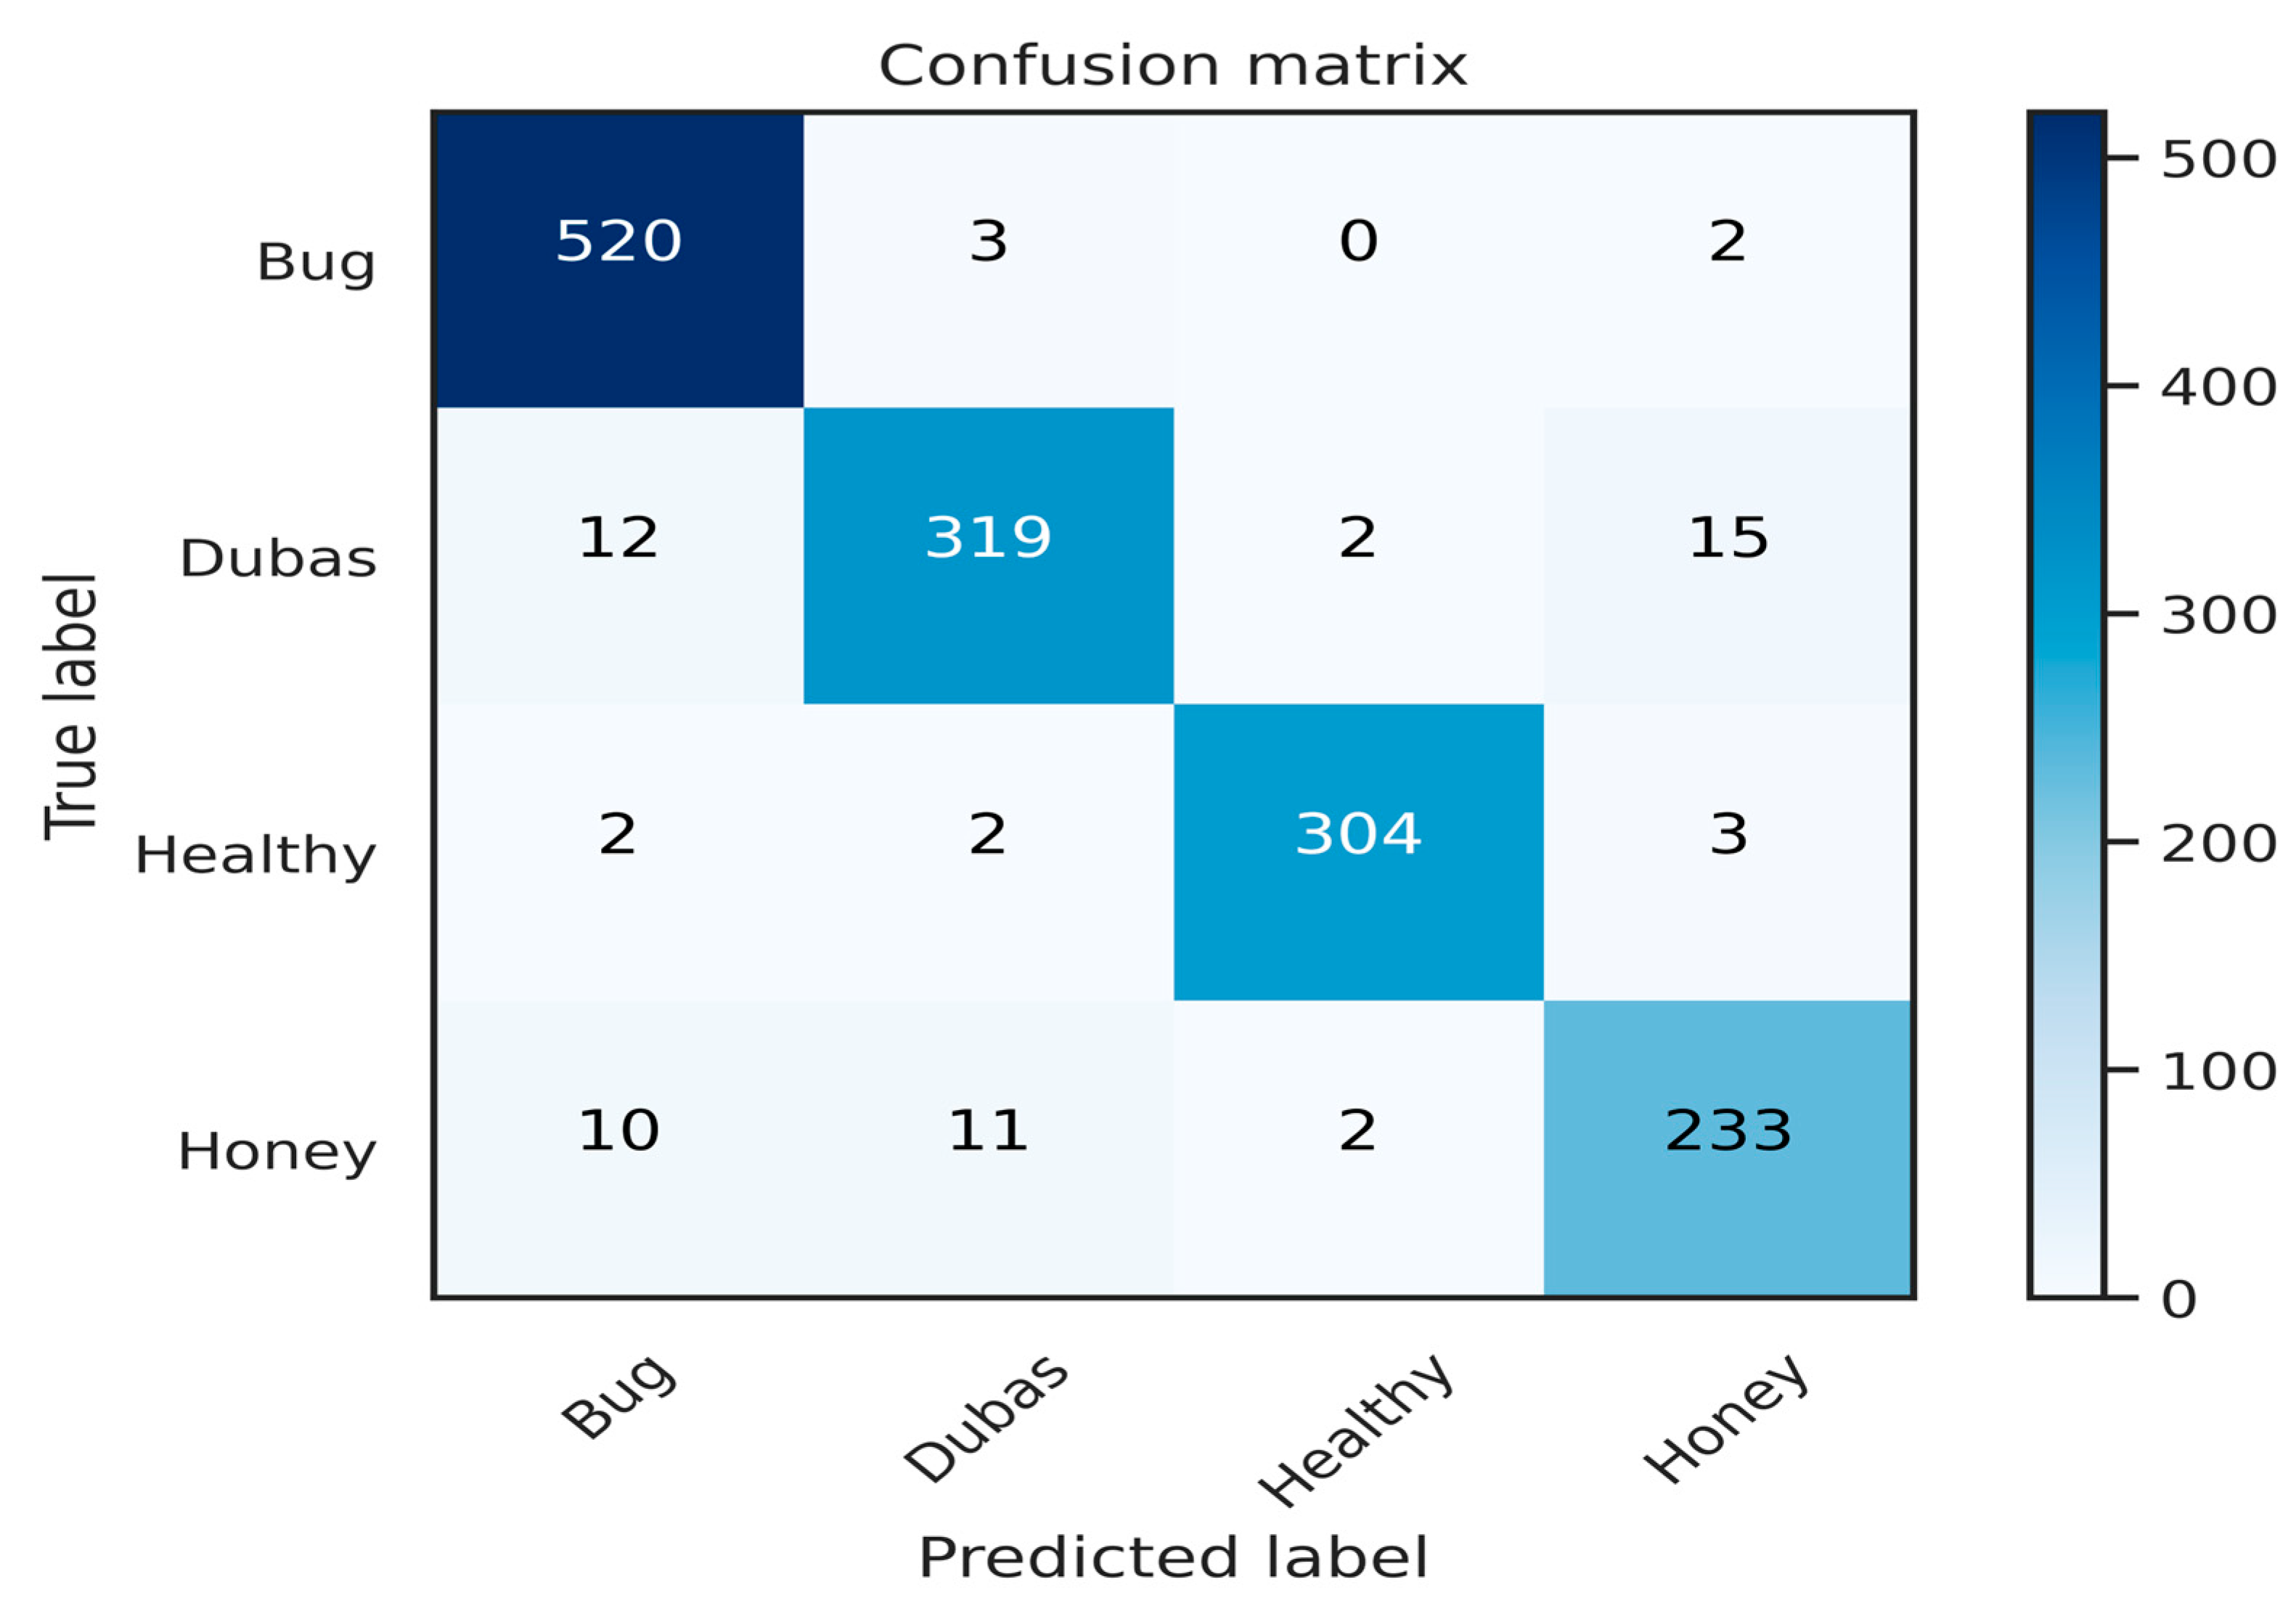
- VGG16
- d.
- VGG19
5.4. Ensemble Voting Method: Performance Analysis and Results
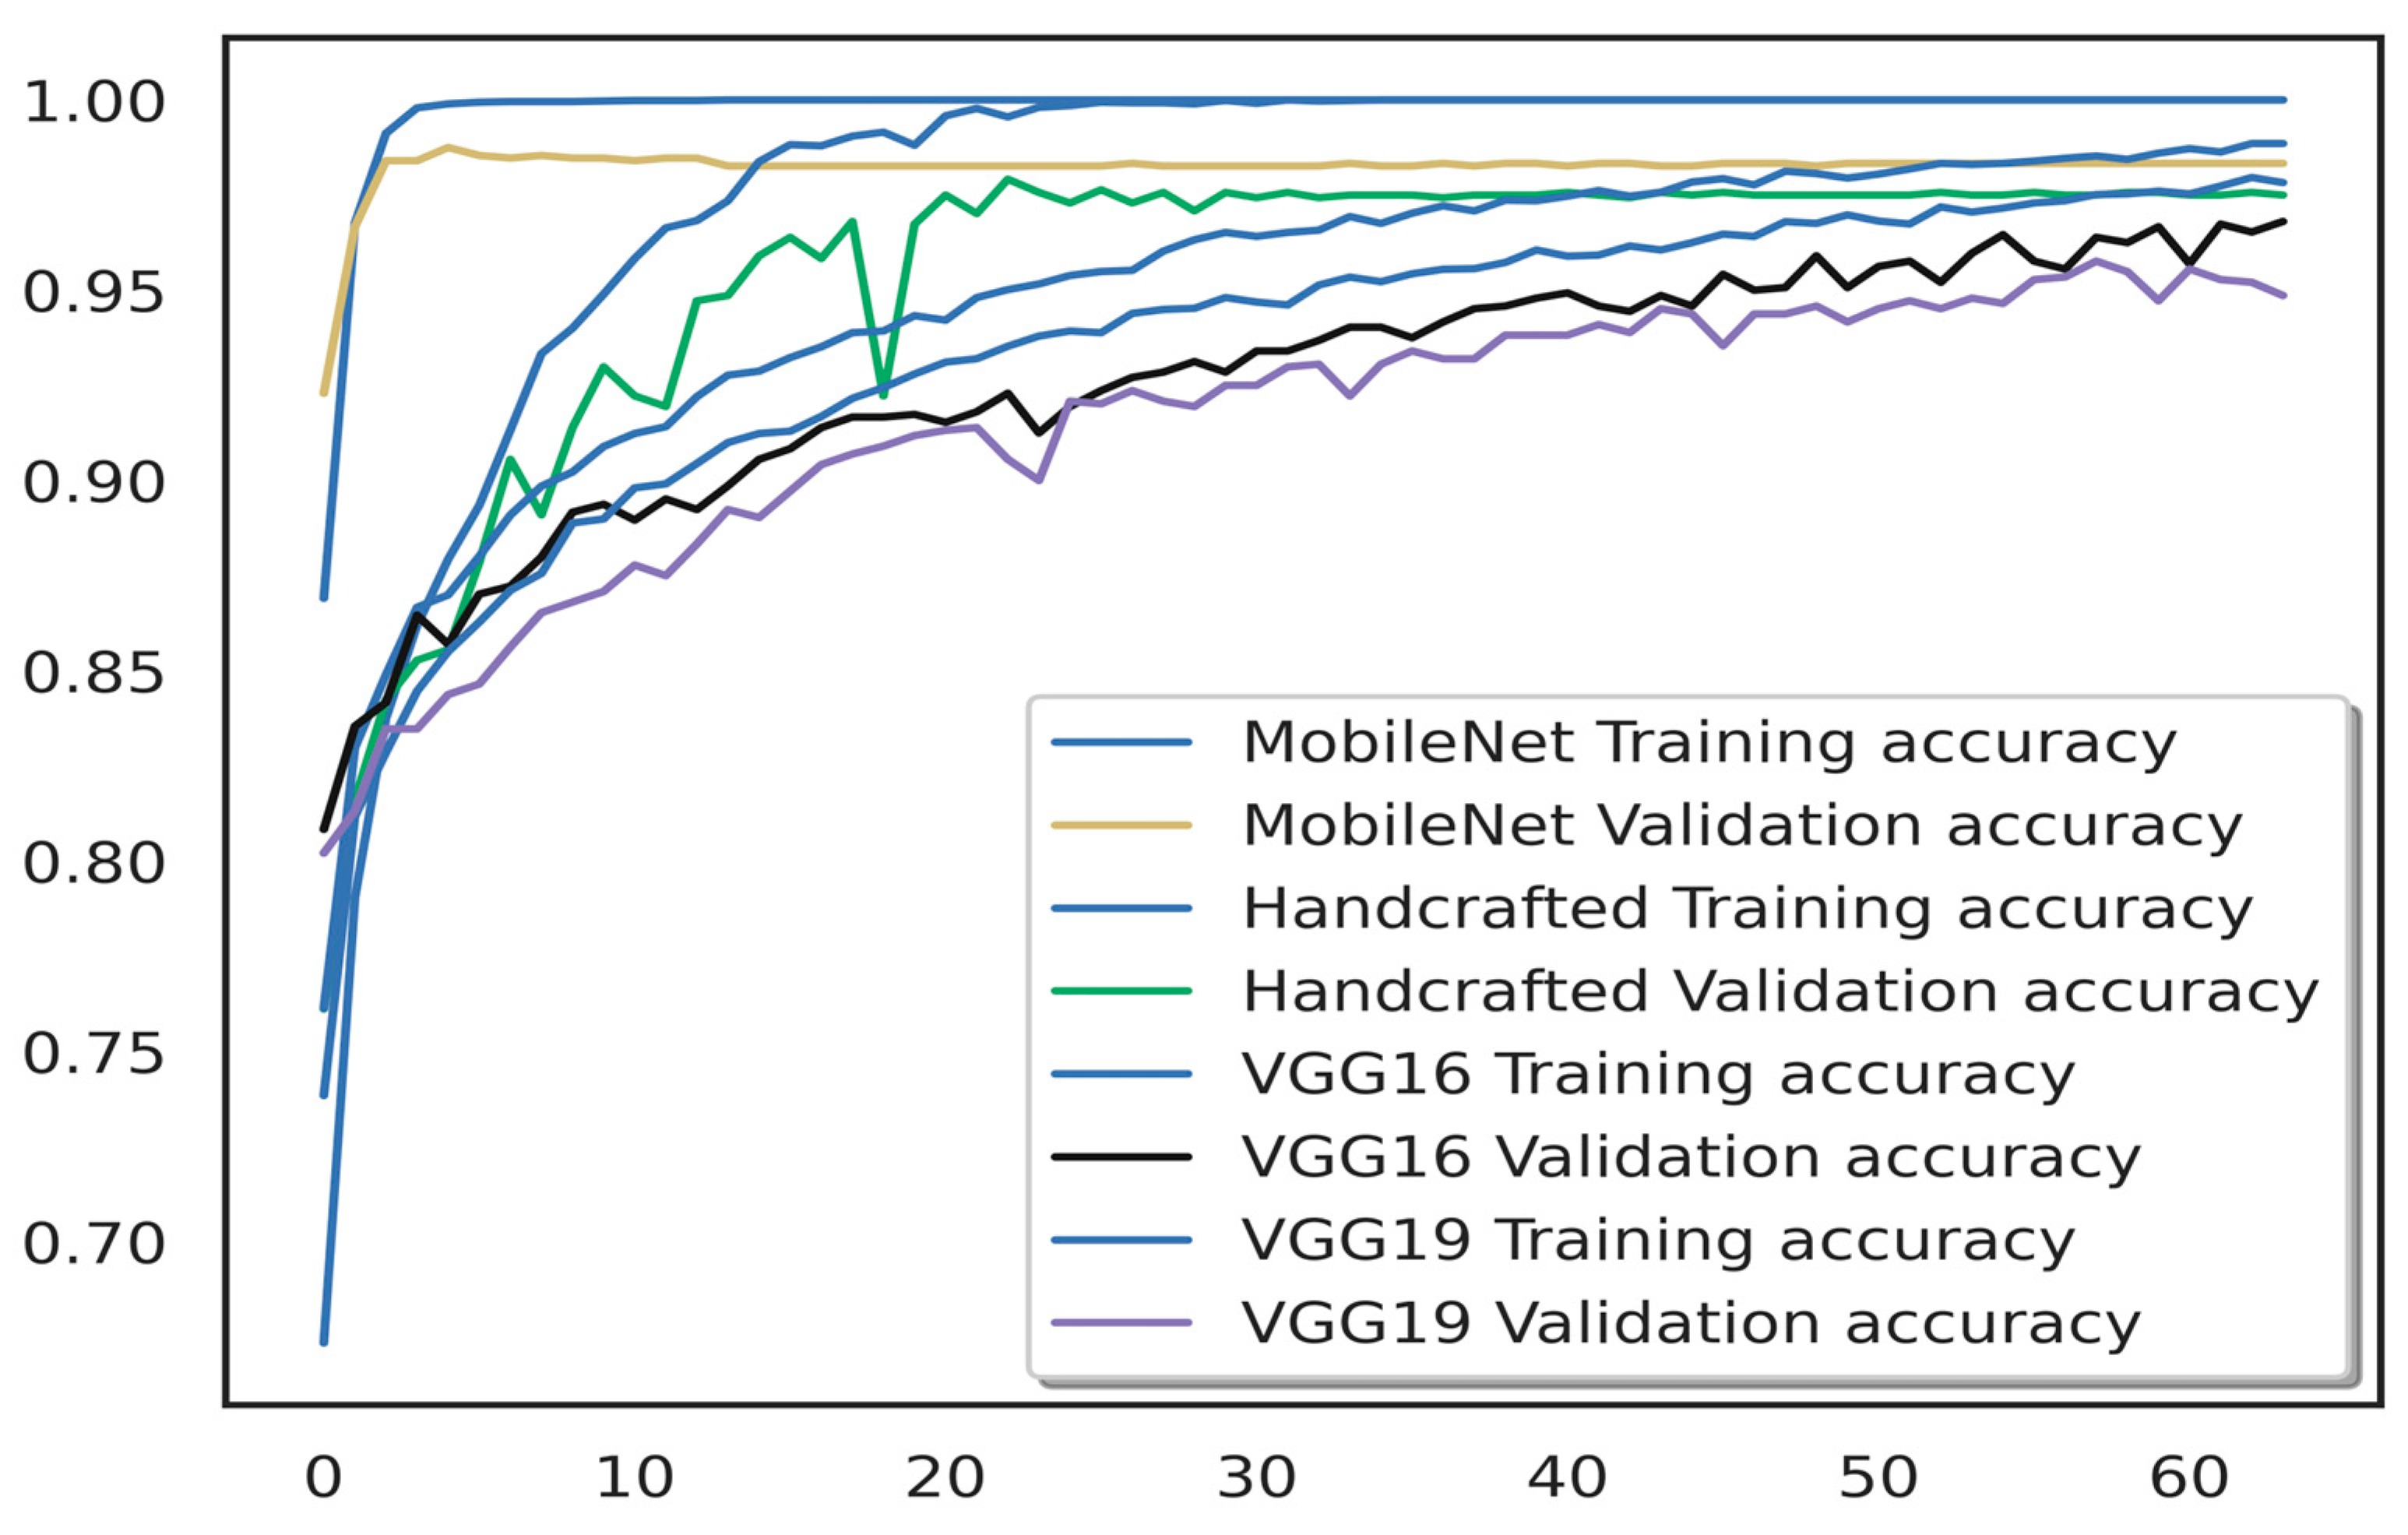
5.5. Accuracy Comparison of CNN Models on Date Palm Data
5.6. Efficiency and Robustness Comparison
6. Conclusions
Author Contributions
Funding
Data Availability Statement
Acknowledgments
Conflicts of Interest
Abbreviations
| UAV | Unmanned aerial vehicle |
| FOV | Field of view |
| IBVS | Image-based visual servoing |
| 6 DOF | Six degrees of freedom |
| CNNs | Convolutional neural networks |
| DL | Deep learning |
| MobileNet | Mobile convolutional network |
| VGG16 | Visual Geometry Group 16 |
| VGG19 | Visual Geometry Group 19 |
| Hand CNN | Handcrafted convolutional neural network |
| VBC | Voting-based classification |
| The force | |
| The moment | |
| φ | The roll angle |
| The yaw angle | |
| Θ | The pitch angle |
| T | The transformation matrix |
| R | The rotation matrix |
References
- Velusamy, P.; Rajendran, S.; Mahendran, R.K.; Naseer, S.; Shafiq, M.; Choi, J.G. Unmanned Aerial Vehicles (UAV) in Precision Agriculture: Applications and Challenges. Energies 2022, 15, 217. [Google Scholar] [CrossRef]
- Torres-Sánchez, J.; López-Granados, F.; Serrano, N.; Arquero, O.; Peña, J.M. High-Throughput 3-D Monitoring of Agricultural-Tree Plantations with Unmanned Aerial Vehicle (UAV) Technology. PLoS ONE 2015, 10, e0130479. [Google Scholar] [CrossRef] [PubMed]
- Hogan, S.D.; Kelly, M.; Stark, B.; Chen, Y. Unmanned Aerial Systems for Agriculture and Natural Resources. Calif. Agric. 2017, 71, 5–14. [Google Scholar] [CrossRef]
- Abrar, I.M.; Mahbubul, S.M.M.; Shakhawat, H.M.; Mohammad, F.U.; Mahady, H.; Razib, H.K.; Nafis, S.A. Adoption of Unmanned Aerial Vehicle (UAV) Imagery in Agricultural Management: A Systematic Literature Review. Ecol. Inform. 2023, 72, 102305. [Google Scholar] [CrossRef]
- Makarov, M.; Maniu, C.S.; Tebbani, S.; Hinostroza, I.; Beltrami, M.M.; Kienitz, J.R.; Menegazzi, R.; Moreno, C.S.; Rocheron, T.; Lombarte, J.R. Octorotor UAVs for Radar Applications: Modelling and Analysis for Control Design. In Proceedings of the Workshop on Research, Education, and Development of Unmanned Aerial Systems (RED-UAS), Cancun, Mexico, 25–27 November 2015; IEEE: New York, NY, USA, 2015; pp. 288–297, ISBN 978-1-5090-1784-3. [Google Scholar]
- Thanaraj, T.; Govind, S.; Roy, A.; Ng, B.F.; Low, K.H. A Reliability Framework for Safe Octorotor UAV Flight Operations. In Proceedings of the International Conference on Unmanned Aircraft Systems (ICUAS), Warsaw, Poland, 6–9 June 2023; IEEE: New York, NY, USA, 2023; pp. 1013–1020, ISBN 9798350310375. [Google Scholar]
- Chaumette, F.; Hutchinson, S. Visual Servo Control I: Basic Approaches. IEEE Robot. Autom. Mag. 2006, 13, 82–90. [Google Scholar] [CrossRef]
- Chaumette, F.; Hutchinson, S. Visual Servo Control II: Advanced Approaches. IEEE Robot. Autom. Mag. 2007, 14, 109–118. [Google Scholar] [CrossRef]
- Janabi-Sharifi, F.; Lingfeng, D.; Wilson, W.J. Comparison of Basic Visual Servoing Methods. IEEE/ASME Trans. Mechatron. 2011, 16, 967–983. [Google Scholar] [CrossRef]
- Shi, H.; Xu, M.; Hwang, K.S. A Fuzzy Adaptive Approach to Decoupled Visual Servoing for a Wheeled Mobile Robot. IEEE Trans. Fuzzy Syst. 2020, 28, 3229–3243. [Google Scholar] [CrossRef]
- Wang, S.; Xu, D.; Liang, H.; Bai, Y.; Li, X.; Zhou, J.; Su, C.; Wei, W. Advances in Deep Learning Applications for Plant Disease and Pest Detection: A Review. Remote Sens. 2025, 17, 698. [Google Scholar] [CrossRef]
- Ouhami, M.; Hafiane, A.; Es-Saady, Y.; El Hajji, M.; Canals, R. Computer Vision, IoT and Data Fusion for Crop Disease Detection Using Machine Learning: A Survey and Ongoing Research. Remote Sens. 2021, 13, 2486. [Google Scholar] [CrossRef]
- Mohammed, M.; Alqahtani, N.K.; Munir, M.; Eltawil, M.A. Applications of AI and IoT for Advancing Date Palm Cultivation in Saudi Arabia. In Internet of Things—New Insights; IntechOpen: London, UK, 2023. [Google Scholar] [CrossRef]
- Nobel, S.N.; Imran, M.A.; Bina, N.Z.; Kabir, M.M.; Safran, M.; Alfarhood, S.; Mridha, M.F. Palm Leaf Health Management: A Hybrid Approach for Automated Disease Detection and Therapy Enhancement. IEEE Access 2024, 12, 105986. [Google Scholar] [CrossRef]
- Al-Shalout, M.; Mansour, K. Detecting Date Palm Diseases Using Convolutional Neural Networks. In Proceedings of the 2021 22nd International Arab Conference on Information Technology (ACIT), Sfax, Tunisia, 21–23 December 2021; IEEE: New York, NY, USA, 2021; pp. 1–5. [Google Scholar] [CrossRef]
- Nadour, M.; Cherroun, L.; Hadroug, N. Classification of ECG Signals Using Deep Neural Networks. J. Eng. Exact Sci. 2023, 9, e16041. [Google Scholar] [CrossRef]
- Nasiri, A.; Taheri-Garavand, A.; Zhang, Y. Image-Based Deep Learning Automated Sorting of Date Fruit. Postharvest Biol. Technol. 2019, 153, 133–141. [Google Scholar] [CrossRef]
- Alshehhi, S.; Almannaee, S.; Shatnawi, M. Date Palm Leaves Discoloration Detection System Using Deep Transfer Learning. In Proceedings of the International Conference on Emerging Technologies and Intelligent Systems, Dubai, United Arab Emirates, 2–4 May 2022; Springer: Cham, Switzerland, 2022; pp. 150–161. [Google Scholar]
- Yarak, K.; Witayangkurn, A.; Kritiyutanont, K.; Arunplod, C.; Shibasaki, R. Oil Palm Tree Detection and Health Classification on High-Resolution Imagery Using Deep Learning. Agriculture 2021, 11, 183. [Google Scholar] [CrossRef]
- Mubin, N.A.; Nadarajoo, E.; Shafri, H.Z.M.; Hamedianfar, A. Young and Mature Oil Palm Tree Detection and Counting Using Convolutional Neural Network Deep Learning Method. Int. J. Remote Sens. 2019, 40, 7500–7515. [Google Scholar] [CrossRef]
- Nesarajan, D.; Kunalan, L.; Logeswaran, M.; Kasthuriarachchi, S.; Lungalage, D. Coconut Disease Prediction System Using Image Processing and Deep Learning Techniques. In Proceedings of the 2020 IEEE 4th International Conference on Image Processing, Applications and Systems (IPAS), Kuala Lumpur, Malaysia, 8–9 December 2020; IEEE: New York, NY, USA, 2020; pp. 212–217. [Google Scholar]
- Al-Gaashani, M.S.A.M.; Shang, F.; Muthanna, M.S.A.M.; Khayyat, M.; Abd El-Latif, A.A. Tomato Leaf Disease Classification by Exploiting Transfer Learning and Feature Concatenation. IET Image Process. 2022, 16, 913–925. [Google Scholar] [CrossRef]
- Kaur, P.; Harnal, S.; Gautam, V.; Singh, M.P.; Singh, S.P. A Novel Transfer Deep Learning Method for Detection and Classification of Plant Leaf Disease. J. Ambient Intell. Humaniz. Comput. 2023, 14, 12407–12424. [Google Scholar] [CrossRef]
- Singh, P.; Verma, A.; Alex, J.S.R. Disease and Pest Infection Detection in Coconut Tree through Deep Learning Techniques. Comput. Electron. Agric. 2021, 182, 105986. [Google Scholar] [CrossRef]
- Puttinaovarat, S.; Chai-Arayalert, S.; Saetang, W. Oil Palm Bunch Ripeness Classification and Plantation Verification Platform: Leveraging Deep Learning and Geospatial Analysis and Visualization. ISPRS Int. J. Geo-Inf. 2024, 13, 158. [Google Scholar] [CrossRef]
- Li, W.; Yu, S.; Yang, R.; Tian, Y.; Zhu, T.; Liu, H.; Jiao, D.; Zhang, F.; Liu, X.; Tao, L.; et al. Machine Learning Model of ResNet50-Ensemble Voting for Malignant–Benign Small Pulmonary Nodule Classification on Computed Tomography Images. Cancers 2023, 15, 5417. [Google Scholar] [CrossRef]
- Johari, S.N.A.M.; Khairunniza-Bejo, S.; Shariff, A.R.M.; Husin, N.A.; Masri, M.M.M.; Kamarudin, N. Detection of Bagworm Infestation Area in Oil Palm Plantation Based on UAV Remote Sensing Using Machine Learning Approach. Agriculture 2023, 13, 1886. [Google Scholar] [CrossRef]
- Hossain, M.M.; Arefin, M.B.; Akhtar, F.; Blake, J. Combining State-of-the-Art Pre-Trained Deep Learning Models: A Noble Approach for Skin Cancer Detection Using Max Voting Ensemble. Diagnostics 2024, 14, 89. [Google Scholar] [CrossRef]
- Toudji, K.; Nadour, M.; Cherroun, L. Fuzzy Logic Controllers Design for the Path Tracking of an Autonomous Coaxial Octorotor. Electroteh. Electron. Autom. (EEA) 2024, 72, 39–46. [Google Scholar] [CrossRef]
- Saied, M.; Lussier, B.; Fantoni, I.; Shraim, H.; Francis, C. Passive Fault-Tolerant Control of an Octorotor Using Super-Twisting Algorithm: Theory and Experiments. In Proceedings of the 3rd Conference on Control and Fault-Tolerant Systems (SysTol), Barcelona, Spain, 7–9 September 2016; IEEE: New York, NY, USA, 2016; pp. 361–366. [Google Scholar] [CrossRef]
- Zeghlache, S.; Mekki, H.; Bouguerra, A.; Djerioui, A. Actuator Fault Tolerant Control Using Adaptive RBFNN Fuzzy Sliding Mode Controller for Coaxial Octorotor UAV. ISA Trans. 2018, 80, 267–278. [Google Scholar] [CrossRef] [PubMed]
- Al-Mahmood, A.M.; Shahadi, H.I.; Khayeat, A.R.H. Image dataset of infected date palm leaves by dubas insects. Data Brief 2023, 49, 109371. [Google Scholar] [CrossRef] [PubMed]
- Nanni, L.; Ghidoni, S.; Brahnam, S. Artisanal and Non-Artisanal Features for Computer Vision Classification. Pattern Recognit. 2017, 71, 158–172. [Google Scholar] [CrossRef]
- Özyurt, F. Efficient Deep Feature Selection for Remote Sensing Image Recognition with Fused Deep Learning Architectures. J. Supercomput. 2020, 76, 8413–8431. [Google Scholar] [CrossRef]
- Rajinikanth, V.; Joseph Raj, A.N.; Thanaraj, K.P.; Naik, G.R. A Customized VGG19 Network with Feature Concatenation for Brain Tumor Detection. Appl. Sci. 2020, 10, 3429. [Google Scholar] [CrossRef]
- Tandel, G.S.; Tiwari, A.; Kakde, O.G. Optimizing Deep Learning Model Performance Using Majority Voting for Brain Tumor Classification. Comput. Biol. Med. 2021, 135, 104564. [Google Scholar] [CrossRef]
- Yacouby, R.; Axman, D. Probabilistic Extension of Precision, Recall, and F1 Score for Thorough Evaluation of Classification Models. In Proceedings of the First Workshop on Evaluation and Comparison of NLP Systems, Virtual Event, 16–20 November 2020; Association for Computational Linguistics: Stroudsburg, PA, USA, 2020; pp. 79–91. [Google Scholar] [CrossRef]
- Unal, Y.; Taspinar, Y.S.; Cinar, I.; Kursun, R.; Koklu, M. Application of Pre-Trained Deep Convolutional Neural Networks for Coffee Bean Species Detection. Food Anal. Methods 2022, 15, 3232–3243. [Google Scholar] [CrossRef]
- Savaş, S. Application of Deep Ensemble Learning for Palm Disease Detection in Smart Agriculture. Heliyon 2024, 10, e37141. [Google Scholar] [CrossRef] [PubMed]
- Kursun, R.; Yasin, E.T.; Koklu, M. Machine Learning-Based Classification of Infected Date Palm Leaves Caused by Dubas Insects: A Comparative Analysis of Feature Extraction Methods and Classification Algorithms. In Proceedings of the 2023 Innovations in Intelligent Systems andApplications Conference (ASYU), Sivas, Turkiye, 11–13 October 2023. [Google Scholar] [CrossRef]
- Al-Mulla, Y.; Ali, A.; Parimi, K. Detection and Analysis of Dubas-Infested Date Palm Trees Using Deep Learning, Remote Sensing, and GIS Techniques in Wadi Bani Kharus. Sustainability 2023, 15, 14045. [Google Scholar] [CrossRef]
- Safran, M.; Alrajhi, W.; Alfarhood, S. DPXception: A lightweight CNN for image-based date palm species classification. Front. Plant Sci. 2024, 14, 1281724. [Google Scholar] [CrossRef]
- Alsirhani, A.; Siddiqi, M.H.; Mostafa, A.M.; Ezz, M.; Mahmoud, A.A. A Novel Classification Model of Date Fruit Dataset Using Deep Transfer Learning. Electronics 2023, 12, 665. [Google Scholar] [CrossRef]
- Hessane, A.; El Youssefi, A.; Farhaoui, Y.; Aghoutane, B. Toward a Stage-Wise Classification of Date Palm White Scale Disease Using Features Extraction and Machine Learning Techniques. In Proceedings of the 2022 International Conference on Intelligent Systems and Computer Vision (ISCV), Fez, Morocco, 4–6 May 2022; IEEE: New York, NY, USA, 2022; pp. 1–6. [Google Scholar]


| Ref. | Year | Type of Palm | Model | Accuracy |
|---|---|---|---|---|
| [17] | 2019 | Date palm | VGG-16 | 96.98% |
| [18] | 2022 | Date palm | SqueezeNet, GoogleNet, and AlexNet | 98% |
| [15] | 2021 | Date palm | CNN | 80% |
| [19] | 2021 | Oil palm tree | Resnet-50 VGG16 | 97.76% |
| [20] | 2019 | Oil palm tree | CNN | 95.11% and 92.96% |
| [21] | 2020 | Coconut palm | SVM and CNN models (EfficientNetB0, ResNet50, and VGG16) | SVM and CNN algorithms, achieving accuracies of 93.54% and 93.72%, respectively |
| [22] | 2022 | Tomato | Random Forest and SVM and MobileNetV2, NASNetMobile | 98.5% |
| [23] | 2023 | Tomato | InceptionResNet-V2 | 98.92% |
| [24] | 2021 | Coconut palm | VGG16, VGG19, InceptionV3, DenseNet201, MobileNet, Xception, InceptionResNetV2, and NASNetMobile | 96.94% |
| [25] | 2024 | Oil palm | MobileNetV1 and InceptionV3 | 96.12% |
| Classes | Number of Images for Each Class | Total Data | For Training | For Validation | For Testing |
|---|---|---|---|---|---|
| Bug | 3265 | ||||
| Dubas | 2337 | 9600 | 6720 | 1440 | 1440 |
| Healthy | 2164 | ||||
| Honey | 1834 |
| Parameters | MobileNet | Handcrafted | VGG16 | VGG19 |
|---|---|---|---|---|
| Input Image Size | 224 × 224 | 224 × 224 | 224 × 224 | 224 × 224 |
| Batch Size | 64 | 64 | 64 | 64 |
| Hardware | GPU | GPU | GPU | GPU |
| Epochs | 64 | 64 | 64 | 64 |
| Training Set | 70% of data | 70% of data | 70% of data | 70% of data |
| Validation Set | 15% of data | 15% of data | 15% of data | 15% of data |
| Test Set | 15% of data | 15% of data | 15% of data | 15% of data |
| Model | Class and Macro–Micro Average | Precision | Recall | F1 Score | Accuracy |
|---|---|---|---|---|---|
| MobileNet | For bug class | 0.9943 | 1 | 0.9871 | |
| For Dubas class | 0.9913 | 0.9827 | 0.9870 | ||
| For healthy class | 0.9902 | 0.9839 | 0.9870 | 98.81% | |
| For honey class | 0.9689 | 0.9727 | 0.9727 | ||
| Macro average | 0.9826 | 0.9858 | 0.9860 | ||
| Micro average | 0.9881 | 0.9881 | 0.9881 |
| Model | Class and Macro–Micro Average | Precision | Recall | F1 Score | Accuracy |
|---|---|---|---|---|---|
| Handcrafted CNN | For bug class | 0.9923 | 1 | 0.9971 | |
| For Dubas class | 0.9769 | 0.9741 | 0.9755 | ||
| For healthy class | 0.9810 | 0.9967 | 0.9888 | 98.26% | |
| For honey class | 0.9678 | 0.9414 | 0.9544 | ||
| Macro average | 0.9803 | 0.9780 | 0.9789 | ||
| Micro average | 0.9826 | 0.9826 | 0.9826 |
| Model | Class and Macro–Micro Average | Precision | Recall | F1 Score | Accuracy |
|---|---|---|---|---|---|
| VGG16 | For bug class | 0.9866 | 0.9847 | 0.9857 | |
| For Dubas class | 0.9445 | 0.9798 | 0.9619 | ||
| For healthy class | 0.9809 | 0.9935 | 0.9872 | 97.22% | |
| For honey class | 0.9708 | 0.9101 | 0.9395 | ||
| Macro average | 0.9707 | 0.9670 | 0.9872 | ||
| Micro average | 0.9722 | 0.9685 | 0.9722 |
| Model | Class and Macro–Micro Average | Precision | Recall | F1 Score | Accuracy |
|---|---|---|---|---|---|
| VGG19 | For bug class | 0.9656 | 0.9904 | 0.9783 | |
| For Dubas class | 0.95 | 0.9281 | 0.9389 | ||
| For healthy class | 0.9868 | 0.9678 | 0.9772 | 95.69% | |
| For honey class | 0.9105 | 0.9140 | 0.9122 | ||
| Macro average | 0.9534 | 0.9501 | 0.9517 | ||
| Micro average | 0.9569 | 0.9569 | 0.9569 |
| The Ensemble Models with Voting Method | ||
|---|---|---|
| Test Accuracy | 99.16% | |
| Precision | For bug class | 1 |
| For Dubas class | 0.9885 | |
| For healthy class | 0.9904 | |
| For honey class | 0.9803 | |
| Macro average | 0.9898 | |
| Micro average | 0.9916 | |
| Recall | For bug class | 1 |
| For Dubas class | 0.9885 | |
| For healthy class | 0.9967 | |
| For honey class | 0.9726 | |
| Macro average | 0.9894 | |
| Micro average | 0.9916 | |
| F1 Score | For bug class | 1 |
| For Dubas class | 0.9885 | |
| For healthy class | 0.9935 | |
| For honey class | 0.9764 | |
| Macro average | 0.9886 | |
| Micro average | 0.9916 | |
| Ref. | Year | Date Palm Dataset | Models Applied | Accuracy |
|---|---|---|---|---|
| [14] | 2024 | Same data | Hybrid models: ECA-Net with ResNet50 and DenseNet201 | 98.67 |
| [39] | 2024 | Same data | MobileNetV2, ResNet, ResNetRS50, DenseNet121 | 99.00 |
| [40] | 2023 | Same data | Comparison of ANN, SVM, KNN, and LR with Inceptionv3, SqueezeNet, and VGG16 | 83.8, 83.4, 80.0, and 72.9, respectively |
| [41] | 2023 | Other data | CNN | 87% |
| [42] | 2024 | Other data | DPXception | 92.9% |
| [43] | 2023 | Other data | DenseNet201 | 95.21% |
| [44] | 2022 | Other data | Comparative analysis VGG16, Xception, InceptionV3, DenseNet, MobileNet, and NasNetMobile | 96.90% |
| Our paper | MobileNet | 98.81 | ||
| Handcrafted CNN | 98.26 | |||
| VGG16 | 97.22 | |||
| VGG19 | 95.96 | |||
| Proposed method (Voting approach) | 99.16 | |||
| MobileNet | Handcrafted CNN | VGG16 | VGG19 | Voting Method | ||
|---|---|---|---|---|---|---|
| Test accuracy | 98.81% | 98.26% | 97.22% | 95.69% | 99.16% | |
| Precision | For bug class | 0.9943 | 0.9923 | 0.9866 | 0.9656 | 1 |
| For Dubas class | 0.9913 | 0.9769 | 0.9445 | 0.9500 | 0.9885 | |
| For healthy class | 0.9902 | 0.9810 | 0.9809 | 0.9868 | 0.9904 | |
| For honey class | 0.9689 | 0.9678 | 0.9708 | 0.9105 | 0.9803 | |
| Macro average | 0.9826 | 0.9803 | 0.9707 | 0.9534 | 0.9898 | |
| Micro average | 0.9881 | 0.9826 | 0.9722 | 0.9569 | 0.9916 | |
| Recall | For bug class | 1 | 1 | 0.9847 | 0.9904 | 1 |
| For Dubas class | 0.9827 | 0.9741 | 0.9798 | 0.9281 | 0.9885 | |
| For healthy class | 0.9839 | 0.9967 | 0.9935 | 0.9678 | 0.9967 | |
| For honey class | 0.9727 | 0.9414 | 0.9101 | 0.9140 | 0.9726 | |
| Macro average | 0.9858 | 0.9780 | 0.9670 | 0.9501 | 0.9894 | |
| Micro average | 0.9881 | 0.9826 | 0.9685 | 0.9569 | 0.9916 | |
| F1 Score | For bug class | 0.9871 | 0.9971 | 0.9857 | 0.9783 | 1 |
| For Dubas class | 0.9870 | 0.9755 | 0.9619 | 0.9389 | 0.9885 | |
| For healthy class | 0.9870 | 0.9888 | 0.9872 | 0.9772 | 0.9935 | |
| For honey class | 0.9727 | 0.9544 | 0.9395 | 0.9122 | 0.9764 | |
| Macro average | 0.9860 | 0.9789 | 0.9872 | 0.9517 | 0.9886 | |
| Micro average | 0.9881 | 0.9826 | 0.9722 | 0.9569 | 0.9916 | |
Disclaimer/Publisher’s Note: The statements, opinions and data contained in all publications are solely those of the individual author(s) and contributor(s) and not of MDPI and/or the editor(s). MDPI and/or the editor(s) disclaim responsibility for any injury to people or property resulting from any ideas, methods, instructions or products referred to in the content. |
© 2025 by the authors. Licensee MDPI, Basel, Switzerland. This article is an open access article distributed under the terms and conditions of the Creative Commons Attribution (CC BY) license (https://creativecommons.org/licenses/by/4.0/).
Share and Cite
Guettaf Temam, A.; Nadour, M.; Cherroun, L.; Hafaifa, A.; Angiulli, G.; La Foresta, F. Voting-Based Classification Approach for Date Palm Health Detection Using UAV Camera Images: Vision and Learning. Drones 2025, 9, 534. https://doi.org/10.3390/drones9080534
Guettaf Temam A, Nadour M, Cherroun L, Hafaifa A, Angiulli G, La Foresta F. Voting-Based Classification Approach for Date Palm Health Detection Using UAV Camera Images: Vision and Learning. Drones. 2025; 9(8):534. https://doi.org/10.3390/drones9080534
Chicago/Turabian StyleGuettaf Temam, Abdallah, Mohamed Nadour, Lakhmissi Cherroun, Ahmed Hafaifa, Giovanni Angiulli, and Fabio La Foresta. 2025. "Voting-Based Classification Approach for Date Palm Health Detection Using UAV Camera Images: Vision and Learning" Drones 9, no. 8: 534. https://doi.org/10.3390/drones9080534
APA StyleGuettaf Temam, A., Nadour, M., Cherroun, L., Hafaifa, A., Angiulli, G., & La Foresta, F. (2025). Voting-Based Classification Approach for Date Palm Health Detection Using UAV Camera Images: Vision and Learning. Drones, 9(8), 534. https://doi.org/10.3390/drones9080534