Article

Predicting Nitrogen Flavanol Index (NFI) in Mentha arvensis Using UAV Imaging and Machine Learning Techniques for Sustainable Agriculture

1
Computational Biology Department, CSIR–Central Institute of Medicinal and Aromatic Plants, Lucknow 226015, India
2
Department of Electronics and Communication Engineering, Christ University, Bangalore 560074, India
3
Plant Protection and Production Division, CSIR-Central Institute of Medicinal and Aromatic Plants, Lucknow 226015, India
4
Academy of Scientific and Innovative Research (AcSIR), Ghaziabad 201002, India
*
Author to whom correspondence should be addressed.
Drones 2025, 9(7), 483; https://doi.org/10.3390/drones9070483
Submission received: 1 May 2025 / Revised: 24 June 2025 / Accepted: 26 June 2025 / Published: 9 July 2025
(This article belongs to the Section Drones in Agriculture and Forestry)

Abstract

Crop growth monitoring at various growth stages is essential for optimizing agricultural inputs and enhancing crop yield. Nitrogen plays a critical role in plant development; however, its improper application can reduce productivity and, in the long term, degrade soil health. The aim of this study was to develop a non-invasive approach for nitrogen estimation through proxies (Nitrogen Flavanol Index) in Mentha arvensis using UAV-derived multispectral vegetation indices and machine learning models. Support Vector Regression, Random Forest, and Gradient Boosting were used to predict the Nitrogen Flavanol Index (NFI) across different growth stages. Among the tested models, Random Forest achieved the highest predictive accuracy (R2 = 0.86, RMSE = 0.32) at 75 days after planting (DAP), followed by Gradient Boosting (R2 = 0.75, RMSE = 0.43). Model performance was lowest during early growth stages (15–30 DAP) but improved markedly from mid to late growth stages (45–90 DAP). The findings highlight the significance of UAV-acquired data coupled with machine learning approaches for non-destructive nitrogen flavanol estimation, which can immensely contribute to improving real-time crop growth monitoring.

1. Introduction

Crop growth monitoring is essential for maintaining agricultural productivity and food security. Crop monitoring using the traditional methods relies heavily upon in-field measurements and laboratory analyses to assess crop health and nutrient uptake during its growth phases for the prediction of crop yield and productivity [1]. Nitrogen plays a crucial role during plant growth as it is a key driver responsible for the photosynthetic and nutrient uptake process in the plants [2]. On one hand, the availability of nitrogen in small quantities weakens the photosynthetic efficiency of the plant, which reduces the biomass and effects the overall plant health, whereas on the other side, excessive nitrogen application often leads to degradation of the soil health and contamination of water resources and also contributes to greenhouse gas emissions over a long time [3].
Traditionally, nitrogen estimation has relied on destructive methods such as the Kjeldahl and Dumas combustion techniques, which are widely applied for major crops [4]. These methods are labor-intensive and hence unsuitable for deployment at a large scale to provide hyperlocal advisories on nitrogen status during the crop growth stages, and often lead to the application of either a low or excess dosage of fertilizer by the farmer in their fields, leading to the adoption of unsustainable practices [5]. Nowadays, advancements in sensor technologies have led to the development of various non-destructive devices like MPM-100 and Dualex for crop nitrogen flavanol assessment during its growth [6,7]. These devices derive the Nitrogen Flavanol Index (NFI), which is also referred to as the (NBI) and is mathematically represented as the ratio of chlorophyll content to flavanol content in the plant leaf [8].
NFI = chlrophyll flavanol
As the NFI is directly proportional to chlorophyll content and inversely proportional to flavanol content in the plant leaf, it serves as a robust indicator of plant nitrogen status. As compared to chlorophyll or flavanol-based measurements alone, the NFI offers greater accuracy and reduced sensitivity to phenological variations, making it a more reliable metric for nitrogen assessment [9]. Additionally, Cerovic et al. validated the efficacy of the Nitrogen Balance Index (NBI) as a reliable estimator of leaf nitrogen content (LNC), demonstrating strong agreement with standard chemical analysis methods such as Dumas and Kjeldahl, with a reported root mean square error (RMSE) of less than 2 mg N g−1 dry weight [10]. Furthermore, Fan et al. reported a significant correlation between the NBI and key agronomic parameters, including LNC, shoot nitrogen accumulation, and crop yield, thereby reinforcing its potential utility for real-time nitrogen monitoring and precision nutrient management [11].
However, despite its advantages, the application of the NFI remains constrained by its reliance on localized, point-based measurements, limiting its capacity for field-scale nitrogen variability assessment. Hence, to overcome these spatial limitations, MPM-100, which provides a point-based leaf NFI, can be coupled with the data acquired using the multispectral sensors mounted on Unmanned Aerial Vehicles (UAVs), which are being used along with machine learning models for large-scale, non-destructive crop monitoring [12]. This system can help in the capture of high-resolution spatial data that can enable the assessment of plant health, growth dynamics, and nutrient status across extensive agricultural landscapes.
Multispectral sensing techniques leverage vegetation reflectance characteristics across multiple spectral bands to compute vegetation indices (VIs) such as the Normalized Difference Vegetation Index (NDVI), Normalized Difference Red Edge Index (NDRE), Soil-Adjusted Vegetation Index (SAVI), and Difference Vegetation Index (DVI). These indices have been widely employed by researchers across the world to estimate nitrogen content, chlorophyll levels, and biomass accumulation [12,13,14,15]. Machine learning (ML) has demonstrated remarkable efficacy in handling complex, nonlinear relationships within multivariate datasets, making it a powerful tool for agricultural data analysis and predictive modeling [16]. By leveraging spectral data and advanced computational techniques, ML-driven models can facilitate precise, spatially continuous predictions of nitrogen status, ultimately improving real-time crop monitoring and site-specific nitrogen management [17].
Numerous studies have explored the potential of multispectral and hyperspectral sensors for predicting the NFI, underscoring its strong association with vegetation indices that characterize crop growth status. A significant correlation was identified between the Transformed Chlorophyll Absorption in Reflectance Index (TCARI) and the Optimized Soil-Adjusted Vegetation Index (OSAVI) in hyperspectral NBI estimation using field observation and airborne imagery in maize [18]. The Dark Green Color Index (DGCI) could explain 77.1% of NBI variability, highlighting its predictive potential [19]. Machine learning techniques with hyperspectral data can enhance NBI prediction accuracy [11].
Mentha arvensis (commonly known as menthol mint or Japanese mint) is a short-duration (90–110 days) aromatic cash crop cultivated extensively across the Indo-Gangetic plains of northern India. This crop is highly valued for its essential oil, which is widely used in the pharmaceutical, flavoring, and cosmetic industries, and it provides a significant source of income for millions of smallholder farmers. India is the world’s largest producer of menthol mint oil, accounting for approximately 80% of the global supply, with an estimated 250,000 hectares under cultivation by more than 500,000 farming families. Effective nitrogen management is critical for this crop, as optimal nitrogen levels are directly linked to biomass accumulation and the quality and yield of essential oil, which determine the economic returns for farmers.
While the Nitrogen Flavanol Index (NFI) has been explored as a non-destructive indicator of nitrogen status in cereals and other staple crops, no prior studies, to our knowledge, have applied NFI prediction to aromatic crops such as Mentha arvensis. Therefore, this study aims to develop and evaluate machine learning models for predicting the NFI at different growth stages of Mentha arvensis by integrating UAV-derived multispectral vegetation indices. This novel approach is expected to support precise, growth-stage-specific nitrogen monitoring, enabling optimized fertilizer management and contributing to improved productivity and sustainability in menthol mint cultivation.

2. Materials and Methods
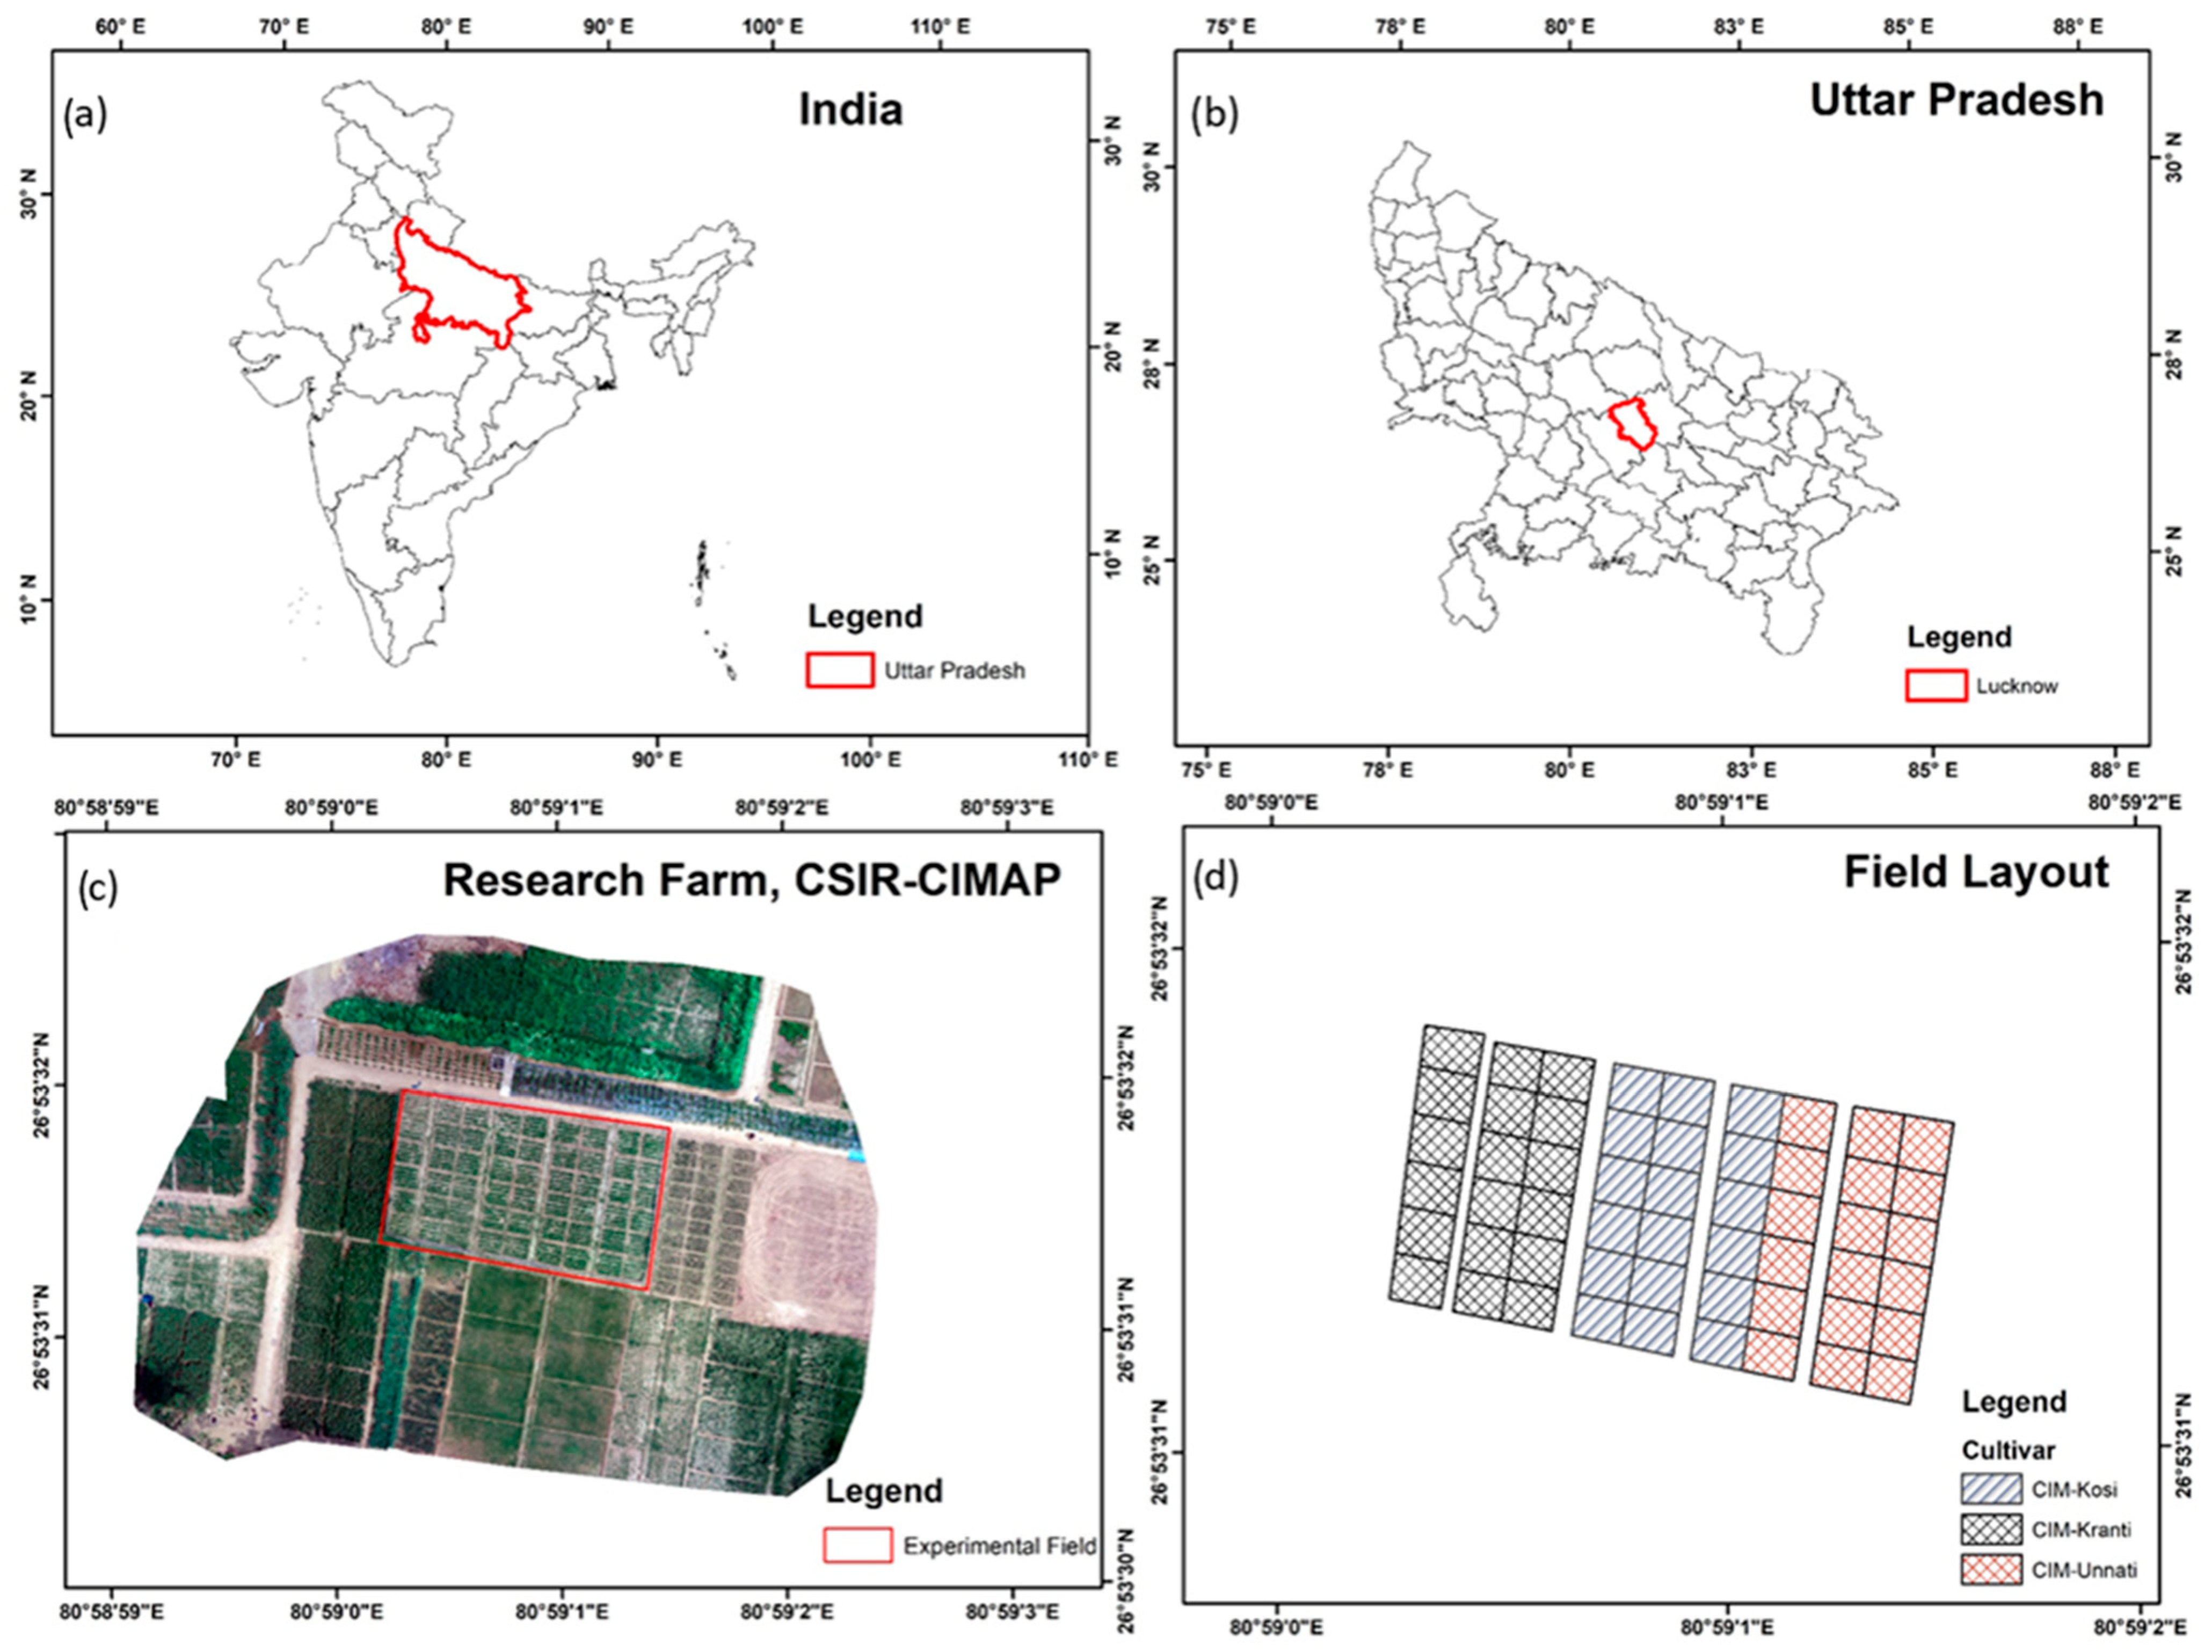
2.1. Study Area

The field experiment was conducted between March and June 2022 at the research farm of the CSIR–Central Institute of Medicinal and Aromatic Plants (CSIR-CIMAP), located in Lucknow, India, at 26.8916° north latitude and 80.9831° east longitude, with an elevation of approximately 120 m above sea level (Figure 1). The site lies within a semi-arid subtropical climatic zone, characterized by hot summers and mild winters. These environmental conditions are particularly well-suited for the cultivation of Mentha arvensis (menthol mint), supporting vigorous vegetative growth and enhanced essential oil biosynthesis during the March–June growing season.
The experimental field was systematically partitioned into 56 uniformly sized plots, each measuring 3 × 3 m, to ensure consistency in agronomic management and spatial analysis. The soil in the study area is classified as loamy sand, with high drainage capacity, a light brown hue, and a slightly alkaline pH of 7.78 ± 0.65—properties considered optimal for mint cultivation under irrigated field conditions.
Three commercially important and genetically distinct cultivars of Mentha arvensis—CIM-Kosi, CIM-Unnati, and CIM-Kranti—were selected from the CSIR-CIMAP gene bank and cultivated under uniform management conditions. These cultivars are widely adopted across northern India due to their high essential oil content, biotic stress resistance, and proven agro-climatic adaptability. Plants were established with an inter-row spacing of 45 cm and an intra-row spacing of 15 cm.

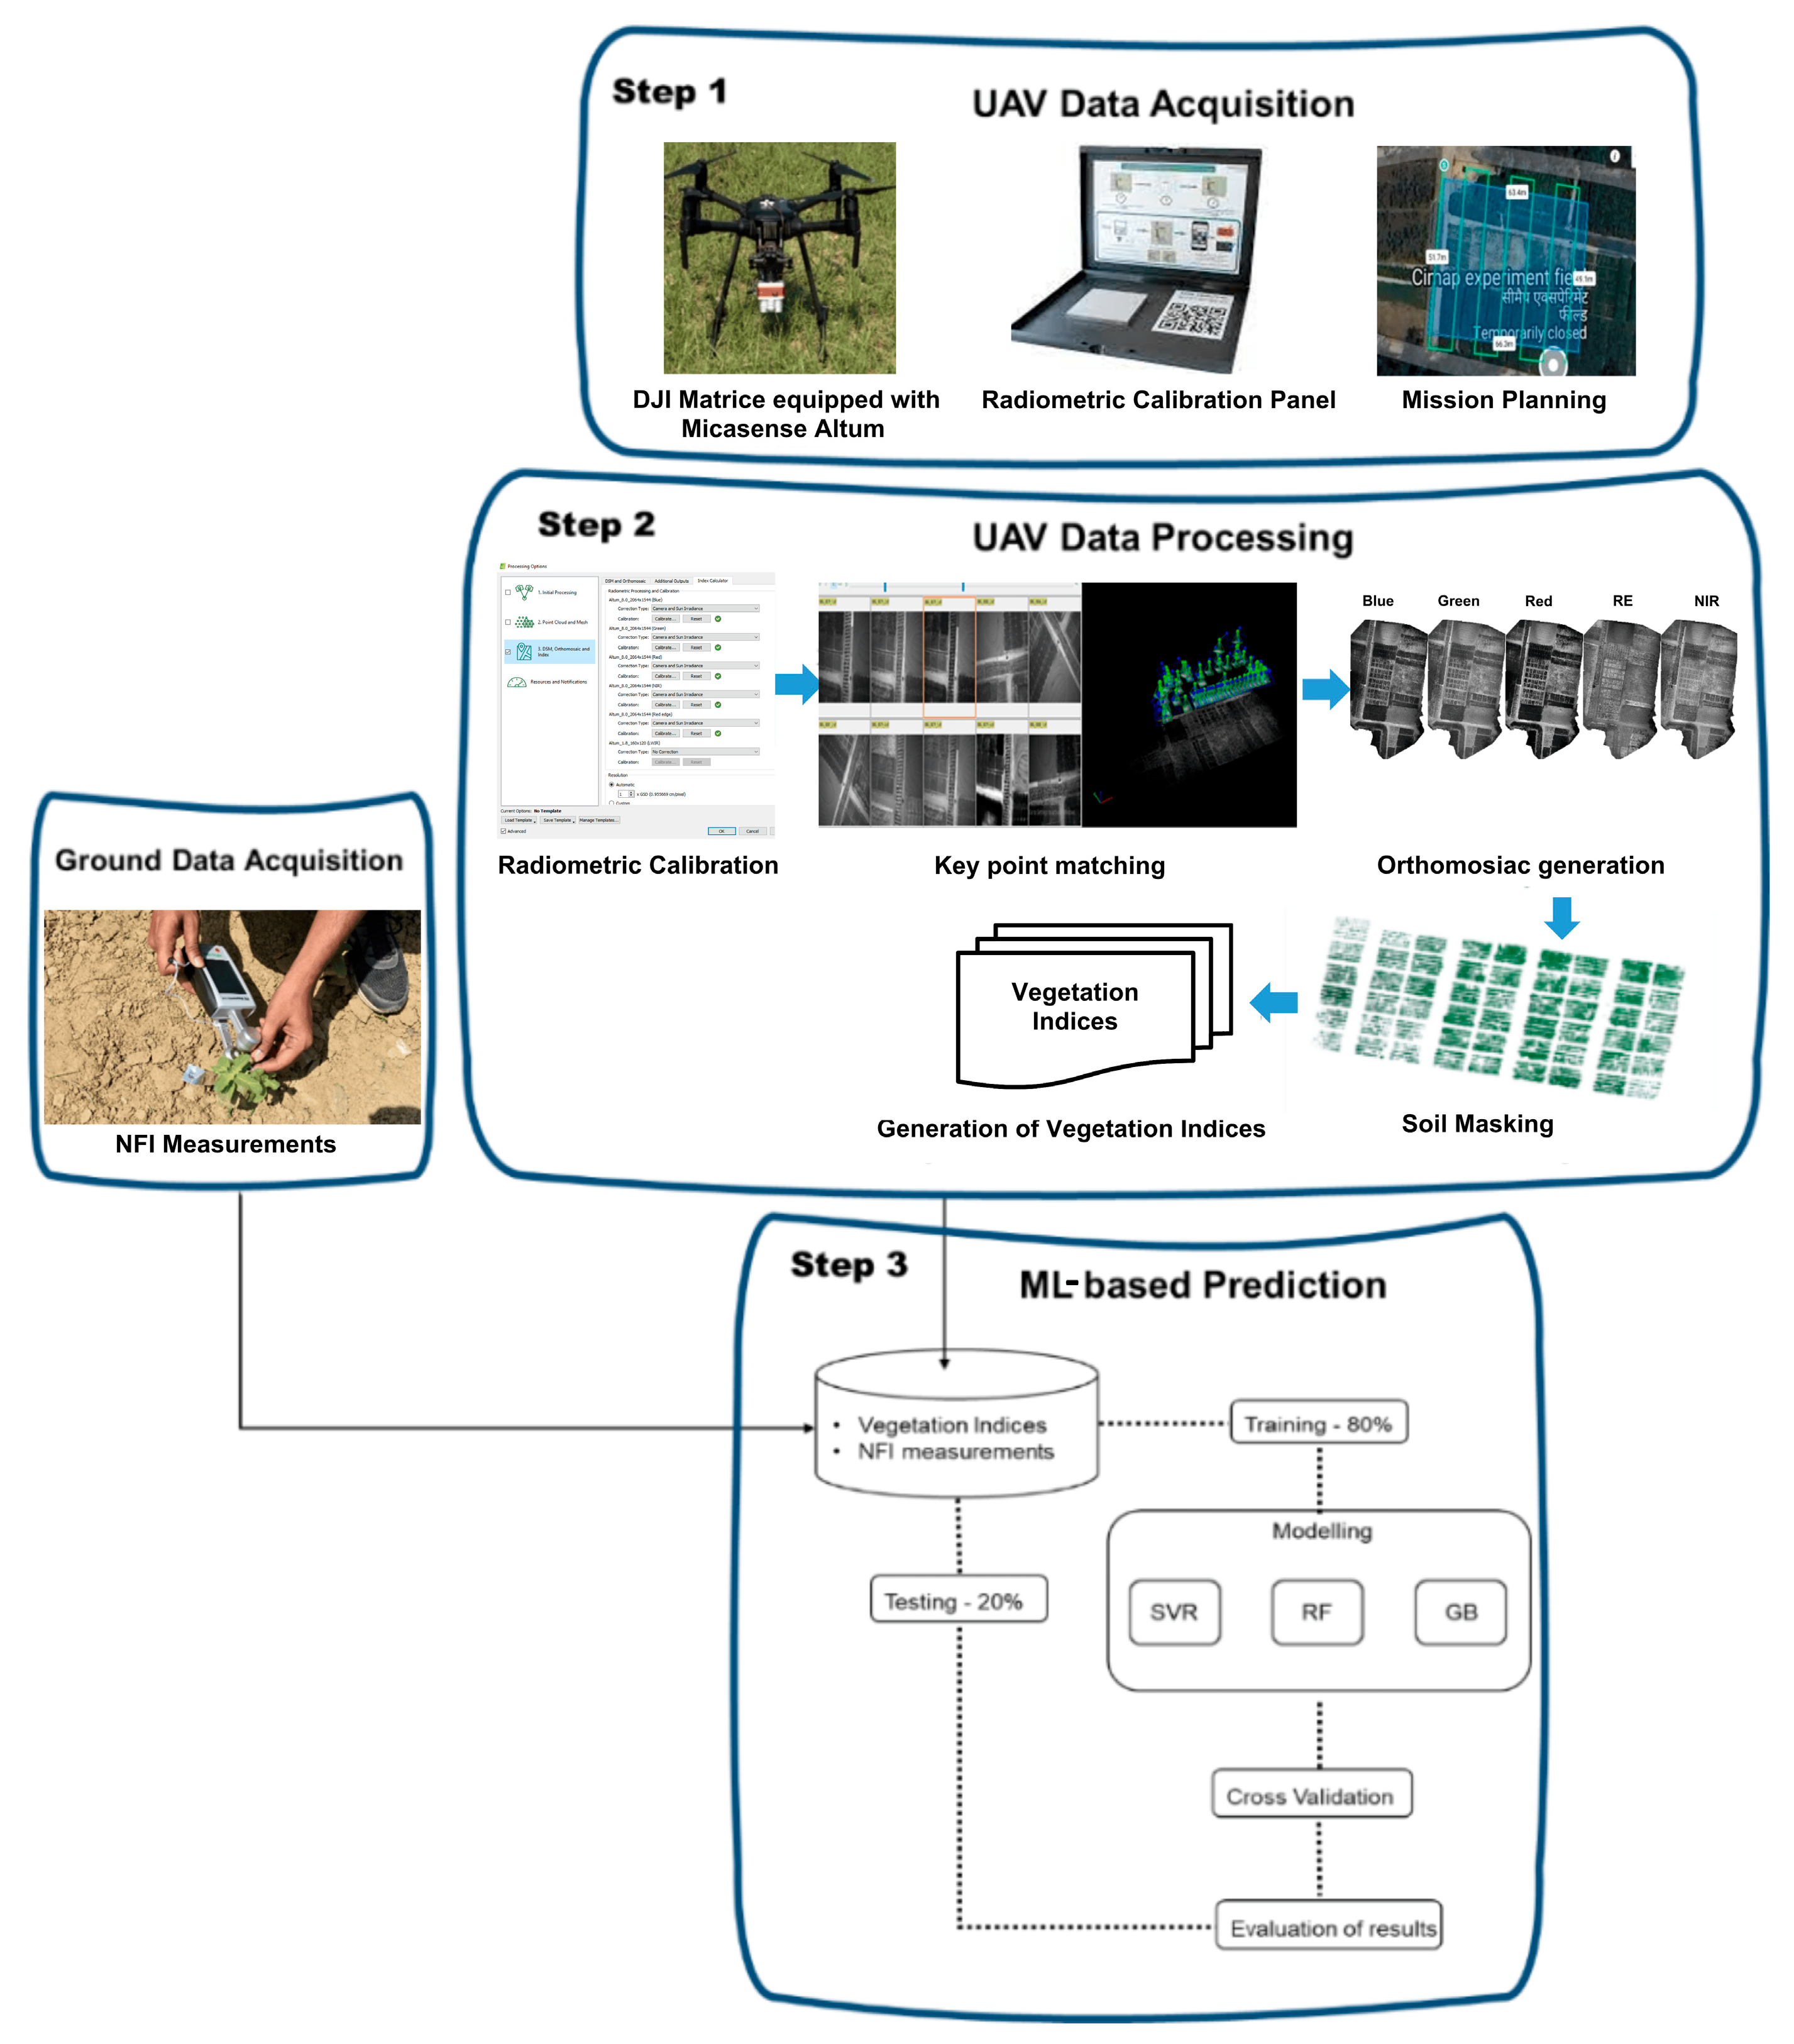
2.2. UAV Data Acquisition

Aerial data acquisition was performed using a DJI Matrice 200 UAV (DJI Inc., Shenzhen, China) equipped with a MicaSense Altum (MicaSense Inc., Seattle, WA, USA) multispectral sensor and a downwelling light sensor (DLS) (MicaSense Inc., Seattle, WA, USA). The Altum sensor captures imagery across five discrete spectral bands: blue (475 nm), green (560 nm), red (668 nm), red edge (717 nm), and near-infrared (842 nm). All flights were conducted between 10:00 AM and 12:00 PM local time to ensure stable solar illumination and minimize shadow effects. Flights were conducted at a constant altitude of 30 meters above ground level. A single-grid flight plan was created using Pix4Dcapture 4.10 (Pix4D SA, Lausanne, Switzerland), maintaining 80% forward and lateral overlap to ensure complete coverage and facilitate accurate image stitching and 3D reconstruction. Radiometric calibration was performed using MicaSense reflectance calibration panels, imaged immediately before and after each flight [20]. Figure 2 shows the methodology flow of the data acquisition, processing, and modeling of NFI prediction.
To capture the temporal dynamics of the Nitrogen Flavanol Index (NFI) across the growth cycle of Mentha arvensis, six UAV flights were conducted at regular 15-day intervals. Table 1 provides the dates of each UAV mission along with the corresponding days after planting (DAP), spanning from 15 to 90 DAP. This temporal resolution enabled the assessment of nitrogen variability at critical crop growth stages.

2.3. UAV Data Processing

Post-flight image processing was carried out using Pix4D Mapper 4.8.1(Pix4D SA, Lausanne, Switzerland), The raw multispectral imagery was first radiometrically calibrated using the reflectance calibration panel images and DLS metadata. This step corrected for variations in ambient lighting and sensor-specific response. Subsequently, structure-from-motion (SfM) algorithms were applied to align the images and generate a dense point cloud. High-resolution orthomosaics were then generated for each spectral band by mosaicking the aligned images.
The resulting orthomosaics were used to compute the Excess Green Index (ExG); a threshold value of 0.1 was applied to the ExG output to discriminate between vegetative canopy and non-vegetative background elements such as soil and shadows. This threshold was empirically determined through iterative testing and visual inspection of ExG-classified images across multiple plots and growth stages. Specifically, a range of threshold values (0.05 to 0.25) was initially explored, and 0.1 consistently yielded the most accurate segmentation of the canopy, minimizing false positives from soil and artifacts while retaining true vegetation pixels. A binary mask was created, which was used to mask the orthomosaic to only keep canopy pixels for further analysis.

2.4. Calculation of Vegetation Indices

A total of 25 vegetation indices (VIs) associated with chlorophyll content and nitrogen status were computed from UAV-based multispectral imagery (Table 2). These indices were selected based on their relevance to vegetation monitoring and validation in previous studies. All VIs were calculated using canopy-masked orthomosaics to exclude non-vegetative areas, ensuring index values represented only crop pixels. The indices were computed in ArcGIS Pro 3.1.7, and mean VI values for each experimental plot were extracted using the “Zonal Statistics as Table” option in ArcGIS Pro for subsequent analysis.

2.5. Ground Truth Data Collection

Ground truth data for the Nitrogen Flavanol Index (NFI) was collected immediately after UAV image acquisition across all 56 experimental plots. In each plot, ten plants were randomly selected to ensure spatial representativeness. For consistency, the third fully expanded leaf from the apical meristem was chosen from each plant, minimizing physiological variation within and between plants. NFI measurements were obtained using a handheld portable sensor (MPM-100, ADC Bioscientific Ltd., Hoddesdon, UK). The ten measurements per plot were averaged to produce a single representative NFI value, which was later used for validating UAV-derived vegetation indices and for model calibration.

2.6. Machine Learning Model Development

The models were developed and implemented using the programming language Python 3.12.2 on Jupyter Notebook 7.2.2. Key libraries used were scikit-learn for model implementation and performance evaluation, numpy and pandas for data processing, and matplotlib and seaborn for data visualization. The dataset was randomly split into training and testing subsets using an 80:20 ratio. For the individual crop growth stage, 56 samples were included. The combined dataset, formed by aggregating all six growth stages (15, 30, 45, 60, 75, and 90 DAP), consisted of a total of 336 samples. To predict the Nitrogen Flavanol Index (NFI), three supervised machine learning algorithms were implemented: Support Vector Regression, Random Forest Regression, and Gradient Boosting Regression (GBR). These algorithms were selected based on their proven effectiveness in modeling complex, nonlinear relationships, particularly in remote sensing and agricultural research. The model development workflow included feature selection, model training, hyperparameter tuning, and performance evaluation to ensure high predictive accuracy and reliability. Model hyperparameters were optimized using Grid Search with 5-fold cross-validation. For SVR, the parameters included a radial basis function (RBF) kernel, regularization parameter (C) values of 0.1, 1, and 10, and epsilon values of 0.1 and 0.2. Random Forest models were tuned using 100 to 200 trees, with maximum depth values of none, 10, and 20, and minimum samples split values of 2 and 5. For GBR, the learning rate ranged from 0.01 to 0.1, with 100 to 200 estimators and maximum depths of 3 and 5, which helps in avoiding overfitting.

2.6.1. Support Vector Regression

SVR is a machine learning technique based on Support Vector Machine principles, designed for regression tasks. Unlike traditional regression models that minimize the sum of squared errors, SVR seeks to find an optimal function that predicts target values within a specified ε-tolerance margin. The core objective is to identify a hyperplane that best fits the data while maintaining robustness against noise and outliers. SVR utilizes kernel functions, such as the radial basis function (RBF), to map input features into higher-dimensional spaces, thereby capturing complex nonlinear relationships between spectral indices and NFI values. Key hyperparameters, including the regularization parameter (C), the ε-insensitive loss function, and the kernel type, were optimized using grid search and cross-validation techniques to maximize model accuracy.

2.6.2. Random Forest Regression

Random Forest is an ensemble learning method that constructs multiple decision trees and aggregates their outputs to improve prediction accuracy and mitigate overfitting. Each decision tree is trained on a random subset of the data using bootstrap aggregation (bagging). Final predictions are obtained by averaging the outputs of all trees, resulting in a robust and stable regression model. RF is particularly effective for high-dimensional datasets involving multiple vegetation indices and spectral features. Furthermore, RF provides an inherent measure of feature importance, allowing the identification of the most influential predictors for NFI estimation. Hyperparameters, including the number of trees (n_estimators), maximum tree depth (max_depth), and minimum samples per split (min_samples_split), were fine-tuned using grid search and k-fold cross-validation to achieve optimal model performance.

2.6.3. Gradient Boosting Regression

Gradient Boosting Regression is another ensemble learning approach that builds models sequentially, where each subsequent tree focuses on correcting the residual errors of previous trees. Unlike RF, which builds independent trees, GBR applies gradient descent optimization to minimize the prediction error iteratively. GBR assigns higher weights to misclassified samples in each iteration, making it particularly effective for datasets with subtle variations in nitrogen content. However, GBR is prone to overfitting if not properly regularized. To prevent overfitting, key hyperparameters such as the learning rate (shrinkage), number of estimators, and maximum depth were optimized using cross-validation. A learning rate between 0.01 and 0.1 provided the best trade-off between bias and variance.

2.6.4. Selection of Predictor Variables

The predictor variables used for each machine learning model (SVR, RF, and GBR) comprised vegetation indices (VIs) derived from UAV-based multispectral imagery (Table 2). Vegetation indices mathematically combine spectral bands through ratios, differences, or normalization techniques, effectively minimizing confounding effects caused by soil background, variable illumination, and canopy structural variation, thereby providing more robust proxies for physiological and biochemical traits relevant to nitrogen estimation.
Strong Pearson correlation coefficients were observed between the Nitrogen Flavanol Index (NFI) and multiple VIs, confirming their utility as predictors. However, because many indices share common spectral bands, considerable multi-collinearity was detected among them. High multi-collinearity can introduce redundancy, inflate model variance, and diminish generalization performance. To mitigate this, Recursive Feature Elimination (RFE) was employed to identify the most informative subset of predictors. RFE iteratively constructs models, ranks feature importance, and systematically removes the least relevant variables at each step; based on this process, the top ten most important VIs were selected and used as input variables for each machine learning model (RF, SVR, and GB).

2.6.5. Model Performance

The performance of SVR, RF, and GBR models in estimating the NFI was evaluated using three statistical metrics: the coefficient of determination (R2) and root mean square error (RMSE). Models achieving higher R2 values and a lower RMSE were considered more accurate and reliable. The best-performing model was selected based on achieving the lowest RMSE and a high R2, indicating strong predictive capacity for NFI estimation in Mentha arvensis.

3. Results

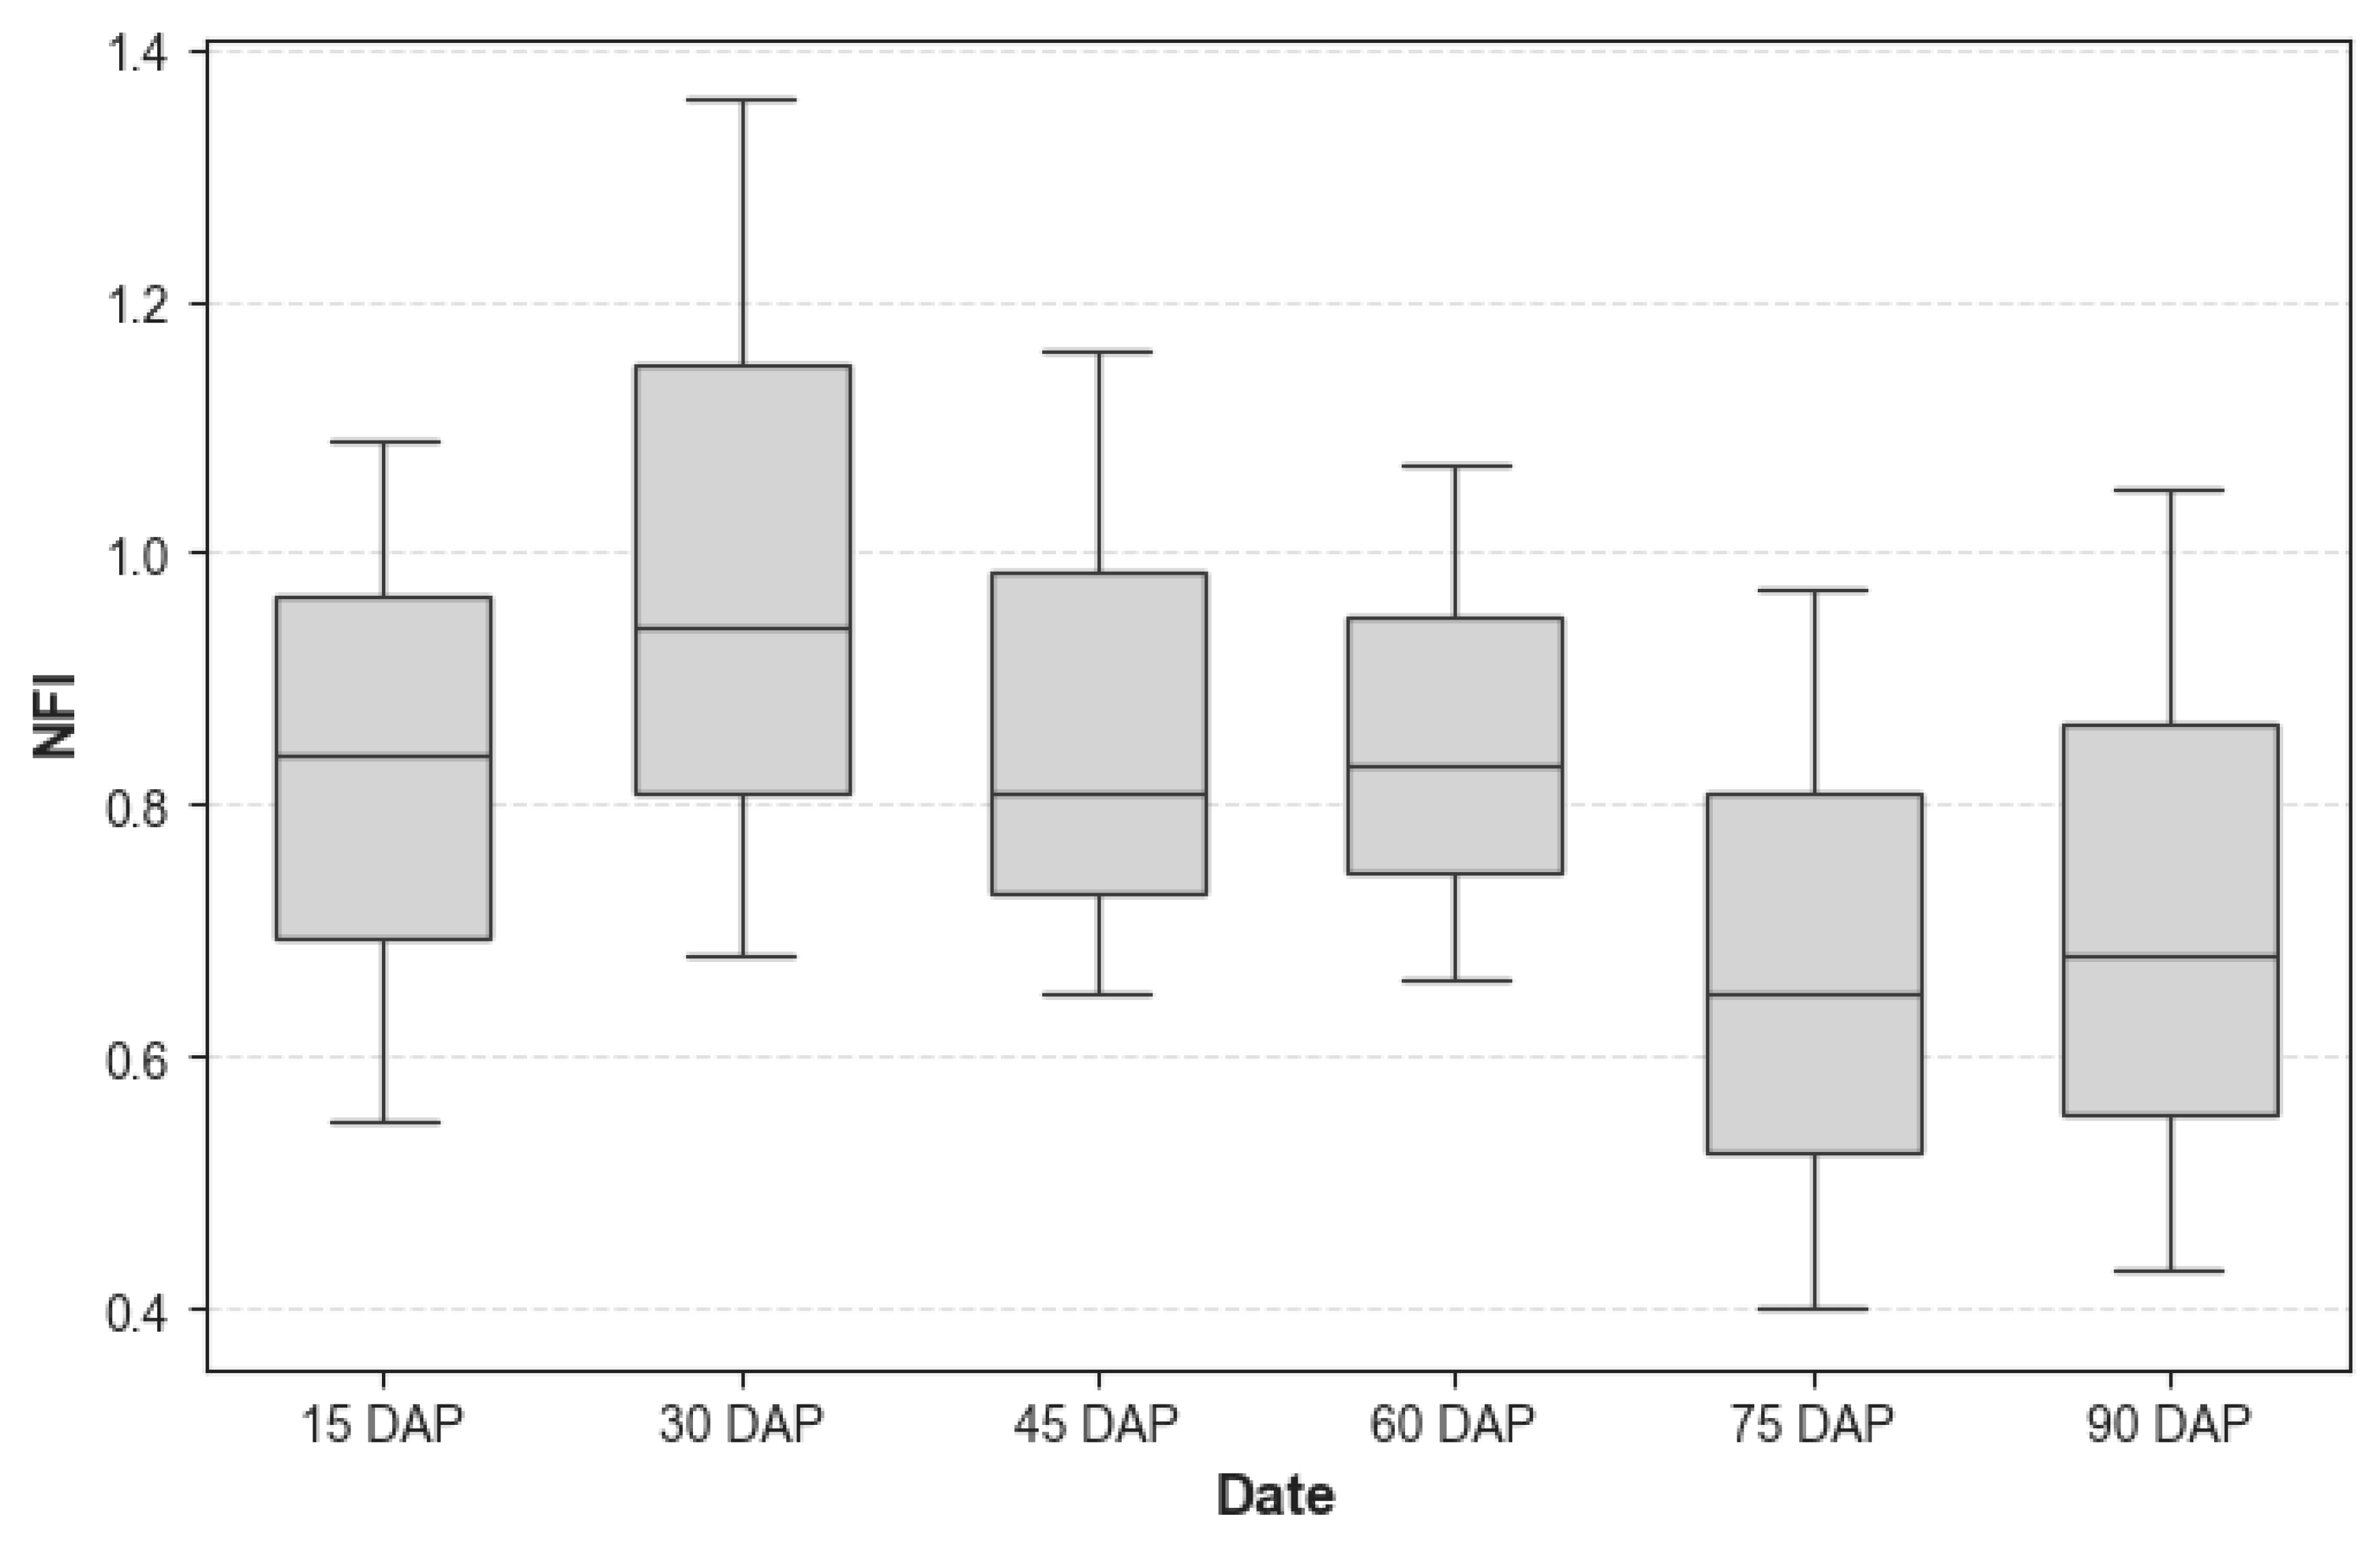
3.1. Variation in NFI Content During Different Growth Stage

The Nitrogen Flavanol Index (NFI) varied significantly across the growth stages of Mentha arvensis. Figure 3 shows the variation at different growth stages: At 15 DAP, NFI values were moderate, reflecting limited nitrogen uptake during early plant establishment. By 30 DAP, the NFI reached its peak, indicating vigorous vegetative growth and high nitrogen demand. After 45 DAP, NFI values began to decline as the plant transitioned from vegetative to reproductive stages, shifting nitrogen allocation toward biomass and reproductive structures. Between 60 and 75 DAP, the NFI stabilized, suggesting reduced nitrogen uptake. At 90 DAP, the NFI reached its lowest level, consistent with the onset of senescence.

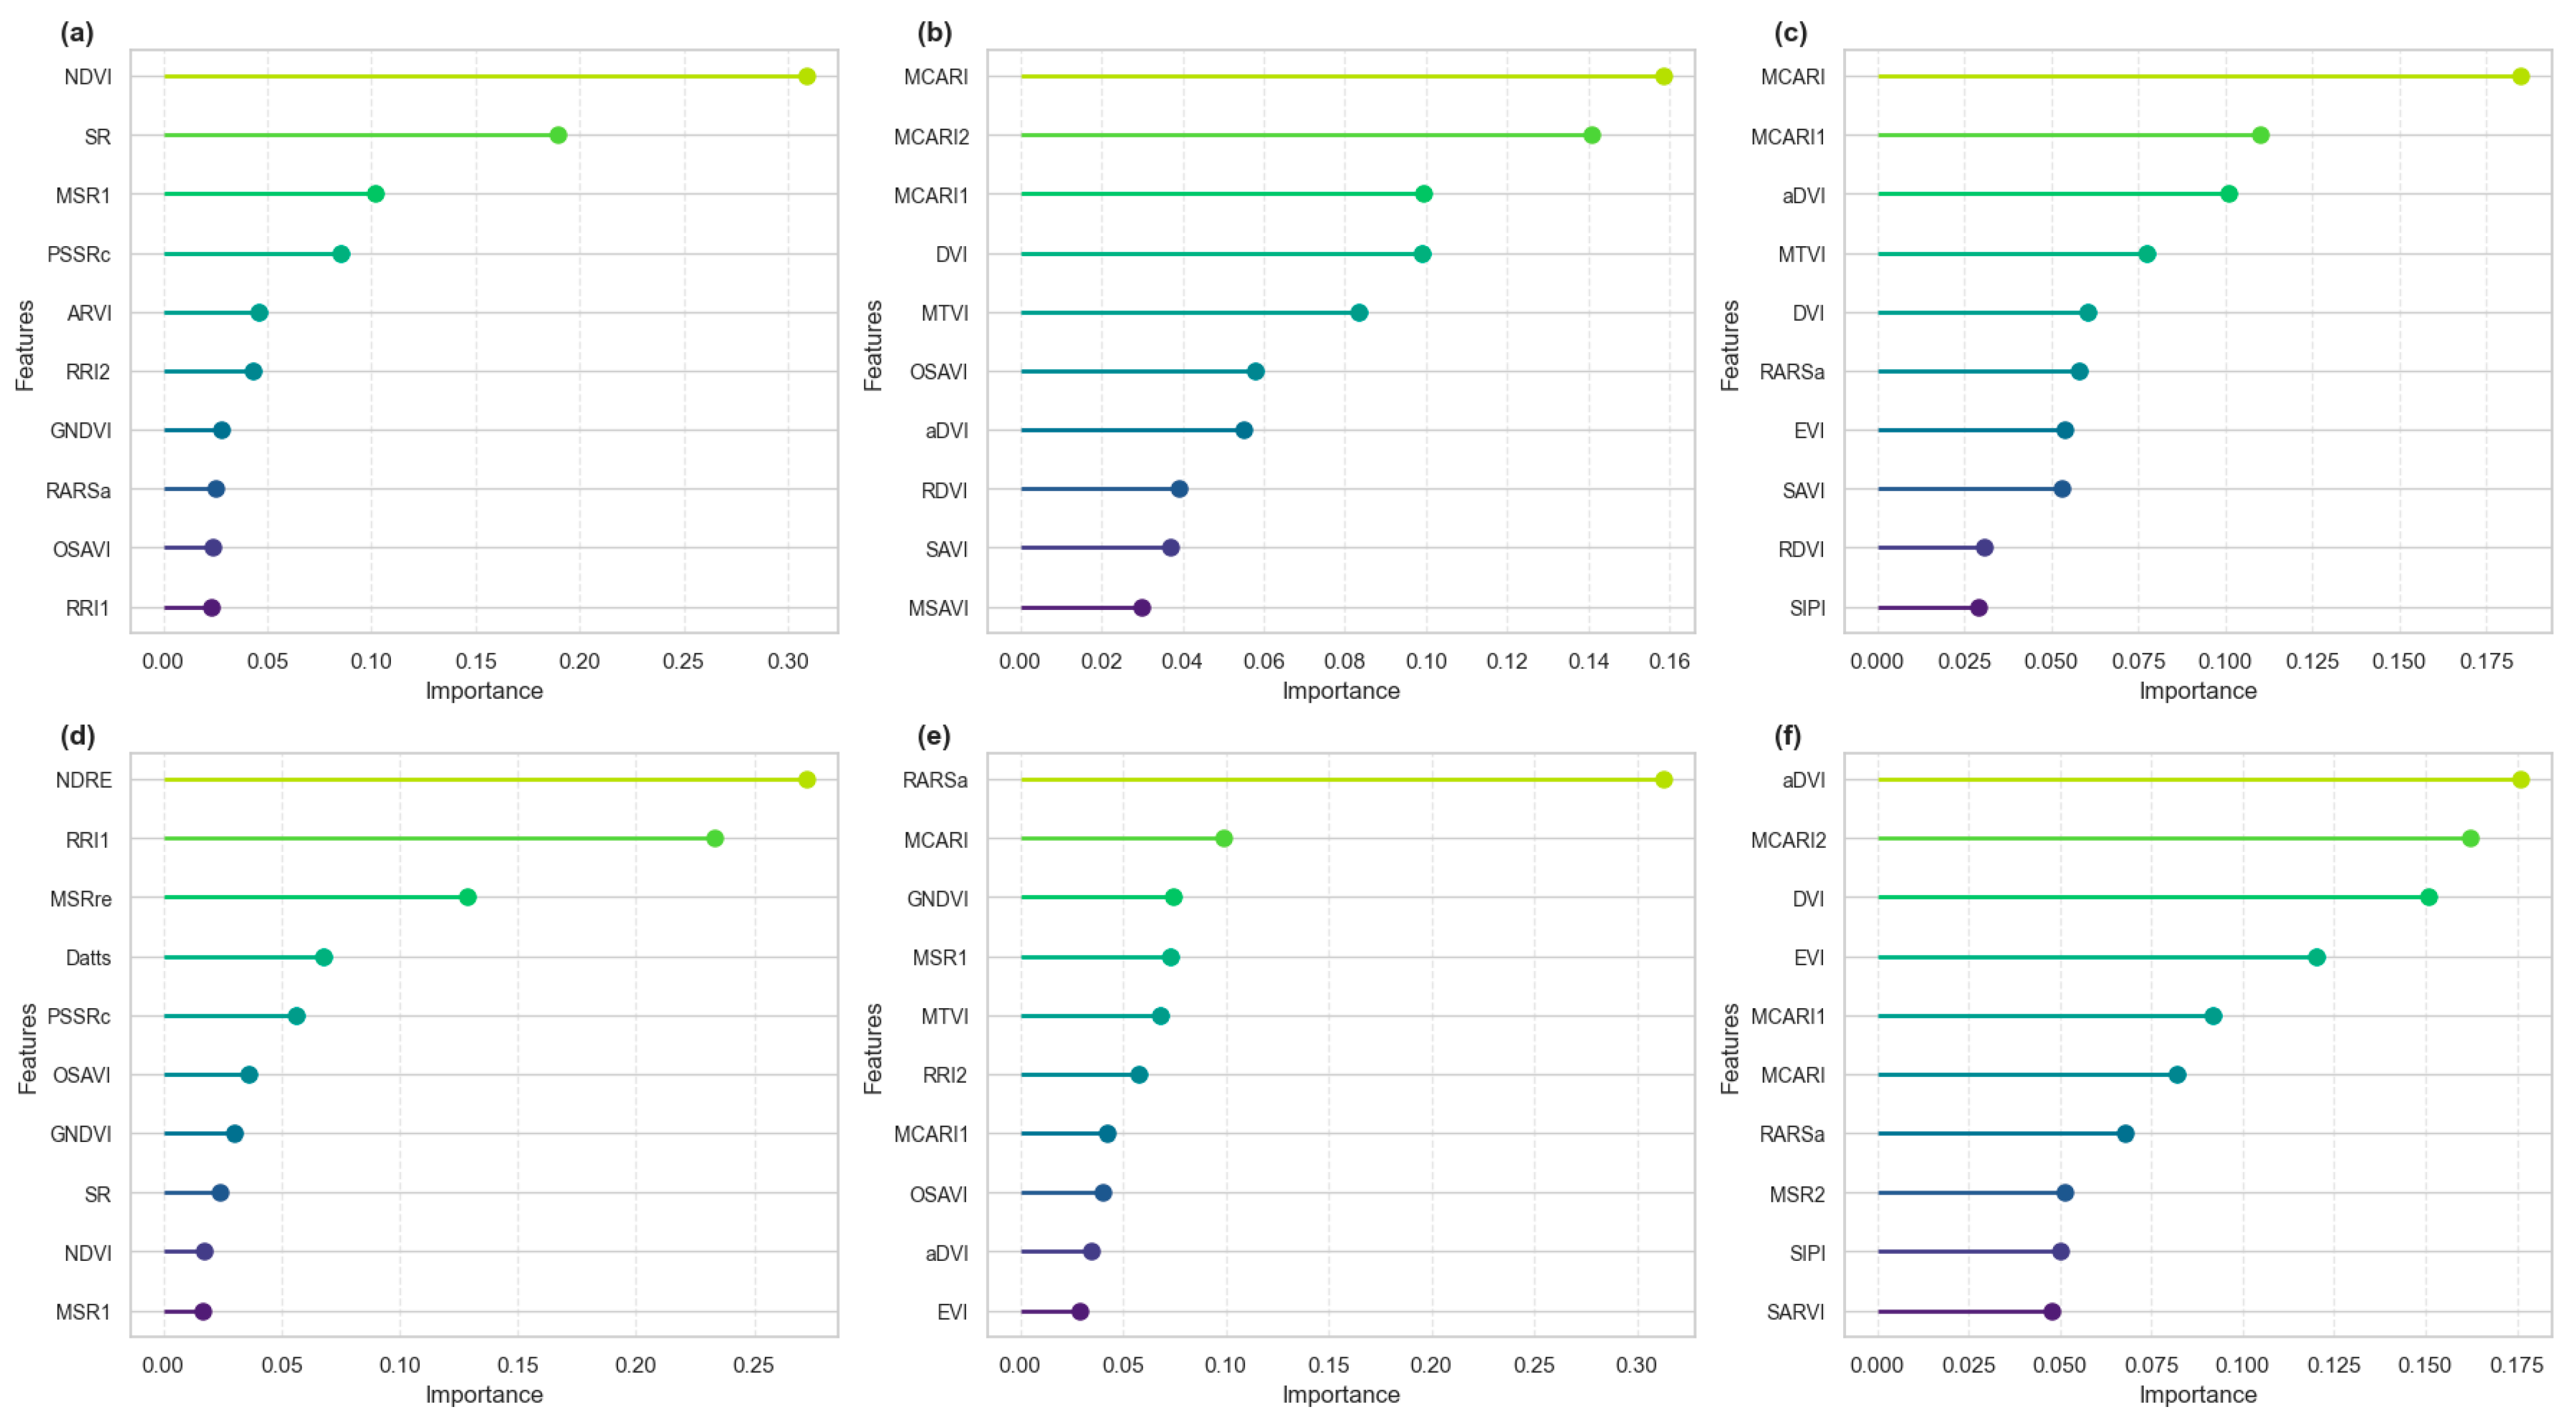
3.2. Feature Selection

Recursive Feature Elimination (RFE) was conducted at individual growth stages 15, 30, 45, 60, 75, and 90 DAP as well as on a combined dataset encompassing all time points to identify the most influential vegetation indices for estimating the Nitrogen Flavanol Index (NFI). Figure 4 shows feature importance across different growth stages. At 15 DAP, the NDVI exhibited the highest importance, followed by SR and MSR1. By 30 DAP, the MCARI, M CARI2, and MCARI1 emerged as the most significant indices. At 45 DAP, MCARI indices continued to be the most influential, with increasing contributions from RARS. By 60 DAP, NDRE surpassed the MCARI and NDVI. At 75 DAP, RARS3 exhibited the highest feature importance, followed by MCARI and GNDVI indices. By 90 DAP, the aDVI and MCARI contributed most, while the EVI, MCARI3, and MTVI gained prominence.

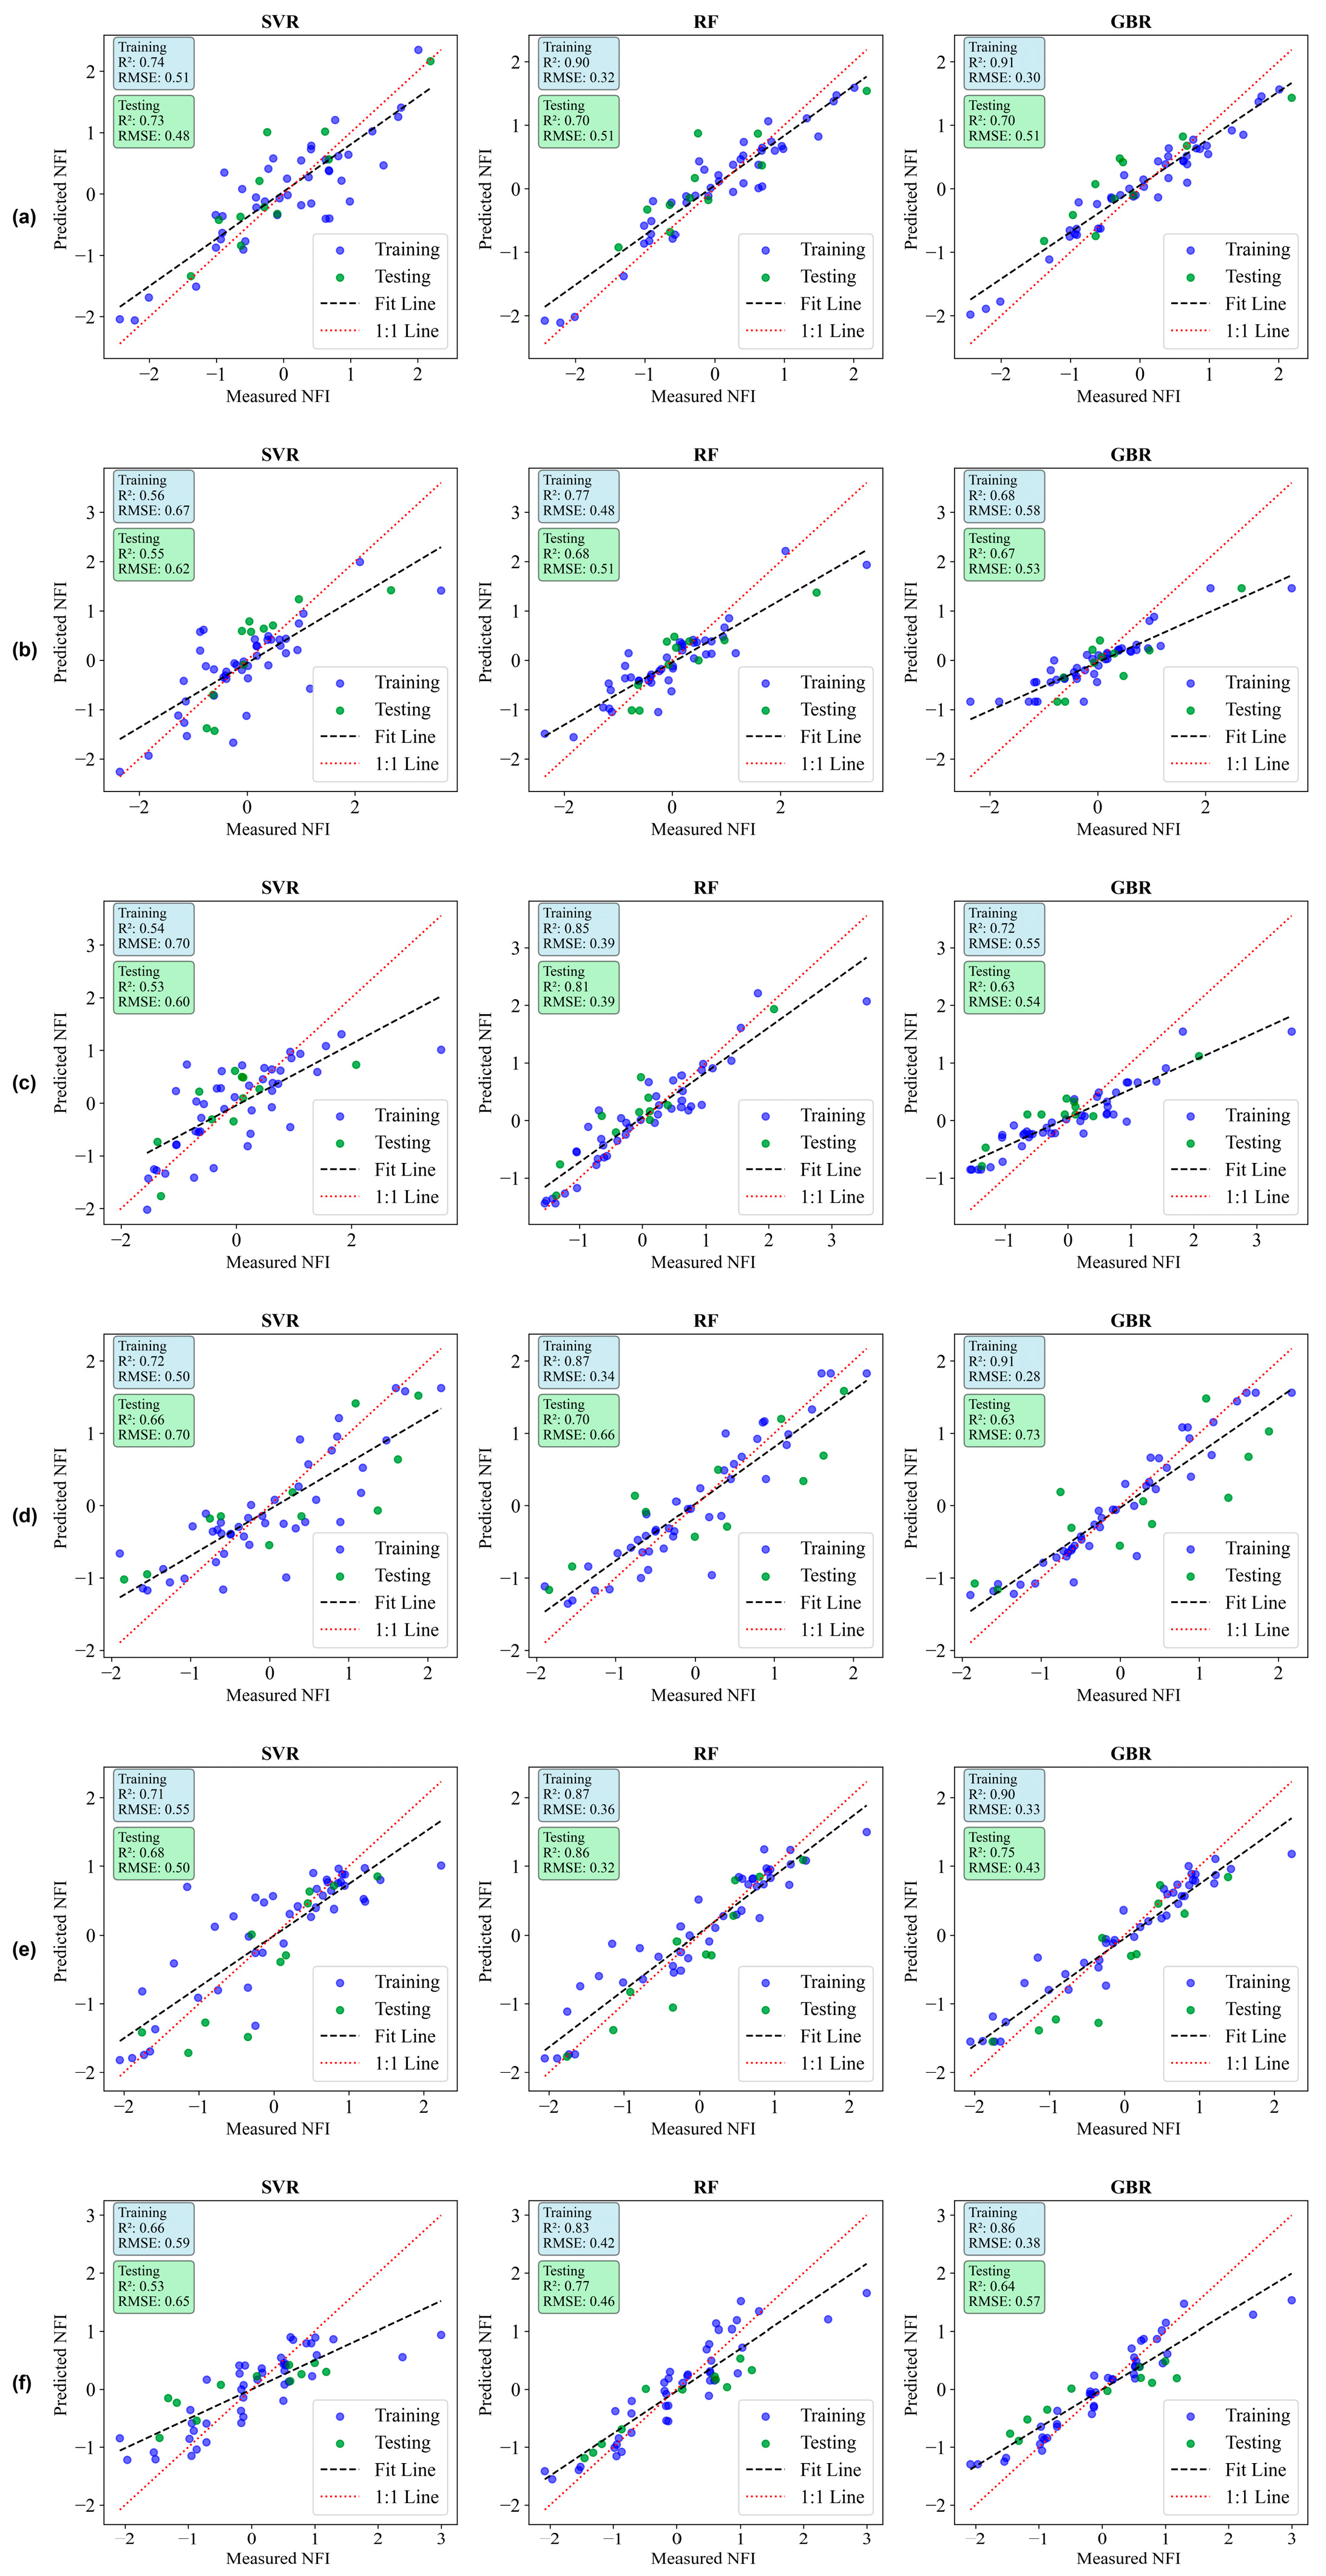
3.3. Model Evaluation

The performance of Support Vector Regression, Random Forest, and Gradient Boosting models varied across different crop growth stages based on R2 and RMSE values. At 15 DAP, Random Forest and Gradient Boosting achieved high training R2 values of 0.90 and 0.91, respectively, but their test R2 dropped to 0.70, with an RMSE of 0.51, indicating overfitting. Support Vector Regression performed more consistently, with a training R2 of 0.74, a test R2 of 0.73, and RMSE values of 0.51 for training and 0.48 for testing. At 30 DAP, Random Forest exhibited the best generalization ability with a test R2 of 0.68 and RMSE of 0.51, followed by Gradient Boosting with a test R2 of 0.67 and RMSE of 0.53. Support Vector Regression showed a lower test R2 of 0.55 and RMSE of 0.62. At 45 DAP, Random Forest achieved the highest test R2 of 0.81 with the lowest RMSE of 0.39, making it the most accurate model, while Gradient Boosting had a test R2 of 0.63 and RMSE of 0.54. Support Vector Regression had the lowest test R2 of 0.53 and the highest RMSE of 0.60, indicating lower predictive accuracy. At 60 DAP, Random Forest maintained strong performance with a test R2 of 0.70 and RMSE of 0.66, while Gradient Boosting and Support Vector Regression had lower test R2 values of 0.63 and 0.66, respectively, with RMSE values above 0.70. At 75 DAP, Random Forest remained the best-performing model with a test R2 of 0.86 and the lowest RMSE of 0.32, followed by Gradient Boosting with a test R2 of 0.75 and RMSE of 0.43. Support Vector Regression showed moderate accuracy with a test R2 of 0.68 and RMSE of 0.50. At 90 DAP, Random Forest retained the highest test R2 of 0.77 and RMSE of 0.46, whereas Gradient Boosting and Support Vector Regression exhibited lower test R2 values of 0.64 and 0.53, with RMSE values of 0.57 and 0.65, respectively. These results indicate that Random Forest consistently outperformed the other models, particularly from mid to late growth stages, achieving the highest R2 values and the lowest RMSE, making it the most reliable model for nitrogen estimation in crops. The performance of the models across all growth stages is summarized in Table 3, while Figure 5 presents scatter plots illustrating the relationship between predicted and actual NFI values.
The model was assessed for all crop growth stages combined (Figure 6). RF achieved the highest test performance with an R2 of 0.70 and an RMSE of 0.09, followed by GBR with an R2 of 0.67 and an RMSE of 0.10. Support Vector Regression (SVR) had the lowest test accuracy, with an R2 of 0.61 and the highest RMSE of 0.11, indicating higher prediction errors than RF and GB.

4. Discussion

4.1. Feature Selection and Vegetation Indices’ Contribution Across Growth Stages

RFE analysis highlighted distinct vegetation indices (VIs) contributing to NFI estimation at different growth stages. In the early stages (15–30 DAP), the NDVI, SR, and MCARI showed the highest feature importance, consistent with previous findings that simple ratio-based indices like the NDVI effectively detect early nitrogen stress when the canopy is not yet fully developed. For example, Rehman et al. demonstrated that the NDVI is a reliable indicator of nitrogen status and grain yield potential in rice during early vegetative growth [41]. Similarly, Boiarskii and Hasegawa compared the NDVI and NDRE and found that the NDVI is more sensitive to chlorophyll and biomass variation at earlier stages when the canopy is sparse [42].
As the crop matured (45–90 DAP), MCARI variants and RARSa indices emerged as dominant predictors. The MCARI, which accounts for chlorophyll content and leaf structure variations, has been previously validated as a reliable nitrogen-sensitive index [33,39]. Our study further confirms its robustness, particularly at 45 and 75 DAP, when plant nitrogen uptake reaches its peak. The increased importance of RARsa at 75 DAP suggests that red-edge-based indices become more effective as canopy complexity increases. In 90 DAP, the contribution of the aDVI and MCARI3 further increased, indicating that advanced indices incorporating both chlorophyll and structural features provide enhanced predictive capability at maturity. These results suggest that growth-stage-specific feature selection is crucial for optimizing nitrogen estimation models, rather than relying on a single index across all stages.

4.2. Model Performance and Variability Across Growth Stages

Machine learning models exhibited varying prediction performance across crop growth stages, with the Random Forest (RF) algorithm consistently outperforming Support Vector Regression (SVR) and Gradient Boosting (GB). This variability suggests that each model’s generalization capability is strongly influenced by the crop phenological development and the stability of its spectral reflectance patterns.
During the early growth stages (15–30 days after planting, DAP), all models achieved relatively lower test R2 values due to limited spectral contrast between nitrogen-deficient and nitrogen-sufficient plants when the canopy is still sparse. Among them, RF achieved the best performance, with a test R2 of 0.70 at 15 DAP and 0.68 at 30 DAP.
At mid-growth stages (45–60 DAP), RF performance improved significantly, reaching a test R2 of 0.81 at 45 DAP. This stage corresponds to the period of vigorous nitrogen uptake and maximum chlorophyll accumulation. In contrast, GB achieved moderate accuracy (R2 = 0.63 at 45 DAP) but exhibited signs of overfitting, indicated by a higher training R2 relative to the test R2. This behavior aligns with the analysis by Gianquinto et al., who emphasized the challenge of maintaining model generalizability when nitrogen status interacts with rapidly changing canopy structure [43].
At later growth stages (75–90 DAP), RF maintained superior predictive performance, achieving its highest test R2 (0.86) and lowest RMSE (0.32) at 75 DAP. This period coincides with substantial biomass accumulation and the onset of leaf senescence, conditions that enhance the spectral distinctions related to nitrogen availability. A comparable trend was demonstrated by Chiu and Wang, who reported that RF-based models effectively captured biomass variation and nitrogen status in winter wheat using UAV multispectral data during advanced growth phases [44].
When all growth stages were combined into a single model, RF still demonstrated robust performance, with a test R2 of 0.70 and an RMSE of 0.09, indicating its strong generalization across varying canopy conditions and nitrogen levels. This outcome is consistent with the results of Lu et al., who developed an RF-based in-season nitrogen diagnosis framework for rice that remained accurate across different nitrogen application rates and phenological stages, confirming the model’s reliability for large-scale, site-specific nitrogen management [45].
This study presents a promising approach for predicting the Nitrogen Flavanol Index (NFI) using UAV-based multispectral vegetation indices, offering a non-destructive, scalable alternative to traditional field-based nitrogen estimation methods. By identifying growth-stage-specific vegetation indices, this study enhances the timeliness of nitrogen assessment, which is critical for optimizing fertilizer application, improving yield potential, and maintaining long-term soil health. These findings are particularly relevant for precision agriculture in aromatic crops such as Mentha arvensis, where nitrogen levels directly influence essential oil productivity. It is important to acknowledge, however, that the model was developed and validated using data from a single location and cropping season, which may limit its generalizability across different environmental conditions and management practices. As such, this study was developed as a proof of concept, demonstrating the feasibility and potential of UAV- and ML-based non-invasive NFI prediction for Mentha arvensis. Future research should focus on multi-location, multi-season validation of the proposed models to assess their robustness under diverse agro-climatic and soil conditions. Moreover, the integration of hyperspectral data for finer spectral resolution and the inclusion of real-time variables such as soil moisture, temperature, and irrigation history can further improve nitrogen estimation accuracy. The development of automated decision-support tools based on such enriched models could support real-time, site-specific nitrogen recommendations, promoting sustainable and data-driven nitrogen management practices in aromatic crop systems.

5. Conclusions

This study demonstrates the feasibility of integrating UAV-derived multispectral vegetation indices with machine learning models to estimate the Nitrogen Flavanol Index (NFI) in Mentha arvensis across different growth stages. By evaluating 25 chlorophyll- and nitrogen-sensitive vegetation indices and applying recursive feature elimination, the most relevant predictors for each stage were identified, improving estimation accuracy. Among the tested models, Random Forest consistently provided the best performance, especially during mid to late growth stages when nitrogen dynamics are most pronounced. The results confirm that stage-specific selection of vegetation indices enhances model reliability compared to static approaches. This framework fulfills the research objective by offering, for the first time, a scalable, non-destructive method for growth-stage-specific nitrogen monitoring in an aromatic crop. Adoption of this approach can inform more precise nitrogen management, optimize fertilizer use, and support sustainable menthol mint cultivation, ultimately benefiting smallholder farmers and the essential oil industry.

Author Contributions

Conceptualization, M.S. and N.P.; methodology, M.S. and B.G.; software, M.S., B.G., and Z.Z.; validation, N.P., A.S., and N.S.; formal analysis, M.S. and B.G.; investigation, M.S., N.P., B.G., and Z.Z.; resources, M.S.; data curation, N.P., A.S., and N.S.; writing—original draft preparation, B.G. and M.S.; writing—review and editing, M.S. and N.P.; visualization, Z.Z. and B.G.; supervision, M.S.; project administration, M.S.; funding acquisition, M.S. All authors have read and agreed to the published version of the manuscript.

Funding

This research was funded by Region-specific smart agro technologies for enhancing soil plant health (RSSA) (HCP-057).

Data Availability Statement

Data will be made available on request to corresponding author.

Acknowledgments

We are grateful to the Director, CSIR-CIMAP, for constant support and to CSIR New Delhi, India, for financial assistance from the mission project entitled, “Region Specific Smart Agro technologies for enhancing soil plant health (RSSA)-HCP-057”. The institutional communication number of this article is CIMAP/Pub/2025/62.

Conflicts of Interest

The authors declare that they have no conflicts of interest that could influence the work reported in this paper.

Abbreviations

The following abbreviations are used in this manuscript:
UAVUnmanned Aerial Vehicle
NFINitrogen Flavanol Index
DAPDays After Planting
VIVegetation Index
VIsVegetation Indices
RGBRed–Green–Blue
DLSDownwelling Light Sensor
SfMStructure-from-Motion
GISGeographic Information System
RFERecursive Feature Elimination
SVRSupport Vector Regression
RFRandom Forest
GBRGradient Boosting Regression
SRSimple Ratio
NDVINormalized Difference Vegetation Index
RDVIRenormalized Difference Vegetation Index
ARVIAtmospherically Resistant Vegetation Index
MSR1Modified Simple Ratio 1
MSR2Modified Simple Ratio 2
DVIDifference Vegetation Index
SAVISoil Adjusted Vegetation Index
OSAVIOptimized Soil-Adjusted Vegetation Index
MSAVIModified Soil-Adjusted Vegetation Index
SARVISoil and Atmosphere Resistant Vegetation Index
EVIEnhanced Vegetation Index
NDRENormalized Difference Red Edge Index
RRI1Red Edge Ratio Index 1
RRI2Red Edge Ratio Index 2
MCARIModified Chlorophyll Absorption Ratio Index
MCARI1Modified Chlorophyll Absorption Ratio Index 1
MCARI2Modified Chlorophyll Absorption Ratio Index 2
MTVIModified Triangular Vegetation Index
Datt IndexDatt Index
aDVIAdjusted Difference Vegetation Index
GNDVIGreen Normalized Difference Vegetation Index
PSSRcPigment-Specific Simple Ratio for Carotenoids
RARSaRatio Analysis of Reflectance Spectra for Chlorophyll a
SIPIStructure-Insensitive Pigment Index

References

  1. Pinter, P.J., Jr.; Hatfield, J.L.; Schepers, J.S.; Barnes, E.M.; Moran, M.S.; Daughtry, C.S.T.; Upchurch, D.R. Remote Sensing for Crop Management. Photogramm. Eng. Remote Sens. 2003, 69, 647–664. [Google Scholar] [CrossRef]
  2. Novoa, R.; Loomis, R.S. Nitrogen and Plant Production. Plant Soil. 1981, 58, 177–204. [Google Scholar] [CrossRef]
  3. Evans, J.R. Photosynthesis and Nitrogen Relationships in Leaves of C3 Plants. Oecologia 1989, 78, 9–19. [Google Scholar] [CrossRef]
  4. Watson, M.E.; Galliher, T.L. Comparison of Dumas and Kjeldahl Methods with Automatic Analyzers on Agricultural Samples under Routine Rapid Analysis Conditions. Commun. Soil. Sci. Plant Anal. 2001, 32, 2007–2019. [Google Scholar] [CrossRef]
  5. Ali, M.M.; Al-Ani, A.; Eamus, D.; Tan, D.K.Y. Leaf Nitrogen Determination Using Non-Destructive Techniques—A Review. J. Plant Nutr. 2017, 40, 928–953. [Google Scholar] [CrossRef]
  6. Bista, M.K.; Adhikari, B.; Sankarapillai, L.V.; Pieralisi, B.; Reddy, K.R.; Jenkins, J.; Bheemanahalli, R. Drought and Heat Stress Induce Differential Physiological and Agronomic Trait Responses in Cotton. Ind. Crops Prod. 2024, 222, 119540. [Google Scholar] [CrossRef]
  7. Goulas, Y.; Cerovic, Z.G.; Cartelat, A.; Moya, I. Dualex: A New Instrument for Field Measurements of Epidermal Ultraviolet Absorbance by Chlorophyll Fluorescence. Appl. Opt. 2004, 43, 4488–4496. [Google Scholar] [CrossRef]
  8. Cartelat, A.; Cerovic, Z.G.; Goulas, Y.; Meyer, S.; Lelarge, C.; Prioul, J.-L.; Barbottin, A.; Jeuffroy, M.-H.; Gate, P.; Agati, G. Optically Assessed Contents of Leaf Polyphenolics and Chlorophyll as Indicators of Nitrogen Deficiency in Wheat (Triticum aestivum L.). Field Crops Res. 2005, 91, 35–49. [Google Scholar] [CrossRef]
  9. Cerovic, Z.G.; Masdoumier, G.; Ghozlen, N.B.; Latouche, G. A New Optical Leaf-clip Meter for Simultaneous Non-destructive Assessment of Leaf Chlorophyll and Epidermal Flavonoids. Physiol. Plant 2012, 146, 251–260. [Google Scholar] [CrossRef]
  10. Cerovic, Z.G.; Ghozlen, N.B.; Milhade, C.; Obert, M.; Debuisson, S.; Moigne, M. Le Nondestructive Diagnostic Test for Nitrogen Nutrition of Grapevine (Vitis vinifera L.) Based on Dualex Leaf-Clip Measurements in the Field. J. Agric. Food Chem. 2015, 63, 3669–3680. [Google Scholar] [CrossRef]
  11. Fan, K.; Li, F.; Chen, X.; Li, Z.; Mulla, D.J. Nitrogen Balance Index Prediction of Winter Wheat by Canopy Hyperspectral Transformation and Machine Learning. Remote Sens. 2022, 14, 3504. [Google Scholar] [CrossRef]
  12. Khan, M.S.; Yadav, P.; Semwal, M.; Prasad, N.; Verma, R.K.; Kumar, D. Predicting Canopy Chlorophyll Concentration in Citronella Crop Using Machine Learning Algorithms and Spectral Vegetation Indices Derived from UAV Multispectral Imagery. Ind. Crops Prod. 2024, 219, 119147. [Google Scholar] [CrossRef]
  13. Qiao, L.; Tang, W.; Gao, D.; Zhao, R.; An, L.; Li, M.; Sun, H.; Song, D. UAV-Based Chlorophyll Content Estimation by Evaluating Vegetation Index Responses under Different Crop Coverages. Comput. Electron. Agric. 2022, 196, 106775. [Google Scholar] [CrossRef]
  14. Hansen, P.M.; Schjoerring, J.K. Reflectance Measurement of Canopy Biomass and Nitrogen Status in Wheat Crops Using Normalized Difference Vegetation Indices and Partial Least Squares Regression. Remote Sens. Environ. 2003, 86, 542–553. [Google Scholar] [CrossRef]
  15. Wiegand, C.L.; Richardson, A.J.; Escobar, D.E.; Gerbermann, A.H. Vegetation Indices in Crop Assessments. Remote Sens. Environ. 1991, 35, 105–119. [Google Scholar] [CrossRef]
  16. Chlingaryan, A.; Sukkarieh, S.; Whelan, B. Machine Learning Approaches for Crop Yield Prediction and Nitrogen Status Estimation in Precision Agriculture: A Review. Comput. Electron. Agric. 2018, 151, 61–69. [Google Scholar] [CrossRef]
  17. Wang, X.; Miao, Y.; Dong, R.; Zha, H.; Xia, T.; Chen, Z.; Kusnierek, K.; Mi, G.; Sun, H.; Li, M. Machine Learning-Based in-Season Nitrogen Status Diagnosis and Side-Dress Nitrogen Recommendation for Corn. Eur. J. Agron. 2021, 123, 126193. [Google Scholar] [CrossRef]
  18. Quemada, M.; Gabriel, J.L.; Zarco-Tejada, P. Airborne Hyperspectral Images and Ground-Level Optical Sensors as Assessment Tools for Maize Nitrogen Fertilization. Remote Sens. 2014, 6, 2940–2962. [Google Scholar] [CrossRef]
  19. Li, J.; Zhang, F.; Qian, X.; Zhu, Y.; Shen, G. Quantification of Rice Canopy Nitrogen Balance Index with Digital Imagery from Unmanned Aerial Vehicle. Remote Sens. Lett. 2015, 6, 183–189. [Google Scholar] [CrossRef]
  20. Kumar, R.; Murthy, P.V.S.; Kumar, A. Unmanned Aerial Vehicle-Based Multispectral Remote Sensing for Commercially Important Aromatic Crops in India for Its Efficient Monitoring and Management. J. Indian Soc. Remote Sens. 2021, 50, 397–407. [Google Scholar]
  21. Jordan, C.F. Derivation of Leaf-Area Index from Quality of Light on the Forest Floor. Ecology 1969, 50, 663–666. [Google Scholar] [CrossRef]
  22. Pearson, R.L.; Miller, L.D. Remote Mapping of Standing Crop Biomass for Estimation of the Productivity of the Shortgrass Prairie, Pawnee National Grasslands, Colorado; CABI: Wallingford, UK, 1972. [Google Scholar]
  23. Rouse, J.W., Jr.; Haas, R.H.; Schell, J.A.; Deering, D.W. Monitoring Vegetation Systems in the Great Plains with Erts. In Third Earth Resources Technology Satellite-1 Symposium. Volume I: Technical Presentations; Freden, S.C., Mercanti, E.P., Becker, M.A., Eds.; NASA SP-351; NASA Goddard Space Flight Center: Greenbelt, MD, USA, 1973; pp. 309–317. [Google Scholar]
  24. Roujean, J.-L.; Breon, F.-M. Estimating PAR Absorbed by Vegetation from Bidirectional Reflectance Measurements. Remote Sens. Environ. 1995, 51, 375–384. [Google Scholar] [CrossRef]
  25. Kaufman, Y.J.; Tanre, D. Atmospherically Resistant Vegetation Index (ARVI) for EOS-MODIS. IEEE Trans. Geosci. Remote Sens. 1992, 30, 261–270. [Google Scholar] [CrossRef]
  26. Chen, J.M. Evaluation of Vegetation Indices and a Modified Simple Ratio for Boreal Applications. Can. J. Remote Sens. 1996, 22, 229–242. [Google Scholar] [CrossRef]
  27. Sims, D.A.; Gamon, J.A. Relationships between Leaf Pigment Content and Spectral Reflectance across a Wide Range of Species, Leaf Structures and Developmental Stages. Remote Sens. Environ. 2002, 81, 337–354. [Google Scholar] [CrossRef]
  28. Huete, A.; Didan, K.; Miura, T.; Rodriguez, E.P.; Gao, X.; Ferreira, L.G. Overview of the Radiometric and Biophysical Performance of the MODIS Vegetation Indices. Remote Sens. Environ. 2002, 83, 195–213. [Google Scholar] [CrossRef]
  29. Rondeaux, G.; Steven, M.; Baret, F. Optimization of Soil-Adjusted Vegetation Indices. Remote Sens. Environ. 1996, 55, 95–107. [Google Scholar] [CrossRef]
  30. Qi, J.; Chehbouni, A.; Huete, A.R.; Kerr, Y.H.; Sorooshian, S. A Modified Soil Adjusted Vegetation Index. Remote Sens. Environ. 1994, 48, 119–126. [Google Scholar] [CrossRef]
  31. Gitelson, A.; Merzlyak, M.N. Spectral Reflectance Changes Associated with Autumn Senescence of Aesculus Hippocastanum L. and Acer Platanoides L. Leaves. Spectral Features and Relation to Chlorophyll Estimation. J. Plant Physiol. 1994, 143, 286–292. [Google Scholar] [CrossRef]
  32. Ehammer, A.; Fritsch, S.; Conrad, C.; Lamers, J.; Dech, S. Statistical Derivation of FPAR and LAI for Irrigated Cotton and Rice in Arid Uzbekistan by Combining Multi-Temporal RapidEye Data and Ground Measurements. In Proceedings of the SPIE Remote Sensing, Toulouse, France, 20–23 September 2010; Volume 7824, p. 782409. [Google Scholar]
  33. Daughtry, C.S.T.; Walthall, C.L.; Kim, M.S.; de Colstoun, E.B.; McMurtrey, J.E. Estimating Corn Leaf Chlorophyll Concentration from Leaf and Canopy Reflectance. Remote Sens. Environ. 2000, 74, 229–239. [Google Scholar] [CrossRef]
  34. Haboudane, D.; Miller, J.R.; Pattey, E.; Zarco-Tejada, P.J.; Strachan, I.B. Hyperspectral Vegetation Indices and Novel Algorithms for Predicting Green LAI of Crop Canopies: Modeling and Validation in the Context of Precision Agriculture. Remote Sens. Environ. 2004, 90, 337–352. [Google Scholar] [CrossRef]
  35. Datt, B. Visible/near Infrared Reflectance and Chlorophyll Content in Eucalyptus Leaves. Int. J. Remote Sens. 1999, 20, 2741–2759. [Google Scholar] [CrossRef]
  36. Broge, N.H.; Leblanc, E. Comparing Prediction Power and Stability of Broadband and Hyperspectral Vegetation Indices for Estimation of Green Leaf Area Index and Canopy Chlorophyll Density. Remote Sens. Environ. 2001, 76, 156–172. [Google Scholar] [CrossRef]
  37. Gitelson, A.A.; Merzlyak, M.N. Remote Estimation of Chlorophyll Content in Higher Plant Leaves. Int. J. Remote Sens. 1997, 18, 2691–2697. [Google Scholar] [CrossRef]
  38. Blackburn, G.A. Quantifying Chlorophylls and Caroteniods at Leaf and Canopy Scales: An Evaluation of Some Hyperspectral Approaches. Remote Sens. Environ. 1998, 66, 273–285. [Google Scholar] [CrossRef]
  39. Chappelle, E.W.; Kim, M.S.; McMurtrey, J.E. Ratio Analysis of Reflectance Spectra (RARS): An Algorithm for the Remote Estimation of the Concentrations of Chlorophyll A, Chlorophyll B, and Carotenoids in Soybean Leaves. Remote Sens. Environ. 1992, 39, 239–247. [Google Scholar] [CrossRef]
  40. Penuelas, J.; Frederic, B.; Filella, I. Semi-Empirical Indices to Assess Carotenoids/Chlorophyll-a Ratio from Leaf Spectral Reflectance. Photosynthetica 1995, 31, 221–230. [Google Scholar]
  41. Rehman, T.H.; Borja Reis, A.F.; Akbar, N.; Linquist, B.A. Use of Normalized Difference Vegetation Index to Assess N Status and Predict Grain Yield in Rice. Agron. J. 2019, 111, 2889–2898. [Google Scholar] [CrossRef]
  42. Boiarskii, B.; Hasegawa, H. Comparison of NDVI and NDRE Indices to Detect Differences in Vegetation and Chlorophyll Content. J. Mech. Contin. Math. Sci. 2019, 4, 20–29. [Google Scholar] [CrossRef]
  43. Gianquinto, G.; Goffart, J.P.; Olivier, M.; Guarda, G.; Colauzzi, M.; Dalla Costa, L.; Delle Vedove, G.; Vos, J.; Mackerron, D.K.L. The Use of Hand-Held Chlorophyll Meters as a Tool to Assess the Nitrogen Status and to Guide Nitrogen Fertilization of Potato Crop. Potato Res. 2004, 47, 35–80. [Google Scholar] [CrossRef]
  44. Chiu, M.S.; Wang, J. Evaluation of Machine Learning Regression Techniques for Estimating Winter Wheat Biomass Using Biophysical, Biochemical, and UAV Multispectral Data. Drones 2024, 8, 287. [Google Scholar] [CrossRef]
  45. Lu, J.; Dai, E.; Miao, Y.; Kusnierek, K. Developing a New Active Canopy Sensor- and Machine Learning-Based in-Season Rice Nitrogen Status Diagnosis and Recommendation Strategy. Field Crops Res. 2024, 317, 109540. [Google Scholar] [CrossRef]
Figure 1. Study area showing (a) India with state boundaries; (b) Uttar Pradesh state with district boundaries; (c) experimental field; and (d) field layout of experimental field.
Drones 09 00483 g001
Figure 2. Methodology for NFI estimation.
Drones 09 00483 g002
Figure 3. Variation in the Nitrogen Flavanol Index (NFI) across successive days after planting (DAP) of Mentha arvensis.
Drones 09 00483 g003
Figure 4. Feature importance based on RFE on 6 different DAP: (a) 15 DAP, (b) 30 DAP, (c) 45 DAP, (d) 60 DAP, (e) 75 DAP, and (f) 90 DAP.
Drones 09 00483 g004
Figure 5. Scatter plot of measured NFI values versus predicted NFI values for SVR, RF, and GBR model on six different days after planting: (a) 15 DAP, (b) 30 DAP (c) 45 DAP, (d) 60 DAP, (e) 75 DAP, and (f) 90 DAP.
Drones 09 00483 g005
Figure 6. Scatter plot of measured NFI values versus predicted NFI values for SVR, RF, and GBR model for whole growing period.
Drones 09 00483 g006
Table 1. UAV data acquisition campaign.
DateDay After Planting
2 April 202215
17 April 202230
2 May 202245
17 May 202260
1 June 202275
16 June 202290
Table 2. Vegetation indices used in this study.
Index NameFormulaReference
SRNIR/RED[21,22]
NDVI(NIR − RED)/(NIR + RED)[23]
RDVI(NIR − RED)/√(NIR + RED)[24]
ARVI(NIR − [RED − γ (BLUE − RED)])/(NIR + [RED − γ (BLUE − RED)]), γ = 1[25]
MSR1((NIR/RED) − 1)/√((NIR/RED) + 1)[26]
MSR2(NIR − BLUE)/(RED − BLUE)[27]
DVINIR − RED[21]
SAVI((1 + L)(NIR − RED))/(NIR + RED + L), L = 0.5[28]
OSAVI(1 + 0.16)(NIR − RED)/(NIR + RED + 0.16)[29]
MSAVI0.5 × [2 × NIR + 1 − √((2 × NIR + 1)2 − 8 × (NIR − RED))][30]
SARVI(1 + L) × (NIR − (RED − (BLUE − RED)))/(NIR + (RED − (BLUE − RED)) + L), L = 0.5[25]
EVI2.5 × (NIR − RED)/(NIR + 6 × RED − 7.5 × BLUE + 1)[28]
NDRE(NIR − RE)/(NIR + RE)[31]
RRI1NIR/RE[32]
RRI2RE/RED[32]
MCARI[(RE − RED) − 0.2 × (RE − GREEN)] × (RE/RED)[33]
MCARI11.2 × [2.5 × (NIR − RED) − 1.3 × (NIR − GREEN)][34]
MCARI2[1.5 × (2.5 × (NIR − RED) − 1.3 × (NIR − GREEN))]/√((2 × NIR + 1)2 − (6 × NIR − 5 × √RED) − 0.5)[34]
MTVI1.2 × [1.2 × (NIR − GREEN) − 2.5 × (RED − GREEN)][34]
Datt Index(NIR − RE)/(NIR − RED)[35]
aDVINIR − ((GREEN + RED)/2)[36]
GNDVI(NIR − GREEN)/(NIR + GREEN)[37]
PSSRcNIR/BLUE[38]
RARSaRED/RE[38,39]
SIPI(NIR − BLUE)/(NIR − RED)[40]
Table 3. R2 and RMSE between predicted and measured NFI values obtained by SVR, RF, and GB model at the six different DAP and the whole growing period.
Growth StageModelTrain R2Test R2Train RMSETest RMSE
15 DAP SVR0.740.730.510.48
RF0.900.700.320.51
GB0.910.700.300.51
30 DAP SVR0.560.550.670.62
RF0.770.680.480.51
GB0.680.670.580.53
45 DAPSVR0.540.530.700.60
RF0.850.810.390.39
GB0.720.630.550.54
60 DAPSVR0.720.660.500.70
RF0.870.700.340.66
GB0.910.630.280.73
75 DAPSVR0.710.680.550.50
RF0.870.860.360.32
GB0.900.750.330.43
90 DAPSVR0.660.530.590.65
RF0.830.770.420.46
GB0.860.640.380.57
Whole growing period SVR0.710.610.080.11
RF0.910.700.040.09
GB0.890.670.050.10
Disclaimer/Publisher’s Note: The statements, opinions and data contained in all publications are solely those of the individual author(s) and contributor(s) and not of MDPI and/or the editor(s). MDPI and/or the editor(s) disclaim responsibility for any injury to people or property resulting from any ideas, methods, instructions or products referred to in the content.

