Article

Development of an Unmanned Glider for Temperature and Image Monitoring

School of Engineering, Aerospace Department, Amity University Dubai, Dubai 345019, United Arab Emirates
*
Author to whom correspondence should be addressed.
Drones 2025, 9(7), 481; https://doi.org/10.3390/drones9070481
Submission received: 11 May 2025 / Revised: 29 June 2025 / Accepted: 4 July 2025 / Published: 7 July 2025

Abstract

This paper presents the design, fabrication, simulation, and partial validation of a low-cost, fixed-wing unmanned glider equipped for temperature and image monitoring. Aerodynamic optimization was performed using XFLR5 and ANSYS Fluent 2023 R1, with spanwise variation between NACA 63(3)-618 and NACA 4415 to enhance performance. Wind tunnel tests of the selected airfoil showed good agreement with CFD predictions, with deviations within 5–10%. The airframe, fabricated using 3D-printed PLA with a cross-lattice structure, was integrated with an ESP32-CAM and temperature sensor. A reflective thermal coating was applied to mitigate the heat sensitivity of PLA. Propeller-induced flow was analyzed separately using the lattice Boltzmann method. Real-time flight behavior was simulated in a virtual environment via Simulink and FlightGear. While full in-flight testing is pending, the results demonstrate a scalable, open-source UAV platform for environmental monitoring and academic research.

1. Introduction

Unmanned aerial vehicles (UAVs) have significantly advanced remote sensing and data acquisition across various sectors, including agriculture, civil engineering, and environmental monitoring [1,2,3,4,5]. Among UAV configurations, fixed-wing gliders offer distinct advantages for passive surveillance missions due to their aerodynamic efficiency, extended endurance, and the capacity for lightweight sensor integration [6,7,8]. Despite rapid developments in UAV design, a lack of affordable glider platforms remains that combine aerodynamic optimization, embedded sensing systems, and physical validation [9,10,11]. Proprietary components constrain many existing models or rely solely on numerical simulations, limiting their accessibility and practical applicability in field research and education [12]. This study addresses this gap by presenting the design, fabrication, simulation, and partial validation of a 3D-printed UAV glider equipped with onboard imaging and temperature sensors [13,14]. The platform utilizes spanwise airfoil variation to enhance aerodynamic performance and leverages open-source tools, including XFLR5, ANSYS Fluent, and FlightGear via Simulink, for comprehensive modeling and real-time flight simulation [15,16,17,18,19,20,21,22]. The result is a scalable, cost-effective UAV framework designed for academic, environmental, and educational applications [12].

2. Airfoil Design and Aerodynamic Analysis

This section details the aerodynamic design, analysis, and validation of the UAV’s wing structure. The approach involved initial airfoil screening using XFLR5, followed by 3D modeling in SolidWorks and computational fluid dynamics (CFD) simulations in ANSYS Fluent. Selected airfoils were then validated experimentally through subsonic wind tunnel testing, and a comparative study was conducted to assess the agreement between the CFD and wind tunnel test results. A separate simulation of propeller-induced flow was performed using the lattice Boltzmann method (LBM) to understand localized effects. Together, these steps provide a comprehensive framework for assessing the glider’s aerodynamic performance.

2.1. Airfoil Selection and XFLR5 Performance Analysis

The aerodynamic design of the glider’s wing is critical to its overall performance, particularly in terms of maximizing lift and minimizing drag. Multiple airfoils were evaluated using XFLR5 to compare their aerodynamic characteristics [14,15,16,17,18]. While Clark Y and Gottingen 796 were initially considered for their historical relevance and stable behavior [23], they were ultimately not selected for further study. Instead, the NACA 63(3)-618 and NACA 4415 were chosen based on superior lift-to-drag ratios and complementary performance characteristics. The coordinates of these airfoils are sourced from Airfoil Tools as seen in Figure 1.
The NACA 63(3)-618 airfoil, part of the 6-series known for low drag and laminar flow stability, was selected for the wing root to enhance cruise efficiency and load-bearing capability. In contrast, the NACA 4415, a 4-series airfoil with a higher maximum lift coefficient at low Reynolds numbers, was used at the wingtip to improve low-speed control. Spanwise airfoil variation was implemented using geometric interpolation (lofting) in SolidWorks, as shown in Figure 2, to generate a smooth transition from the root to the tip [24,25]. This spanwise variation in airfoil geometry is a common technique in glider and UAV design, optimizing aerodynamic performance along the wing’s span. The selected configuration ensures a balance between lift generation and structural integrity, tailored to the UAV’s mission requirements for endurance and controllability.
Although the wing design includes a spanwise blend between NACA 63(3)-618 and NACA 4415, only the NACA 63(3)-618 section was analyzed using CFD and validated experimentally. This choice was based on its dominant contribution to lift and structural performance. The blending was implemented through geometric lofting in SolidWorks, enabling a smooth, aerodynamic transition along the span.
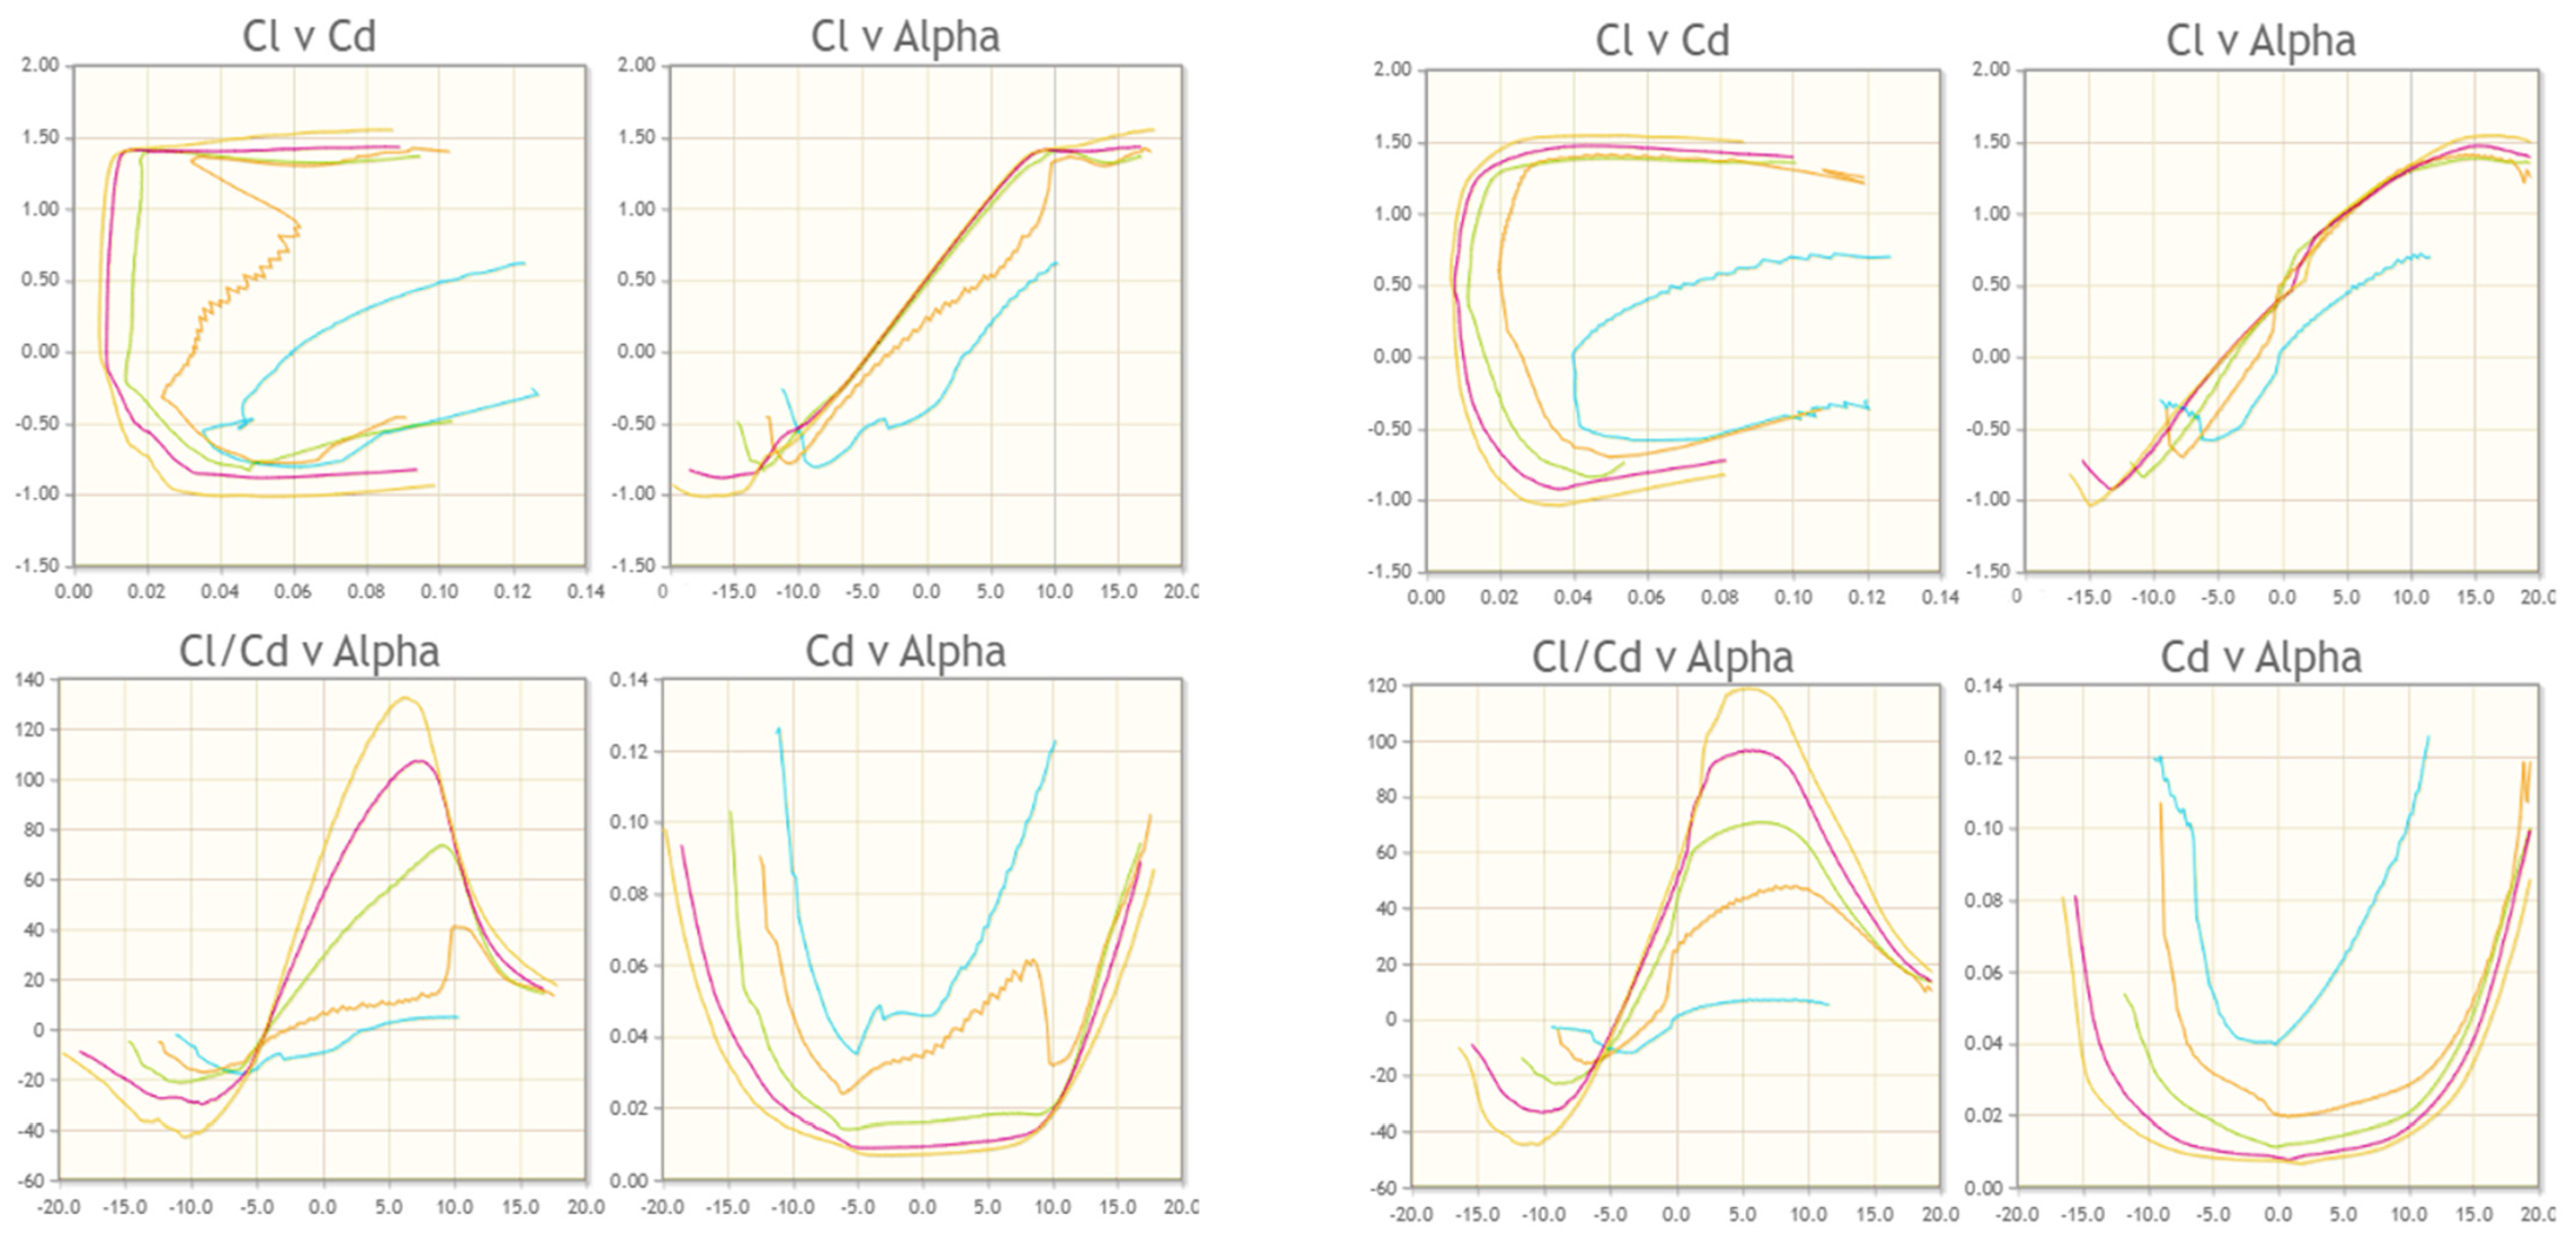
XFLR5 was used to analyze the aerodynamic properties of these airfoils under subsonic flow conditions, employing both panel and vortex lattice methods. It enabled the assessment of lift (CL), drag (CD), and moment (Cm) coefficients across a range of angles of attack. Optimal lift-to-drag (L/D) performance for both selected airfoils occurred between 4° and 6° AoA, with 6° chosen for all subsequent CFD and experimental testing. Figure 3 and Figure 4 illustrate the polar performance for each profile.
Based on XFLR5 analysis, multiple candidate airfoils were screened. The NACA 63(3)-618, due to its low drag and laminar flow profile, was selected for the root section, while the NACA 4415 was chosen for the tip to enhance low-speed controllability. For practical testing, the NACA 63(3)-618 was fabricated and tested in the wind tunnel to validate CFD results, as it represented the structurally dominant profile and contributed significantly to the glider’s lift characteristics.

2.2. CFD Modeling in ANSYS Fluent

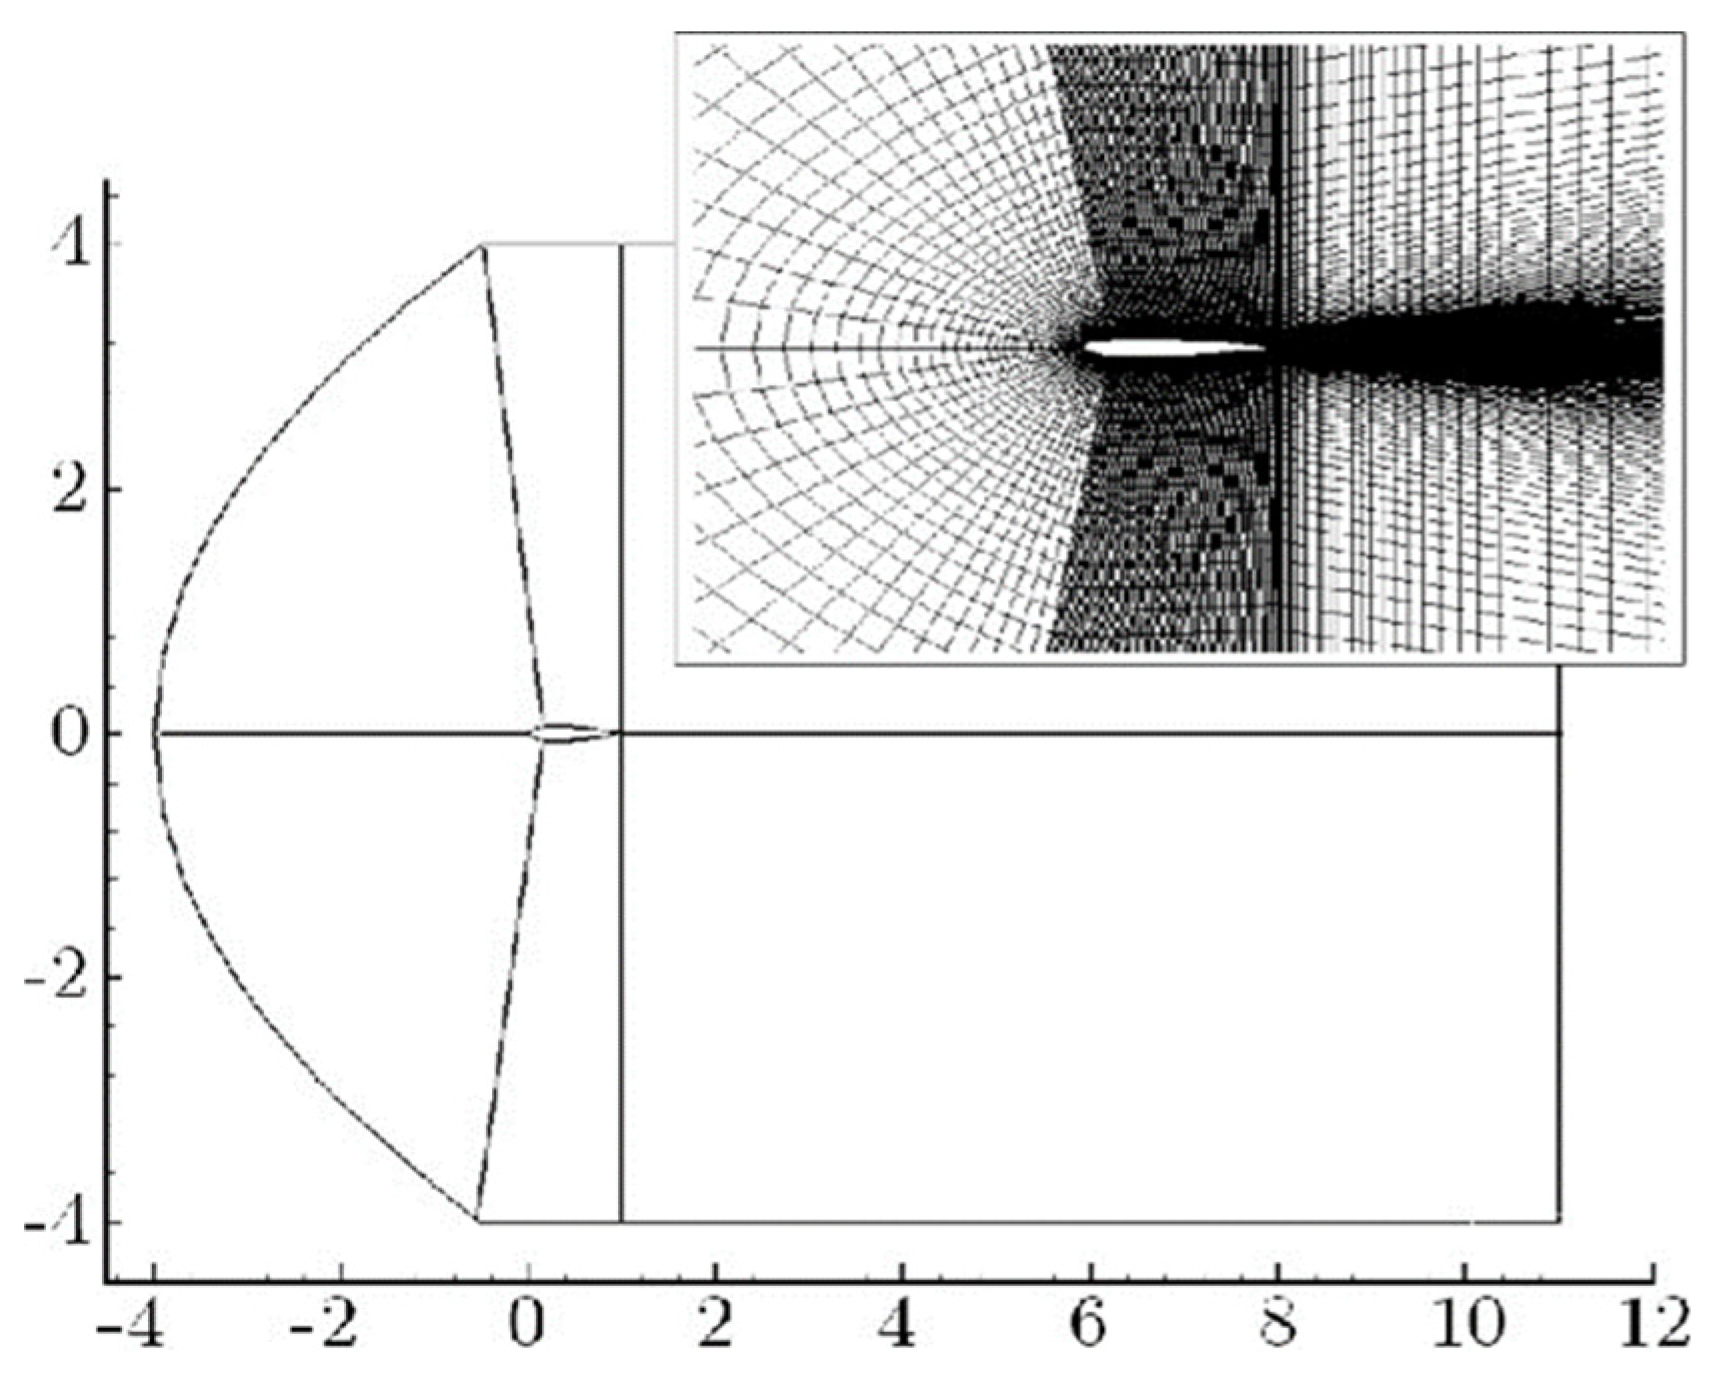
A 3D model of the airfoil section with a specified wing area was created in SolidWorks (see Figure 2) and imported into ANSYS Fluent for CFD analysis. A structured C-grid mesh topology was selected due to its suitability for capturing boundary layer development near curved surfaces, illustrated in Figure 5 [14,26]. Approximately 75,000 elements were used, refined in the leading and trailing edge regions to ensure mesh independence and accurate flow resolution, as shown in Table 1. The simulation employed a density-based solver with a realizable k-ε turbulence model and second-order upwind spatial discretization [15]. A three-way velocity inlet boundary condition and a zero-gauge pressure outlet were included, allowing downstream velocity to develop freely.
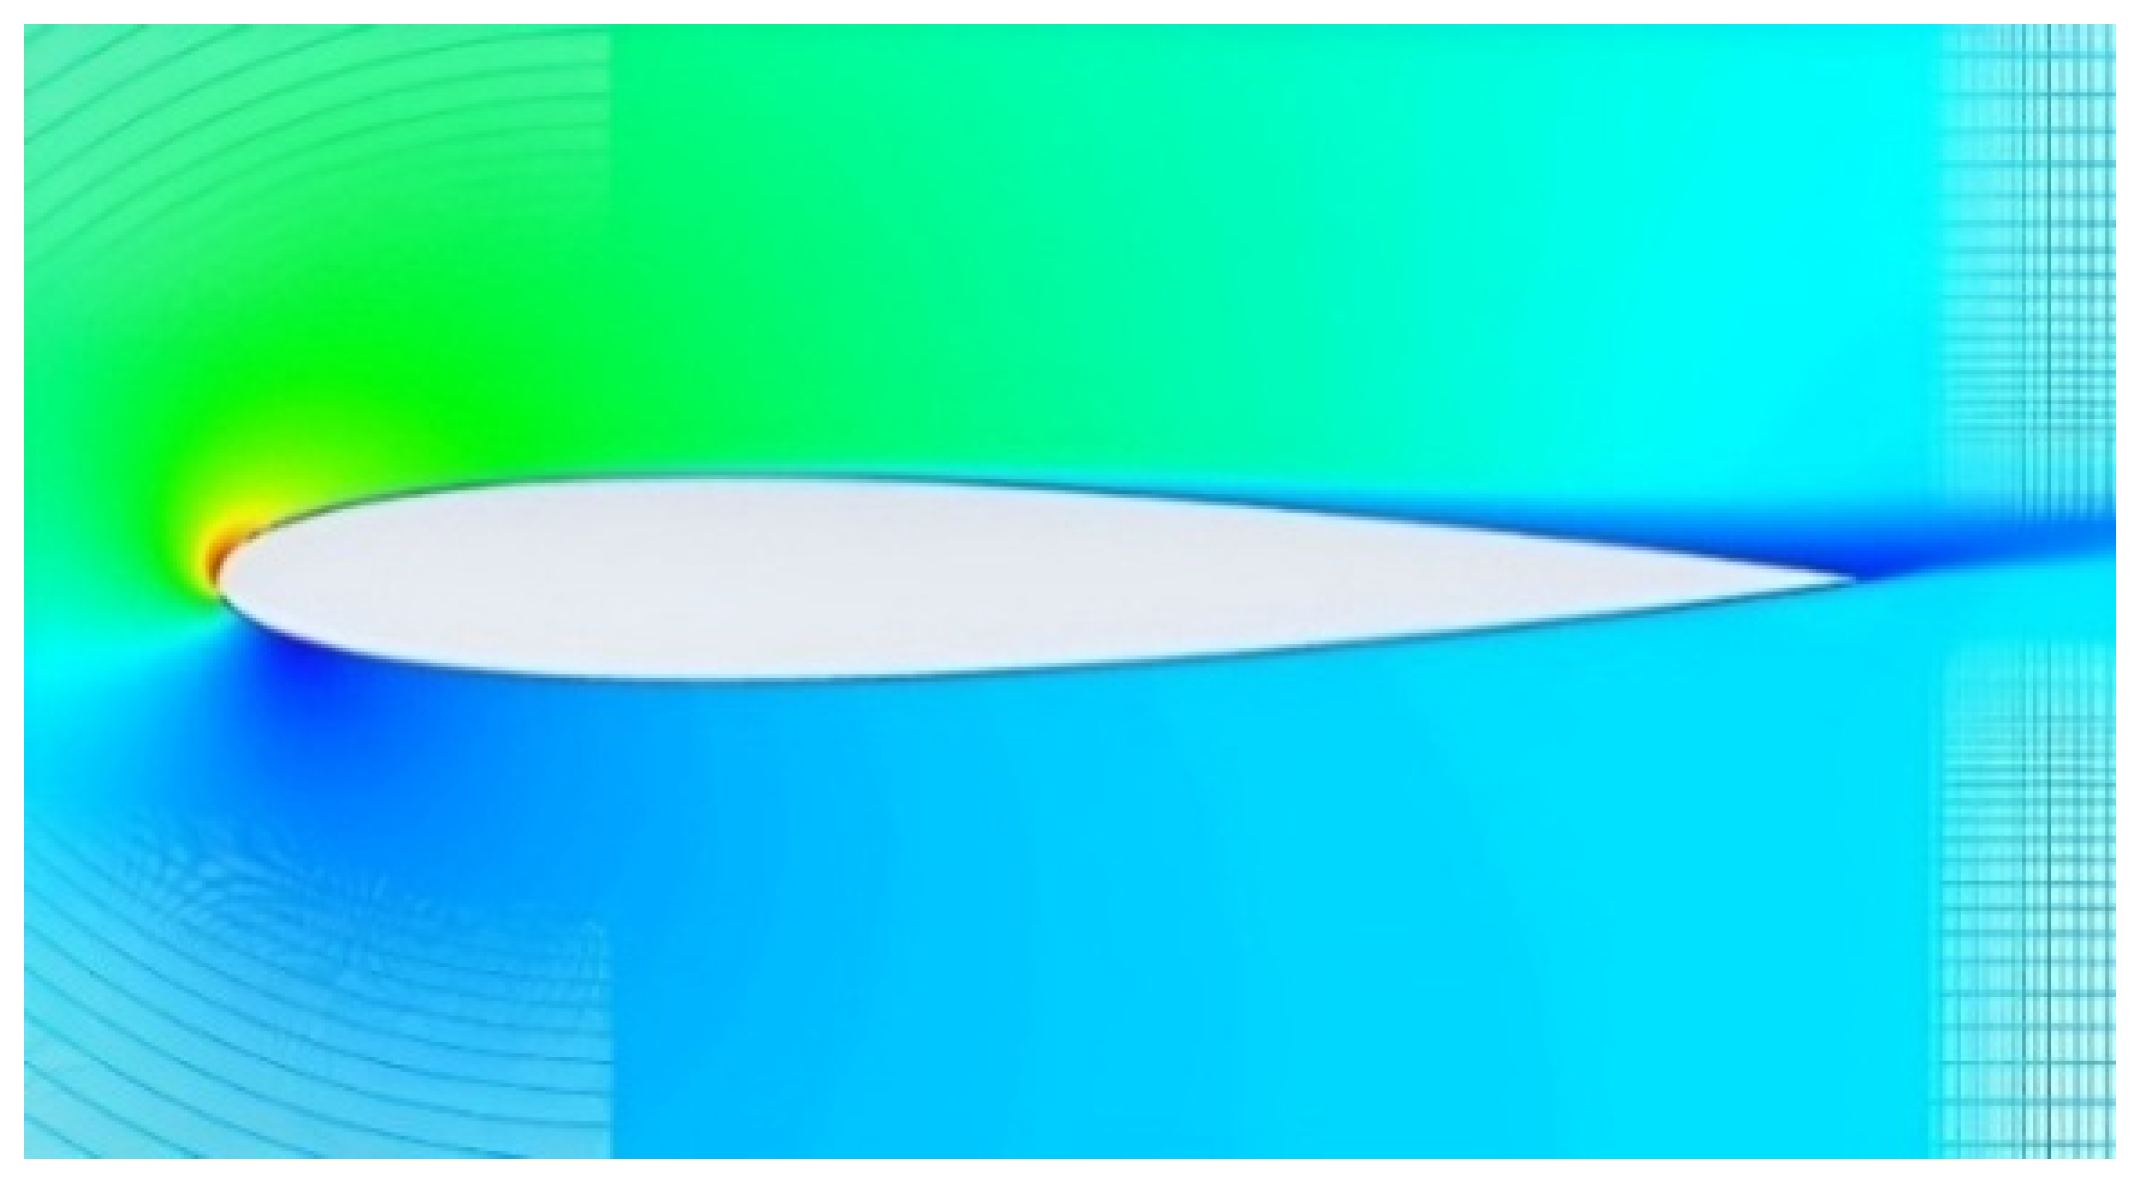
During post-processing, contour maps and streamlines were generated to visualize relevant flow variables. Capturing the wake, particularly at the trailing edge, was essential for performance assessment [26]. In Figure 6, the results indicated smooth acceleration over the upper surface and deceleration beneath, consistent with Bernoulli’s principle. These flow patterns resulted in a favorable L/D ratio [20,27]. Velocity contours and streamlines confirmed effective lift generation and minimal flow separation at the design AoA. Pressure gradient distribution across the chord also showed agreement with expected trends for laminar airfoils.

2.3. Wind Tunnel Testing and Validation

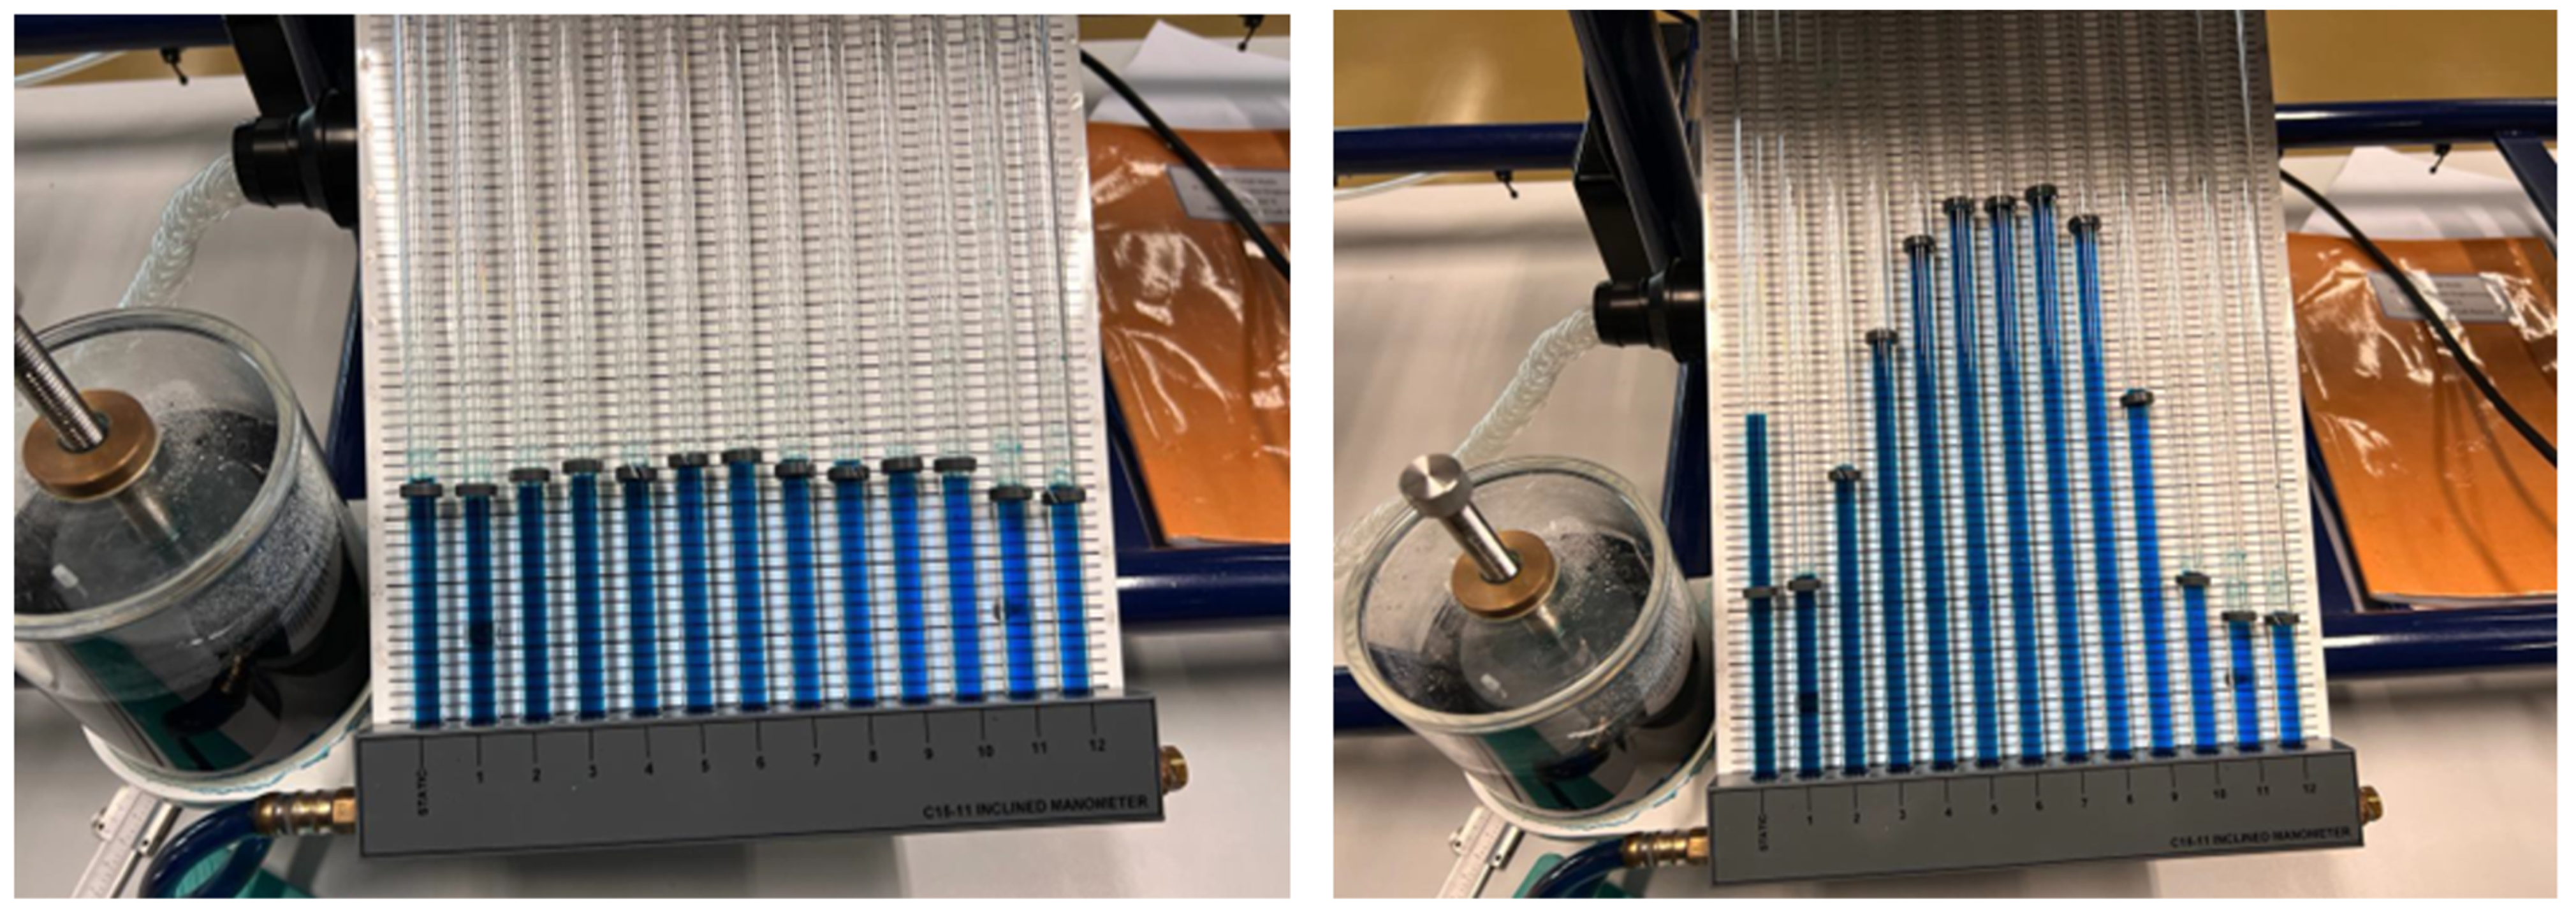
Wind tunnel testing was conducted at the Aerospace Lab in the C15-10 subsonic wind tunnel at Amity University Dubai in the UAE. A scaled-down PLA model of the NACA 63(3)-618 airfoil was fabricated for the test and mounted in the tunnel along with the C15-10 computer-controlled setup [28], as shown in Figure 7. Tests were conducted under Reynolds numbers ranging from 1.2 × 10⁵ to 2.4 × 10⁵, with AoA varying from 0° to 10° in 2° increments. Differential pressure readings were collected using a 16-channel inclined manometer across increasing fan speeds from 20% to 100%, as shown in Figure 8. Wake rake alignment and model mounting were verified before testing. Table 2 represents the recorded lift, drag, CL, and CD values.
The wind tunnel testing setup and parameters were carefully selected to replicate the simulation conditions for validation purposes closely. The comparison of CFD and wind tunnel results for the airfoil is presented in Table 3. The lift and drag coefficients align closely, with deviations typically within 5–10%, validating the accuracy of the CFD model under the given conditions [26,29]. Minor differences are attributed to limitations in turbulence modeling, boundary condition simplifications, and experimental measurement uncertainties, including pressure sensor resolution and potential setup misalignment. These results confirm that the simulation framework reasonably replicates physical aerodynamic behavior.
All numerical and experimental values reported have been rounded to 3–4 significant figures to reflect realistic precision. In CFD simulations, mesh independence was confirmed using a 75,000-element grid. However, limitations in turbulence modeling (realizable k-ε) and assumptions about boundary conditions introduce modeling uncertainty. Wind tunnel measurements are subject to uncertainty from manometer resolution (±0.5 Pa), potential parallax errors, and sensor sensitivity. While formal uncertainty propagation was not conducted, these sources of error are acknowledged, and future work will include a more rigorous quantitative error analysis.

2.4. Propeller Flow Simulation and Effects (LBM)

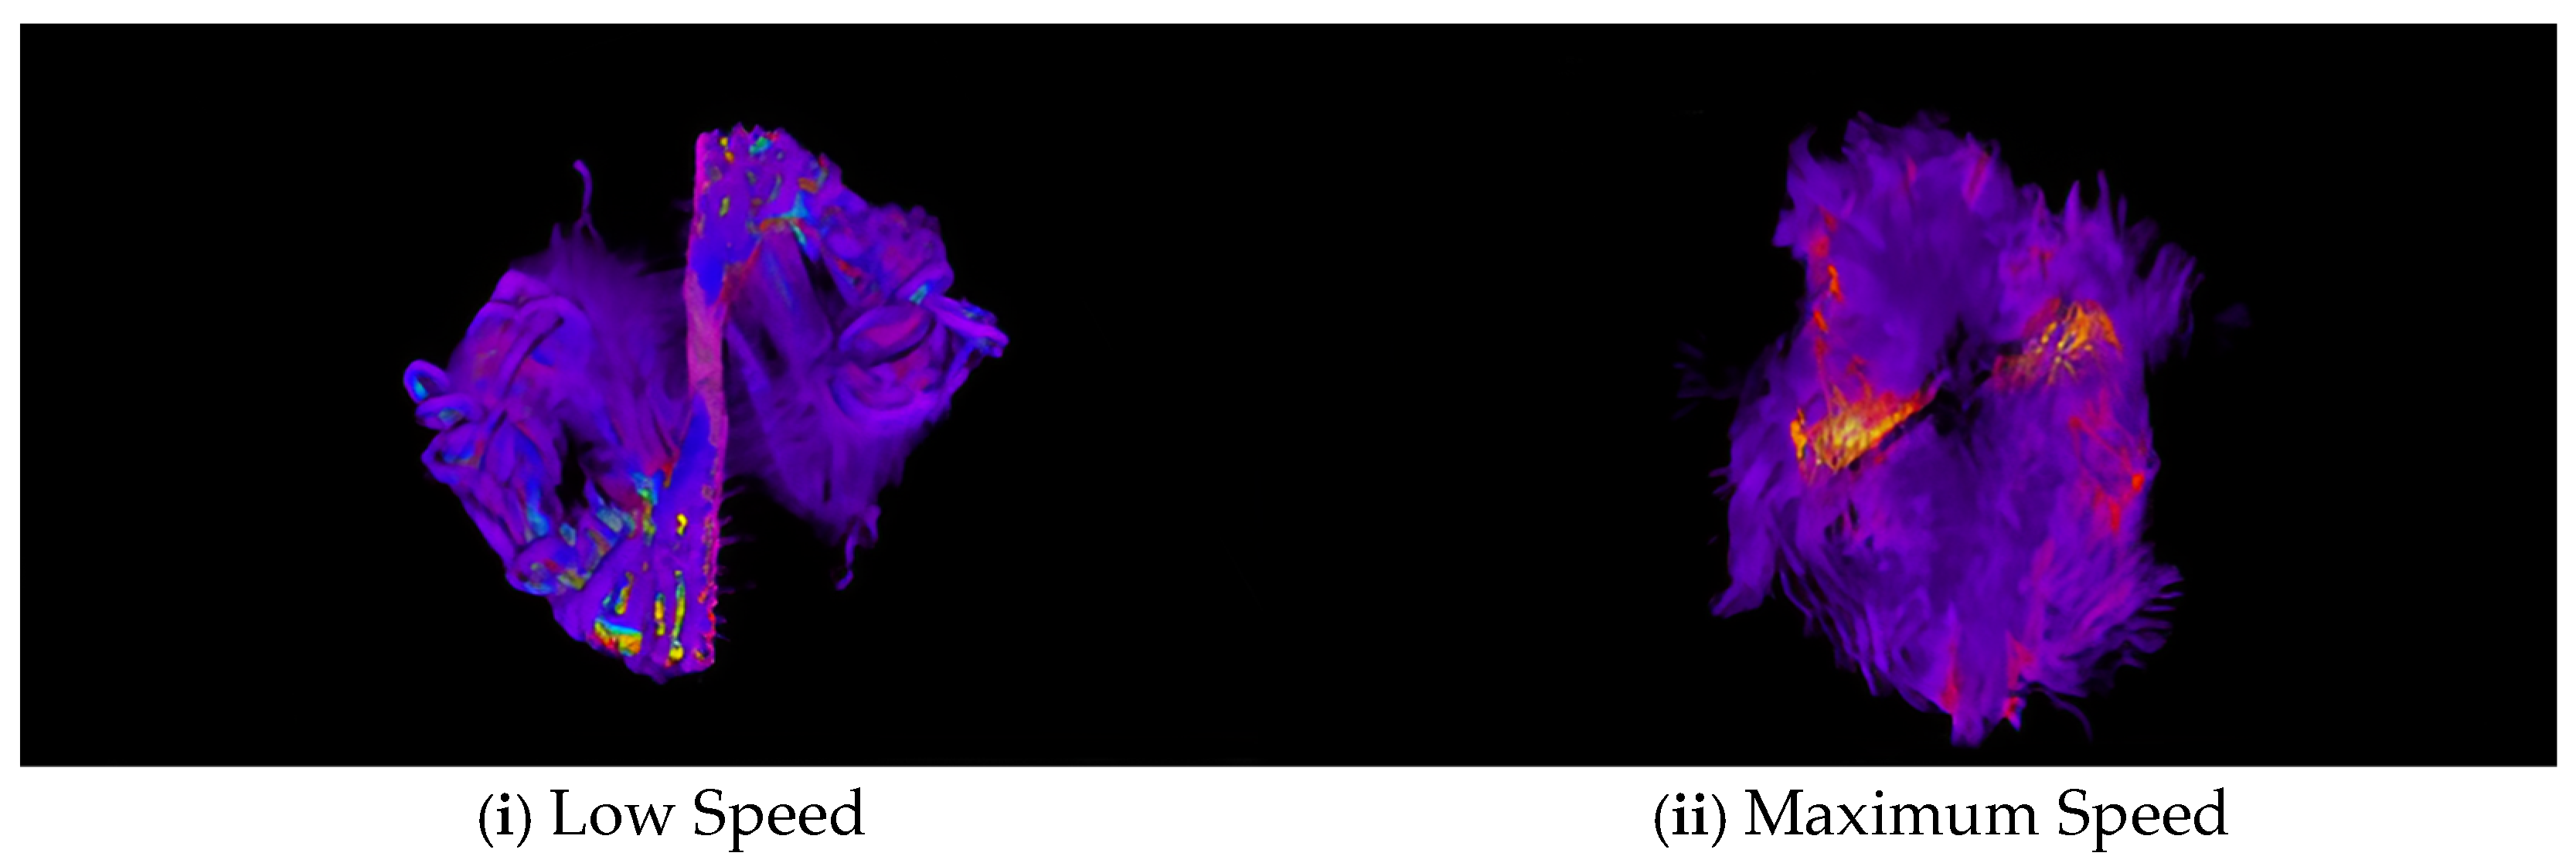
Most aerodynamic analyses in this study were conducted under the assumption of a clean flow field, excluding propeller-induced effects to isolate the performance of the airfoil and fuselage. Propeller-induced flow effects were evaluated separately using the lattice Boltzmann method (LBM) at different operating speeds (see Figure 9), which simulates particle distribution functions on a discrete lattice. This method provided direct numerical simulation (DNS)-level precision in modeling the induced velocity field and wake characteristics [29]. Although the LBM simulation was not coupled into the main aerodynamic CFD workflow, its findings support future modeling efforts to include rotor–airframe interaction through actuator disk models or rotating reference frames.

3. Glider Structural Design and Flow Visualization

This section outlines the structural and aerodynamic development of the UAV glider’s full airframe. The process began with MATLAB-based parametric calculations to define key performance metrics, including wing loading, stability margins, and aerodynamic centers. The glider was then modeled using AutoCAD 2024 and SolidWorks 2023, which captured the fuselage, wing, and tail configurations in detail. To assess the external aerodynamic flow behavior, CFD simulations were performed on the assembled glider geometry, allowing for the visualization of pressure and velocity distributions across critical surfaces.

3.1. Glider Design Calculations

Conceptual design calculations and estimations were performed using a custom MATLAB code, enabling the assessment of various aspects of the glider’s design, including aerodynamics, stability, control, and performance parameters [30]. The code allowed the input of key metrics to determine wing and tail geometries, airfoil properties, the center of gravity (CG), the aerodynamic center (AC), and other critical parameters. These factors are essential for achieving controlled, stable flight and optimizing aerodynamic performance. The preliminary design produced the following wing characteristics:
  • Wing area (S): 534,710 mm2 (828.80 in2)
  • Wingspan (b): 2000 mm
  • Chord length (C1, C1’’, C2): 149.97 mm, 149.97 mm, 86.98 mm
  • Taper ratio (λ): 0.5799 ≈ 0.6
  • Wing cube loading (WCL): 4.087 ≈ 4 (within ideal RC glider range of 3–5)
Further refinements yielded primary design parameters, including total weight estimation, empennage design, center of gravity, and aerodynamic center. The final results obtained from MATLAB are as follows:
  • Total weight: 46 oz (1.3 kg)
  • Thrust (T): 33 oz
  • Thrust-to-weight ratio (T/W): 0.80
  • Wing surface area (S): 5.75 sq. ft.
  • Aspect ratio (AR): 4.6
  • Wingspan (b): 6.5 ft (2000 mm)
  • Chord length (c): 0.63 ft
  • Tail span (bt): 3 ft
  • Tail aspect ratio (ARt): 4.6
  • Tail area (St): 1.95 sq. ft.
  • Tail chord length (ct): 0.63 ft
  • Aerodynamic center (Xac): 0.21 ft (behind c.g)
  • Center of gravity (Xcg): 0.19 ft (behind wing L.E)
  • Stability margin (Sm): −0.04 ft (marginally stable condition)
These parameters established a foundation for the glider’s structural design and further validated its aerodynamics.

3.2. Glider CAD Modeling

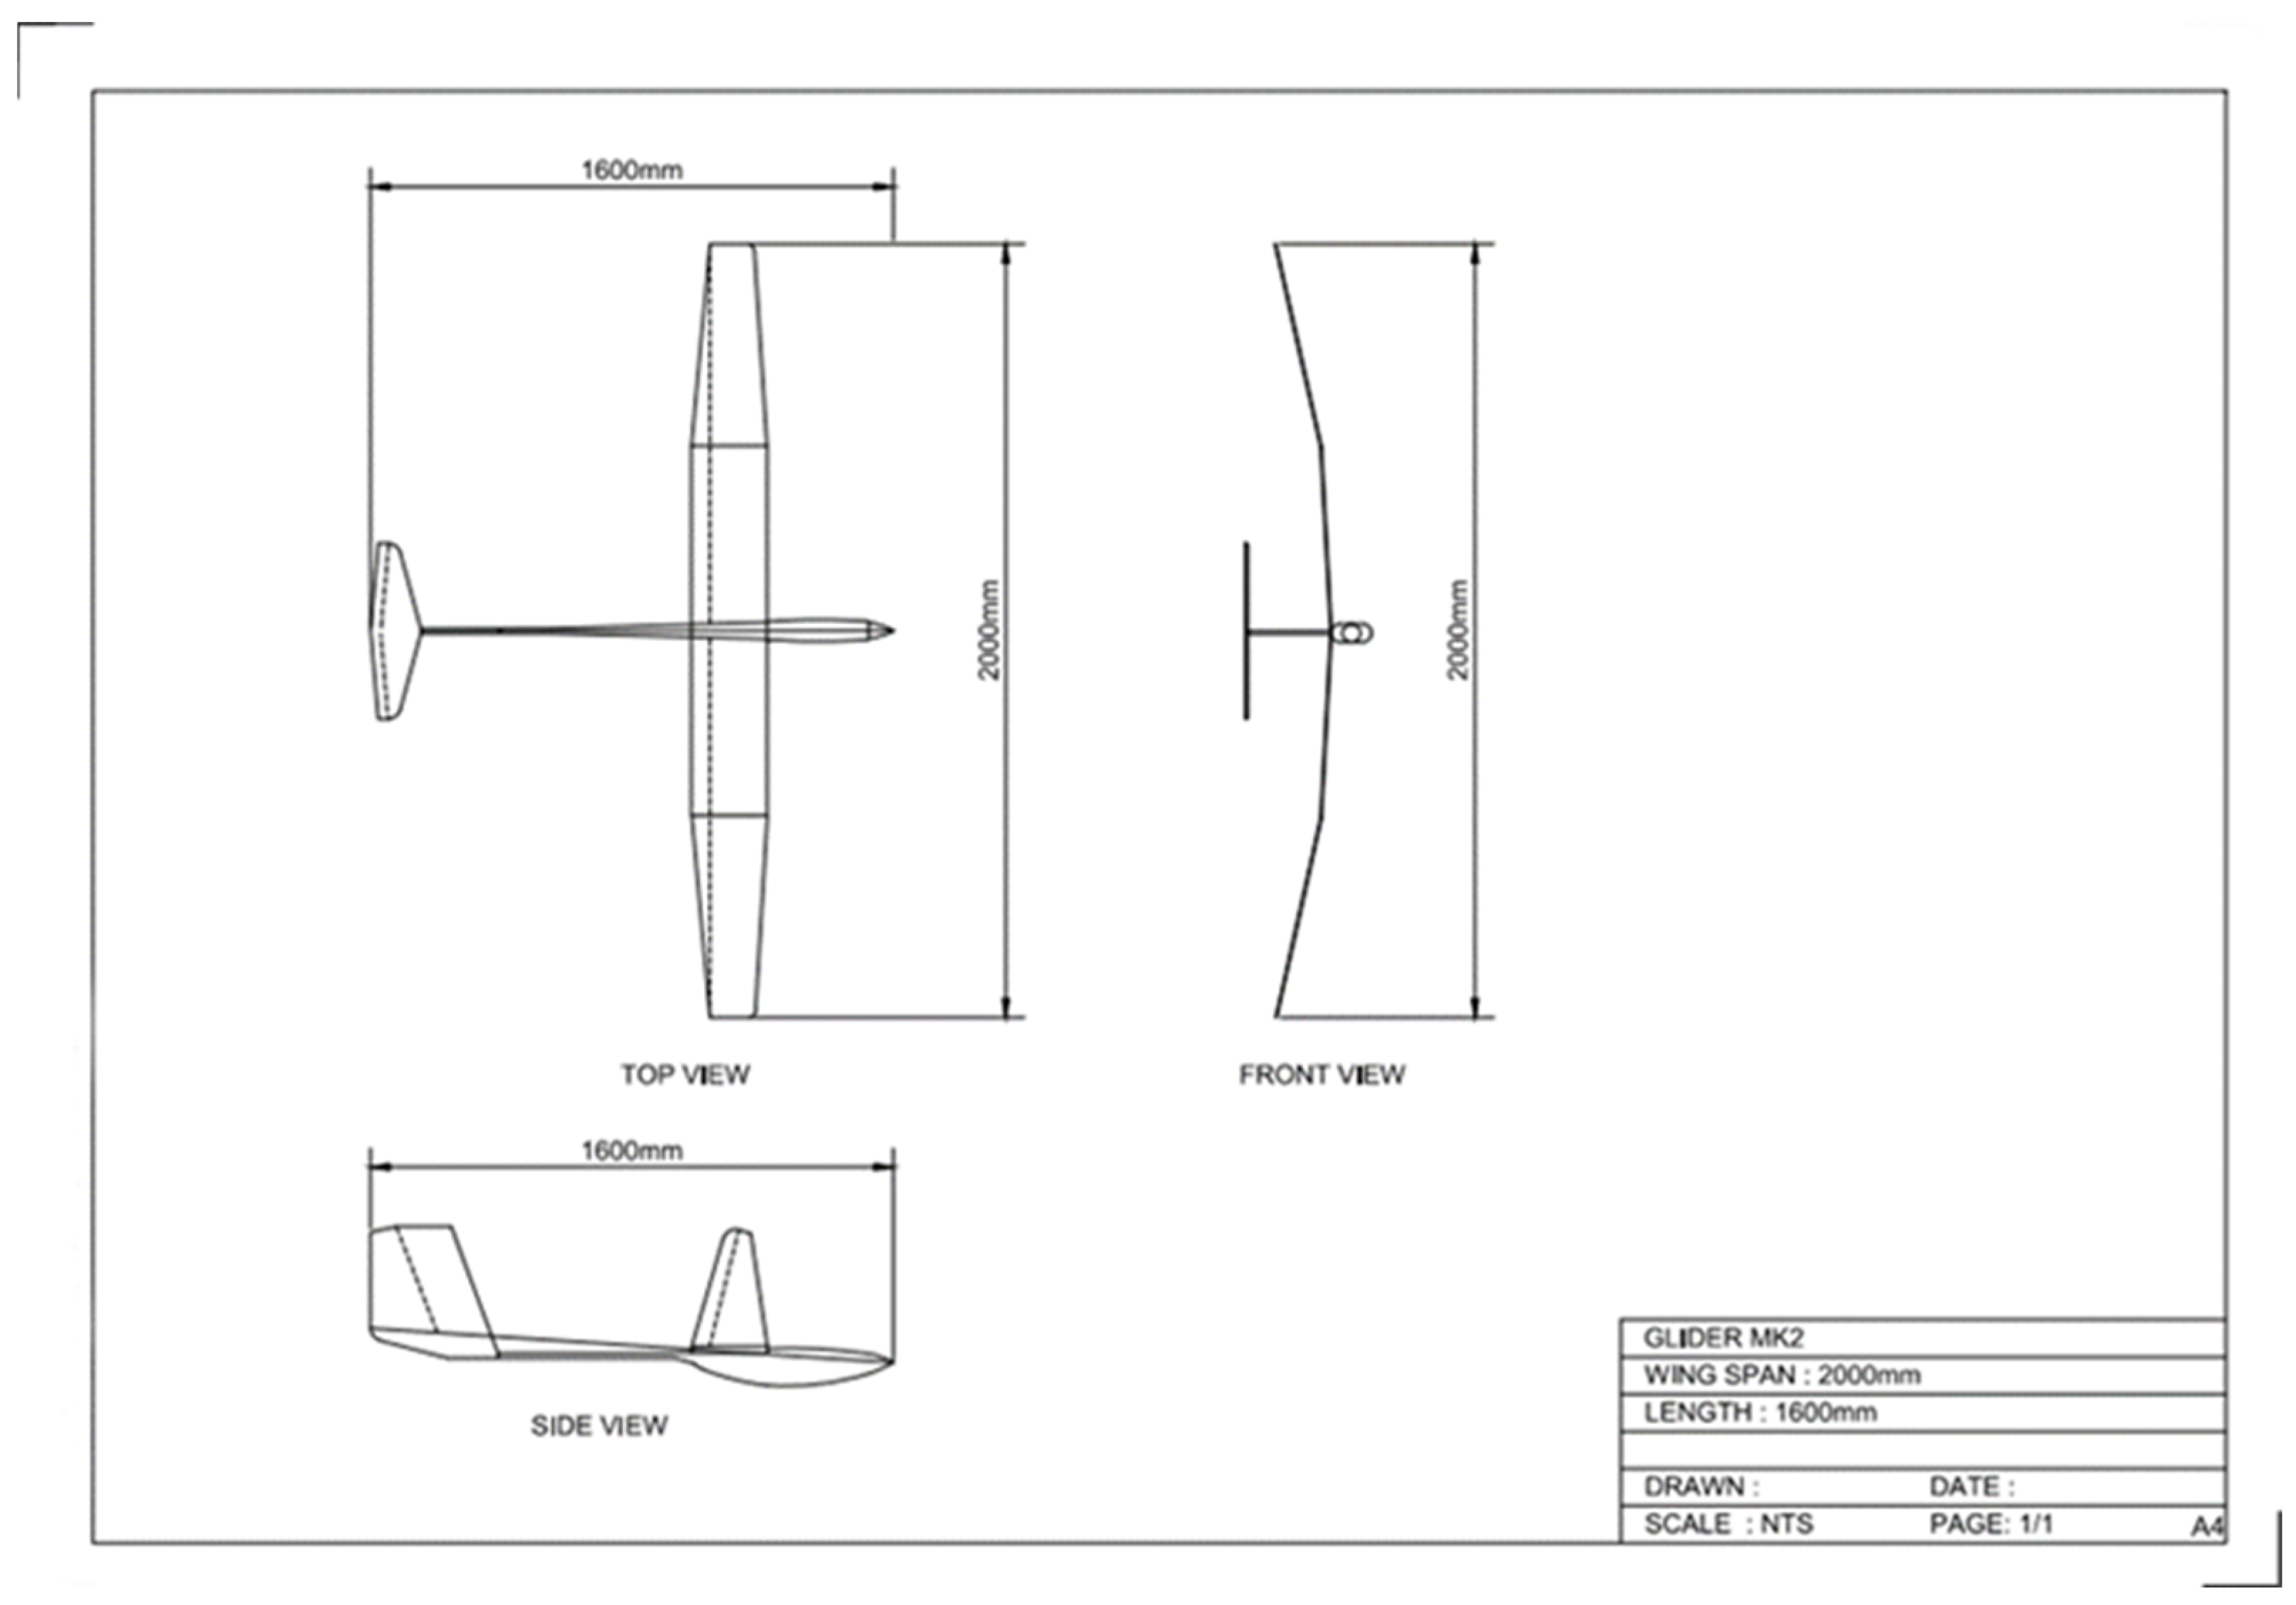
AutoCAD, CATIA, COMSOL, and CREO are widely employed across engineering disciplines for creating 2D and 3D models for diverse engineering applications [25,30,31] In this case study, AutoCAD was used to design the body and components of the proposed glider. Figure 10 presents the technical drawing of the RC glider model, illustrating its top, front, and side views. The top view highlights the wingspan of 1600 mm, along with the tail section and the relative positioning of the fuselage and stabilizers. The front view highlights the wing’s dihedral angle, which contributes to the model’s lateral stability. The side view illustrates the fuselage length of 900 mm, emphasizing the proportional alignment of the vertical and horizontal tail components. These views collectively offer a comprehensive understanding of the glider’s geometric configuration, supporting further analysis and validation of the design parameters.
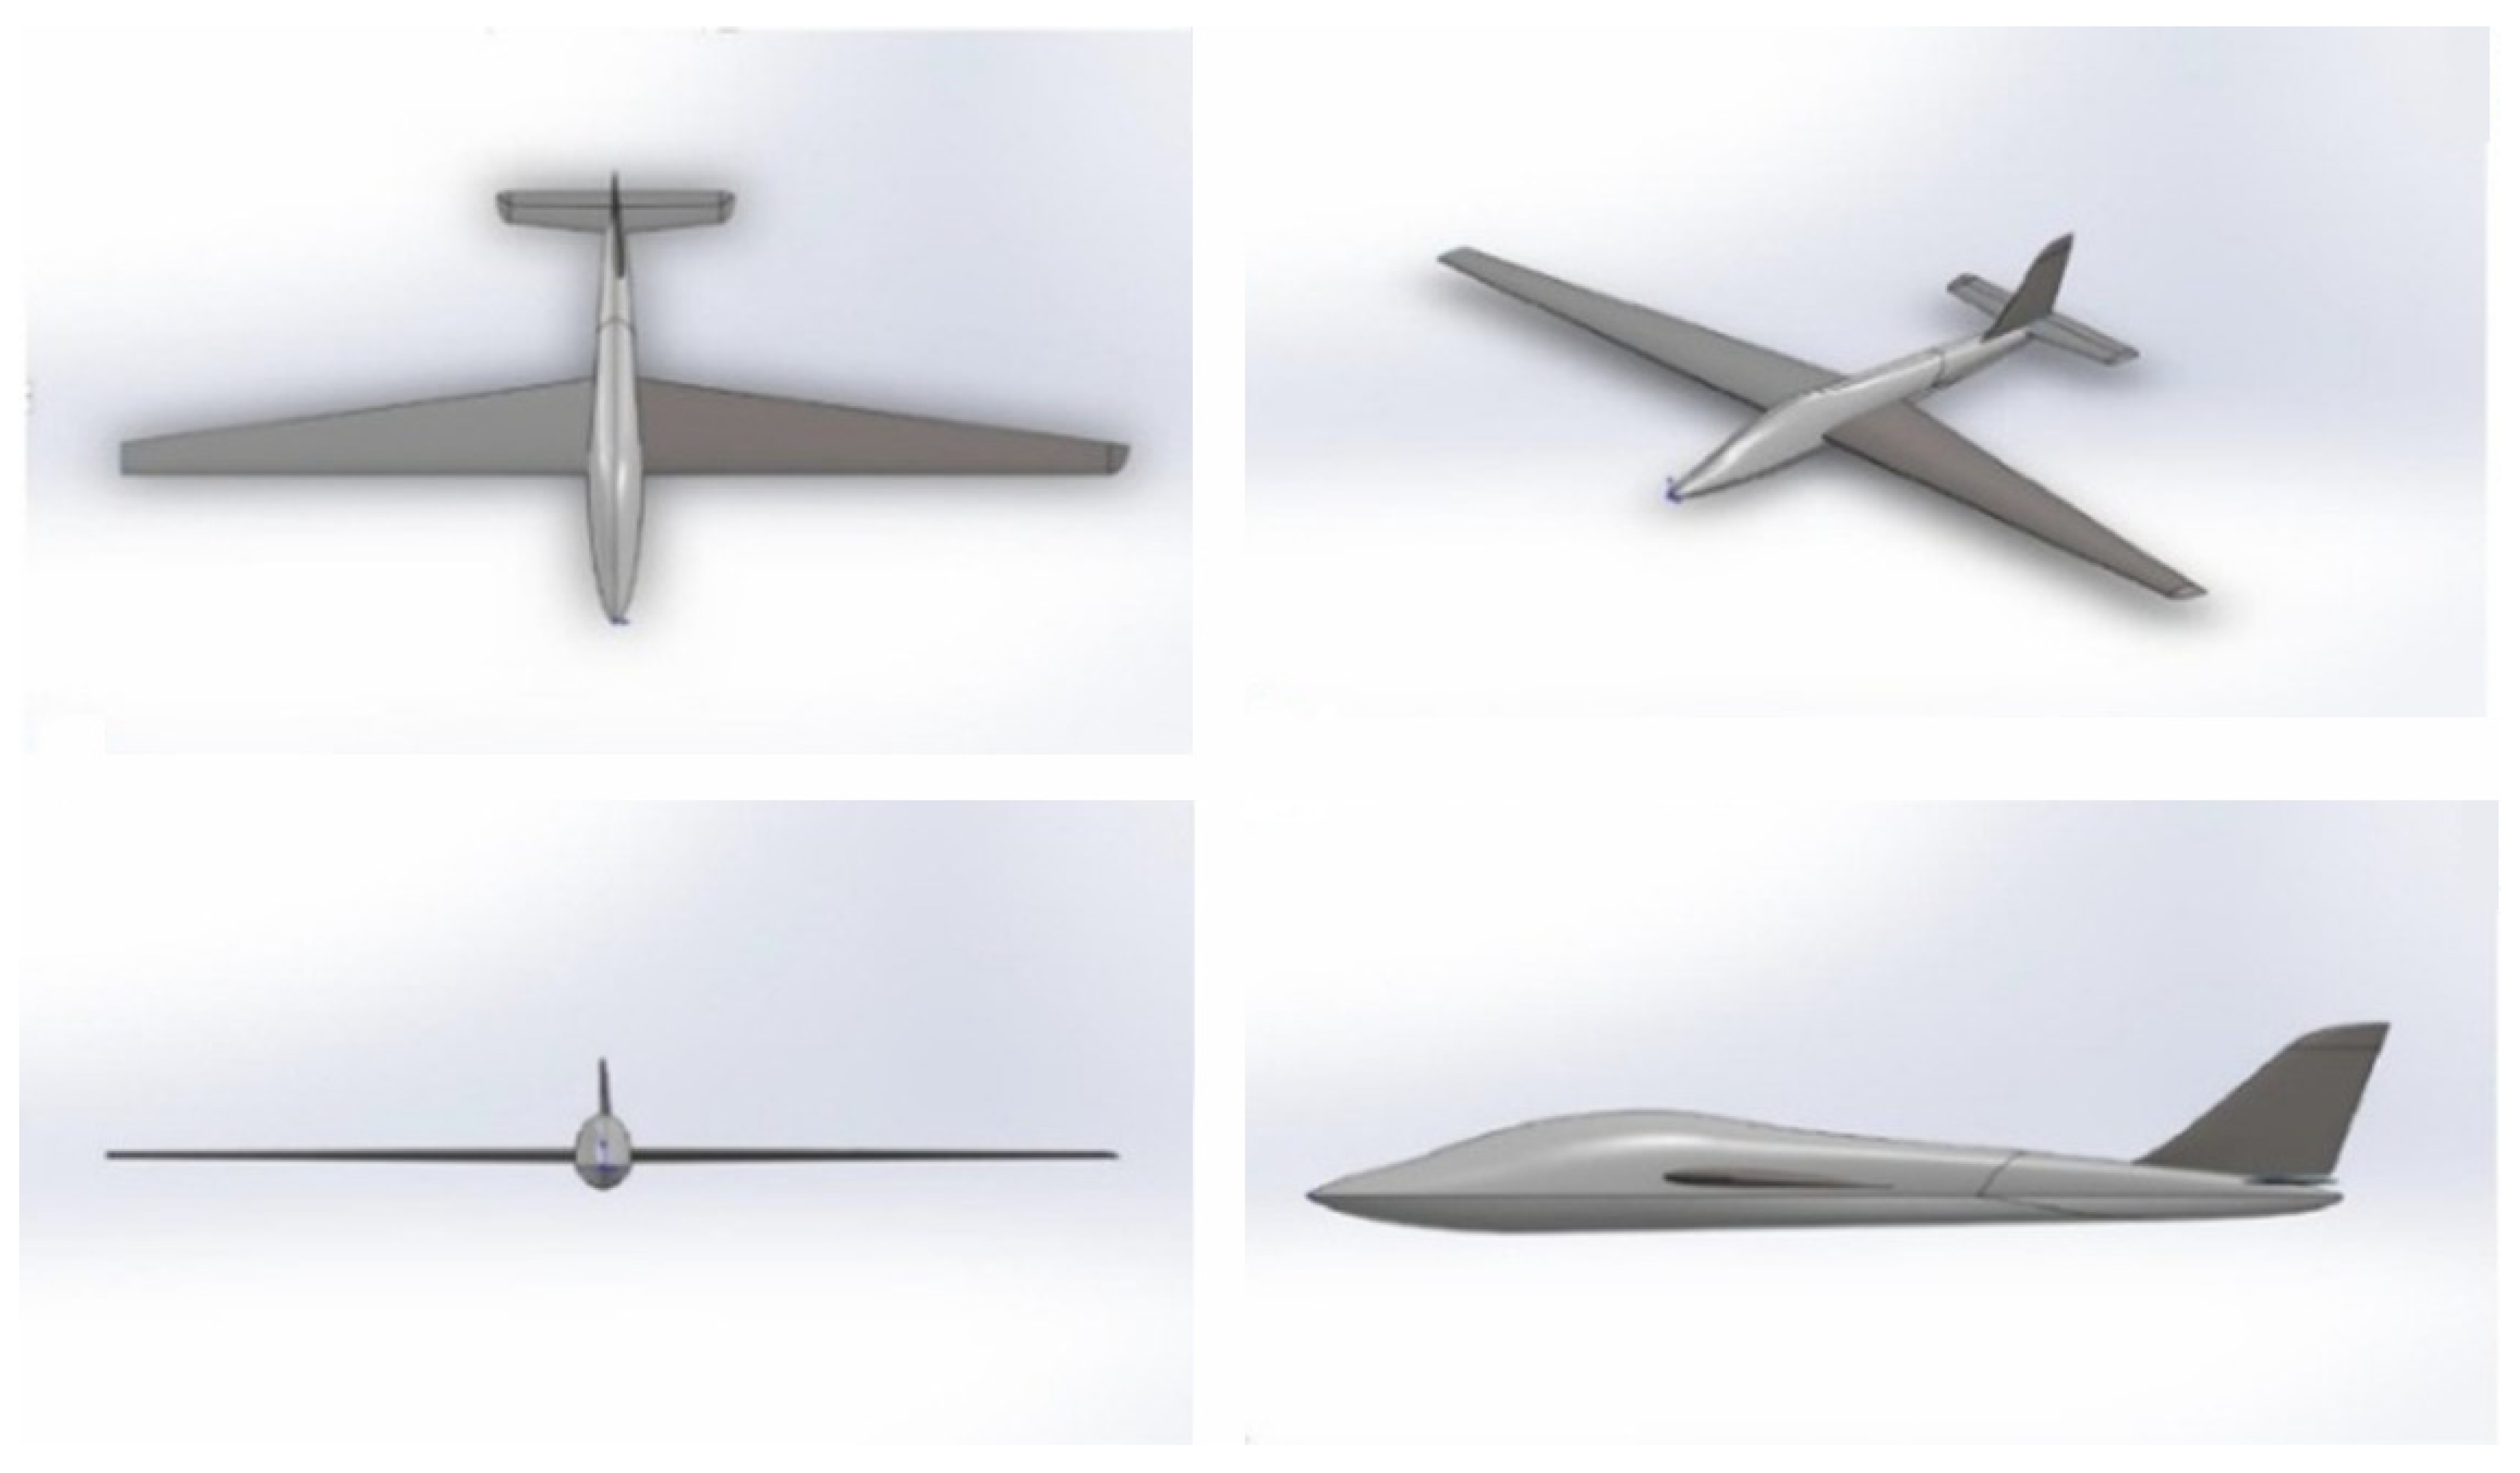
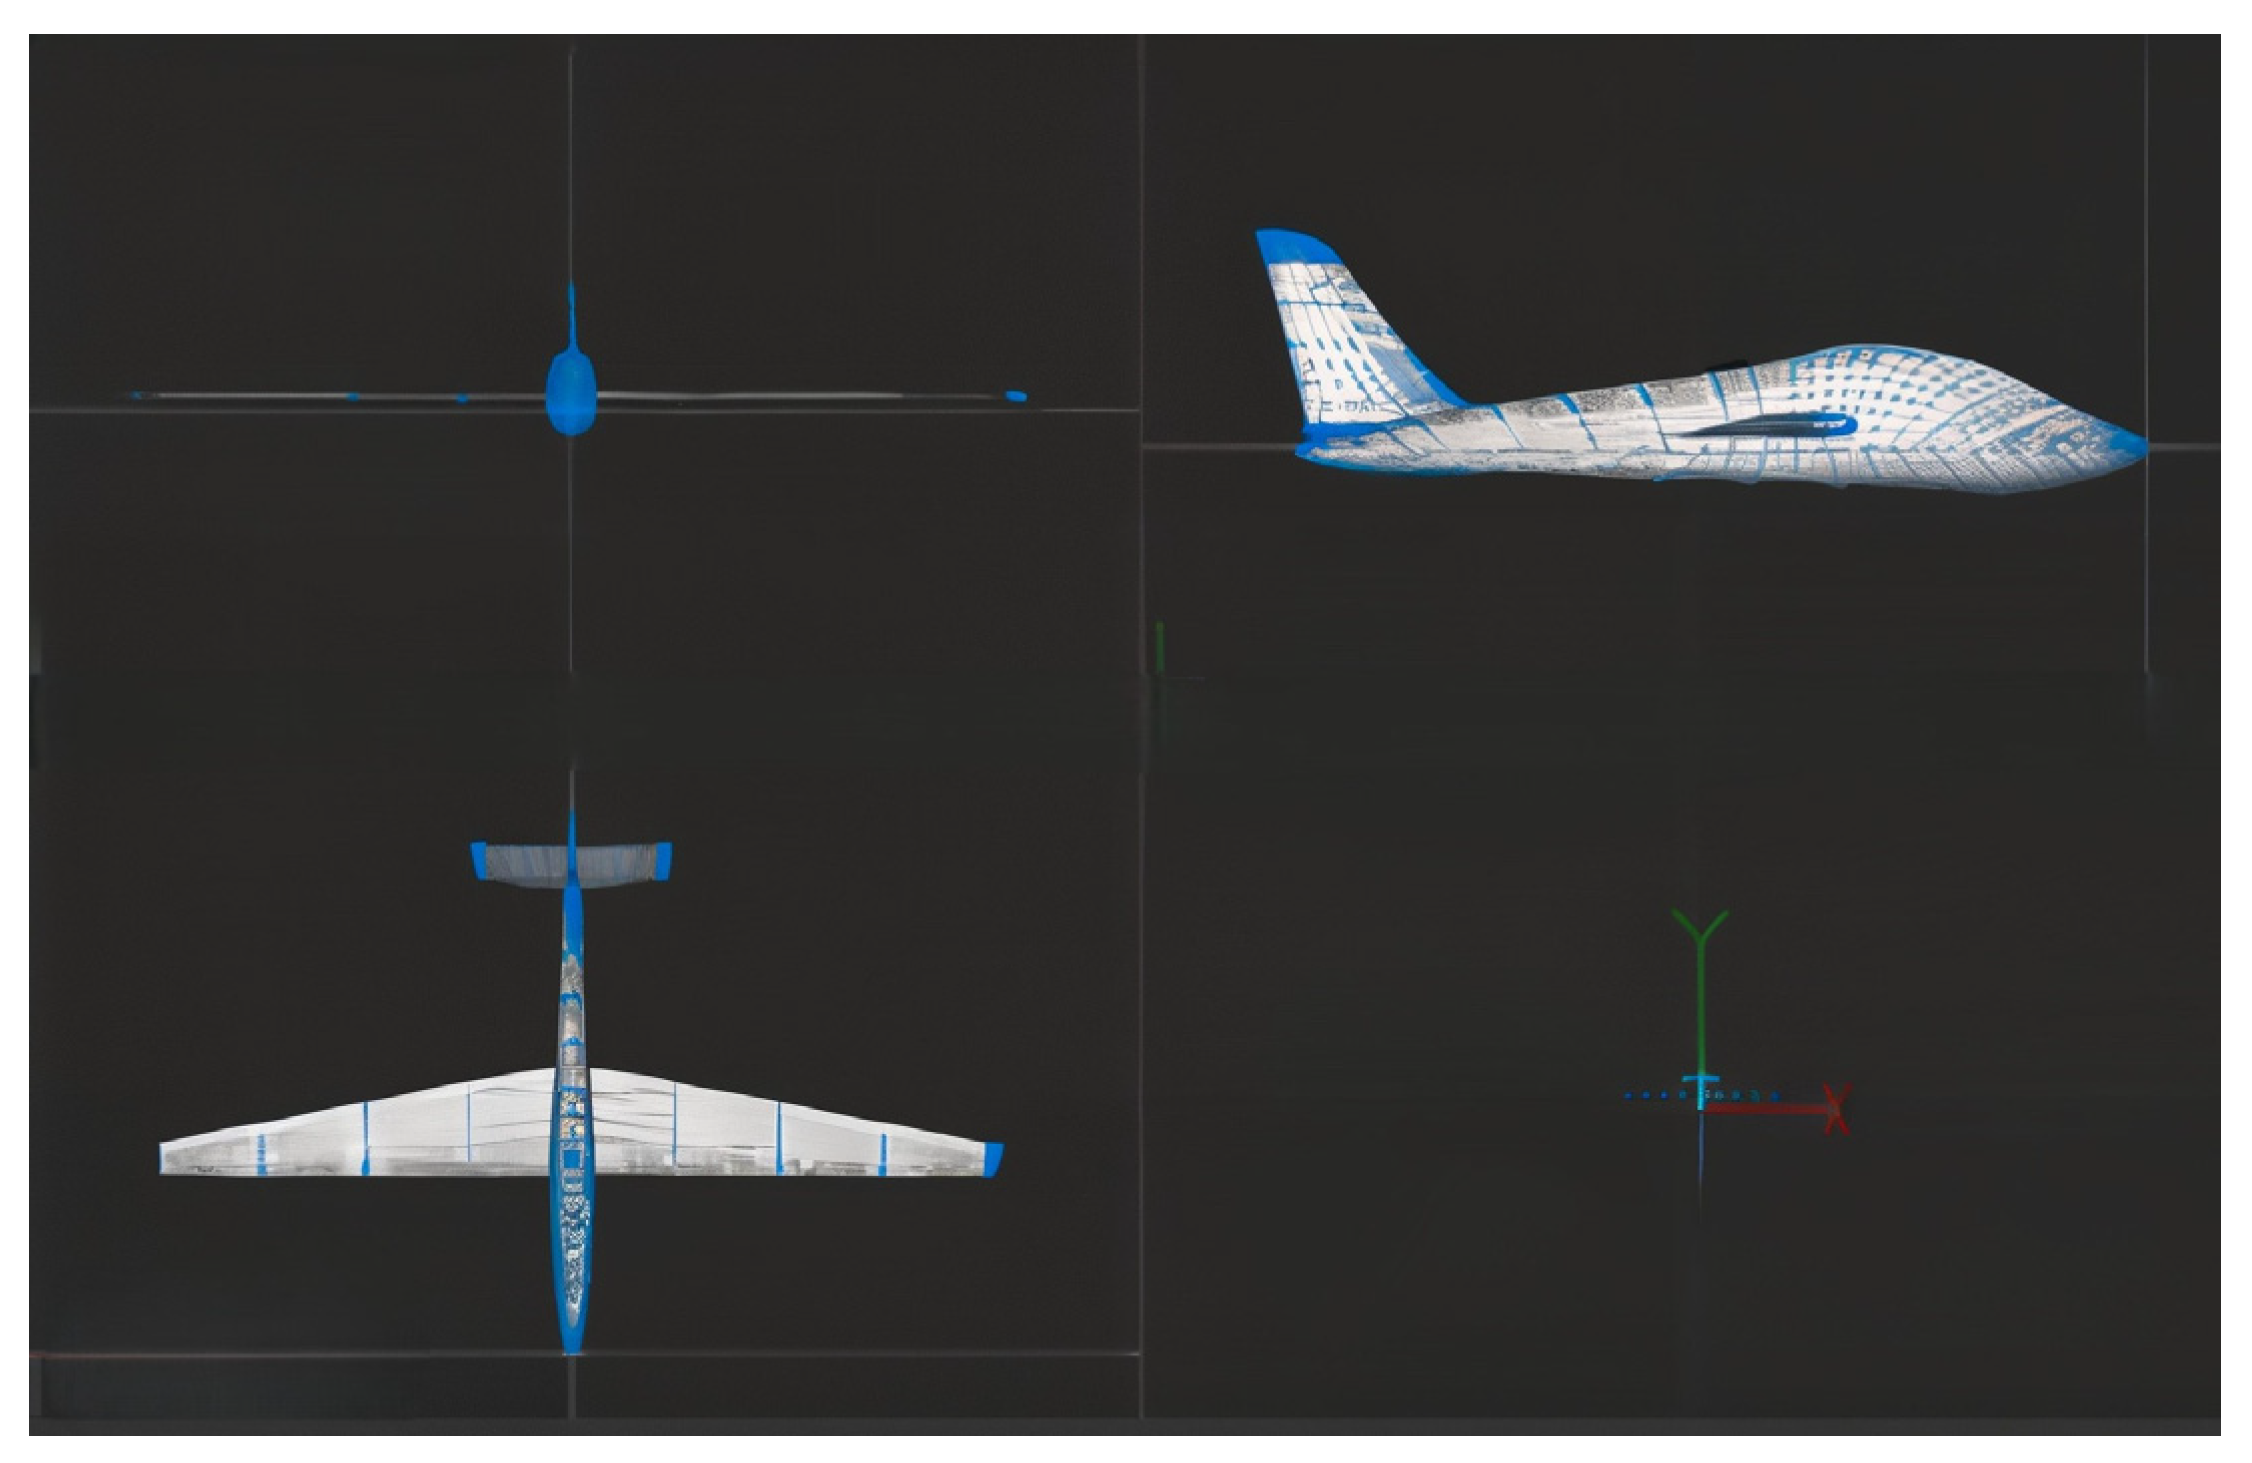
Figure 11 illustrates the 3D CAD model of the RC glider, developed in SolidWorks, which showcases both orthographic and isometric perspectives. The streamlined fuselage, tapered wings, and conventional tail configuration are clearly represented. This CAD model also served as the basis for generating the mesh in the CFD simulations.

3.3. CFD Simulation and Flow Visualization

Control volume is a fundamental concept in CFD, used to analyze fluid flow within a defined space [32]. To simulate aerodynamic behavior, the glider model was analyzed using a control volume-based CFD approach, as illustrated in Figure 12. The computational domain was discretized into a structured mesh, with each cell treated as a finite control volume where conservation laws were applied (mass, momentum, and energy). The flow characteristics are estimated at discrete places inside each control volume, such as cell centers or nodes. The fluxes entering and exiting the control volume through its faces are considered when applying the flow equations to these discrete locations. CFD simulations provide insight into fluid behavior, including velocity distributions, pressure gradients, and temperature profiles, by numerically solving the flow equations within each control volume. The control volume method also permits the incorporation of boundary conditions and the simulation of intricate flow phenomena, such as turbulence or heat transfer [14,15,32].
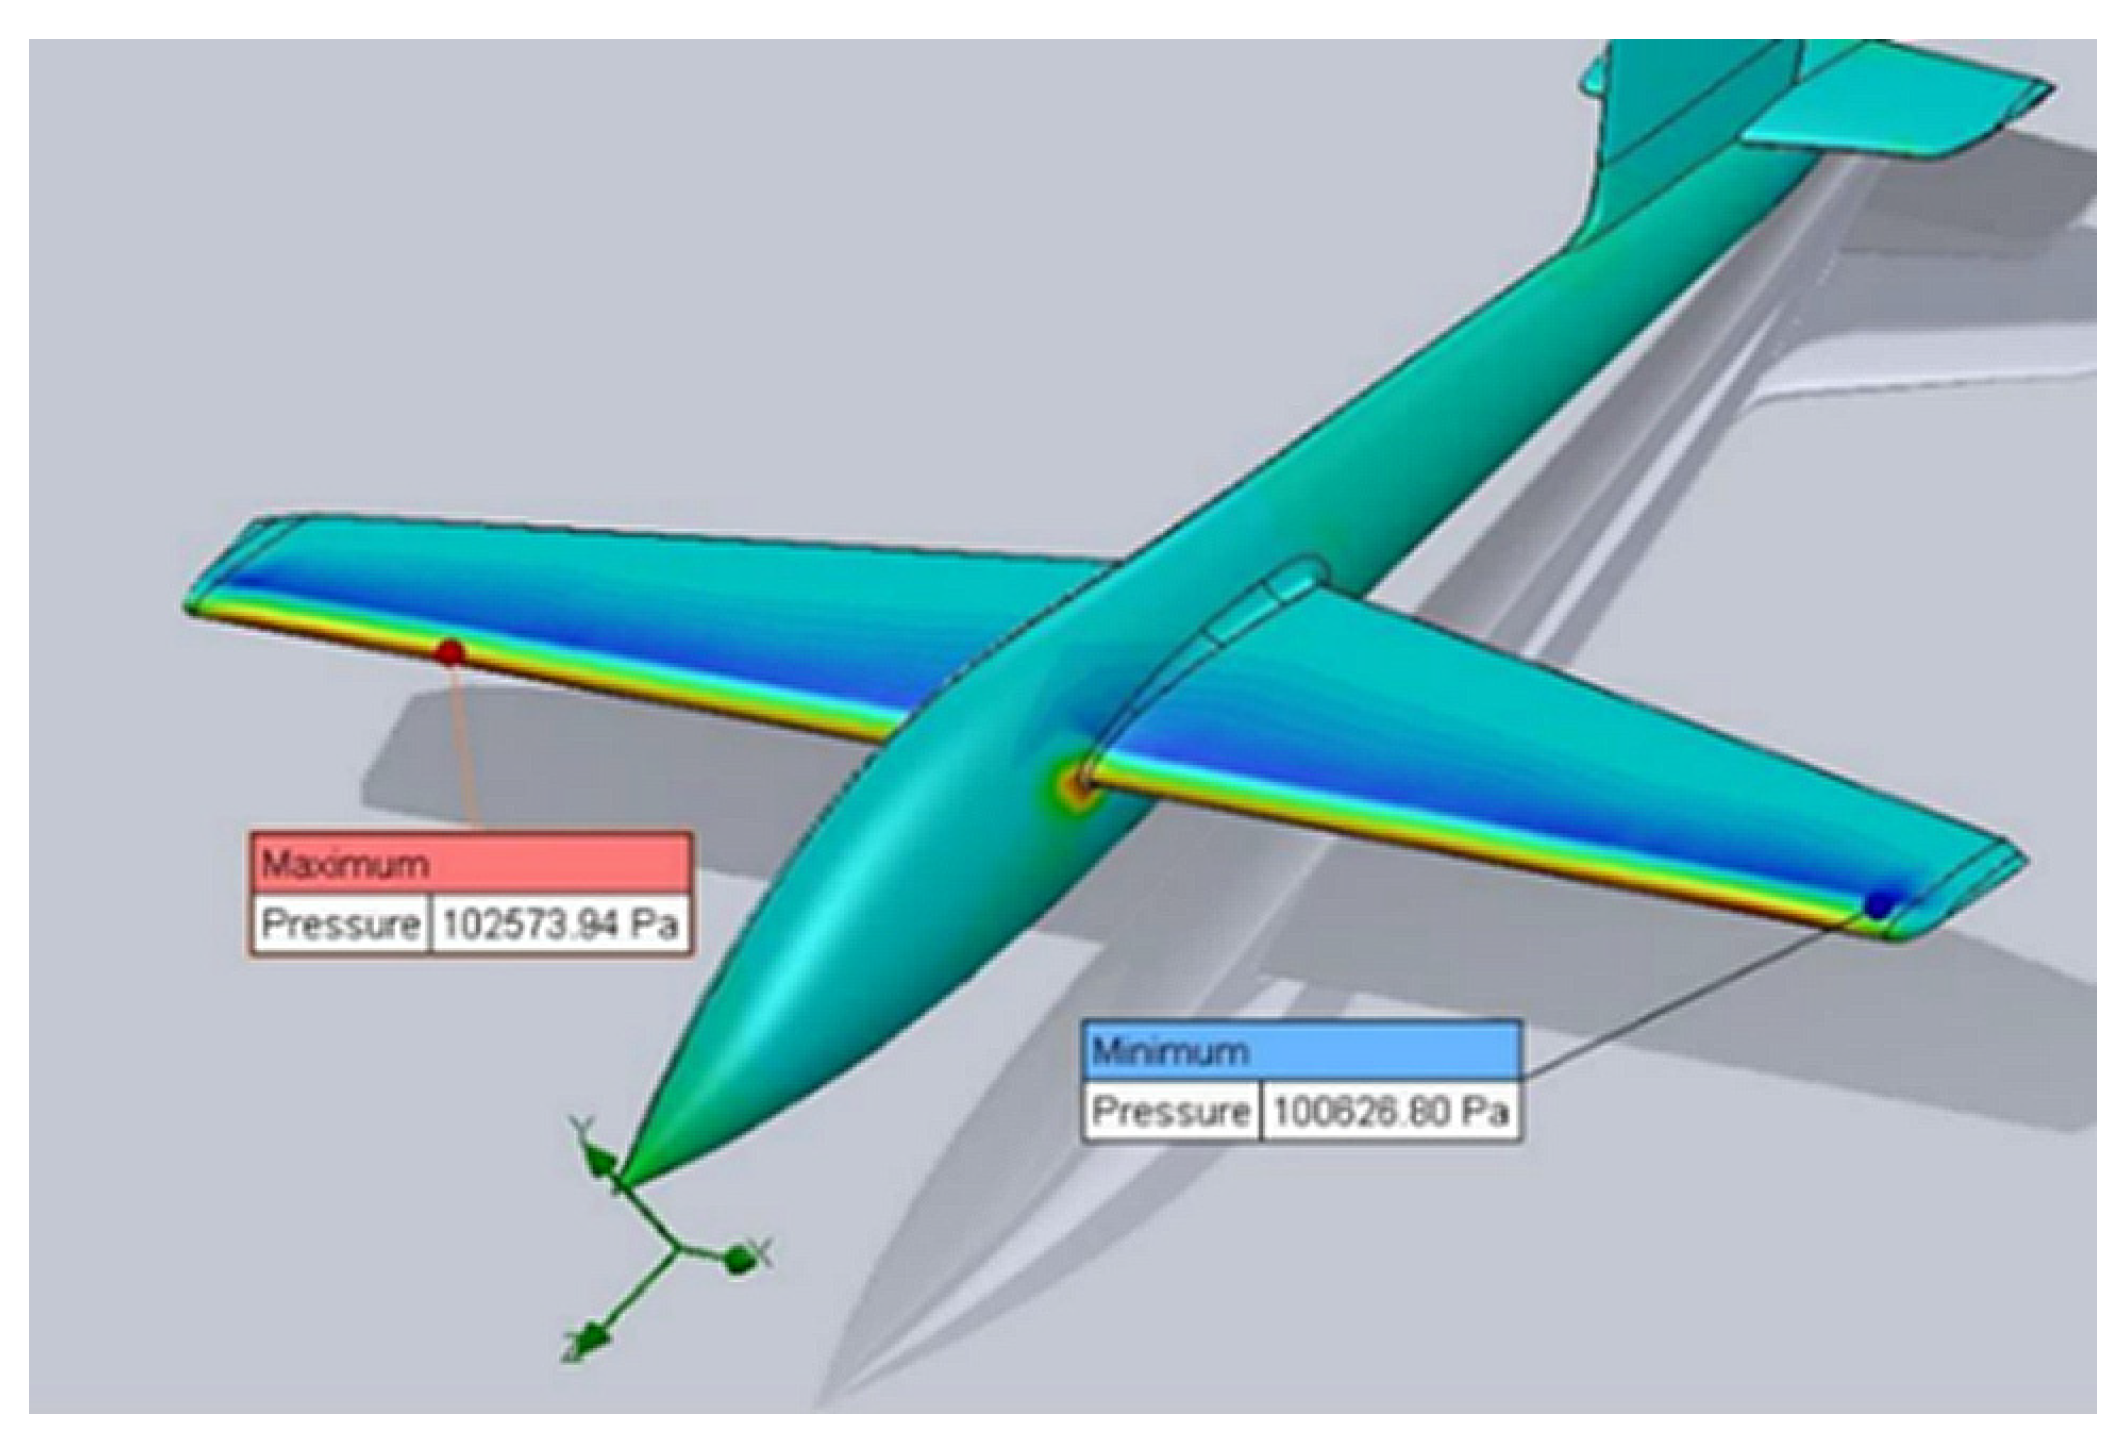
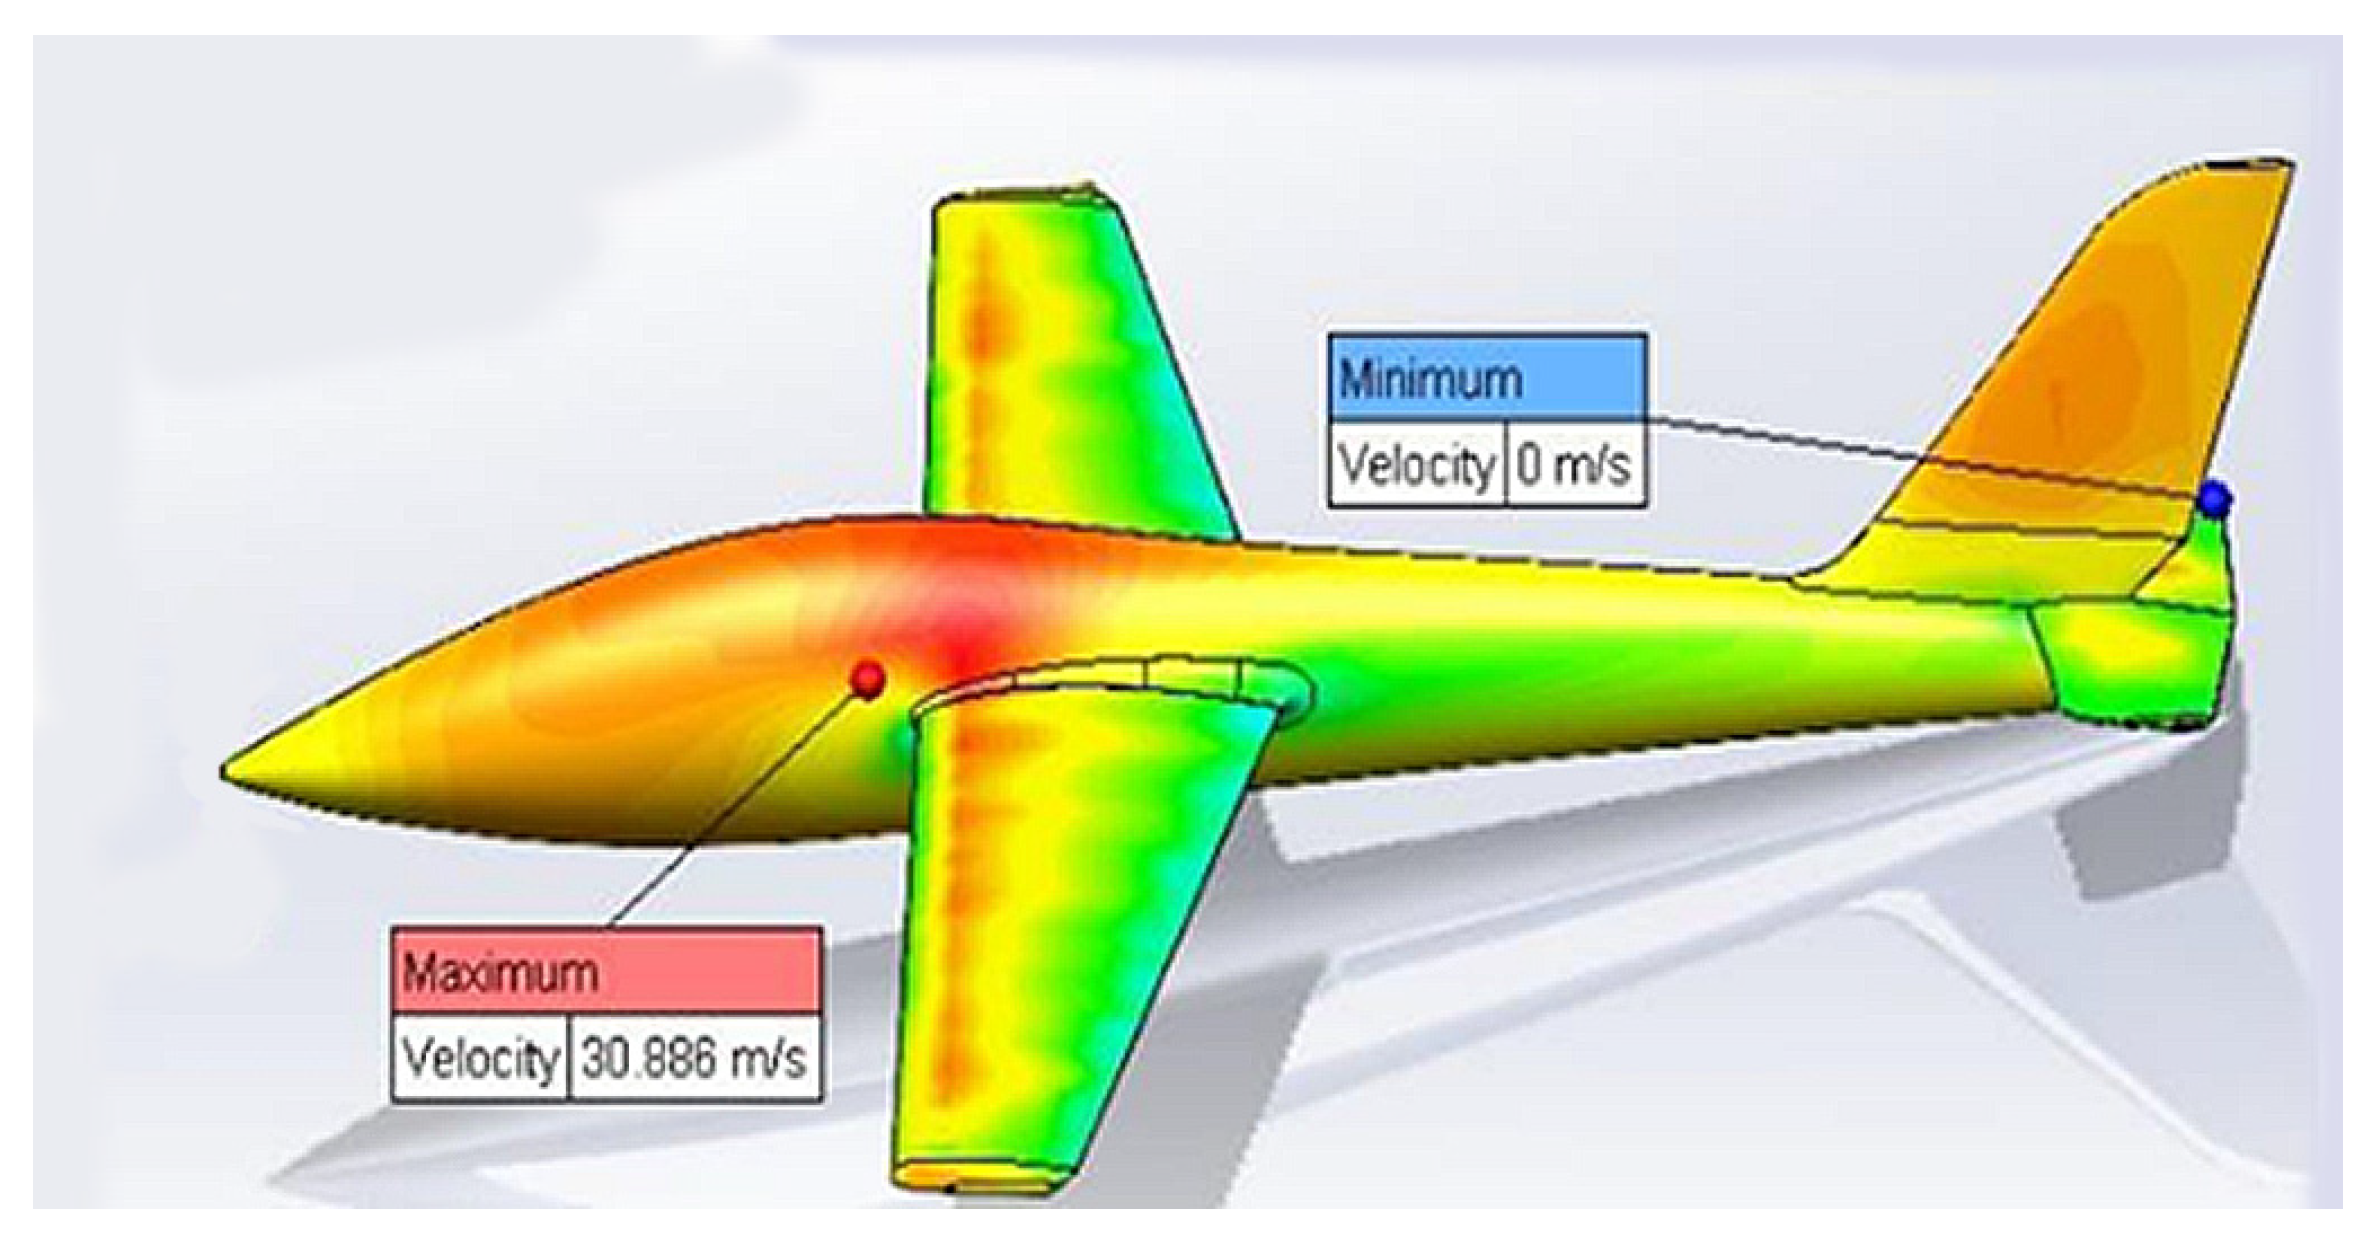
The pressure distributions across the glider’s surface, shown in Figure 13, identified high- and low-pressure regions. Higher pressure below and lower pressure above the wing confirmed the effective generation of lift. Areas of flow separation or adverse pressure gradients were also identified. Streamline analysis helped visualize flow behavior around the fuselage and wings, including zones of separation and recirculation [27]. Velocity contour plots in Figure 14 captured changes in flow speed across wetted surfaces. The results indicated smooth airflow around most surfaces, with limited separation regions. These data enabled an understanding of how surface geometry affects drag, stability, and lift across different parts of the airframe [33,34].

4. Virtual Flight Simulation and Optimization

This section demonstrates the transition from CAD modeling to a real-time simulation environment using AC3D and Simulink–FlightGear integration. A six-degree-of-freedom (6-DoF) flight dynamics model was implemented, incorporating network communication protocols and dynamic visualization tools to evaluate flight performance.

4.1. AC3D Model Conversion for Flight Simulation

Converting SolidWorks assemblies into AC3D format enhances compatibility with simulation platforms such as Simulink and FlightGear. This process simplifies the geometry by removing non-essential components, reducing file size, and preserving critical structural details. AC3D supports customizable export settings to optimize mesh resolution, material properties, and texture mapping. Its animation and rendering tools further improve model visualization for real-time rendering. As shown in Figure 15, the final glider model was exported in AC3D format and prepared for integration into the FlightGear simulator [20,35].

4.2. Simulink Integration and Real-Time Interface

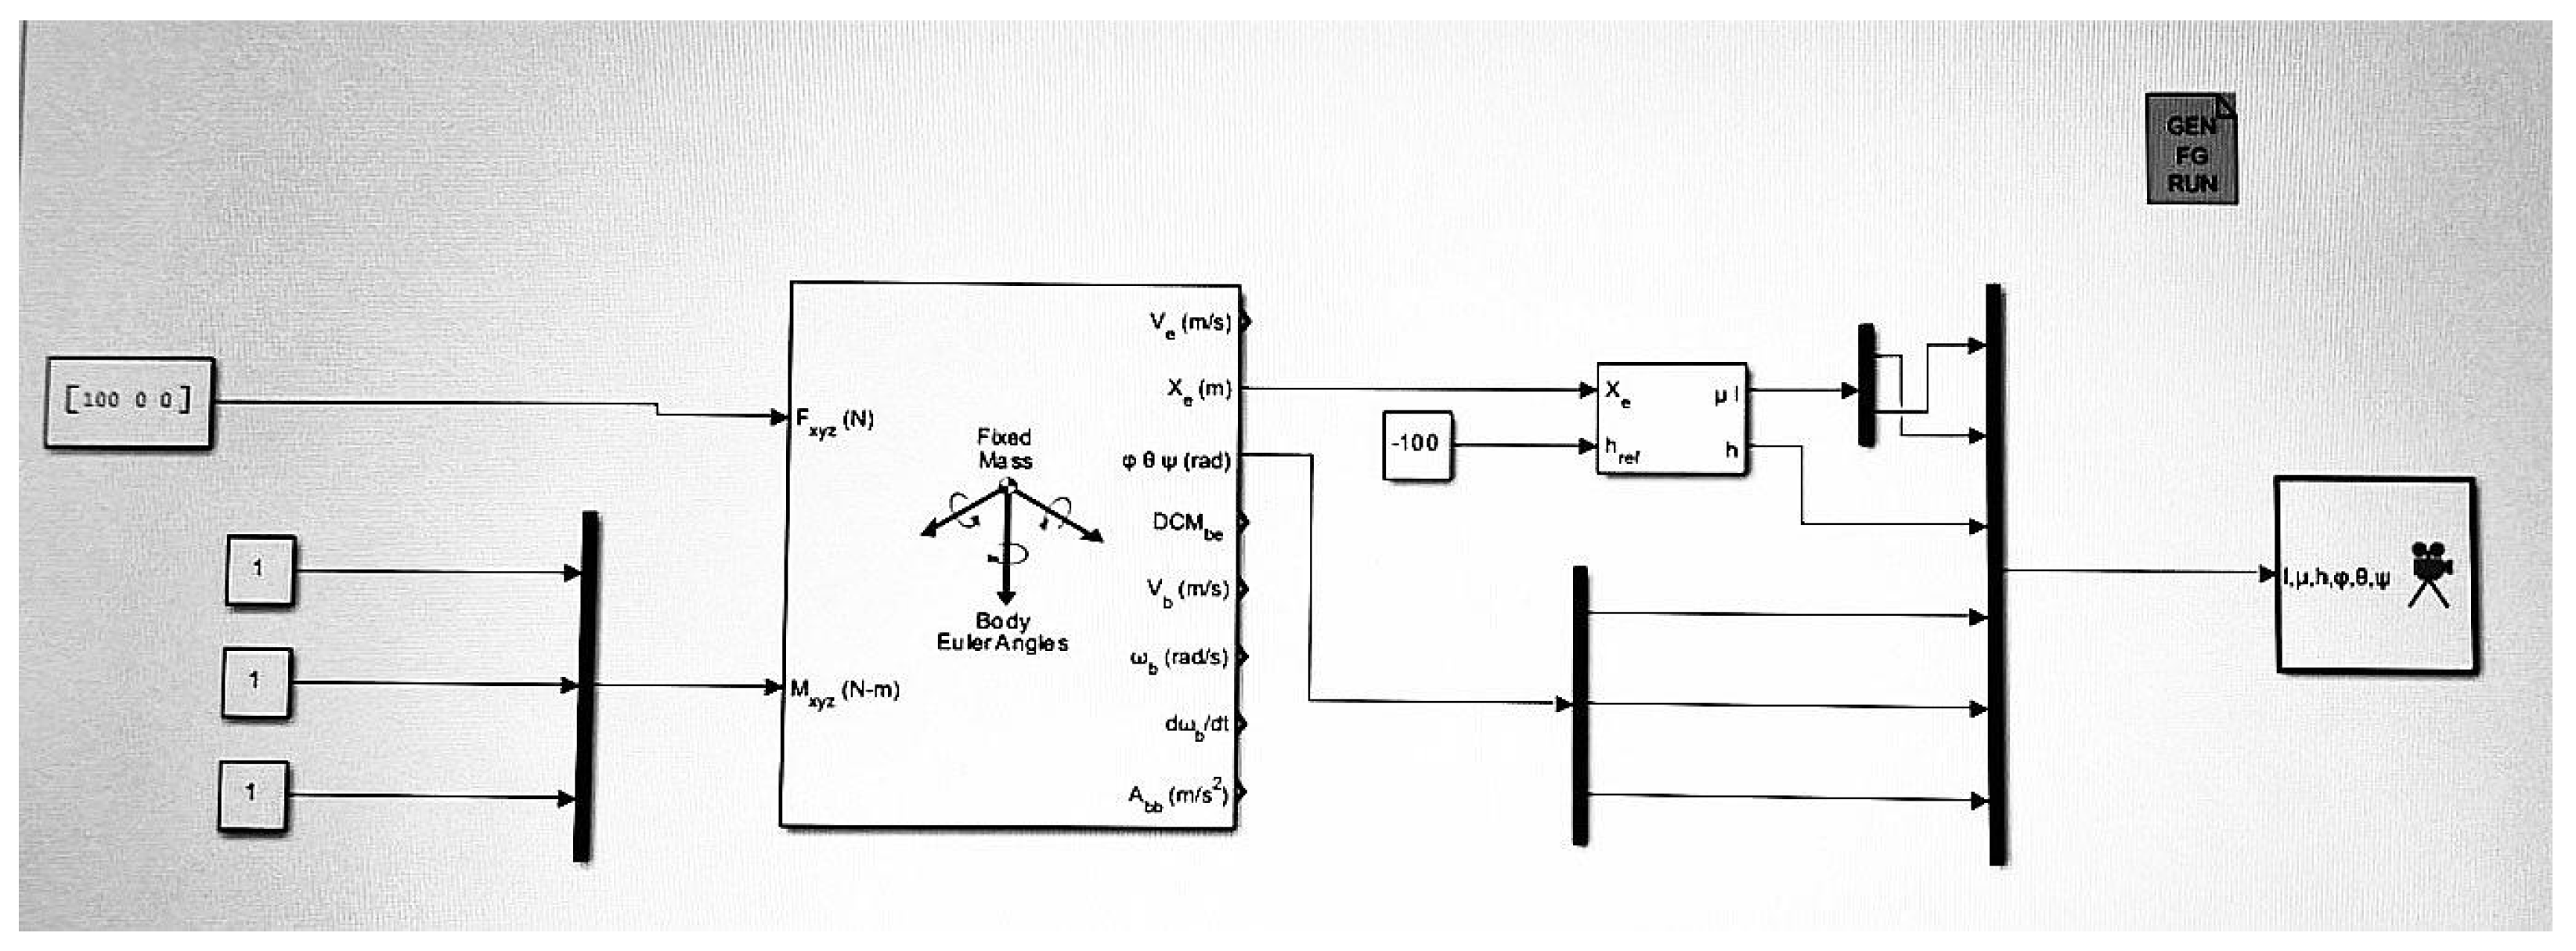
To simulate the flight dynamics, a simple model was developed using MATLAB R2017b Simulink, which is connected to FlightGear through the FlightGear Network Protocol (FGNet) to exchange aircraft data. A 6-DoF flight dynamics model was constructed, incorporating aerodynamic coefficients derived from CFD and wind tunnel data. Control inputs and state variables were transmitted to FlightGear through the Simulink block set interface, allowing real-time 3D visual feedback of flight behavior [20,35], as shown in Figure 16. The simulation altitude was set at 200 m, in compliance with UAE regulations for UAV flight testing [1]. This real-time loop setup enables future integration and testing of autopilot systems and control algorithms for flight testing under realistic environmental conditions [21].

4.3. Visualization and Flight Testing in FlightGear

FlightGear (2020.3.19) is an open-source flight simulation software that provides a highly realistic environment for simulating a wide range of aircraft models. Featuring a customizable physics engine, advanced weather modeling, and global terrain data, it offers a detailed and accurate representation of flight dynamics. In this paper, the UAV glider was evaluated within FlightGear for virtual airworthiness and control responsiveness (see Figure 17). The AC3D model was linked with the Simulink FGNet control logic, and flight tests were executed under various input and weather scenarios [36]. This allowed for the preliminary validation of the glider’s flight stability and aerodynamic behavior, providing a low-cost and efficient alternative to physical test flights during the early development stages.

5. Fabrication and Systems Integration

This section outlines the practical implementation of the UAV, utilizing 3D-printed PLA components, electronic sensor integration, control systems, and thermal protection methods.

5.1. Material Selection and Structural Assembly

Polylactic acid (PLA) was selected for the UAV’s fabrication due to its compatibility with 3D printing, cost-effectiveness, and adequate mechanical strength. Although balsa wood was initially considered, PLA offered better geometric precision and ease of manufacturing [31,37]. Key material properties are summarized in Table 4.
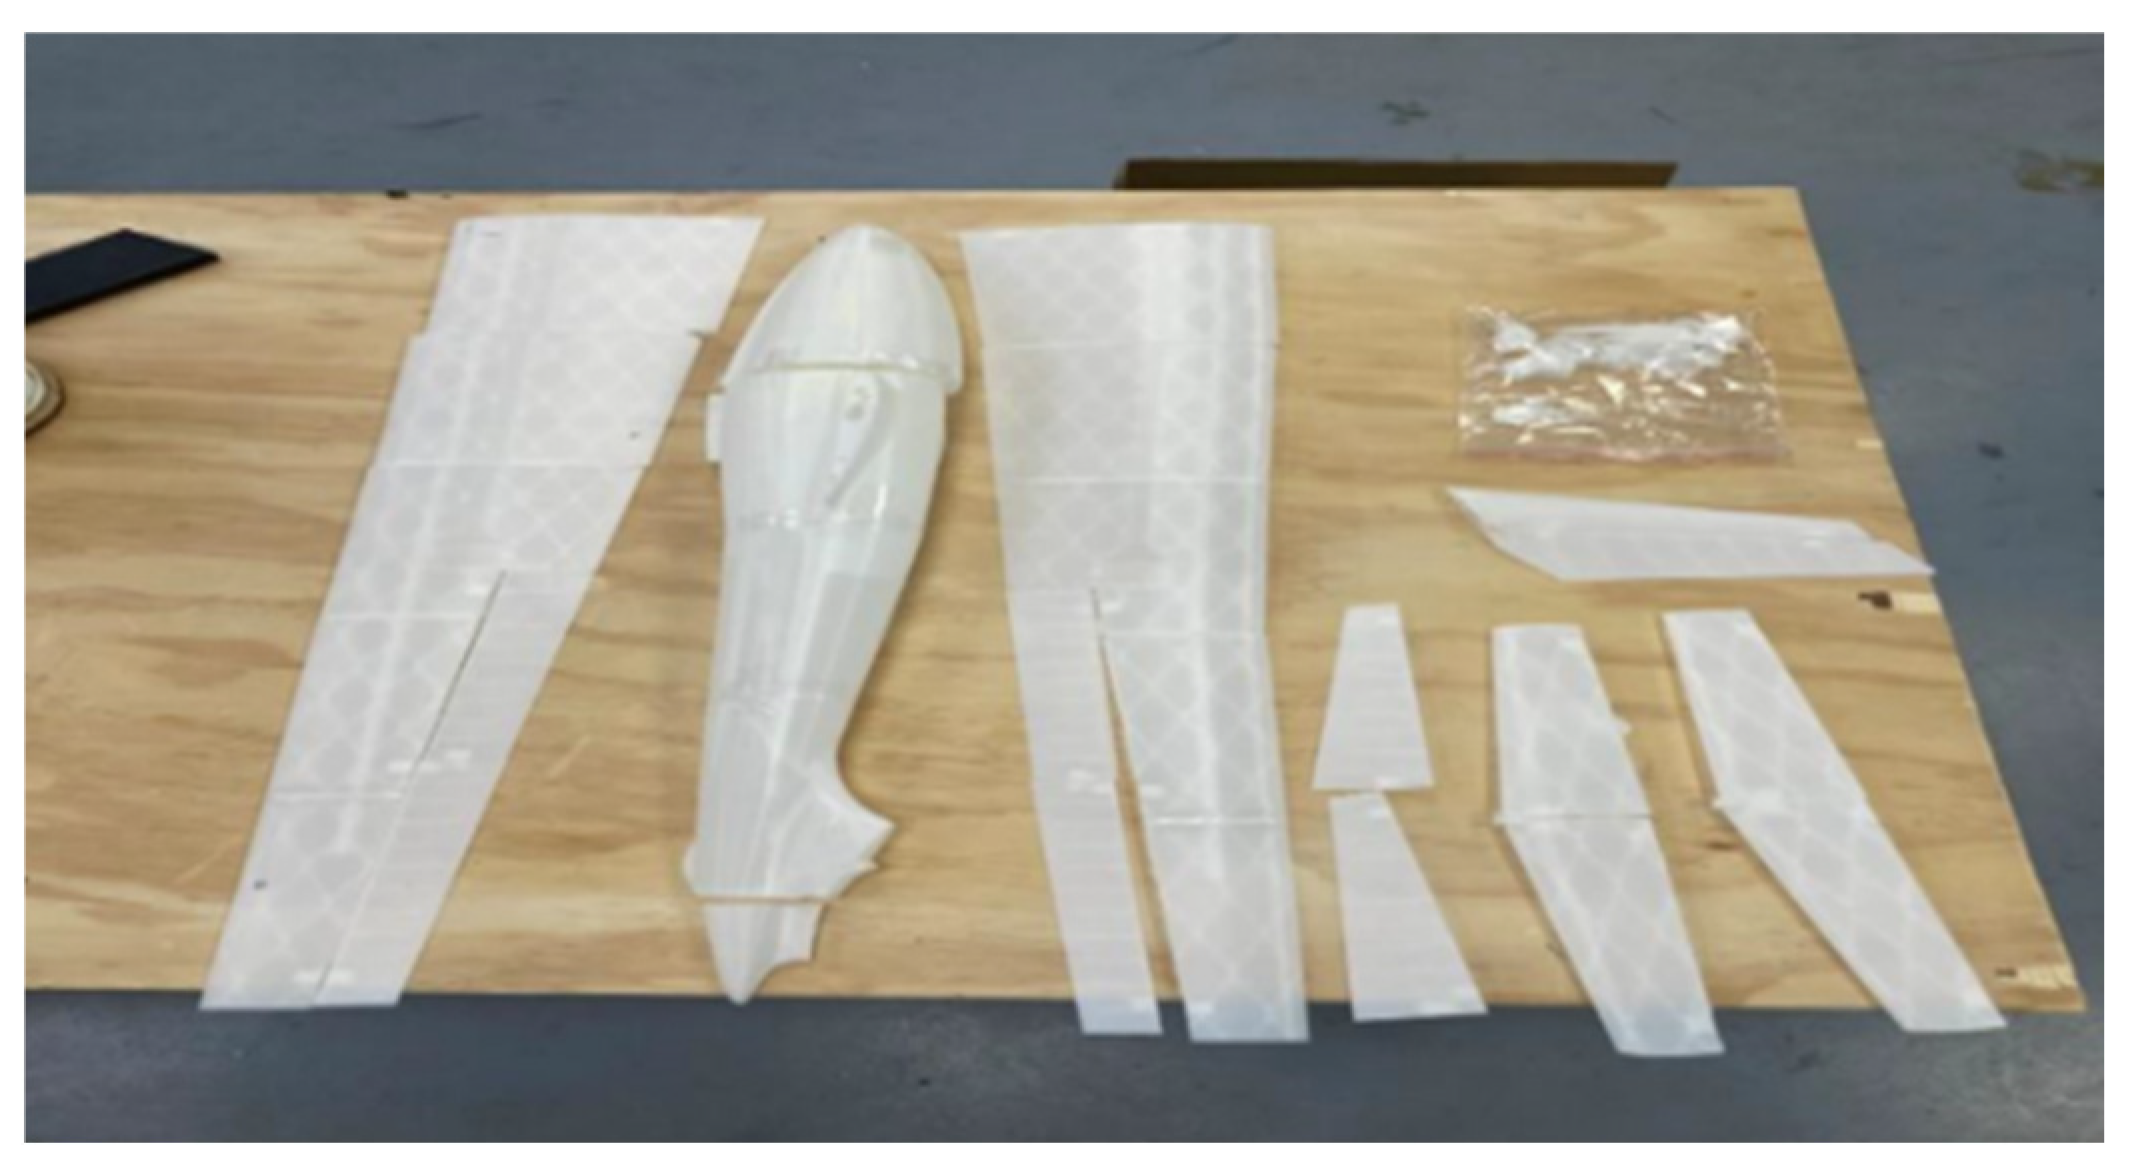
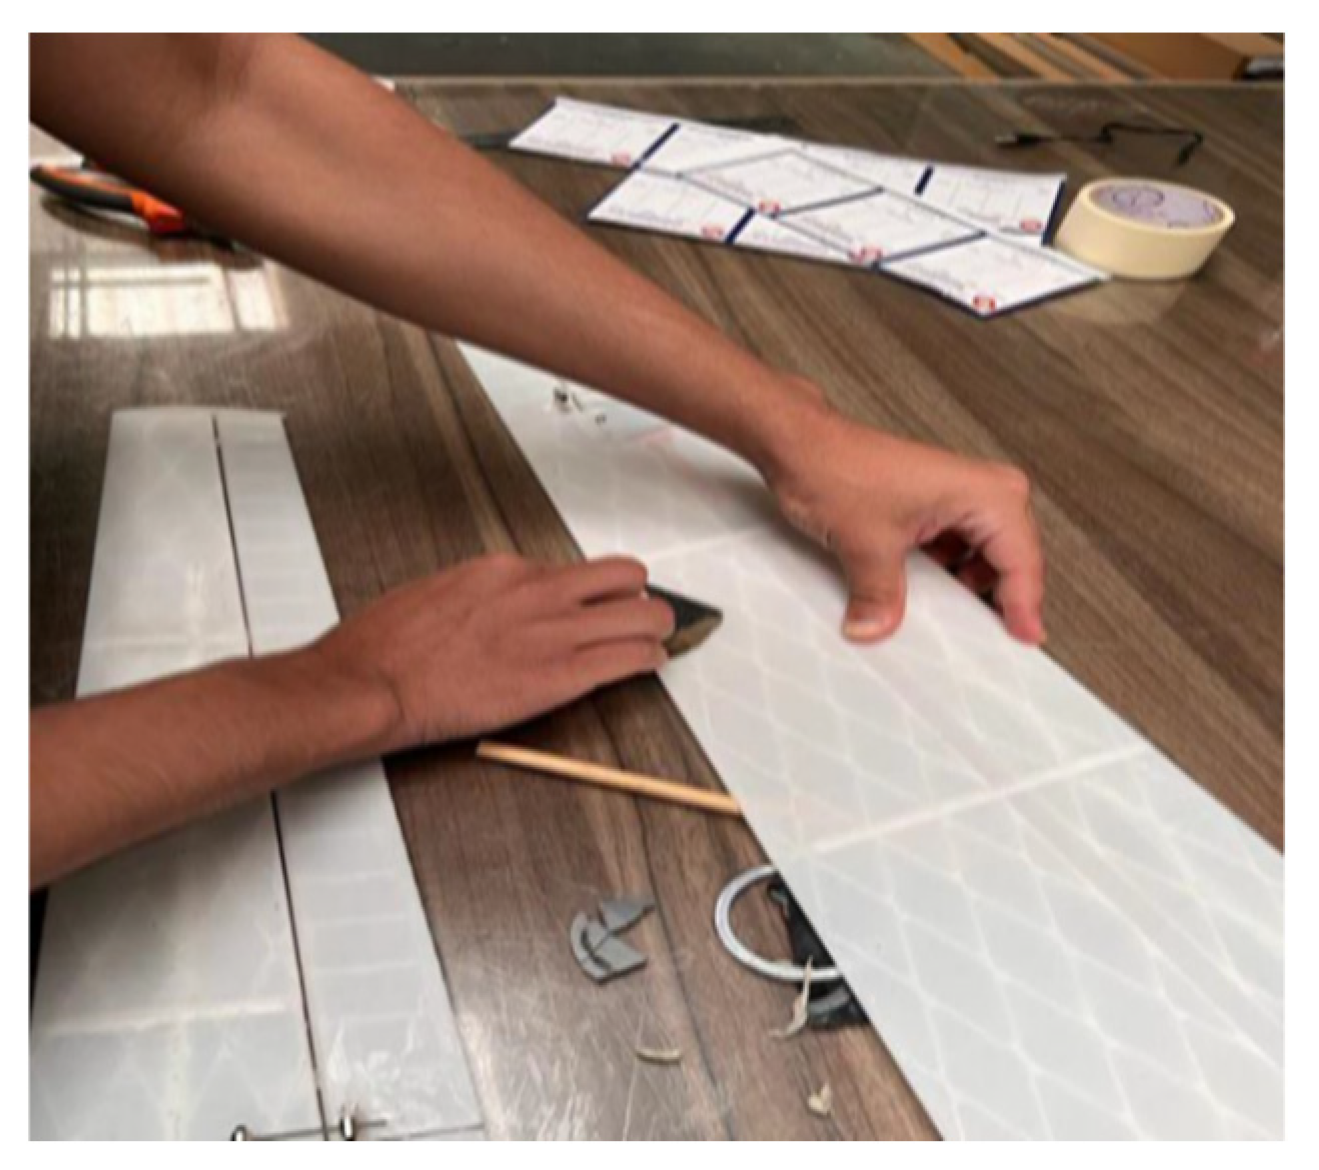
The CAD model from SolidWorks 2022 was sectioned into printable sections. Design features such as slots and connectors were incorporated to streamline assembly and ensure structural integrity. Figure 18 shows the printed components, while Figure 19 depicts the sanding process used to remove surface imperfections and achieve a smooth finish.
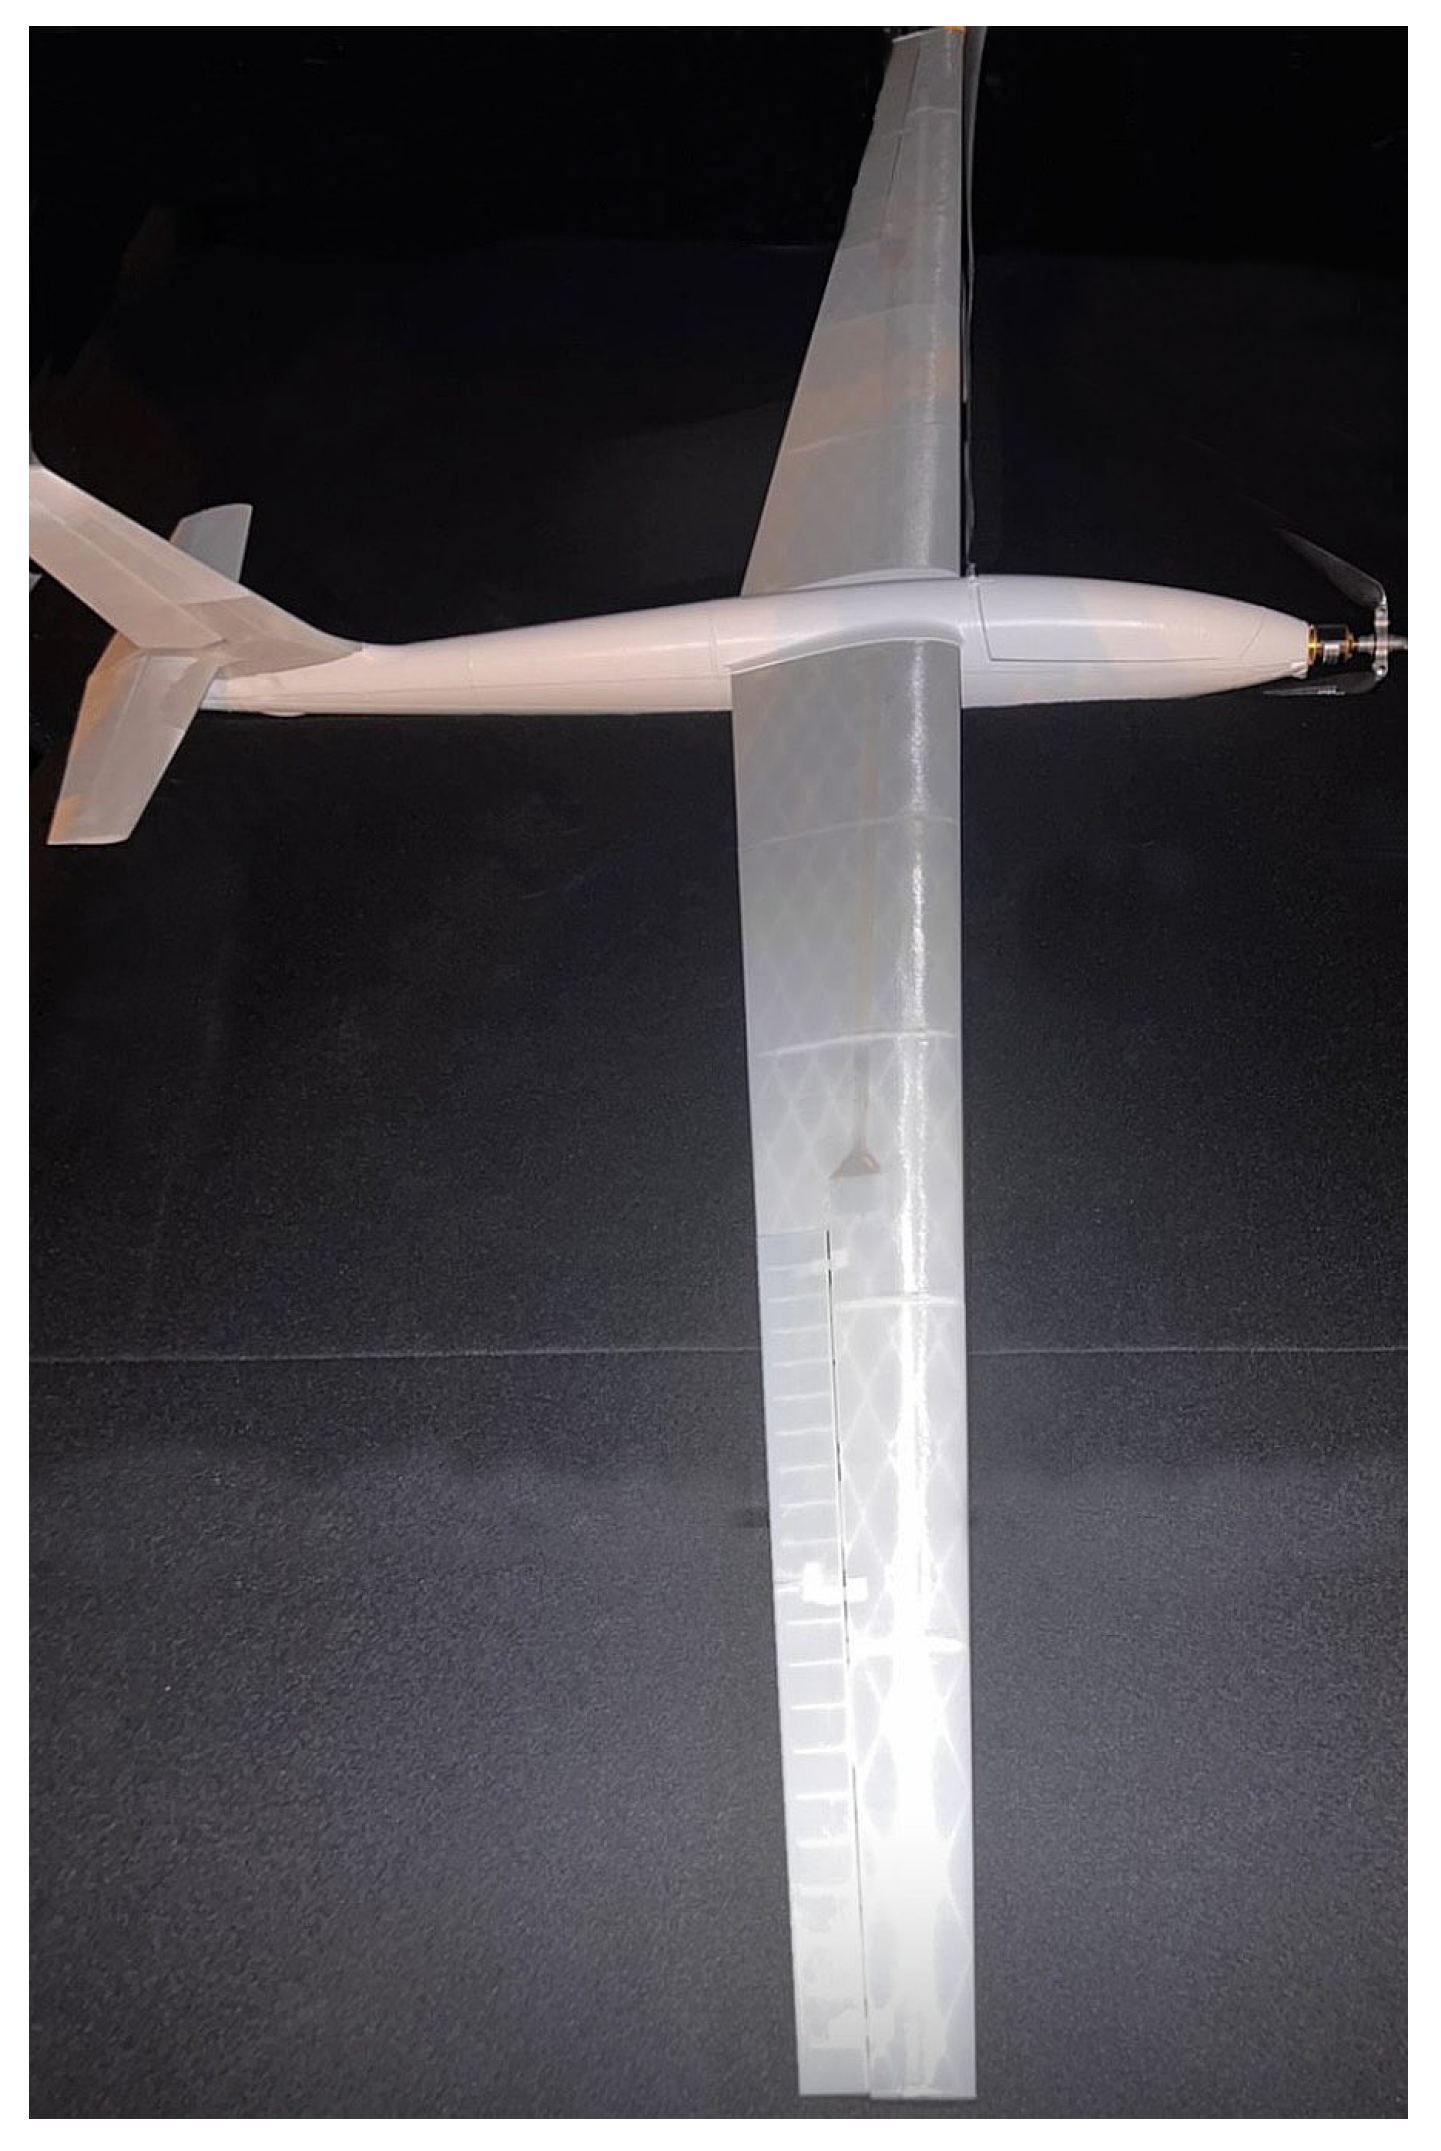
A cross-lattice internal wing structure was incorporated to increase the glider’s load-bearing capacity by approximately 12%, as confirmed through finite element analysis [30]. This design distributes aerodynamic loads efficiently while minimizing weight and enabling modular repairs. The final wing assembly, as shown in Figure 20, features a hinge joint for portability and includes control surface mounts for aileron actuation.
To evaluate the structural efficiency of the cross-lattice wing design, a finite element method (FEM) analysis was conducted using SolidWorks simulation. The internal lattice was modeled with linear tetrahedral elements to capture the load distribution across the spars and interconnecting members. Boundary conditions included fixed constraints at the wing root and uniformly distributed pressure loads simulating aerodynamic forces at cruise conditions. The applied pressure values were derived from the maximum lift coefficients obtained during CFD analysis [14,15]. Mesh convergence analysis was performed with three mesh densities, and a mesh of approximately 85,000 elements was chosen for an optimal balance between accuracy and computational efficiency. The lattice structure demonstrated a 12% improvement in maximum load-bearing capacity compared to a solid PLA wing of equivalent mass. Peak von Mises stresses remained well below the PLA yield strength (60 MPa), indicating safe operation under expected aerodynamic loads. Although preliminary, these FEM results support the viability of the cross-lattice design for lightweight UAV applications and highlight its structural advantage. Future work will focus on physical testing to corroborate these simulations.

5.2. Powertrain Integration and Embedded Control

A performance-based sizing method was used to select appropriate electrical propulsion components. Given the glider’s estimated weight of approximately 4 lbs., a target power level of 290 W was calculated using the formula:
  • Wattage = Weight × Power Performance Level
A moderate performance level of 100 was selected based on RC modeling guidelines. For this wattage, a 6-cell (6S) LiPo battery was used, yielding a nominal voltage of 22.2 V. Current draw was calculated as:
  • Current = Wattage/Voltage ≈ 13.1 A
With a safety margin of 20%, a 16A ESC was selected. Using RPM and propeller-sizing empirical formulas:
  • RPM = 0.4896 × (Wingspan2) − 162.66 × Wingspan + 20,786
  • Propeller Diameter = –0.002 × RPM + 35.607
  • Pitch = Diameter/1.57
This resulted in a 14 × 9-inch propeller configuration for optimal cruise thrust.
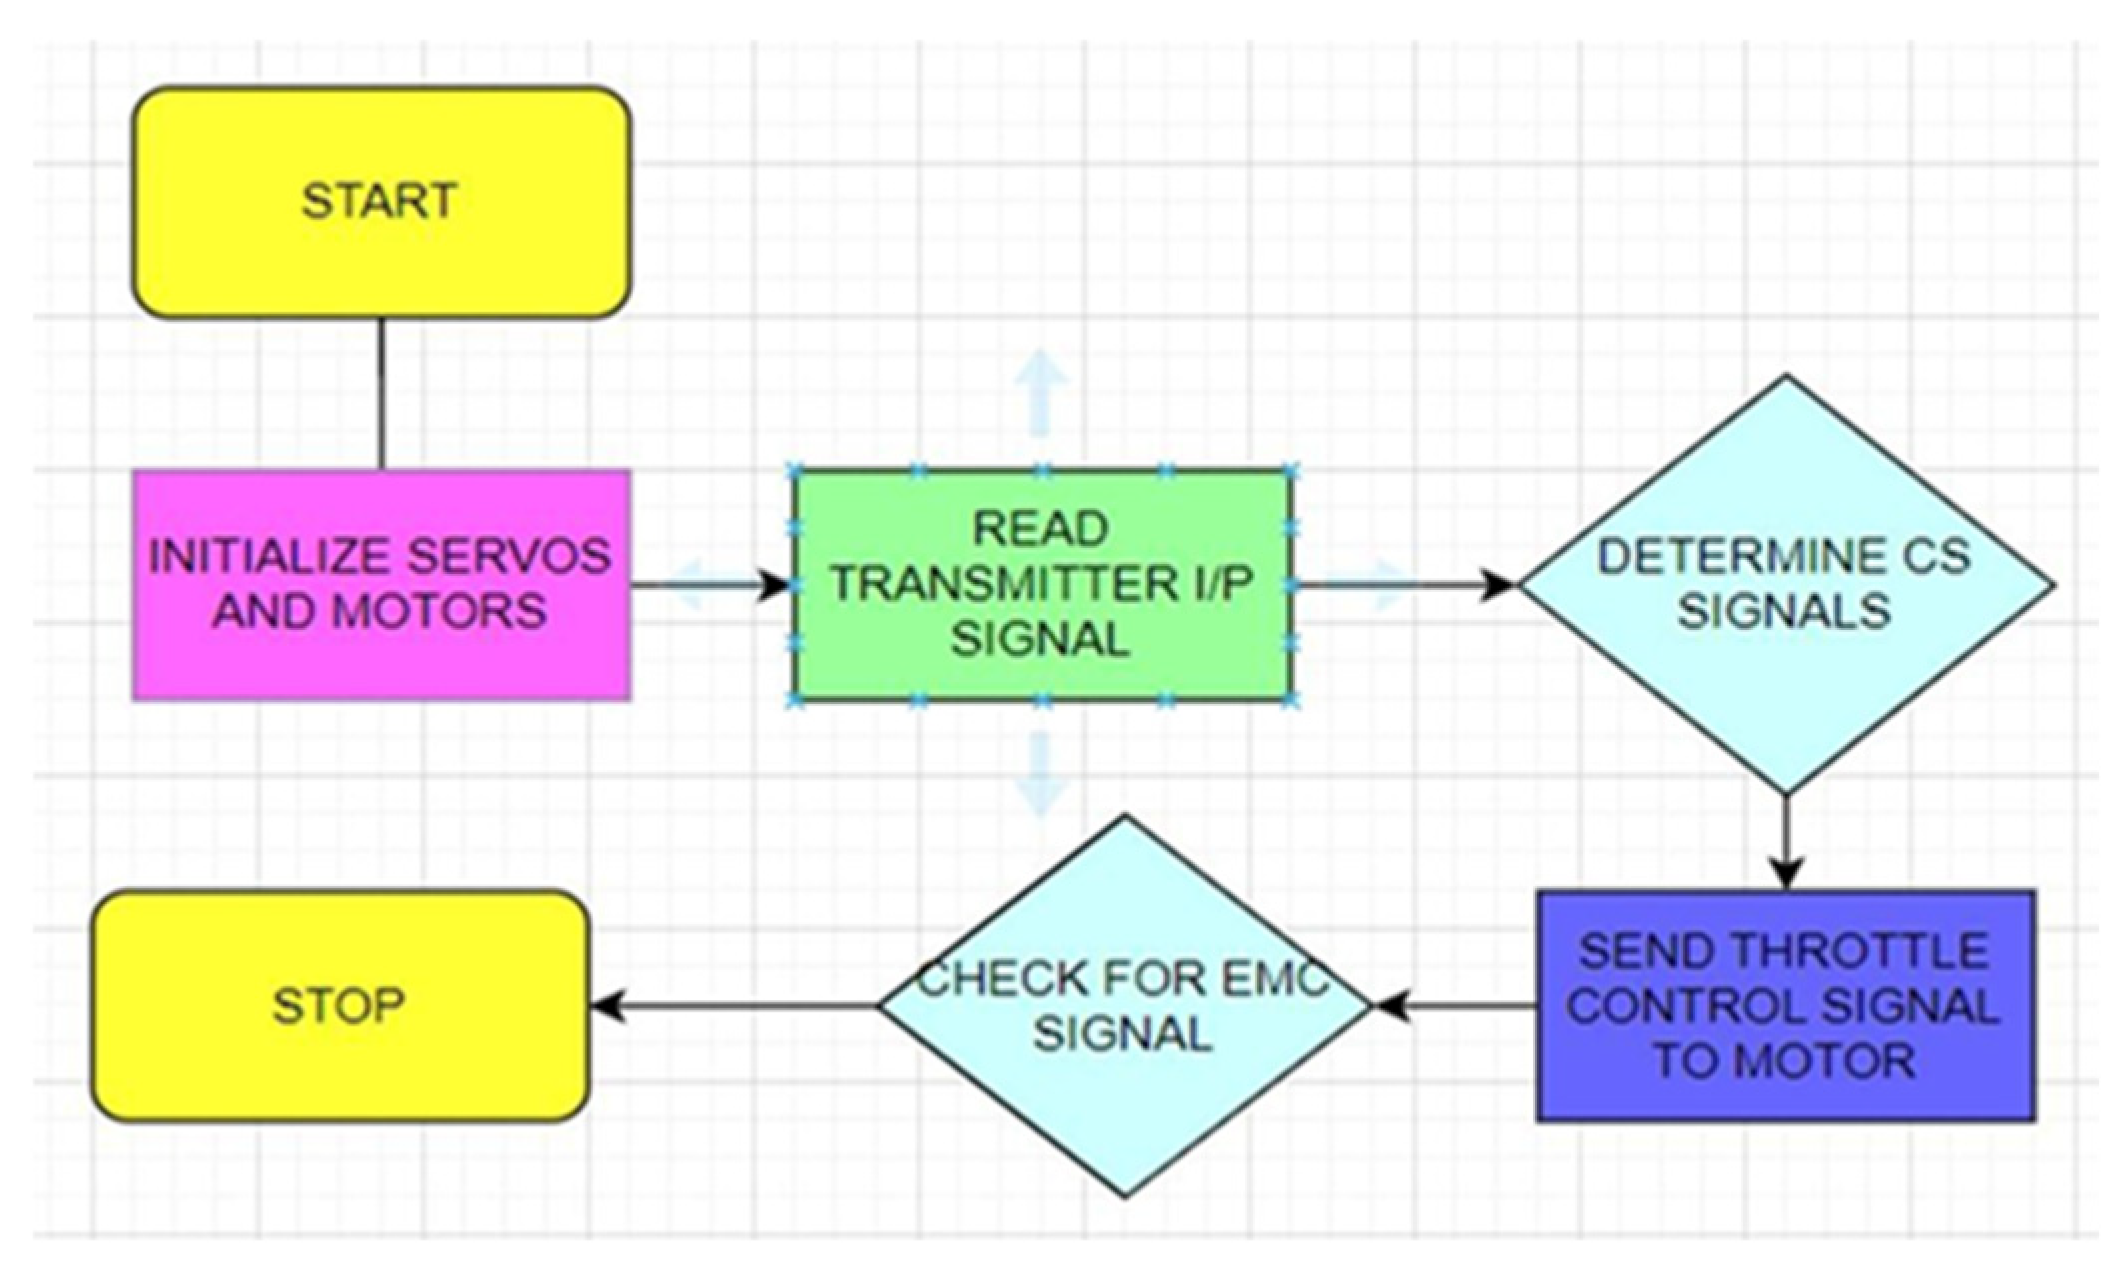
All key electronic subsystems, including the ESC, servos, and telemetry modules, were installed within the canopy compartment. Wiring was routed for minimal interference and secured with appropriate connectors. All components were positioned to maintain the center of gravity and ensure aerodynamic balance. The onboard control system interprets the transmitter signal inputs to regulate the motor throttle and actuate the control surfaces. Safety protocols include emergency cutoff (EMC) logic, enabling immediate system shutdown when triggered. The control workflow is illustrated in Figure 21.

5.3. Sensor Setup and Thermal Protection

The UAV glider integrates a lightweight sensing system comprising an ESP32-CAM module and a non-contact thermal sensor (MLX90614) [12,13]. The camera was programmed via UART using an ESP32-CAM-MB module and mounted on the forward canopy for optimal field of view. The thermal sensor was placed near the nose to capture ambient air temperature during flight. These sensors were chosen for their compact design, low power consumption, and real-time monitoring capabilities. The locations of these sensors are shown in Figure 22.
To address the PLA’s susceptibility to high temperatures, a reflective thermal coating (Therma Cool) was applied [25,37] to the fuselage exterior (see Figure 23). This coating reduces surface temperatures by 15–20 °C under direct sunlight, preserving the structural integrity of 3D-printed components. Its use ensures stable performance during extended operations in hot climates, such as those typical in the UAE.
This concludes the fabrication, systems integration, and preliminary validation phase of the UAV glider development. The following section discusses the key performance outcomes, challenges encountered, and recommendations for future improvements.

6. Discussion

The integration of aerodynamic design, CFD analysis, and wind tunnel validation demonstrated the feasibility of developing a lightweight, efficient UAV glider tailored for data collection missions. The results confirm the aerodynamic suitability of the NACA 63(3)-618 airfoil, as both CFD and experimental data showed close alignment in lift and drag values. However, several challenges emerged during the design and prototyping phases. PLA, though effective for 3D printing, exhibited structural sensitivity to prolonged sun exposure [25,31], leading to warping risks. This issue was addressed through the application of a thermal-reflective coating (ThermaCool); however, further testing under operational flight temperatures is required. From a systems perspective, the integration of ESP32-based imaging and thermal sensor modules was functionally verified on the ground. However, the lack of flight-based testing limits the validation of real-time data acquisition and environmental robustness [38,39]. Furthermore, simulation limitations arose due to reduced GPU resources, affecting visual fidelity and timing in virtual test scenarios. Future work will focus on conducting full-scale flight tests to assess system integration in dynamic conditions, improving heat resistance through alternative materials, and expanding simulation fidelity through hardware-in-the-loop frameworks. A structured uncertainty analysis and coupled propeller–airframe interaction study will also be prioritized to strengthen system reliability and aerodynamic accuracy.

7. Conclusions

This paper details the development of a glider UAV for environmental data collection, integrating aerodynamic optimization, sensor systems, and flight simulation. Aerodynamic performance was enhanced through spanwise variation between the NACA 63(3)-618 and NACA 4415 airfoils, with CFD results closely matching wind tunnel data. The airframe was fabricated from PLA with a cross-lattice design and integrated with low-cost onboard electronics. Unlike traditional shell-type or monolithic PLA structures, the internal lattice framework strategically channels aerodynamic loads through a lightweight truss-like geometry, significantly enhancing rigidity and damage tolerance without significant weight penalties. As shown in [37], conventional PLA-based glider designs tend to suffer from premature deformation due to low heat deflection temperatures and limited internal reinforcement, particularly under solar heating or sustained aerodynamic loading. In contrast, the design presented here introduces both geometric stiffness and thermal resilience through a combination of distributed internal supports and a heat-reflective coating. This approach is particularly well suited for glider UAVs operating in field conditions, where reliability, structural endurance, and material limitations must be carefully balanced. While full-system flight validation is ongoing, early simulations and stress analyses suggest that this integrated lattice approach marks a significant advancement in the design of low-cost, field-deployable UAVs.

Author Contributions

Conceptualization, methodology, final analysis, J.E., S.S. and Z.A.I.; supervision, E.L.N. All authors have read and agreed to the published version of the manuscript.

Funding

This research received no external funding.

Data Availability Statement

No new data were created.

Conflicts of Interest

The authors declare no conflict of interest.

References

  1. Stöcker, C.; Bennet, R.M.; Nex, F.; Gerke, M.; Zevenbergen, J.A. Review of the Current State of UAV Regulations. Remote Sens. 2017, 9, 459. [Google Scholar] [CrossRef]
  2. Lucia, L.D.; Vegni, A.M. UAV Main applications: From military to agricultural fields. In Internet of Unmanned Things (IoUT) and Mission-Based Networking. Internet of Things; Kerrache, C.A., Calafate, C., Lakas, A., Lahby, M., Eds.; Springer: Cham, Switzerland, 2023. [Google Scholar]
  3. Shakhatreh, H. Unmanned Aerial Vehicles (UAVs): A Survey on Civil Applications and Key Research Challenges. IEEE Access 2019, 7, 48572–48634. [Google Scholar] [CrossRef]
  4. Del Cerro, J.; Cruz Ulloa, C.; Barrientos, A.; de León Rivas, J. Unmanned Aerial Vehicles in Agriculture: A Survey. Agronomy 2021, 11, 203. [Google Scholar] [CrossRef]
  5. Kim, J.; Kim, S.; Ju, C.; Son, H.I. Unmanned Aerial Vehicles in Agriculture: A Review of Perspective of Platform. Control, and Applications. IEEE Access 2019, 7, 105100–105115. [Google Scholar] [CrossRef]
  6. Brown, C.; Miller, D. The future of UAVs in sustainable aviation. Aerosp. Technol. Rev. 2019, 12, 98–105. [Google Scholar]
  7. Li, Y. An Autonomous Glider for Marine Surveillance. Int. J. Intell. Robot. Appl. 2018, 2, 427–439. [Google Scholar]
  8. Zhang, Y.; Zhou, Y.; Chen, W.; Zhang, W.; Gao, F. Design, modeling and numerical analysis of a WEC-Glider (WEG). Renew. Energy 2022, 188, 911–921. [Google Scholar] [CrossRef]
  9. Finn, R.; Wright, D. Unmanned aircraft systems: Surveillance, ethics, and privacy in civil applications. Comput. Law Secur. Rev. 2022, 28, 184–194. [Google Scholar] [CrossRef]
  10. Goetzendorf-Grabowski, T.; Rodzewicz, M. Design of UAV for photogrammetric mission in Antarctic Area. Proc. Inst. Mech. Eng. Part G J. Aerosp. Eng. 2016, 231, 1660–1675. [Google Scholar] [CrossRef]
  11. Rango, A.; Laliberte, A. Impact of flight regulations on effective use of unmanned aircraft systems for natural resources applications. J. Appl. Remote Sens. 2010, 4, 043539. [Google Scholar]
  12. Alkaabi, K.; Abuelgasim, A. Applications of Unmanned Aerial Vehicle (UAV) Technology for Research and Education in UAE. Int. J. Soc. Sci. Arts Humanit. 2017, 5, 2321–2326. [Google Scholar]
  13. Rathinakumar, G.; Ntantis, E.L. Designing a quadcopter for fire and temperature detection with an infrared camera and PIR sensor. Drones Auton. Veh. 2024, 1, 10003. [Google Scholar] [CrossRef]
  14. Arora, S.; Ntantis, E.L. Customization and Payload Integration of Hexacopter for Enhanced Grocery Delivery. Multidiscip. Sci. J. 2024, 6, 2024126. [Google Scholar] [CrossRef]
  15. Zawawi, H. A review: Fundamentals of computational fluid dynamics (CFD). AIP Conf. Proc. 2018, 2030, 020252. [Google Scholar]
  16. Rao, R.K.S. Modelling and simulation of aerofoil element. Int. Res. J. Eng. Technol. 2018, 5, 2056–2059. [Google Scholar]
  17. Joseph Daniel, S. Daniel Performance Analysis of Asymmetrical Airfoil for Subsonic Flight. Int. J. Progress. Res. Sci. Eng. 2020, 1, 8–11. [Google Scholar]
  18. Demir, H.; Ozden, M.; Genc, M.S.; Cagdas, M. Numerical investigation of flow on NACA4412 aerofoil with different aspect ratios. EPJ Web Conf. 2016, 114, 02016. [Google Scholar] [CrossRef]
  19. Yousefi, K.; Saleh, R. The effects of trailing edge blowing on aerodynamic characteristics of the NACA 0012 airfoil and optimization of the blowing slot geometry. J. Theor. Appl. Mech. 2014, 52, 165–179. [Google Scholar]
  20. Ntantis, E.L.; Xezonakis, V. Aerodynamic design optimization of a NACA 0012 airfoil: An introductory adjoint discrete tool for educational purposes. Int. J. Mech. Eng. Educ. 2024, 53, 611–630. [Google Scholar] [CrossRef]
  21. Chaturvedi, D.K. Modeling and Simulation of Systems Using MATLAB and Simulink; CRC Press: Boca Raton, FL, USA, 2010. [Google Scholar]
  22. Horri, N.; Pietrasko, M. A tutorial and review on flight control co-simulation using Matlab/Simulink and Flight Simulators. Automation 2022, 3, 486–510. [Google Scholar] [CrossRef]
  23. Ho, C.M.; Carr, L.W. The aerodynamic characteristics of NACA 4-digit and 6-series airfoils in subsonic flow. J. Aircr. 1971, 8, 987–992. [Google Scholar]
  24. Wang, L.; Li, Y.; Liao, Y.; Pan, K.; Zhang, W. Adaptive heading control of unmanned wave glider with heading information fusion. Control Eng. Pract. 2019, 85, 216–224. [Google Scholar]
  25. Chai, J.; Conlon, B. Conceptual Design of a Martian Reconnaissance Glider; American Geographic Union: Washington, DC, USA, 2020. [Google Scholar]
  26. Spinner, S. An Overview of High Fidelity CFD Engine Modeling. AIAA SciTech 2022, 45, 2022. [Google Scholar]
  27. Ntantis, E.L.; Francis, E.; Fazel, H.; George, J.; Blal, M.; Emthias, M.; Pugazendi, V. Numerical study on a supersonic flow around a bullet. WSEAS Trans. Fluid Mech. 2023, 18, 1–9. [Google Scholar] [CrossRef]
  28. Ntantis, E.L.; Francis, E.; Pugazendi, V.; George, J.; Tarek, A.; Emthias, M.; Rasheed, S. Study of sinusoidal perturbations on the leading edge of an aircraft wing. J. Aeronaut. Astronaut. Aviat. 2021, 53, 375–386. [Google Scholar]
  29. Lehmann, M. Esoteric Pull and Esoteric Push: Two Simple In-Place Streaming Schemes for the Lattice Boltzmann Method on GPUs. Computation 2022, 10, 92. [Google Scholar] [CrossRef]
  30. Hosseini, S.; Vaziry-Zanjany, M.A.; Ovesy, H.R. A Framework for Aircraft Conceptual Design and Multidisciplinary Optimization. Aerospace 2024, 11, 273. [Google Scholar] [CrossRef]
  31. Pornet, C.; Isikveren, A.T. Conceptual design of hybrid-electric transport aircraft. Prog. Aerosp. Sci. 2015, 79, 114–135. [Google Scholar] [CrossRef]
  32. Garmann, D.; Miguel, R.V.; Orkwis, P.D. Three-dimensional flow structure and aerodynamic loading on a revolving wing. Phys. Fluids 2013, 25, 034101. [Google Scholar] [CrossRef]
  33. Epstein, B. Comparative study of three-dimensional wing drag minimization by different optimization techniques. J. Aircr. 2012, 46, 526–541. [Google Scholar] [CrossRef]
  34. Zhao, A. Analysis on the Aerodynamic Characteristics of a Continuous Whole Variable Camber Airfoil. J. Phys. Conf. Ser. 2019, 1215, 012005. [Google Scholar] [CrossRef]
  35. Perry, A.R. The FlightGear Flight Simulator History, Status and Future; Citeseer: Princeton, NJ, USA, 2021. [Google Scholar]
  36. Barrio, L.D.; Korek, W.; Millidere, M.; Whidborne, J. Analysis of Visualisation Systems in Flight Simulators. In Proceedings of the AIAA AVIATION 2023 Forum, San Diego, CA, USA, 12–16 June 2023; pp. 2023–3476. [Google Scholar]
  37. Leon, A.E.; Pineda, R.; Yanez, A.; Caggiano, A. Development of a Low-Cost Glider UAV for Environmental Monitoring. Materials 2020, 13, 2310. [Google Scholar]
  38. Dalamagkidis, K. Classification of UAVs. In Handbook of Unmanned Aerial Vehicles; Valavanis, K., Vachtsevanos, G., Eds.; Springer: Dordrecht, The Netherlands, 2015. [Google Scholar]
  39. Adams, S.; Friedland, C.A. A Survey of Unmanned Aerial Vehicle (UAV) Usage for Imagery Collection in Disaster Research and Management. In Proceedings of the 9th International Workshop on Remote Sensing for Disaster Response, Stanford, CA, USA, 15–16 September 2011; pp. 15–16. [Google Scholar]
Figure 1. Airfoil selections and coordinates for the glider.
Drones 09 00481 g001
Figure 2. Isometric and side profile view of the NACA 63(3)-618 and NACA 4415 airfoils.
Drones 09 00481 g002
Figure 3. Polar charts for Clark Y and GOE 796 [15,24].
Drones 09 00481 g003
Figure 4. Polar charts for NACA 63(3)-618 and NACA 4415 [15,24].
Drones 09 00481 g004
Figure 5. C-Type structured mesh.
Drones 09 00481 g005
Figure 6. Velocity magnitude contours around the airfoil, showing flow acceleration over the upper surface. Colors indicate speed from low (blue) to high (red/orange).
Drones 09 00481 g006
Figure 7. Airfoil model mounted in wind tunnel with electronic reading interface. Ambient temperature: 18 °C, static pressure: 27.9 mm Hg, velocity: 21.3 m/s at 75% fan speed.
Drones 09 00481 g007
Figure 8. Inclined manometer readings at low fan speed (20%) and max fan speed (100%).
Drones 09 00481 g008
Figure 9. Propeller flow simulation (LBM) at low and maximum speeds. Colors represent velocity and vorticity: yellow/red indicate high intensity, purple/blue show low intensity.
Drones 09 00481 g009
Figure 10. Glider blueprint: top, front, and side views.
Drones 09 00481 g010
Figure 11. Orthographic projections and isometric view of the glider.
Drones 09 00481 g011
Figure 12. Control volume setting for full glider simulation.
Drones 09 00481 g012
Figure 13. Pressure distribution across glider surfaces. The maximum pressure observed is 102,573.94 Pa near the nose, while the minimum pressure is 100,626.80 Pa along the wing’s trailing edge.
Drones 09 00481 g013
Figure 14. Velocity contour of the glider’s wetted area, showing a maximum velocity of 30.886 m/s near the nose and a minimum of 0 m/s at the trailing edge. The contour colors represent velocity magnitude, with red indicating high-velocity regions and blue indicating low-velocity areas.
Drones 09 00481 g014
Figure 15. CAD model converted to AC3D format for simulation.
Drones 09 00481 g015
Figure 16. Simulink model connected to the FlightGear interface.
Drones 09 00481 g016
Figure 17. Front and rear view of the UAV glider in FlightGear simulation.
Drones 09 00481 g017
Figure 18. 3D-printed parts of the glider.
Drones 09 00481 g018
Figure 19. Sanding process of the components.
Drones 09 00481 g019
Figure 20. Cross-lattice design and layout of the wing.
Drones 09 00481 g020
Figure 21. Control system logic flowchart.
Drones 09 00481 g021
Figure 22. ESP32-CAM mounted on the canopy (left), and the thermal sensor mounted behind the brushless motor (right).
Drones 09 00481 g022
Figure 23. Application of ThermaCool coating on the glider fuselage.
Drones 09 00481 g023
Table 1. Mesh number independence table.
Mesh NumbersCLCDCL/CD
30,0000.5480.02918.51
35,0000.5890.02820.49
40,0000.5970.02523.32
45,0000.6030.02425.89
50,0000.6130.02325.89
55,0000.6250.02129.74
60,0000.6310.01932.17
65,0000.6550.01541.80
70,0000.6590.01445.09
75,0000.6650.01445.51
Table 2. Polar calculations from the wind tunnel experiment.
CLCDLift (N)Drag (N)
0.5160.0261256526
0.5460.0261259549
0.5490.0261526526
0.5460.0281265598
0.5910.0261289540
0.5190.0251247562
0.5690.0241263597
Table 3. CFD vs. wind tunnel comparison.
ParameterCFD (ANSYS)Wind Tunnel% Deviation
Lift Coefficient (CL)0.52–0.600.52–0.61~3–5%
Drag Coefficient (CD)0.025–0.0300.025–0.030<5%
Lift Force (N)1250–13101247–1313~5%
Drag Force (N)500–540502–549~5–10%
Table 4. PLA filament properties.
PropertiesValues
Density1.24 g/ c m 3
Tensile Strength60 MPa
Flexural Strength108 MPa
Elongation9%
Young’s Modulus3100 MPa
Shore Hardness, D85 Sh D
Melting Temperature145–160°C
Glass Transition Temperature566–64°C
Disclaimer/Publisher’s Note: The statements, opinions and data contained in all publications are solely those of the individual author(s) and contributor(s) and not of MDPI and/or the editor(s). MDPI and/or the editor(s) disclaim responsibility for any injury to people or property resulting from any ideas, methods, instructions or products referred to in the content.