Article

Cluster-Based Flight Path Construction for Drone-Assisted Pear Pollination Using RGB-D Image Processing

1
Graduate School of Science and Engineering, Doshisha University, 1-3 Tataramiyakodani, Kyotanabe-shi 610-0394, Kyoto, Japan
2
Graduate School of Engineering, Nippon Institute of Technology, 1-4 Gakuendai, Miyashiro-cho 345-8501, Sitama, Japan
3
Saitama Agricultural Technology Research Center (Kuki Proving Ground), 9-1, Kuki-shi 346-0037, Sitama, Japan
4
Faculty of Agriculture, Tottori University, Minami 4-101, Koyama-cho, Tottori-shi 680-8553, Tottori, Japan
*
Author to whom correspondence should be addressed.
Drones 2025, 9(7), 475; https://doi.org/10.3390/drones9070475
Submission received: 4 June 2025 / Revised: 29 June 2025 / Accepted: 3 July 2025 / Published: 4 July 2025
(This article belongs to the Special Issue UAS in Smart Agriculture: 2nd Edition)

Abstract

This paper proposes a cluster-based flight path construction method for automated drone-assisted pear pollination systems in orchard environments. The approach uses RGB-D (Red-Green-Blue-Depth) sensing through an observation drone equipped with RGB and depth cameras to detect blooming pear flowers. Flower detection is performed using a YOLO (You Only Look Once)-based object detection algorithm, and three-dimensional flower positions are estimated by integrating depth information with the drone’s positional and orientation data in the east-north-up coordinate system. To enhance pollination efficiency, the method applies the OPTICS (Ordering Points To Identify the Clustering Structure) algorithm to group detected flowers based on spatial proximity that correspond to branch-level distributions. The cluster centroids then construct a collision-free flight path, with offset vectors ensuring safe navigation and appropriate nozzle orientation for effective pollen spraying. Field experiments conducted using RTK-GNSS-based flight control confirmed the accuracy and stability of generated flight trajectories. The drone hovered in front of each flower cluster and performed uniform spraying along the planned path. The method achieved a fruit set rate of 62.1%, exceeding natural pollination at 53.6% and compared to the 61.9% of manual pollination. These results demonstrate the effectiveness and practicability of the method for real-world deployment in pear orchards.

1. Introduction

Pollination plays a pivotal role in fruit cultivation by contributing to stable yields and maintaining high fruit quality. However, many fruit tree species encounter difficulties in achieving adequate fruit set through natural pollination because of the decline in insect populations caused by global warming [1,2]. In natural pollination, honeybees are widely relied on because of their ability to pollinate large areas efficiently with minimal human intervention. Despite these advantages, honeybee activity is highly susceptible to environmental conditions. Elevated temperatures and the broader impacts of climate change can lead to decreased foraging behavior, which results in unstable fruit set and deformities in fruit shape. Additionally, the ongoing decline in honeybee populations caused by environmental degradation and habitat loss has further undermined the reliability of natural pollination [3,4]. To address these limitations, artificial pollination methods have been adopted. Manual pollination by human workers is the most prevalent. This technique enables relatively stable fruit set outcomes by ensuring that each flower is carefully pollinated. However, it is extremely labor-intensive and increasingly impractical for application in large-scale orchards. The persistent labor shortage in the agricultural sector exacerbates this issue, particularly for commercial fruit farms that require scalable and sustainable pollination methods [5,6,7]. Given the shortcomings of both natural and manual pollination, there is an increasing need for alternative solutions that combine stability with reduced labor dependency. In response to this demand, drone-based pollination systems have recently emerged as a promising approach because they have the potential to achieve efficient and consistent pollination across wide orchard areas with minimal human intervention.
Recent advancements in drone technology, particularly regarding flight stability, operability, and precise control, have led to its rapid adoption across various industries, including agriculture [8]. In farming, drones equipped with high-precision cameras and advanced sensors are being used to monitor crop growth and detect pest infestations. These sensing technologies have greatly improved efficiency in agricultural monitoring by reducing the reliance on manual labor and enhancing productivity [9]. Beyond agriculture, drones are being used in logistics [10,11], infrastructure maintenance [12,13], disaster management [14,15], and environmental monitoring [16,17], thereby catering to a wide range of societal needs. Given these technological advancements and the increasing demand for automation, a drone-based pollination system is a promising solution to improve the efficiency of pollination in agriculture [18,19,20].
In this study, we focus on the development of a drone-based pollination system that detects the blooming status of pear flowers and autonomously performs pollination. The proposed system consists of two drones that work together to ensure an efficient pollination process (Figure 1). The first, which is called the observation drone, is responsible for monitoring pear trees, whereas the second, which is called the pollination drone, performs actual pollination. The observation drone is tasked with monitoring the pear trees by simply flying between the pear trees and capturing both color and depth images of the blooming flowers. These images are then transmitted to a cloud-based server, where both flower detection and spatial clustering are performed using computer vision algorithms. Then, a flight path is generated based on the processed data for the pollination drone. The pollination drone then navigates to the identified flower clusters autonomously and performs targeted pollen spraying.
By assigning distinct roles to the observation drone and pollination drone, the system aims to automate the pollination process, reduce labor burden, and enhance operational efficiency in farming. Additionally, the integration of machine learning with drone technology allows for adaptive real-time decision making, which improves the consistency and accuracy of pollination. Despite these advantages, the implementation of drone-based pollination systems presents three critical technical challenges that must be addressed: (i) the accurate identification of the optimal pollination period, (ii) the realization of precise drone flight, and (iii) the determination of efficient pollination flight paths. The first challenge relates to the determination of optimal pollination timing, which is a key factor in maximizing fruit set rates. In our previous study, we proposed a method that leverages DeepSort [21], a deep-learning-based object tracking algorithm, to monitor and count the number of blooming flowers and buds. This method processes video footage captured by the observation drone and uses machine learning techniques to automatically detect, track, and quantify individual floral structures throughout the blooming phase of pear trees. In experimental evaluations, we demonstrated that this approach accurately identified peak blooming periods, which enabled timely and effective pollination intervention. The second challenge involves achieving high-precision drone flight, which is essential for accurately targeting pollination sites. To address this, we developed a method based on RTK (Real-Time Kinematic) [22] positioning, as detailed in our previous study [23]. Through field experiments, we confirmed that the RTK-based approach significantly improved navigational accuracy, and enabled stable and reliable flight control, even in complex orchard environments. The third challenge is the determination of the pollination drone’s flight path. To execute effective and efficient pollination, it is essential to first detect the precise spatial coordinates of individual flowers. Once the observation drone has estimated the flower positions using integrated RGB and depth data, a flight path must be constructed that allows the pollination drone to visit the target flowers in an optimized sequence. The third challenge remains unresolved; hence, it is necessary to investigate effective methods for determining the flight path of the pollination drone.
In this study, we propose a cluster-based flight path construction method for use with autonomous drone pollination in orchard environments. The proposed system transmits RGB-D data that have been captured by the observation drone to a cloud-based platform, where the three-dimensional coordinates of the blooming pear flowers are estimated. Pear flowers typically bloom in dense clusters along each branch, which means that it is reasonable to define the spraying targets at the level of flower clusters rather than at the individual flower locations, as shown in Figure 2. A clustering algorithm is therefore applied to the estimated spatial data to group the flowers based on their proximity and thus effectively identify the natural cluster formations on branches. Using the centroids of these clusters, the system then generates a structured flight path for the pollination drone to enable efficient navigation and precise pollen spraying while also minimizing unnecessary movements.
To validate the effectiveness of the proposed method, we conducted field experiments using video data recorded in an actual orchard environment. The results confirmed that the observation drone successfully detected and tracked flowers, estimated spatial coordinates with high accuracy, and provided reliable navigation data for the pollination drone. The experimental validation demonstrated that the system autonomously performed pollination with precision, thereby improving efficiency in large-scale fruit orchards.
The contributions of this paper are summarized as follows:
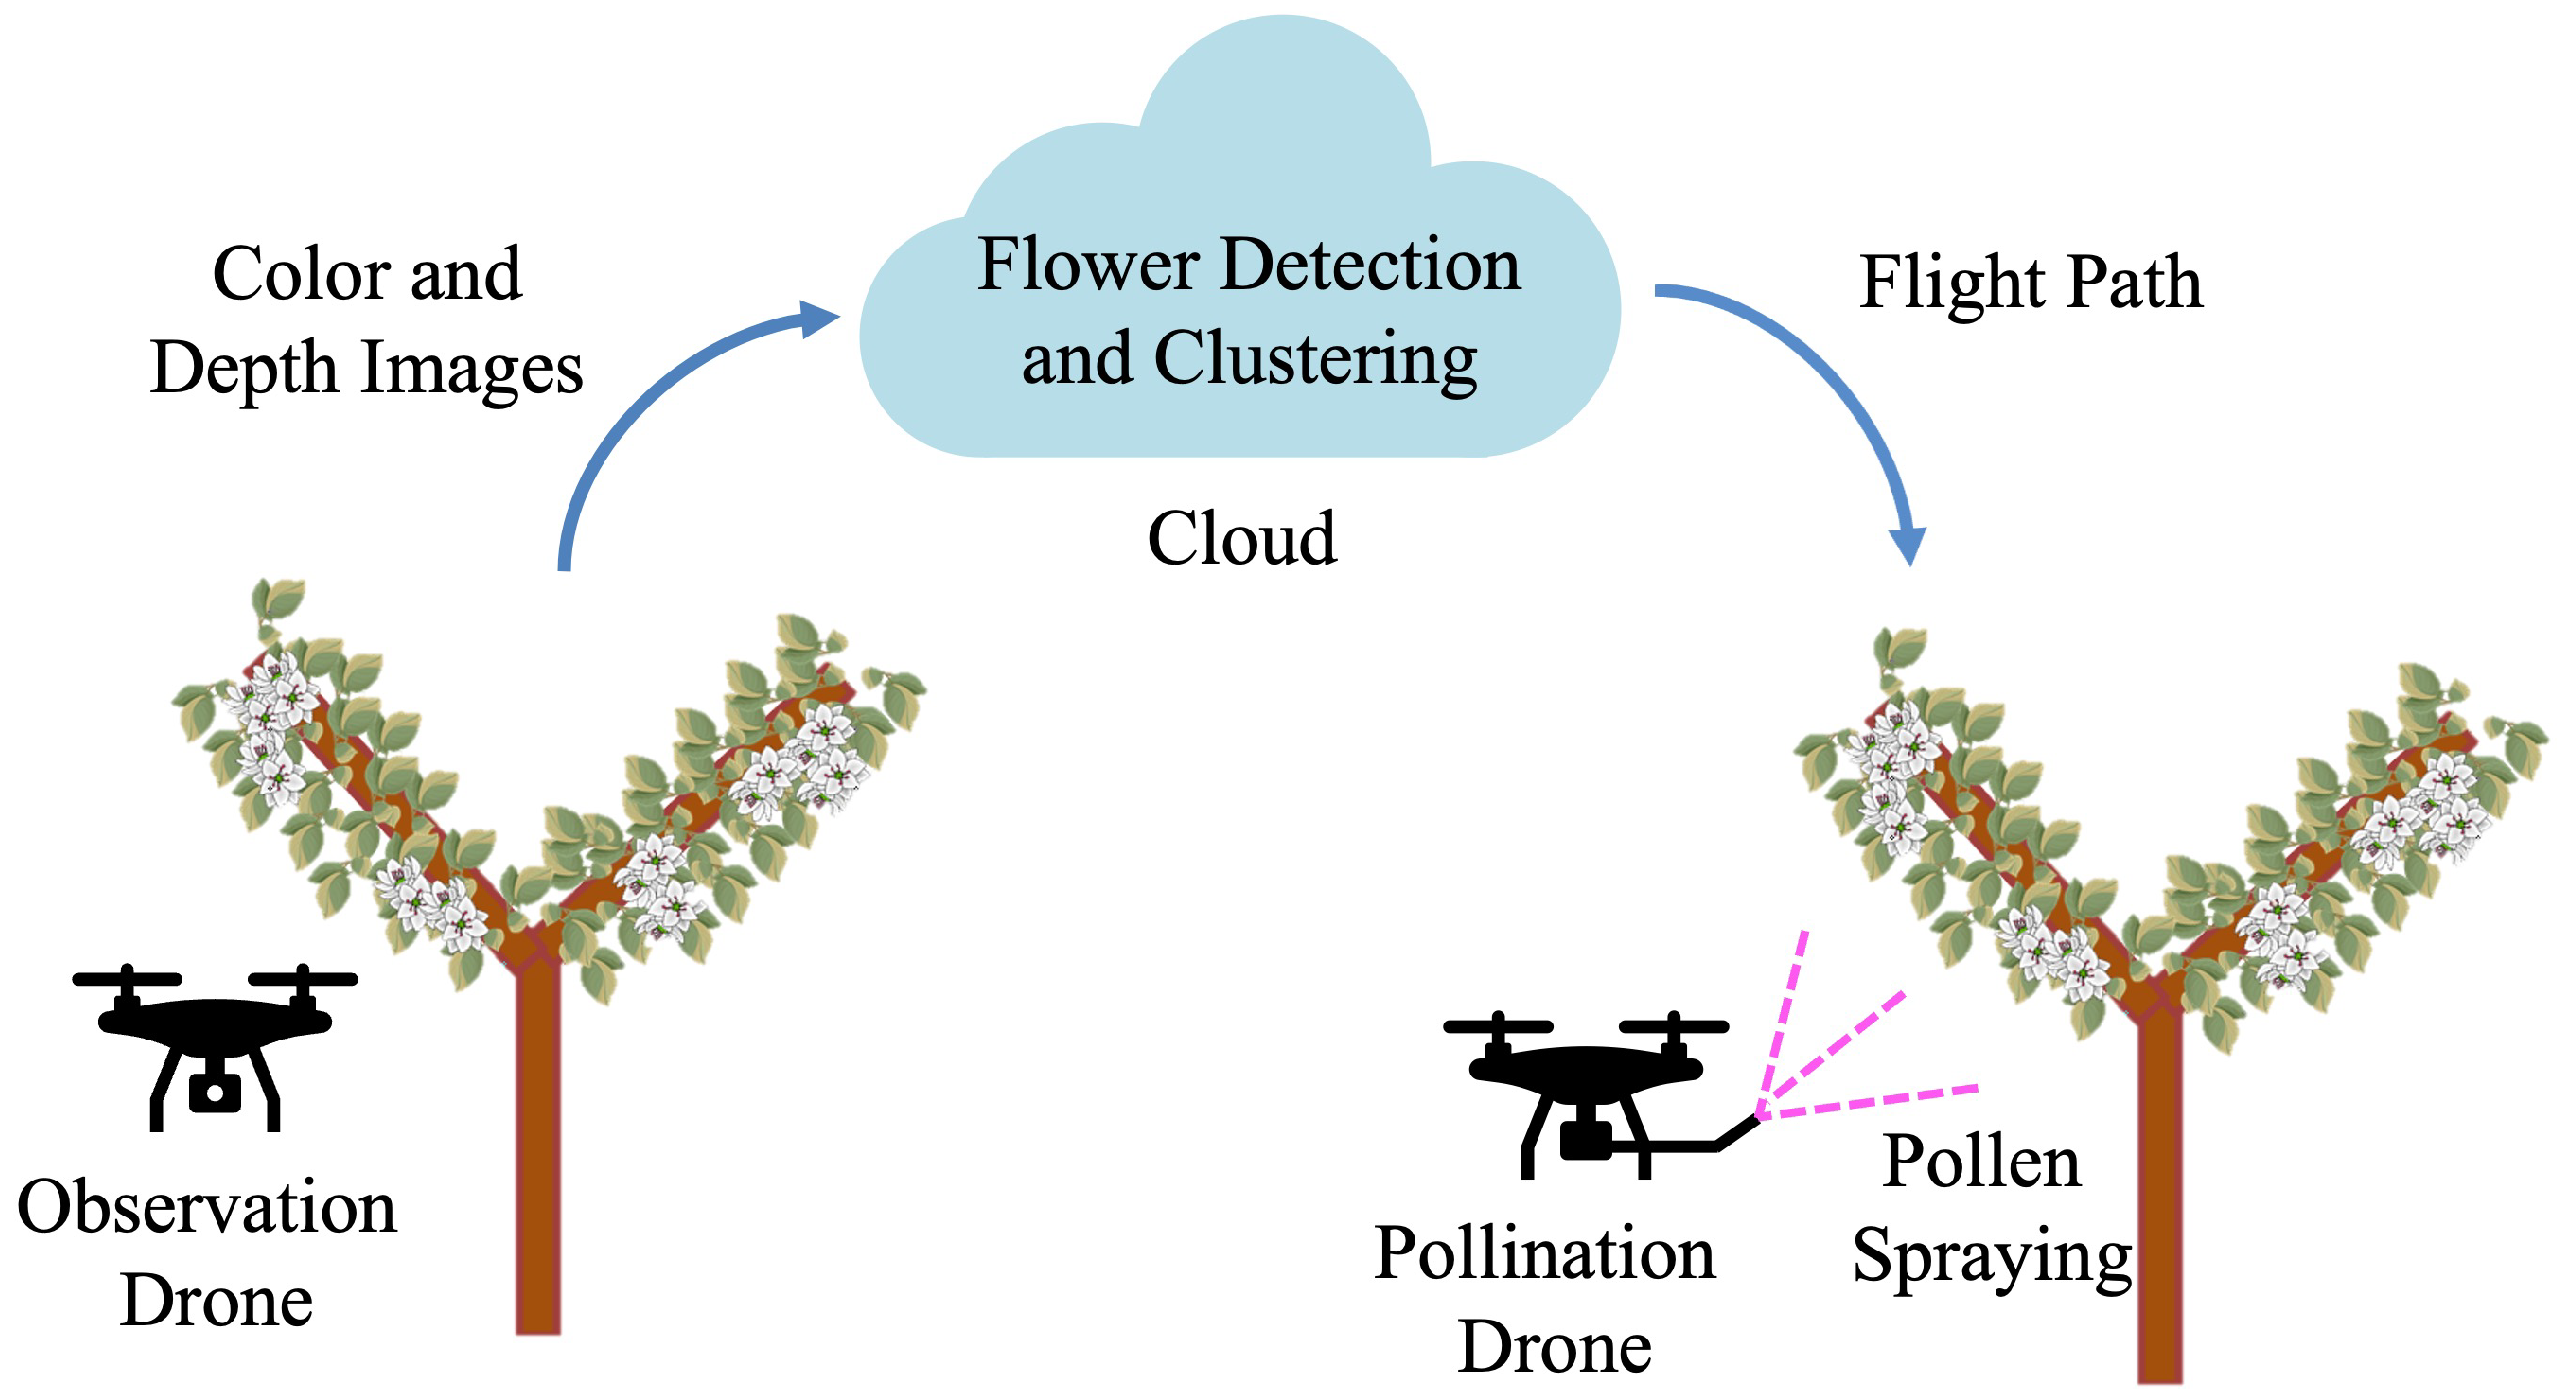
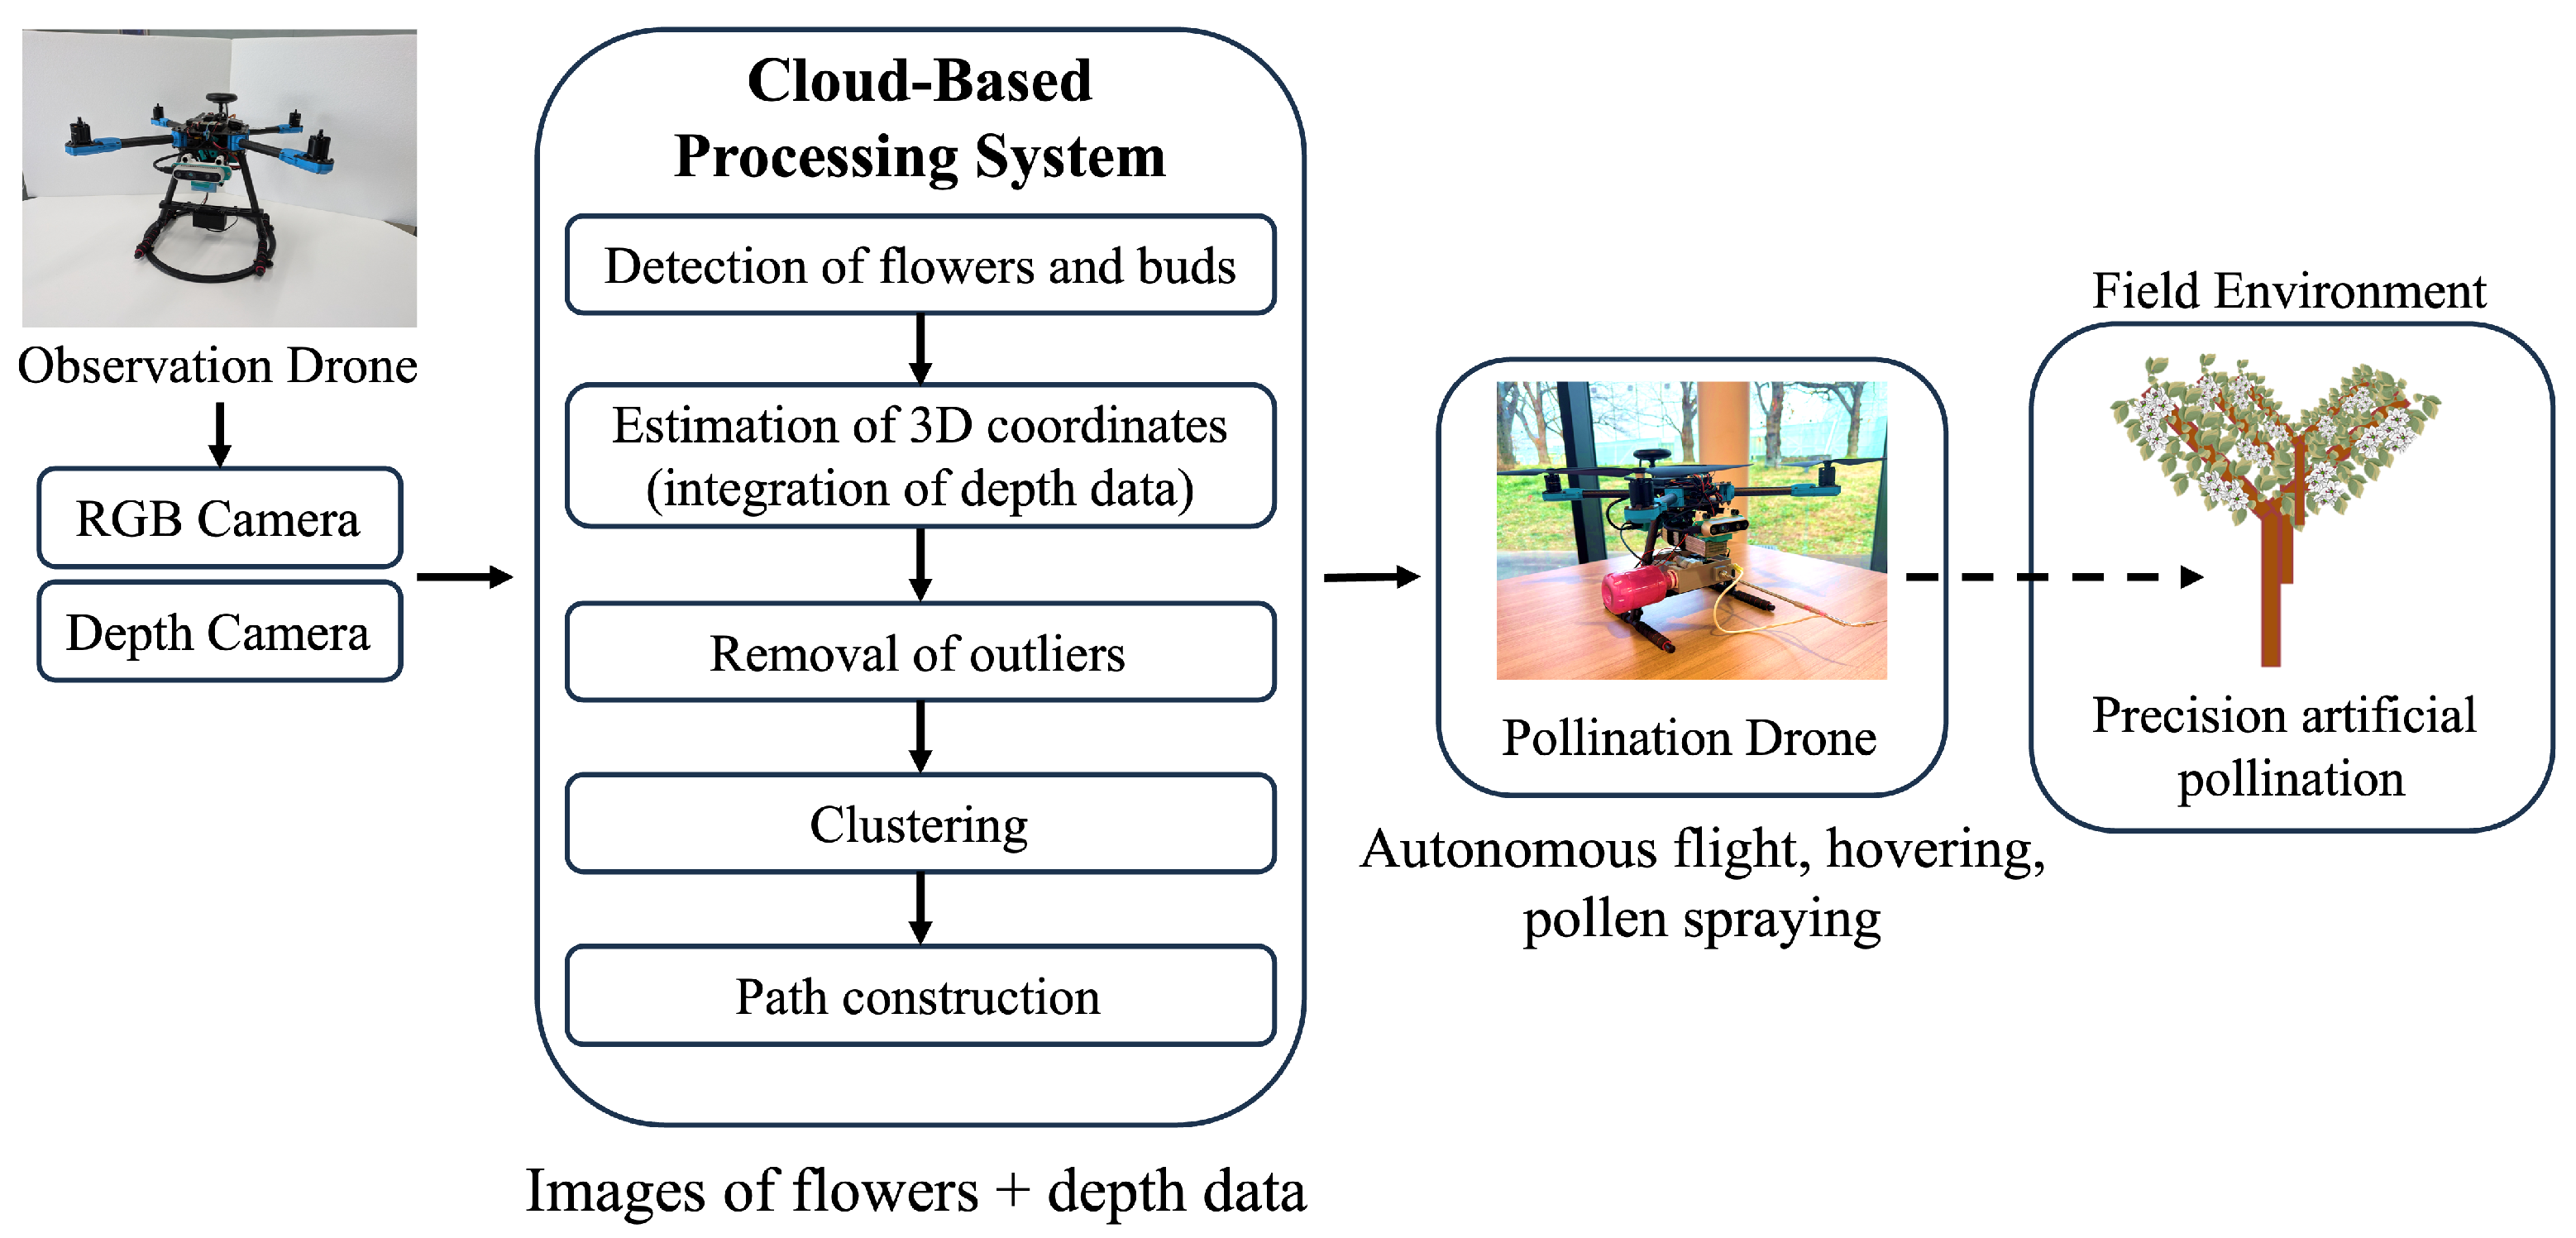
  • Integrated Flower Detection and 3D Localization: The proposed system uses an observation drone equipped with RGB and depth cameras to detect pear flowers and estimate their 3D coordinates with high accuracy, thereby enabling precise guidance for autonomous pollination.
  • Clustering-Based Flight Path Planning: We introduce a novel flight path construction method, which applies the clustering algorithm to group spatially proximate flowers and determine efficient, branch-level waypoints. This approach reduces unnecessary drone movement and improves overall pollination efficiency.
  • Experimental Validation with RTK-Based Control: We demonstrated the system’s effectiveness through real-world experiments using RTK-GNSS (Global Navigation Satellite System)-based flight control to confirm the accuracy of flower detection, position estimation, and autonomous pollination in orchard environments.
  • Fruit Set Rate Evaluation: The effectiveness of the proposed method was further validated by comparing the fruit set rate with that of natural and manual pollination. The results confirmed that our drone-based method achieves a higher fruit set rate than natural pollination and a comparable performance to manual pollination, demonstrating its practical utility in real-world agricultural settings.
The remainder of this paper is organized as follows. Section 2 begins by reviewing the related work. Section 3 then details the proposed flight path construction method used for the pollination drone. Section 4 presents the experimental setup and provides a performance evaluation of the proposed system. Section 5 discusses the implications and limitations of the proposed approach. Finally, Section 6 presents our conclusions about the paper.

2. Related Work

Section 2.1 provides an overview of recent research that leverages vision-based machine learning techniques to address agricultural tasks. Section 2.2 focuses specifically on research related to flight path planning for drones used in agricultural applications.

2.1. Vision-Based Machine Learning Applications in Agriculture

Recent advances in machine learning have led to increased interest in their application to precision agriculture, particularly in tasks including flower detection, crop monitoring, and autonomous pollination [24,25,26,27,28,29]. A variety of vision-based approaches have therefore been proposed to address these challenges using a combination of RGB imagery and deep learning techniques.
For example, Lim et al. [24] developed a system to detect and count kiwi flowers automatically in orchards using drones equipped with RGB cameras. Their method combined deep-learning-based object detection and data augmentation to achieve robust performance under various lighting and occlusion conditions. Similarly, Shang et al. [25] proposed a lightweight framework for real-time apple flower detection that incorporated ShuffleNetv2 and Ghost modules. This reduced both computational cost and model size, thus making their method suitable for real-time deployment in resource-constrained environments.
In addition to detection, image-based monitoring of plant phenology has also been studied. Milicevic et al. [28] used a deep learning model to track subtle phenological changes in olive orchards. Their approach showed that even relatively simple neural architectures, when appropriately trained and augmented, can yield competitive results and offer practical tools for climate-aware agricultural management.
Building on existing advances in vision-based agricultural monitoring, Mu et al. [26] proposed a method for detection of king flowers in apple orchards using a mask R-CNN (Region-based Convolutional Neural Network)-based segmentation model. King flowers play a critical role in the sequential blooming process, and thus, the accurate identification of these flowers enables more targeted and effective pollination strategies. Their study reported a detection performance that varied with the flowering phase and underscored the potential of robotic pollination systems that were guided by detailed floral phenotyping.
In this way, numerous studies have explored the application of vision-based machine learning techniques in agriculture, particularly in tasks including flower detection and crop monitoring [27,29]. However, although these methods have been particularly effective in perception tasks, their integration with flight path planning for use with autonomous agricultural drones remains largely underexplored. This lack of integration poses a major barrier to the development of fully autonomous systems that are capable of both environmental perception and action based on real-time visual data. To address this gap, this study proposes a novel framework that combines a vision-based 3D flower localization approach with a cluster-based flight trajectory planning method to enable efficient and autonomous pollination in orchard environments.

2.2. Flight Path Planning for Drones

In the agricultural robotics domain, although extensive research has been conducted on ground-based robot path planning, flight path planning for drones remains relatively underexplored [30,31]. In particular, studies on flight path planning for a drone-based pollination system remain limited at present [32], with Rice et al. [33] being only one of a few examples addressing this topic. This section provides an overview of the drone path planning methods in agricultural applications and situates the present work within this context.
Hoenig et al. [34] proposed a trajectory planning method for quadrotor swarms that combined discrete waypoint planning with continuous minimum-snap trajectory generation. Their method enabled dynamically feasible, collision-free trajectories, even in dense environments, and also supported scalable multi-drone coordination for aerial displays or collaborative tasks.
In the environmental restoration domain, Zhang et al. [35] developed a drone-based precision afforestation system to integrate 3D terrain-aware path planning with an automated seedling deployment approach. Their method optimized flight paths while also adjusting seed release timing dynamically, thus improving planting accuracy significantly in field experiments when compared with manual operations.
Brundavani et al. [36] proposed the FPSO (Flower Pollination Search Optimization) algorithm for robot path planning that was inspired by biological pollination processes. The algorithm balanced global and local search strategies to generate efficient, smooth trajectories and also proposed superior performance over conventional algorithms, including the A*, Dijkstra, and RRT (Rapidly-exploring Random Trees) algorithms, in simulated environments.
Among the works above, the study by Rice et al. [33] is perhaps the most relevant to drone-based pollination. Their system targets strawberry cultivation by integrating flower detection using an R-CNN model on aerial orthomosaic imagery, which is then followed by path planning formulated as a TSP (Traveling Salesman Problem) to determine an optimal flower visitation sequence. However, their approach assumed an open-field layout in which the drone can navigate freely above low-lying crops, e.g., strawberries. In contrast, our study addresses drone navigation in fruit orchards, where the presence of the branches and the trees introduce significant spatial constraints. Although the TSP is appropriate when the drone has unrestricted mobility, the orchard environments often constrain drone flights to predefined corridors between tree rows. Furthermore, the spatial arrangements and the occlusion patterns of the tree canopies present unique challenges for both flower detection and targeted pollination. Therefore, our proposed method considers these constraints and contributes to advancement of drone path planning for tree-based pollination tasks performed in complex agricultural environments.

3. Proposed Flight Path Construction Method for the Pollination Drone

3.1. Overview

Figure 3 shows the flowchart for the proposed method. In the proposed drone pollination system, pollination is conducted through a coordinated operation involving the observation drone and the pollination drone, with each fulfilling a designated role. The observation drone begins by flying between the pear trees and capturing real-time images of pear flowers using both a conventional RGB camera and a depth camera. These images are then uploaded to a cloud-based system, where the machine learning algorithms immediately detect the flowers and extract their spatial information. The RGB camera captures high-resolution images for flower detection, whereas the depth camera provides distance information, thus allowing the system to estimate the 3D coordinates of the flowers. The pollination drone is then equipped with a pollen sprayer and navigates to the detected flower positions using the coordinate data provided by the observation drone. Using the analyzed video data, the pollination drone approaches each flower precisely and then sprays pollen at the optimal location. This structured approach ensures efficient, accurate pollination while also eliminating any need for manual labor.
To illustrate how the RGB and depth data are jointly used for accurate 3D flower localization, Figure 4 compares a conventional RGB image and its corresponding depth heatmap. In the RGB image, the pear flowers are clearly visible, whereas the heatmap reveals the shapes and the relative depths of the flowers through the various color gradients. By analyzing the RGB and depth images in combination, the system estimates the 3D coordinates for each flower accurately. These estimated positions then serve as the basis for construction of an efficient flight path for the pollination drone.
Using RGB-D processing, the overall procedure for the proposed drone path construction method is shown in Figure 5. Initially, the system performs flower detection using images captured by an RGB camera. Subsequently, it estimates the distance from the camera to each detected flower based on the corresponding depth data. By further calculating the distance from the drone’s takeoff location to the image capture position, the system can estimate the absolute coordinates of the flowers. Then, it clusters the detected flower positions using a suitable clustering algorithm and determines the centroid of each cluster. The system plans the drone’s flight path to sequentially visit these centroids. By hovering in front of each centroid, the drone can spray pollen in a manner that simultaneously targets multiple flowers within the cluster, thereby enhancing pollination efficiency. The detailed procedure for constructing the flight path is organized into the following steps:
Step 1. 
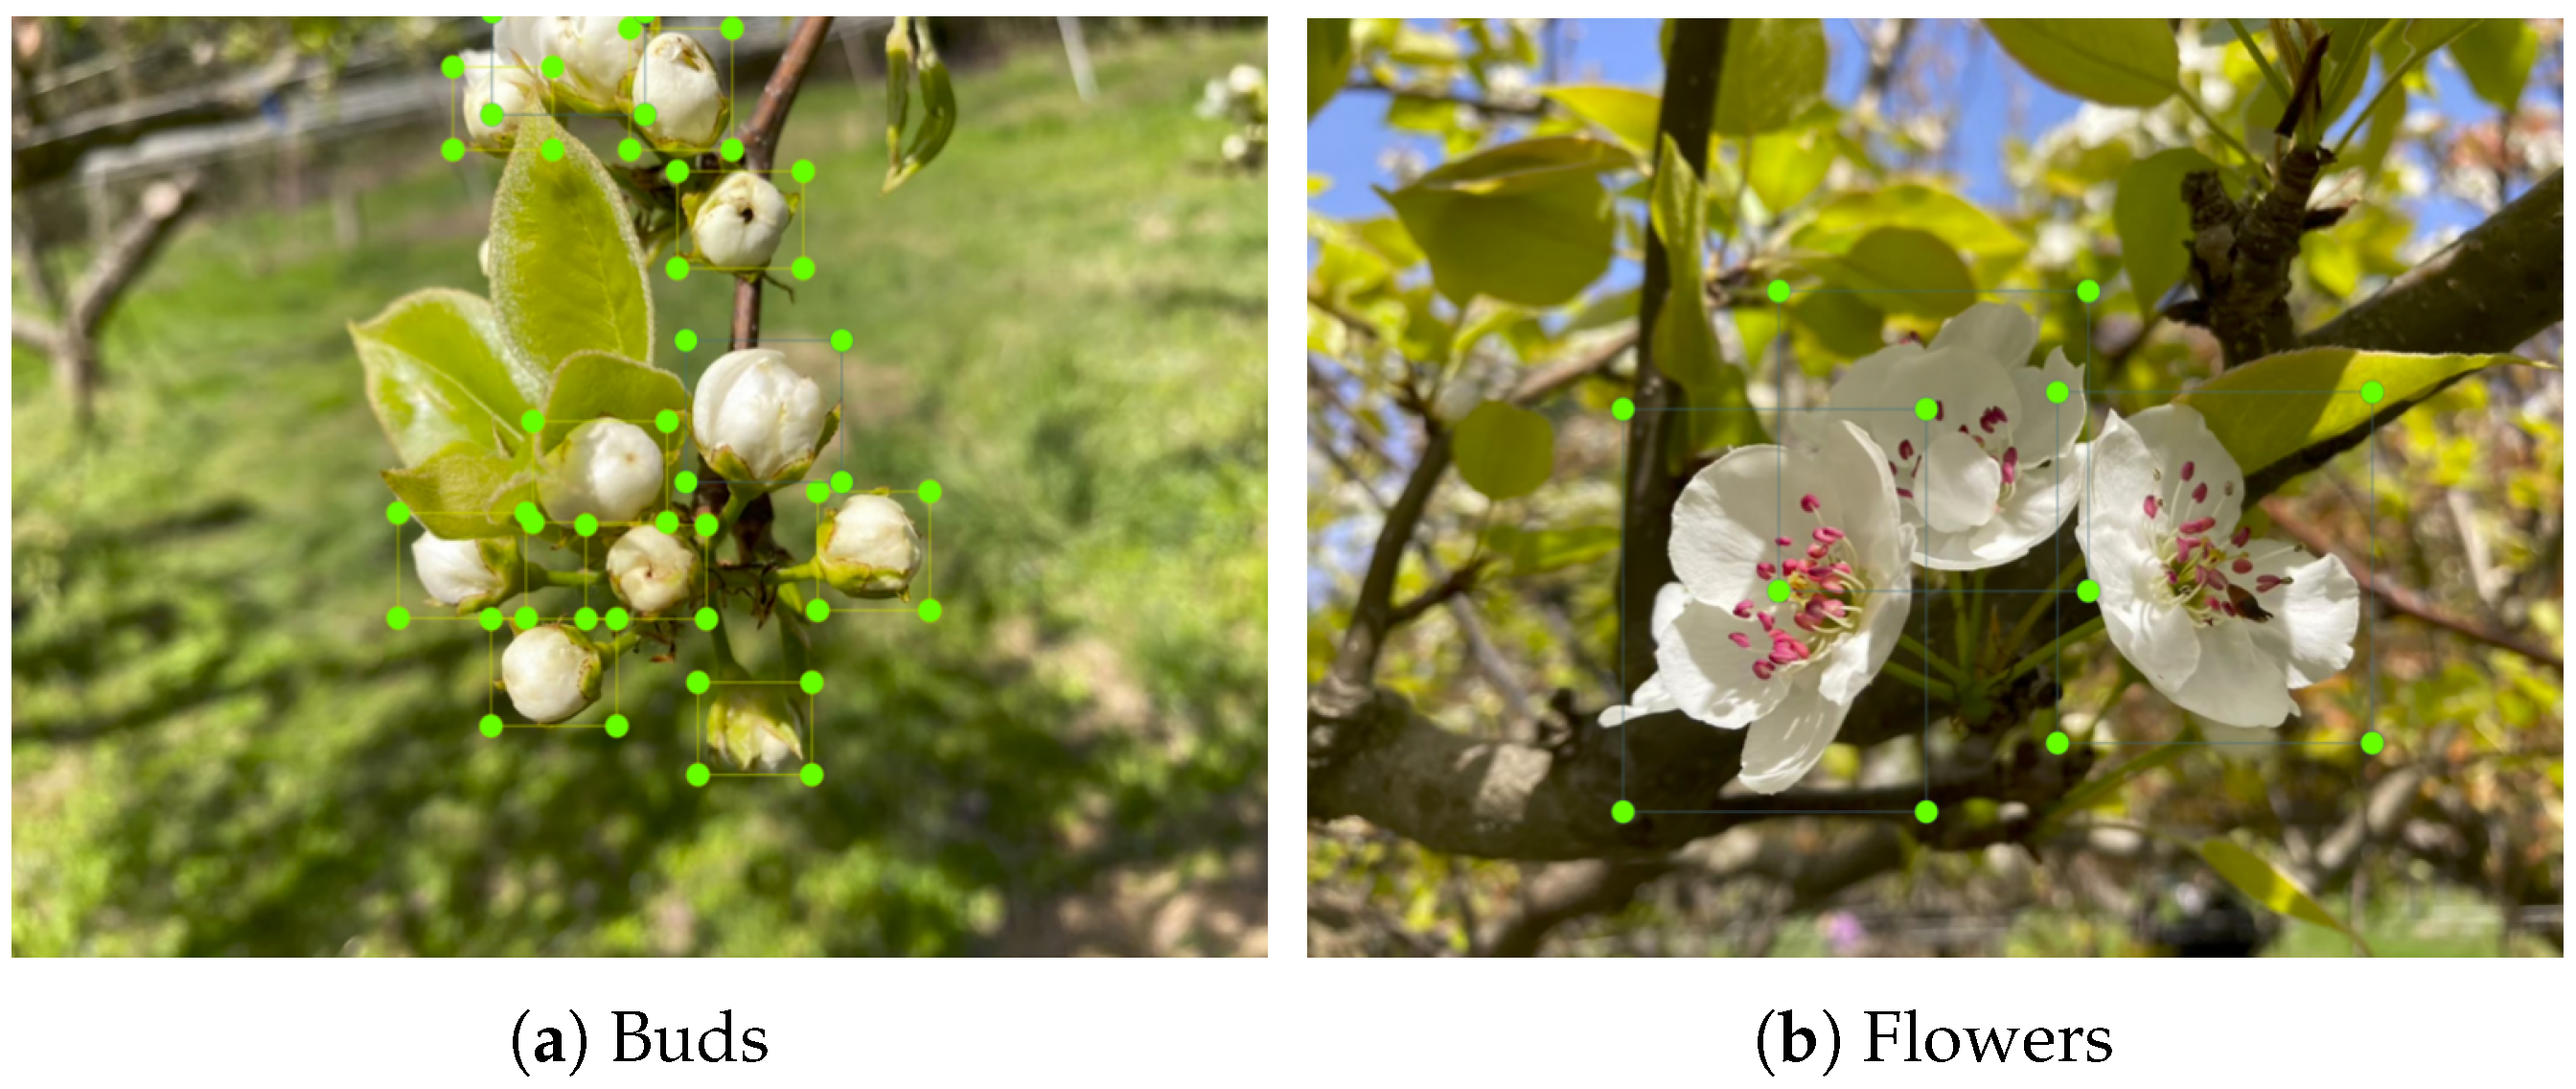
Train the flower detection algorithm.
Step 2. 
Capture video footage with the observation drone.
Step 3. 
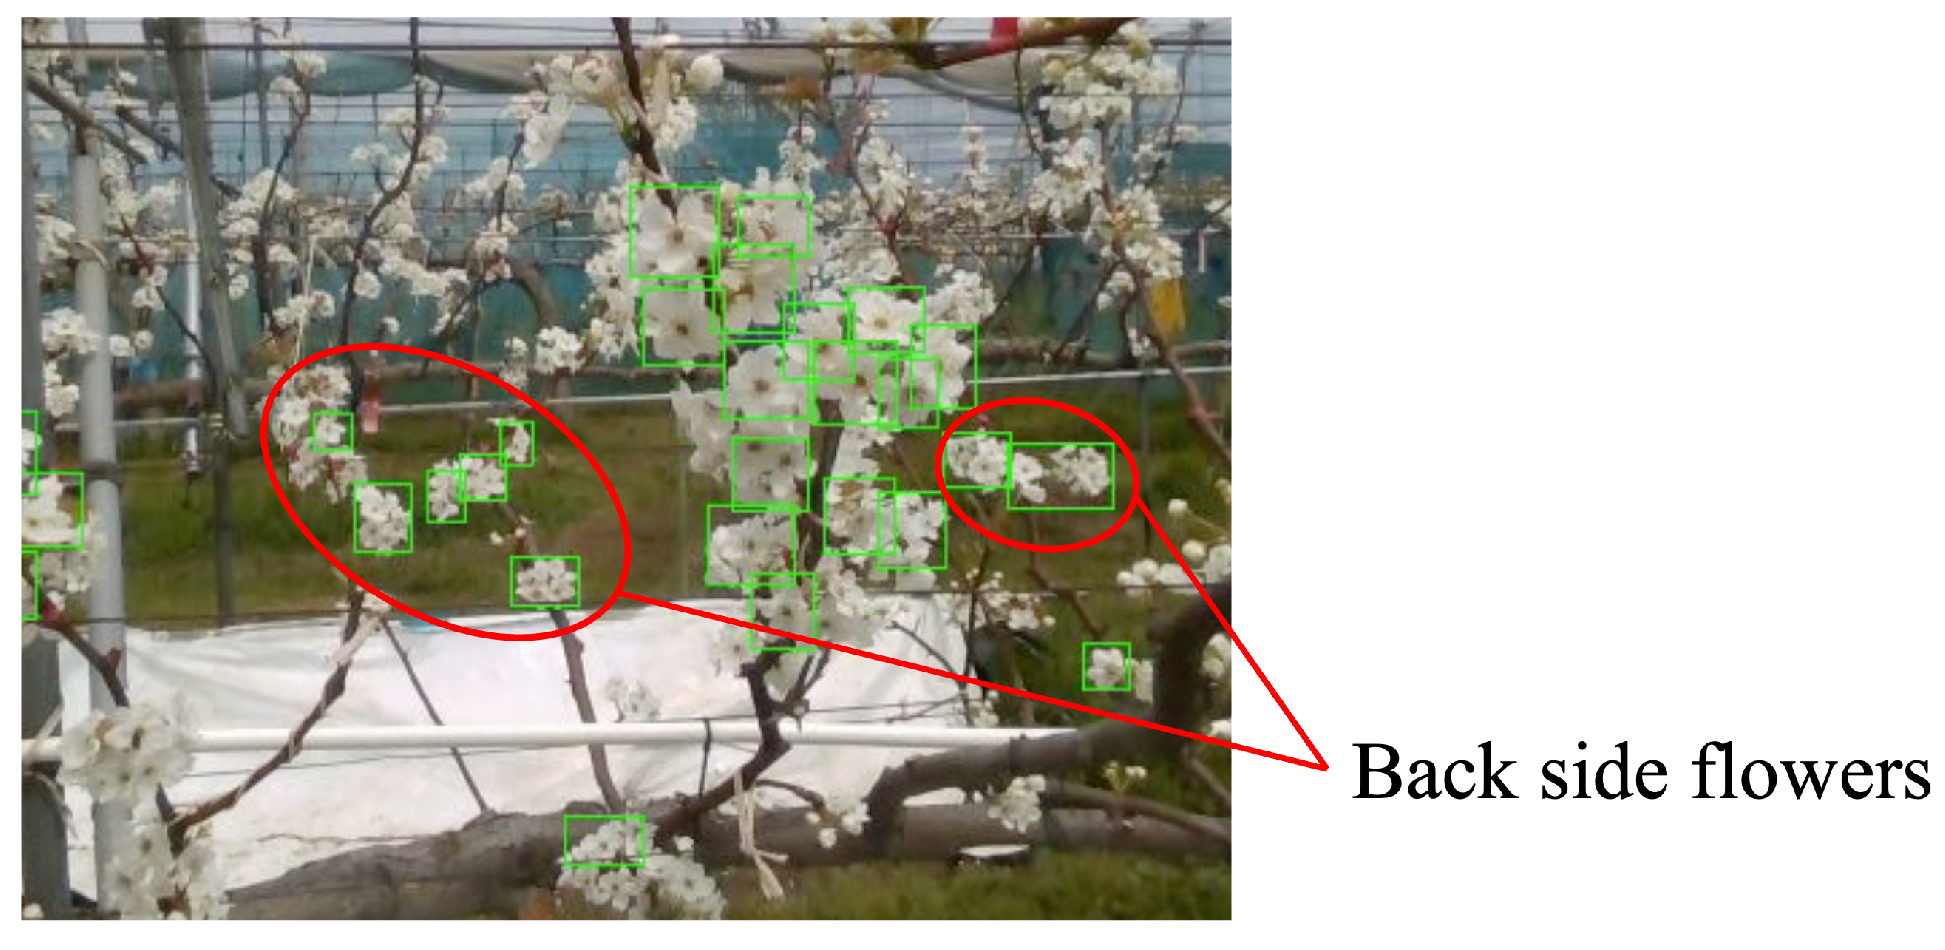
Apply the flower detection algorithm to the video.
Step 4. 
Extract flower coordinates.
Step 5. 
Remove unnecessary points.
Step 6. 
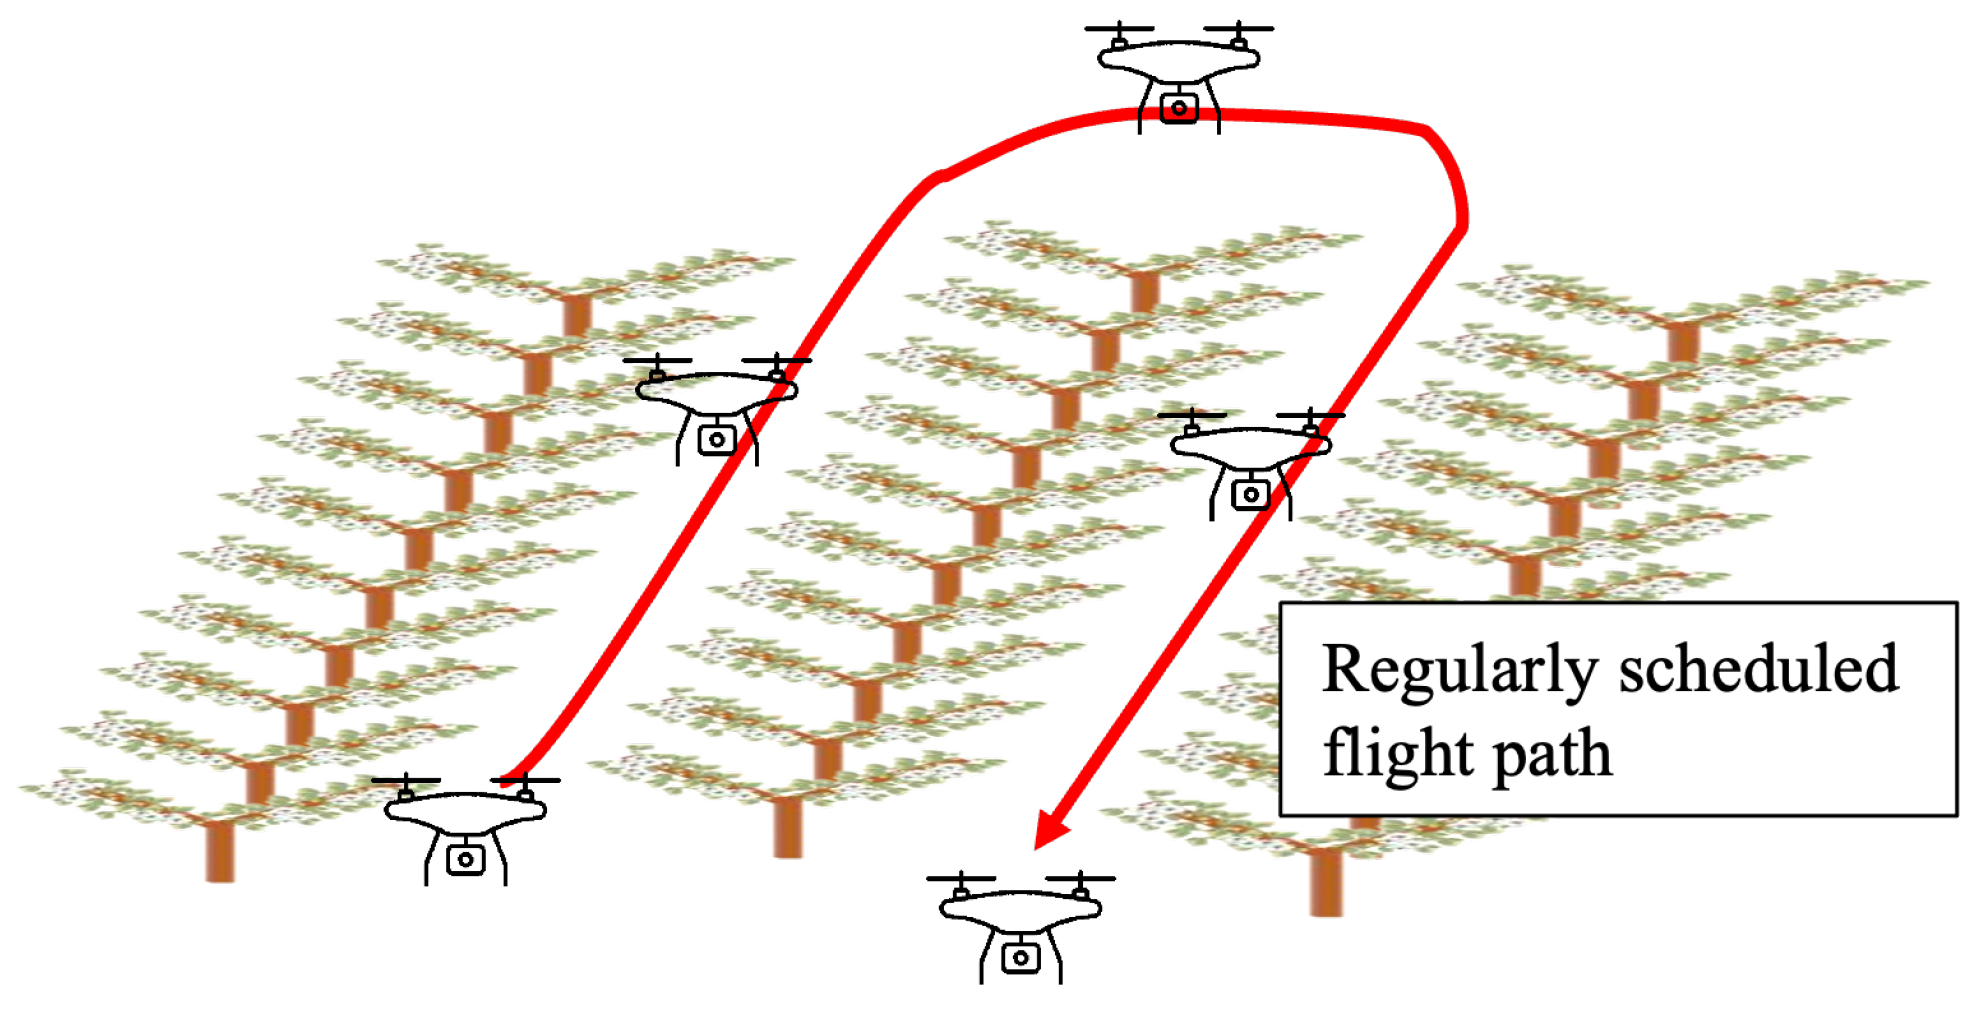
Determine the flight path.
In Step 1, the flower detection algorithm is trained in advance of the blooming period. This training is performed on a cloud-based computer using a labeled dataset to enable the accurate identification of pear flowers during actual operation.
During the blooming season, Step 2 involves capturing video footage of the orchard using the observation drone. Once the recording is complete, the footage is transferred to the cloud-based computer for further processing.
Steps 3–6 are performed on the cloud-based computer, where the system detects flowers, estimates their coordinates, filters out unnecessary points, and generates the flight path for the pollination drone.
Once Step 6 is complete, the system transmits the computed flight path to the pollination drone. The pollination drone follows this flight path to perform pollination. The effectiveness of pollen spraying depends significantly on the performance of the sprayer, which makes it a subject for further study. The following sections provide a detailed explanation of each step in the process.

3.2. Training the Flower Detection Algorithm

For pear flower detection, YOLO (You Only Look Once) [37,38,39] is employed. YOLO is a state-of-the-art, deep-learning-based object detection algorithm widely used in computer vision applications, particularly known for its high detection accuracy and real-time performance. Unlike traditional region-based methods, YOLO processes the entire image in a single forward pass through a neural network, thereby directly predicting bounding boxes and associated class probabilities for multiple objects.
YOLO uses a CNN for object detection. A CNN is a type of neural network designed to extract features from input images and classify them accordingly. Within a CNN, the convolutional layer plays a crucial role. This layer applies filters to the image to extract features such as edges, colors, textures, and shapes. These low-level features are progressively transformed into higher-level representations, which ultimately enables the prediction of object positions and categories.
Compared with conventional R-CNNs, YOLO had significant advantages in object detection. In an R-CNN, candidate regions are first generated and each region is processed individually, which results in high computational costs and slower processing speeds. By contrast, YOLO divides the image into a grid and each grid cell predicts the location of objects. This approach enables simultaneous object detection and classification, which significantly improves processing speed. In fact, YOLO can detect objects at high speed, which makes it suitable for real-time applications.
When an image is input into the YOLO network, it generates the following outputs:
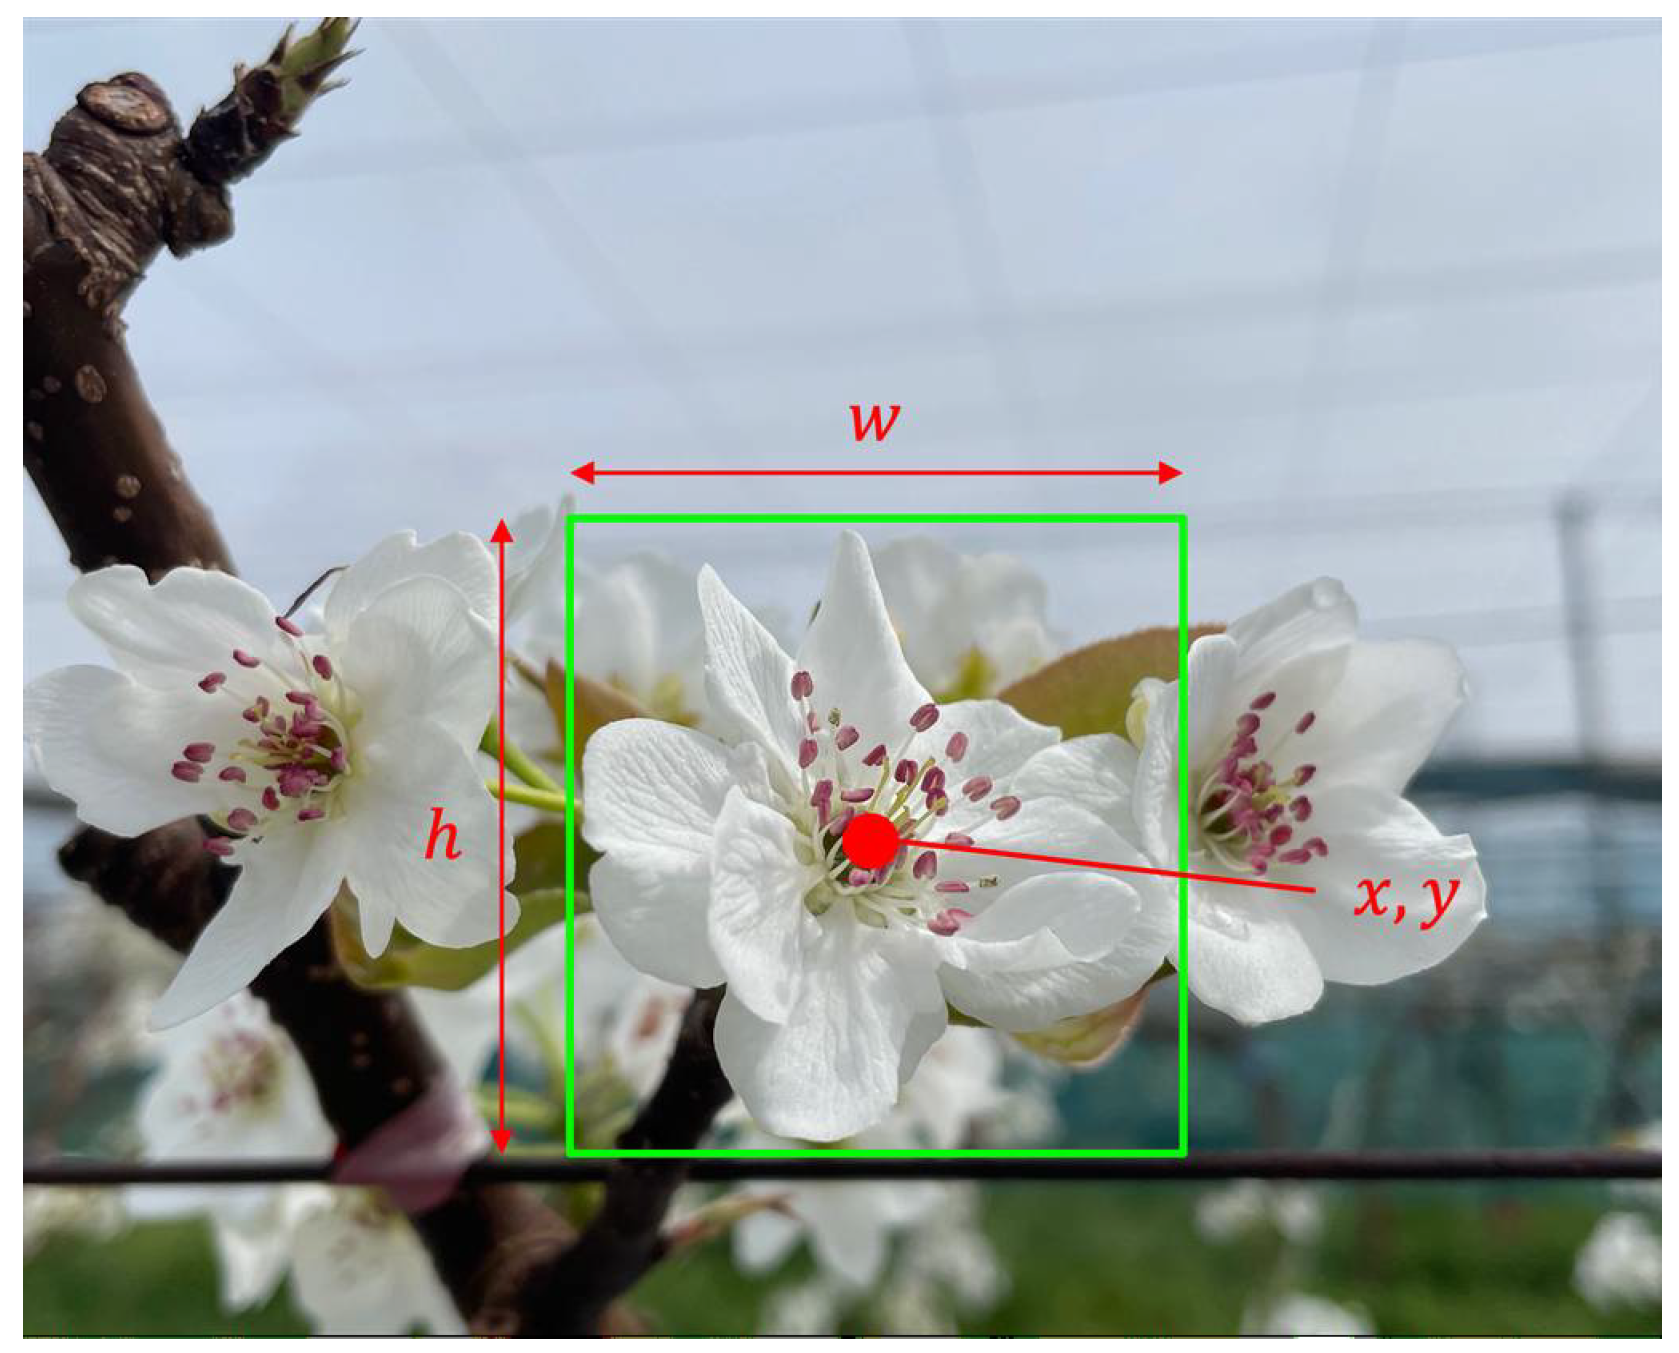
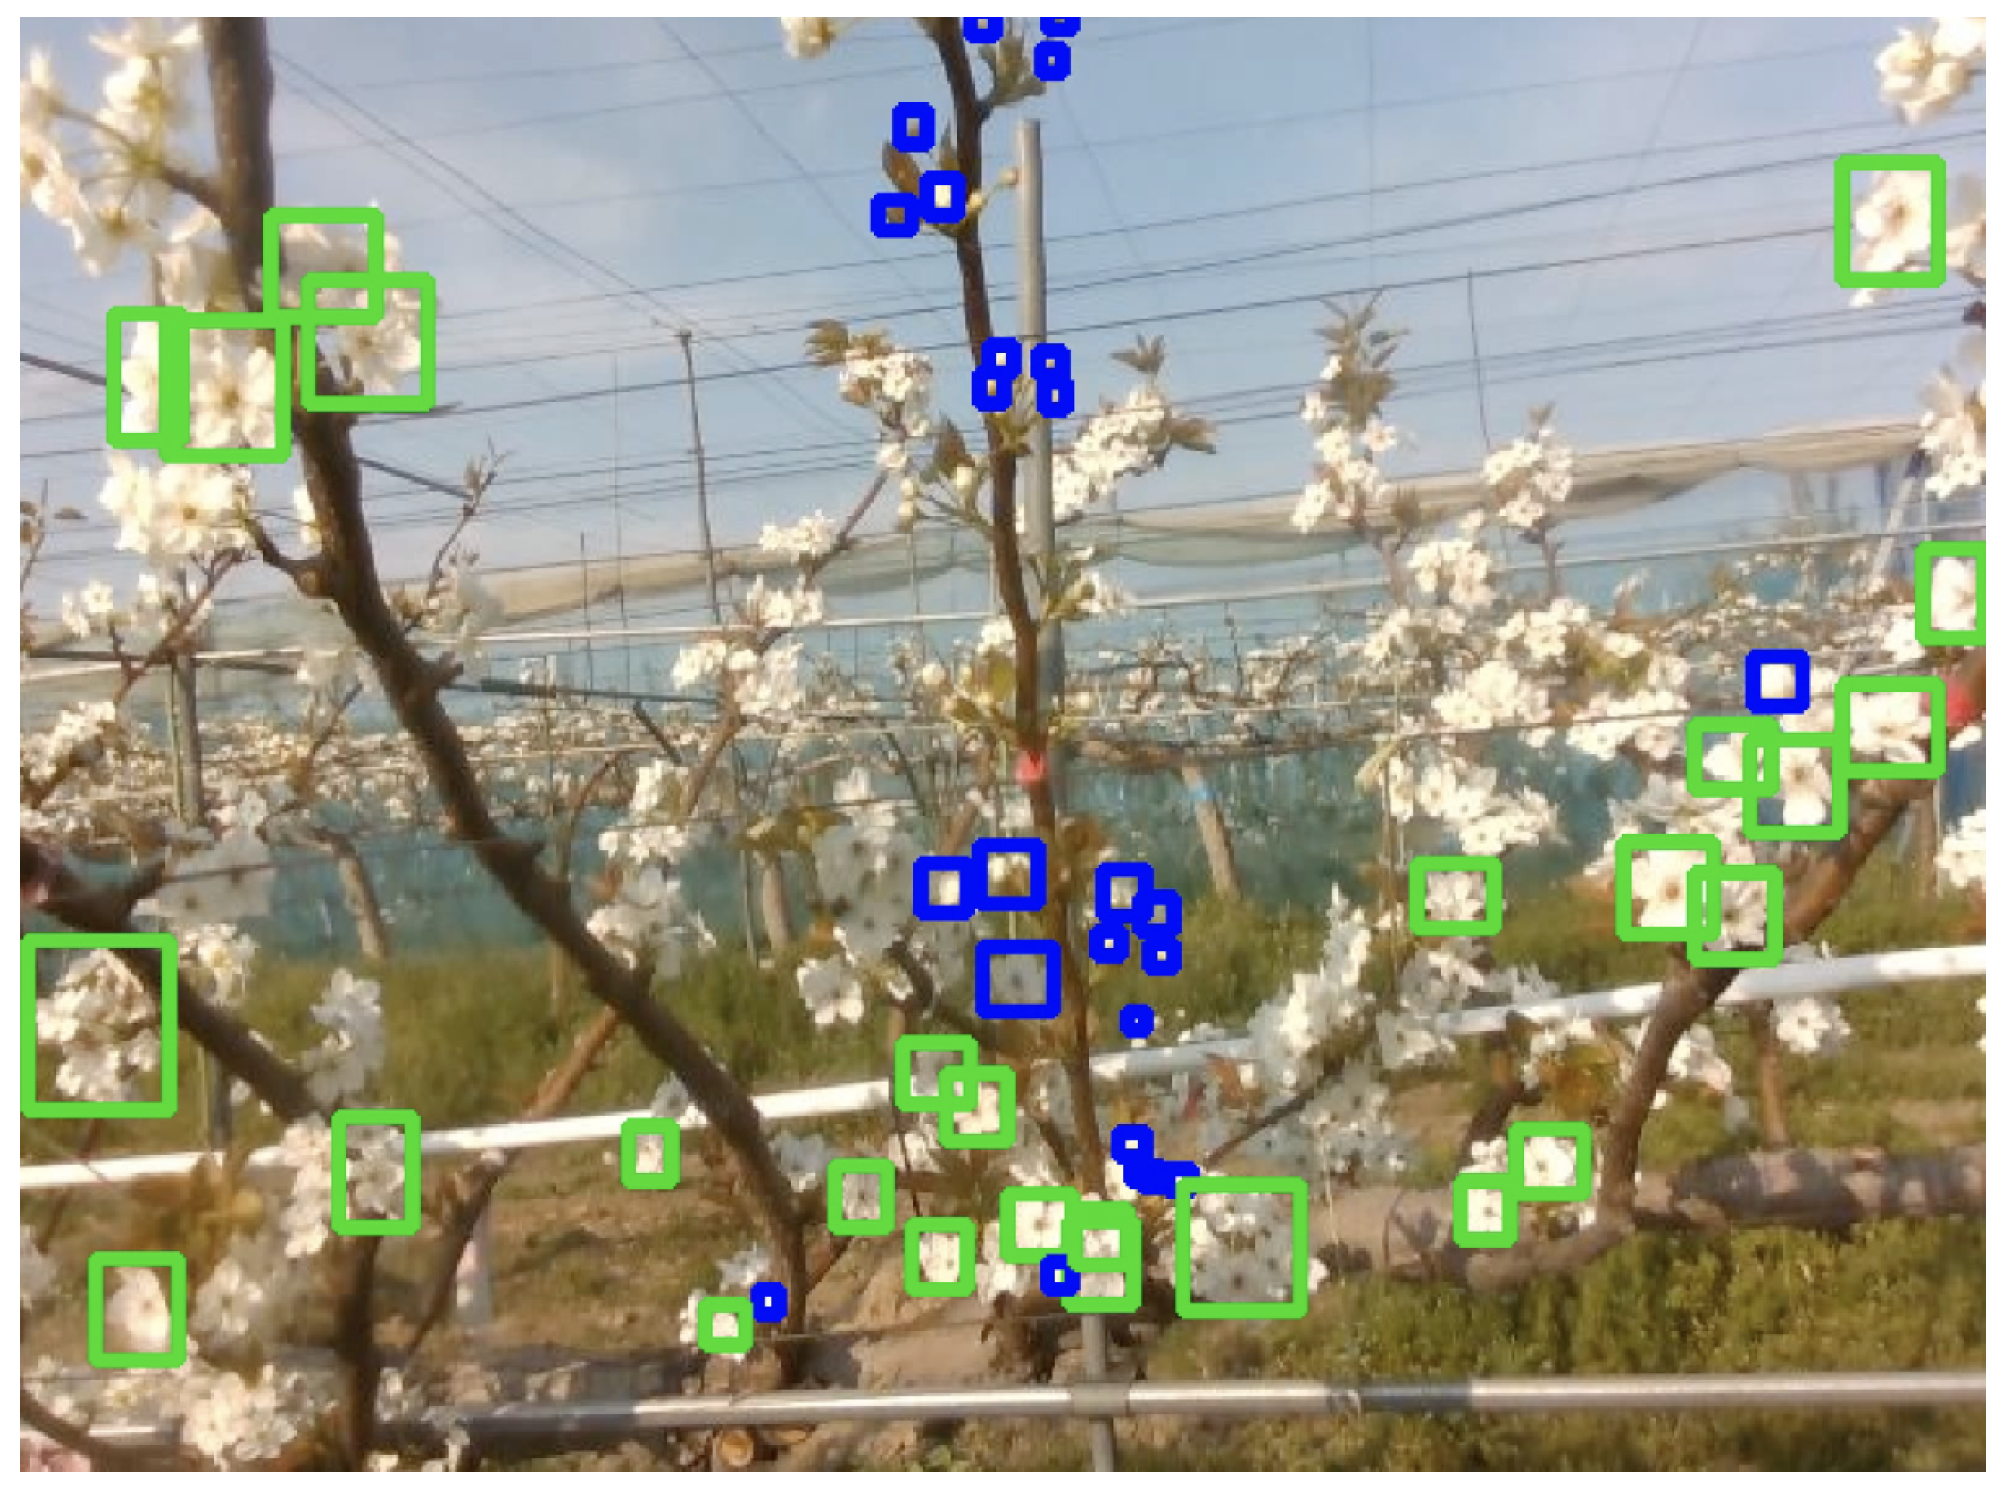
  • Bounding Box A bounding box is a rectangle that indicates the potential region where an object is detected. It represents the position of the detected object within the image (Figure 6). The bounding box is typically defined using four parameters: the central coordinates ( x , y ) , width w, and height h. For example, if an object is detected in an image at position ( x , y ) with width w and height h, the bounding box can be represented as:
    B = ( x , y , w , h )
  • Confidence Score Each bounding box is assigned a confidence score, which represents both the probability that an object is present within the box and the accuracy of the prediction. This confidence score C is calculated as follows:
    C = P ( Object ) × IoU ,
    where P ( Object ) is the probability that an object is present inside the bounding box. IoU (intersection over union) represents the overlap ratio between the predicted bounding box and the ground truth bounding box. The higher the confidence score, the higher the probability that the bounding box contains an object and that the predicted box closely matches the actual object’s position.
To detect pear flowers that are suitable for pollination, flower states are classified using two labels: bud and flower. The bud label indicates that the pear flower has not yet bloomed and is not ready for pollination. Because the bud remains closed at this stage, artificial pollination cannot be performed; hence, these flowers are excluded from the pollination process. By contrast, the flower label indicates that the pear flower has fully bloomed and has reached a state where artificial pollination is possible. Flowers in this state are the targets for drone-assisted pollination. A dataset labeled with bud and flower is used to train the YOLO object detection algorithm. This classification is a crucial step in the pollination process because accurately distinguishing between buds and flowers ensures efficient and reliable pollination.
Figure 7 provides examples of images labeled as bud and flower. The images illustrate the two different states of pear flowers, which are the focus of this study. The preparation of a labeled dataset with these classifications enables YOLO to be trained to distinguish between bud and flower states. YOLO is a highly efficient and accurate algorithm for object detection. Because it processes the entire image in a single pass and predicts object locations simultaneously, it is particularly suited for tasks that require real-time processing, such as automated pollination.
This classification and training process establishes the foundation for an automated pollination system using drones. Accurate detection of flower states is essential for improving the efficiency of pollination operations and reducing the workload of agricultural labor. Proper labeling ensures that only flowers that are ready for pollination receive targeted action, which enhances the precision and effectiveness of the pollination system.
It is important to note that the flowers in the intermediate stages between bud and full blossom were excluded from the training dataset during this study. This is because these flowers are generally not considered to be suitable for effective pollination and may also introduce ambiguity during classification. As a result, the detection accuracy during these intermediate stages is expected to be low. There is also a risk that some of the flowers may also be misclassified as blossoms, thus potentially leading to unintended pollination attempts. In future work, we intend to include intermediate-stage samples explicitly among the training data and train the model to distinguish and exclude these samples, thus improving the overall robustness of the detection system.

3.3. Capture of the Observation Drone Video

To monitor the pear trees, the observation drone is programmed for daily flights through the orchard. The flight path is predefined using the ROS (Robot Operating System) (Figure 8), ensuring that it follows a predetermined route at regular intervals. This systematic flight pattern allows the drone to operate stably within the orchard while efficiently observing different areas.
During its flight between trees, the drone orients its camera toward target pear trees to capture images and videos of flowers in specific regions. This setup enables the collection of essential visual data needed to detect flowers suitable for pollination. However, this method also introduces a challenge: unintended flowers may appear in the captured footage. For instance, flowers on the opposite side of a tree or from neighboring rows may be recorded because of the camera’s orientation. This issue arises because the field of view is determined by the drone’s flight direction, which potentially leads to the unintended detection of non-target flowers.
An attempt to eliminate such false detections at the time of image capture by the dynamic adjustment of the recorded footage would significantly increase system complexity and processing time. Additionally, in real-world agricultural environments, pear flowers are distributed irregularly, which makes it difficult to completely avoid false detections through real-time adjustments. Given these constraints, the proposed method does not incorporate specific measures to filter out unwanted flowers at the time of image capture.
Instead, after the system computes the flower coordinates in Step 4, a filtering process is introduced in Step 5 to remove mistakenly detected points. By allowing some degree of false detection in the early stages and eliminating unnecessary data in later processing steps, the system ensures that only flowers relevant for pollination are accurately identified. This approach effectively minimizes the effect of false detection while maintaining an efficient and reliable method for detecting pollination-ready pear flowers.

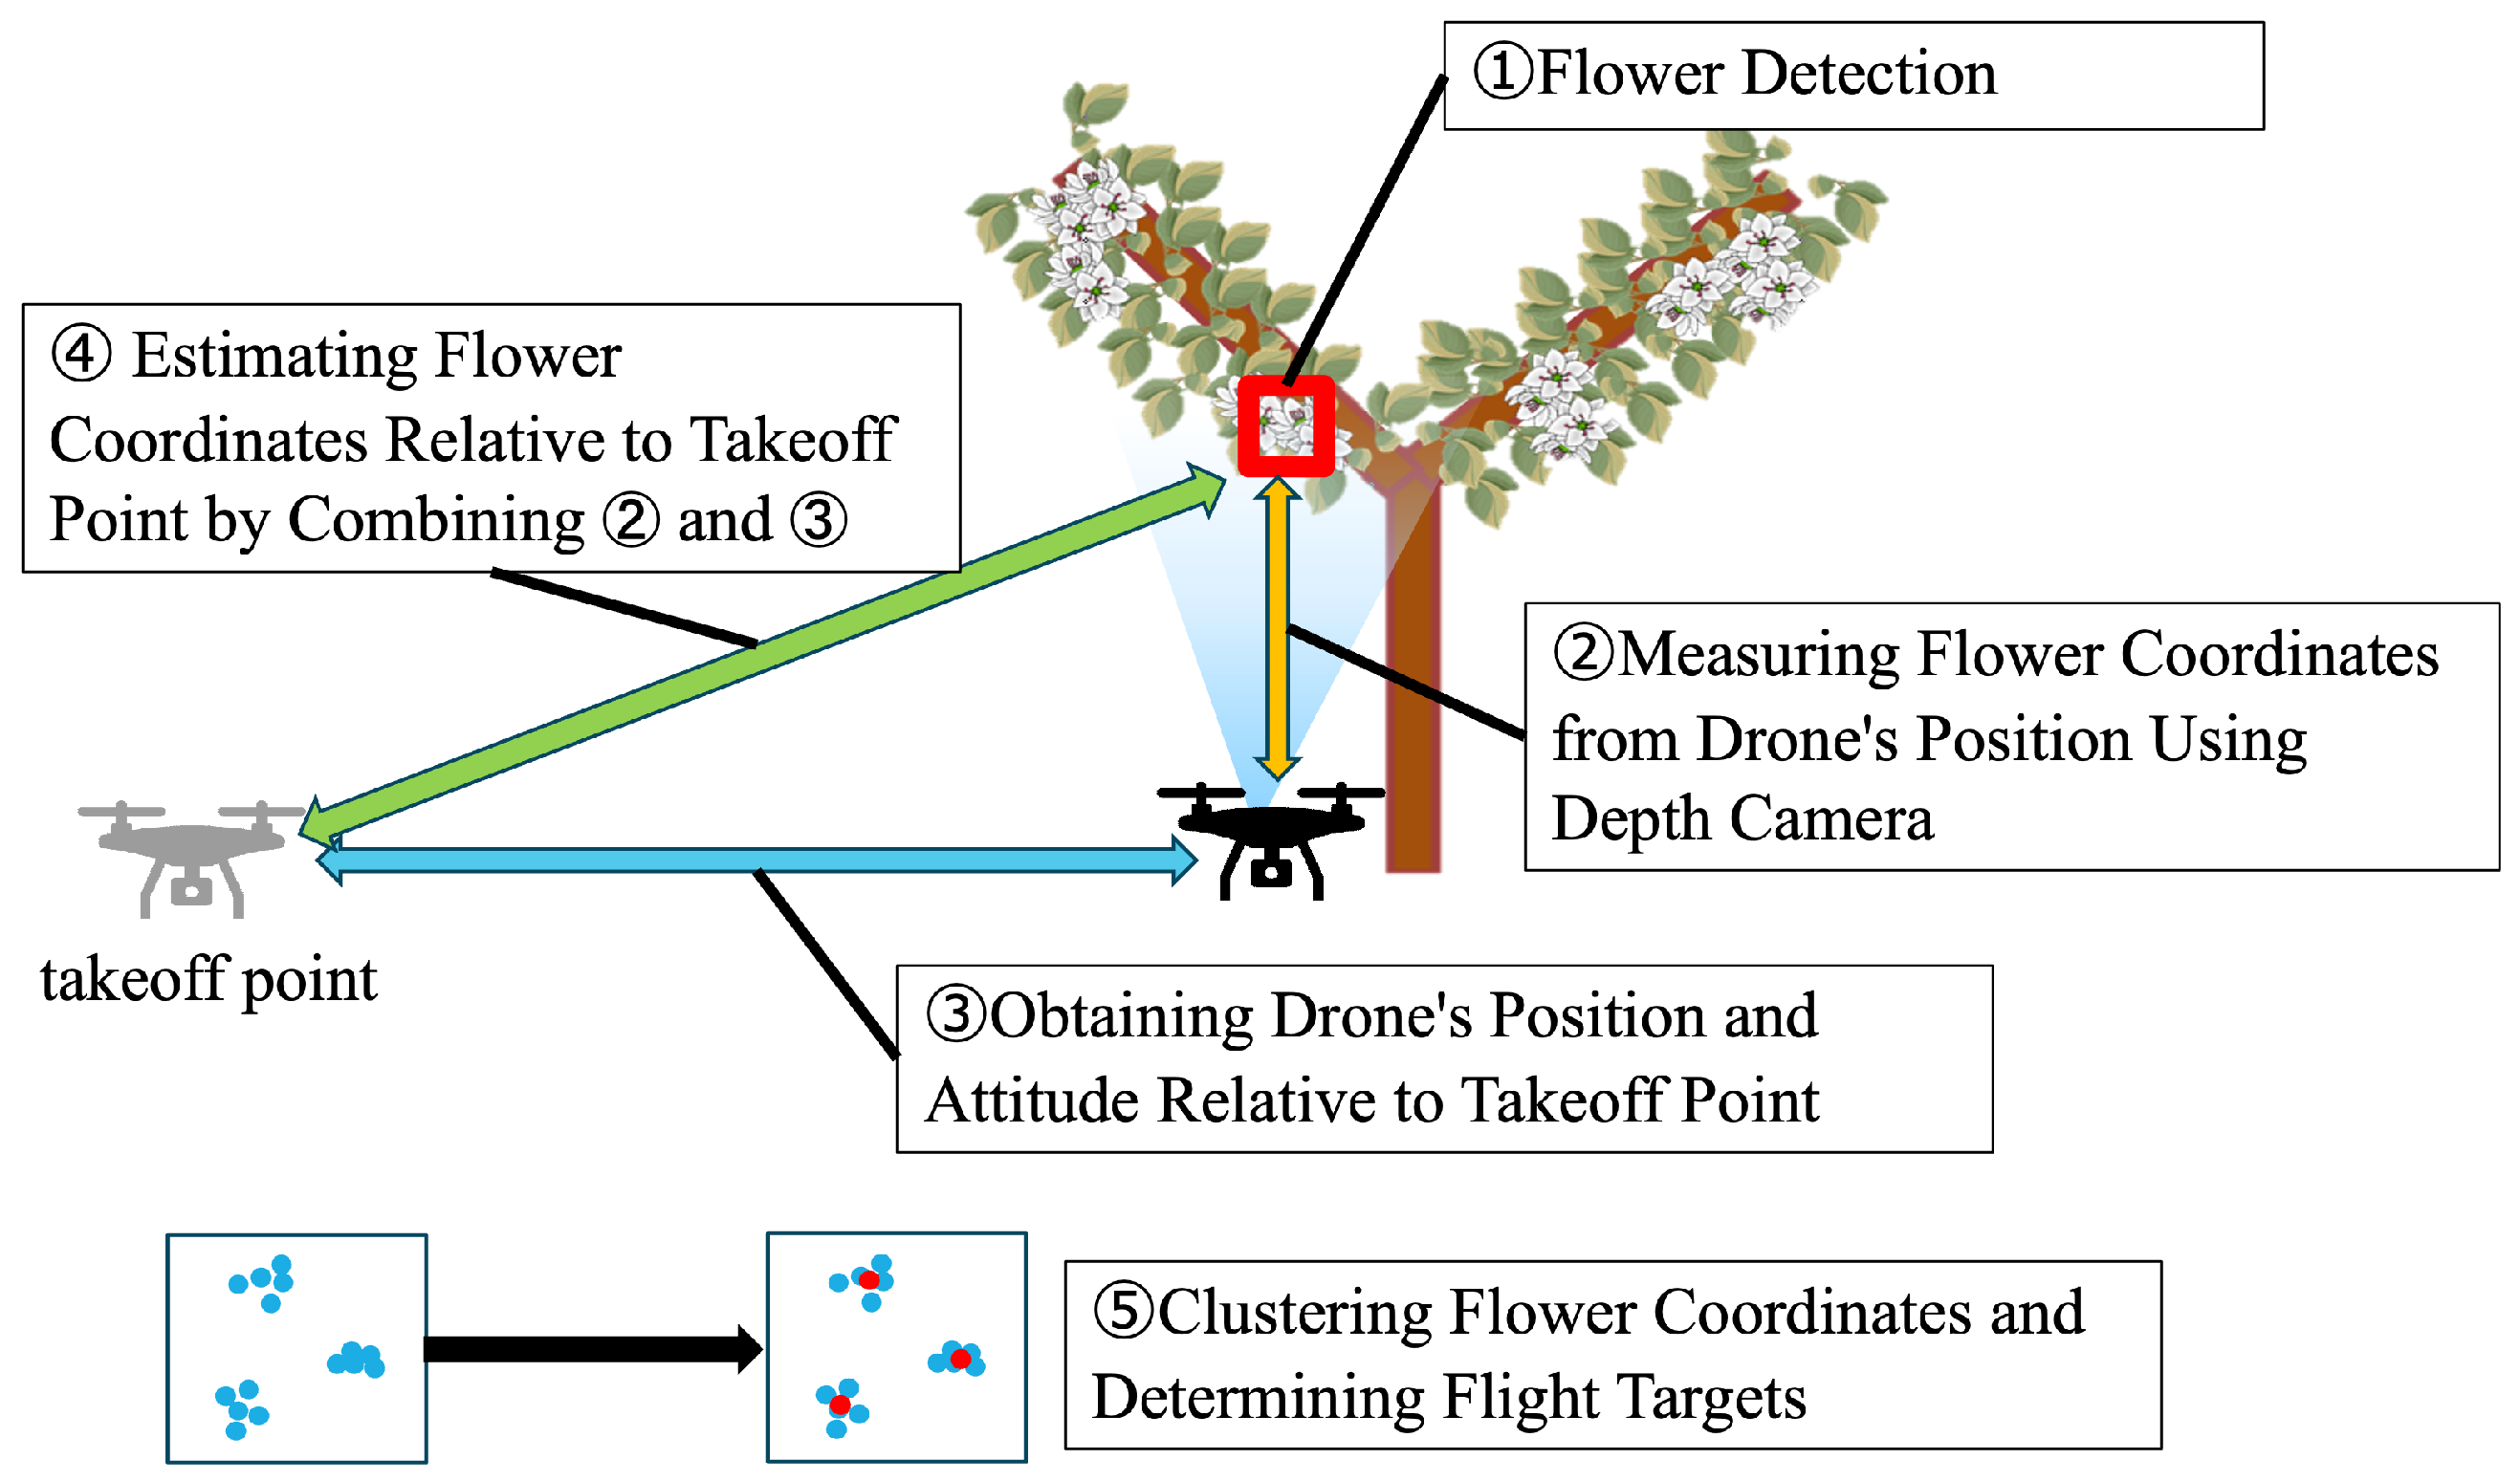
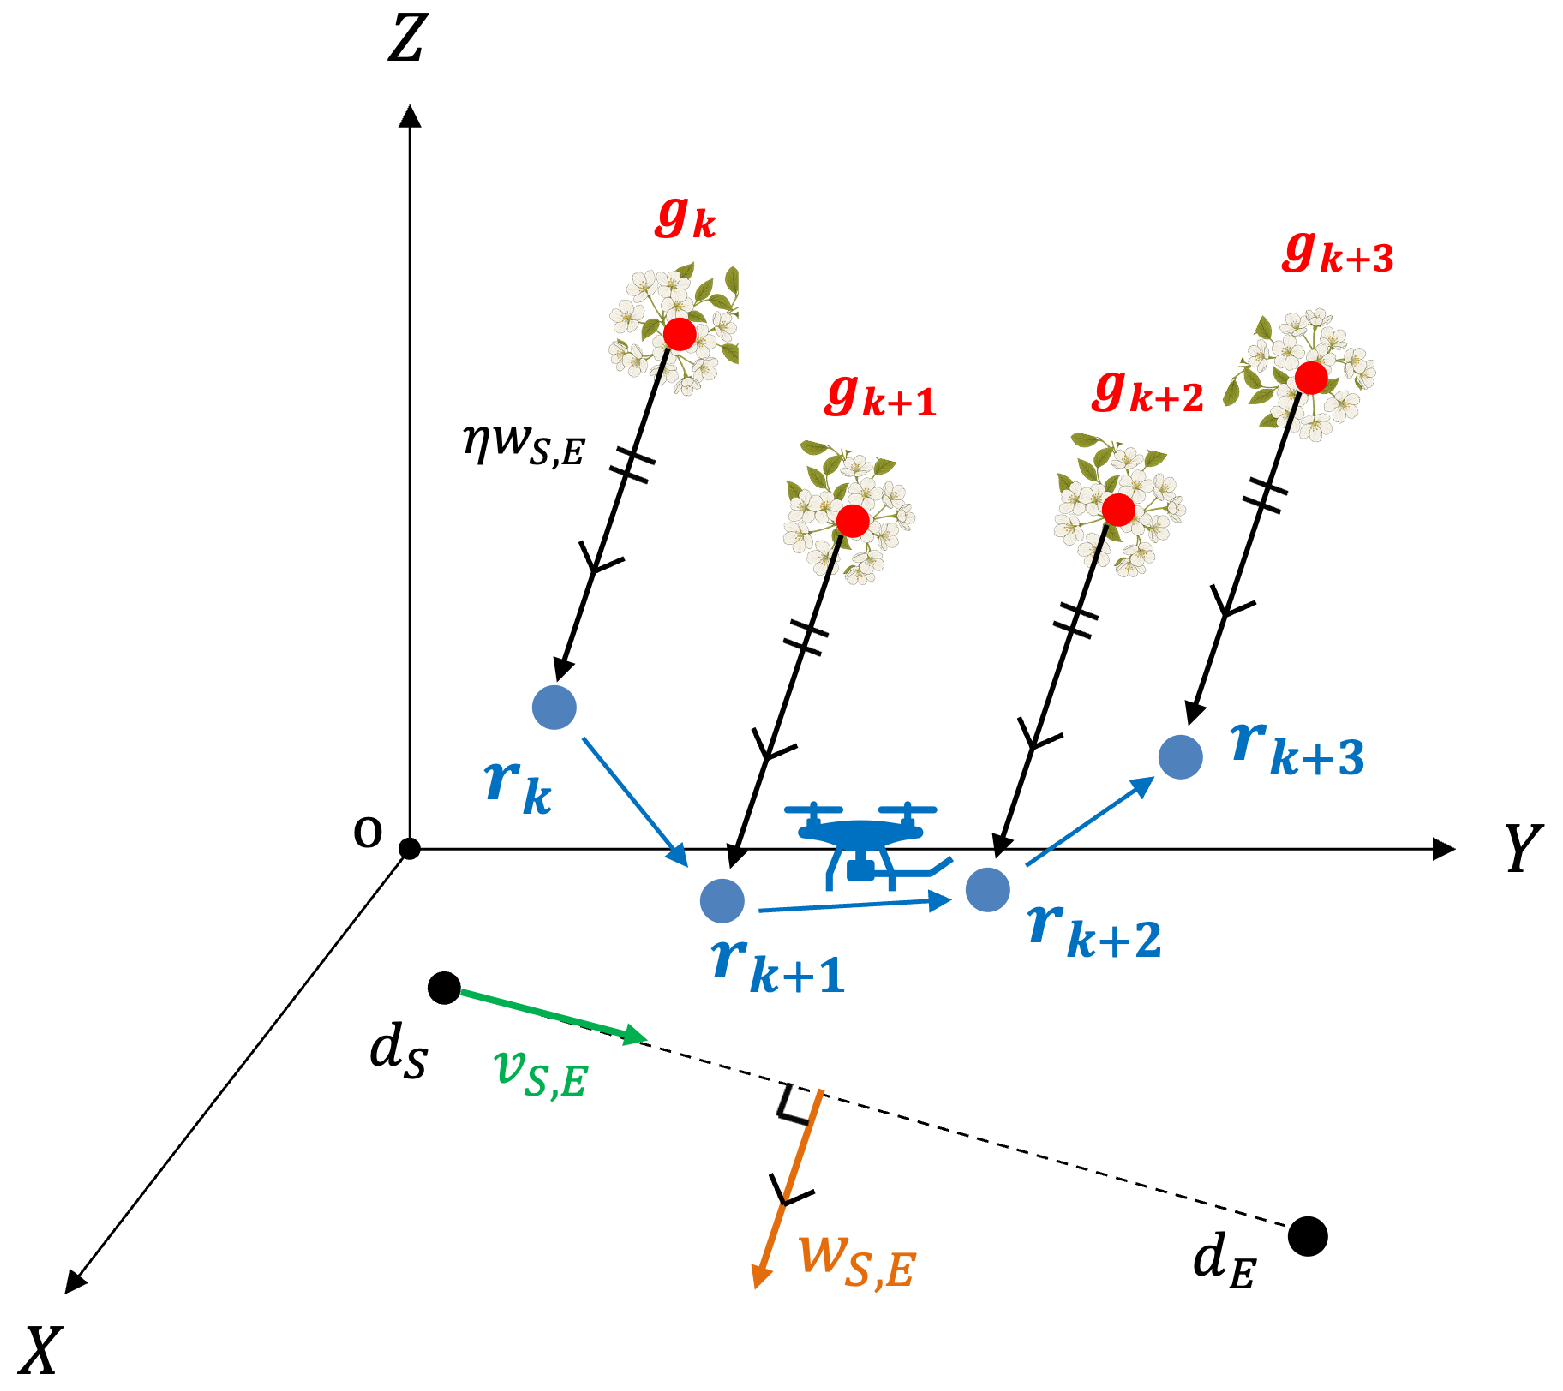
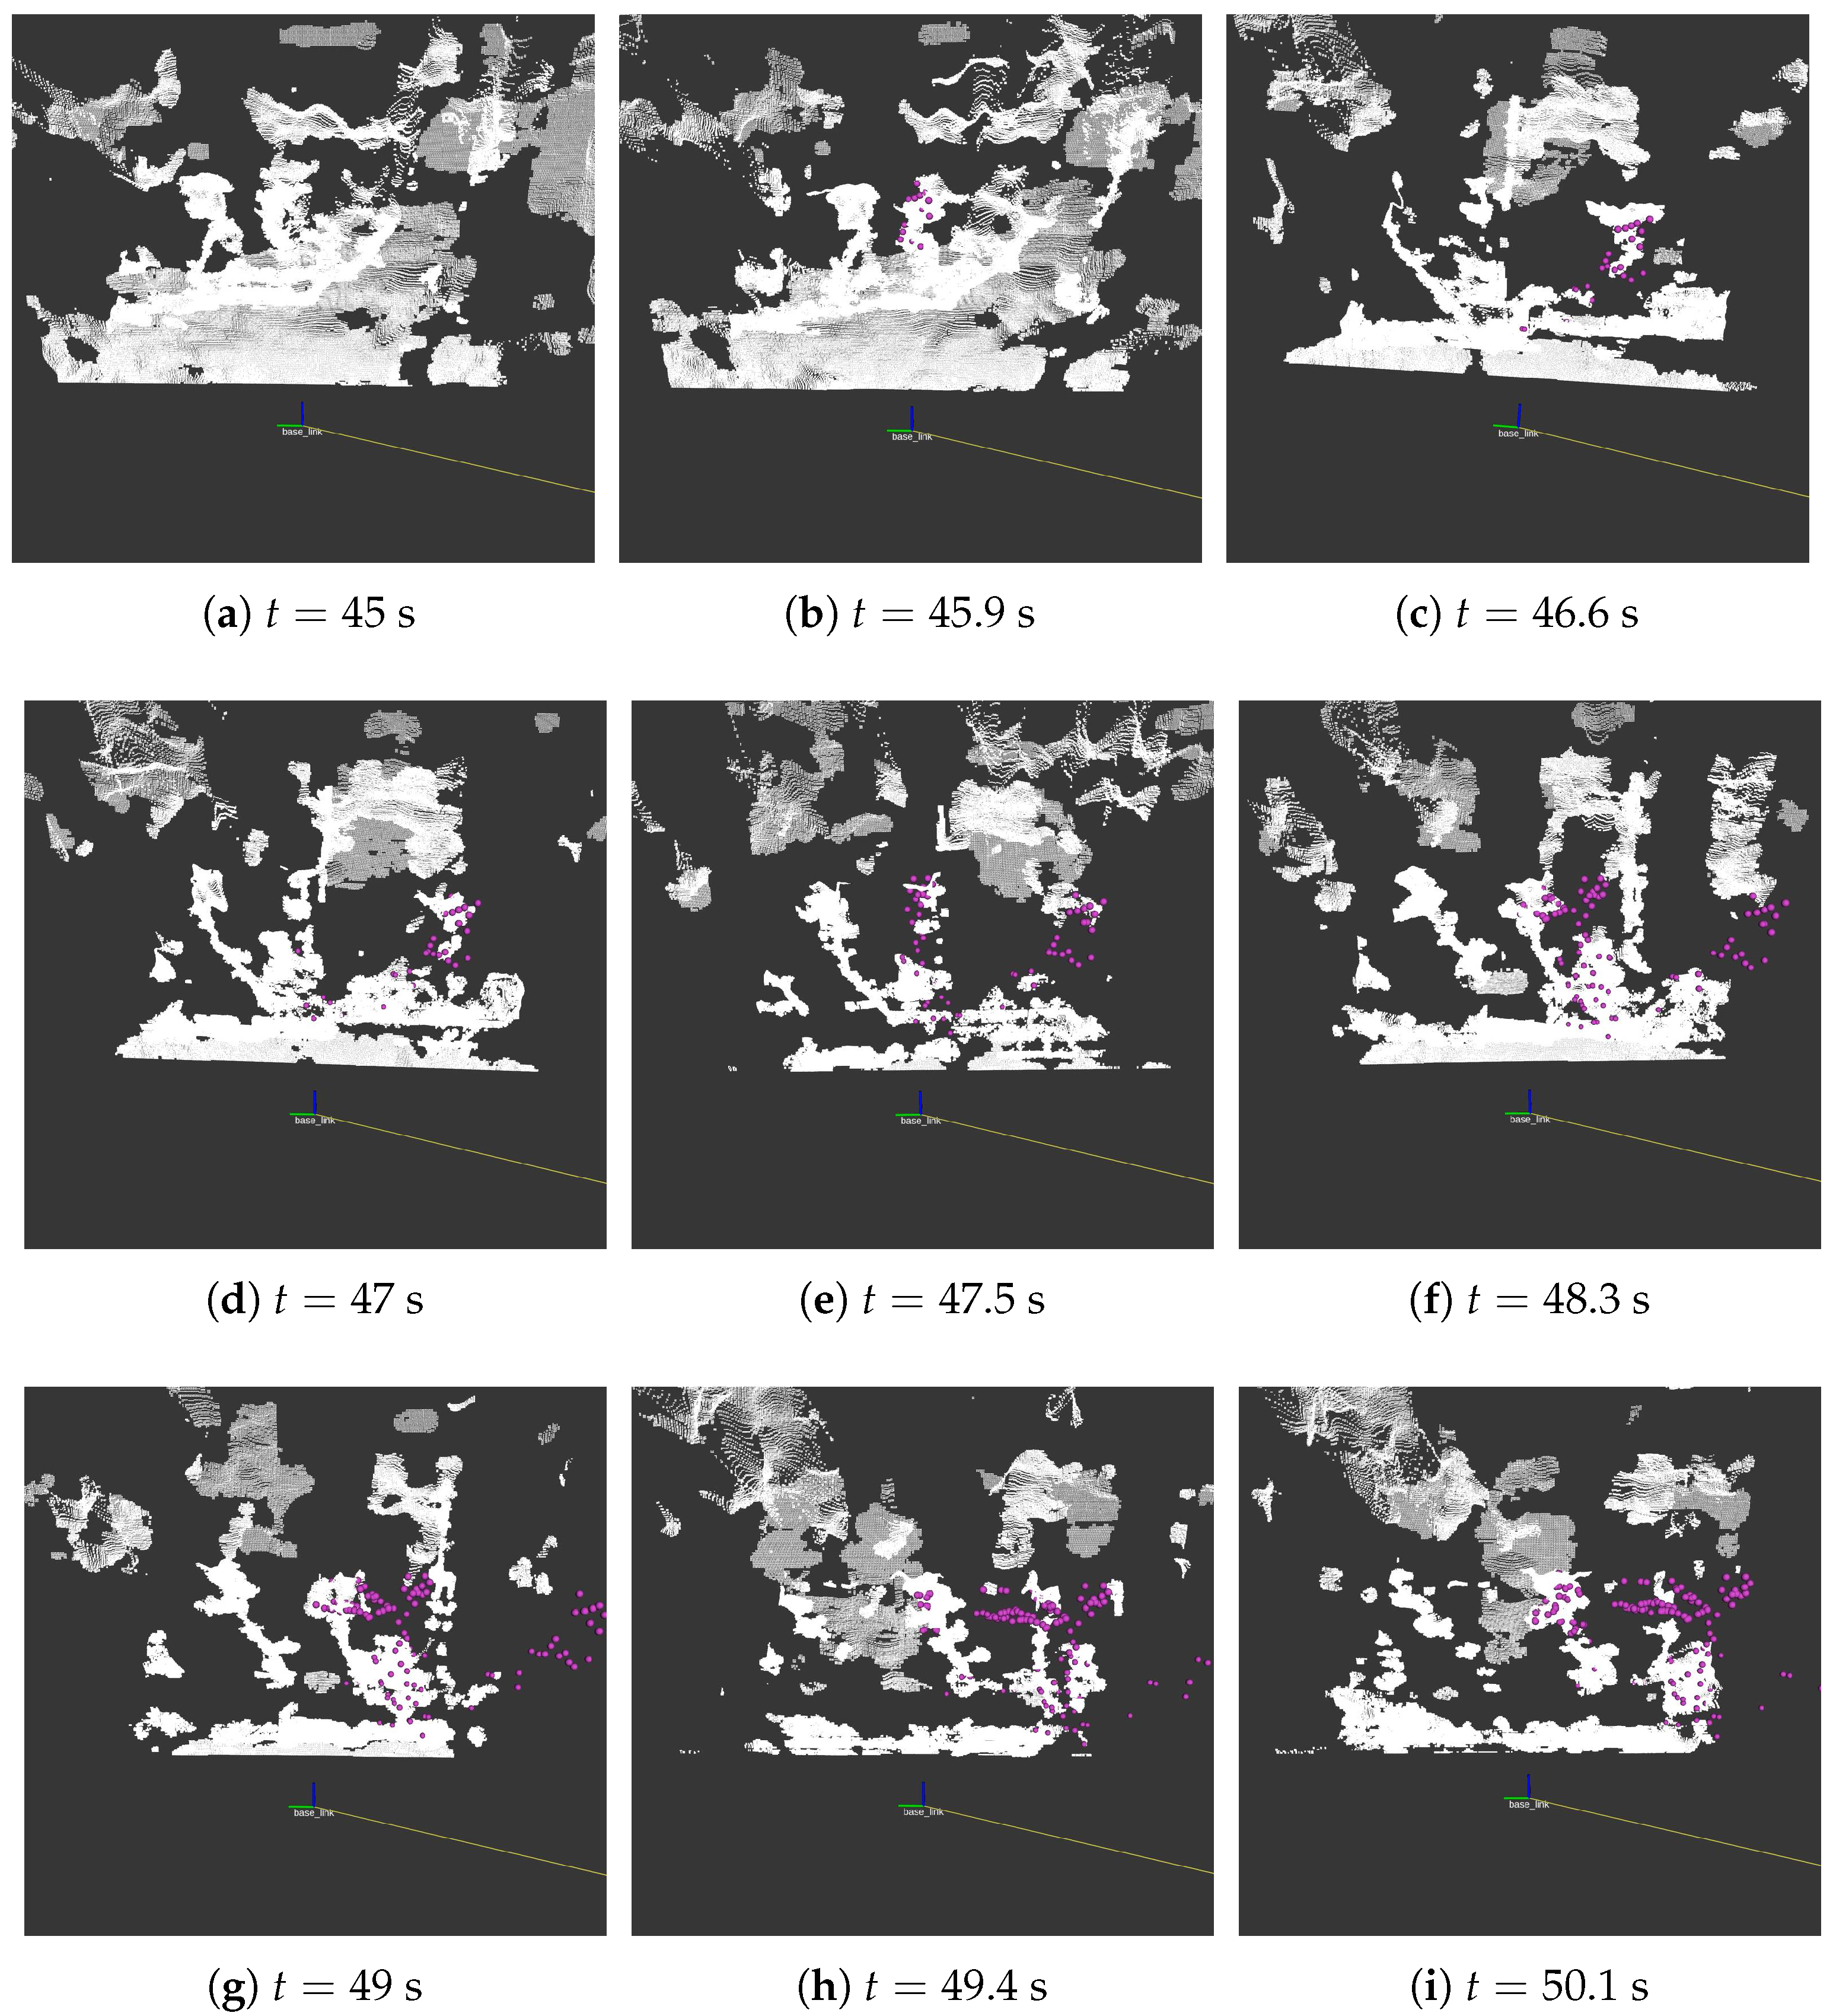
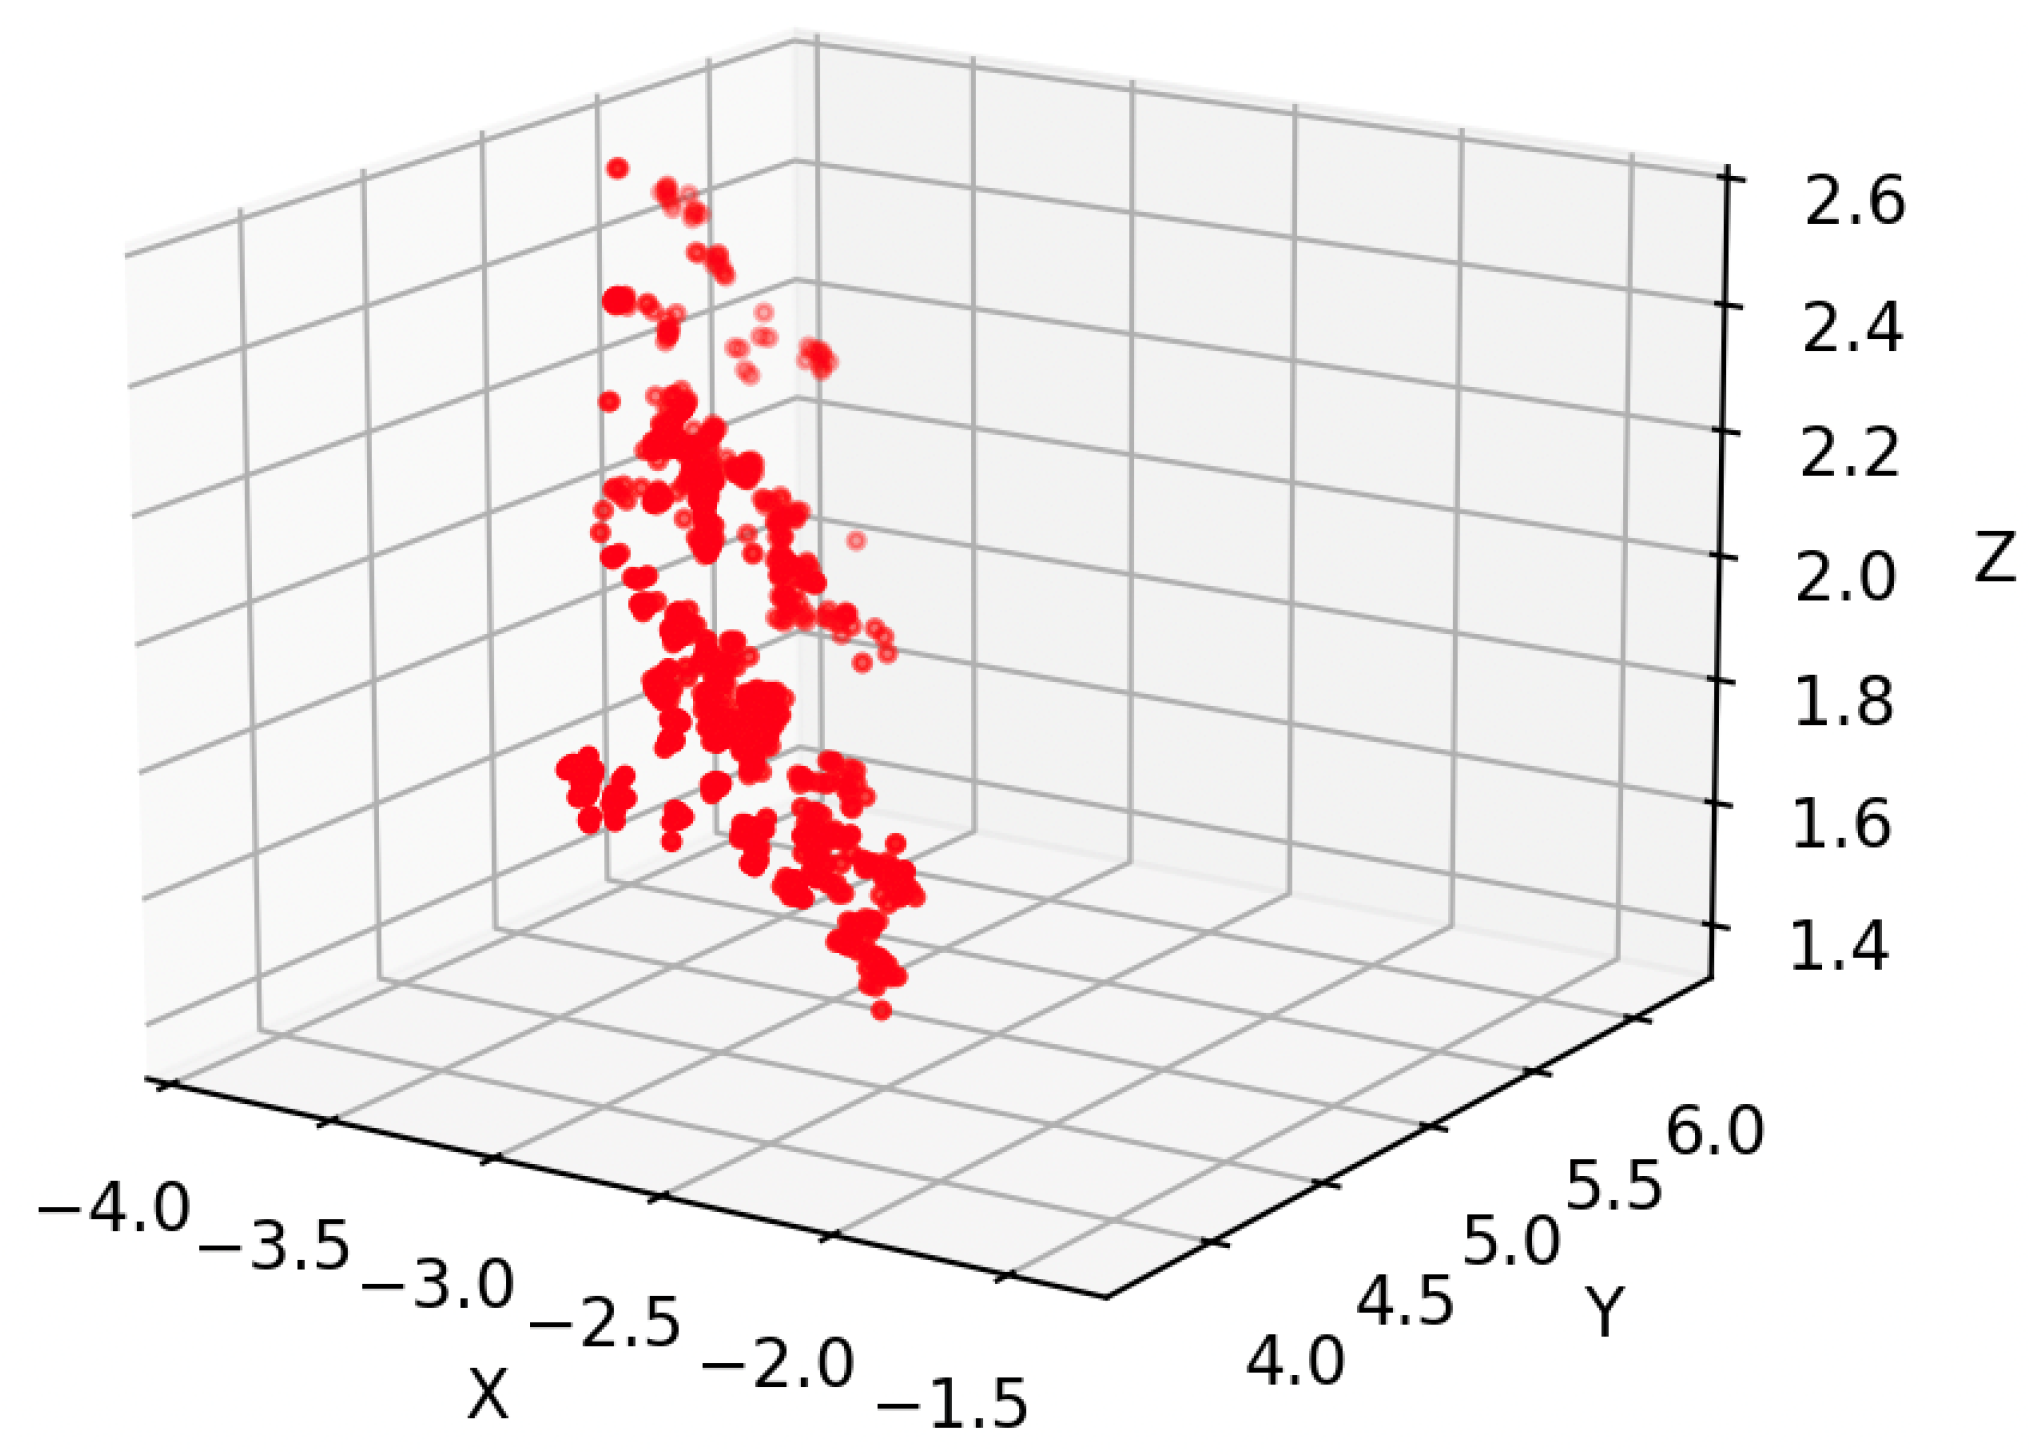
3.4. Estimation of Flower Coordinates

To accurately estimate the coordinates of flowers, the exploration drone uses a depth camera to measure the distance between the drone and the flowers. Additionally, by integrating the drone’s GNSS data and attitude information, the system can determine the flower coordinates in 3D space.
Figure 9 shows the procedure for flower coordinate estimation. First, the observation drone applies the YOLO algorithm, as described in the previous section, to the captured color image with a resolution of W × H to detect the positions of individual flowers. The system localizes each detected flower in the image as a pixel coordinate ( w , h ) . Subsequently, using both the color and corresponding depth images, the system projects the detected pixel positions into a point cloud aligned with the world coordinate system. This coordinate system is defined such that the image center serves as the origin and the positive Z-axis is aligned with the direction of depth. The system obtains the 3D position ( x , y , z ) of a flower relative to the drone by accessing the ( W × h + w ) -th element of the point cloud.
Additionally, the drone’s flight position is recorded in the ENU (East-North-Up) coordinate system as ( e , n , u ) , where the origin corresponds to the takeoff location, and the positive directions are defined as eastward, northward, and upward, respectively. The drone’s orientation is represented by a quaternion ( o x , o y , o z , o w ) , which satisfies the unit-norm constraint:
o x 2 + o y 2 + o z 2 + o w 2 = 1 .
To transform the flower’s position from the drone-relative coordinate system to the ENU coordinate system, we use the drone’s position ( e , n , u ) and attitude ( o x , o y , o z , o w ) corresponding to the timestamp closest to the image capture time. The ENU coordinates of a flower can be transformed into ( x , y , z ) using ( x , y , z ) , ( e , n , u ), and  ( o x , o y , o z , o w ) . This transformation enables the representation of flower locations in a consistent geographic reference frame, which is essential for subsequent flight path planning. Let the coordinates of the n-th detected flower be denoted by ( x n , y n , z n ) and let the total number of detected flowers be N. The set P of all detected flower positions is then represented as
P = { ( x n , y n , z n ) n { 1 , 2 , , N } } .

3.5. Removal of Unnecessary Points

The set P of detected flowers may include flowers located on trees in the background or on the backside, which are not relevant for determining the spraying points. Figure 10 shows the detection of unnecessary flowers. It contains examples of flowers on background trees or on the backside that have been detected. Therefore, such points must be removed from P because they are unnecessary for the planning of pollen spraying locations. If flowers beyond the designated flight path are incorrectly identified, the pollen-spraying drone may attempt to fly across trees during pollination, which increases the risk of a collision or crash. To address this issue, we propose a method to limit target flowers for pollen spraying using a depth camera. Specifically, the average distance of pear branches is measured in advance and set as a threshold. Among the flowers detected by the observation drone’s depth camera, we consider those located beyond this threshold distance to be on the opposite side of the tree and exclude them from the pollination process.
In the proposed method, unnecessary points are removed by ignoring flower positions that are located too far from the observation drone. Specifically, for each detected flower, if the distance between its coordinates and the position of the drone at the time of capture exceeds a predefined threshold τ , we consider the flower to be on the backside and exclude it. The threshold τ is determined in advance based on the measurement of branch lengths. Let P ¯ denote the set of flower positions after unnecessary points are removed:
P ¯ = { p n = ( x n , y n , z n ) P | | p n d n | | τ } ,
where d n denotes the drone’s position at the time when flower p n was captured.
The implementation of this method enables unnecessary flowers to be filtered out at a lower cost and with less effort compared with the installation of additional sensors or measurement of the GNSS coordinates of each pear tree. This approach ensures efficient and safe pollination by preventing unnecessary flights that could lead to obstacles and operational risks.

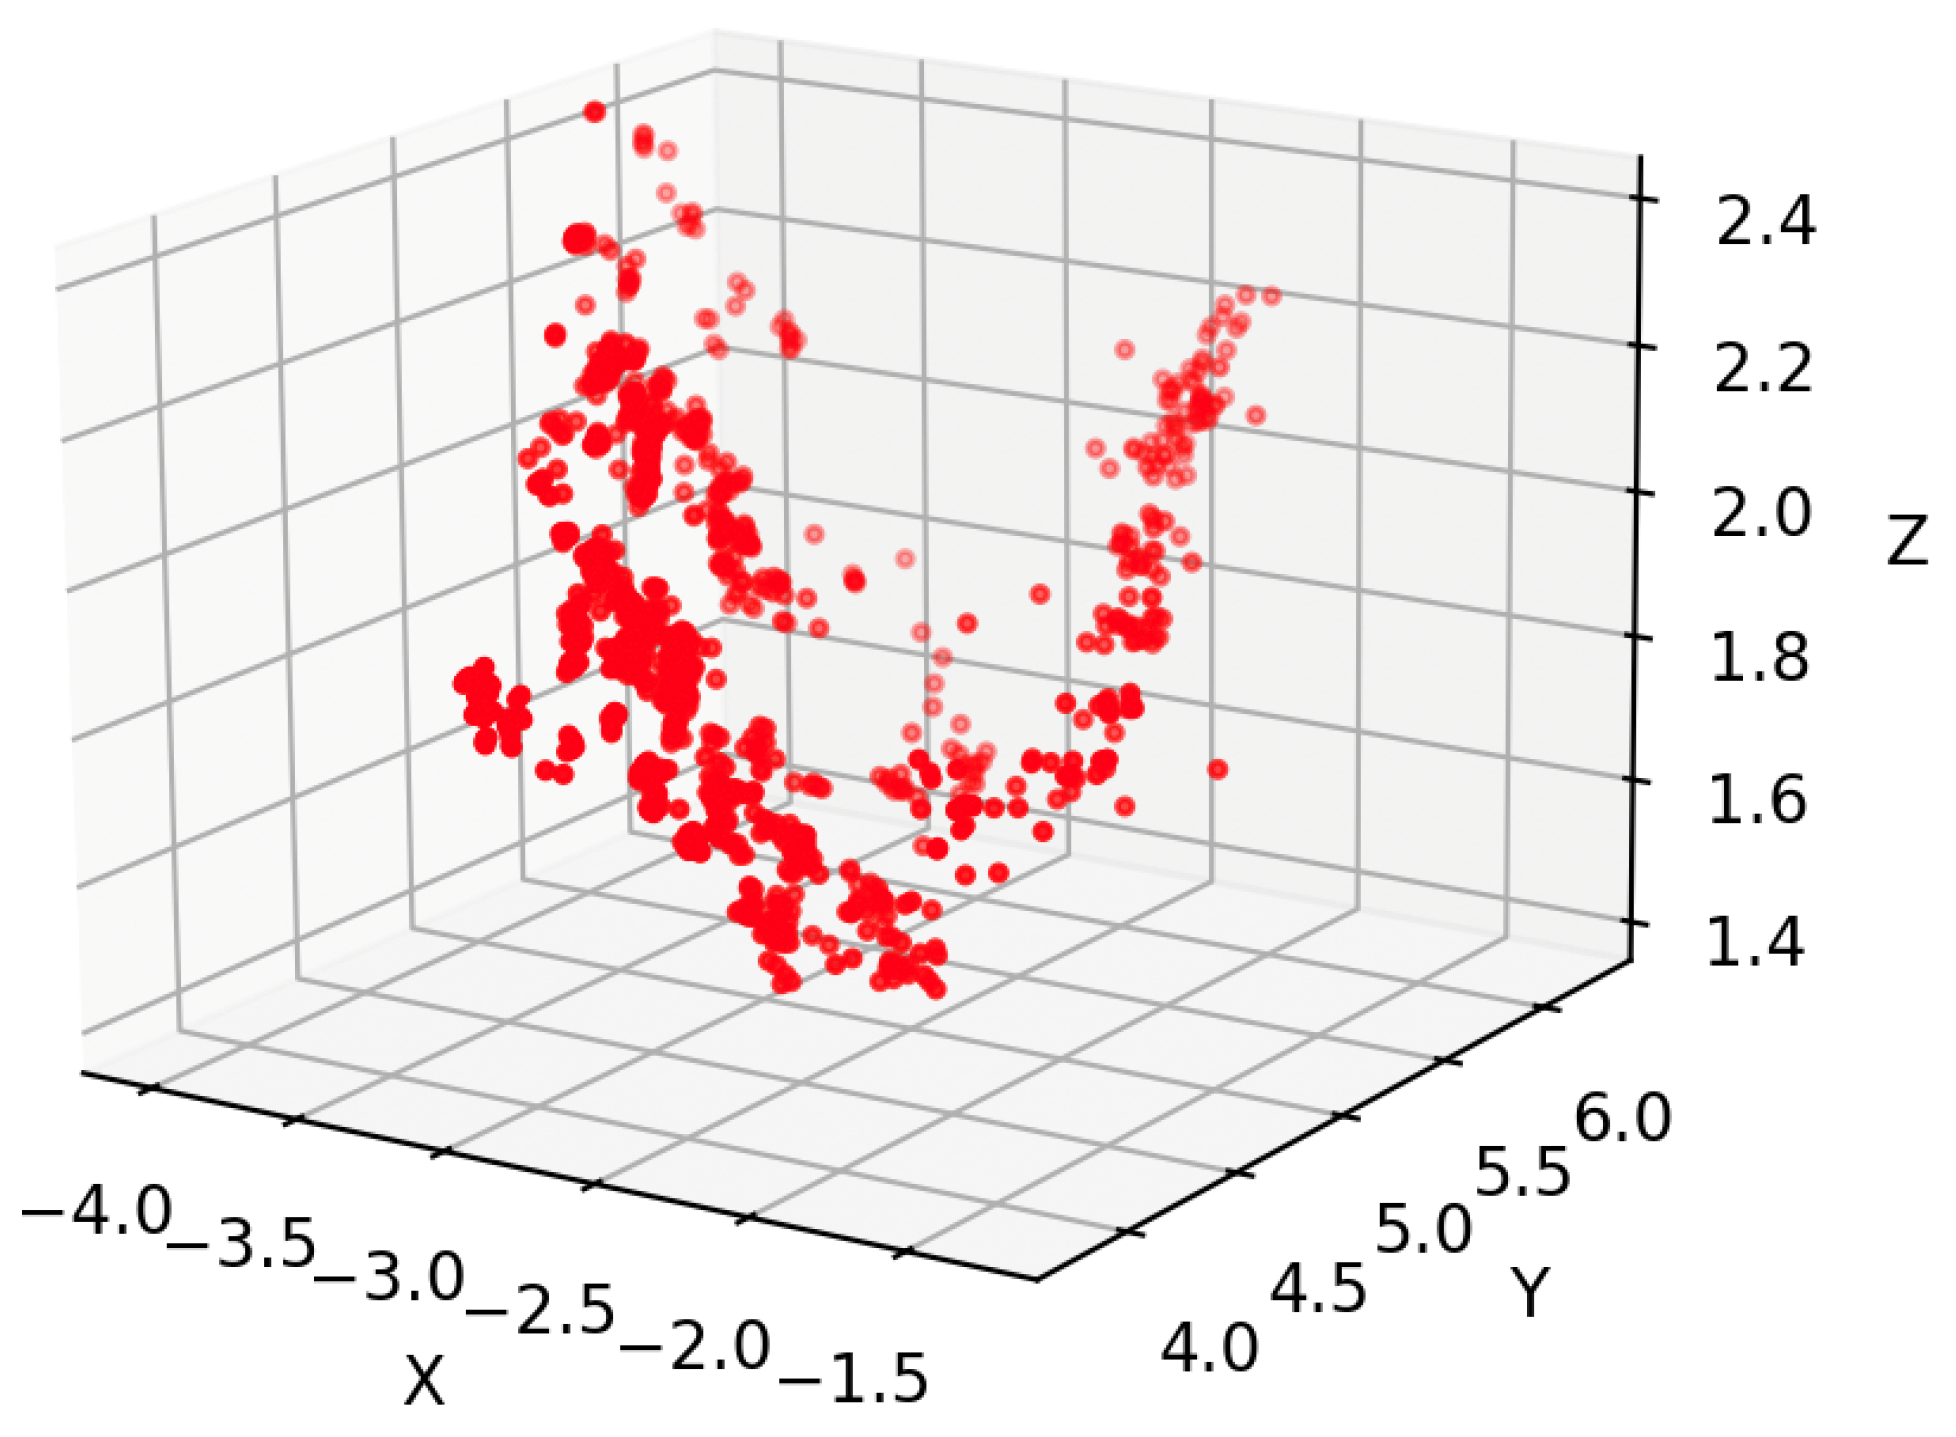
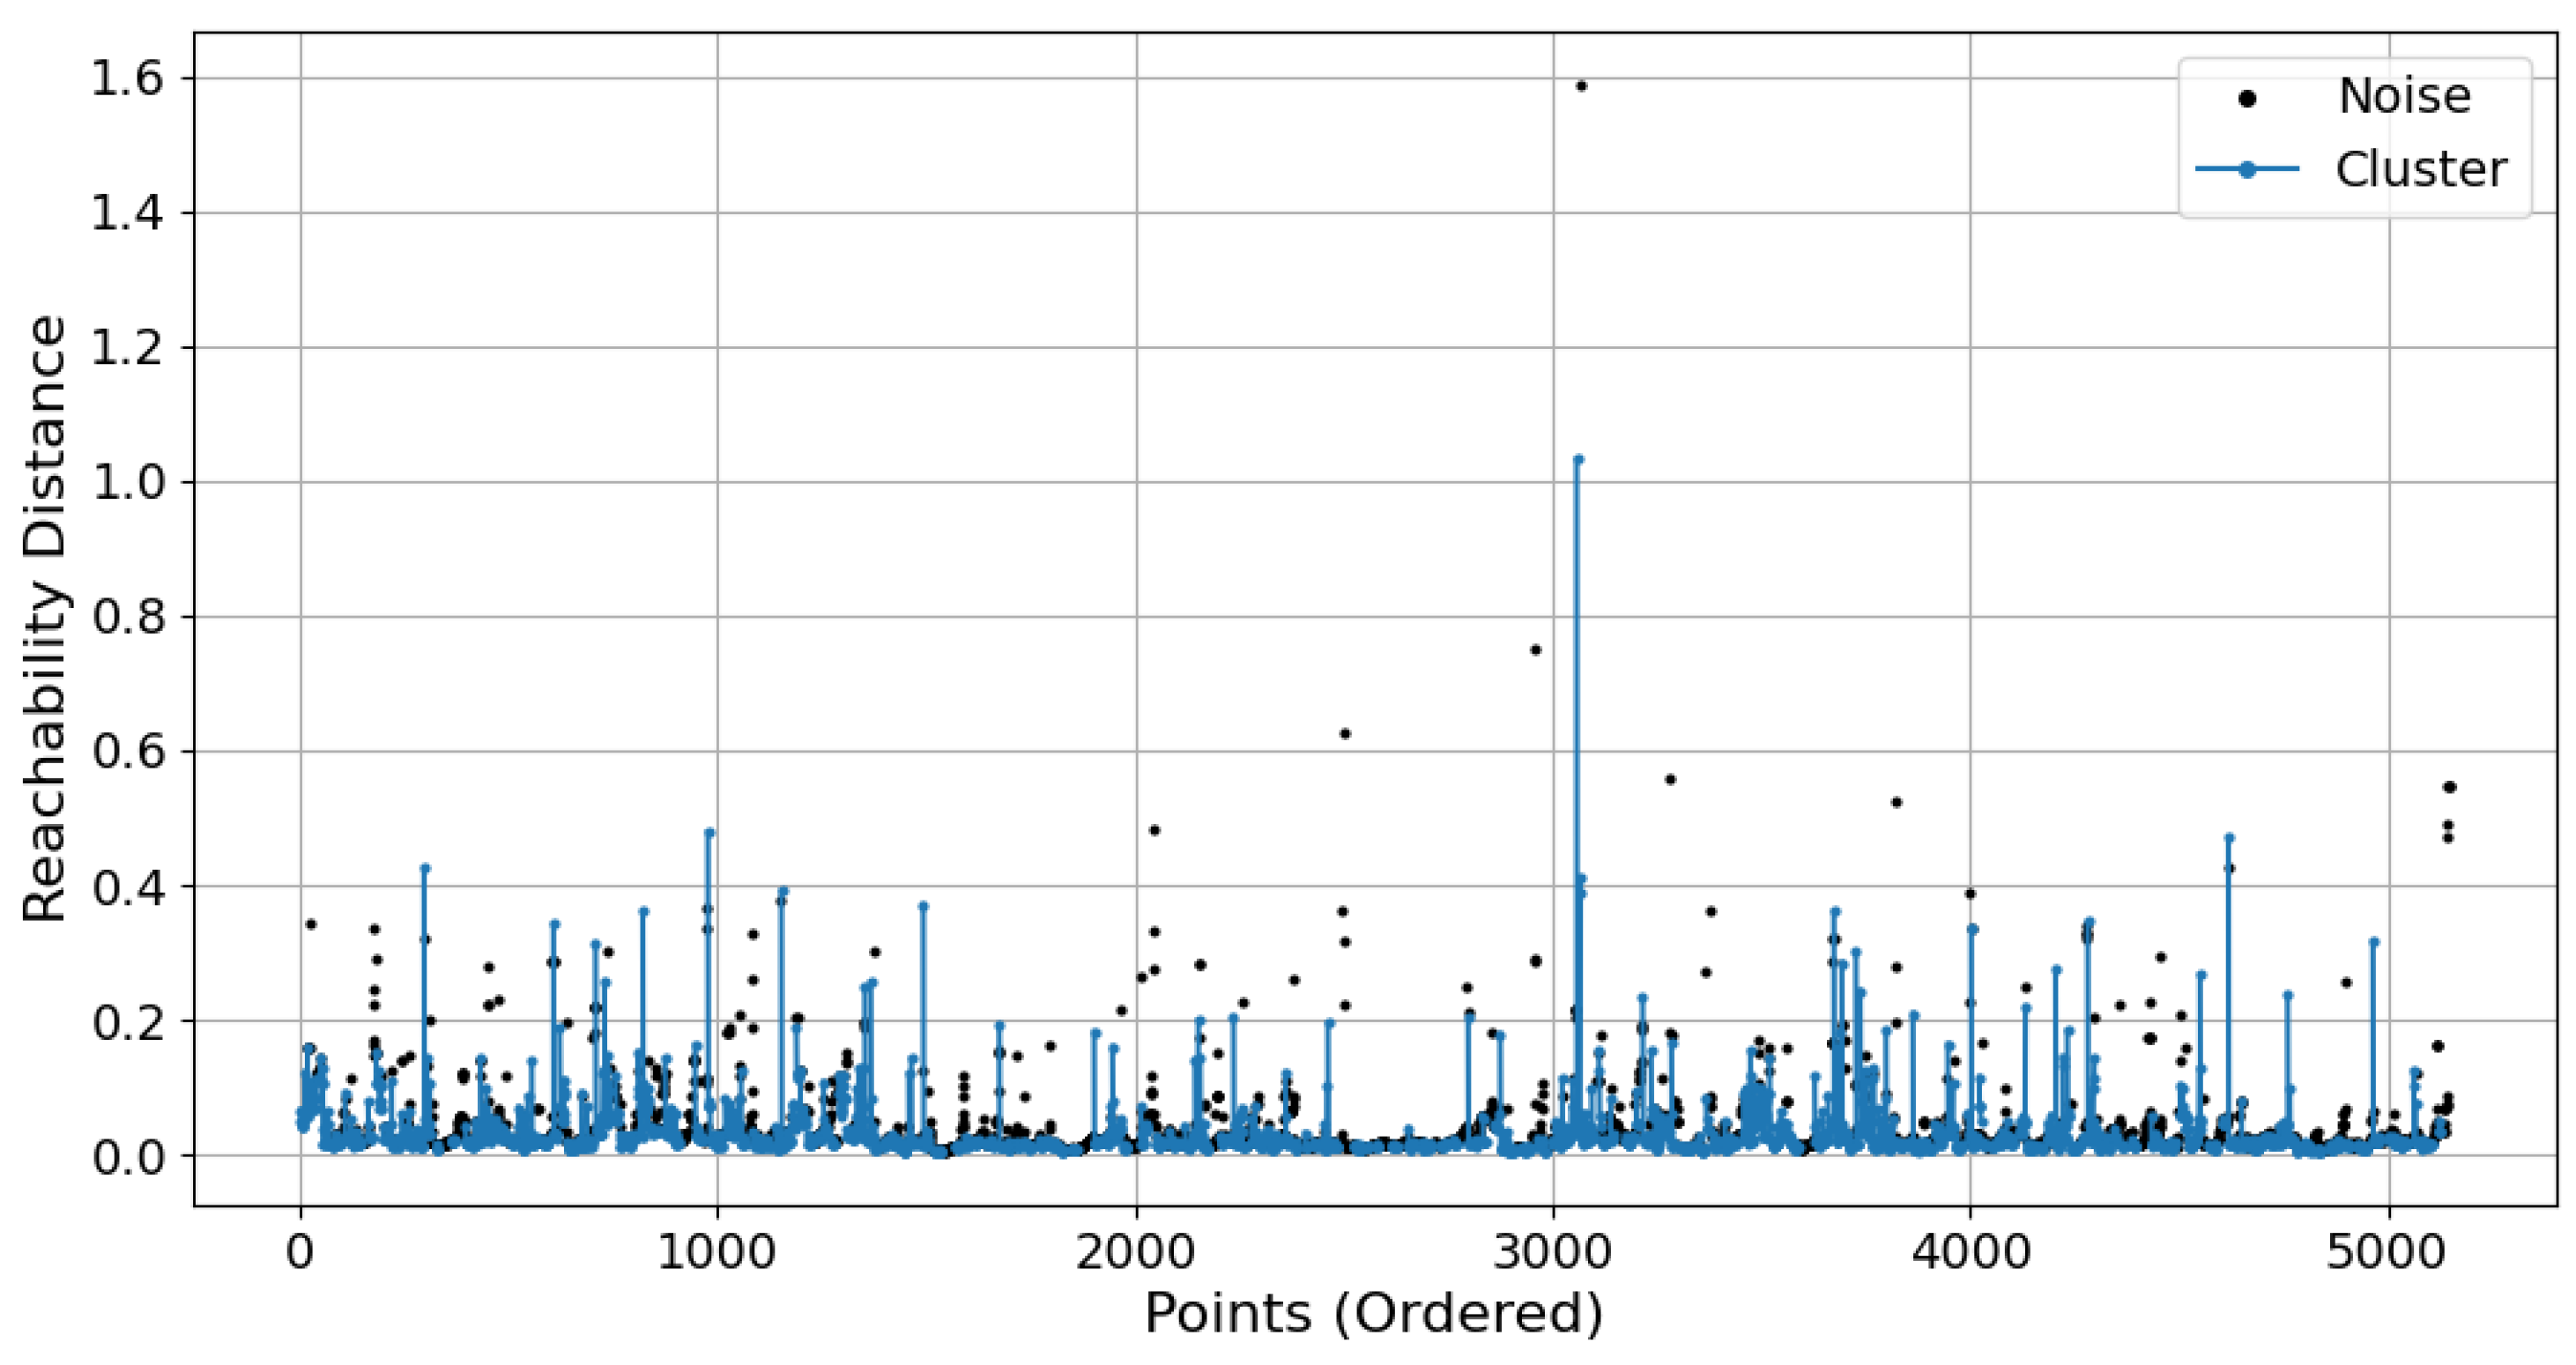
3.6. Clustering of Flower Coordinates Using OPTICS

For the flower coordinate set P ¯ , clustering using the OPTICS (Ordering Points To Identify the Clustering Structure) algorithm is performed. The OPTICS algorithm is a density-based clustering method that is designed to identify data clusters with varying densities, thus making it well-suited for the irregular distributions of pear flowers in natural environments. In pear orchards, the flowers tend to grow in groups along individual branches, thus creating spatial gaps between the clusters and creating varying cluster densities that depend on the branch structure. OPTICS is particularly effective in these settings because it does not require the number of clusters to be specified in advance and it can detect clusters across a wide range of densities while also handling spatial separation and noise.
OPTICS determines the clustering structure based on two parameters: minimum number of points MinPts and maximum neighborhood radius ϵ . Unlike representative clustering methods [40], OPTICS does not directly produce a clustering. Instead, it generates an augmented ordering of the data points that captures the density-based clustering structure at multiple scales.
The clustering process of OPTICS consists of the following steps:
Step 1. 
Initialize each element p P ¯ as unprocessed. Subsequently, initialize J as J = ϕ .
Step 2. 
If J = P ¯ , terminate the algorithm; otherwise, select a specific element p from P ¯ J . Update J as J : = J { p } .
Step 3. 
If p is processed, return to Step 2; otherwise, compute the neighborhood N ϵ ( p ) as the set of points within a distance ϵ . If the number of points in N ϵ ( p ) is at least MinPts , consider the point p a core point. Define the core distance d core ( p ) as the distance from p to its MinPts -th nearest neighbor within N ϵ ( p ) :
d core ( p ) = min { distance ( p , q ) q N ϵ ( p ) , | N ϵ ( p ) |   MinPts } .
When the computation of the neighborhood is complete, mark the point p as processed and append its entry to the ordered list to preserve the density-based traversal order.
Step 4. 
If the core distance d core ( p ) is defined, initialize a priority queue Q . Evaluate each unprocessed point q N ϵ ( p ) and compute its reachability distance from p as
d reach ( p , q ) = max d core ( p ) , distance ( p , q ) .
If q does not yet have a reachability distance assigned to it, set the computed value and insert q into the priority queue Q . If  q is already in the queue with a larger reachability distance, update its value and adjust its position in the queue accordingly.
Step 5. 
Although Q is not empty, remove the point q Q with the smallest reachability distance from the queue. If  q is unprocessed, mark it as processed and add it to the ordered list. Then, compute its ϵ -neighborhood N ϵ ( q ) and evaluate its core distance d core ( q ) . If  q is a core point, process its neighbors in the same manner as described in Step 4 and add them to Q .
Step 6. 
When the processing of all points reachable from p is complete, return to Step 2.
Clusters are extracted from the output of the OPTICS algorithm by identifying changes in the density structure observed in the reachability plot. Specifically, after the reachability-ordered list of data points is constructed, the algorithm analyzes the plot to detect regions where the reachability distance exhibits significant local variations. It initiates a new cluster when the reachability distance decreases sharply, which indicates a transition into a denser region. The cluster ends when the reachability distance increases beyond a specified ratio. This behavior is controlled by the parameter ξ , which defines the minimum relative change in reachability distance required to signal a cluster boundary. In essence, the algorithm detects valleys in the reachability plot whose slopes exceed the threshold defined by ξ , which allows the identification of clusters based on density variations rather than a fixed global distance threshold.
Let K denote the number of clusters obtained by the OPTICS algorithm and let each cluster be represented by P k ( k = 1 , 2 , , K ). Furthermore, let g k denote the centroid of cluster P k , which is defined as
g k = 1 | P k | p P k p ,
where | P k | is the number of points in cluster P k and p represents the coordinate of each flower in the cluster. The centroids g k ( k = 1 , 2 , , K ) are rearranged in ascending order of their distance from the drone’s starting position d s , which results in an ordered sequence denoted by g k ( k = 1 , 2 , , K ).
Because flying the drone directly to the position of g k may result in a collision with branches, it is necessary to apply an offset v offset to each g k to ensure a safe flight path. Because the vertical position should remain unchanged, the offset vector is defined as
v offset = ( x offset , y offset , 0 ) .
The offset vector v offset is determined as follows. First, using the coordinates of the starting point d S = ( x S , y S , 0 ) and ending point d E = ( x E , y E , 0 ) , the unit vector v S , E is defined as
v S , E = d E d S d E d S = ( x S , E , y S , E , 0 ) .
Let w S , E denote a vector orthogonal to v S , E . Then, w S , E is given by
w S , E = ( y S , E , x S , E , 0 ) .
The offset vector v offset is defined using w S , E as follows:
v offset = η · w S , E ,
where η is a predefined offset distance used to avoid collisions with branches. The parameter η is determined based on the length of the nozzle mounted on the pollination drone. In this study, we assume that the nozzle length is 0.8 m, and by adding a margin of 0.5 m, η is set to 1.3 m.
The drone’s flight path is defined using the centroids g k ( k = 1 , 2 , , K ) and offset vector v offset , which results in the following trajectory:
d S r 1 r 2 r K d E ,
where
r k = g k + v offset ( k = 1 , 2 , , K ) .
Figure 11 illustrates the relationship between the flight path and the mathematical notations that are used in the formulation. The path r k r k + 1 r k + 2 r k + 3 represents the planned flight trajectory. This path ensures that the drone will approach each flower cluster from a safe offset distance position defined by η w S , E to perform pollination effectively.

4. Performance Evaluation

4.1. Experimental Setting

The drone flight experiment was conducted in April 2024 and 2025 at the Saitama Prefectural Agricultural Technology Center (Kuki experiment field, Saitama prefecture in Japan) [41]. We equipped the drone with a Pixhawk 4 flight controller and Intel RealSense D435i depth camera [42]. In 2024, the PX4 Vision [43] (Figure 12a) was used as the drone platform and, in 2025, the Holybro X500 V2 [44] (Figure 12b) was adopted. The drones were controlled using QGroundControl [45] and followed a predefined flight path generated based on aerial imagery. A compact base station was installed within the orchard to enable RTK-GNSS-based positioning (Figure 13). This allowed for centimeter-level control accuracy. For a detailed discussion of the precise flight control method, please refer to our previous study [23].
The flight path of the observation drone was configured as follows: the drone flew approximately 41.8 m in a north-northwest direction above a single row of pear trees, maintaining an altitude of approximately 1.5 m while capturing images facing northeast. During the flight, the drone traveled at a speed of approximately 0.1 m per second and hovered for one second every ten seconds. A companion computer located onboard the observation drone recorded the ROS (Robot Operating System) topics as a rosbag file on an external USB memory device. The recorded ROS topics were summarized in Table 1, where N E represents the number of events. The rosbag file size that was recorded during a single flight experiment was 5.9 GB.
The ROS topics recorded via the observation drone were subsequently transferred to the control PC for further processing. Communications between the drone and the control PC were conducted via Wi-Fi. The control PC operated on Ubuntu 18.04 and also used ROS Melodic [46]. For the point cloud generation and coordinate transformation, the ROS libraries (e.g., depth_image_proc and tf) were used. In this setup, the recorded rosbag files are replayed and subscribed sequentially to the image and the coordinate data streamed over the ROS core. Online processing is conducted by publishing a combination of the newly generated point cloud data and estimated world coordinates of the flowers to dedicated ROS topics. More specifically, blooming pear flowers are detected first for the images in the ROS topics. The center of each detected bounding box is obtained as ( x , y ) and its corresponding depth is used to compute the 3D coordinate ( x , y , z ) . Next, a set of flower coordinates is clustered using the OPTICS algorithm. Using the method described in Section 3.6, the drone’s flight path is constructed from the flower clusters identified, which result in a sequence of waypoints denoted as d S r 1 r 2 r K d E . The waypoint sequence is processed in the control PC before being subsequently transmitted to the drone via the ROS. Using the MAVROS package, generated commands are published to a control topic (e.g., /mavros/setpoint_position/local), which is subscribed to by the PX4 flight controller. On receiving these waypoints, the PX4 controller then interprets them and performs real-time PID (Proportional-Integral-Derivative)-based control to regulate the drone’s propeller thrust and its trajectory. During flight, the drone’s position is refined continuously using RTK-GNSS, which enables centimeter-level accuracy while also ensuring stable hovering at the designated waypoints.

4.2. Results

In this section, we first describe the performance of flower detection in Section 4.2.1. Next, the accuracy of flower position estimation is evaluated in Section 4.2.2. Section 4.2.3 presents the clustering performance, followed by the evaluation of flight path generation in Section 4.2.4. Finally, Section 4.2.5 discusses the results of the fruit set rate experiments.

4.2.1. Flower Detection Performance

YOLOv7 [39] is used as the object detection algorithm. A total of 4000 images of pear trees captured in 2022 were collected. The buds and flowers in these images were manually annotated, as illustrated in Figure 7. For training, 3000 images were used, containing 36,008 annotated buds and 5355 flowers. The remaining 1000 images, which included 12,605 buds and 1819 flowers, were used to test the trained model. Detection performance was evaluated using standard metrics: precision, recall, F1 score, and average precision. Precision and recall are defined as follows:
Precision = TP TP + FP , Recall = TP TP + FN ,
where TP, FP, and FN denote the numbers of true positives, false positives, and false negatives, respectively. The F1 score is defined as
F 1 Score = 2 Precision · Recall Precision + Recall .
The average precision is used to quantify detection performance when confidence scores are available. It is computed as the area under the precision-recall curve. Let P ( r ) denote precision at recall r. The average precision is defined as
Average Precision = 0 1 P ( r ) d r .
The detection results are summarized in Table 2. The precision was 0.833 for the buds and 0.858 for blossoms, which indicates that both buds and blossoms were identified with high accuracy. Recall was 0.745 for buds and 0.902 for blossoms. The F1 score was 0.787 for buds and was 0.880 for blossoms. These results suggest that blossoms were rarely missed, whereas buds were frequently overlooked, which indicates that buds were more difficult to detect than blossoms.
Figure 14 shows the results of applying YOLO to images captured by the drone. Green bounding boxes indicate flowers suitable for pollination, whereas blue bounding boxes represent flower buds. The detection results demonstrate that blooming pear flowers were accurately identified, with minimal false positives involving non-flower objects, indicating the reliability of the detection model. Furthermore, each green bounding box corresponds to a detected flower and each flower is mathematically represented by (1). The center of each bounding box serves as a 2D image coordinate that is subsequently projected into 3D space using the associated depth data and the intrinsic camera parameters. The resulting 3D points are subsequently transformed into the ENU coordinate system to estimate the global flower positions, as detailed in Section 3.4.

4.2.2. Detection Accuracy of Flower Positions

Figure 15 illustrates the progressive development of the 3D point clouds when visualized in RViz at various times t elapsed after takeoff. The 3D point cloud represents the surrounding environment when captured by the observation drone, where the white points correspond to the tree structure. Detected pear flowers are overlaid as purple spheres with spatial coordinates that are estimated from the RGB-D data and clustered using the OPTICS algorithm.
As the drone moved along its flight trajectory, flower detection was performed continuously, with newly detected flowers appearing as purple spheres on the 3D plot. The series of snapshots shows how the number of detected points gradually increased in real time as the drone observed new areas. No flower points are visible in Figure 15a. By contrast, points appear around the branches in Figure 15b,c, which are rendered in white. A large number of points are densely concentrated around the branches in Figure 15i, whereas the areas between them remain largely unmarked. This progression confirms that flower positions were detected accurately and localized in accordance with the actual structure of the tree.
Figure 16 shows a 3D plot of the detected flower positions, where each red dot represents an individual flower. The flowers are distributed in a Y-shaped pattern, which indicates that the flower positions were accurately estimated. To verify the accuracy of the detected flower positions, we manually measured the locations of approximately 20 flowers using a tape measure, with the drone’s flight position serving as the origin. Although this method is somewhat rudimentary, it allowed us to assess the validity of the estimated positions. Figure 17 shows the measurement of the estimated flower position using a tape measure. The results confirmed that, in general, actual flowers were present at the detected positions, thereby supporting the reliability of detection. Although this measurement method may involve significant errors, its accuracy is sufficient for our purposes because the drone experienced slight movements caused by external factors such as wind. Given these conditions, we deem the level of precision achieved through this approach acceptable for validating the estimated flower positions.
As shown in Figure 16, the detected flower positions formed a Y-shaped structure and some flowers on the back side were also detected. Table 3 shows the number of detected flower positions classified as frontside and backside. A considerable number of flowers were detected on the backside. Therefore, we applied the proposed method to remove these back-side flowers. Figure 18 shows the 3D distribution of flower positions after the removal of back-side detection. The figure shows that the flower positions on only one side of the branch were plotted, which indicates that flowers on one side were appropriately extracted. Furthermore, visible gaps exist between groups of points, which confirms that the flowers were clustered as expected.
Figure 19 shows the Accuracy and F1 score as a function of the threshold parameter τ . Accurcay is defined as
Accuracy = TP + TN TP + FP + TN + FN ,
and the F1 score is as defined in Equation (2). From Figure 19, both the accuracy and F1 score reached high values when threshold τ was approximately 1.4 m. This result implies that setting threshold τ to approximately the length of a branch was sufficient. Table 4 presents the lengths of seven branches. The average branch length was approximately 1.4 m, which indicates that setting threshold τ to around the typical branch length was effective for removing flowers located on the backside.

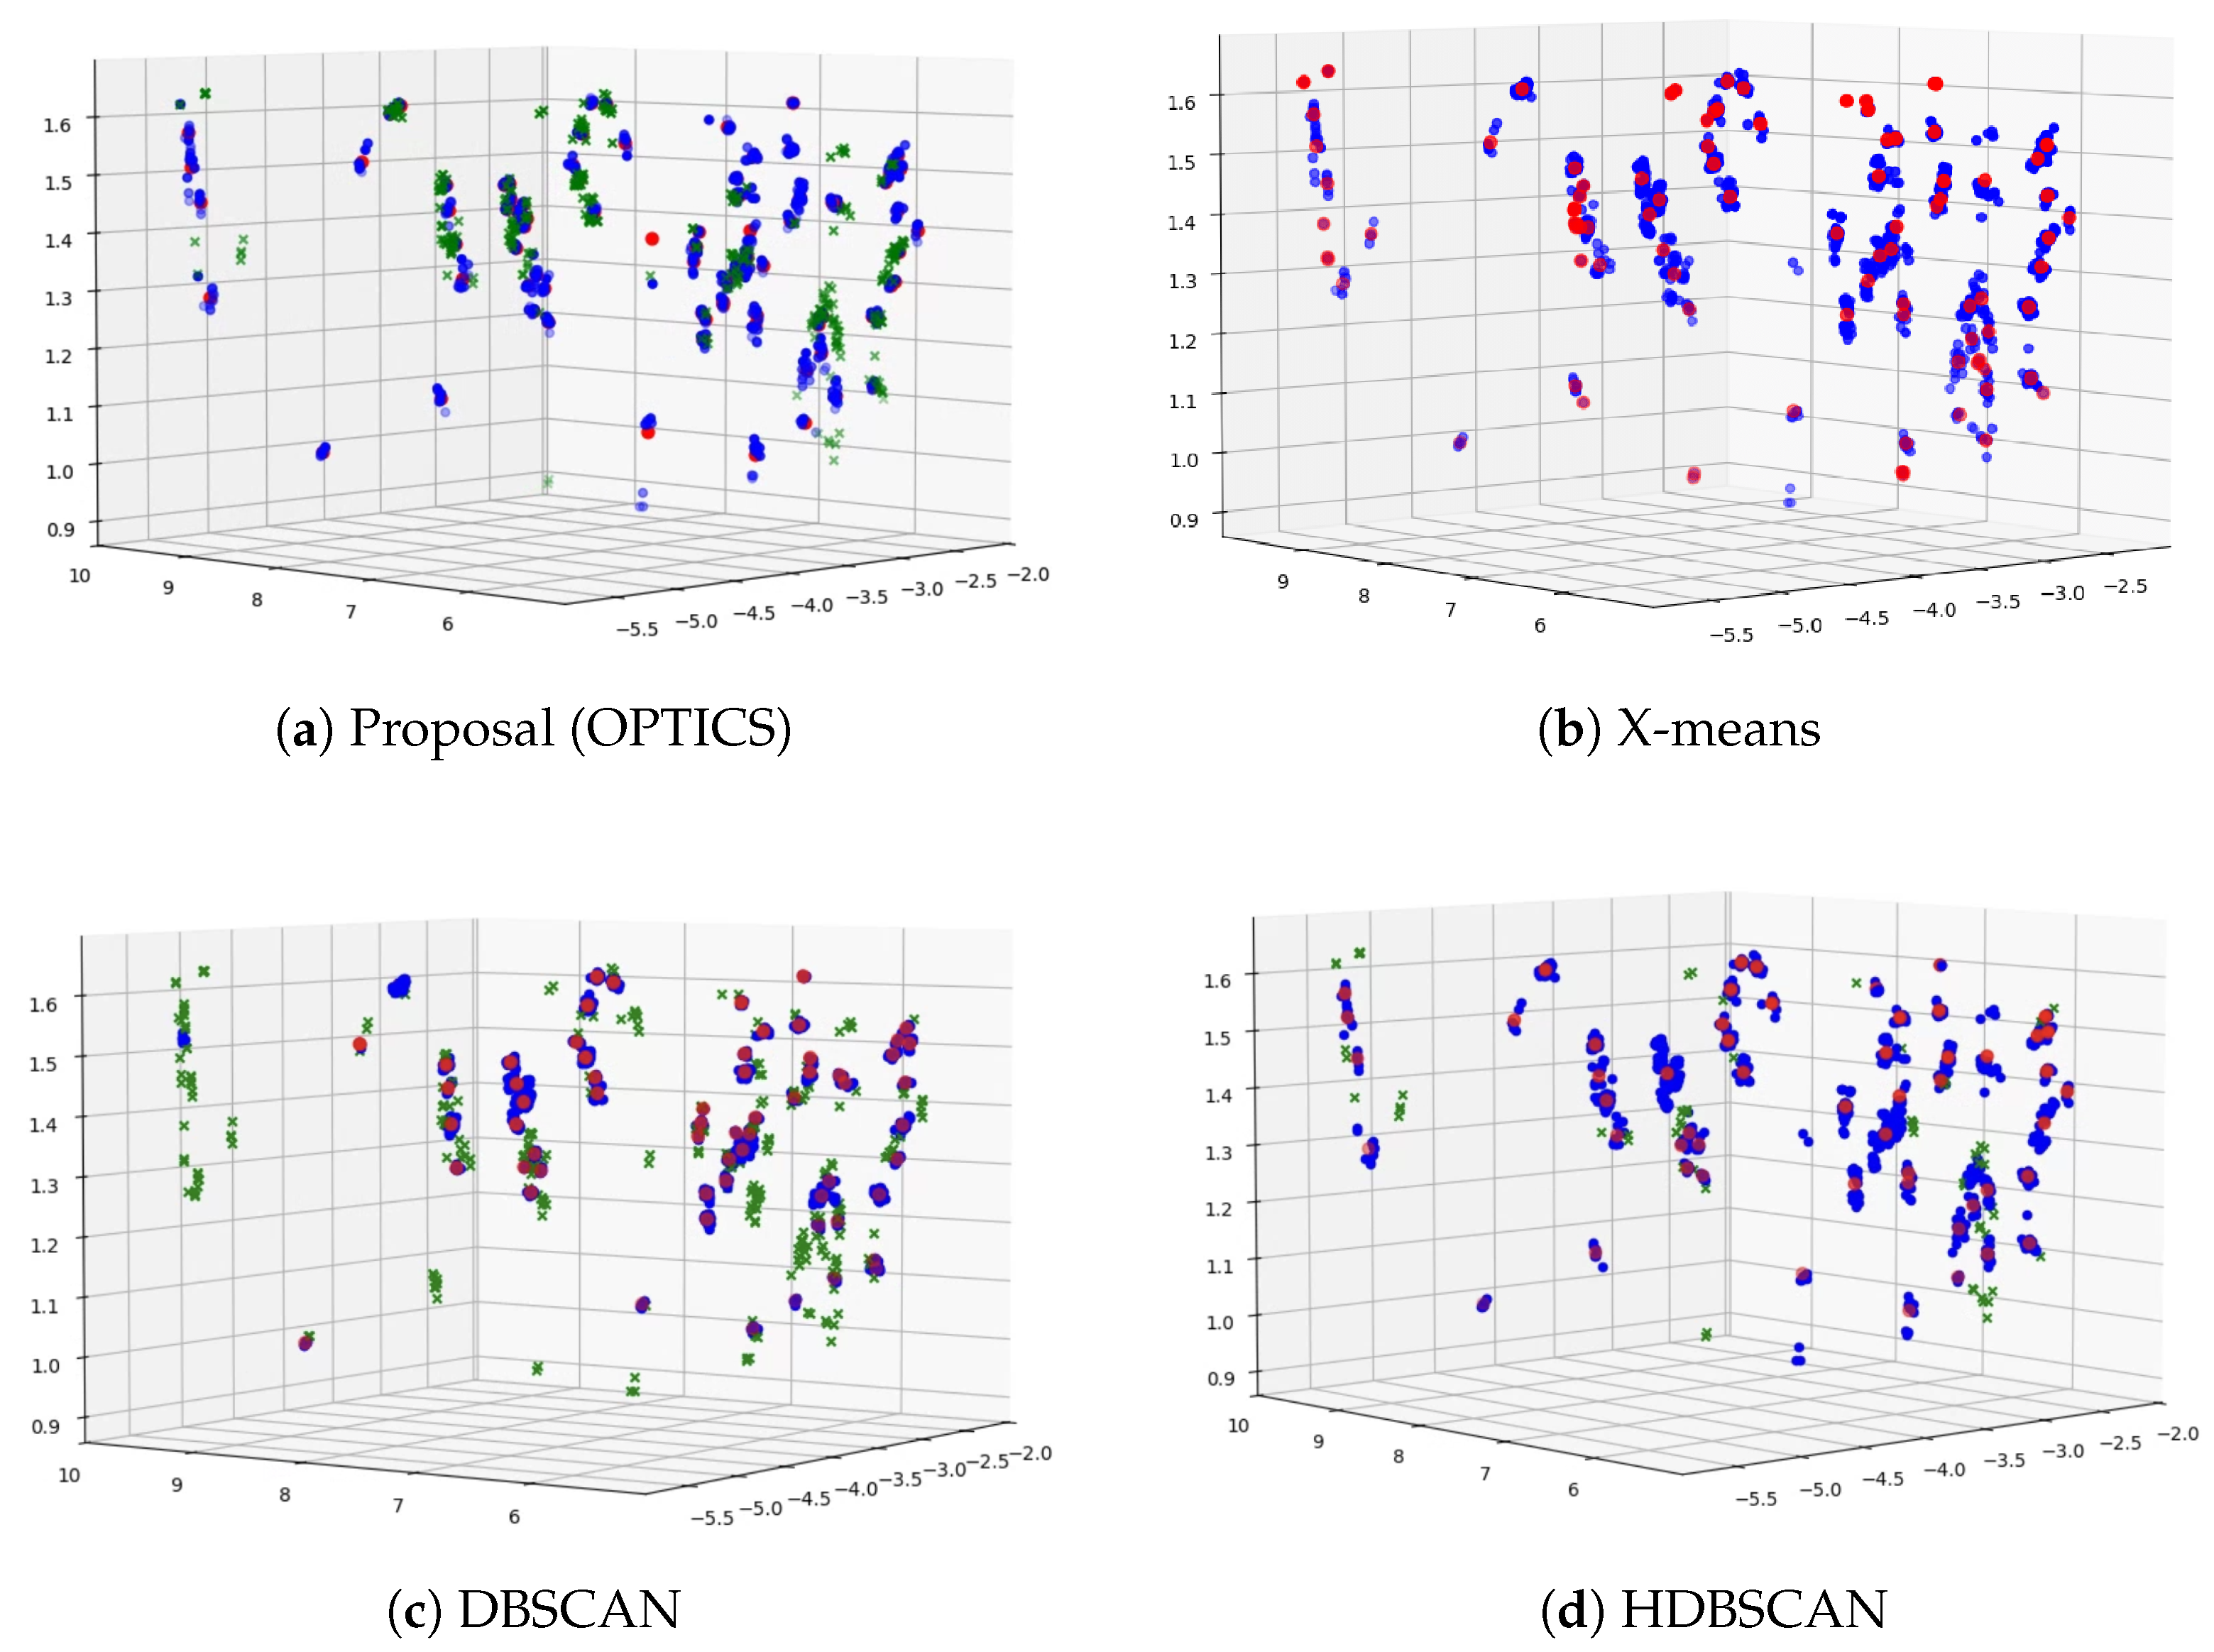
4.2.3. Clustering Performance

In the proposed method, the parameters for the OPTICS algorithm were configured as follows: the maximum neighborhood radius ε is set to a sufficiently large value and the minimum number of samples is set to MinPts = 5 .
We begin by evaluating the effect of the parameter ξ in the OPTICS clustering algorithm. Table 5 summarizes the numbers of the detected clusters and the noise points for the various ξ values. The results show that as ξ increases, the number of clusters decreases, whereas the proportion of the points that are identified as noise increases accordingly. When ξ is set high, the flower locations that should be treated accordingly are mistakenly classified as noise and are excluded from the planned flight path. Conversely, if ξ is set to be too low, the flowers may be grouped erroneously into separate clusters, leading to excessive numbers of spray targets. These findings indicate that the clustering outcome is strongly sensitive to the value of ξ , and a careful balance must thus be struck between cluster separation and noise reduction. From our experimental results, we found that setting ξ within the range from 0.05 to 0.1 provides the most reasonable trade-off between accuracy and efficiency. Therefore, we used ξ = 0.082 for the subsequent analyses.
Figure 20 shows the reachability plot obtained from the OPTICS algorithm. There are multiple well-defined valleys, each corresponding to a dense cluster of data points. The clear separation between valleys, indicated by high peaks, suggests that the clusters were well-separated. Additionally, noise points shown as black dots are scattered mainly around high-reachability regions, which indicates the successful identification of outliers. The varying depths of the valleys reflect the presence of clusters with differing densities, which demonstrates OPTICS’s robustness in capturing complex, multi-scale cluster structures.
To enable a performance comparison, the results of X-means [47], DBSCAN [48], and HDBSCAN [49] are also presented.
  • X-means: X-means is an extension of the K-means clustering algorithm that automatically determines the optimal number of clusters by iteratively splitting existing clusters based on a statistical criterion, such as the Bayesian information criterion.
  • DBSCAN: DBSCAN is a density-based clustering algorithm that groups points that are closely packed while marking points in low-density regions as outliers. It requires two parameters: a neighborhood radius and minimum number of points to form a cluster.
  • HDBSCAN: HDBSCAN is an advanced density-based clustering algorithm that extends DBSCAN by building a hierarchy of clusters and extracting the most stable clusters. It can handle clusters of varying densities and is more robust to parameter selection.
Figure 21 presents the results of the clustering analysis, where the red points represent the cluster centroids, the blue points indicate the flower positions, and the green points correspond to noise. As illustrated in Figure 21a, the OPTICS algorithm effectively eliminated outlier points corresponding to false detection (i.e., non-pear flowers) and peripheral points located at the edges of each cluster. Furthermore, the number of clusters identified by OPTICS is consistent with the count obtained through manual annotation, which indicates that the clustering results are well-aligned with ground truth observations.
By contrast, as shown in Figure 21b, the X-means algorithm erroneously classified outliers as separate clusters, which led to over-segmentation and inaccurate clustering. Similarly, DBSCAN, shown in Figure 21c, failed to properly cluster the data; in particular, it misclassified a significant number of points near the coordinates ( 5.5 , 10 , 1.5 ) as noise, which were, in fact, part of a valid flower cluster.
Figure 21d shows the results obtained using HDBSCAN. Although HDBSCAN correctly identified distant outliers as noise, it failed to separate closely located flower clusters, often merging them into a single cluster. Consequently, the total number of clusters was smaller than that determined by visual inspection, which suggests under-segmentation.

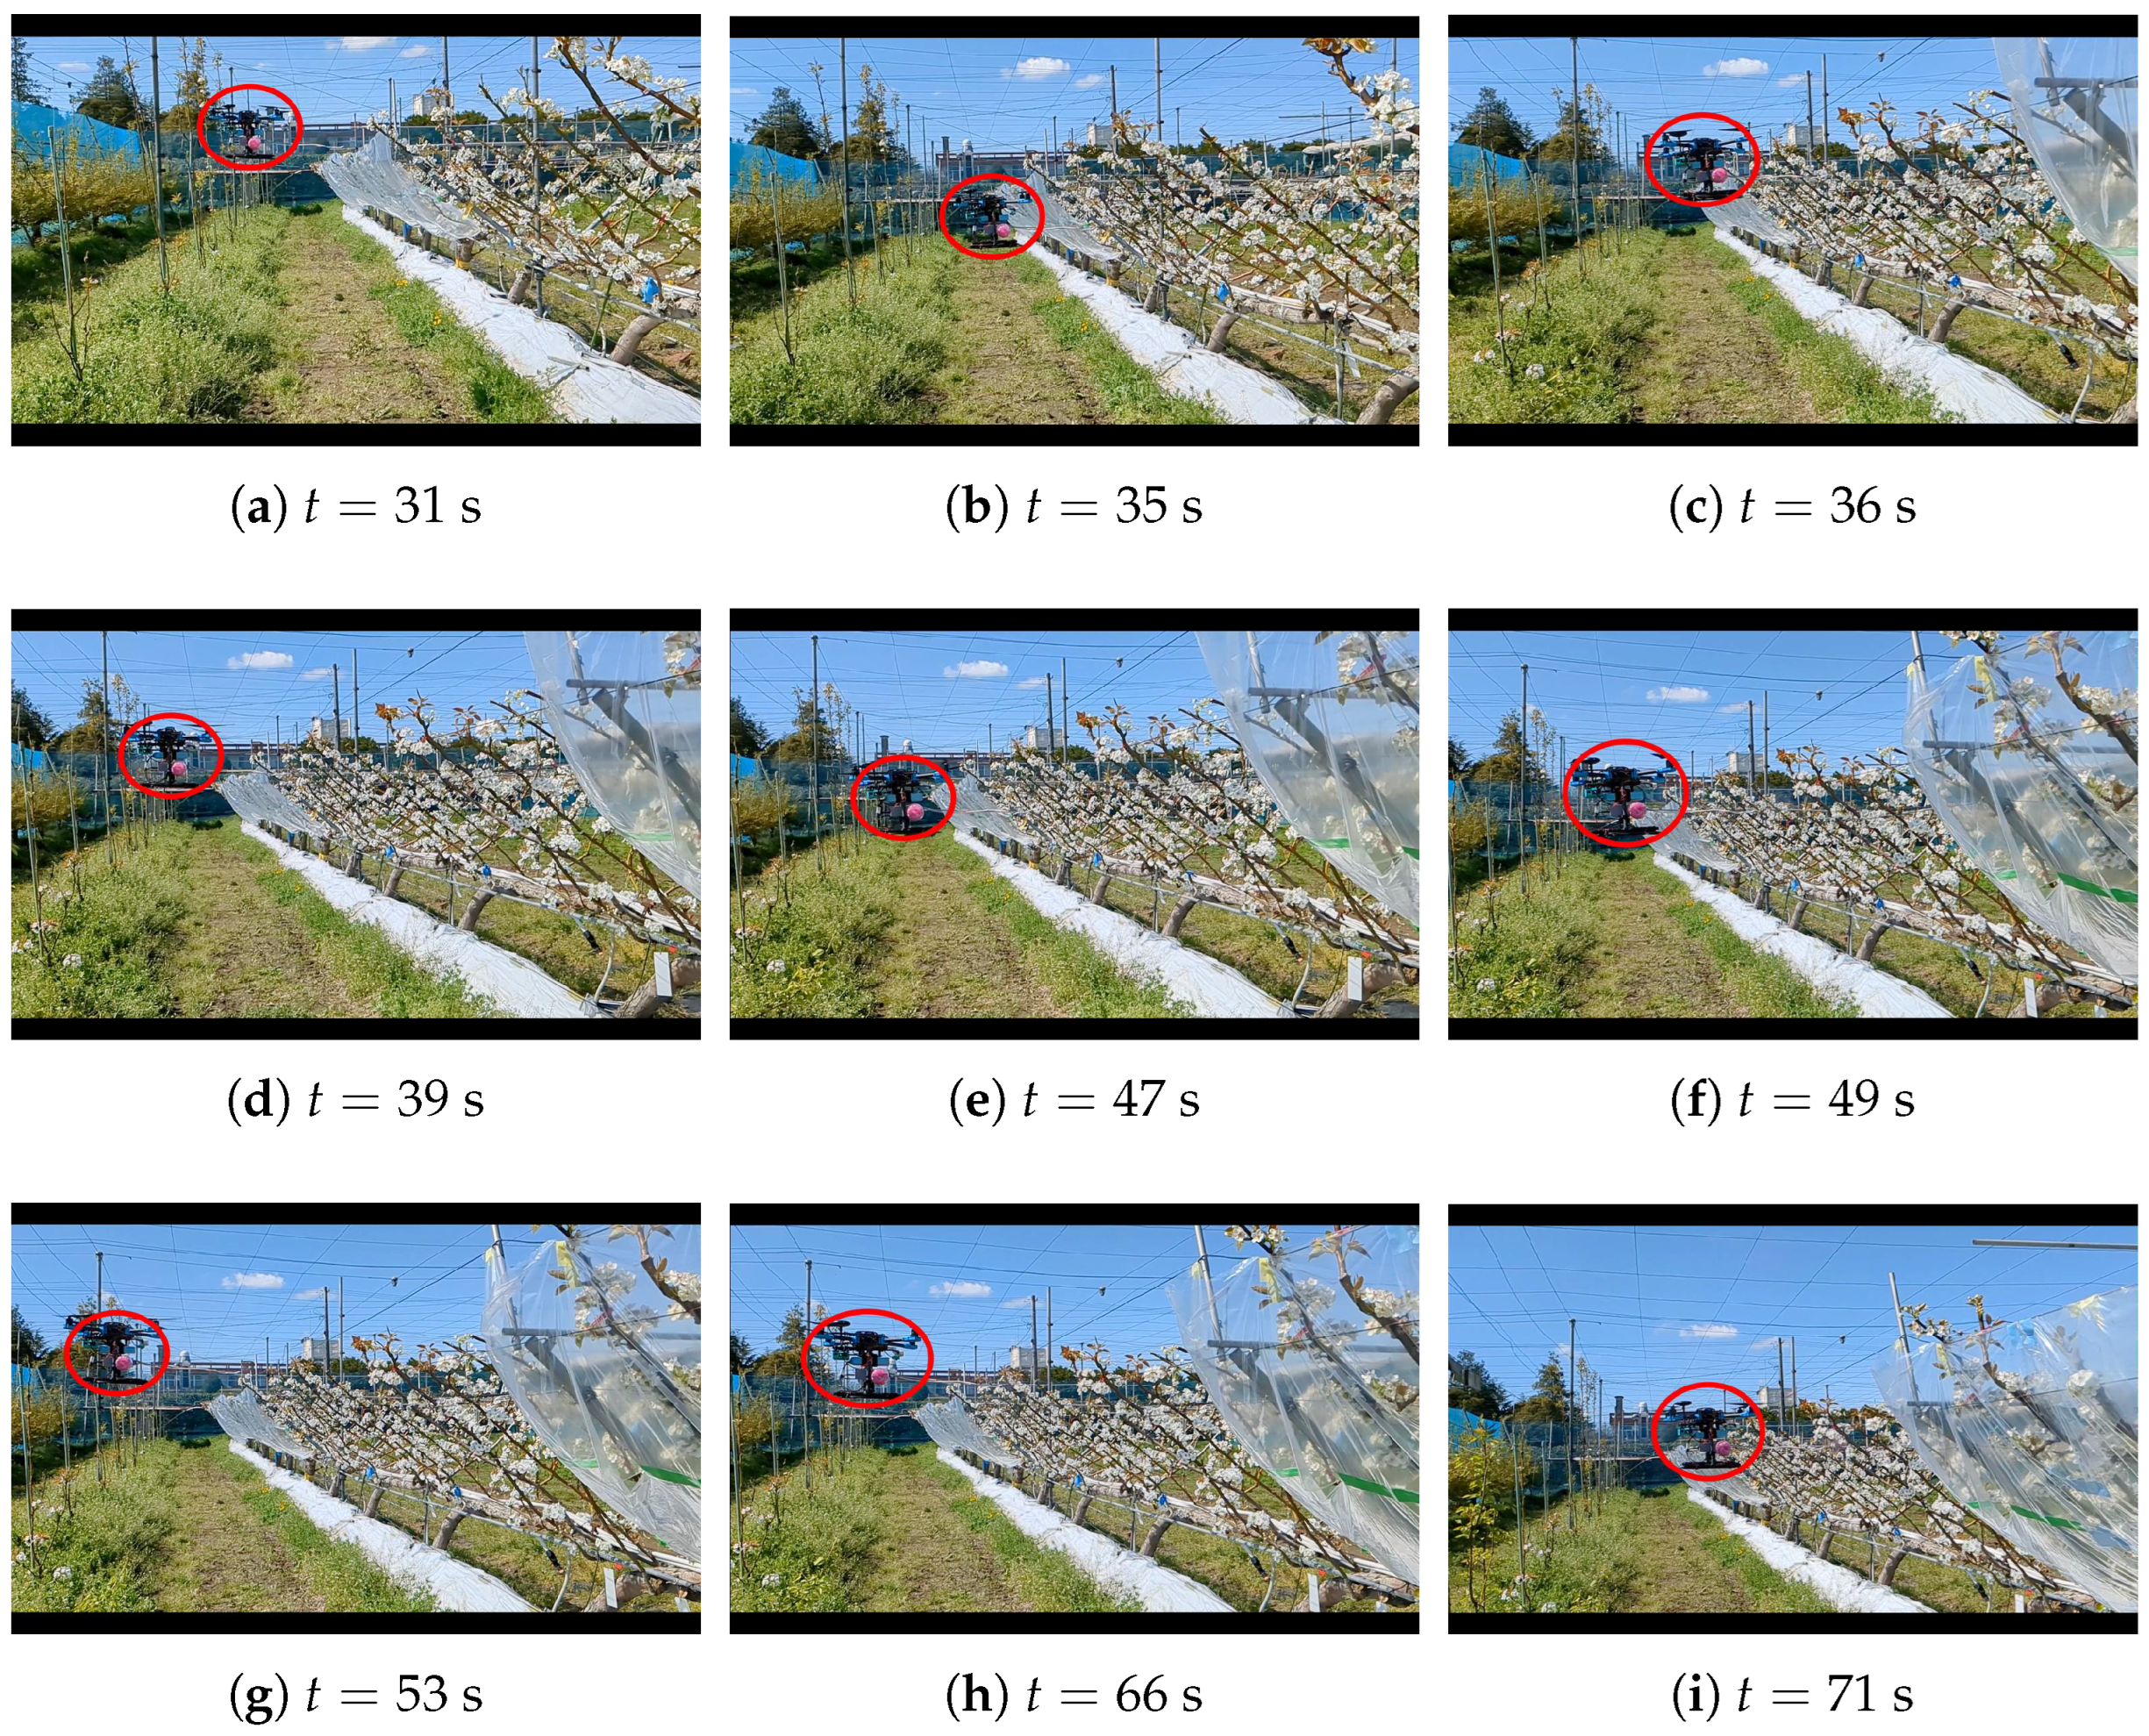
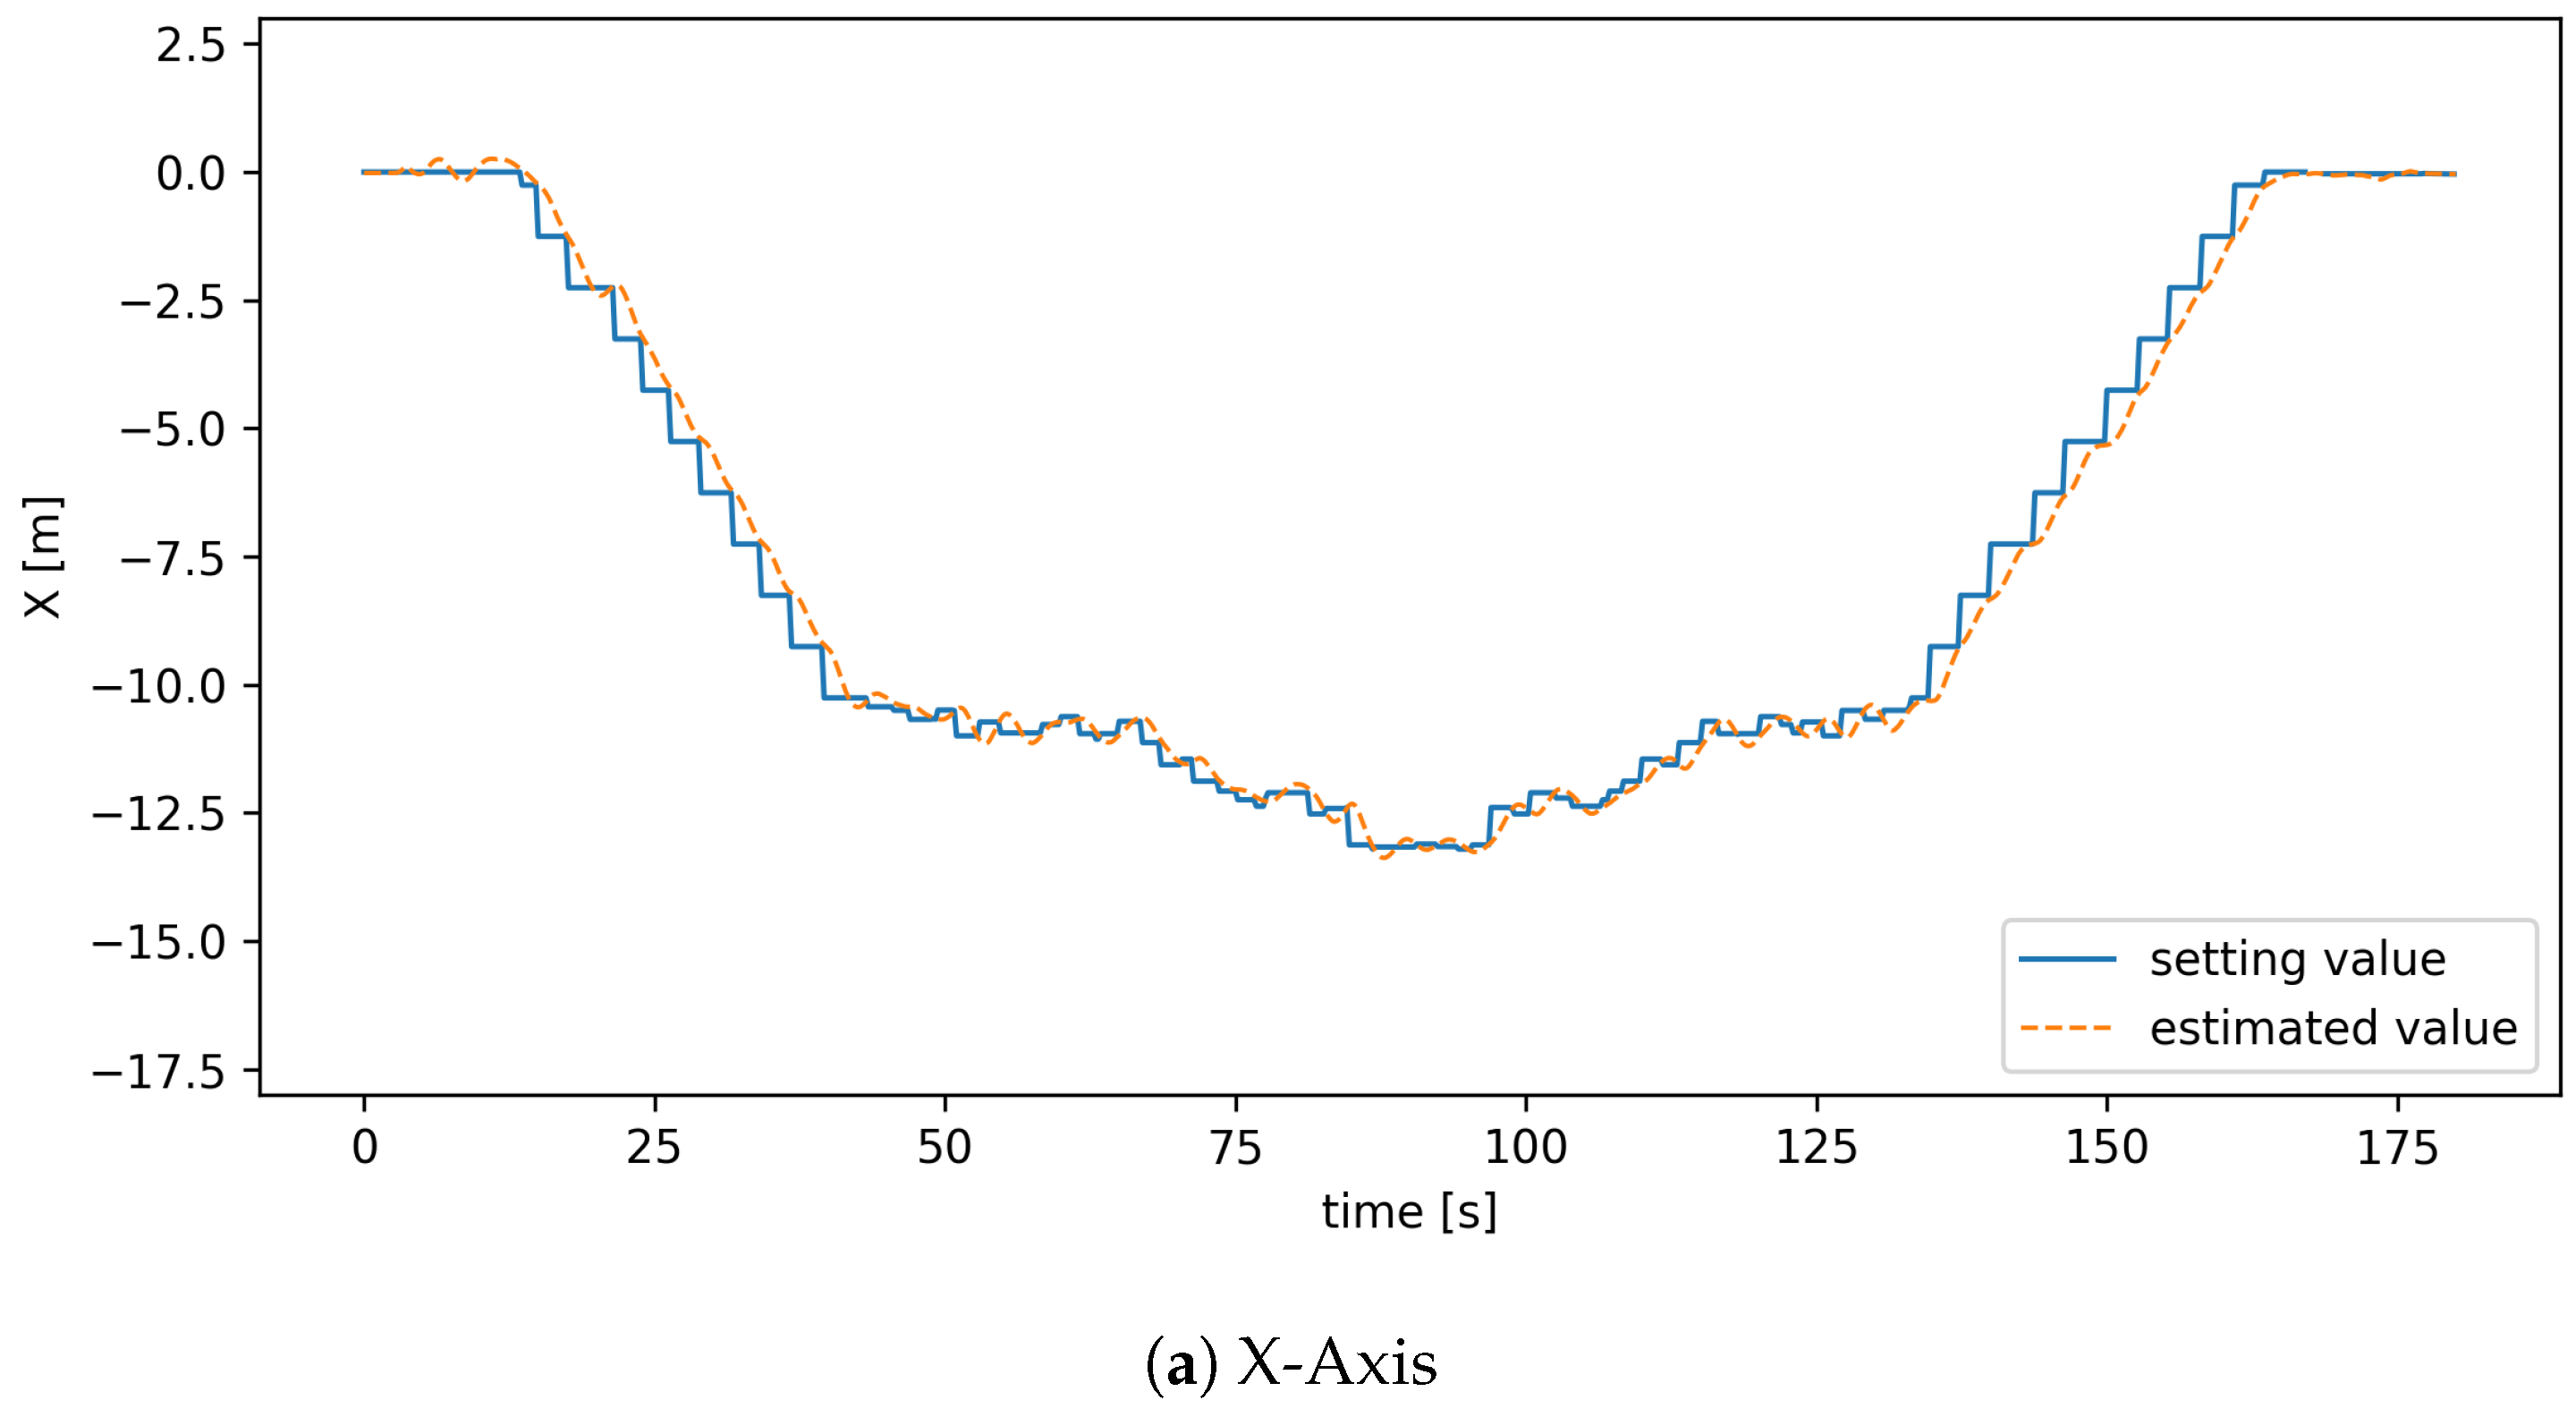
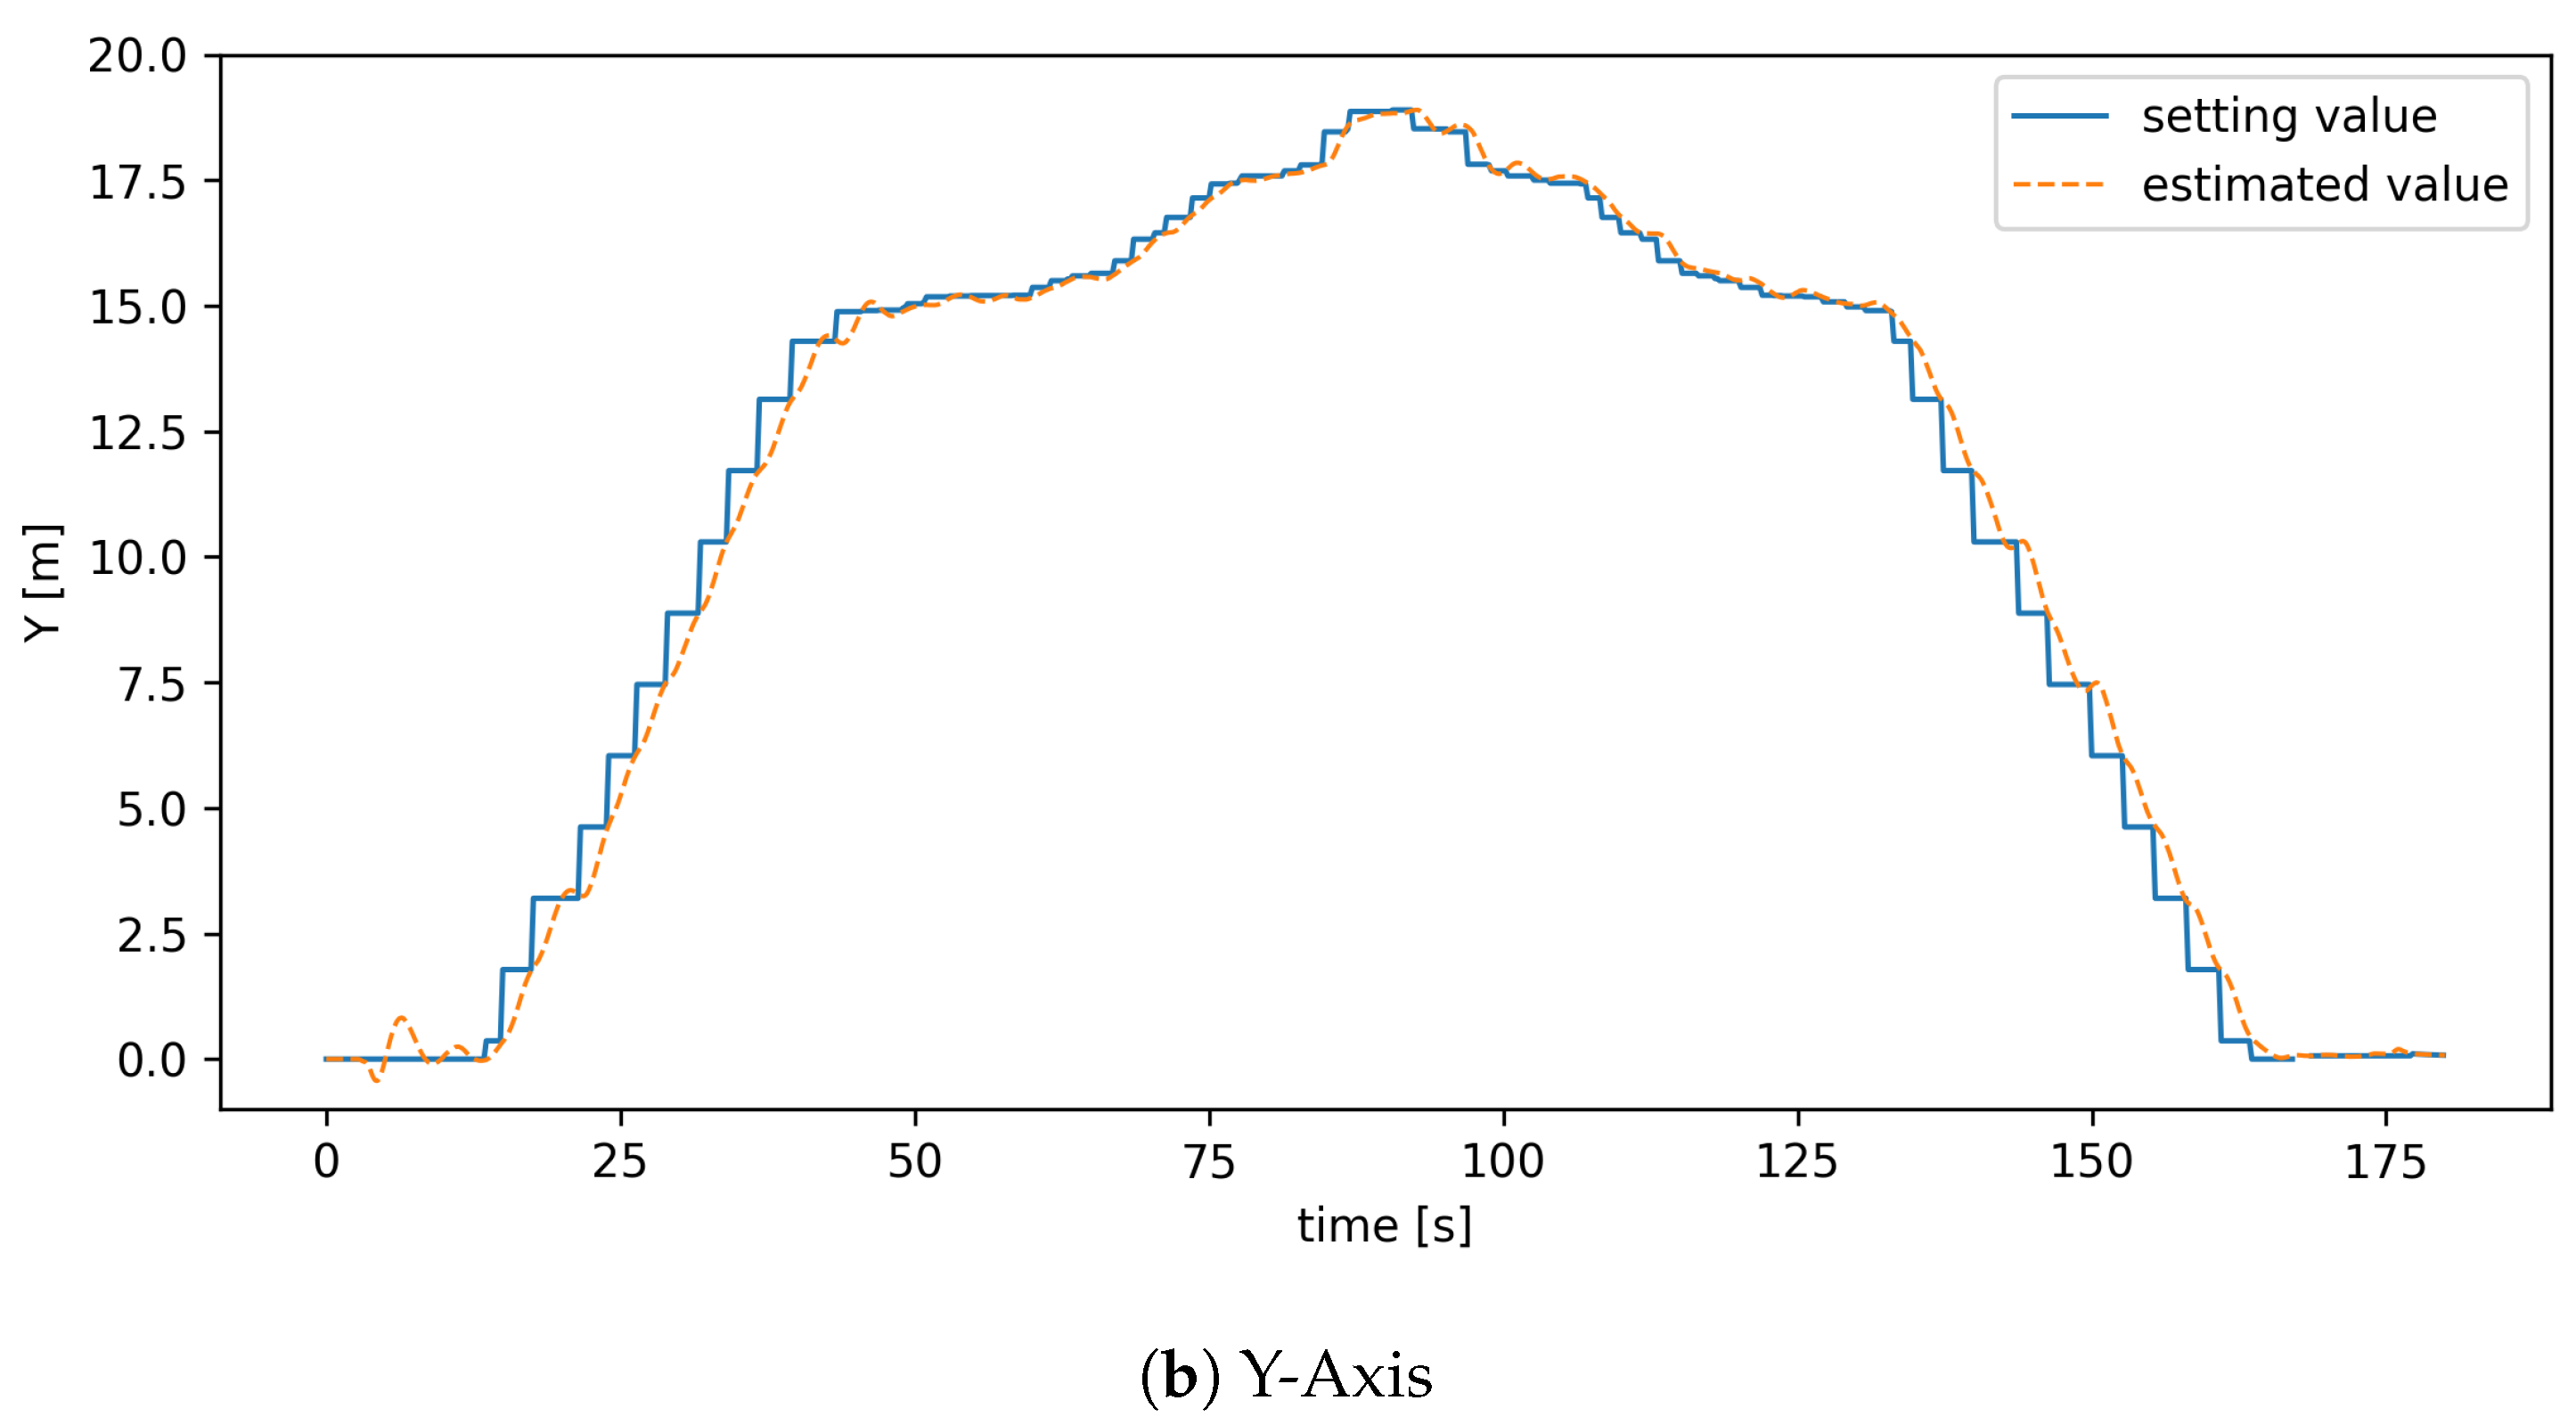
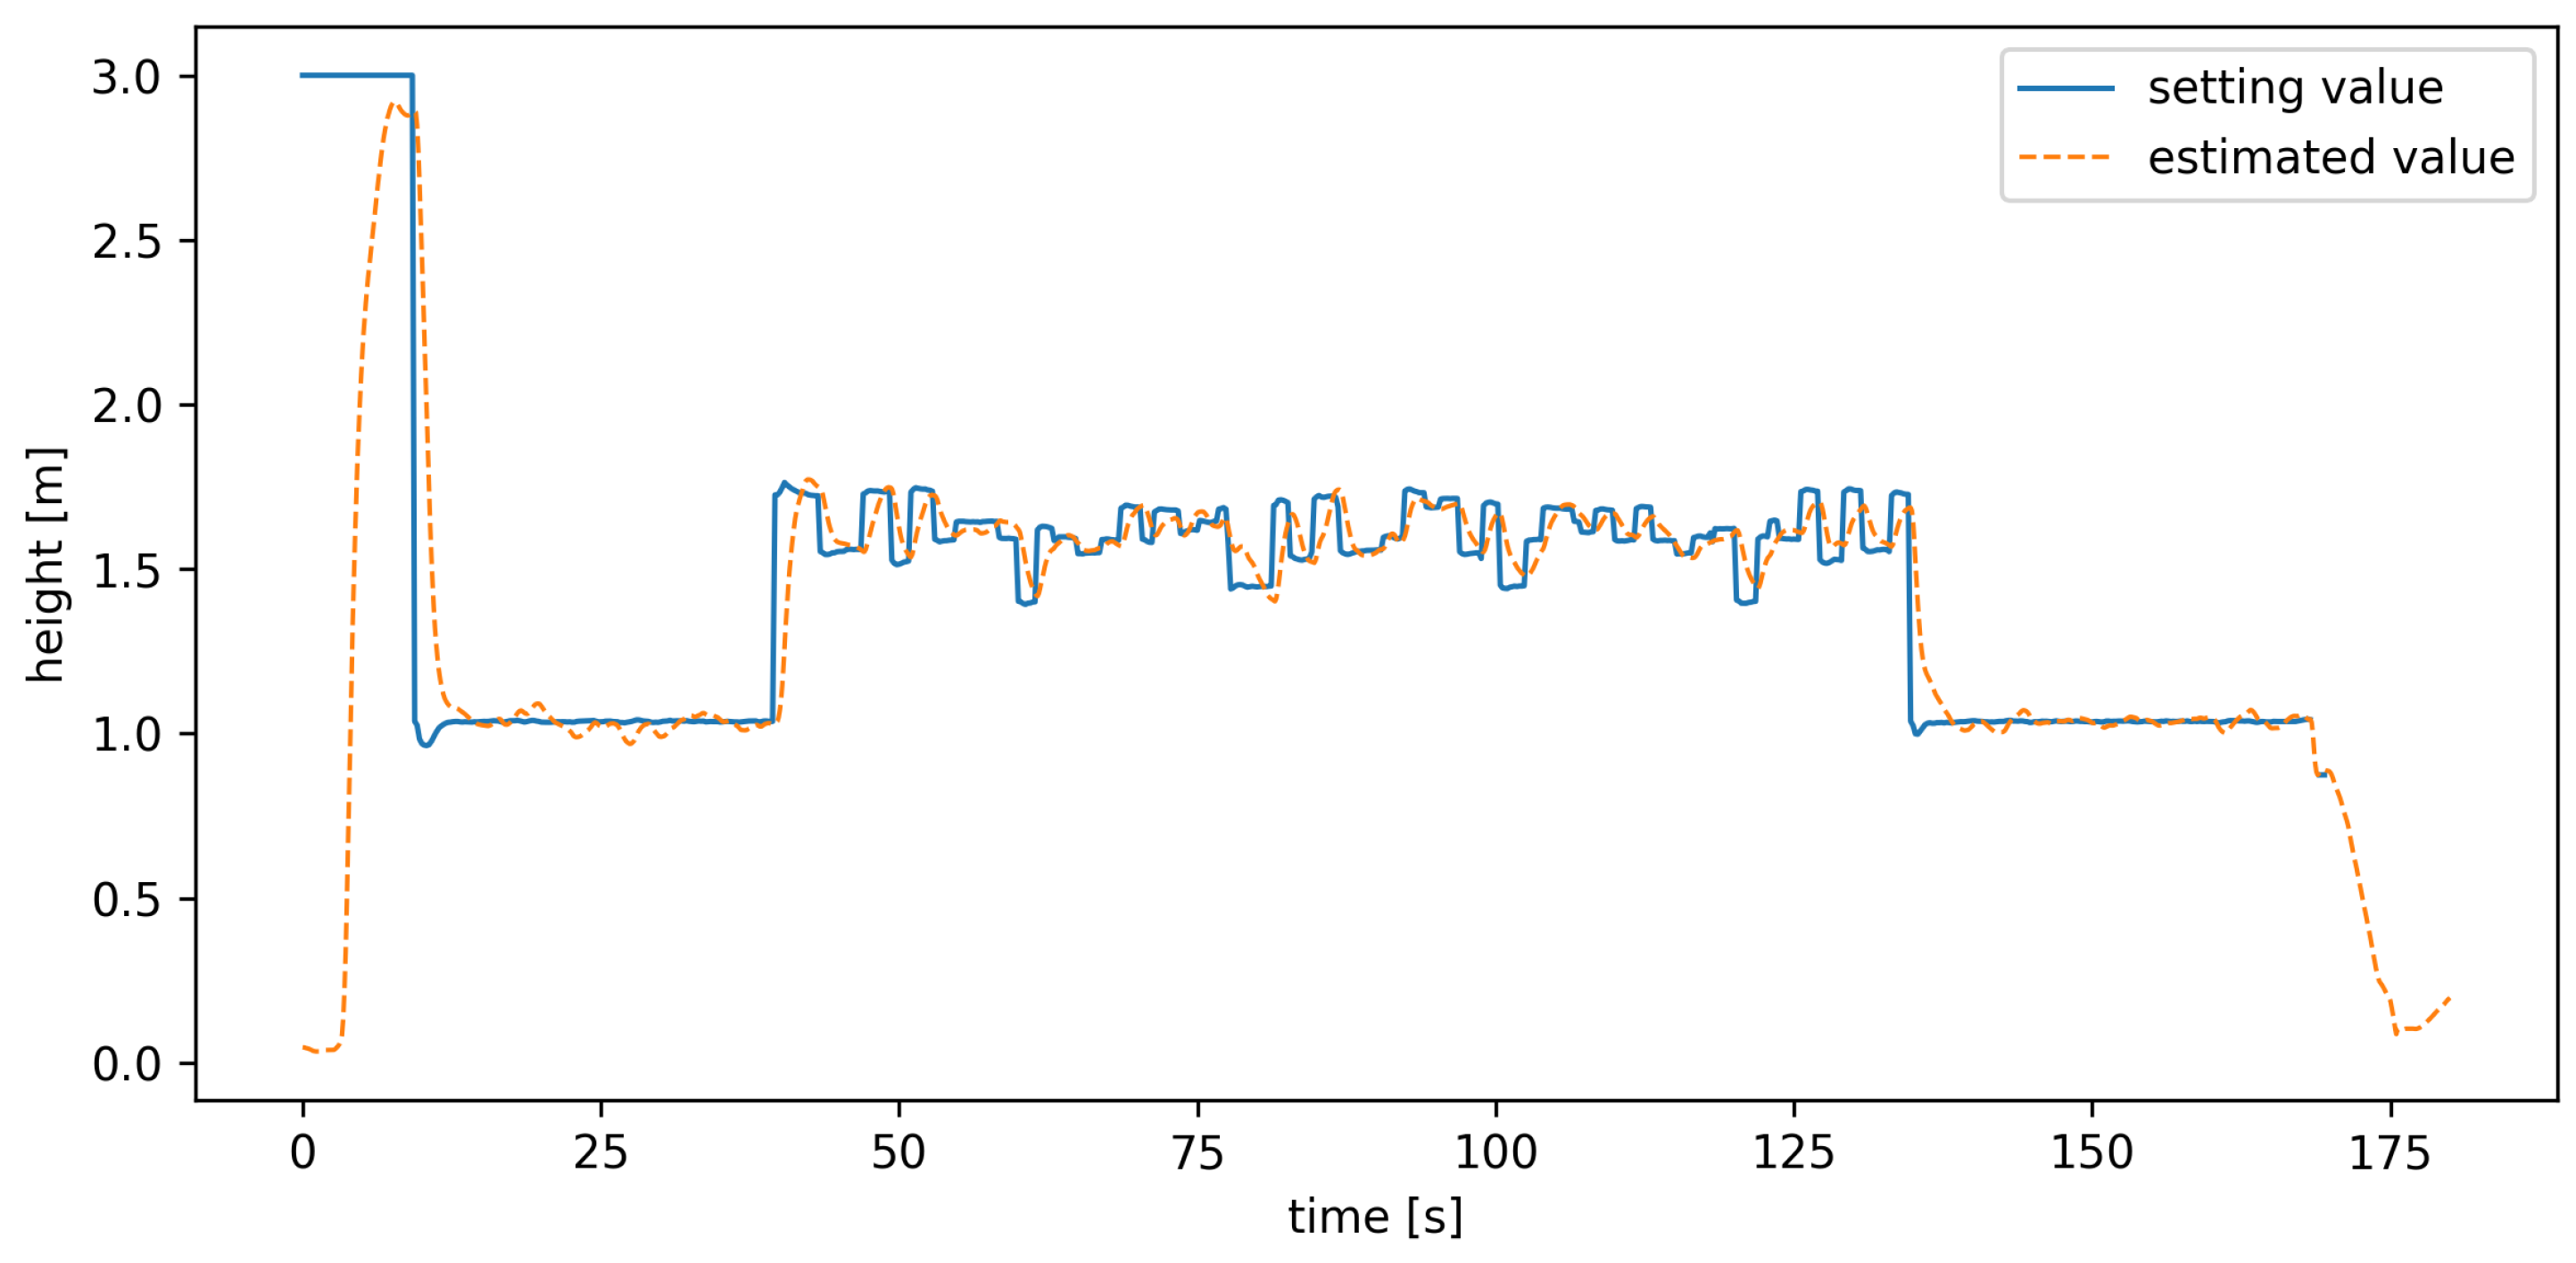
4.2.4. Flight Path Performance

Figure 22 shows the observed appearance of the pollination drone at elapsed time t after takeoff. The figure captures the drone in flight along the computed trajectory, which it generated using the centroids of the clusters obtained in Figure 21a. We visually confirmed that the drone stopped in front of each branch and hovered at locations where flowers were present, which indicates that the planned path aligned well with the actual spatial distribution of the flowers.
Figure 23 shows the flight log data along the X and Y axes, as recorded by sensors mounted on the pollination drone. The blue lines represent the predefined waypoints generated by the proposed method, whereas the orange lines indicate the estimated flight trajectories based on the drone’s onboard sensors during operation. From Figure 23, it can be observed that there was no significant deviation between the planned trajectory and the estimated flight path. Although the setpoints were defined discretely, resulting in minor visual differences in the trajectory shape, the drone successfully passed through nearly all of the specified waypoints. This result stems from the use of a Real-Time Kinematic positioning system, which provides highly accurate localization. Therefore, the adoption of RTK enables the spraying drone to be precisely controlled within the X–Y plane.
Figure 24 shows the trajectory of the drone’s movement along the Z-axis during the experiment. The blue line represents the target altitude profile generated by the proposed method, while the orange line shows the estimated altitude based on the drone’s onboard sensors during the drone’s flight. The segment up to approximately 35 s corresponds to the drone’s transition from the takeoff point to the orchard area. Due to the specifications of the drone, it first ascends to an altitude of approximately 3 m. It then descends to around 1 m to pass through the entrance gate of the orchard. From 35 to 135 s, the drone follows the flight path generated by our proposed method. As shown by the orange line, the drone generally tracks the planned altitude profile, indicating that the system successfully guided the drone along the intended vertical trajectory. Additionally, the planned path exhibits altitude variations reflecting the vertical distribution of flower clusters, confirming that the path was adapted to the spatial arrangement of the targets. After 135 s, the drone begins its landing sequence. Since it must pass through the gate once again, the altitude is reduced accordingly before landing at the original takeoff point.

4.2.5. Fruit Set Rate

Finally, the fruit set rates obtained in our 2025 field experiments using the proposed drone-based pollination system are presented.
In the experiments, the pollination drone did not treat all flower positions as observed by the observation drone. Rather, approximately half of the branches were assigned to drone-based pollination, with the remaining half being designated as a control group for comparison. Consequently, pollination was only performed within a subset of the cluster centroids identified in Section 4.2.3. Specifically, the drone flight path was constructed using the centroids of 37 selected clusters. During the operation, the pollination drone hovered before each target cluster and sprayed pollen. A total of 457.5 g of pollen was used to perform the drone-based pollination. The average quantity of pollen consumed per branch was approximately 12.4 g (≈457.5/37); this was determined by measuring the weight of the pollen container before and after completion of the spraying operation. The pollen for use in these trials was collected in advance from several other pear trees located within the Kuki experimental field. The wind conditions during drone pollination were classified as a light breeze, with an average wind speed of 2.0 m/s and reaching a maximum wind speed of 2.5 m/s.
For performance comparison, we also include results from manual pollination, in which a human operator used a handheld tool (similar to a cotton swab) to pollinate each flower individually, and from natural pollination, which was conducted without any artificial control or intervention entirely, and thus, reflected purely natural conditions.
Table 6 shows that the fruit set rate achieved by drone pollination exceeded that of natural pollination and slightly outperformed manual pollination. This suggests that our drone-based system was able to navigate to appropriate positions and effectively achieve a high fruit set rate. However, when examining the good fruit rate, the drone-based method, although higher than natural pollination, falls significantly short of manual pollination. Specifically, manual pollination achieved a good fruit rate of 22.5%, whereas drone pollination achieved only 13.8%. This discrepancy is likely due to the difference in pollination granularity: while manual pollination targets each flower individually, the drone system pollinates clusters of flowers. To improve a good fruit rate, it is necessary to develop drone systems capable of more precise pollination at the individual flower level. This remains an important direction for future work.

5. Discussion

The proposed drone-based pollination system in this work integrates RGB-D image processing, clustering-based flight path construction, and an RTK-GNSS-based control system to automate pollination in pear orchards. The overall system realized accurate detection of blooming flowers and generated efficient flight paths, thus demonstrating its potential for real-world agricultural applications. The blossom detection component reached a high F1 score of 0.880, which indicated that the YOLO-based model effectively identifies flowers that are suitable for pollination. This level of accuracy is comparable with those reported in previous studies of vision-based flower detection using machine learning [24,25,26]. However, recent advances in deep learning, including those in transformer-based architectures, have demonstrated improved detection capabilities in a variety of complex agricultural environments. Incorporation of these advanced models into our system could enhance the detection accuracy further, particularly under conditions involving occlusions, uneven lighting conditions, or dense flower clusters.
One notable contribution made by this study involves the use of the OPTICS clustering algorithm, which enabled robust grouping of the flower positions based on spatial proximity. In pear orchards, the flowers tend to appear in localized clusters along the branches, with a combination of natural gaps and non-uniform densities. The OPTICS method was particularly effective in adapting to this structure and then distinguishing flower clusters from the noise. Through comparison with the X-means, DBSCAN, and HDBSCAN methods, the OPTICS-based method yielded more accurate and more efficient pollination paths via identifying cluster centers appropriately. However, the performance of the OPTICS technique depends on important parameter settings, including the choice of ξ . Future research should, therefore, investigate automated or adaptive parameter selection strategies to reduce manual tuning and improve consistency.
Previous drone path planning studies for use in agricultural tasks have often assumed use of open-field conditions that allow for relatively unconstrained aerial movement [31,33]. Many such works have primarily focused on simulation environments or have assumed sparsely distributed targets within flat terrains. In contrast, the clustered arrangements of the flowers along narrow tree branches in orchard environments impose unique drone navigation constraints. The cluster-based path planning approach proposed in this study is suited to such structured environments because it minimizes unnecessary flight maneuvers while also ensuring targeted pollination at meaningful spatial resolutions. By aligning the path planning strategy along with the physical distribution of the flowers, the proposed method is effective in real-world orchard settings.
Despite the positive results in observed in the overall fruit set rate, as shown in Table 6, the proportion of the high-quality fruits obtained when using the drone-based system was lower than that when achieved by manual pollination alone. This discrepancy can likely be attributed to the coarse spraying mechanism, which targets the flower clusters as single units. In contrast, human pollinators can address the individual flowers selectively. Enhancement of the nozzle design and refining the spray control mechanisms will be essential in improving the selectivity and the effectiveness of drone-mediated pollination.
The current experiments were conducted under favorable weather conditions. Unfortunately, the system’s robustness against environmental variations, including wind, lighting changes, and occlusion from leaves or branches, was not explicitly examined. Evaluating the system’s performance under such conditions will ultimately be essential for practical deployment. Planned future work will include performing additional field experiments under diverse environments to assess the system’s stability and adaptability.
Filtering mechanisms that have been used to exclude background flowers use on the reliance of distance-based heuristics. Although this approach has been effective to a degree, incorporation of more advanced filtering techniques that consider the orchard geometry, the tree structure, and the viewpoint could enhance detection precision further.
Another potential direction for improvement involves real-time path adjustment. Although the current system generates flight paths that have been based on predetected flower positions, the orchard environments may be dynamic. Adaptive clustering and online path re-planning approaches could allow the system to respond to either unexpected obstacles or to flower distribution changes during operation. This flexibility is particularly important for large-scale deployments in unstructured and heterogeneous orchard layouts.
Finally, although this study has focused on spatial detection and navigation, the physical behavior of the pollen spray is a critical factor in influencing pollination success. Parameters including spray particle dispersion, the directionality, and the adhesion to floral surfaces will require more detailed modeling and empirical validation. Future studies will also investigate the spray mechanics dynamics along with improved hardware to enhance the system’s precision and its pollination efficiency.

6. Conclusions

In this study, we proposed a method for constructing a safe and efficient flight path for drone-based pollination in orchard environments. The system uses an observation drone to detect blooming pear flowers using RGB and depth imagery and estimate their 3D coordinates. To improve operational efficiency, we applied the clustering algorithm OPTICS to group spatially proximate flowers. Then, we used the centroids of these clusters to define a structured flight path for the pollination drone and incorporated offset vectors to prevent collisions with surrounding branches. We validated the proposed method through field experiments using RTK-GNSS-based flight control. The experimental results confirmed that the observation drone detected flowers and estimated their spatial coordinates with sufficient accuracy. Moreover, we visually confirmed that the pollination drone successfully hovered at positions appropriate for pollen spraying, which indicates that the planned flight path aligned well with the actual locations of flower clusters. Furthermore, field trials revealed that the proposed system achieved a higher fruit set rate than natural pollination and a comparable rate to manual pollination, confirming the effectiveness of the constructed flight path and pollination mechanism. These findings demonstrate the feasibility of constructing a reliable flight path for autonomous pollination.

Author Contributions

Conceptualization: T.K. and T.H.; Data curation: A.K., S.O., R.Y., K.E. and C.S.; Formal analysis: H.S. and T.K.; Methodology: A.K., T.K., S.O., K.E. and T.H.; Investigation: A.K. and T.K.; Validation: T.K.; Visualization: A.K., S.O. and R.Y.; Writing—original draft: A.K., S.O. and T.K.; Funding acquisition: Y.T. and T.H.; Supervision: T.S., Y.T. and T.H. All authors have read and agreed to the published version of the manuscript.

Funding

This research was supported by the “Development and Improvement Program of Strategic Smart Agricultural Technology” (JPJ011397) and the “Development and Supply Program of Smart Agricultural Technology” (JPJ013136), both funded by the Project of the Bio-oriented Technology Research Advancement Institution (BRAIN).

Data Availability Statement

Data are available from the authors upon request.

Acknowledgments

The authors thank Shimon Ajisaka for their technical assistance with research and development.

Conflicts of Interest

The authors declare no conflicts of interest.

References

  1. Potts, S.G.; Biesmeijer, J.C.; Kremen, C.; Neumann, P.; Schweiger, O.; Kunin, W.E. Global pollinator declines: Trends, impacts and drivers. Trends Ecol. Evol. 2010, 25, 345–353. [Google Scholar] [CrossRef] [PubMed]
  2. Chaffer, L. Pollinators, bees and food. Geogr. Bull. 2020, 52, 68–69. [Google Scholar]
  3. Martén-Rodríguez, S.; Cristobal-Pérez, E.J.; de Santiago-Hernández, M.H.; Huerta-Ramos, G.; Clemente-Martínez, L.; Krupnick, G.; Taylor, O.; Lopezaraiza-Mikel, M.; Balvino-Olvera, F.J.; Sentíes-Aguilar, E.M.; et al. Untangling the complexity of climate change effects on plant reproductive traits and pollinators: A systematic global synthesis. Glob. Change Biol. 2025, 31, e70081. [Google Scholar] [CrossRef]
  4. Kerr, J.T.; Pindar, A.; Galpern, P.; Packer, L.; Potts, S.G.; Roberts, S.M.; Rasmont, P.; Schweiger, O.; Colla, S.R.; Richardson, L.L.; et al. Climate change impacts on bumblebees converge across continents. Science 2015, 349, 177–180. [Google Scholar] [CrossRef]
  5. Broussard, M.A.; Coates, M.; Martinsen, P. Artificial pollination technologies: A review. Agronomy 2023, 13, 1351. [Google Scholar] [CrossRef]
  6. Quinet, M.; Jacquemart, A.L. Troubles in pear pollination: Effects of collection and storage method on pollen viability and fruit production. Acta Oecol. 2020, 105, 103558. [Google Scholar] [CrossRef]
  7. Wurz, A.; Grass, I.; Tscharntke, T. Hand pollination of global crops–A systematic review. Basic Appl. Ecol. 2021, 56, 299–321. [Google Scholar] [CrossRef]
  8. Olson, D.; Anderson, J. Review on unmanned aerial vehicles, remote sensors, imagery processing, and their applications in agriculture. Agron. J. 2021, 113, 971–992. [Google Scholar] [CrossRef]
  9. Ayamga, M.; Akaba, S.; Nyaaba, A.A. Multifaceted applicability of drones: A review. Technol. Forecast. Soc. Chang. 2021, 167, 120677. [Google Scholar] [CrossRef]
  10. Rejeb, A.; Rejeb, K.; Simske, S.J.; Treiblmaier, H. Drones for supply chain management and logistics: A review and research agenda. Int. J. Logist. Res. Appl. 2023, 26, 708–731. [Google Scholar] [CrossRef]
  11. Goodchild, A.; Toy, J. Delivery by drone: An evaluation of unmanned aerial vehicle technology in reducing CO2 emissions in the delivery service industry. Transp. Res. Part D Transp. Environ. 2018, 61, 58–67. [Google Scholar] [CrossRef]
  12. Rakha, T.; Gorodetsky, A. Review of Unmanned Aerial System (UAS) applications in the built environment: Towards automated building inspection procedures using drones. Autom. Constr. 2018, 93, 252–264. [Google Scholar] [CrossRef]
  13. Rymer, N.; Moore, A.J. A Review of Unmanned Aerial Vehicle Technology in Power Line Inspection. In Proceedings of the AIAA Scitech 2021, Virtual, 11–15 January 2021. [Google Scholar]
  14. Erdelj, M.; Król, M.; Natalizio, E. Wireless sensor networks and multi-UAV systems for natural disaster management. Comput. Netw. 2017, 124, 72–86. [Google Scholar] [CrossRef]
  15. Yucesoy, E.; Balcik, B.; Coban, E. The role of drones in disaster response: A literature review of operations research applications. Int. Trans. Oper. Res. 2025, 32, 545–589. [Google Scholar] [CrossRef]
  16. Koh, L.P.; Wich, S.A. Dawn of drone ecology: Low-cost autonomous aerial vehicles for conservation. Trop. Conserv. Sci. 2012, 5, 121–132. [Google Scholar] [CrossRef]
  17. Anderson, K.; Gaston, K.J. Lightweight unmanned aerial vehicles will revolutionize spatial ecology. Front. Ecol. Environ. 2013, 11, 138–146. [Google Scholar] [CrossRef]
  18. Rejeb, A.; Abdollahi, A.; Rejeb, K.; Treiblmaier, H. Drones in agriculture: A review and bibliometric analysis. Comput. Electron. Agric. 2022, 198, 107017. [Google Scholar] [CrossRef]
  19. Marzuki, O.F.; Teo, E.Y.L.; Rafie, A.S.M. The mechanism of drone seeding technology: A review. Malays. For. 2021, 84, 349–358. [Google Scholar]
  20. Miyoshi, K.; Hiraguri, T.; Shimizu, H.; Hattori, K.; Kimura, T.; Okubo, S.; Endo, K.; Shimada, T.; Shibasaki, A.; Takemura, Y. Development of Pear Pollination System Using Autonomous Drones. AgriEngineering 2025, 7, 68. [Google Scholar] [CrossRef]
  21. Wojke, N.; Bewley, A.; Paulus, D. Simple online and realtime tracking with a deep association metric. In Proceedings of the 2017 IEEE International Conference on Image Processing (ICIP), Beijing, China, 17–20 September 2017; pp. 3645–3649. [Google Scholar]
  22. Radočaj, D.; Plaščak, I.; Jurišić, M. Global navigation satellite systems as state-of-the-art solutions in precision agriculture: A review of studies indexed in the web of science. Agriculture 2023, 13, 1417. [Google Scholar] [CrossRef]
  23. Okubo, S.; Tsunewaki, K.; Kimura, T.; Shimizu, H.; Hiraguri, T.; Shibasaki, A.; Shimada, T.; Takemura, Y. Pear Blossom Counting System with Drones Using YOLO and Deep SORT. In Proceedings of the 2024 International Conference on Image Processing and Robotics (ICIPRoB), Colombo, Sri Lanka, 9–10 March 2024; pp. 1–4. [Google Scholar]
  24. Lim, J.; Ahn, H.S.; Nejati, M.; Bell, J.; Williams, H.; MacDonald, B.A. Deep neural network based real-time kiwi fruit flower detection in an orchard environment. arXiv 2020, arXiv:2006.04343. [Google Scholar]
  25. Shang, Y.; Xu, X.; Jiao, Y.; Wang, Z.; Hua, Z.; Song, H. Using lightweight deep learning algorithm for real-time detection of apple flowers in natural environments. Comput. Electron. Agric. 2023, 207, 107765. [Google Scholar] [CrossRef]
  26. Mu, X.; He, L.; Heinemann, P.; Schupp, J.; Karkee, M. Mask R-CNN based apple flower detection and king flower identification for precision pollination. Smart Agric. Technol. 2023, 4, 100151. [Google Scholar] [CrossRef]
  27. Wang, C.; Liu, S.; Wang, Y.; Xiong, J.; Zhang, Z.; Zhao, B.; Luo, L.; Lin, G.; He, P. Application of convolutional neural network-based detection methods in fresh fruit production: A comprehensive review. Front. Plant Sci. 2022, 13, 868745. [Google Scholar] [CrossRef] [PubMed]
  28. Milicevic, M.; Zubrinic, K.; Grbavac, I.; Obradovic, I. Application of deep learning architectures for accurate detection of olive tree flowering phenophase. Remote Sens. 2020, 12, 2120. [Google Scholar] [CrossRef]
  29. Wu, S.; Liu, J.; Lei, X.; Zhao, S.; Lu, J.; Jiang, Y.; Xie, B.; Wang, M. Research progress on efficient pollination technology of crops. Agronomy 2022, 12, 2872. [Google Scholar] [CrossRef]
  30. Yang, L.; Li, P.; Qian, S.; Quan, H.; Miao, J.; Liu, M.; Hu, Y.; Memetimin, E. Path planning technique for mobile robots: A review. Machines 2023, 11, 980. [Google Scholar] [CrossRef]
  31. Manasherov, O.; Degani, A. Multi-agent target allocation and safe trajectory planning for artificial pollination tasks. Smart Agric. Technol. 2024, 8, 100461. [Google Scholar] [CrossRef]
  32. Zhang, Q.; Zhang, Z.; Manzoor, S.; Li, T.; Igathinathane, C.; Li, W.; Zhang, M.; Mhamed, M.; Javidan, S.; Abdelhamid, M. A comprehensive review of autonomous flower pollination techniques: Progress, challenges, and future directions. Comput. Electron. Agric. 2025, 237, 110577. [Google Scholar] [CrossRef]
  33. Rice, C.R.; McDonald, S.T.; Shi, Y.; Gan, H.; Lee, W.S.; Chen, Y.; Wang, Z. Perception, path planning, and flight control for a drone-enabled autonomous pollination system. Robotics 2022, 11, 144. [Google Scholar] [CrossRef]
  34. Hönig, W.; Preiss, J.A.; Kumar, T.S.; Sukhatme, G.S.; Ayanian, N. Trajectory planning for quadrotor swarms. IEEE Trans. Robot. 2018, 34, 856–869. [Google Scholar] [CrossRef]
  35. Liu, H.; Chen, Z.; Wang, Z.; Li, J. An effective precision afforestation system for UAV. Sustainability 2023, 15, 2212. [Google Scholar] [CrossRef]
  36. Brundavani, P.; Avanija, Y. Robot Path Planning and Tracking with the Flower Pollination SearchOptimization Algorithm. J. Comput. Allied Intell. 2024, 2, 70–81. [Google Scholar]
  37. Redmon, J.; Divvala, S.; Girshick, R.; Farhadi, A. You only look once: Unified, real-time object detection. In Proceedings of the IEEE Conference on Computer Vision and Pattern Recognition, Las Vegas, NV, USA, 27–30 June 2016; pp. 779–788. [Google Scholar]
  38. Redmon, J.; Farhadi, A. YOLO9000: Better, faster, stronger. In Proceedings of the IEEE Conference on Computer Vision and Pattern Recognition, Honolulu, HI, USA, 21–26 July 2017; pp. 7263–7271. [Google Scholar]
  39. Wang, C.Y.; Bochkovskiy, A.; Liao, H.Y.M. YOLOv7: Trainable bag-of-freebies sets new state-of-the-art for real-time object detectors. In Proceedings of the IEEE/CVF Conference on Computer Vision and Pattern Recognition, Vancouver, BC, Canada, 18–22 June 2023; pp. 7464–7475. [Google Scholar]
  40. Ankerst, M.; Breunig, M.M.; Kriegel, H.P.; Sander, J. OPTICS: Ordering points to identify the clustering structure. ACM Sigmod Rec. 1999, 28, 49–60. [Google Scholar] [CrossRef]
  41. Saitama Prefectural Agricultural Technology Research Center. 2025. Available online: https://www.pref.saitama.lg.jp/soshiki/b0909/ (accessed on 31 May 2025).
  42. Intel. Intel RealSense Depth Camera D435i Specifications. 2025. Available online: https://www.intel.co.jp/content/www/jp/ja/products/sku/190004/intel-realsense-depth-camera-d435i/specifications.html (accessed on 31 May 2025).
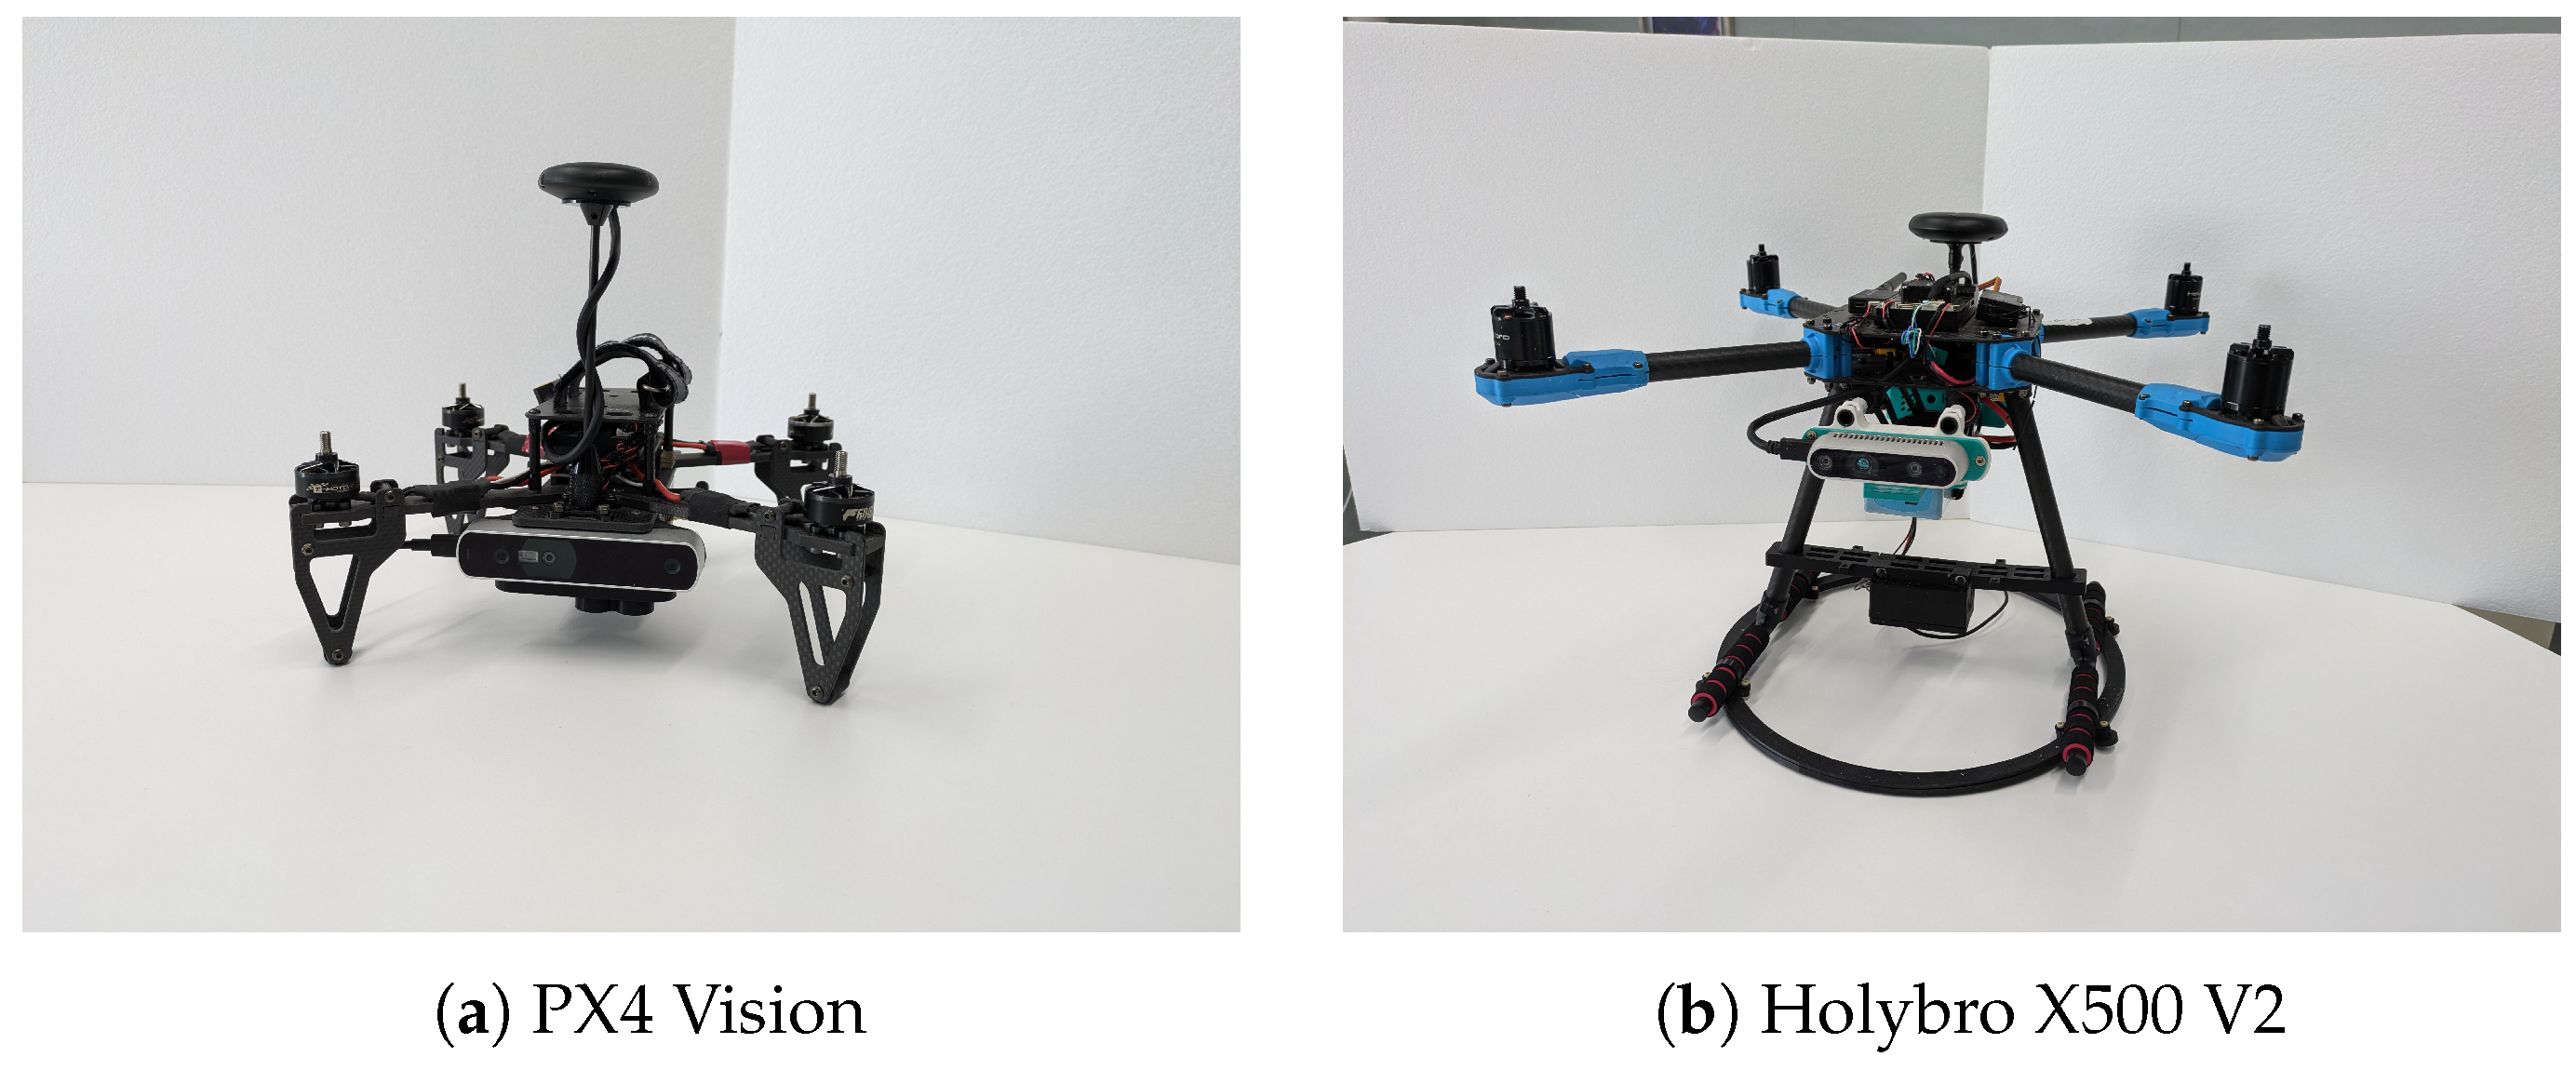
  43. Holybro. PX4 Vision Kits. 2025. Available online: https://holybro.com/collections/multicopter-kit/products/px4-vision-dev-kit-v1-5 (accessed on 27 May 2025).
  44. Holybro. X500 V2 Kits. 2025. Available online: https://holybro.com/collections/x500-kits (accessed on 27 May 2025).
  45. QGroundControl. QGroundControl. 2025. Available online: https://qgroundcontrol.com/ (accessed on 27 May 2025).
  46. Open Source Robotics Foundation. Robot Operating System (ROS) Melodic. 2025. Available online: https://wiki.ros.org/melodic (accessed on 27 May 2025).
  47. Pelleg, D.; Moore, A. X-means: Extending K-means with E cient Estimation of the Number of Clusters. In Proceedings of the ICML’00: Seventeenth International Conference on Machine Learning, Stanford, CA, USA, 29 June–2 July 2000; pp. 727–734. [Google Scholar]
  48. Ester, M.; Kriegel, H.P.; Sander, J.; Xu, X. A density-based algorithm for discovering clusters in large spatial databases with noise. In Proceedings of the KDD’96: Second International Conference on Knowledge Discovery and Data Mining, Portland, OR, USA, 2–4 August 1996; Volume 96, pp. 226–231. [Google Scholar]
  49. Campello, R.J.; Moulavi, D.; Zimek, A.; Sander, J. Hierarchical density estimates for data clustering, visualization, and outlier detection. ACM Trans. Knowl. Discov. Data (TKDD) 2015, 10, 1–51. [Google Scholar] [CrossRef]
Figure 1. Drone pollination system.
Drones 09 00475 g001
Figure 2. Cluster-based flight path construction.
Drones 09 00475 g002
Figure 3. Overview of the proposed method.
Drones 09 00475 g003
Figure 4. Sample images of RGB and depth cameras.
Drones 09 00475 g004
Figure 5. Procedure of the proposed method.
Drones 09 00475 g005
Figure 6. Object detection results using YOLO.
Drones 09 00475 g006
Figure 7. Buds and flowers.
Drones 09 00475 g007
Figure 8. Regularly scheduled flight path for the observation drone.
Drones 09 00475 g008
Figure 9. Flower coordinate estimation.
Drones 09 00475 g009
Figure 10. Opposite side detection.
Drones 09 00475 g010
Figure 11. Relationship between the flight path and the associated mathematical notations.
Drones 09 00475 g011
Figure 12. The drones used in the experiment.
Drones 09 00475 g012
Figure 13. Experimental system.
Drones 09 00475 g013
Figure 14. Detected flowers and buds.
Drones 09 00475 g014
Figure 15. RViz snapshots of flower detection at elapsed time t after takeoff.
Drones 09 00475 g015
Figure 16. Three-dimensional plot of the detected flower positions.
Drones 09 00475 g016
Figure 17. Measurement of estimated flower position using a tape measure.
Drones 09 00475 g017
Figure 18. Three-dimensional plot of flower positions after the removal of back-side points.
Drones 09 00475 g018
Figure 19. Accuracy and F1 score after removing back-side points.
Drones 09 00475 g019
Figure 20. Reachability plot.
Drones 09 00475 g020
Figure 21. Clustering results.
Drones 09 00475 g021
Figure 22. Observed appearance of the pollination drone at elapsed time t after takeoff.
Drones 09 00475 g022
Figure 23. Flight log on X and Y axes.
Drones 09 00475 g023aDrones 09 00475 g023b
Figure 24. Flight log on Z axis.
Drones 09 00475 g024
Table 1. List of recorded ROS topics.
Topic NameData Type N E
/camera/color/image_raw/compressedColor Image4468
/camera/aligned_depth_to_color/image_rawDepth Image2328
/mavros/local_position/poseDrone Position and Orientation9090
/tfCoordinate Transformation Data38,887
Table 2. Detection performance for blossoms and buds.
LabelPrecisionRecallF1 ScoreAverage Precision
Bud0.8330.7450.7870.825
Blossom0.8580.9020.8800.943
Table 3. Number of detected flower points.
FrontsideBacksideTotal
11062211327
Table 4. Distances between pear tree branches.
Branch 1Branch 2Branch 3Branch 4Branch 5Branch 6Branch 7Average
1.41.51.41.31.41.41.41.4
Table 5. Number of clusters and noise points for different ξ values.
ξ 0.010.020.050.080.10.120.150.180.2
Clusters959389878179746867
Noise249264323335340334351416410
Table 6. Fruit set rate.
Pollination MethodFruit Set Rate (%)Good Fruit Set Rate (%)
Drone pollination62.113.8
Manual pollination61.922.5
Natural pollination53.610.5
Disclaimer/Publisher’s Note: The statements, opinions and data contained in all publications are solely those of the individual author(s) and contributor(s) and not of MDPI and/or the editor(s). MDPI and/or the editor(s) disclaim responsibility for any injury to people or property resulting from any ideas, methods, instructions or products referred to in the content.

