1. Introduction
Modern small unmanned aerial system (sUAS) platforms are designed for and used in a wide variety of operating environments and for an increasing number of application scenarios. For example, drones are used in underground environments [
1], for marine applications [
2], and even healthcare services [
3]. Within this wide scope of applications, there seems to be an ever-growing set of use cases, such as search-and-rescue (SAR) operations, which may require sUAS platforms to operate in a multitude of possible environments [
4,
5]. It is intuitive to hypothesize that the performance of different sUAS platforms will vary depending on the use case scenario being tested. For example, one sUAS platform may have better collision tolerance against walls but may not perform as well in terms of navigating indoor hallways. The ability to determine the ‘best’ sUAS for a specific mission or use case may prove to be immensely helpful in the deployment of such platforms in indoor and subterranean (subT) environments.
Some prior works examined the ability of sUASs to perform in GPS-denied environments [
6], and the effects of sUAS collisions with other aircraft in the national airspace [
7,
8]. With specific regard to defense applications, there has been increasing interest in the deployment of sUASs in subT or similarly confined, GPS-denied environments [
9]. This focus on combat scenarios in indoor, underground urban, tunnel, and mine environments is demonstrated by recent programs such as the DARPA Subterranean Challenge [
10] and the DARPA Fast Lightweight Autonomy program (FLA) [
11,
12,
13].
Each of these deployment scenarios requires a prior understanding of the performance capabilities of the sUAS in these environments. However, there have been very few studies that developed testing and evaluation methodologies focusing on indoor and subT use cases. This represents a knowledge gap that we seek to remedy.
In this work, we present test and evaluation methodologies focused on collision tolerance and navigation. Collision tolerance tests refer to the ability to maintain continuity of operation after impact with obstacles formed by different kinds of materials and tested with different collision incidence trajectories. The following work proposes numerical and categorical evaluation metrics for collision tolerance, some of which are inspired by similar approaches in the field of vehicle crash testing [
14]. On the other hand, navigation tests evaluate a drone’s ability to fly in various configurations and environments using take-off to landing waypoints [
15]. The following work also proposes a testing methodology and evaluation criteria for the navigation and trajectory followability capabilities of sUASs.
More generally, the described methodologies provide guidelines for sUAS evaluation and benchmarks for testing [
16,
17]. They may be built upon or adapted to suit other environments not covered in our tests. For example, our evaluation metrics could be utilized for tests in underground disaster scenarios, collapsed buildings [
5], tunnel inspections for railways and mines [
18], or catastrophic collisions [
7]. Such environments may contain specific use cases where drones may have difficulty navigating or may encounter obstacles that prevent movement in vertical and horizontal directions, such as in pipes, shafts, stairwells with tight corners, and doorways. These building blocks may potentially be configured and combined to form larger representative environments, such as tunnels and building floors.
We expand upon our prior research on navigation test methodologies for indoor environments [
16,
17,
19]. Our tests incorporated several commercially available and prototype sUAS platforms available for civil and defense use cases, including Flyability Elios 2, Parrot ANAFI USA GOV, Teal Drones Golden Eagle, Vantage Robotics Vesper, Cleo Dronut, Skydio X2D, and Lumenier Nighthawk. The experimental evaluations highlighted both the differences and similarities between the capabilities of these systems. Other companion studies produced as part of the same research efforts examined situational awareness [
20], communication capabilities [
21,
22], trust [
23], autonomy [
24], mapping [
13], etc.
The remainder of this paper is organized as follows:
Section 2 discusses prior research studies in the domain of sUAS evaluation and testing.
Section 3 discusses our testing methodology.
Section 4 discusses the setup of the test environment, and finally,
Section 5 presents the results of our evaluation study.
Section 5 is further broken down into two sections, with the first being collision tolerance and the second being navigation testing.
2. Background
Current state-of-the-art sUAS evaluation techniques are largely designed for testing in outdoor environments, in large open spaces where GPS positioning solutions are readily available. Much of this work has been aggregated by the National Institute of Standards and Technology (NIST), whose Response Robots program has been steadily pursuing the development of standards for sUAS operations [
25]. These standards focus on holistic sUAS testing in above-ground environments. While this work examines many aspects of sUAS platforms, it does not include testing for trajectory following or collision tolerance.
The few navigation and maneuvering evaluation methodologies proposed by the NIST (called the position test procedure, labeled as MAN 1) focus primarily on waypoint navigation. While other methodologies assess the ability to follow specific paths (such as traversal (MAN 2), orbiting (MAN 3), and spiral (MAN 4)), their evaluation mainly involves examining alignment and orientation concerning visual acuity targets [
25]. These evaluations are binary: whether or not the sUAS successfully holds position while aligning with a target at various points along the trajectory. Another protocol proposed by Ćwiąkała offers a fine-scale quantitative evaluation of sUAS navigation capabilities by using GPS to measure how well the sUAS reaches specific waypoints in outdoor environments [
26]. However, these evaluation techniques are difficult to replicate in GPS-denied indoor and subT environments, where GPS serves as a foundational element in the evaluation. Given the increased number of obstacles in indoor and underground spaces, the ability of the drone to exactly follow the desired path is critical. These spaces are often complex and unstructured environments [
27], which present many opportunities for collisions to occur. Any minor deviation from the trajectory can cause the mission to end catastrophically. We will present a testing methodology that shows how a drone deviates from the full trajectory, instead of just its ability to path through certain waypoints.
The evaluation of collision tolerance characteristics is notably lacking in the state of the art for drones in indoor spaces. Interestingly, while there has been significant interest in evaluating the collision tolerance of aircraft, much of this work has focused on the tolerance of large passenger aircraft
to sUAS collisions [
7,
28]. However, some recent research has sought to examine the ability of sUASs to tolerate collisions in confined environments [
29,
30,
31]. Other recent works have also sought to develop collision-resilient frames for sUASs, generally utilizing shapes and designs less impacted by collisions, drawing inspiration from special geometries or natural shapes [
32,
33,
34]. The development of such frames could be facilitated by a better understanding of standardized tests to determine the effect of collisions and the survivability of the drone.
Recent efforts have also focused on testing and evaluating sUAS performance based on simulations [
35,
36,
37,
38]. These simulations can eventually speed up testing and reduce costs, provided that the testing methodologies are valid and standardized.
Collision tolerance requires a sUAS to collide with an obstacle and continue flying without external intervention, whether needing repairs or repositioning for takeoff. Tolerance, in this context, indicates that the drone does not need to land or can take off immediately after landing following the collision. Much of the engineering related to this has drawn inspiration from insects, which often collide with objects but continue flying [
31,
39]. Further developments have included rigid [
31,
40] or elastic frames [
32], Euler spring systems [
41,
42,
43], and icosahedron designs [
34]. Cage-based systems that surround the drone or its propellers are another solution. One example of a drone designed with collision tolerance in mind is the ‘RMF-Owl’ [
29,
44]. Some drones tested in this project feature propeller guards or cages around the propellers to prevent the blades from sticking. When a drone without propeller guards collides with a wall, the blades stop, causing the drone to crash. While propeller guards do not prevent collisions, they mitigate thrust loss, allowing the sUAS to recover from the collision force and continue flying [
44,
45].
The collision tolerance evaluation metrics presented later in this paper draw inspiration from car testing methodologies [
14,
46,
47,
48]. Cars undergo rigorous testing for many metrics, including safety and how collision tolerance helps mitigate harm to passengers. Similarly, when a sUAS collides with a wall, many forces act on it, just as they do on a car during a crash. The methods for measuring and evaluating these forces in cars are adapted in this paper.
An important consideration when evaluating sUASs in indoor or subterranean (subT) environments is that these conditions present challenges due to platform-induced air currents and turbulence [
49]. While, in these situations, there is not the same type of wind as outdoors [
50], in inside spaces, there are air currents generated by the agent’s propellers. These currents spread out from the sUAS and can change direction upon contacting walls, returning to act on the drone. The strength of these currents depends on the force of the propellers and the density of obstacles nearby. Increasing motor power does not necessarily solve the problem and may worsen it, as the stronger air currents generated might further destabilize the sUAS. Different control systems can mitigate these issues both outdoors and indoors [
51]. Such disturbances are common in indoor environments, and confined spaces create significant eddies and turbulence that are categorically different from outdoor disturbances [
52]. These turbulent eddies constrain the spatial maneuvering capabilities of the operator–platform team, significantly impacting waypoint navigation, trajectory-following, and collision tolerance [
45]. The next section discusses the test methods used to evaluate sUAS performance in indoor environments.
3. Evaluation Methodology
Our proposed test and evaluation methodology examines two modalities of sUAS flight: collision tolerance and navigation. Both of these are discussed in more detail below. This work expands significantly of our earlier work in this domain [
19]. The drones in question did not have a self-navigation feature that functions in GPS-denied spaces; therefore, the tests were conducted with the drones being remotely controlled by a single expert pilot trained on the respective platforms. In cases where the drones supported autopilot, the same tests were repeated using that feature, to gain a more comprehensive understanding of the autonomy capabilities.
3.1. Collision Tolerance Tests
Collision tolerance examines the ability of a drone to continue operations after colliding with an obstacle. This may include the mission being temporarily disrupted, for example, through a forced landing due to the collision, but the mission nevertheless completes all of its goals. Collision tolerance also heavily depends on the factors involved in the collision. What material did the sUAS collide with? What was the angle of motion during the collision? These factors influence the outcome, making collision evaluations case-specific and therefore complex to standardize. We will now introduce the testing methodology used for collision tolerance, followed by the evaluation metrics.
3.1.1. Test Methodology
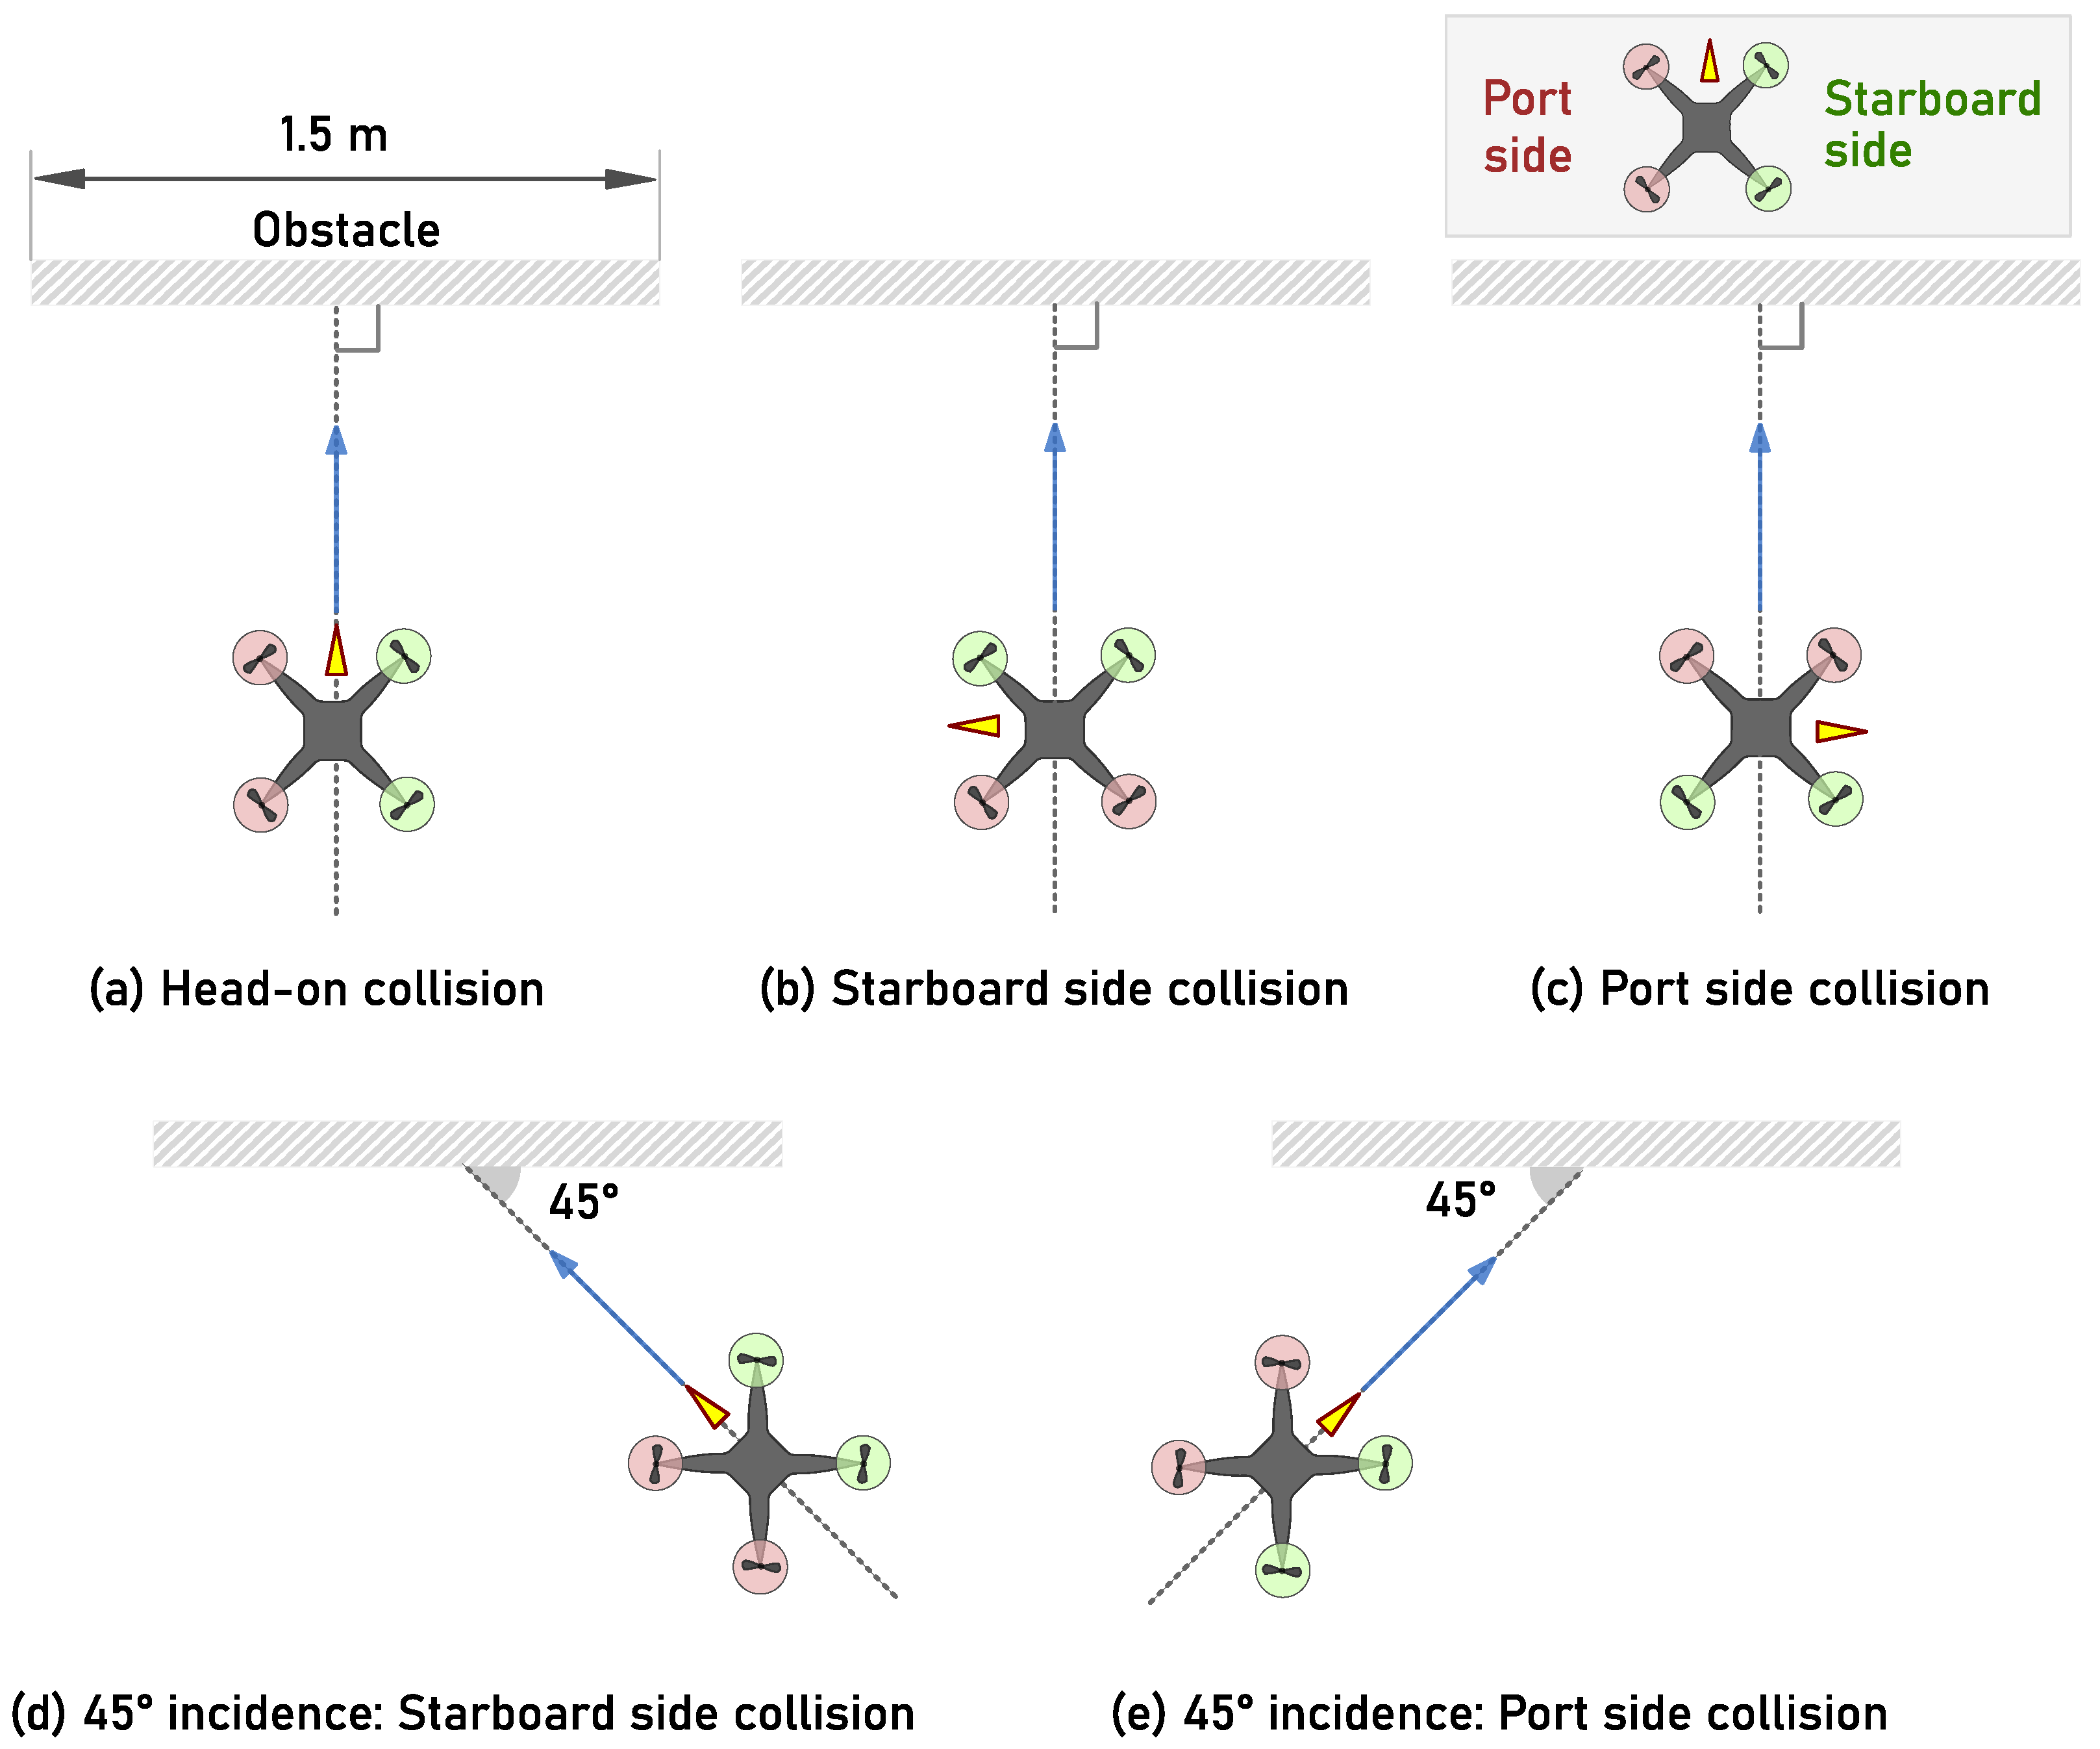
The collision tests included five categories of collision impact orientations (
Figure 1). Each orientation assessed the collision tolerance of the drone from a different direction, with head-on and side-on collisions (
Figure 1a–c) possibly having a reduced effect in comparison to angled collisions (
Figure 1d,e). The results from these tests were evaluated using test metrics developed to score collision tolerance. In all tests, the drone took off from a starting point 2 m away from the obstacle, collided with the obstacle for approximately 1 s, and then returned to land at the takeoff point. All tests were repeated five times.
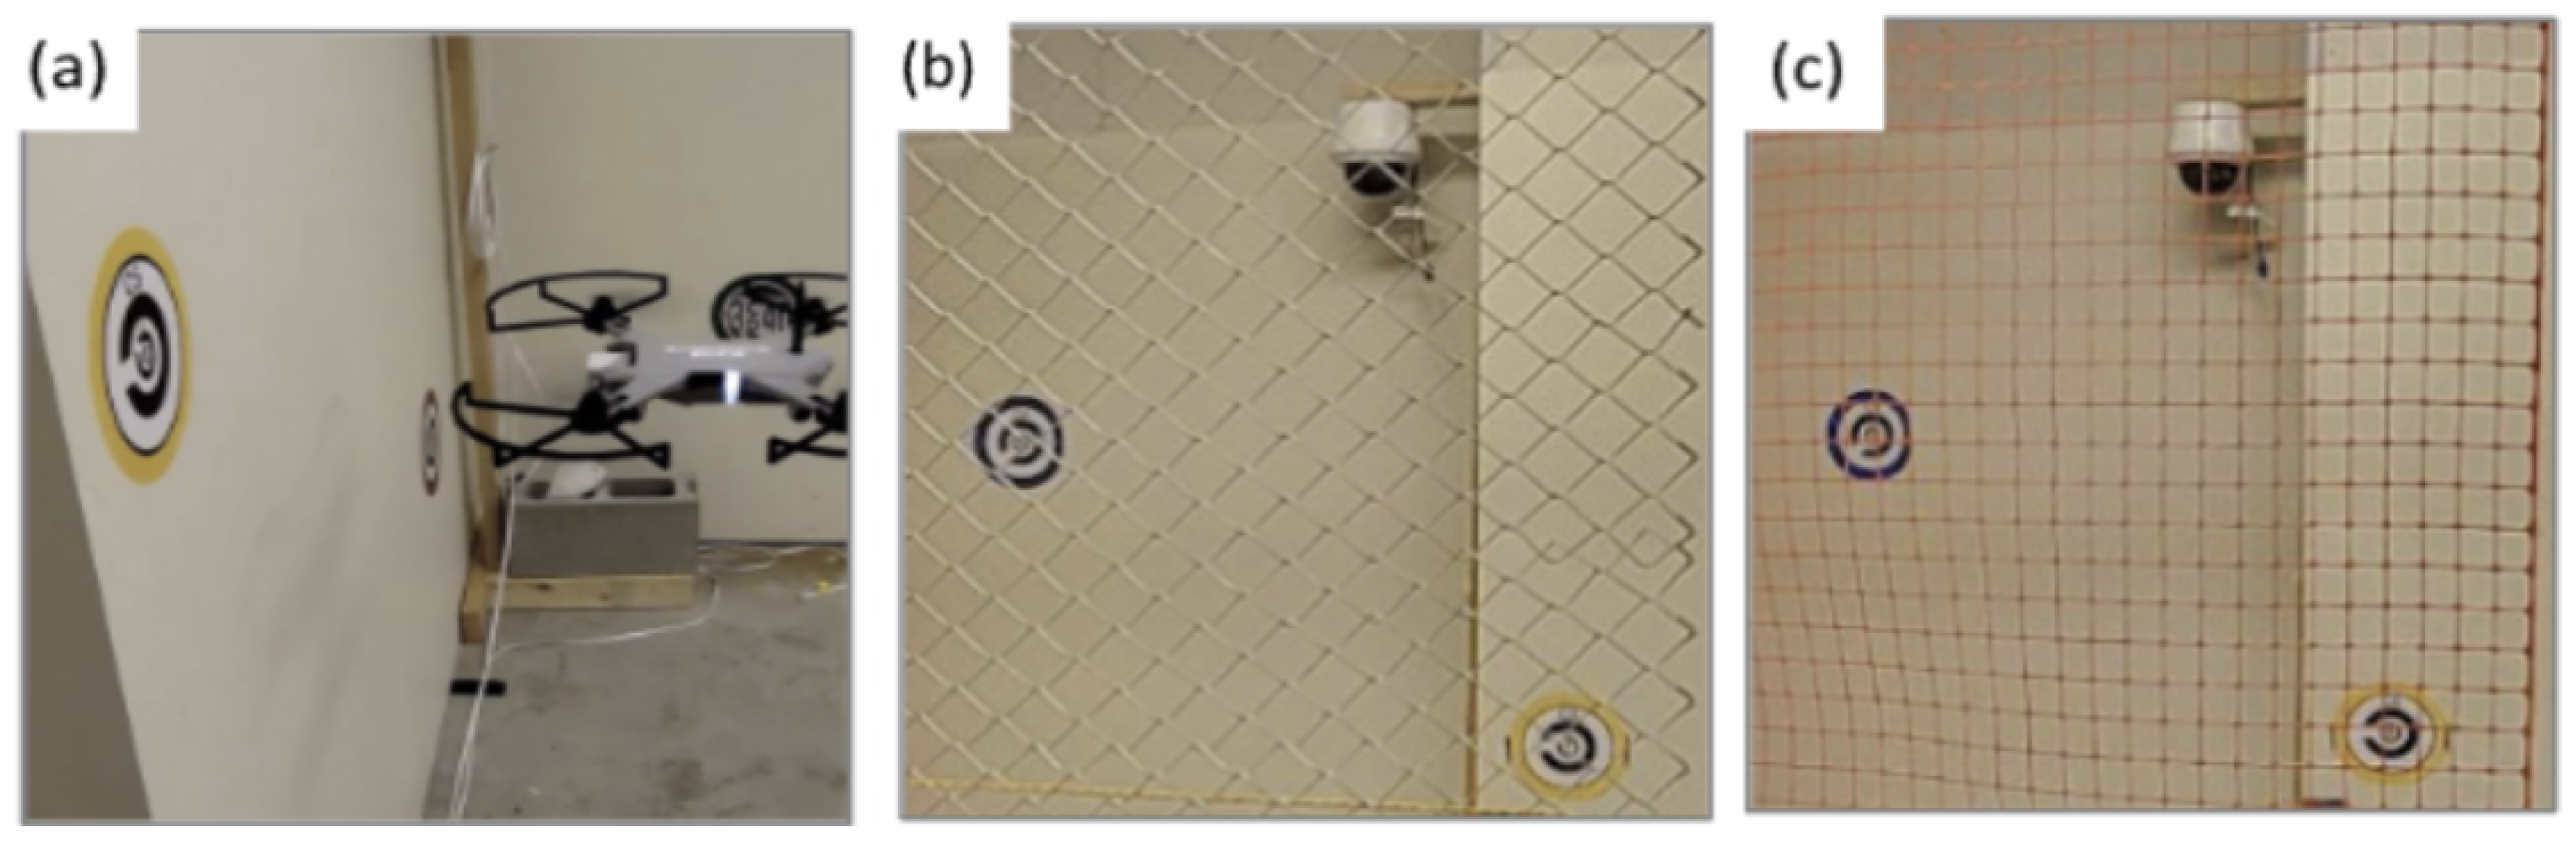
Additionally, the collision tests were performed for three obstacle categories using materials that had varying levels of elasticity: drywall, mesh, and chainlink fence (
Figure 2). The tested sUAS platforms were expected to be more tolerant of collisions with flexible materials such as chainlink and mesh, with an increased likelihood of continued operation despite a collision event. To demonstrate this, two of the obstacles possessed very little elasticity; the wall test serves as an example.
Figure 1.
Different angles of collision for the drones in the collision tolerance tests. Yellow arrows represent the forward orientation of the sUAS, blue arrows indicate the direction of travel, and dotted line indicates the ideal path of traversal.
Figure 1.
Different angles of collision for the drones in the collision tolerance tests. Yellow arrows represent the forward orientation of the sUAS, blue arrows indicate the direction of travel, and dotted line indicates the ideal path of traversal.
One of the key aspects of collision tolerance that is very specific to sUASs is propeller protection. Propeller guards prevent objects from contacting the propellers, enabling the operational continuity of the motors and drone system. Without adequate propeller protection, there is a significantly increased likelihood of the drone failing collision tolerance tests. Since we had a limited number of platforms available for collision testing, the scope of impact testing was limited to a few which had available propeller protection. Additional details are discussed in
Section 5.1.
3.1.2. Evaluation Metrics
We developed three metrics to score the various drone systems. The first metric indicates the overall success or failure of the drone in the experiment. This is the Categorical score. We followed this up with the Modified Acceleration Severity Index (MASI) and Maximum Delta V (MDV) scores for each drone. Collectively, these scores fully evaluate the ability of a drone to survive collisions. The validity of these metrics will be discussed in
Section 5, alongside the experimental results.
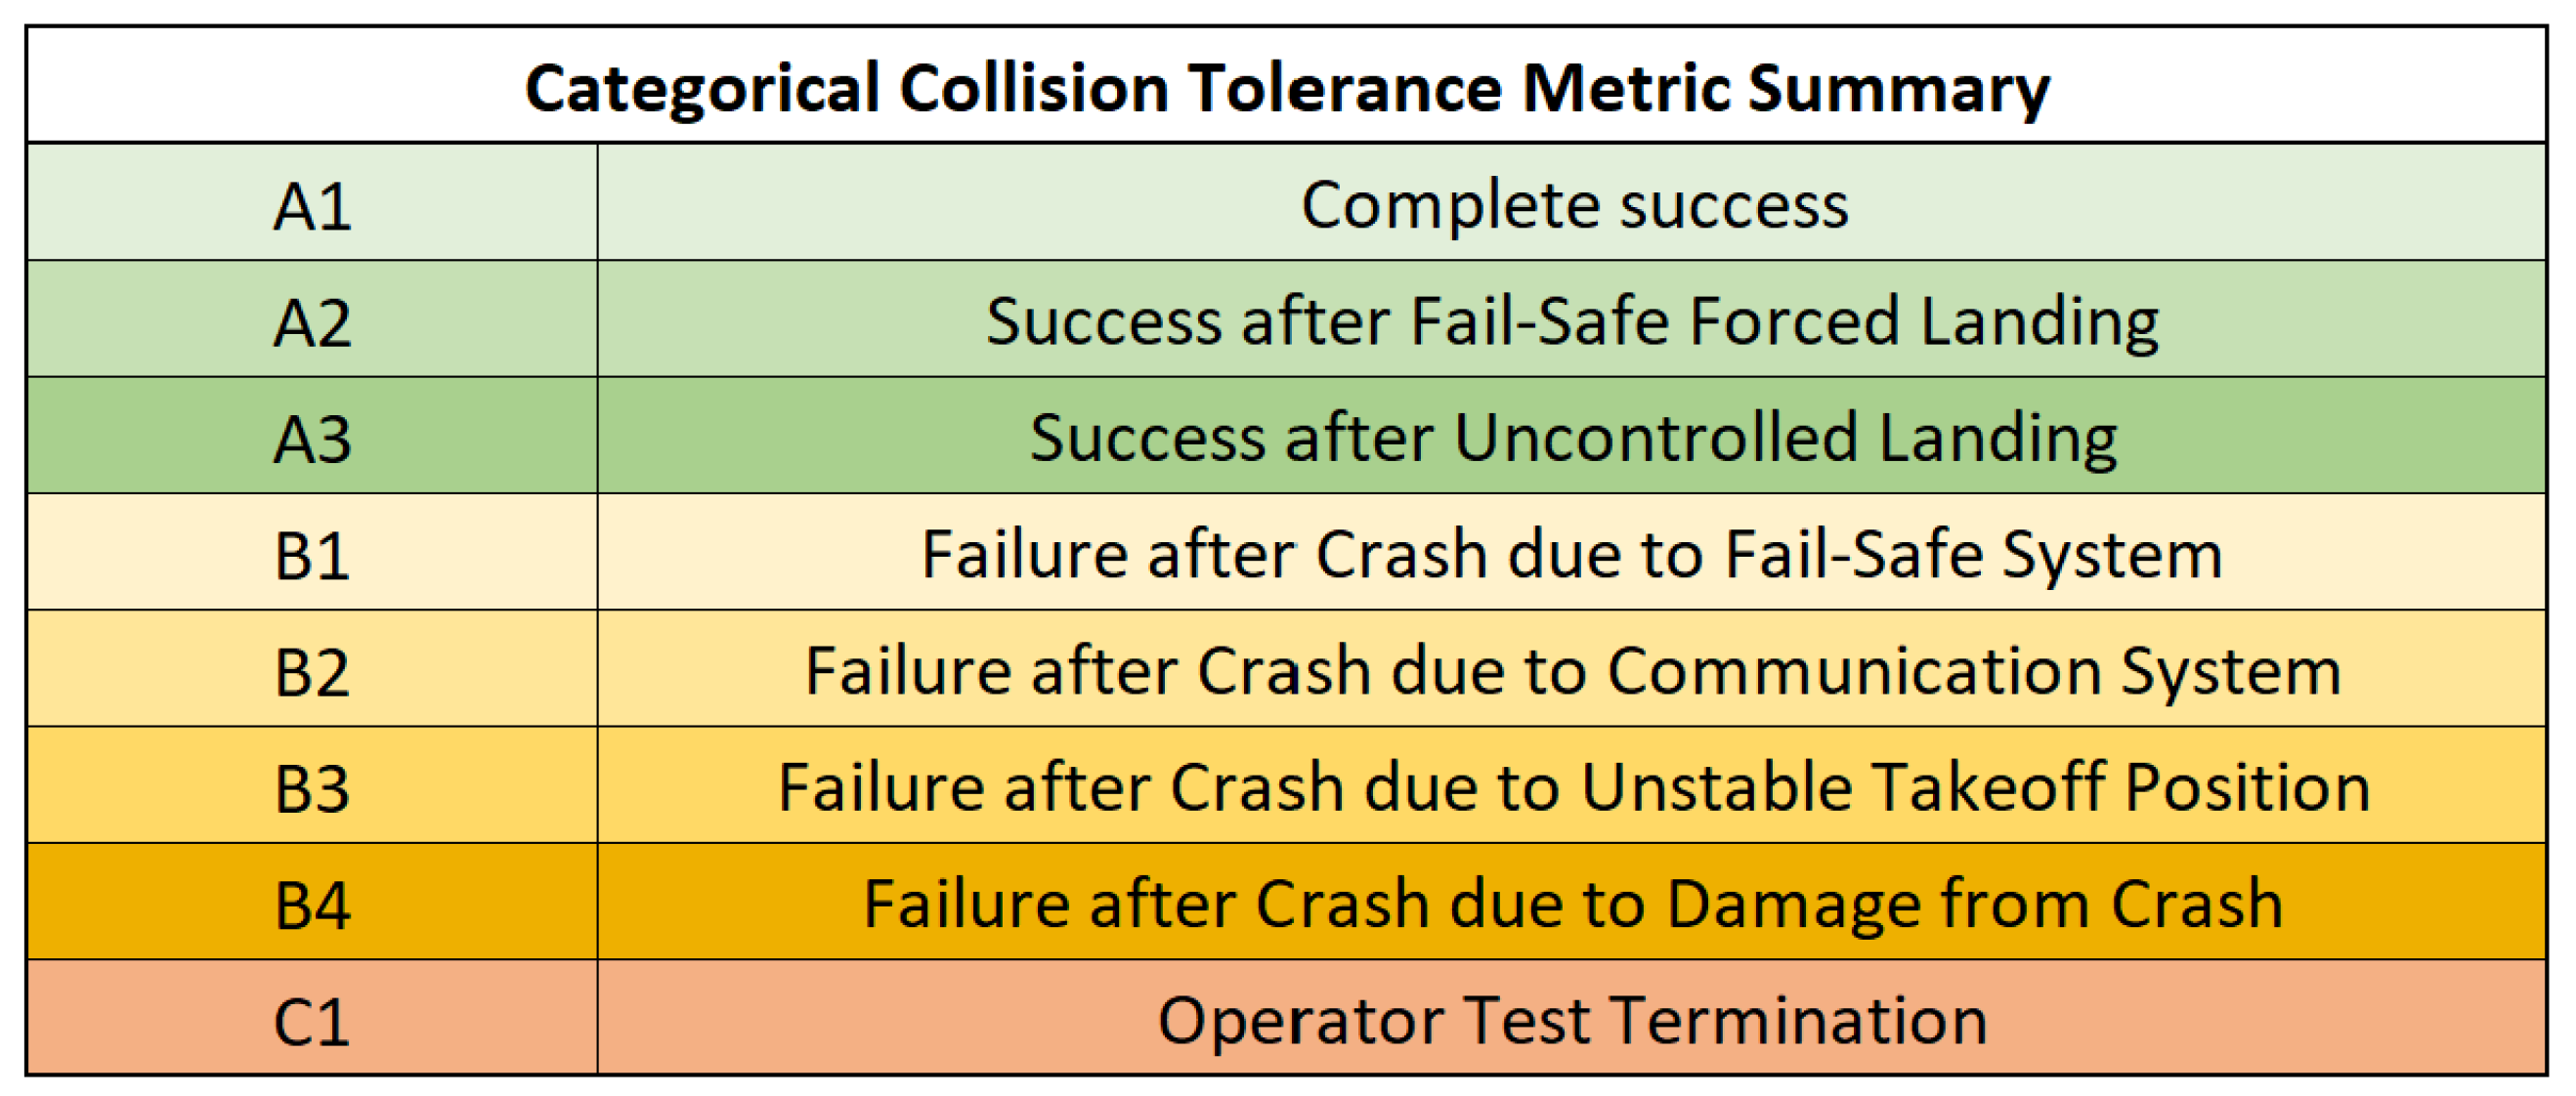
3.1.3. Categorical Score
The success or failure of the collision tests was classified using two markers (as seen in
Figure 3): a letter, and a number. The letter indicates one of three outcomes: “A” for pass, “B” for fail, and “C” for not tested. A failure type B occurs when the drone collides with an object and cannot continue operating. A failure type C designation implies that the test was not conducted due to concerns about potential system damage, such as when prop guards are missing or the drone cannot safely follow commands in a constrained environment.
The number specifies the subclass within each letter category. For a successful test A, there are three subclasses: A1 means the drone never crashes, A2 indicates it lands only after a software-initiated landing, and A3 means it crashes but can take off again without assistance. These rankings reflect increasing severity, with A1 being the best outcome, A2 involving a controlled landing, and A3 signifying a crash but with a recovery.
For a failure category B, the subclasses are as follows: B1 when the drone lands and cannot take off again due to software issues, B2 when communication is lost after the collision and the drone becomes inoperable, B3 when the drone is physically unable to take off again (e.g., it flips over), and B4 when the drone sustains damage that prevents further operation. The subclasses reflect an increasing severity of these issues, with B1 and B2 addressing fixable software or communication problems, while B3 and B4 involve physical damage or recovery difficulties.
In both cases, a lower number indicates a better subclass within the categorization.
Figure 3.
Collision tolerance categorical evaluation summary table.
Figure 3.
Collision tolerance categorical evaluation summary table.
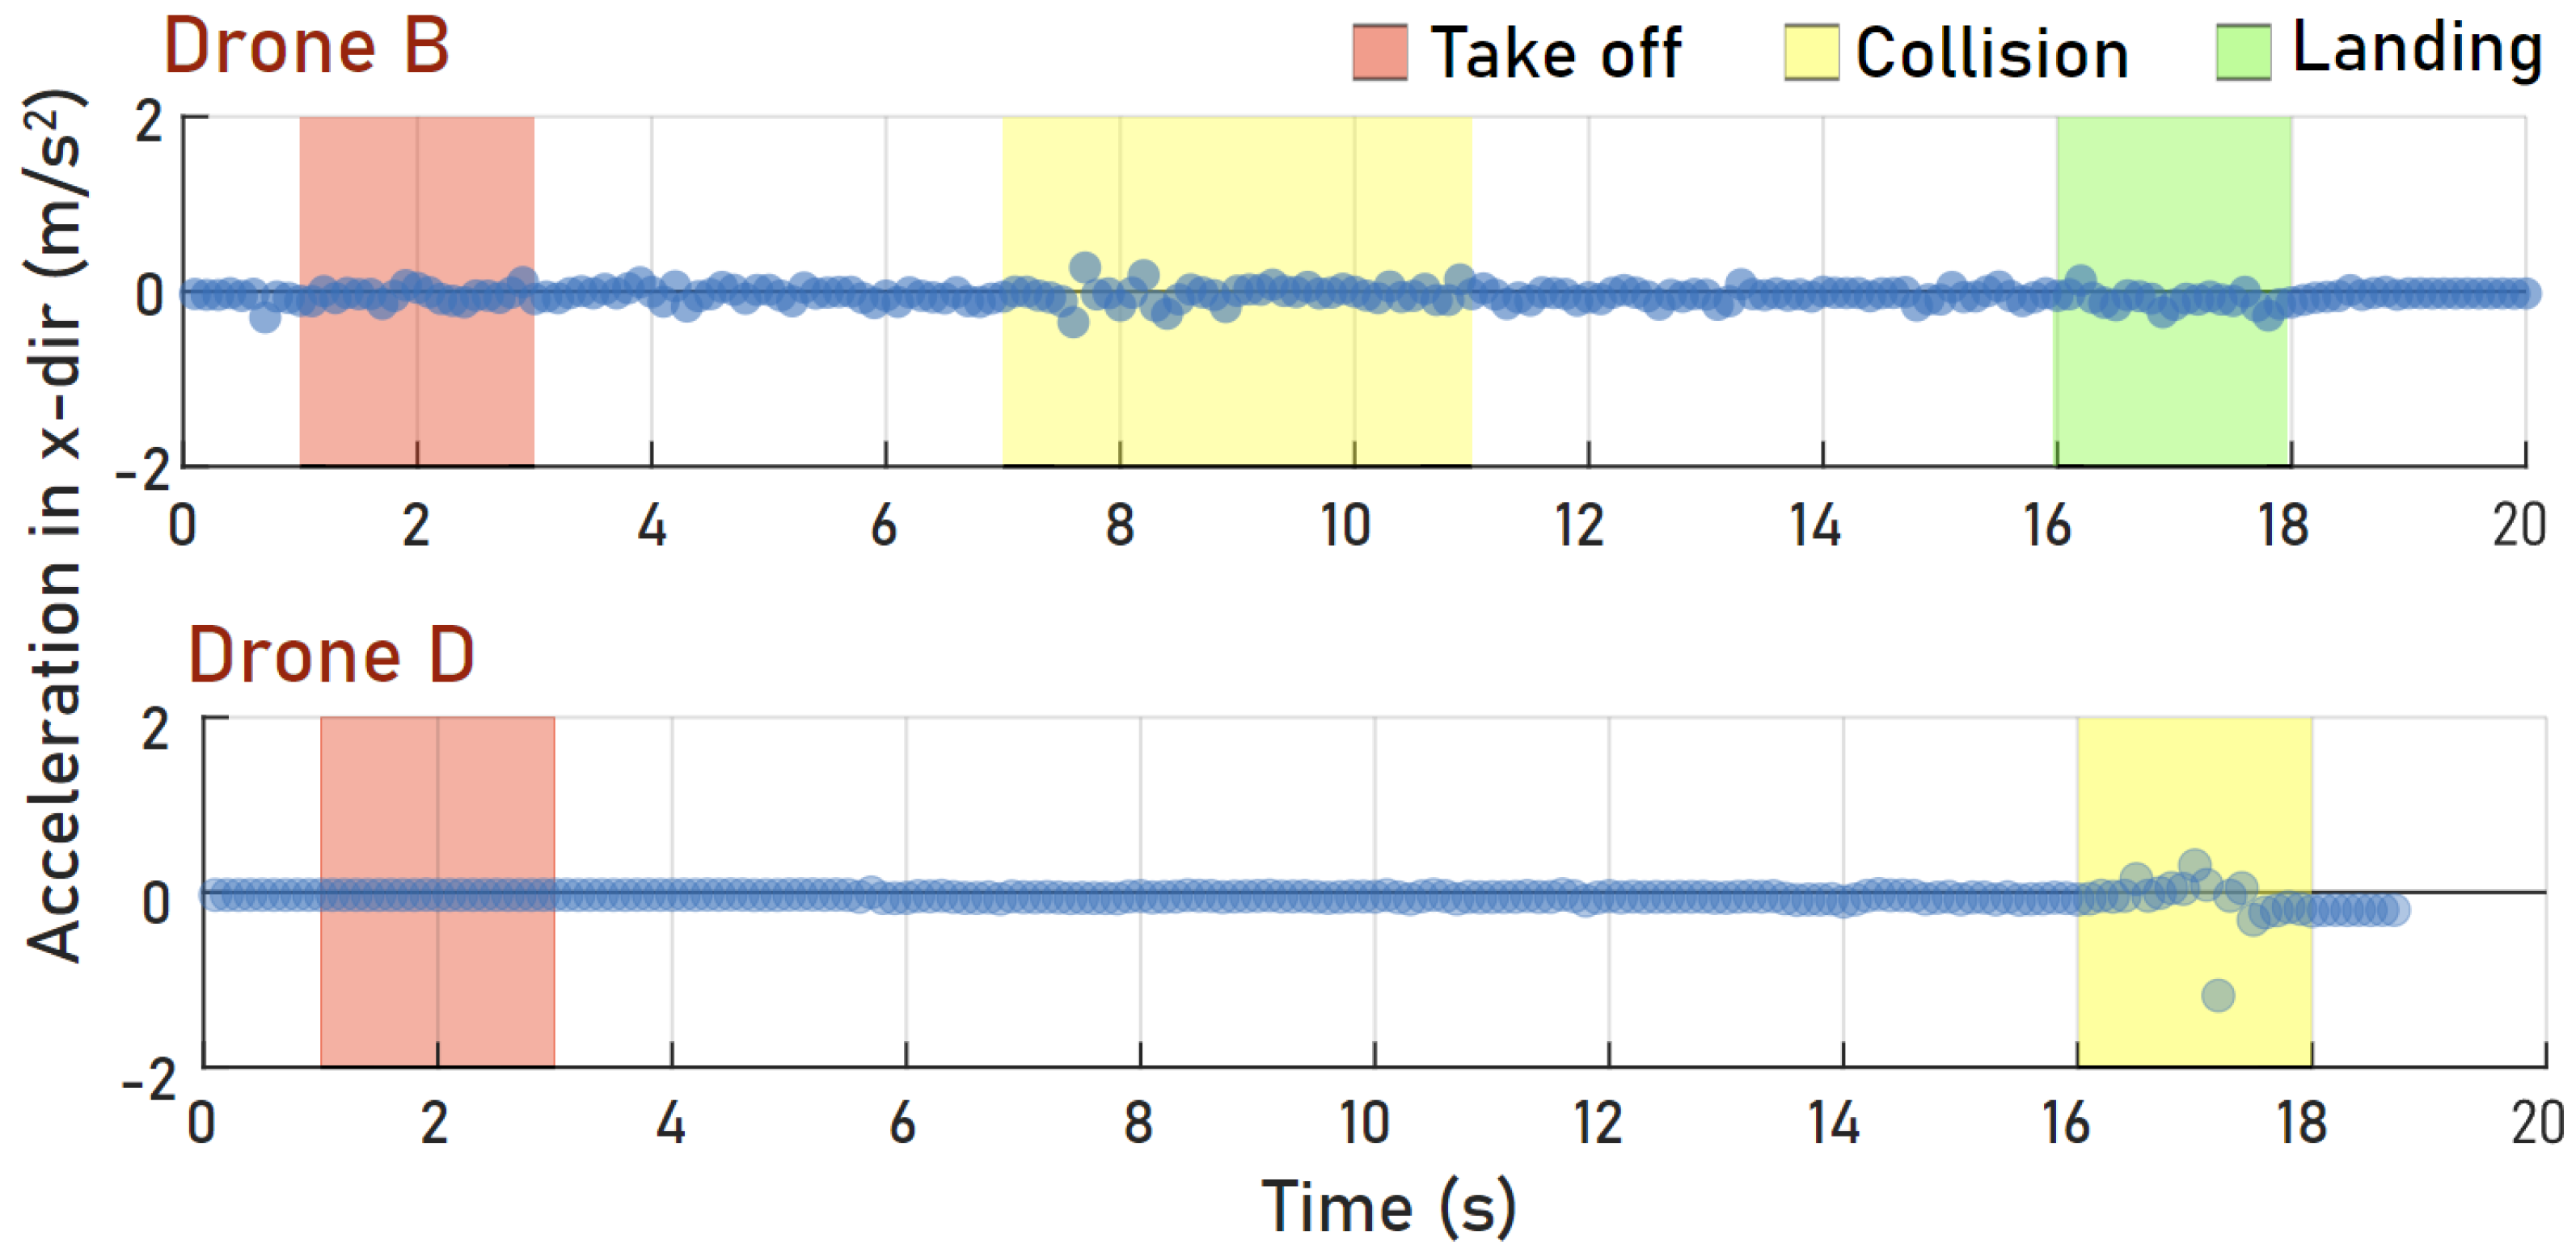
3.1.4. Modified Acceleration Severity Index (MASI)
The Acceleration Severity Index (ASI), introduced in 1972 [
53], is a widely used method for evaluating vehicle collisions in the car industry. The index quantifies the relative severity of a collision event for an unrestrained occupant. The ASI can easily be adapted to measure collision intensity in small unmanned aerial systems (sUASs). The Modified Acceleration Severity Index (MASI) is calculated as the acceleration in three dimensions divided by the force of gravity, as seen in Equation (
1). This unitless metric indicates the overall intensity of the drone’s total acceleration during impact. An example dataset of a collision test is shown in
Figure 4, where the MASI metric for collisions for Drones B and D are shown. This figure shows the time steps at which the drone took off, collided, and landed. The collision caused drone D to crash, and hence its landing transition is not shown.
3.1.5. Maximum Delta V (MDV)
The Maximum Delta V metric is designed to observe the change in velocity (
) across a defined increment in time (
). In the current context, we defined Delta V (DV) at any given time t, as the change in velocity over 10 time steps. The relevant sensors on our platforms operate at a sampling rate of at least 30 Hz, i.e., the 30 sensor time steps were generated per second, so the time interval this metric was calculated at was
s. The MDV metric is calculated as follows:
where DV is direction-specific, i.e., it is computed for each axis (X, Y, Z) or for combinations of axes (X & Y, X & Z, Y & Z, and X & Y & Z), and is calculated at each time instant for the duration of the collision event. Max Delta V (or MDV) is defined as the maximum DV over the duration of the entire collision event, as shown in Equation (
2). An example of a test for MDV is shown in
Figure 5, where Drones B and D had their MDV results computed. Similarly to the previous discussion, this figure illustrates the time steps at which the drone took off, collided, and landed. Drone D did not land properly, as the collision caused it to crash.
Combined, these two metrics indicate the maximum acceleration (MASI) and the maximum velocity change (MDV) that the drone can withstand, which in turn suggest the maximum velocity at which the drone should operate when there is a risk of collision.
Figure 5.
Collision tolerance MDV for Drone B and D.
Figure 5.
Collision tolerance MDV for Drone B and D.
3.2. Navigation Test
Navigation testing in subterranean environments assesses a drone’s ability to accurately follow a designated path without significant deviation. Such deviations can result from various factors, including execution inaccuracies and disturbances caused by air currents—either self-induced or from external sources. While no artificial wind was introduced in these experiments, many tests were conducted with the drone operating in close proximity to walls to evaluate its resilience to reflected airflow. These results were then compared to trials where the drone maintained greater distance from the walls, where such aerodynamic disturbances are expected to be minimal. We will now introduce the testing methodology used for navigation testing, followed by the evaluation metrics.
3.2.1. Test Methodology
An indoor flight mission for an sUAS can be categorized into a series of navigation tasks. We present four such examples: (a) wall following, (b) linear path traversal, (c) corner navigation, and (d) aperture navigation. Each test is repeated five times via line-of-sight (LOS) operation for each sUAS being evaluated. A platform’s success across all five categories indicates its ability to navigate in subterranean spaces.
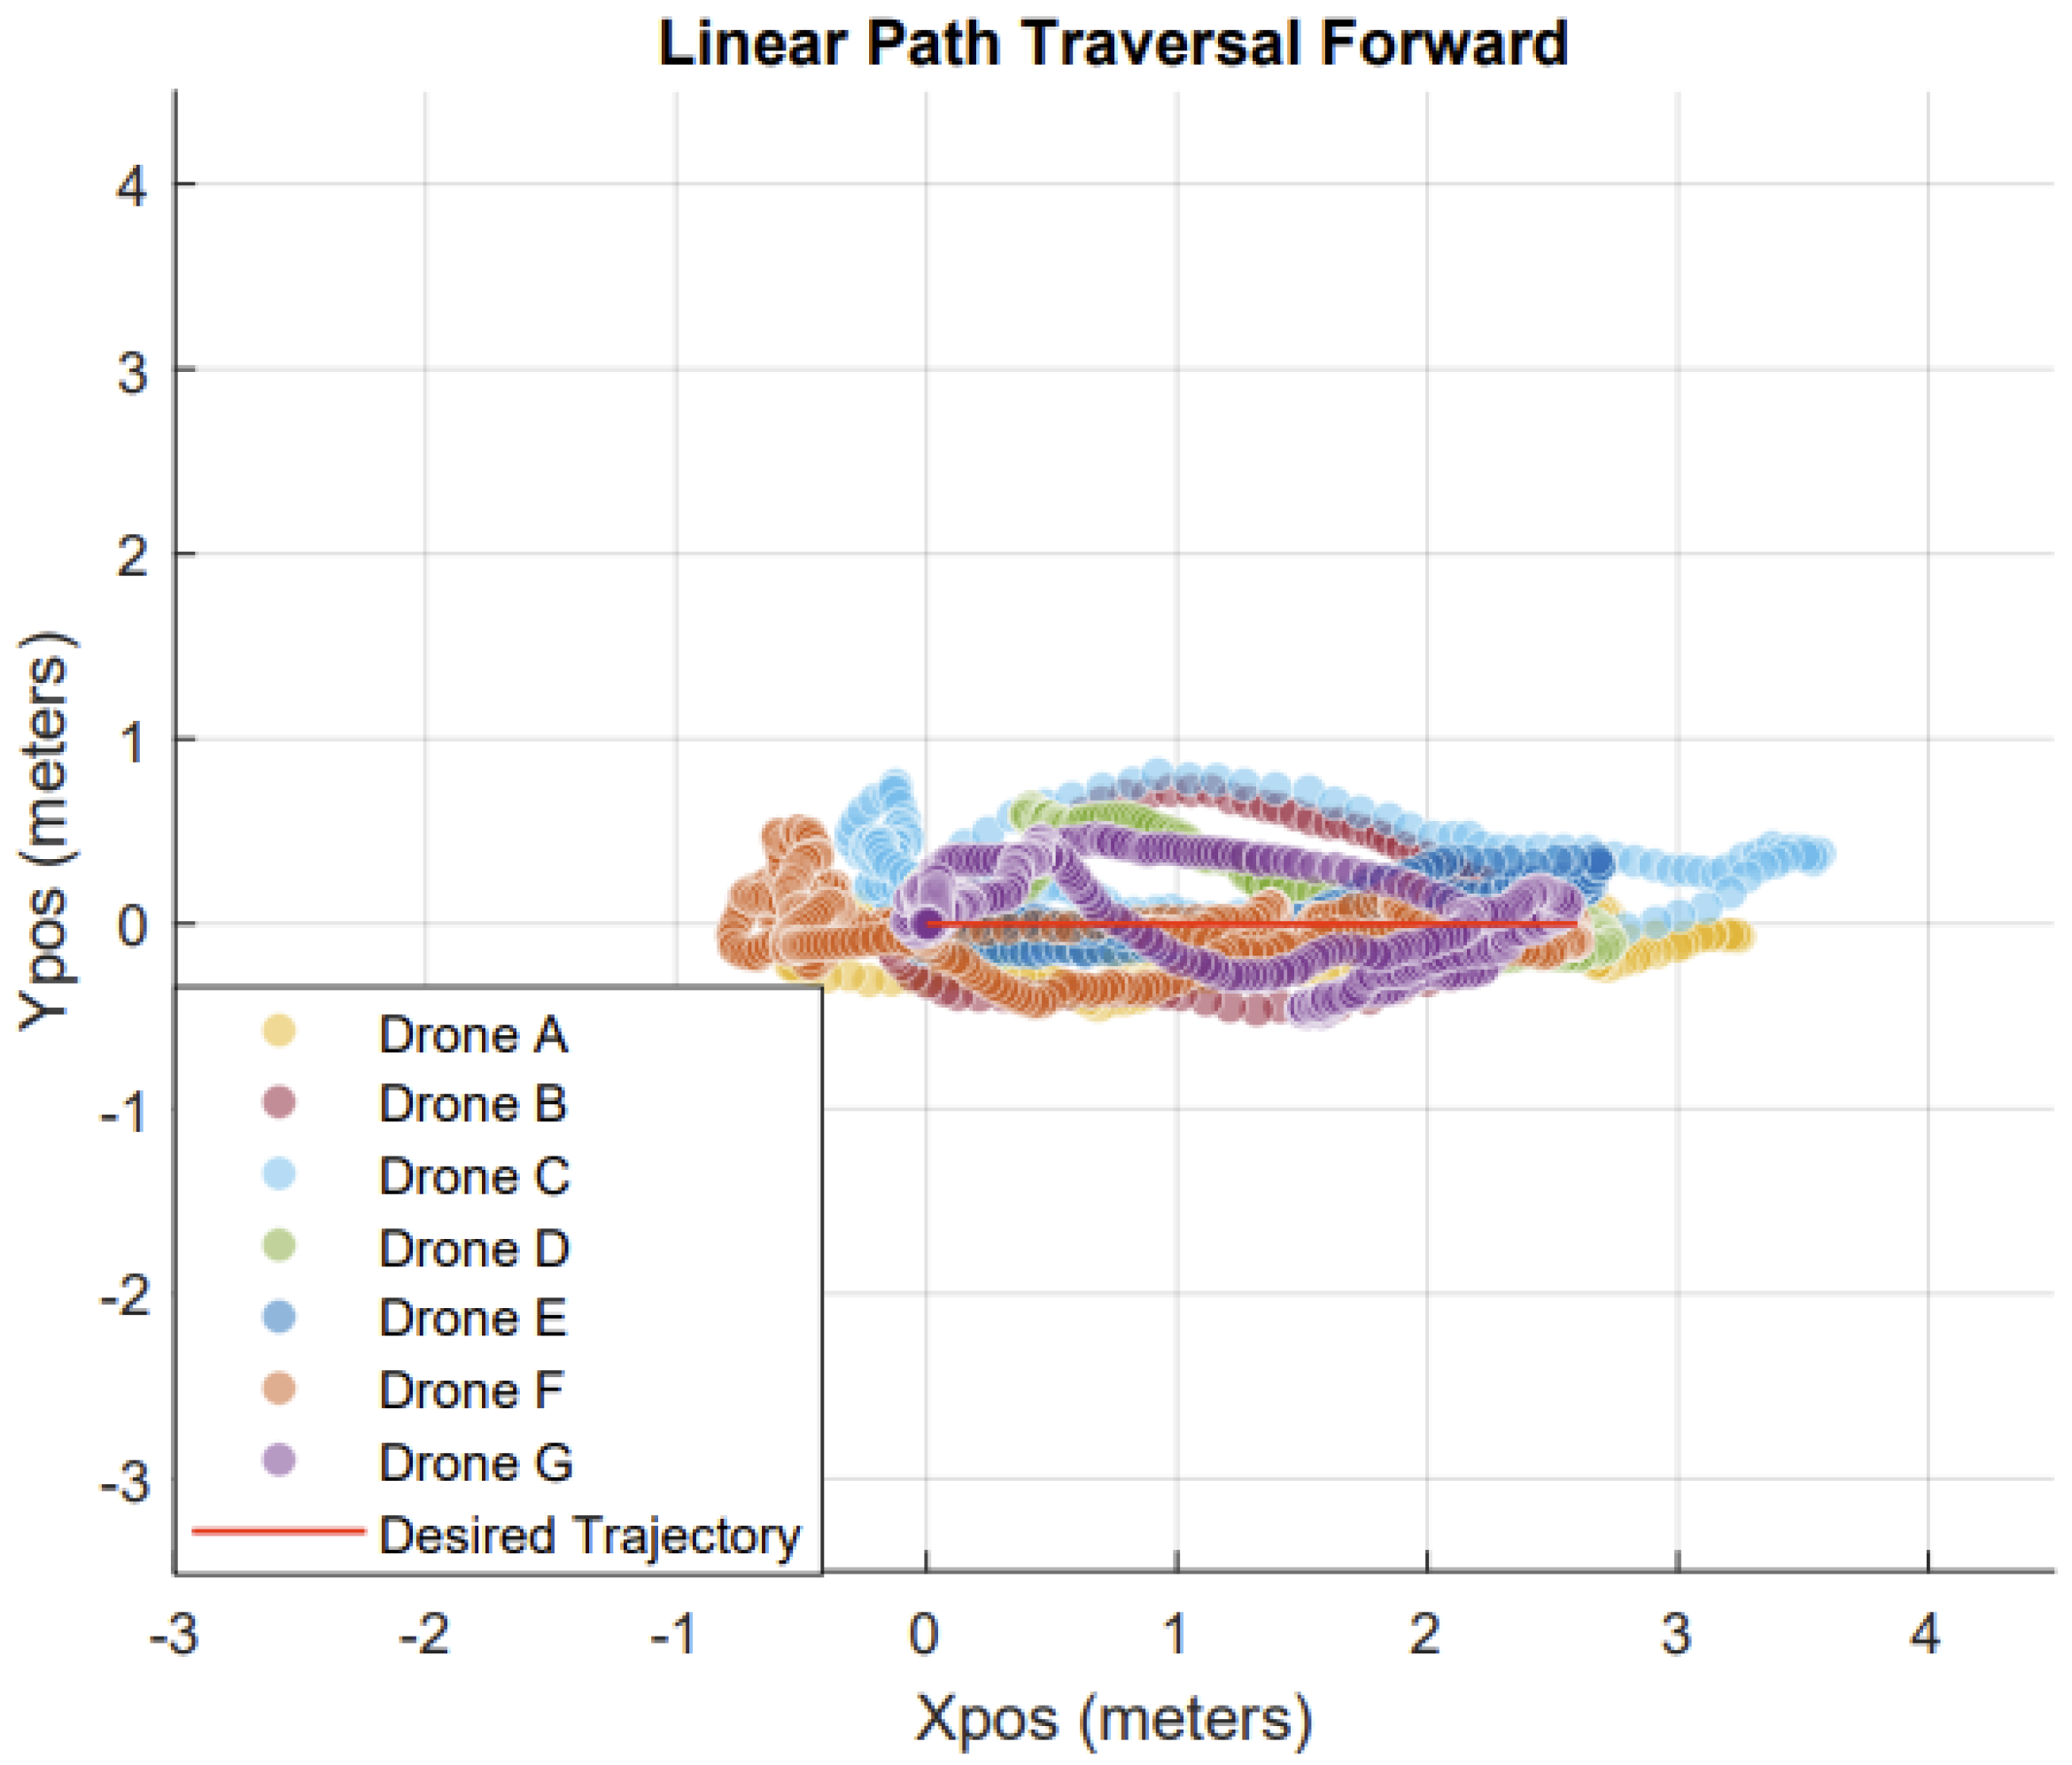
3.2.2. Linear Path Traversal
This test evaluates the ability of the sUAS to follow a linear trajectory. It consists of four different tests.
- 1.
Forward Flight: Takes off, moves forward 2.5 m by changing only its pitch (roll and yaw stay constant), then returns.
- 2.
Sideways Flight: Takes off, moves sideways 2.5 m by changing only its roll (pitch and yaw stay constant), then returns.
- 3.
Diagonal Flight: Takes off, moves diagonally 2.5 m at a angle by adjusting roll and pitch (yaw stays constant), then returns.
- 4.
Square Flight: Takes off, moves forward 2.5 m (changing only pitch), then sideways 2.5 m (changing only roll), then backward 2.5 m, and finally sideways 2.5 m to return.
The first three tests involve missions where the drone flies forward, sideways, or diagonally. In the forward and sideways tests, the drone demonstrates its ability to follow a single line forwards and backwards. The different flight directions (forward or sideways) are used to validate any potential issues or variations between using pitch (forward flight) and roll (sideways flight). The diagonal test assesses the drone’s performance when using both roll and pitch simultaneously. The final test is the square test, which is more complex, as the drone must fly in a square pattern without rotating, meaning the drone needs to move in four different directions by the end of the test. By analyzing data from each test, we can identify if the drone performs better in certain directions. The test takes place in a square space no less than in length.
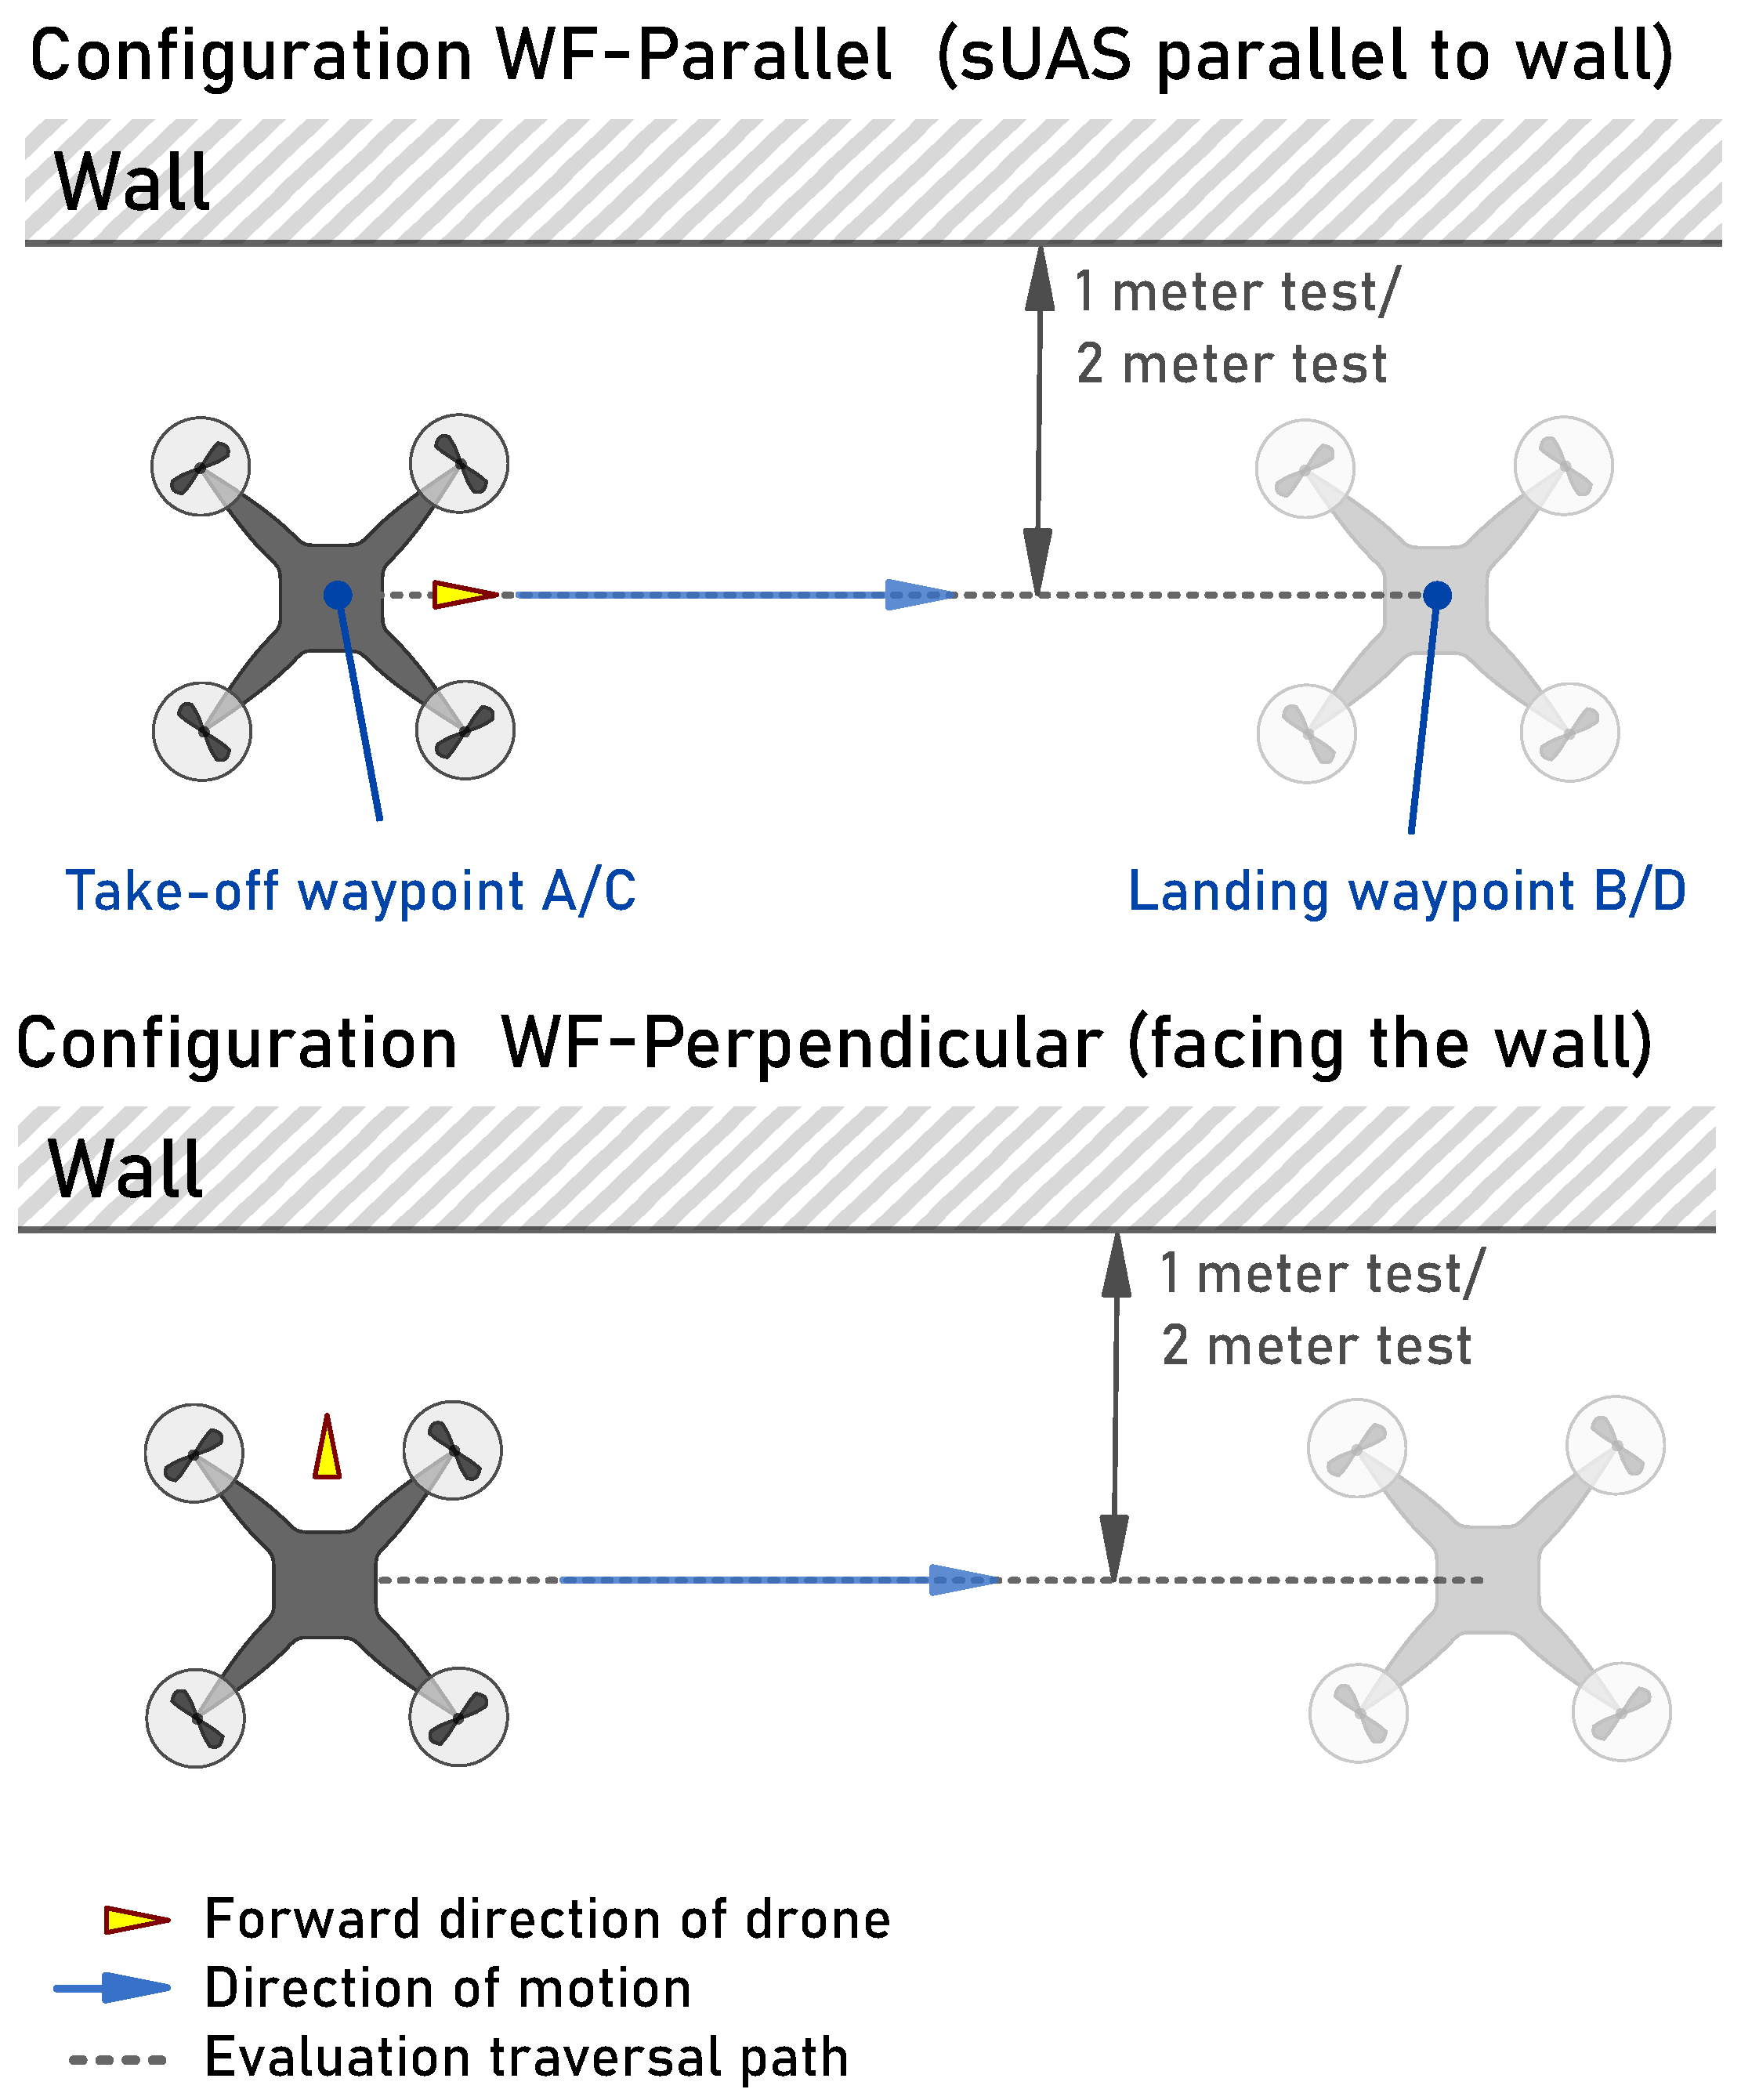
3.2.3. Wall Following
The Wall Following (WF) test examines the ability of the sUAS to navigate a specific traversal path, while operating in the vicinity of a wall at both close (1 m away) and distant (2 m away) positions. In both cases, the sUAS moves a total of 2.5 m from the departure, before landing. This is a common use case scenario in specific indoor and subterranean operations, such as search and rescue [
9]. The ability of the sUAS to traverse this path can be affected by internal dynamics, imperfect pilot control, and turbulent eddy currents generated due to backwash from the sUAS propeller action.
This test is performed in two sUAS configurations common for such missions: WF-Parallel and WF-Perpendicular, as shown in
Figure 6. In the WF-Parallel configuration, the sUAS forward axis is aligned parallel to the wall surface while moving along it (i.e., the sUAS pitches to fly forward and parallel to the wall). In the WF-Perpendicular configuration, the sUAS forward axis is perpendicular to the wall while moving parallel to it (i.e., strafing right or left to fly sideways but parallel to the wall).
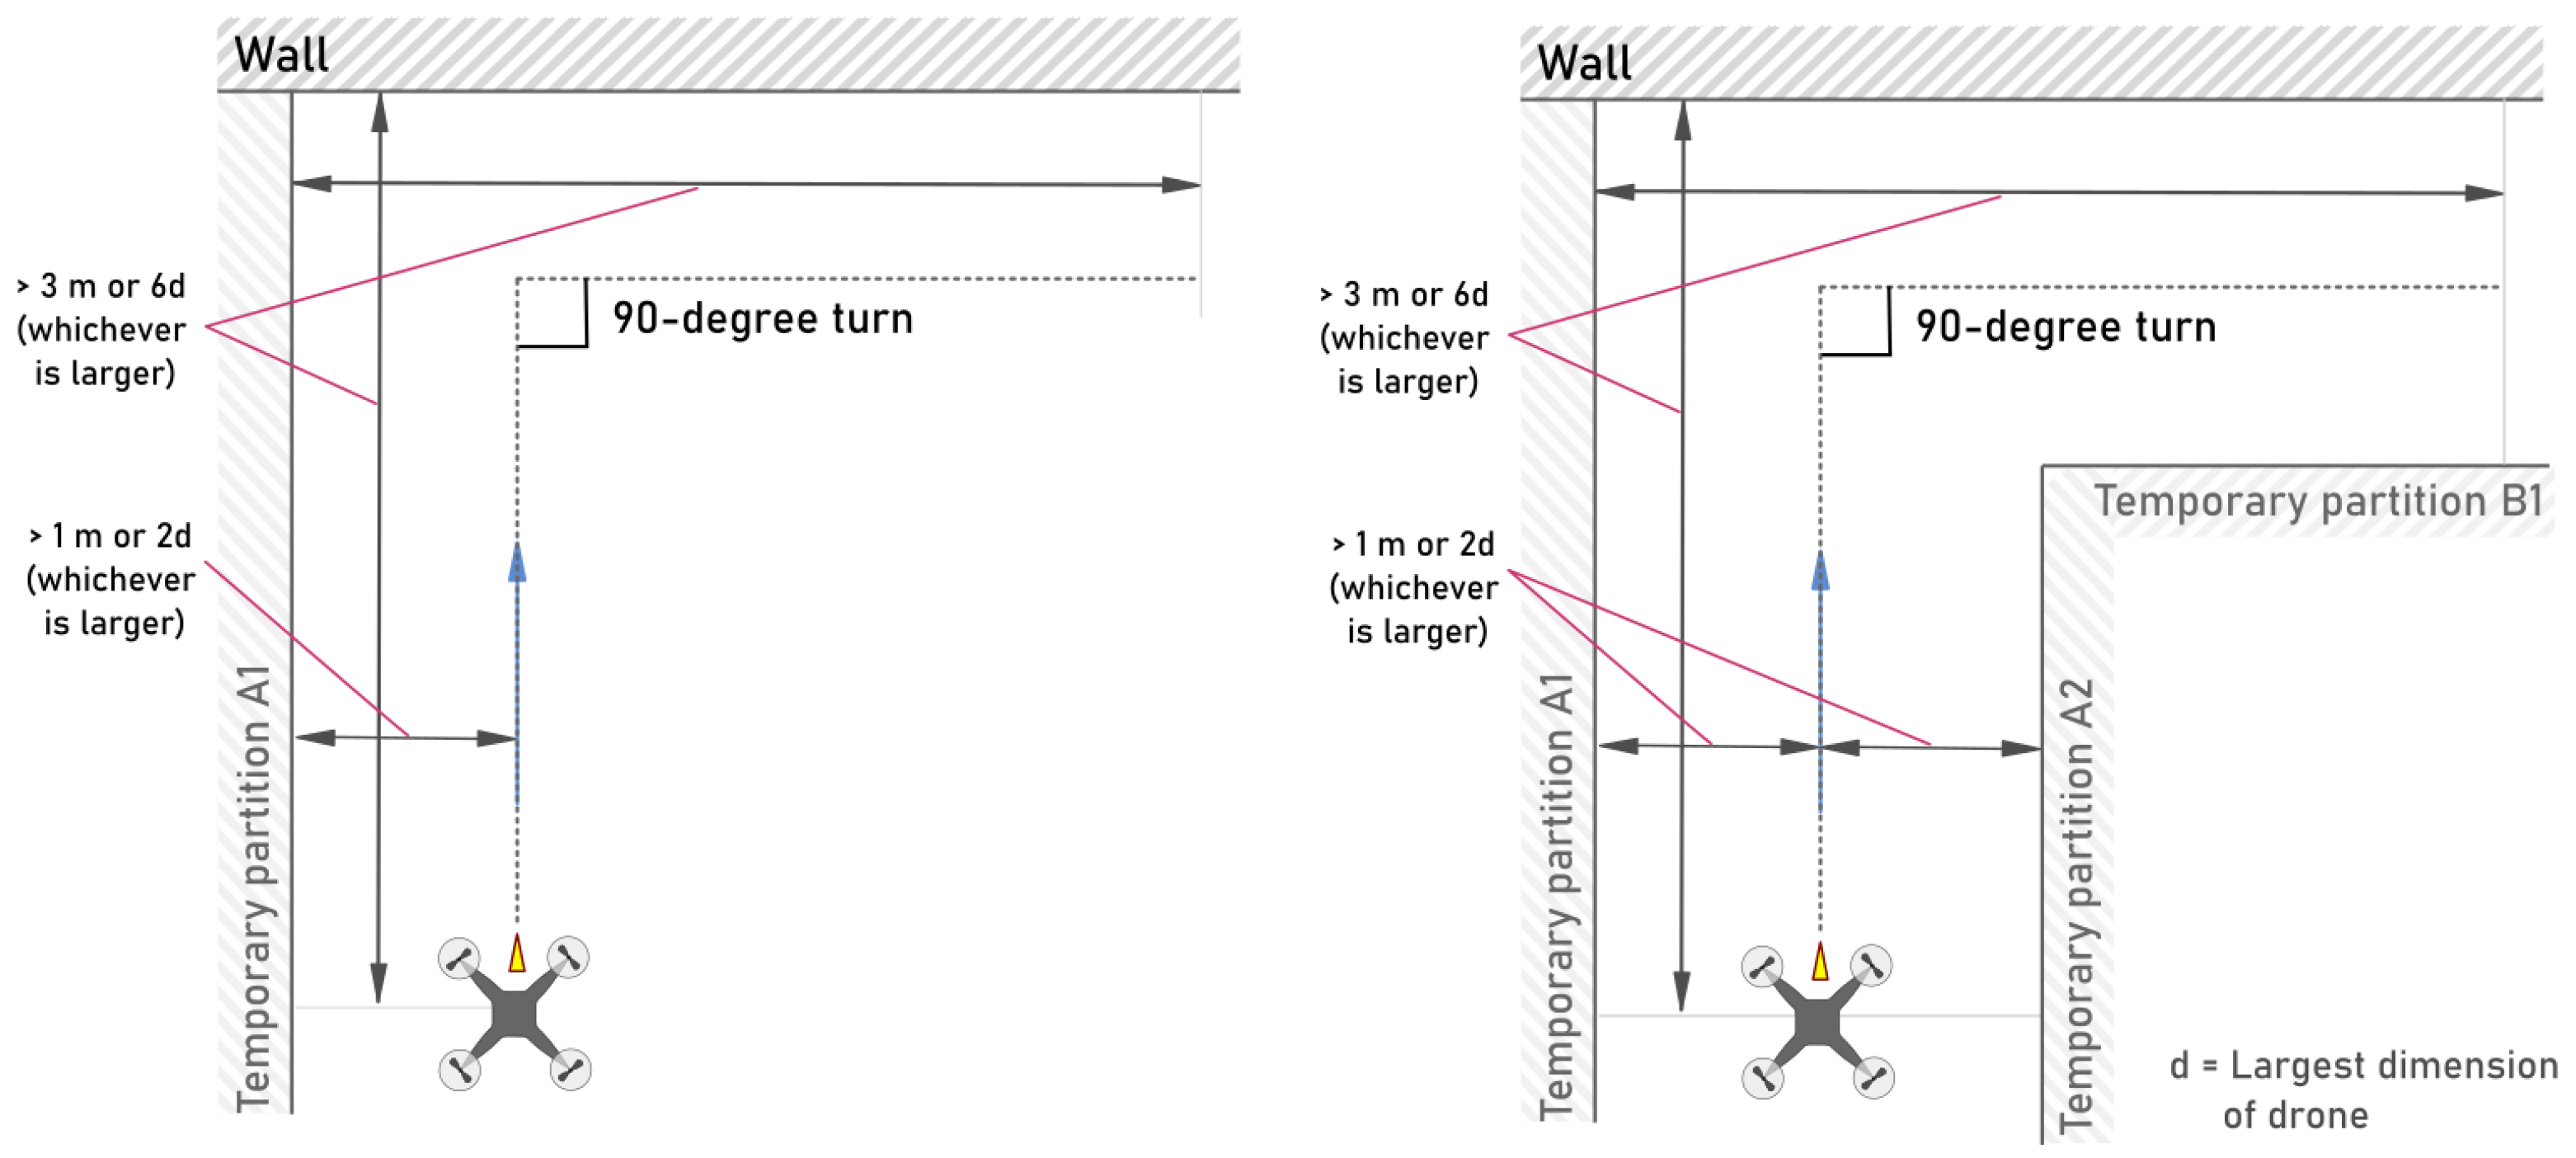
3.2.4. Corner Navigation
This test examines the ability of the sUAS to navigate a space with turns (such as a hallway corridor) and comes in two variants. In the first variant, there is only a wall close to one side of the drone; in the second variant, the drone is enclosed on both sides, as in a hallway configuration. In these tests, the walls are placed either within 1 m of the drone or within
on either side, where
d represents the largest dimension of the sUAS platform. The drone takes off at this distance from the wall(s) and then flies a distance of no less than
forward before taking a 90-degree turn and continuing in the new direction. This is illustrated in
Figure 7.
The first variant is considered confined (i.e., the path is enclosed by walls on both sides), while the second is considered open. In the hallway corner navigation test (the confined variant), the sUAS takes off from a location that is equidistant from temporary partitions forming the corridor (as shown in
Figure 7), flies forward for a distance no less than
, turns in place by 90 degrees, and proceeds further in the corridor for a distance no less than
. In the open corner navigation test, the sUAS takes off from a location that is 0.5 m from the wall (tests at other distances may also be performed), flies forward for a distance no less than
, turns in place by 90 degrees, and continues further in the corridor for a distance no less than
. The difference between the two tests relates to the effect of eddy currents on flight path deviation (as observed in the wall-following tests). The completely closed test allows the eddy current effect to be greater due to the more enclosed environment, and the resulting differences in path deviation can then be monitored.
Figure 7.
Test apparatus for open corner navigation test [
19]. Yellow arrows represent the forward orientation of the sUAS, blue arrows indicate the direction of travel, and dotted line indicates the ideal path of traversal. ©2022 IEEE. Reprinted with permission from E. Meriaux and K. Jerath, “Evaluation of Navigation and Trajectory-following Capabilities of Small Unmanned Aerial Systems,” 2022 IEEE International Symposium on Technologies for Homeland Security (HST), Boston, MA, USA, 2022.
3.2.5. Aperture Navigation
This test examines the ability of the sUAS to navigate through an aperture to reach a destination. In real-world applications, drones operating in underground environments often need to fly through small spaces and openings. This test evaluates whether the sUAS’s flight path is affected by flying through such apertures. The evaluation is conducted in two cases with different aperture sizes. In the first case, the aperture is a square whose side length is 1.5 times the diameter of the sphere that circumscribes the drone; in the second case, the aperture is 2 times this diameter. For a drone with a rectangular configuration, the diameter is defined as the diagonal distance from one corner to the furthest corner. In each test, a drone takes off 1 m from the aperture, flies through it, and then lands 1 m on the other side.
3.2.6. Evaluation Metrics
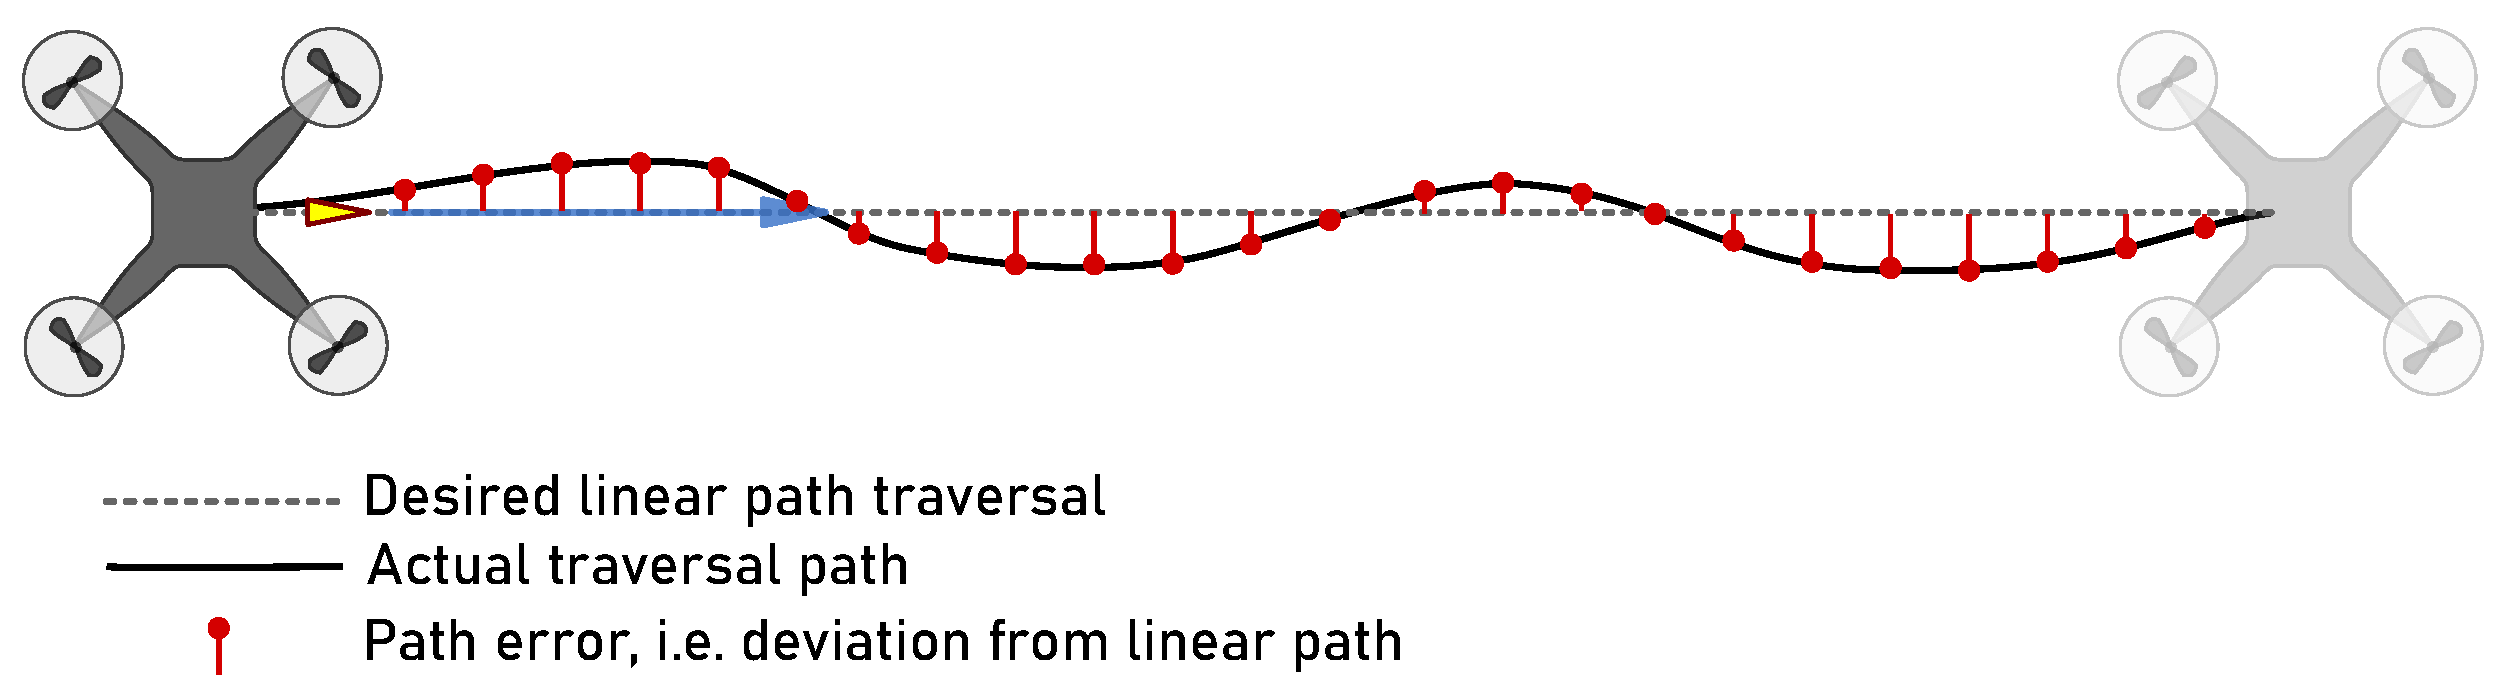
We propose the following evaluation metrics: (a) average path error, (b) standard deviation of path error, (c) average waypoint landing accuracy, and (d) standard deviation of waypoint landing accuracy. All metrics are measured in meters. The path error (
e) for a single test flight of a given sUAS is defined as follows:
where
represents the distance between the sUAS’s position at time instant
k and the nearest point on the desired trajectory. This measures the deviation of the sUAS from the desired path at that moment. Since most of the proposed tests involve linear traversals, this distance typically represents the perpendicular distance from the sUAS’s current position to the trajectory (illustrated in
Figure 8). The average is taken over all
N measurements recorded during the flight, representing the path error (
e) for a single test flight of the sUAS. The standard deviation (
) of the path error for a single test flight is defined as
Each test in our evaluation methodology is repeated five (5) times. Therefore, the average path error (
) and the average standard deviation (
) for an evaluated sUAS are defined as
where
is the path error for the
ith test flight, and
is the standard deviation of the path error for the
ith test flight. These metrics are calculated for each test category (i.e., wall following, linear path traversal, and corner navigation). Similarly, we measure the distance from the desired waypoint to the final landing point of the sUAS, with
representing the radial distance for flight
i. After five (5) test flights, the average waypoint landing accuracy (
) is calculated as
This data are then aggregated across all test flights and visualized using box-and-whisker plots to show the distribution of landing distances. Evaluated metrics are discussed in
Section 5, and the following section outlines the apparatus and equipment requirements. Two examples of departure computation are given in
Figure 9 and
Figure 10, with desired path shown in red and the path of the other drones shown alongside.
Figure 8.
Path error is evaluated using deviations that are perpendicular to the desired linear trajectory [
19]. Yellow arrows represent the forward orientation of the sUAS, and blue arrows indicate the direction of travel. ©2022 IEEE. Reprinted with permission from E. Meriaux and K. Jerath, “Evaluation of Navigation and Trajectory-following Capabilities of Small Unmanned Aerial Systems,” 2022 IEEE International Symposium on Technologies for Homeland Security (HST), Boston, MA, USA, 2022.
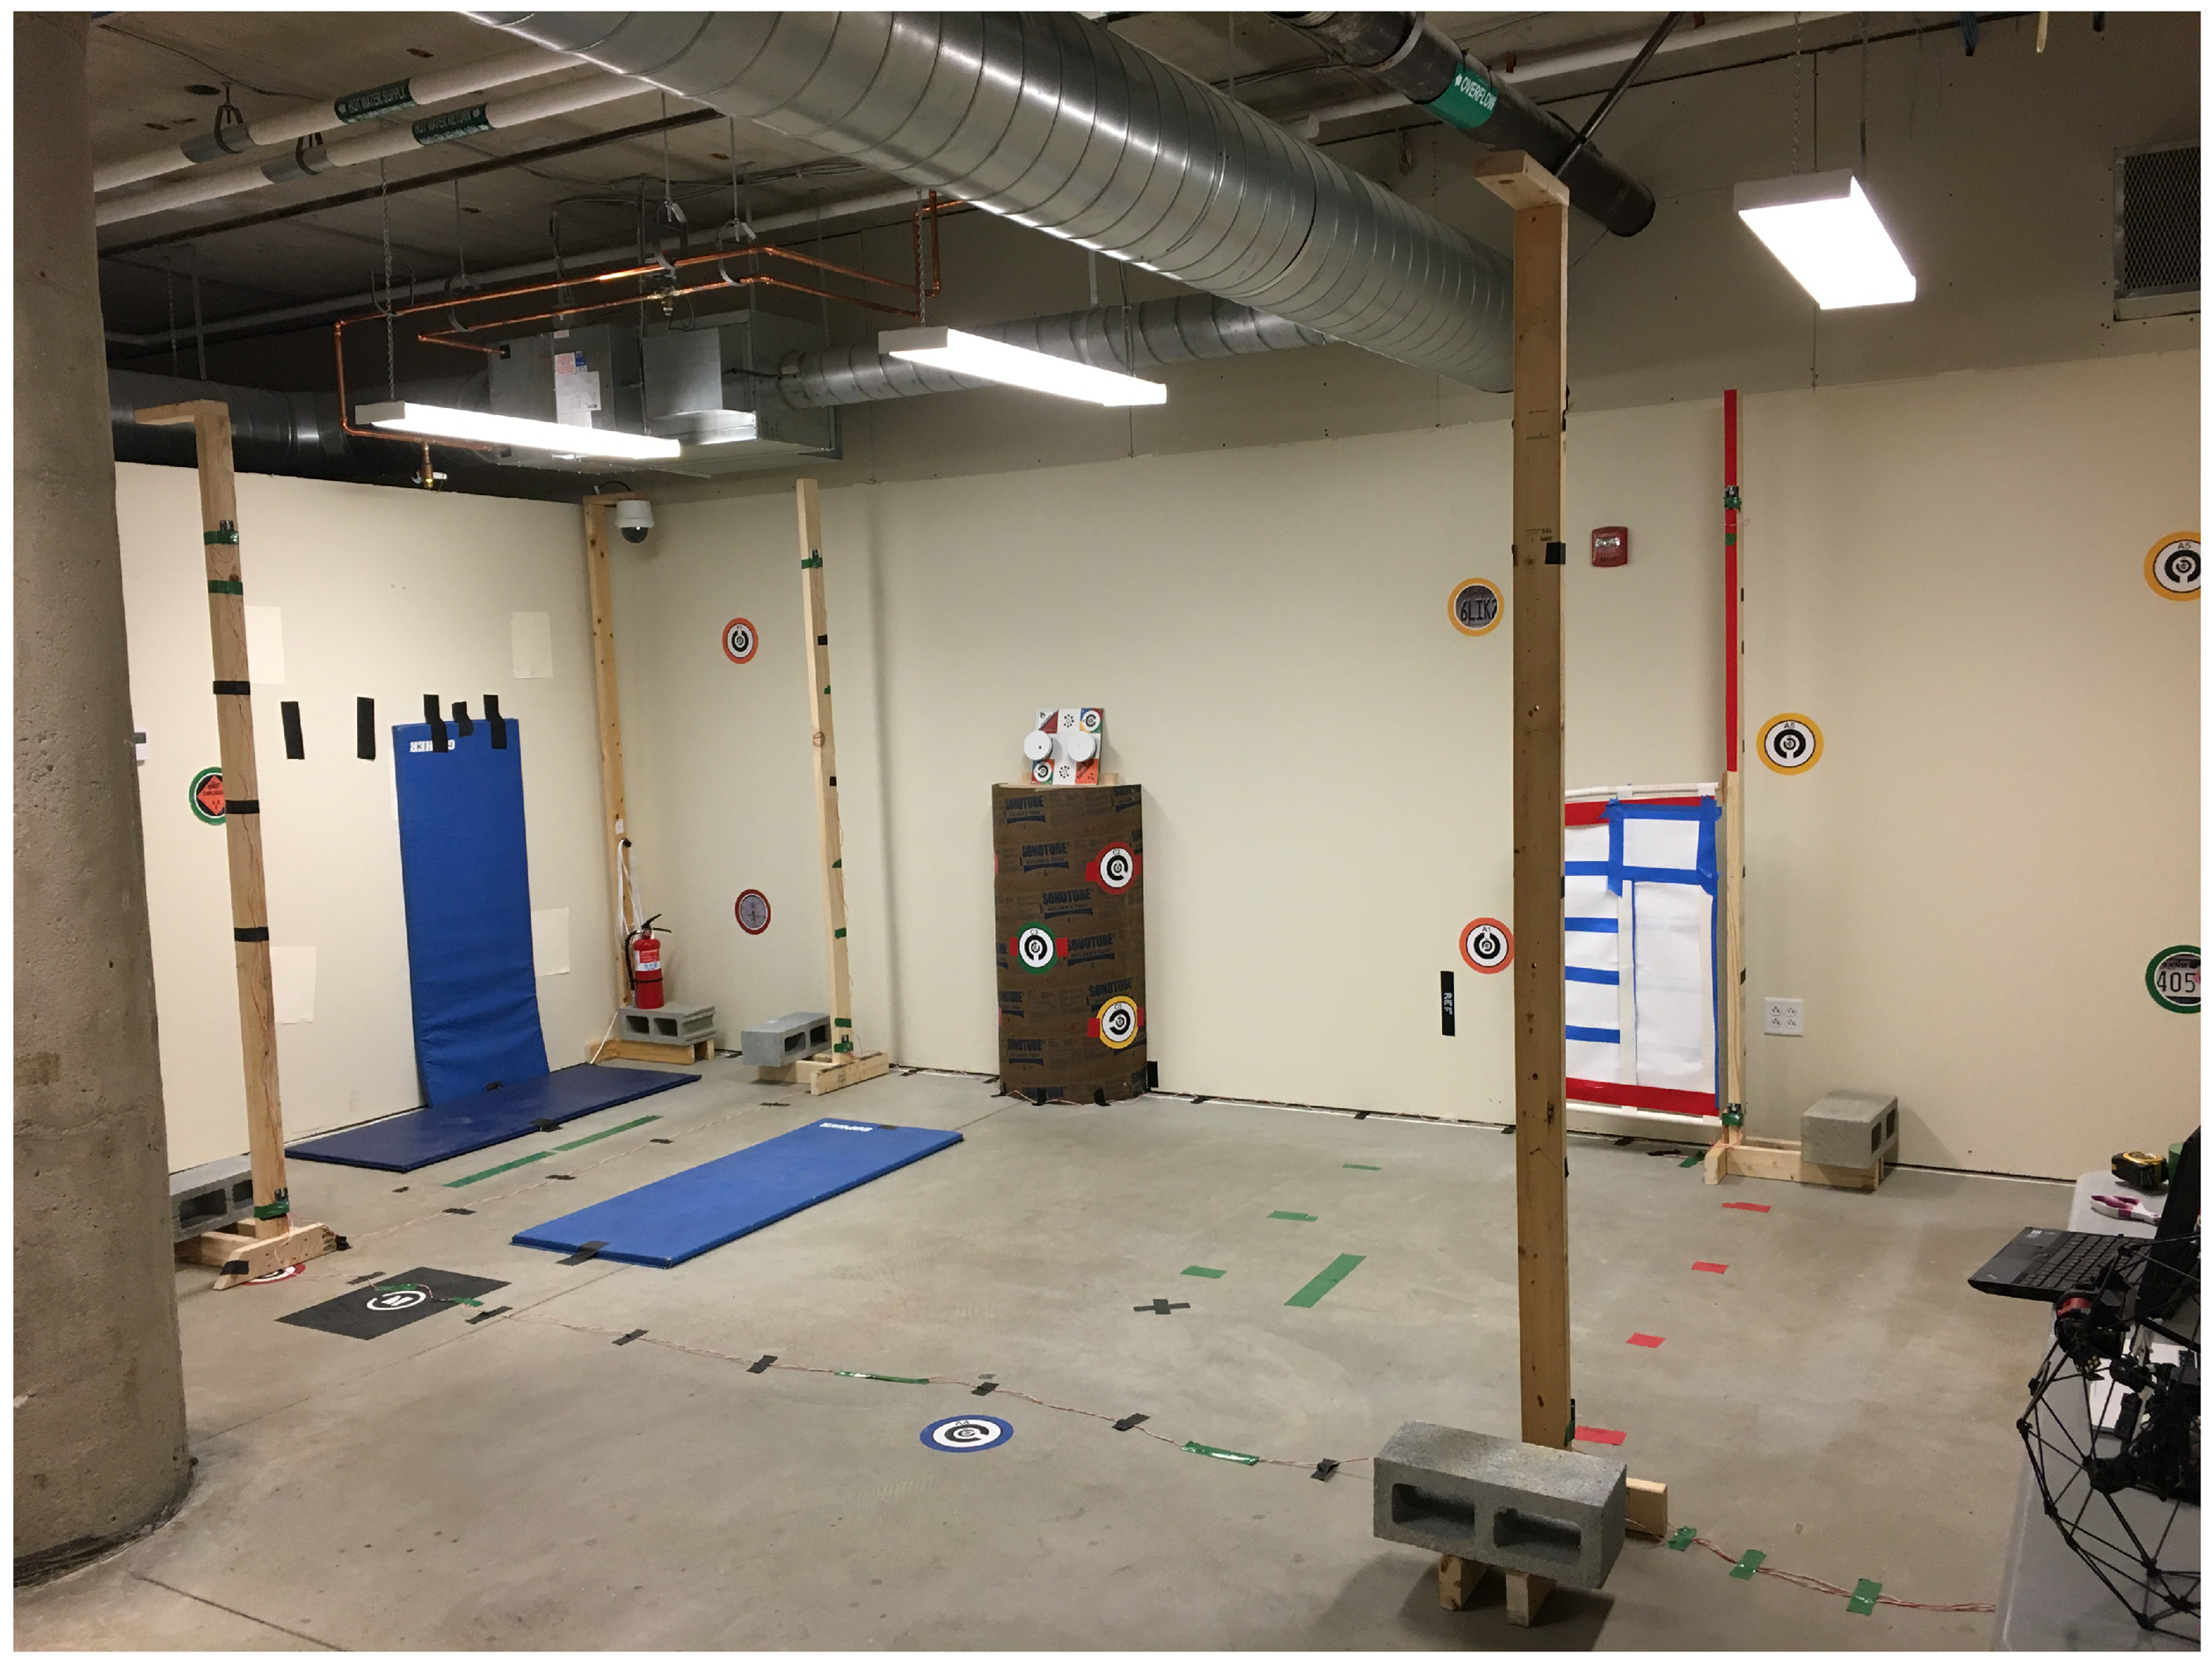
4. Environment and Data Collection Methodology
In this section, we discuss the configuration settings of the flight test environment, as well as the position tracking setup used to record the sUAS pose measurements. An external pose tracking solution is essential for maintaining a fair comparison between platforms, and to mitigate any limitations or advantages offered by internal platform-specific localization capabilities.
4.1. Apparatus and Artifacts
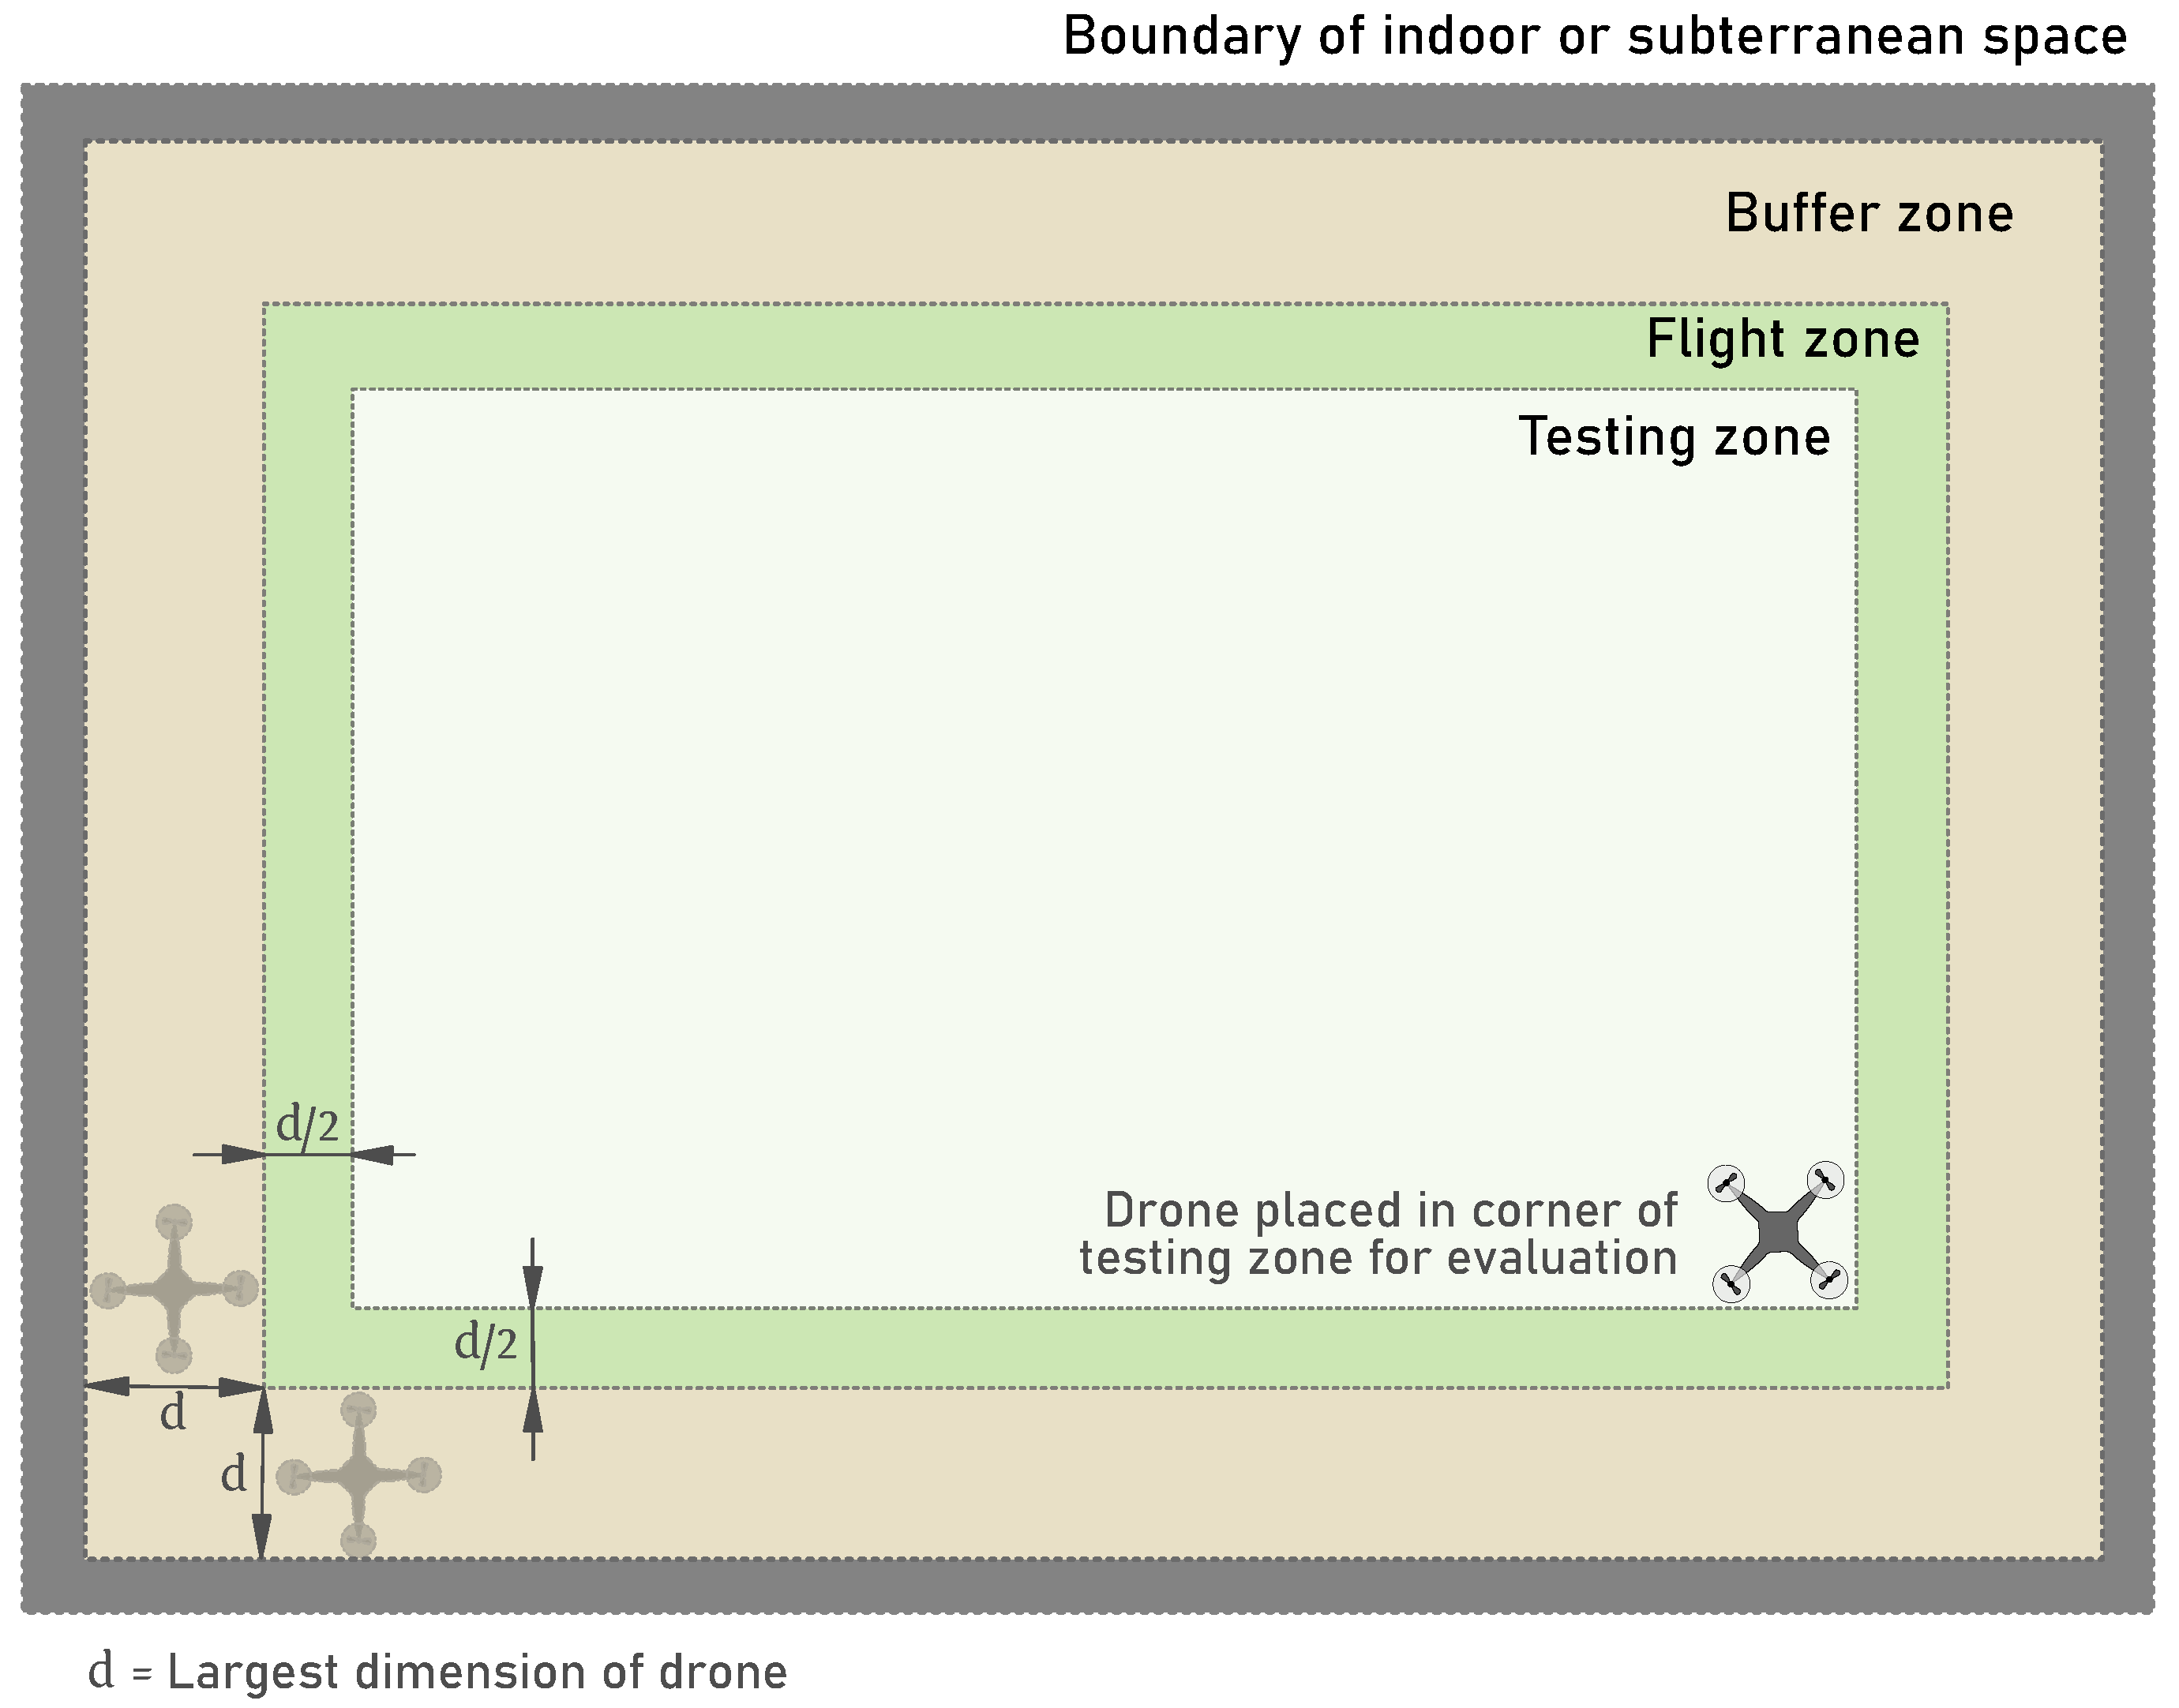
The environment for conducting the evaluation is bounded by walls (as shown in
Figure 11 and
Figure 12) to form a free space with dimensions of at least
. This must be an indoor space, meaning it is inside a building enclosed by four walls and a roof. A building constructed from concrete is preferable to one made of wood, and an underground space is even better than concrete. This setup allows for the most accurate replication of a real subterranean use case.
The area is divided into three zones: a buffer zone (a wide band around the outer edge), a flight zone (, which is the remaining space outside of the buffer zone), and a testing zone within the flight zone (). All dimensions provided are minimum measurements. The buffer zone must be free from any obstructions. Use of metal in the space needs to be minimized as much as possible, as this can interfere with the data collection apparatus. Wood is preferred over metal to avoid these issues.
The space must be in a location without GPS access. This is feasible in indoor or underground spaces with concrete walls. The drone must not have any GPS connection during the tests, to ensure it does not rely on GPS-dependent data. Once the space has been confirmed to be GPS-free, it should be checked for any potential jamming frequencies. No devices should operate at the same frequency as the drones. This was an issue during our testing, where a drone and the sensor apparatus interfered with each other due to frequency overlap.
The temporary partitions must be tall enough to ensure that the sUAS always operates at a height lower than that of the partitions. They can be constructed from any readily available stiff material, such as wood or corrugated cardboard. Ensure that temporary partition B1 is parallel to the wall and separated by at least 2 m or
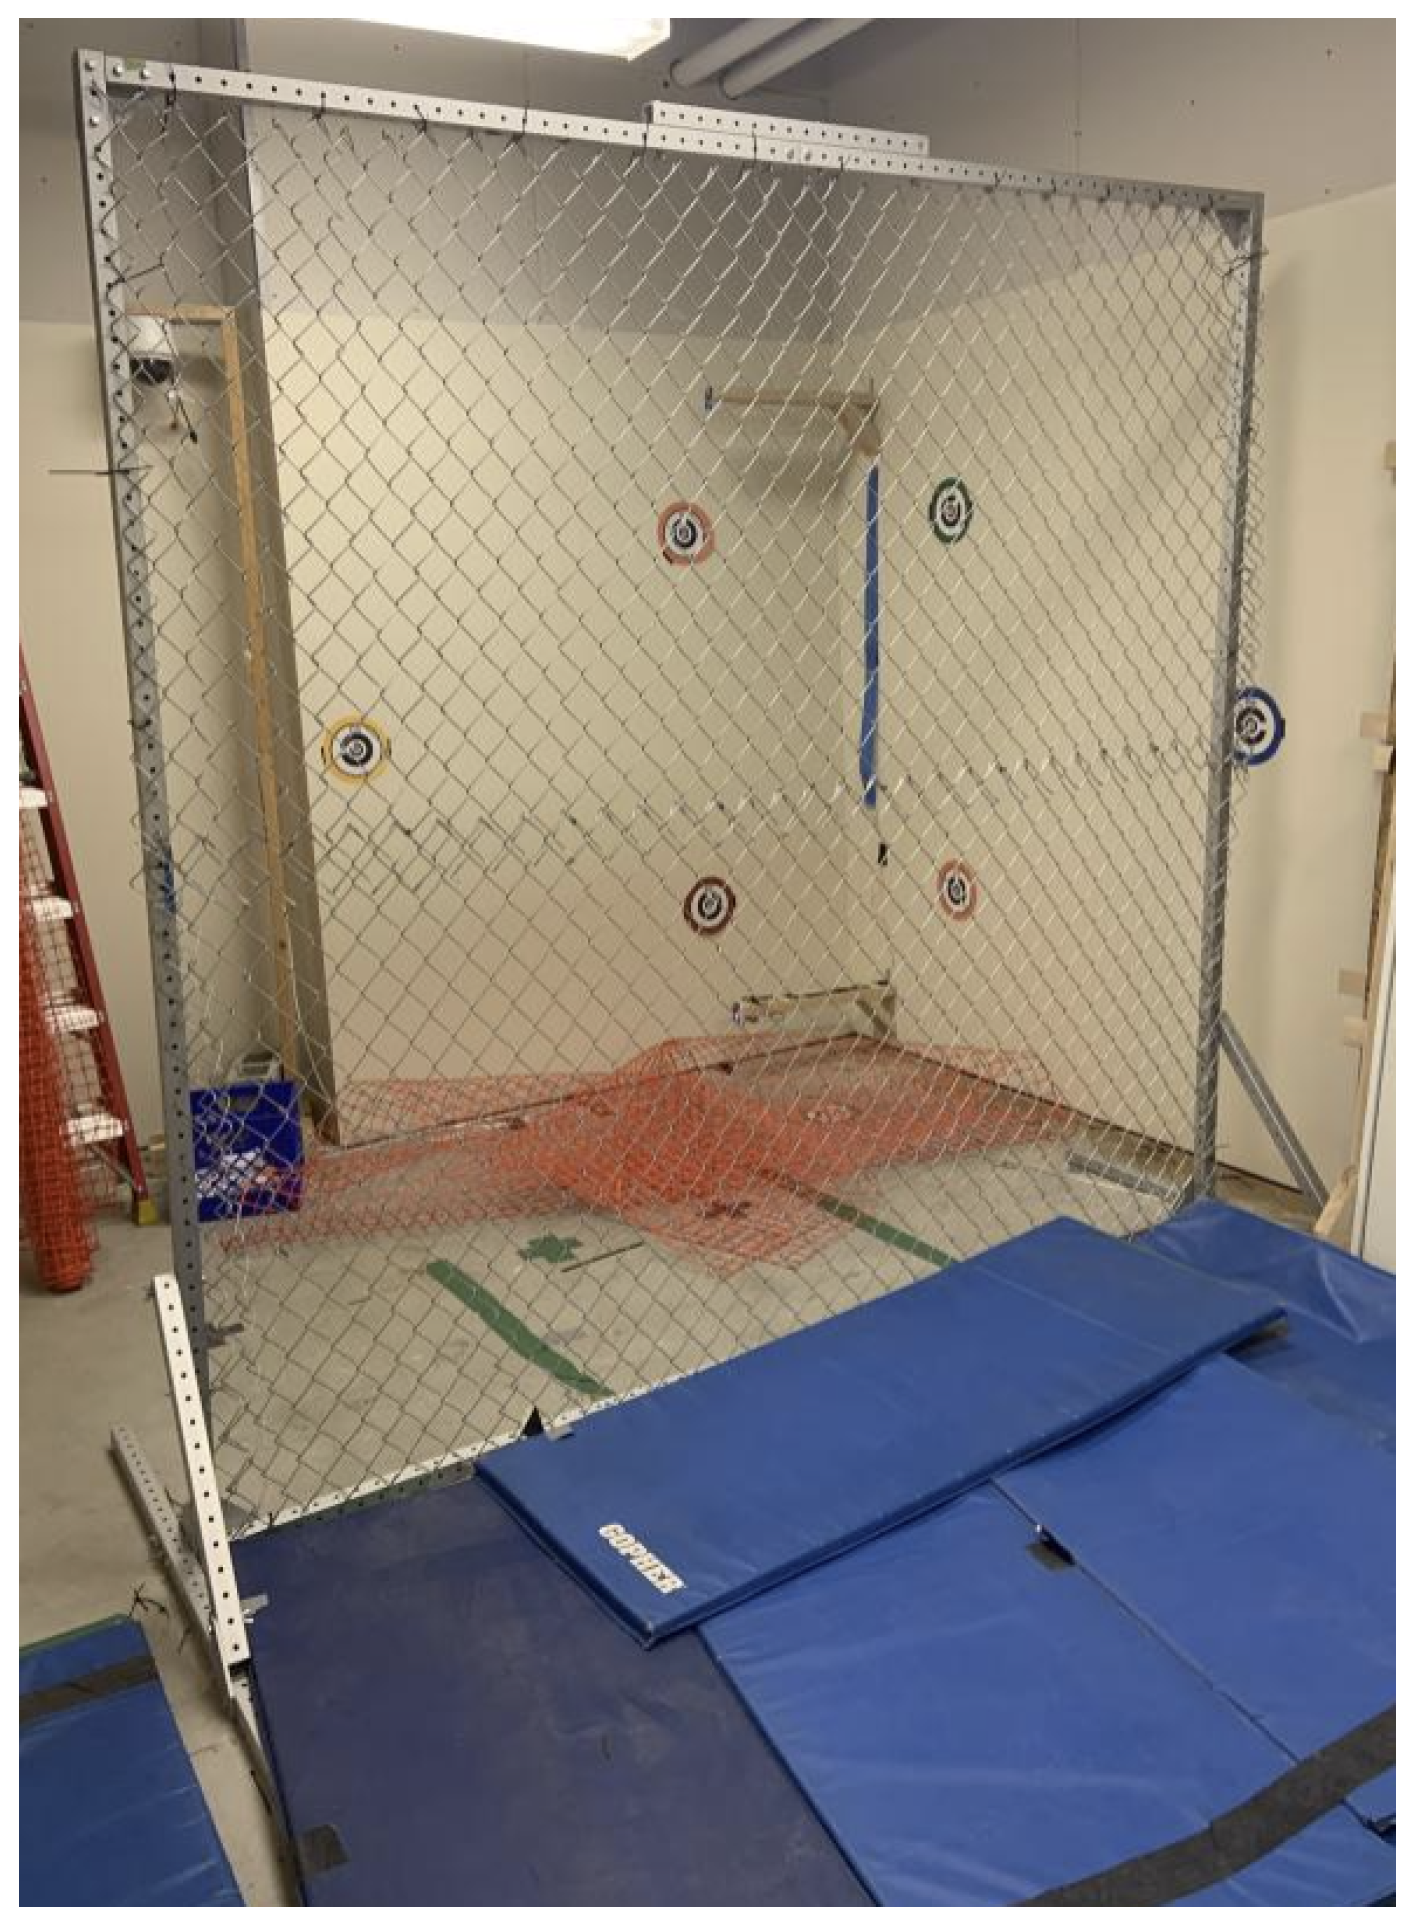
(whichever is larger). If necessary, the wall can be replaced with another temporary partition, B2. From the perspective of the aperture test, a square aperture placed in the center of a wooden frame is used, which allows the sUAS to pass through (
Figure 13). This is representative of window-like obstacles that an sUAS might encounter in an indoor or subterranean environment. The square aperture is modular in nature so that it can be reconfigured for two different tests, as mentioned in
Section 3.2.5.
Figure 11.
Schematic describing the dimensional requirements of the test flight area [
19]. ©2022 IEEE. Reprinted with permission from E. Meriaux and K. Jerath, “Evaluation of Navigation and Trajectory-following Capabilities of Small Unmanned Aerial Systems,” 2022 IEEE International Symposium on Technologies for Homeland Security (HST), Boston, MA, USA, 2022.
Figure 12.
Indoor/subterranean test flight zone used for the experiments [
19]. ©2022 IEEE. Reprinted with permission from E. Meriaux and K. Jerath, “Evaluation of Navigation and Trajectory-following Capabilities of Small Unmanned Aerial Systems,” 2022 IEEE International Symposium on Technologies for Homeland Security (HST), Boston, MA, USA, 2022.
Figure 13.
Test aperture with a modular sized hole so that drones of multiple sizes can be used.
Figure 13.
Test aperture with a modular sized hole so that drones of multiple sizes can be used.
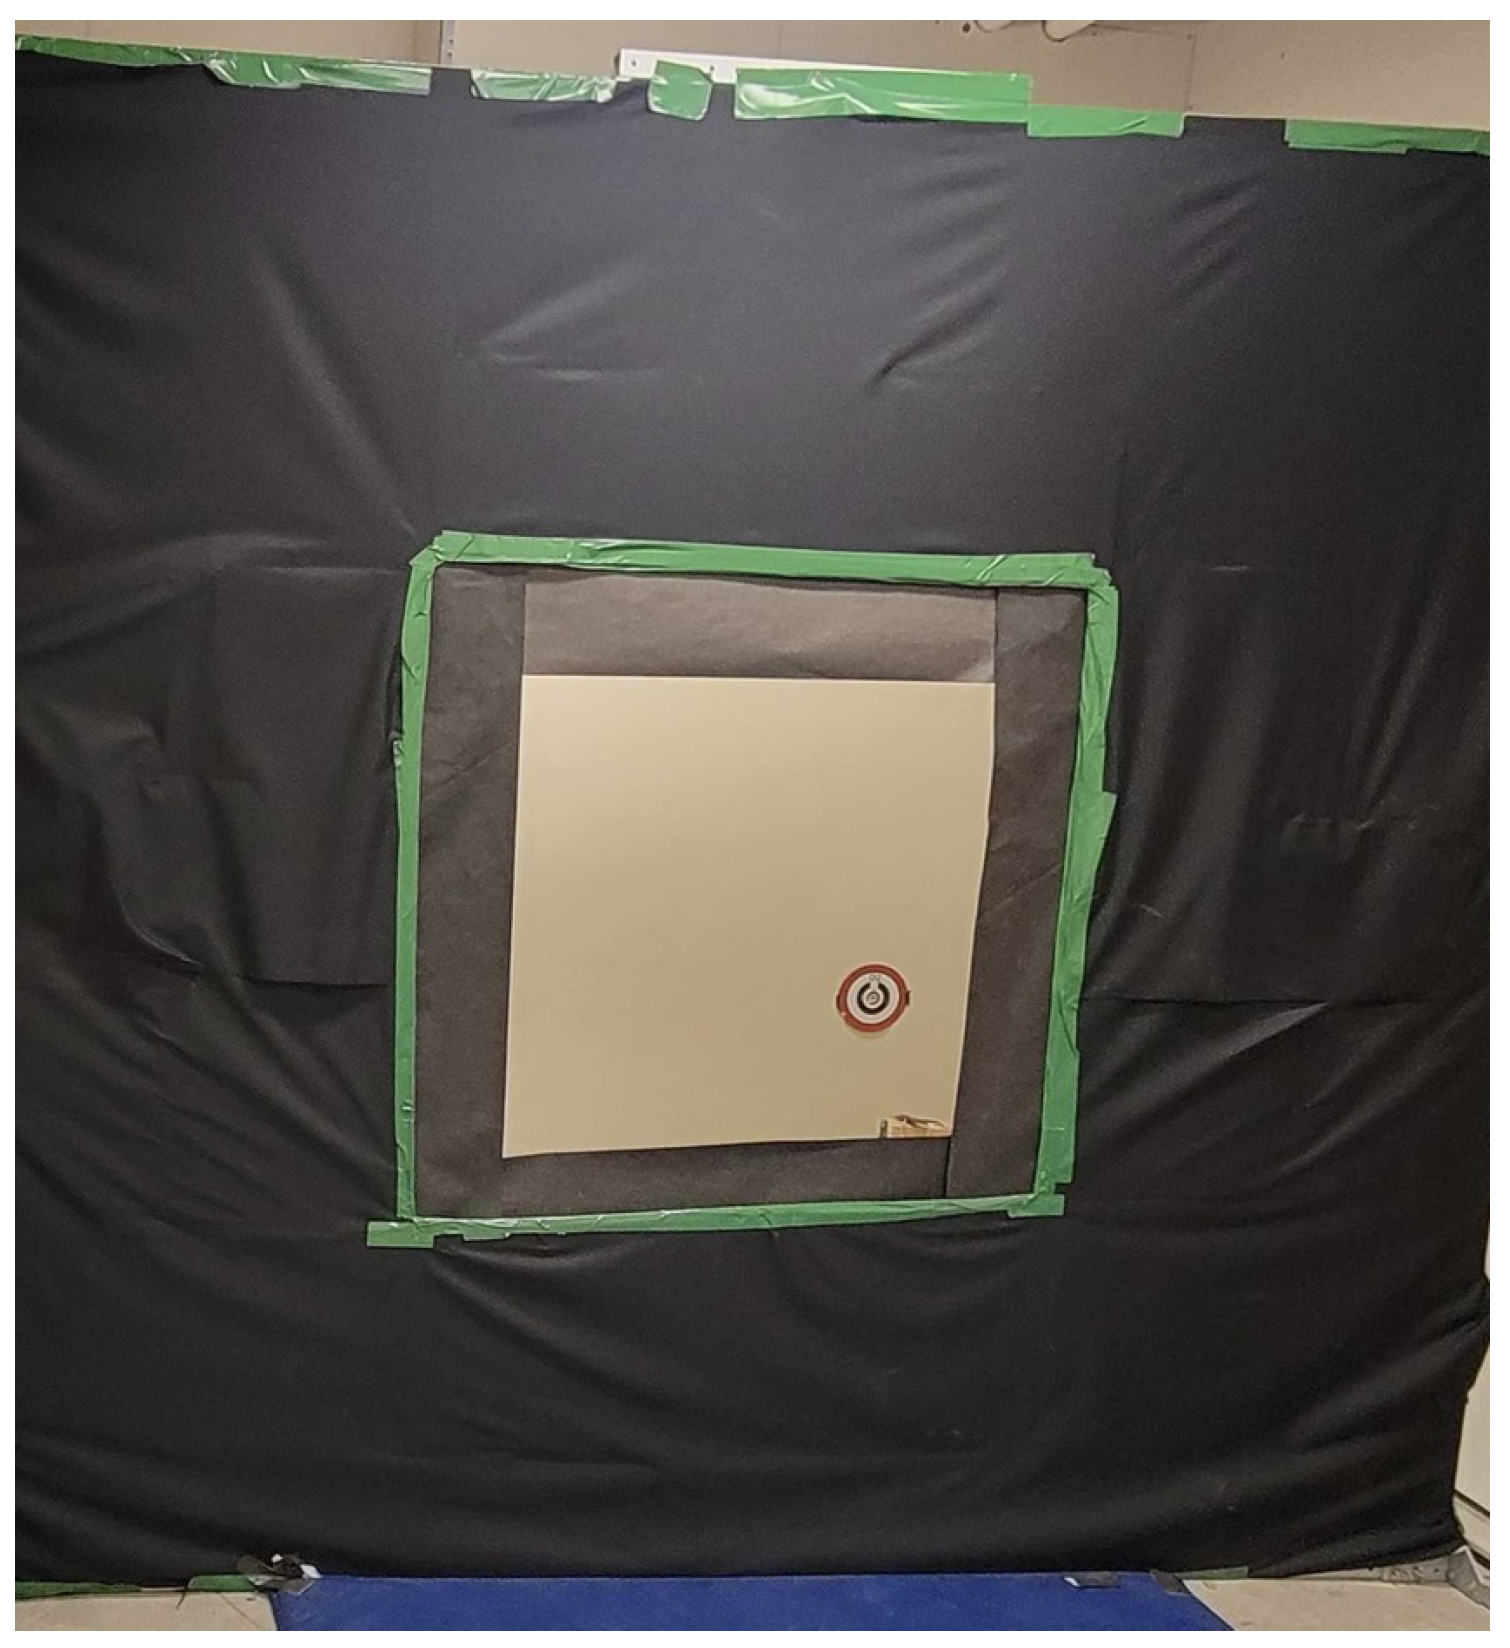
4.2. Obstacle Structures
In the collision tolerance tests, three different material types are used: drywall, mesh, and chain link. These materials need to be set up in the test space. Since the room where this test is conducted has walls made of drywall, the collision tests with drywall take place directly against the wall. For the other two materials, a frame is used, covered with the required material, and the drone flies into the center of this frame, as shown in
Figure 14.
4.3. Position Tracking Equipment
Pose data of the sUAS platforms are collected to measure and evaluate the navigation and trajectory-following performance in each test. When testing multiple drones, a standardized external tracker is required. While some platforms may track and provide their flight positions, these data are based on internal sensors, which can vary in accuracy from drone to drone.
Our work utilized an external tracking system known as the Loco Positioning System (LPS) in conjunction with an optical flow deck, both manufactured by Bitcraze. By using the LPS nodes, which acted as positioning beacons, the LPS deck attached to the sUAS being evaluated, and the optical flow deck to obtain an accurate estimate of the sUAS altitude, we were able to obtain position estimates of the sUAS for all tests. For example,
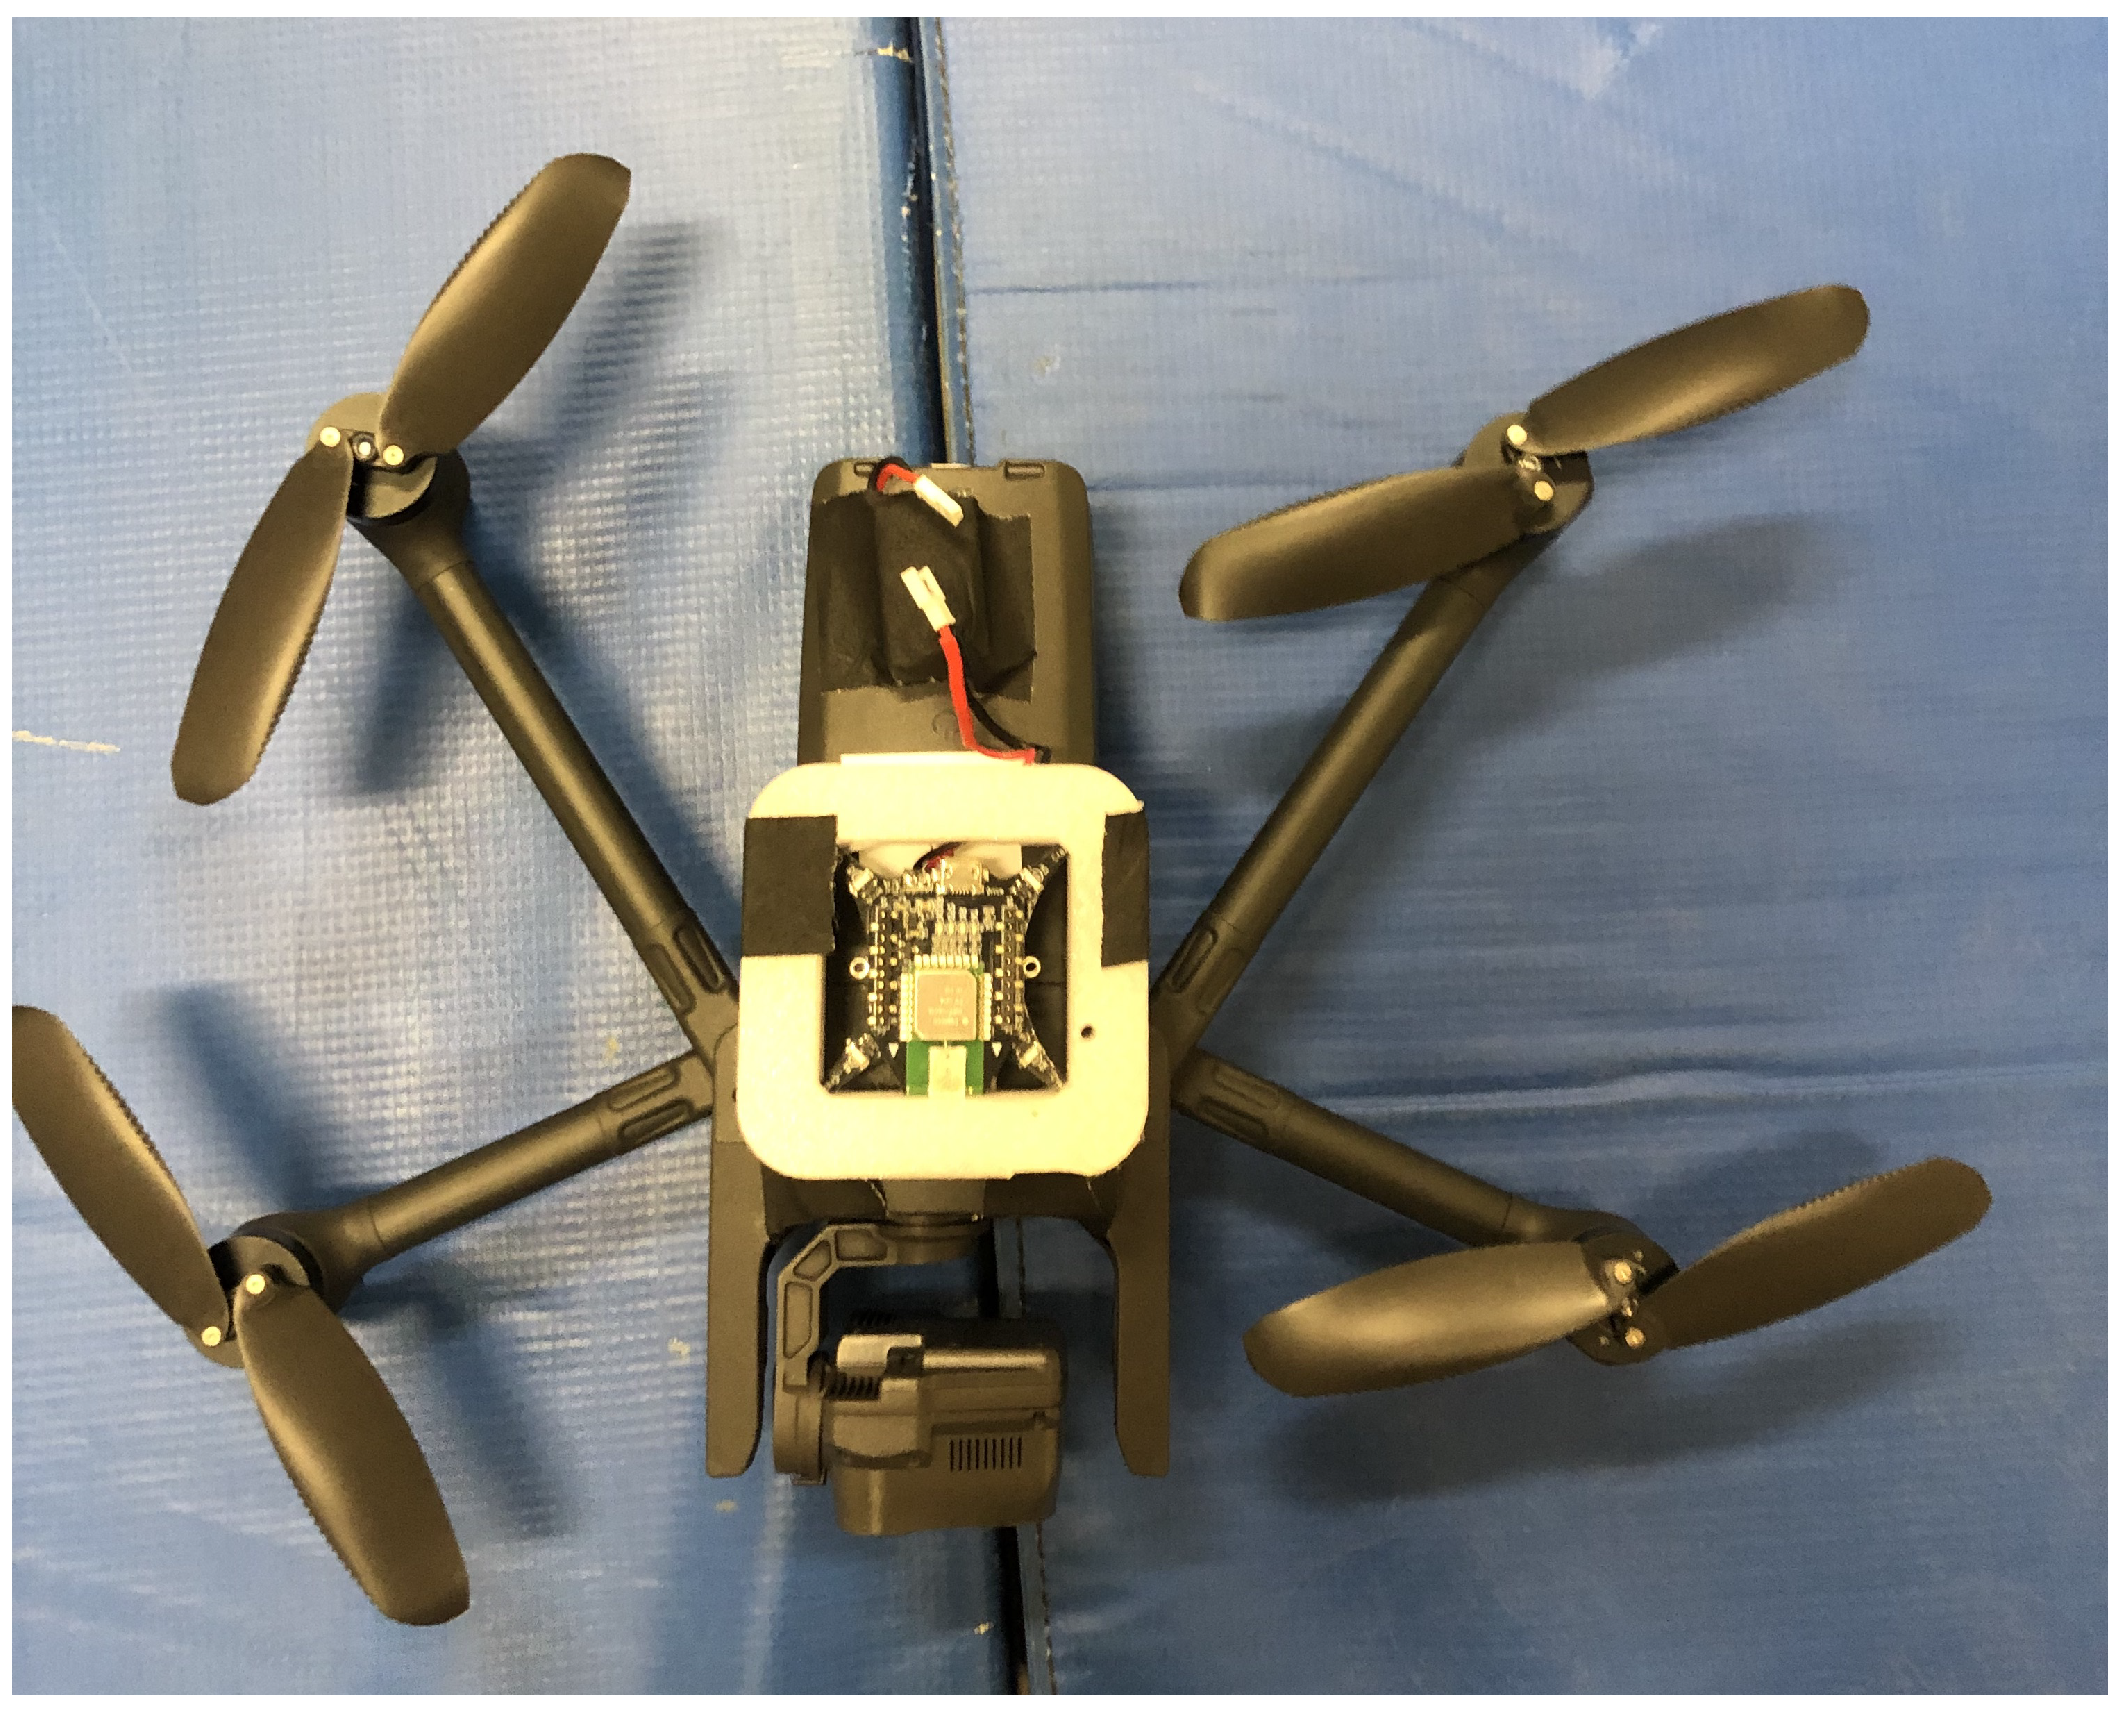
Figure 15 shows the LPS deck (inside the white structural support) mounted to the bottom of a Parrot ANAFI sUAS. Since internal tracking telemetry data are not available for all sUAS systems, our evaluation tests used the LPS external tracking system.
We selected the Loco Positioning System (LPS) as the external tracking system primarily because of its lower cost and ease of set up. Since the evaluation tests occur in a modular, reconfigurable space, having a system that can be quickly set up is beneficial. The LPS nodes were mounted on four wooden poles (visible in
Figure 12), which could be moved, allowing the system to be recalibrated as needed. Another reason for using the LPS system was that its Time Difference of Arrival (TDoA) localization mechanism, operating in the 3.2-7.0 GHz band, does not require line-of-sight, unlike optical position tracking systems. This allowed us to use the position tracking systems in a wider range of test scenarios, such as the corner navigation test or test flights through apertures. However, care must be taken to avoid any interference that may arise from the presence of metallic elements, such as mounting the LPS nodes on metal poles instead of wooden ones.
5. Test Results
We evaluated seven commercially available sUAS platforms for the study of trajectory-following and navigation evaluation: Flyability Elios 2 GOV, Parrot ANAFI USA GOV, Teal Drones Golden Eagle, Vantage Robotics Vesper, Cleo Dronut, Skydio 2 (military version X2D Color/Thermal), and Lumenier Nighthawk. The aggregated and anonymized results of each of the evaluation tests are included in the following discussion, and each drone was randomly given a letter designation from A–G. Over the course of these experiments, a few hundred flights were conducted across the navigation and collision tolerance categories with each different drone, and each test was repeat five times. This was all performed by the same experienced drone pilot.
5.1. Collision Tolerance
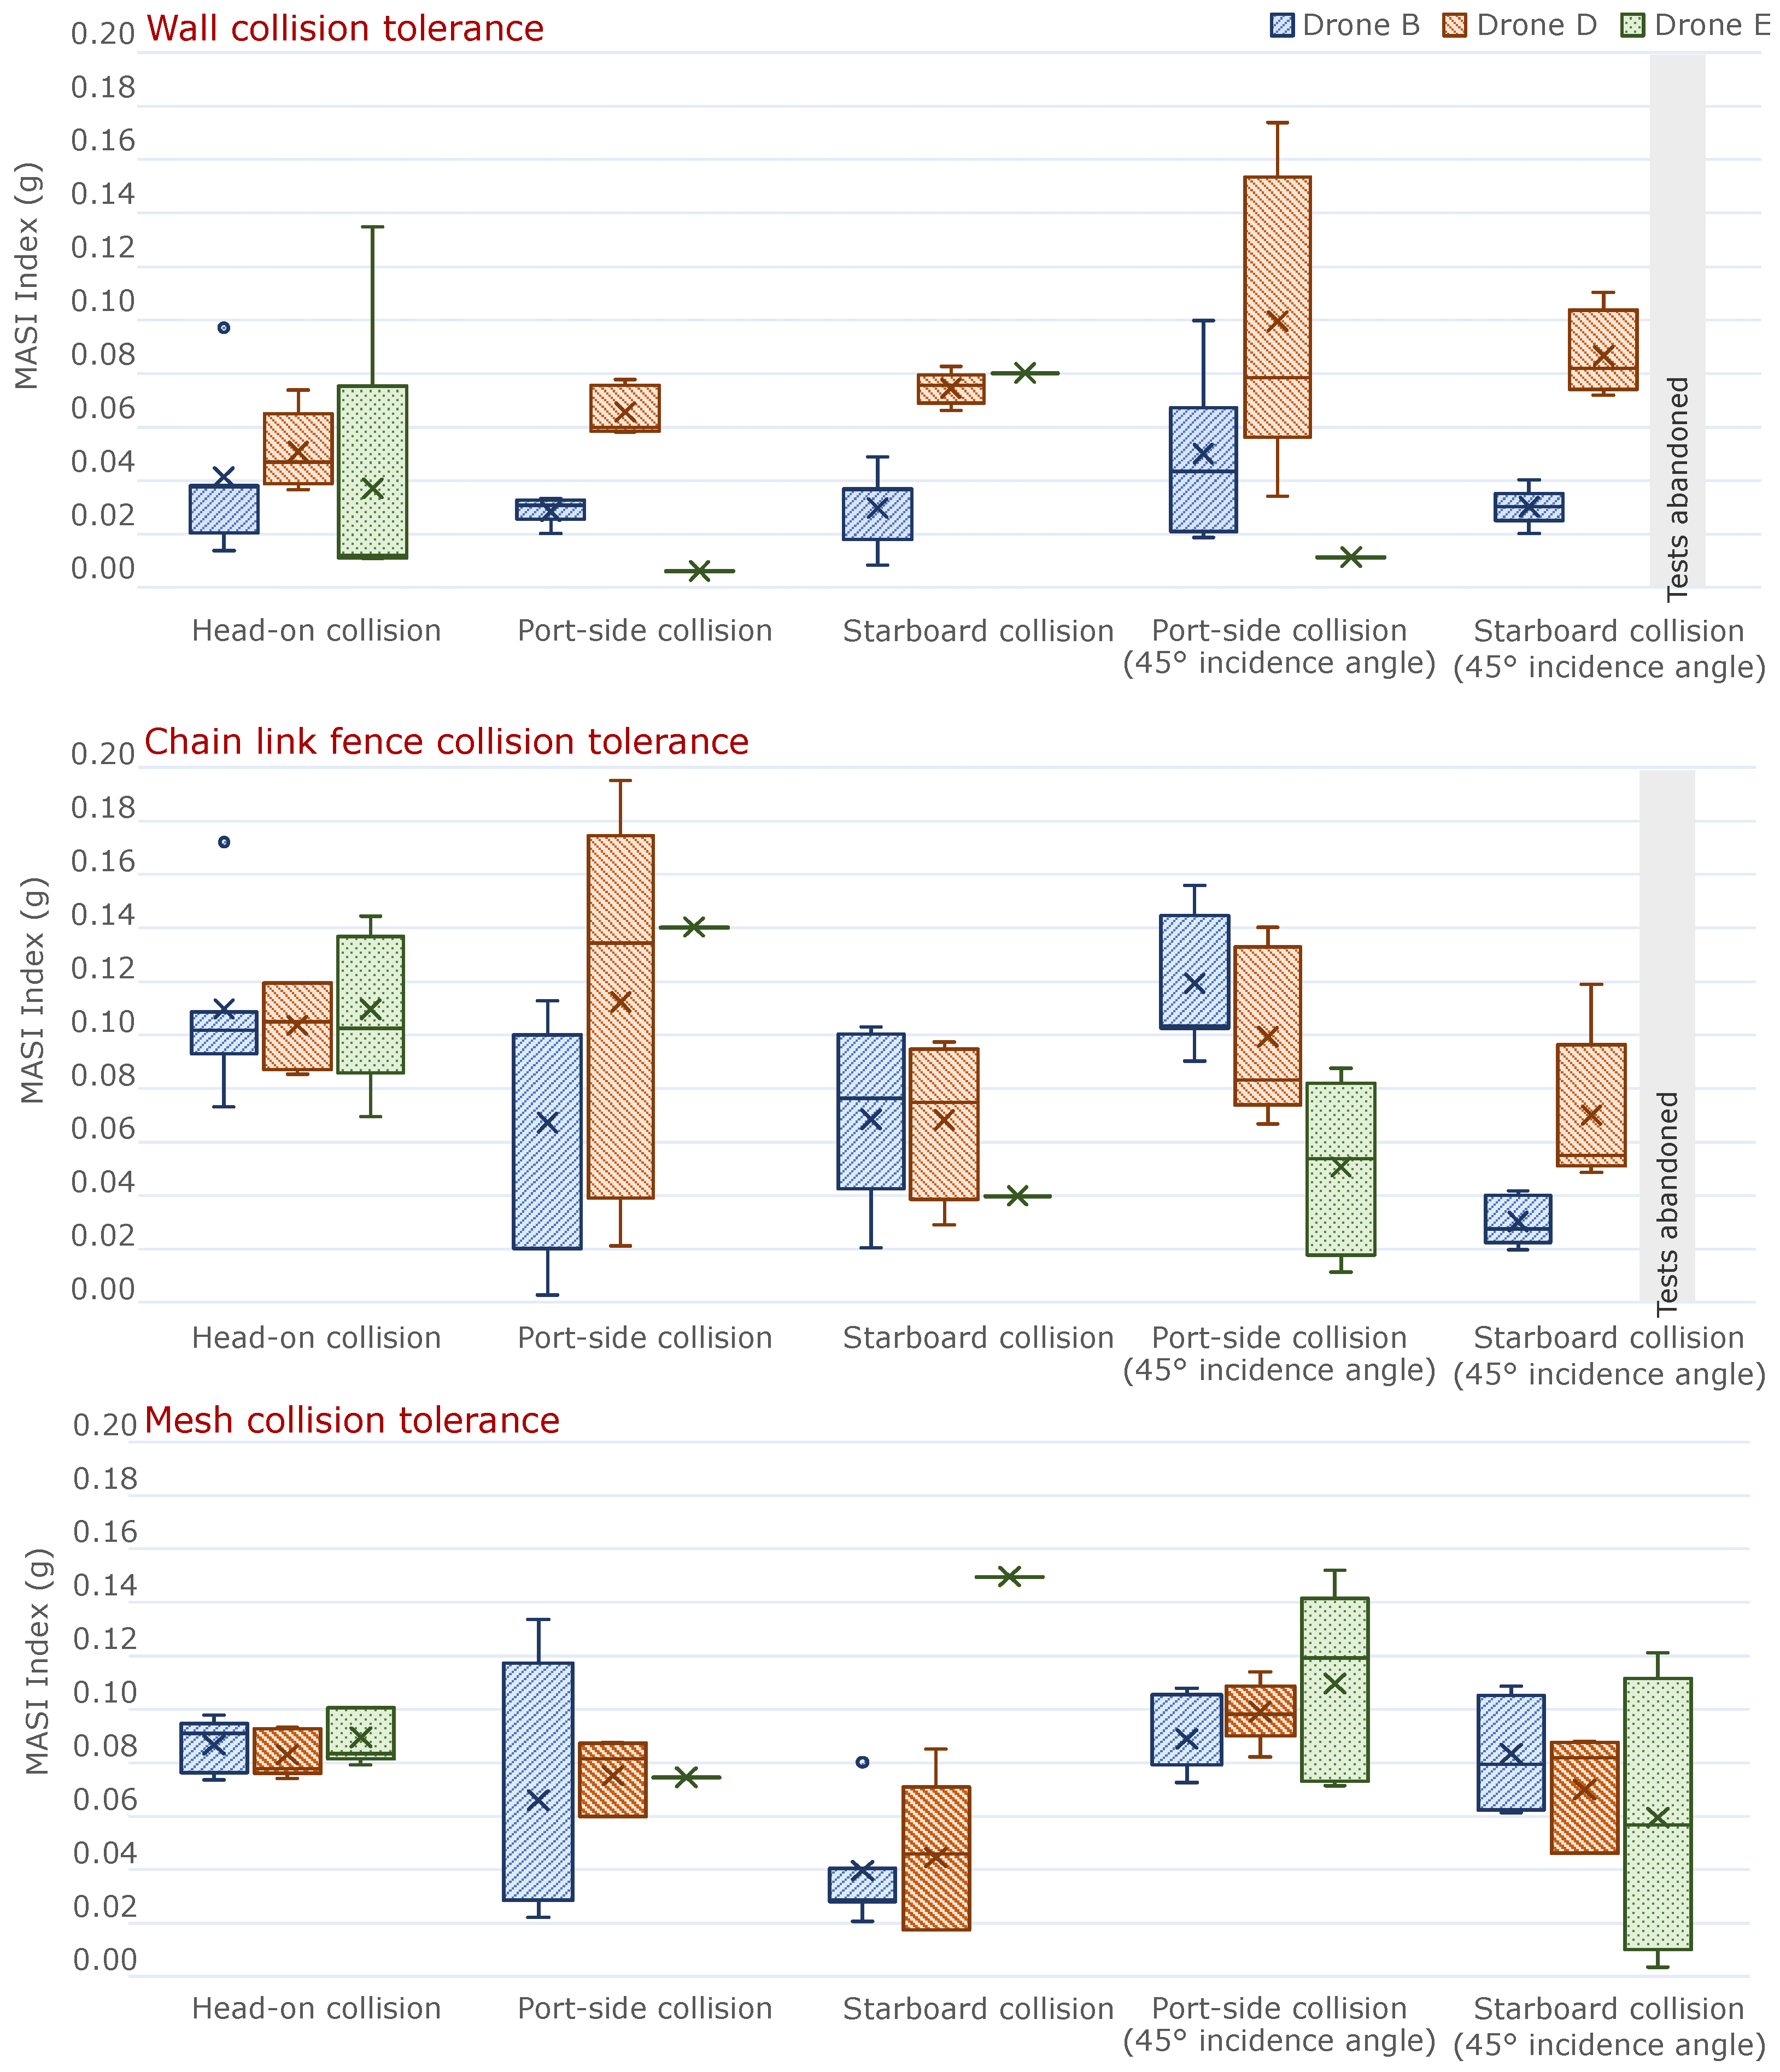
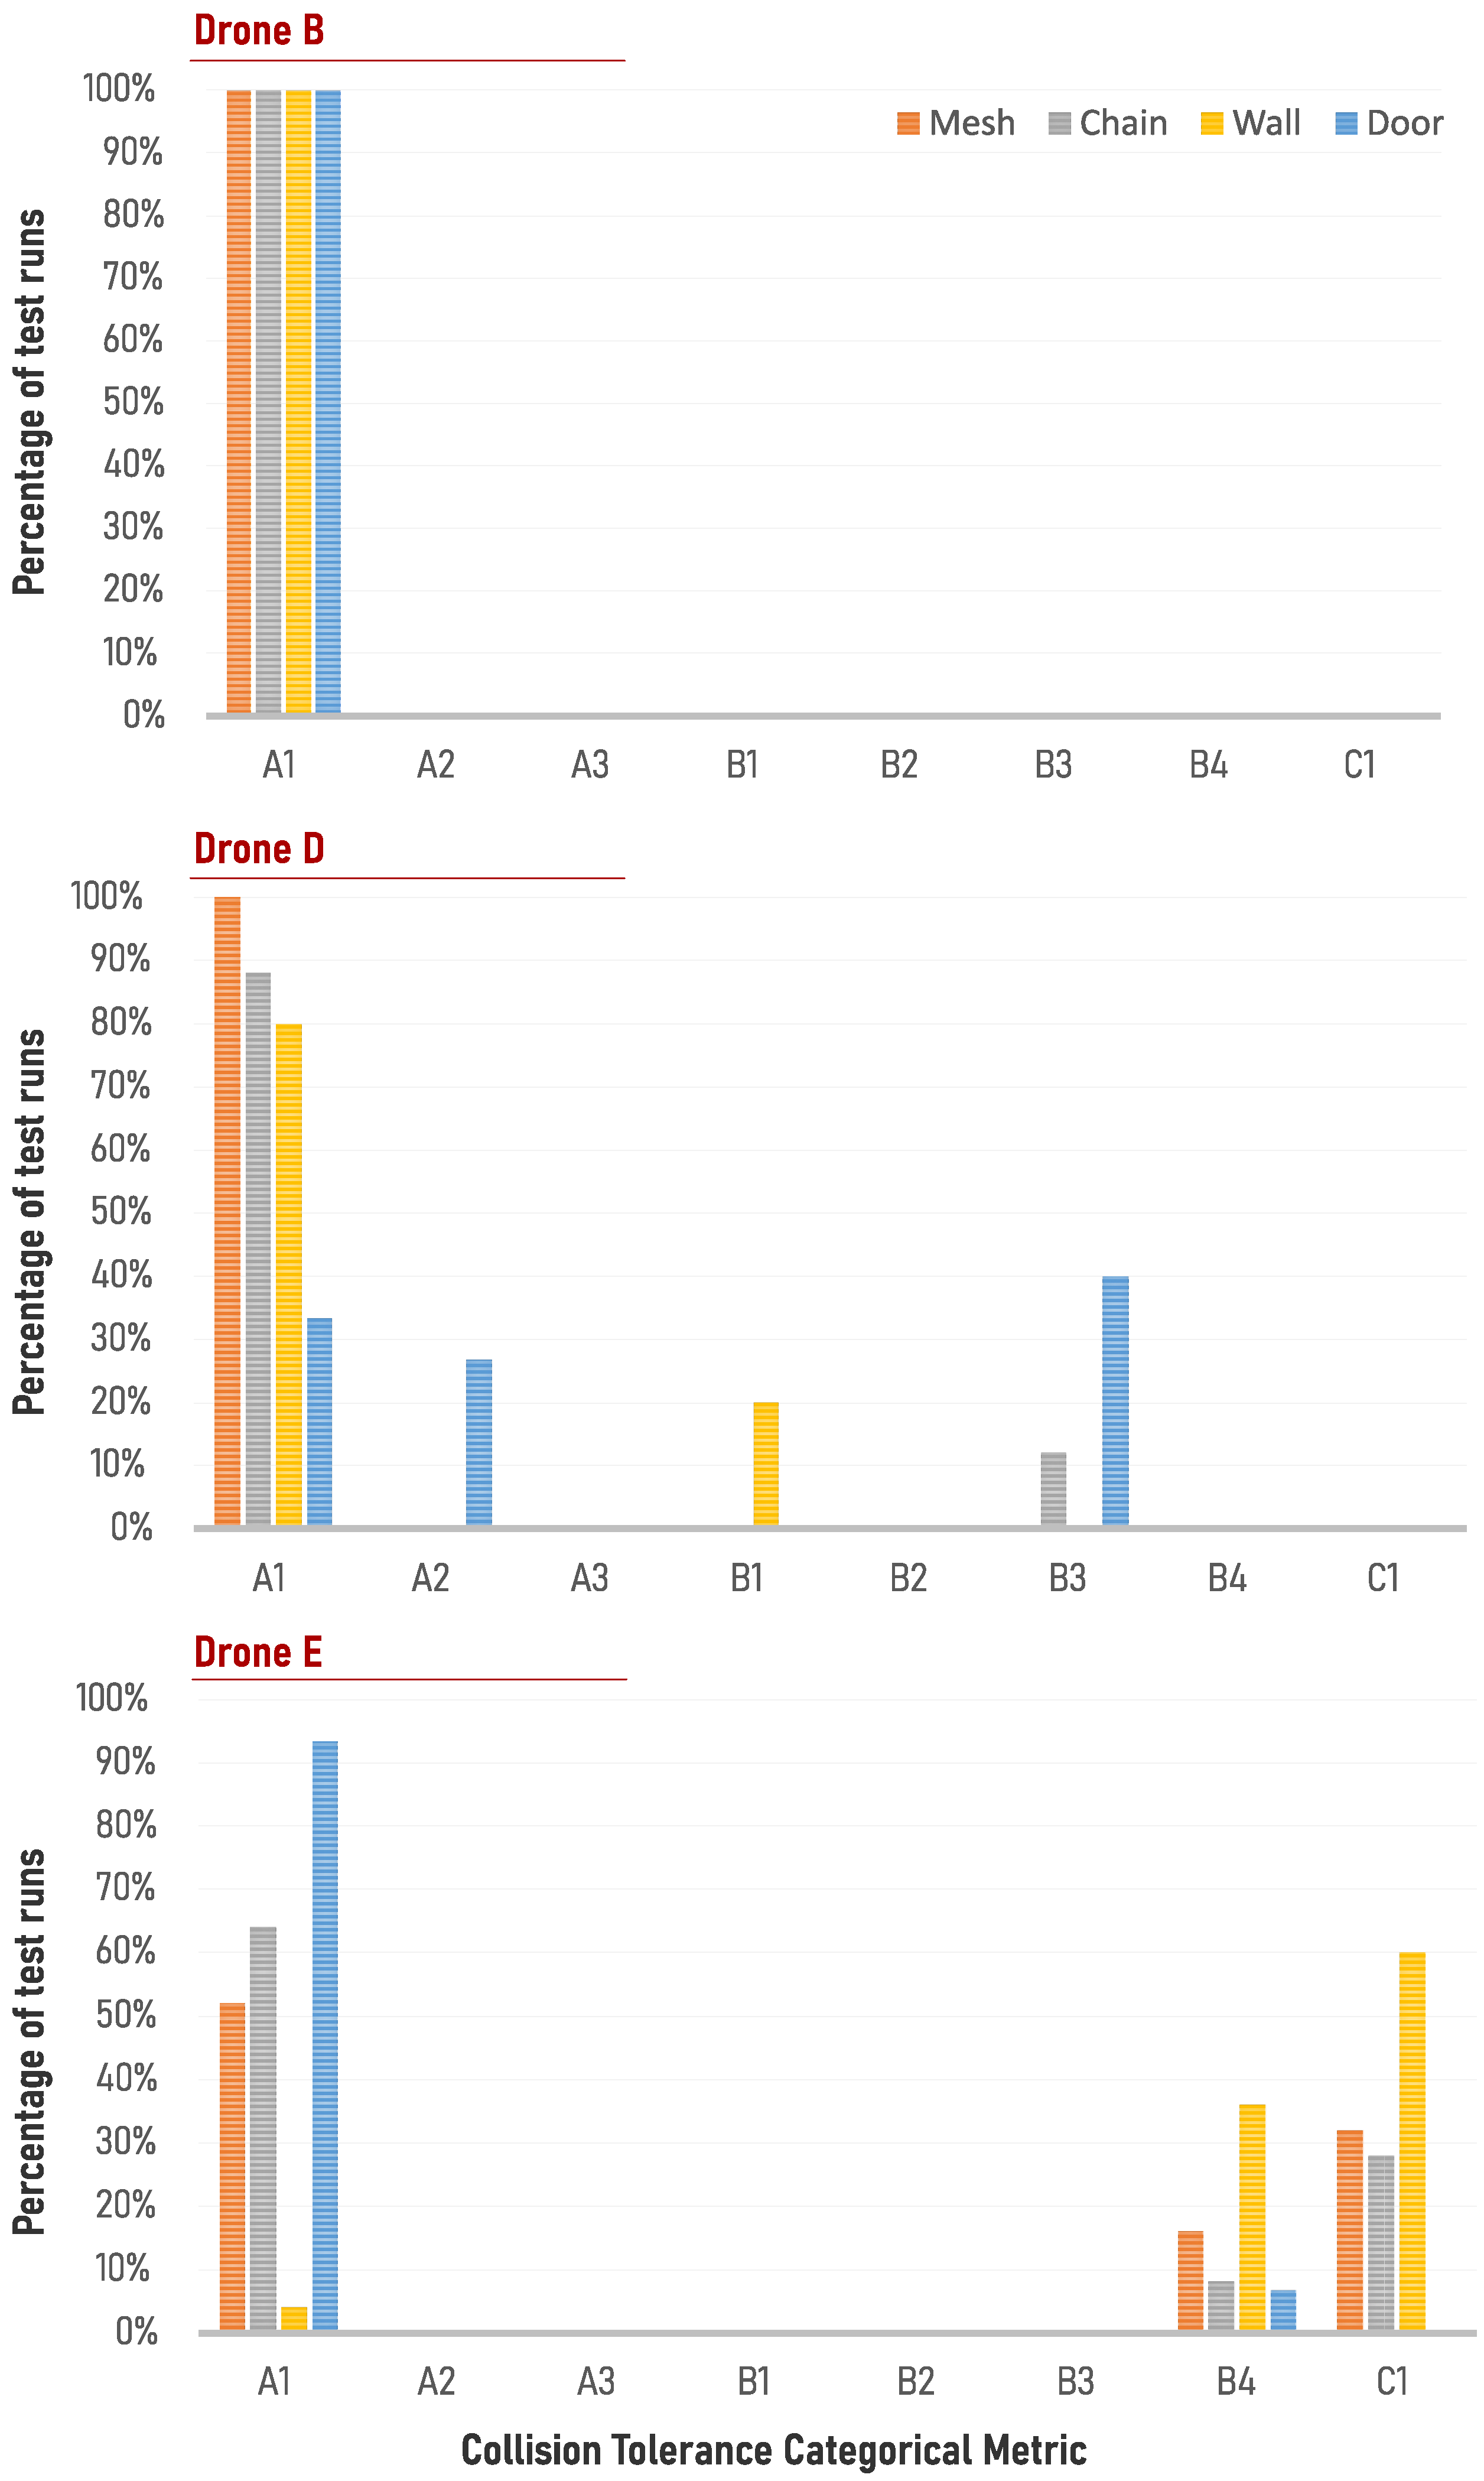
The test results for collision tolerance provide both the categorical score and the numerical (MDV and MASI index) results. Quantifying the abilities of the three tested drones—B, D, and E—the categorical score provided the clearest starting point for analyzing the platforms. This was due to the fact that, while the MASI and MDV results offered insights into the forces and velocity changes experienced by each drone in the tests, they did not directly indicate whether the drone survived the test.
From the categorical results in
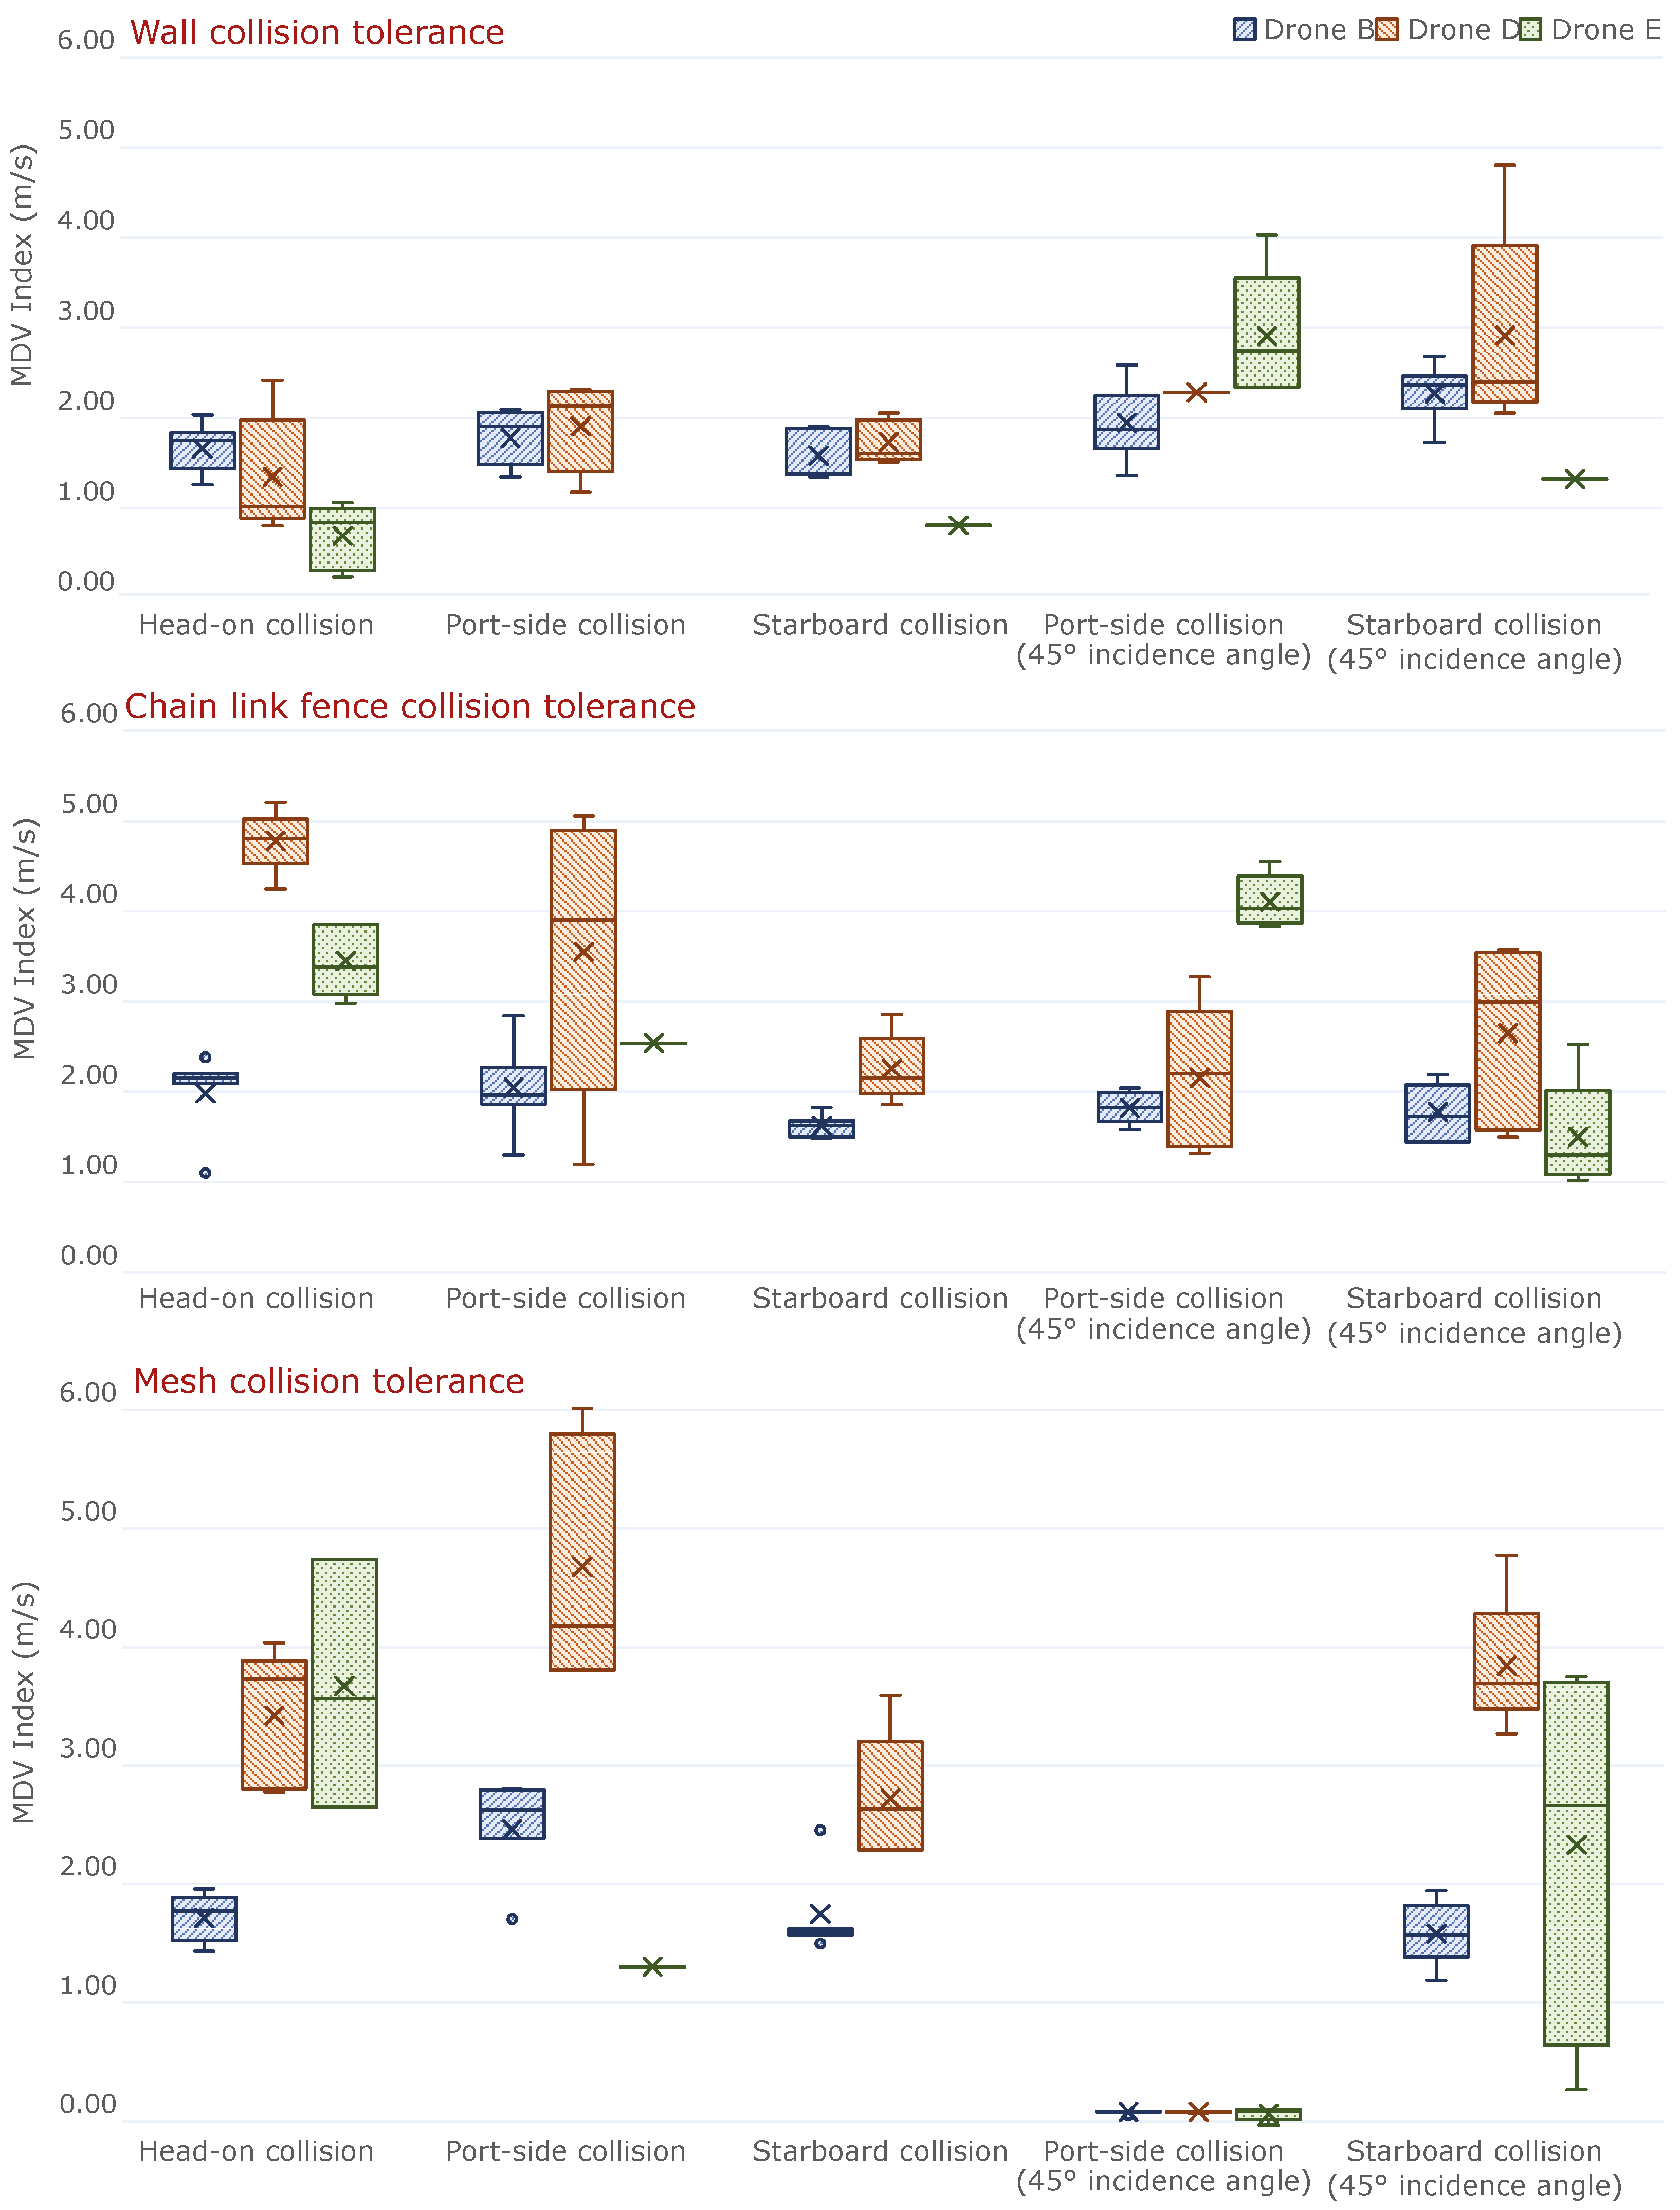
Figure 16, it is evident that Drone B performed the best in terms of collision tolerance. It survived all tests with an A1 categorical score. The other two drones failed certain tests, and in the case of Drone E, it was unable to be tested in several instances. Comparing the MASI and MDV results from
Figure 17 and
Figure 18, Drone B generally experienced a lower applied force and smaller changes in velocity. However, this was not true for every test. In some cases, Drone E outperformed Drone B, such as in the port-side collision with the wall in
Figure 17, but this was largely because the test was conducted only once—after which Drone E was almost severely damaged, preventing further runs.
Given that Drone B was clearly superior in collision tolerance, a comparison between Drones D and E was necessary. Based on score rankings, Drone D tended to outperform Drone E in most cases, except for the aperture 2× test, where Drone E excelled. This indicates that, depending on the specific test scenario, the pilot can determine which drone is more suitable. These tests did not necessarily identify the best overall platform but provide insights into the optimal drone for particular scenarios. If the pilot is choosing between Drones D and E, and the drone will only operate in an underground environment with 2× apertures, Drone E would be the better choice. Additionally, the pilot can take into account the forces exerted on the drone during crashes when making a decision. In general, Drone D survived crashes with stronger forces and greater velocity changes compared to Drone E. If there were more drones, each excelling in different types of collisions, the pilot would also need to consider the type of materials present in the environment and select the drone best suited for that scenario. In cases where many drones performed best for only one type of collision, a drone that may not be the best in any single category but performed well on average across all categories should also be considered.
Figure 17.
MASI index. Lower is better.
Figure 17.
MASI index. Lower is better.
Figure 18.
MDV index. Lower is better.
Figure 18.
MDV index. Lower is better.
5.2. Navigation Testing
The test results for navigation combine the ability for the drone to move along the predetermined path consistently and land at the desired location. The general results for this can be seen in
Figure 19 and
Figure 20. The starting point to evaluate the navigation ability of a given drone is with the use of the linear path traversal tests. These show the general ability of the drones to fly consistently indoors without any nearby obstacles. Most indoor missions will require a drone to move forwards, sidewards, or diagonally while away from obstacles. The evaluation of the drones is then expanded by the more specific test cases, such as the wall-following, corner navigation, and aperture tests. Across these more specific tests, Drones F and G were not tested near completely enclosed obstacles in the hallway configuration of the corner navigation and the aperture tests, as the drones constantly collided with all the obstacles in an unsafe manner.
An evaluation given the tested drones would begin with the linear tests, where there was no clear “best” drone but Drones A, C, and E each had the lowest departure in at least one test. In each test, a different drone was superior for the path departure metric. In terms of waypoint accuracy, Drone E performed consistently the best in these linear tests. Overall, across these tests, Drone E could be the overall best platform. By comparing the results from the other navigation tests, similar comparisons can be made. There is not a clear best tested drone in this case. A trend does emerge, where Drones A and E appeared among the top two drones in several categories.
When comparing such drones in navigation tests, both the average result and the standard deviation are important metrics. A drone could have a good score on average but have wildly different path deviation accuracies. An example of this was Drone B in the 1.5× aperture test. On average, it was the best performing drone, but it also had the largest swing in such results. A pilot would in theory not choose this platform for a flight requiring a flight through an aperture because Drones B and D had slightly worse average scores but much tighter standard deviations.
5.3. Combining Navigation and Collision Tolerance Results
In cases where a drone is needed for underground flights, selecting the best platform involves evaluating both navigation and collision tolerance metrics, similarly to how drones are assessed for either navigation or collision performance alone. If one drone clearly outperforms the others, it will be chosen. However, if multiple drones excel in different categories, the pilot must determine which drone is best overall, considering the specific conditions of the flight.
In the tests presented in this paper, a clear trend emerged: Drones A and E excelled in navigation. However, Drone A was not tested for collision tolerance due to the absence of propeller guards. Drone E, despite its strong navigation performance, performed poorly in collision tests and, in some cases, was not tested because it crashed and damaged its frame. Conversely, Drone B emerged as the top performer in collision tolerance, though it did not perform as well in navigation. Therefore, while Drone B may not have been the best in navigation, its consistent performance in collision tests made it a more reliable choice overall.
When evaluating the best drone, it is crucial to consider the gap between average results and worst-case scenarios. In critical environments, pilots need to understand not only how well a drone operates but also how consistently it performs. For instance, if one drone has a superior average performance but has occasional catastrophic failures, while another has a slightly lower performance but is more consistent, the latter may be the better option in uncertain situations. The importance of consistency was evident in both navigation tests, which showed variability in standard deviation, and in the collision tests, where score variations highlighted the risks. Additionally, a drone’s frame design should be considered, particularly in relation to collision tolerance. Drones equipped with protective cages can mitigate the risk of damage during impacts. As indicated by the collision tolerance results, a drone that sustains critical damage can end a mission prematurely. Thus, reducing this risk is paramount for mission success.
6. Future Work
Our future work aims to expand the wall-following tests to better characterize the magnitude of eddy currents generated at various distances from walls. We also plan to investigate corner navigation performance in hallway tests, assessing how increased operational space (which reduces the impact of eddy currents) affects drone behavior, as well as scenarios where one wall is closer than the other, leading to asymmetric eddy current effects. Additionally, we intend to compare evaluation results from both internal and external tracking systems. This will involve collaborating with drone manufacturers to obtain unencrypted internal tracking data.
We will explore new trajectory patterns that may be encountered in subterranean tunnels, to enhance our evaluation methodology. Building on our collision tolerance testing, we aim to robustly assess obstacle avoidance capabilities in sUASs. This aspect was not addressed in the current project due to several challenges. Primarily, obstacle avoidance testing poses significant risks, as it requires drones to autonomously stop upon detecting an obstacle; any failure in this system could lead to severe damage. Furthermore, among the drones tested, only one was equipped with obstacle avoidance capabilities, making it insufficient to draw definitive conclusions from a single dataset.
The tests conducted in this study only accounted for wind currents generated by the drones themselves, primarily due to airflow reflecting off nearby walls and affecting the sUASs. However, in underground environments such as tunnels and mines, additional air currents may arise from external sources—such as other drones, machinery, or natural airflow entering the space. Future experiments should incorporate these external airflow sources to evaluate their impact on drone performance, better simulating real-world conditions, where multiple drones operate simultaneously.
In the tests devised in this paper, the only wind currents generated were those from the drones themselves reflecting off of the wall and coming back to affect the sUAS platform. In underground space such as tunnels and mines there can be external sources of wind currents from other drones and machines or from natural sources such as outside wind entering. Future tests could contain external sources of air currents to see the effect of increased forces acting on the drones. This can replicate underground spaces where multiple drones are operating simultaneously.
Lastly, developing a series of combined tests would be highly valuable. This project represents just one facet of the broader evaluation of sUASs in subterranean environments for the U.S. Army. Other key areas of investigation include communication loss, mapping, trust, situational awareness, and autonomy. Integrating these evaluation domains—for example, conducting navigation tests under communication loss conditions, while assessing operator trust in the system—would significantly enhance the comprehensiveness of our research.
7. Conclusions
Existing small Unmanned Aircraft Systems (sUASs) have historically been optimized for outdoor use. However, as sUAS technology rapidly evolves, new opportunities for operations in GPS-denied indoor and subterranean environments are emerging. Unlike expansive outdoor settings, subterranean environments present challenges that require sUASs to navigate confined spaces characterized by sharp turns and turbulent eddy currents. This increases the likelihood of collisions with obstacles, making it clear that existing evaluation methodologies designed for outdoor environments cannot be directly applied to indoor and subterranean scenarios.
In this work, we present a practical evaluation methodology through a series of tests that provide valuable insights into sUAS performance in two key areas: navigation and collision tolerance. The navigation tests encompass a range of scenarios, including wall following, linear path traversal, corner navigation, and apparatus navigation. These tests are critical for assessing a sUAS’s ability to perform various subtasks within different subterranean missions. The collision tolerance tests involve multiple variants, where drones collide with various obstacles—such as walls, mesh materials, and chain link fences—at different angles. After evaluating all platforms, mission operators can select the most suitable drone based on the specific requirements of their use case.
The accumulated test scores clearly demonstrate the variations in each platform’s capabilities, with some drones outperforming others in both navigation and collision tolerance. Our proposed methodology leverages multiple tests and a range of scoring metrics to thoroughly evaluate each drone. By breaking down drone tasks into smaller components, every element is individually assessed. Even if there is an overlap between different scores (such as MDV and MASI), they highlight different attributes, including how much force the sUAS can withstand and the maximum survivable deceleration speed when considered alongside the success/failure categorical score. These collision tolerance metrics are integrated with navigation metrics such as path deviation and waypoint accuracy. Together, this unified framework enables mission planners to make informed decisions, by aggregating the relevant scores based on the specific demands of a mission, ultimately guiding the selection of the most suitable sUAS platform.
Author Contributions
Conceptualization, K.J. and E.M.; methodology, K.J. and E.M.; software, E.M.; validation, K.J. and E.M.; formal analysis, K.J. and E.M.; investigation, K.J. and E.M.; resources, K.J.; data curation, E.M.; writing—original draft preparation, E.M.; writing—review and editing, K.J. and E.M.; visualization, K.J. and E.M.; supervision, K.J.; project administration, K.J.; funding acquisition, K.J. All authors have read and agreed to the published version of the manuscript.
Funding
This project was sponsored by the Department of the Army, U.S. Army Combat Capabilities Development Command Soldier Center (W911QY-18-2-0006). Approved for public release.
Data Availability Statement
The original contributions presented in the study are included in the article, further inquiries can be directed to the corresponding author.
Acknowledgments
The authors would like to thank Brendan Donoghue and Peter Gavriel for piloting the sUAS platforms during our evaluation experiments and helping in the building of the test space, as well as Adam Norton for facilitating the process.
Conflicts of Interest
The authors declare no conflicts of interest.
References
- Dinelli, C.; Racette, J.; Escarcega, M.; Lotero, S.; Gordon, J.; Montoya, J.; Dunaway, C.; Androulakis, V.; Khaniani, H.; Shao, S.; et al. Configurations and Applications of Multi-Agent Hybrid Drone/Unmanned Ground Vehicle for Underground Environments: A Review. Drones 2023, 7, 136. [Google Scholar] [CrossRef]
- Raoult, V.; Colefax, A.P.; Allan, B.M.; Cagnazzi, D.; Castelblanco-Martínez, N.; Ierodiaconou, D.; Johnston, D.W.; Landeo-Yauri, S.; Lyons, M.; Pirotta, V.; et al. Operational Protocols for the Use of Drones in Marine Animal Research. Drones 2020, 4, 64. [Google Scholar] [CrossRef]
- Hiebert, B.; Nouvet, E.; Jeyabalan, V.; Donelle, L. The Application of Drones in Healthcare and Health-Related Services in North America: A Scoping Review. Drones 2020, 4, 30. [Google Scholar] [CrossRef]
- Nguyen, H.V.; Manley, T.W.; Saidi, K.S. Survey of Drone Usage in Public Safety Agencies; Technical Report; National Institute of Standards and Technology (NIST): Gaithersburg, MD, USA, 2020. [Google Scholar]
- Pritzl, V.; Stepan, P.; Saska, M. Autonomous Flying into Buildings in a Firefighting Scenario. In Proceedings of the 2021 IEEE International Conference on Robotics and Automation (ICRA), Xi’an, China, 30 May–5 June 2021; pp. 239–245. [Google Scholar] [CrossRef]
- Balamurugan, G.; Valarmathi, J.; Naidu, V.P.S. Survey on UAV navigation in GPS denied environments. In Proceedings of the 2016 International Conference on Signal Processing, Communication, Power and Embedded System (SCOPES), Paralakhemundi, India, 3–5 October 2016; pp. 198–204. [Google Scholar] [CrossRef]
- Olivares, G.; Gomez, L.; de los Monteros, J.E. Volume II—UAS Airborne Collision Severity Evaluation-Quadcopter; Technical Report; Wichita State University, Federal Aviation Administration: Wichita, KS, USA, 2017. [Google Scholar]
- Dan, T.Y.; Chi, W.; Saileh, M.F.B.M.; Low, K.H. Study on impact of separation distance to traffic management for small UAS operations in urban environment. In Transdisciplinary Engineering: A Paradigm Shift, Proceedings of the 24th ISPE Inc. International Conference on Transdisciplinary Engineering, 10–14 July 2017; IOP Press: Amsterdam, The Netherlands, 2017; Volume 5, p. 39. [Google Scholar]
- Department of the Army. Subterranean Operations; Technical Report; Department of the Army: Arlington, VA, USA, 2019.
- Rogers, J.G.; Schang, A.; Nieto-Granda, C.; Ware, J.; Carter, J.; Fink, J.; Stump, E. The DARPA SubT Urban Circuit Mapping Dataset and Evaluation Metric. In Proceedings of the Experimental Robotics; Siciliano, B., Laschi, C., Khatib, O., Eds.; Springer: Berlin/Heidelberg, Germany, 2021; pp. 391–401. [Google Scholar]
- Norton, A.; Yanco, H. Threading the Needle: Test and Evaluation of Early Stage UAS Capabilities to Autonomously Navigate GPS-Denied Environments in the DARPA Fast Lightweight Autonomy (FLA) Program. arXiv 2025, arXiv:2504.08122v1. [Google Scholar]
- Mohta, K.; Watterson, M.; Mulgaonkar, Y.; Liu, S.; Qu, C.; Makineni, A.; Saulnier, K.; Sun, K.; Zhu, A.; Delmerico, J.; et al. Fast, autonomous flight in GPS-denied and cluttered environments. J. Field Robot. 2018, 35, 101–120. [Google Scholar] [CrossRef]
- Norton, A.; Gavriel, P.; Donoghue, B.; Yanco, H. Test Methods to Evaluate Mapping Capabilities of Small Unmanned Aerial Systems in Constrained Indoor and Subterranean Environments. In Proceedings of the 2021 IEEE International Symposium on Technologies for Homeland Security (HST), Boston, MA, USA, 8–9 November 2021; pp. 1–8. [Google Scholar] [CrossRef]
- Tsoi, A.H.; Gabler, H.C. Evaluation of vehicle-based crash severity metrics. Traffic Inj. Prev. 2015, 16, S132–S139. [Google Scholar] [CrossRef]
- Jerath, K.; Langelaan, J.W. Simulation Framework for UAS Conceptual Design. In Proceedings of the AIAA Modeling and Simulation Technologies Conference, Washington, DC, USA, 13–17 June 2016; p. 1186. [Google Scholar]
- Norton, A.; Ahmadzadeh, R.; Jerath, K.; Robinette, P.; Weitzen, J.; Wickramarathne, T.; Yanco, H.; Choi, M.; Donald, R.; Donoghue, B.; et al. DECISIVE Test Methods Handbook: Test Methods for Evaluating sUAS in Subterranean and Constrained Indoor Environments, Version 1.1. arXiv 2022, arXiv:2211.01801. [Google Scholar] [CrossRef]
- Norton, A.; Ahmadzadeh, R.; Jerath, K.; Robinette, P.; Weitzen, J.; Wickramarathne, T.; Yanco, H.; Choi, M.; Donald, R.; Donoghue, B.; et al. DECISIVE Benchmarking Data Report: sUAS Performance Results from Phase I. arXiv 2023, arXiv:2301.07853. [Google Scholar] [CrossRef]
- Maghazei, O.; Steinmann, M. Drones in railways: Exploring current applications and future scenarios based on action research. Eur. J. Transp. Infrastruct. Res. 2020, 20, 87–102. [Google Scholar] [CrossRef]
- Meriaux, E.; Jerath, K. Evaluation of Navigation and Trajectory-following Capabilities of Small Unmanned Aerial Systems. In Proceedings of the 2022 IEEE International Symposium on Technologies for Homeland Security (HST), Boston, MA, USA, 14–15 November 2022; pp. 1–7. [Google Scholar] [CrossRef]
- Choi, M.; Houle, J.; Letteri, N.; Wickramarathne, T.L. On The Use of Small-Scale Unmanned Autonomous Systems for Decision-Support in Subterranean Environments: The Case of Operator Situational Awareness Assessment. In Proceedings of the 2021 IEEE International Symposium on Technologies for Homeland Security (HST), Boston, MA, USA, 8–9 November 2021. [Google Scholar]
- Meriaux, E.; Weitzen, J.; Norton, A. Simulation of the Effect of Correlated Packet Loss for sUAS Platforms Operating in Non-Line-of-Sight Indoor Environments. Drones 2023, 7, 485. [Google Scholar] [CrossRef]
- Meriaux, E.; Weitzen, J.; Yoni, N.; Norton, A. Test methodologies for evaluating the effectiveness of suas communication links for operation in indoor and subterranean environments. J. Test. Eval. 2023, 51, 4431–4445. [Google Scholar] [CrossRef]
- Meriaux, E.; Khavas, Z.R.; Majdi, A.; Robinette, P. How Does Trust in Simulations of Drone Failures Compare with Reality? In Proceedings of the 2024 10th International Conference on Automation, Robotics and Applications (ICARA), Athens, Greece, 22–24 February 2024; pp. 305–310. [Google Scholar]
- Hertel, B.; Donald, R.; Dumas, C.; Ahmadzadeh, S.R. Methods for combining and representing non-contextual autonomy scores for unmanned aerial systems. In Proceedings of the 2022 8th International Conference on Automation, Robotics and Applications (ICARA), Prague, Czech Republic, 18–20 February 2022; pp. 135–139. [Google Scholar]
- Maneuvering (MAN 1-5) and Payload Functionality (PAY 1-5) Quick Start Guide. Available online: https://www.nist.gov/system/files/documents/2019/08/21/nist-astm-nfpa_standard_test_methods_for_suas_-_maneuvering_and_payload_functionality_overiew_v2019-08-20v2.pdf (accessed on 10 November 2022).
- Ćwiąkała, P. Testing procedure of Unmanned Aerial Vehicles (UAVs) trajectory in automatic missions. Appl. Sci. 2019, 9, 3488. [Google Scholar] [CrossRef]
- Ruiz-Fernandez, L.E.; Ruiz-Leon, J.; Gomez-Gutierrez, D.; Murrieta-Cid, R. Decentralized multi-robot formation control in environments with non-convex and dynamic obstacles based on path planning algorithms. Intell. Serv. Robot. 2025, 18, 215–232. [Google Scholar] [CrossRef]
- Arterburn, D.; Duling, C.; Goli, N. Ground collision severity standards for UAS operating in the national airspace system (NAS). In Proceedings of the 17th AIAA Aviation Technology, Integration, and Operations Conference, Denver, CO, USA, 5–9 June 2017. [Google Scholar] [CrossRef]
- Petris, P.D.; Carlson, S.J.; Papachristos, C.; Alexis, K. Collision-tolerant Aerial Robots: A Survey. arXiv 2022, arXiv:2212.03196. [Google Scholar] [CrossRef]
- De Petris, P.; Nguyen, H.; Dang, T.; Mascarich, F.; Alexis, K. Collision-tolerant autonomous navigation through manhole-sized confined environments. In Proceedings of the 2020 IEEE International Symposium on Safety, Security, and Rescue Robotics (SSRR), Abu Dhabi, United Arab Emirates, 4–6 November 2020; pp. 84–89. [Google Scholar]
- De Petris, P.; Nguyen, H.; Kulkarni, M.; Mascarich, F.; Alexis, K. Resilient collision-tolerant navigation in confined environments. In Proceedings of the 2021 IEEE International Conference on Robotics and Automation (ICRA), Xi’an, China, 30 May–5 June 2021; pp. 2286–2292. [Google Scholar]
- Mintchev, S.; de Rivaz, S.; Floreano, D. Insect-Inspired Mechanical Resilience for Multicopters. IEEE Robot. Autom. Lett. 2017, 2, 1248–1255. [Google Scholar] [CrossRef]
- Briod, A.; Kornatowski, P.; Zufferey, J.C.; Floreano, D. A collision-resilient flying robot. J. Field Robot. 2014, 31, 496–509. [Google Scholar] [CrossRef]
- Zha, J.; Wu, X.; Kroeger, J.; Perez, N.; Mueller, M.W. A collision-resilient aerial vehicle with icosahedron tensegrity structure. In Proceedings of the 2020 IEEE/RSJ International Conference on Intelligent Robots and Systems (IROS), Las Vegas, NV, USA, 25–29 October 2020; pp. 1407–1412. [Google Scholar]
- Sujit, P.; Saripalli, S.; Sousa, J. An evaluation of UAV path following algorithms. In Proceedings of the 2013 European Control Conference (ECC), Zurich, Switzerland, 17–19 July 2013; pp. 3332–3337. [Google Scholar] [CrossRef]
- Entzinger, J.O.; Kubo, D. sUAS Remote Pilot Modeling and Airspace Simulation for a Quantitative Safety Evaluation of BVLOS Flights. In Proceedings of the AIAA Aviation 2021 Forum, Virtual, 2–6 August 2021; p. 2398. [Google Scholar]
- Chu, T.; Starek, M.J.; Berryhill, J.; Quiroga, C.; Pashaei, M. Simulation and characterization of wind impacts on sUAS flight performance for crash scene reconstruction. Drones 2021, 5, 67. [Google Scholar] [CrossRef]
- Barclay, S.; Haeri, H.; Jerath, K. Human-guided Swarms: Impedance Control-inspired Influence in Virtual Reality Environments. arXiv 2023, arXiv:2402.04451. [Google Scholar]
- de Azambuja, R.; Fouad, H.; Bouteiller, Y.; Sol, C.; Beltrame, G. When Being Soft Makes You Tough: A Collision-Resilient Quadcopter Inspired by Arthropods’ Exoskeletons. In Proceedings of the 2022 International Conference on Robotics and Automation (ICRA), Philadelphia, PA, USA, 23–27 May 2022; pp. 7854–7860. [Google Scholar]
- Mulgaonkar, Y.; Liu, W.; Thakur, D.; Daniilidis, K.; Taylor, C.J.; Kumar, V. The tiercel: A novel autonomous micro aerial vehicle that can map the environment by flying into obstacles. In Proceedings of the 2020 IEEE International Conference on Robotics and Automation (ICRA), Paris, France, 31 May–31 August 2020; pp. 7448–7454. [Google Scholar]
- Klaptocz, A. Design of Flying Robots for Collision Absorption and Self-Recovery; Technical Report; EPFL: Lausanne, Switzerland, 2012. [Google Scholar]
- Klaptocz, A.; Briod, A.; Daler, L.; Zufferey, J.C.; Floreano, D. Euler spring collision protection for flying robots. In Proceedings of the 2013 IEEE/RSJ International Conference on Intelligent Robots and Systems, Tokyo, Japan, 3–7 November 2013; pp. 1886–1892. [Google Scholar]
- Briod, A.; Klaptocz, A.; Zufferey, J.C.; Floreano, D. The AirBurr: A flying robot that can exploit collisions. In Proceedings of the 2012 ICME International Conference on Complex Medical Engineering (CME), Kobe, Japan, 1–4 July 2012; pp. 569–574. [Google Scholar]
- De Petris, P.; Nguyen, H.; Dharmadhikari, M.; Kulkarni, M.; Khedekar, N.; Mascarich, F.; Alexis, K. RMF-Owl: A Collision-Tolerant Flying Robot for Autonomous Subterranean Exploration. In Proceedings of the 2022 International Conference on Unmanned Aircraft Systems (ICUAS), Dubrovnik, Croatia, 21–24 June 2022; pp. 536–543. [Google Scholar] [CrossRef]
- Kulkarni, M.; Dharmadhikari, M.; Tranzatto, M.; Zimmermann, S.; Reijgwart, V.; De Petris, P.; Nguyen, H.; Khedekar, N.; Papachristos, C.; Ott, L.; et al. Autonomous teamed exploration of subterranean environments using legged and aerial robots. In Proceedings of the 2022 International Conference on Robotics and Automation (ICRA), Philadelphia, PA, USA, 23–27 May 2022; pp. 3306–3313. [Google Scholar]
- Pawlak, M. The Acceleration Severity Index in the impact of a vehicle against permanent road equipment support structures. Mech. Res. Commun. 2016, 77, 21–28. [Google Scholar] [CrossRef]
- Shelby, S.G. Delta-V as a measure of traffic conflict severity. In Proceedings of the 3rd International Conference on Road Safety and Simulation, Indianapolis, IN, USA, 15–16 September 2011; pp. 14–16. [Google Scholar]
- Wusk, G.; Gabler, H. Evaluation of vehicle-based crash severity metrics using event data recorders. In Proceedings of the 25th International Technical Conference on the Enhanced Safety of Vehicles (ESV) National Highway Traffic Safety Administration, Detroit, MI, USA, 5–8 June 2017. [Google Scholar]
- Phadke, A.; Medrano, F.A.; Chu, T.; Sekharan, C.N.; Starek, M.J. Modeling wind and obstacle disturbances for effective performance observations and analysis of resilience in UAV swarms. Aerospace 2024, 11, 237. [Google Scholar] [CrossRef]
- Ito, S.; Akaiwa, K.; Funabashi, Y.; Nishikawa, H.; Kong, X.; Taniguchi, I.; Tomiyama, H. Load and Wind Aware Routing of Delivery Drones. Drones 2022, 6, 50. [Google Scholar] [CrossRef]
- Dai, B.; He, Y.; Zhang, G.; Gu, F.; Yang, L.; Xu, W. Wind disturbance rejection for unmanned aerial vehicle based on acceleration feedback method. In Proceedings of the 2018 IEEE Conference on Decision and Control (CDC), Miami, FL, USA, 17–19 December 2018; pp. 4680–4686. [Google Scholar]
- Adkins, K.A. Urban flow and small unmanned aerial system operations in the built environment. Int. J. Aviat. Aeronaut. Aerosp. 2019, 6, 10. [Google Scholar] [CrossRef]
- Ross, H.; Post, E.R. Criteria for Guardrail Need and Location on Embankments; Volume I: Development of Criteria; Texas Transportation Institute, Texas A&M University Research Report 140-4; Texas A&M University: College Station, TX, USA, 1972. [Google Scholar]
| Disclaimer/Publisher’s Note: The statements, opinions and data contained in all publications are solely those of the individual author(s) and contributor(s) and not of MDPI and/or the editor(s). MDPI and/or the editor(s) disclaim responsibility for any injury to people or property resulting from any ideas, methods, instructions or products referred to in the content. |
© 2025 by the authors. Licensee MDPI, Basel, Switzerland. This article is an open access article distributed under the terms and conditions of the Creative Commons Attribution (CC BY) license (https://creativecommons.org/licenses/by/4.0/).


