Article

Assessment of Building Vulnerability to Tsunami in Ancon Bay, Peru, Using High-Resolution Unmanned Aerial Vehicle Imagery and Numerical Simulation

1
GeoGiRD Research Group, Facultad de Ingenieria Civil, Universidad Nacional de Ingenieria, Lima 15333, Peru
2
Geomatics Laboratory, Centro Peruano Japones de Investigaciones Sismicas y Mitigacion de Desastres, Lima 15333, Peru
3
International Research Institute of Disaster Science (IRIDeS), Tohoku University, Sendai 980-8572, Japan
*
Author to whom correspondence should be addressed.
These authors contributed equally to this work.
Drones 2025, 9(6), 402; https://doi.org/10.3390/drones9060402
Submission received: 11 April 2025 / Revised: 16 May 2025 / Accepted: 26 May 2025 / Published: 29 May 2025
(This article belongs to the Special Issue Drones for Natural Hazards)

Abstract

:
Traditional tsunami vulnerability assessments often rely on empirical models and field surveys, which can be time-consuming and have limited accuracy. In this study, we propose a novel approach that integrates high-resolution Unmanned Aerial Vehicle (UAV) photogrammetry with numerical simulation to improve vulnerability assessment efficacy in Ancon Bay, Lima, Peru, by using the Papathoma Tsunami Vulnerability Assessment (PTVA-4) model. For this purpose, a detailed 3D representation of the study area was generated using UAV-based oblique photogrammetry, enabling the extraction of building attributes. Additionally, a high-resolution numerical tsunami simulation was conducted using the TUNAMI-N2 model for a potential worst-case scenario that may affect the Central Peru subduction zone, incorporating topographic and land-use data obtained with UAV-based nadir photogrammetry. The results indicate that the northern region of Ancon Bay exhibits higher relative vulnerability levels due to greater inundation depths and more tsunami-prone building attributes. UAV-based assessments provide a rapid and detailed method for evaluating building vulnerability. These findings indicate that the proposed methodology is a valuable tool for supporting coastal risk planning and disaster preparedness in tsunami-prone areas.

1. Introduction

The Peru subduction zone has been the site of numerous destructive earthquakes, several of which have triggered tsunamis with devastating consequences [1]. In the twenty-first century alone, the two major tsunamis in Peru—Camana in 2001 ( M w 8.4) [2] and Pisco in 2007 ( M w 8.0) [3]—have shown the high vulnerability of coastal buildings; they caused severe structural damage and numerous deaths and missing persons [4,5]. Given the high exposure of Peruvian coastal cities [6], developing models to predict tsunami impacts on the built environment is crucial to implementing effective mitigation measures [7].
In this context, tsunami fragility functions have been widely applied in the coastal areas of Peru to estimate damage probabilities and expected economic losses based on a numerical tsunami simulation [8,9,10]. However, their application may lead to some uncertainties. While these models quantify damage and losses from tsunami events, most available fragility functions are empirical and only consider construction material as the engineering attribute and inundation depth as the tsunami demand parameter [11]. These limitations introduce biases since other building engineering attributes and tsunami inundation features are not accounted for [7]. In addition, fragility functions are often developed by using data from specific locations where building typologies and construction standards differ from those in other regions, resulting in inaccurate estimates of damage and losses for potential tsunamis [12,13]. As an alternative, index-based models, such as the last version of the Papathoma Tsunami Vulnerability Assessment (PTVA-4), offer a more comprehensive approach, as they incorporate various engineering attributes. Moreover, the PTVA-4 model can be applied where vulnerability curves are not available, such as in Peru, providing a quantitative measure of building vulnerability through the Relative Vulnerability Index RVI) [14] (further details are provided in Section 2.1).
For the determination of the RVI of a building portfolio, the PTVA-4 model requires the collection of numerous data on building characteristics, with on-site surveys based on visual inspection to assess tsunami-related attributes. However, these surveys can be time-consuming, as they often require several days, depending on the extent of the building portfolio and the accessibility of buildings [15,16,17,18]. As a result, this approach may become impractical when time or personnel constraints limit on-site data collection. Additionally, restricted access to certain buildings can further hinder the process, reducing the effectiveness of the PTVA-4 model since not all buildings would be included in the analysis [19]. Therefore, developing efficient strategies for conducting on-site surveys is essential to ensuring timely and comprehensive data collection for PTVA-4.
During the development of the PTVA-4 model [14], the addition of attributes to the PTVA-3 model was proposed, including coastal morphology, ground slope, and the width of adjacent roads as proxies for tsunami flow velocity and inundation extent [20]. However, these parameters were not included among the final model attributes due to uncertainties regarding their contribution to building damage. To address this limitation, high-resolution hydrodynamic models and digital elevation models (DEMs) were proposed, as they can implicitly integrate these attributes into hazard assessments [14]. Consequently, the availability of high-resolution inundation maps is essential to the effective application of PTVA-4. However, obtaining detailed land elevation data by using traditional surveying techniques (e.g., total station) can be costly, labor-intensive, and time-consuming [21].
Unmanned Aerial Vehicles UAVs, commonly known as drones, have been increasingly integrated into comprehensive disaster risk management frameworks [22,23], supporting monitoring, mapping, and damage assessments for a variety of events, including floods [24], geological hazards [25], storms [26], volcanic eruptions [27], earthquakes [28], and tsunamis [29]. In the case of tsunamis, most studies have focused on hazard modeling [29], exposure analysis [30], paleo-tsunami reconstruction [31], evacuation planning [32], and post-disaster assessments [33], with limited attention given to building vulnerability.
Following recent advancements in their underlying technology, UAVs provide an alternative to traditional surveying methods, facilitating the efficient collection of both building attributes [34,35,36] and land elevation data [37,38,39] for improved disaster management. Firstly, UAVs can efficiently capture high-resolution aerial imagery, which can be processed with specialized software into 3D models representing building characteristics and their surroundings [40]. This capability enables efficient data collection for building vulnerability assessments, reducing the time and personnel required for traditional on-site surveys while overcoming accessibility issues [41]. Furthermore, UAVs can capture detailed environmental features, such as coastal morphology and land elevation [37], which can be integrated with tsunami hazard models to improve the accuracy of vulnerability assessments [42].
Accurately representing building vulnerability is crucial to effective coastal risk planning [43]. Therefore, an innovative framework is needed to enhance the application of the PTVA-4 model. In this study, we propose a novel approach to tsunami vulnerability assessment using high-resolution data acquired with UAVs, which enables the efficient collection of building attributes and provides detailed data for tsunami modeling. This study focuses on Ancon Bay in Lima, Peru, as a case study due to its high visitor density and the exposure of its coastal buildings to tsunami hazard [44]. This paper is structured as follows: In Section 2, we outline the materials and methods of this research study, describing the proposed methodology in Section 2.1, the study area in Section 2.2, the UAV surveys in Section 2.3, the tsunami hazard assessment in Section 2.4, and building attribute extraction in Section 2.5. In Section 3, we discuss the results, and in Section 4, we provide the conclusions of this study.

2. Materials and Methods

2.1. Tsunami Vulnerability Assessment

The PTVA-4 model is used to calculate the RVI score for each building, providing a comparative measure of the expected performance against other buildings within a study area. This model was developed based on the expert judgment of specialized scientists worldwide [14]. For a more detailed explanation of the PTVA-4 model and its applications, we refer the reader to previous studies [11,15,16,17,18,19,45]. The RVI is expressed as the weighted sum of Structural Vulnerability (SV) and Water Vulnerability (WV), as defined by the following equation:
R V I = 2 3 S V + 1 3 W V .
Here, SV refers to the building’s structural capacity to resist the forces generated by tsunami water flow. It is calculated, with Equation (2), as the product of three factors: building vulnerability (Bv), determined by its structural and engineering characteristics; building surroundings (Surr), based on the influence of the surrounding environment; and exposure (Ex), defined by the tsunami inundation depth distribution in a given scenario. Additionally, WV represents the vulnerability of building components exposed to water contact and is obtained from Equation (3) as the ratio of the inundated floor height to the total building height. The weights assigned to SV and WV follow the PTVA-3 formulation [20] and were retained in the PTVA-4 model, where greater importance is given to structural damage due to its potentially higher repair costs compared to water intrusion.
S V = B v · S u r r · E x .
W V = Height of inundated building levels Total height of building .
Since both Ex and WV depend on the inundation depth distribution in a given scenario, tsunami numerical simulations are conducted with the nonlinear shallow water equations, presented in Equations (4)–(6), where η is the water level; M and N are the discharge fluxes in the x- and y-directions, respectively; D = h + η is the total water depth, where h is the still water depth; g is the acceleration due to gravity, and n is Manning’s roughness coefficient. These equations are solved by using a staggered leapfrog finite difference scheme [46,47].
η t + M x + N y = 0 .
M t + x M 2 D + x M N D = g D η x g n 2 D 7 3 M M 2 + N 2 .
N t + x M N D + x N 2 D = g D η y g n 2 D 7 3 N M 2 + N 2 .
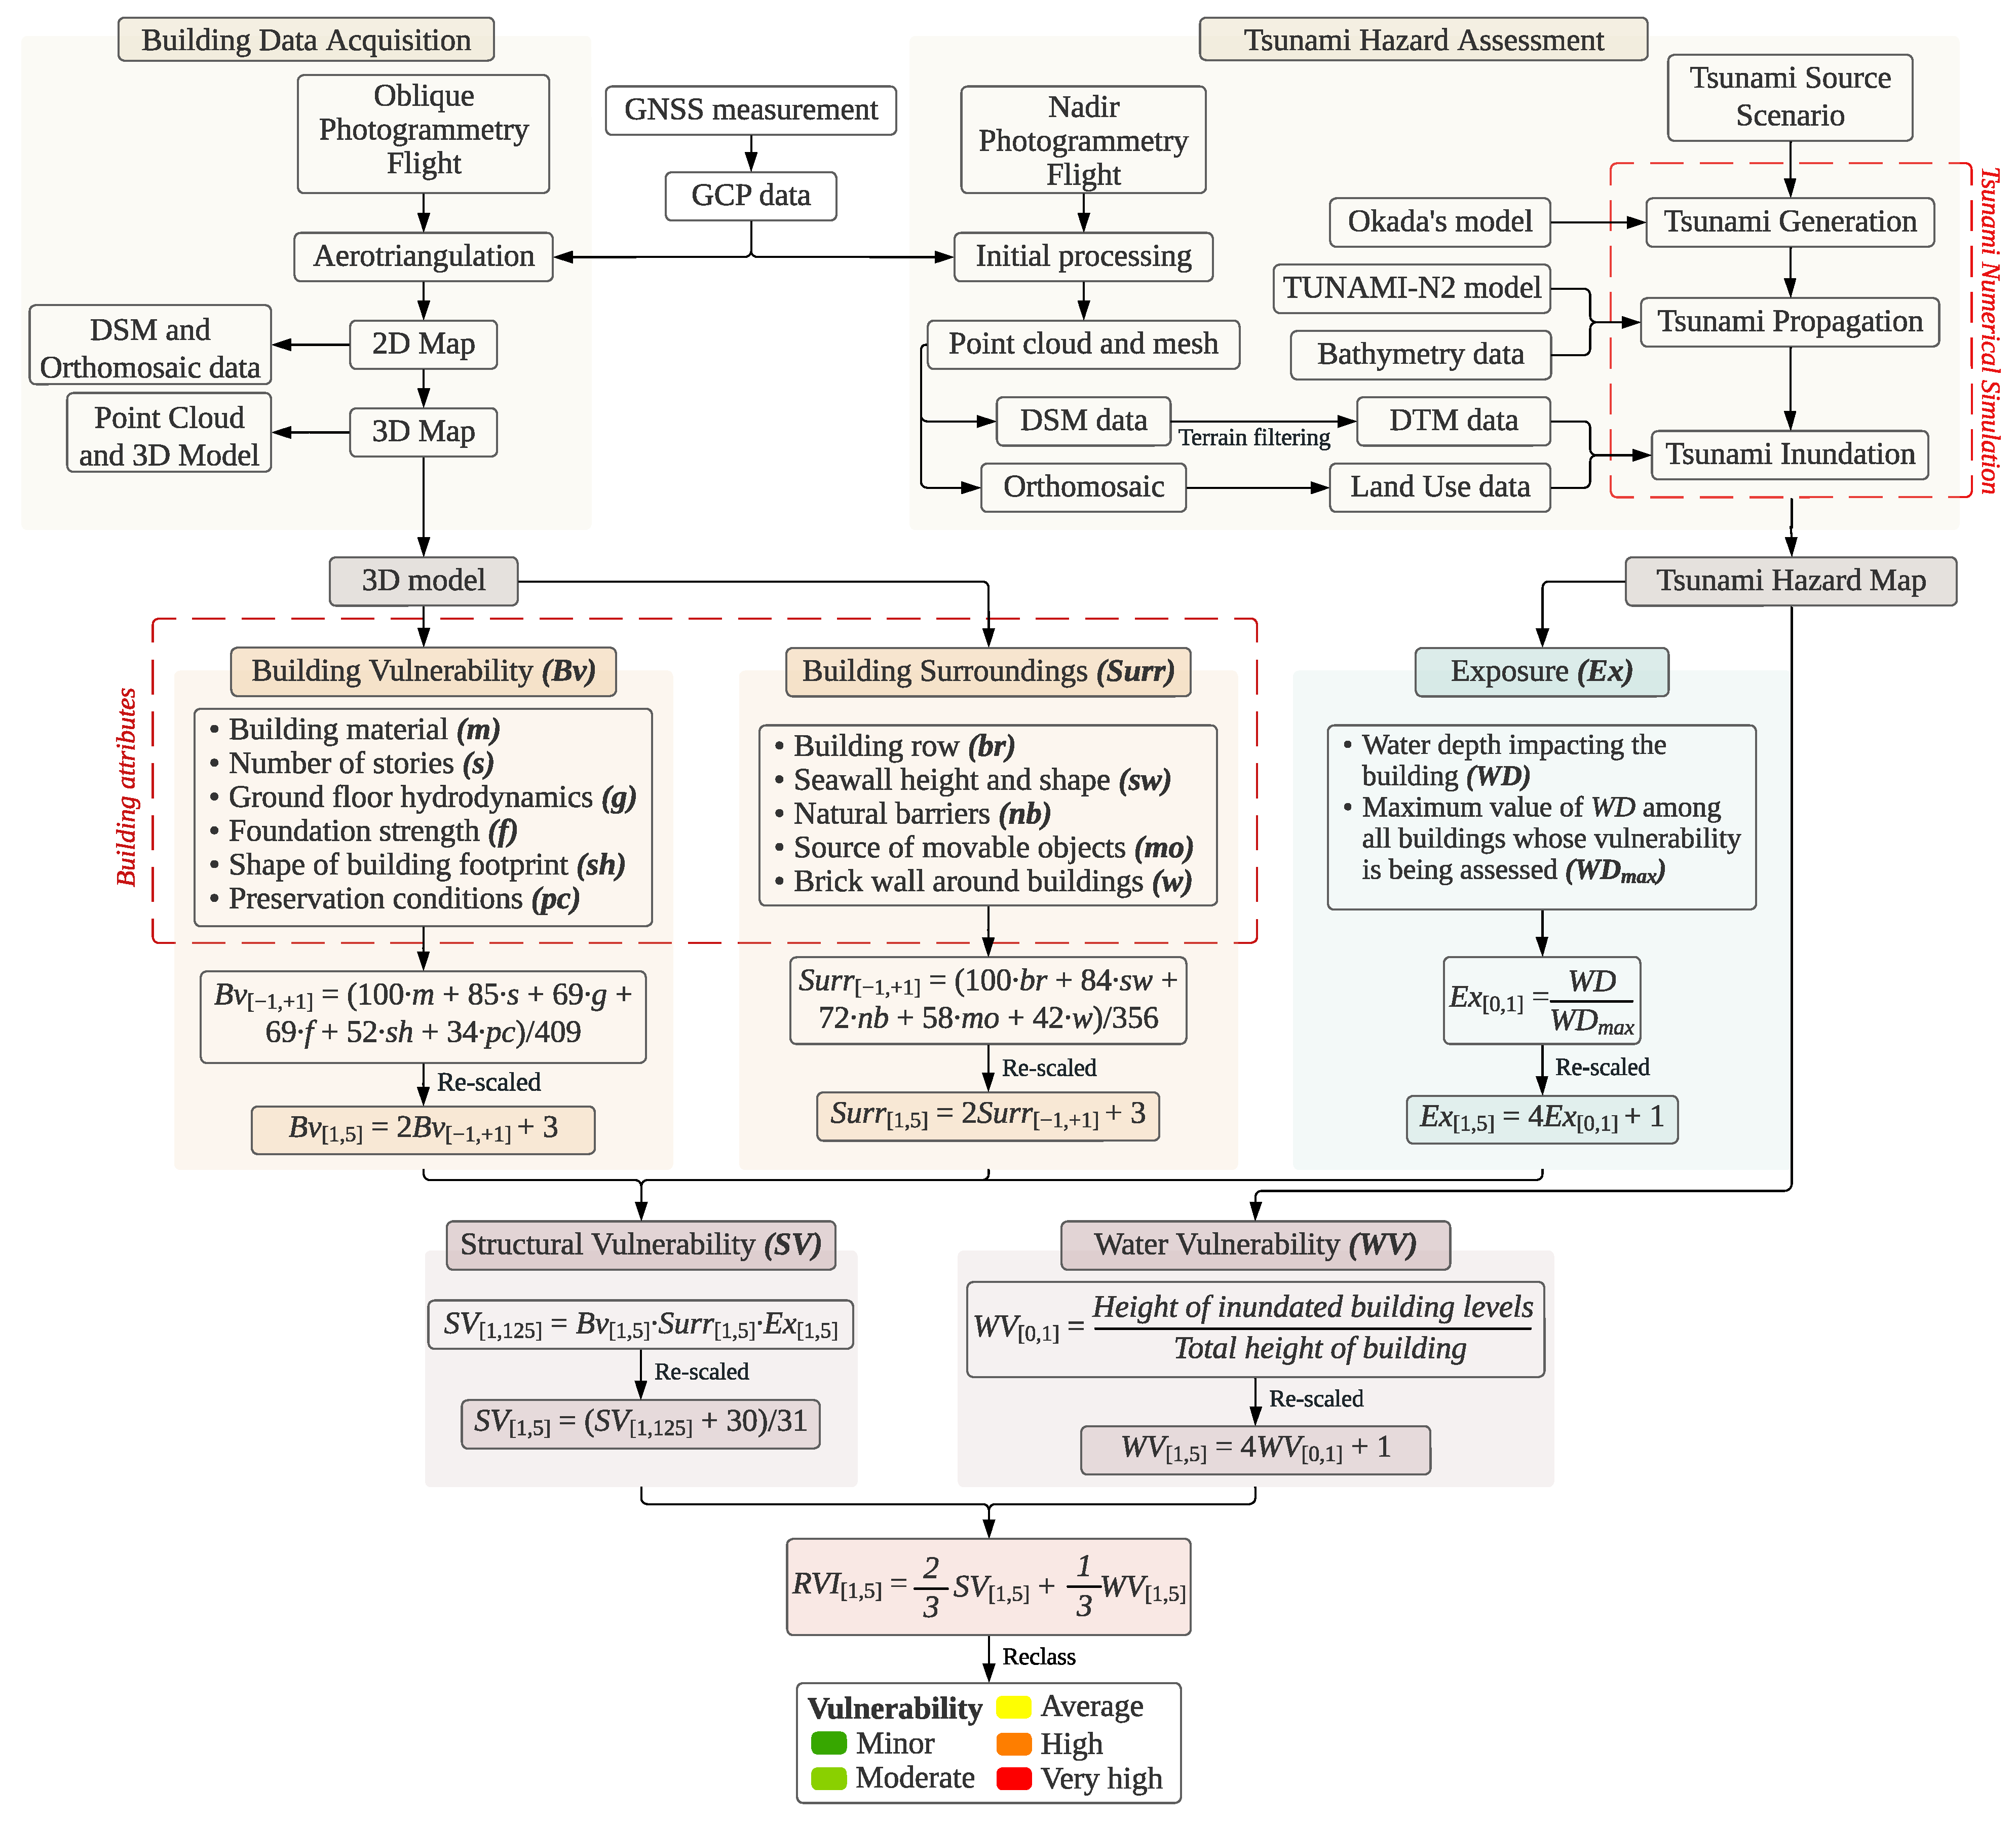
Figure 1 illustrates the proposed PTVA-4 model, which consists of three components: First, UAV technology is employed to efficiently collect high-resolution data required for calculating SV and WV (Figure 1, top). Then, various components of the PTVA-4 model are integrated to compute SV and WV, followed by a reclassification process to normalize the scores on a scale of 1 to 5 (Figure 1, middle). Finally, the RVI score is determined to generate thematic vulnerability maps, classifying buildings into different relative vulnerability levels (Figure 1, bottom). This study focuses only on tsunami vulnerability, as the PTVA-4 model is not a multi-hazard tool [14]. Future research could complement the proposed UAV-based approach by integrating both seismic and tsunami effects since conducting separate analyses remains a practical strategy [48].
The main improvement of the proposed approach compared with existing techniques is the implementation of UAV-based oblique and nadir photogrammetry (Figure 1, top). Oblique UAV imagery was employed to generate a high-resolution 3D model of the study area, which facilitated the extraction of building attributes for the Bv and Surr components based on visual inspection. Additionally, nadir UAV images were used to obtain high-resolution topographic and land-use data, serving as inputs for tsunami numerical simulation. The resulting inundation depth distribution was then used to calculate the Ex and WV components. As a result, the proposed framework enhances the efficiency and accuracy of data acquisition for the PTVA-4 model, ensuring a more precise vulnerability assessment while reducing the time required for data collection.

2.2. Study Area

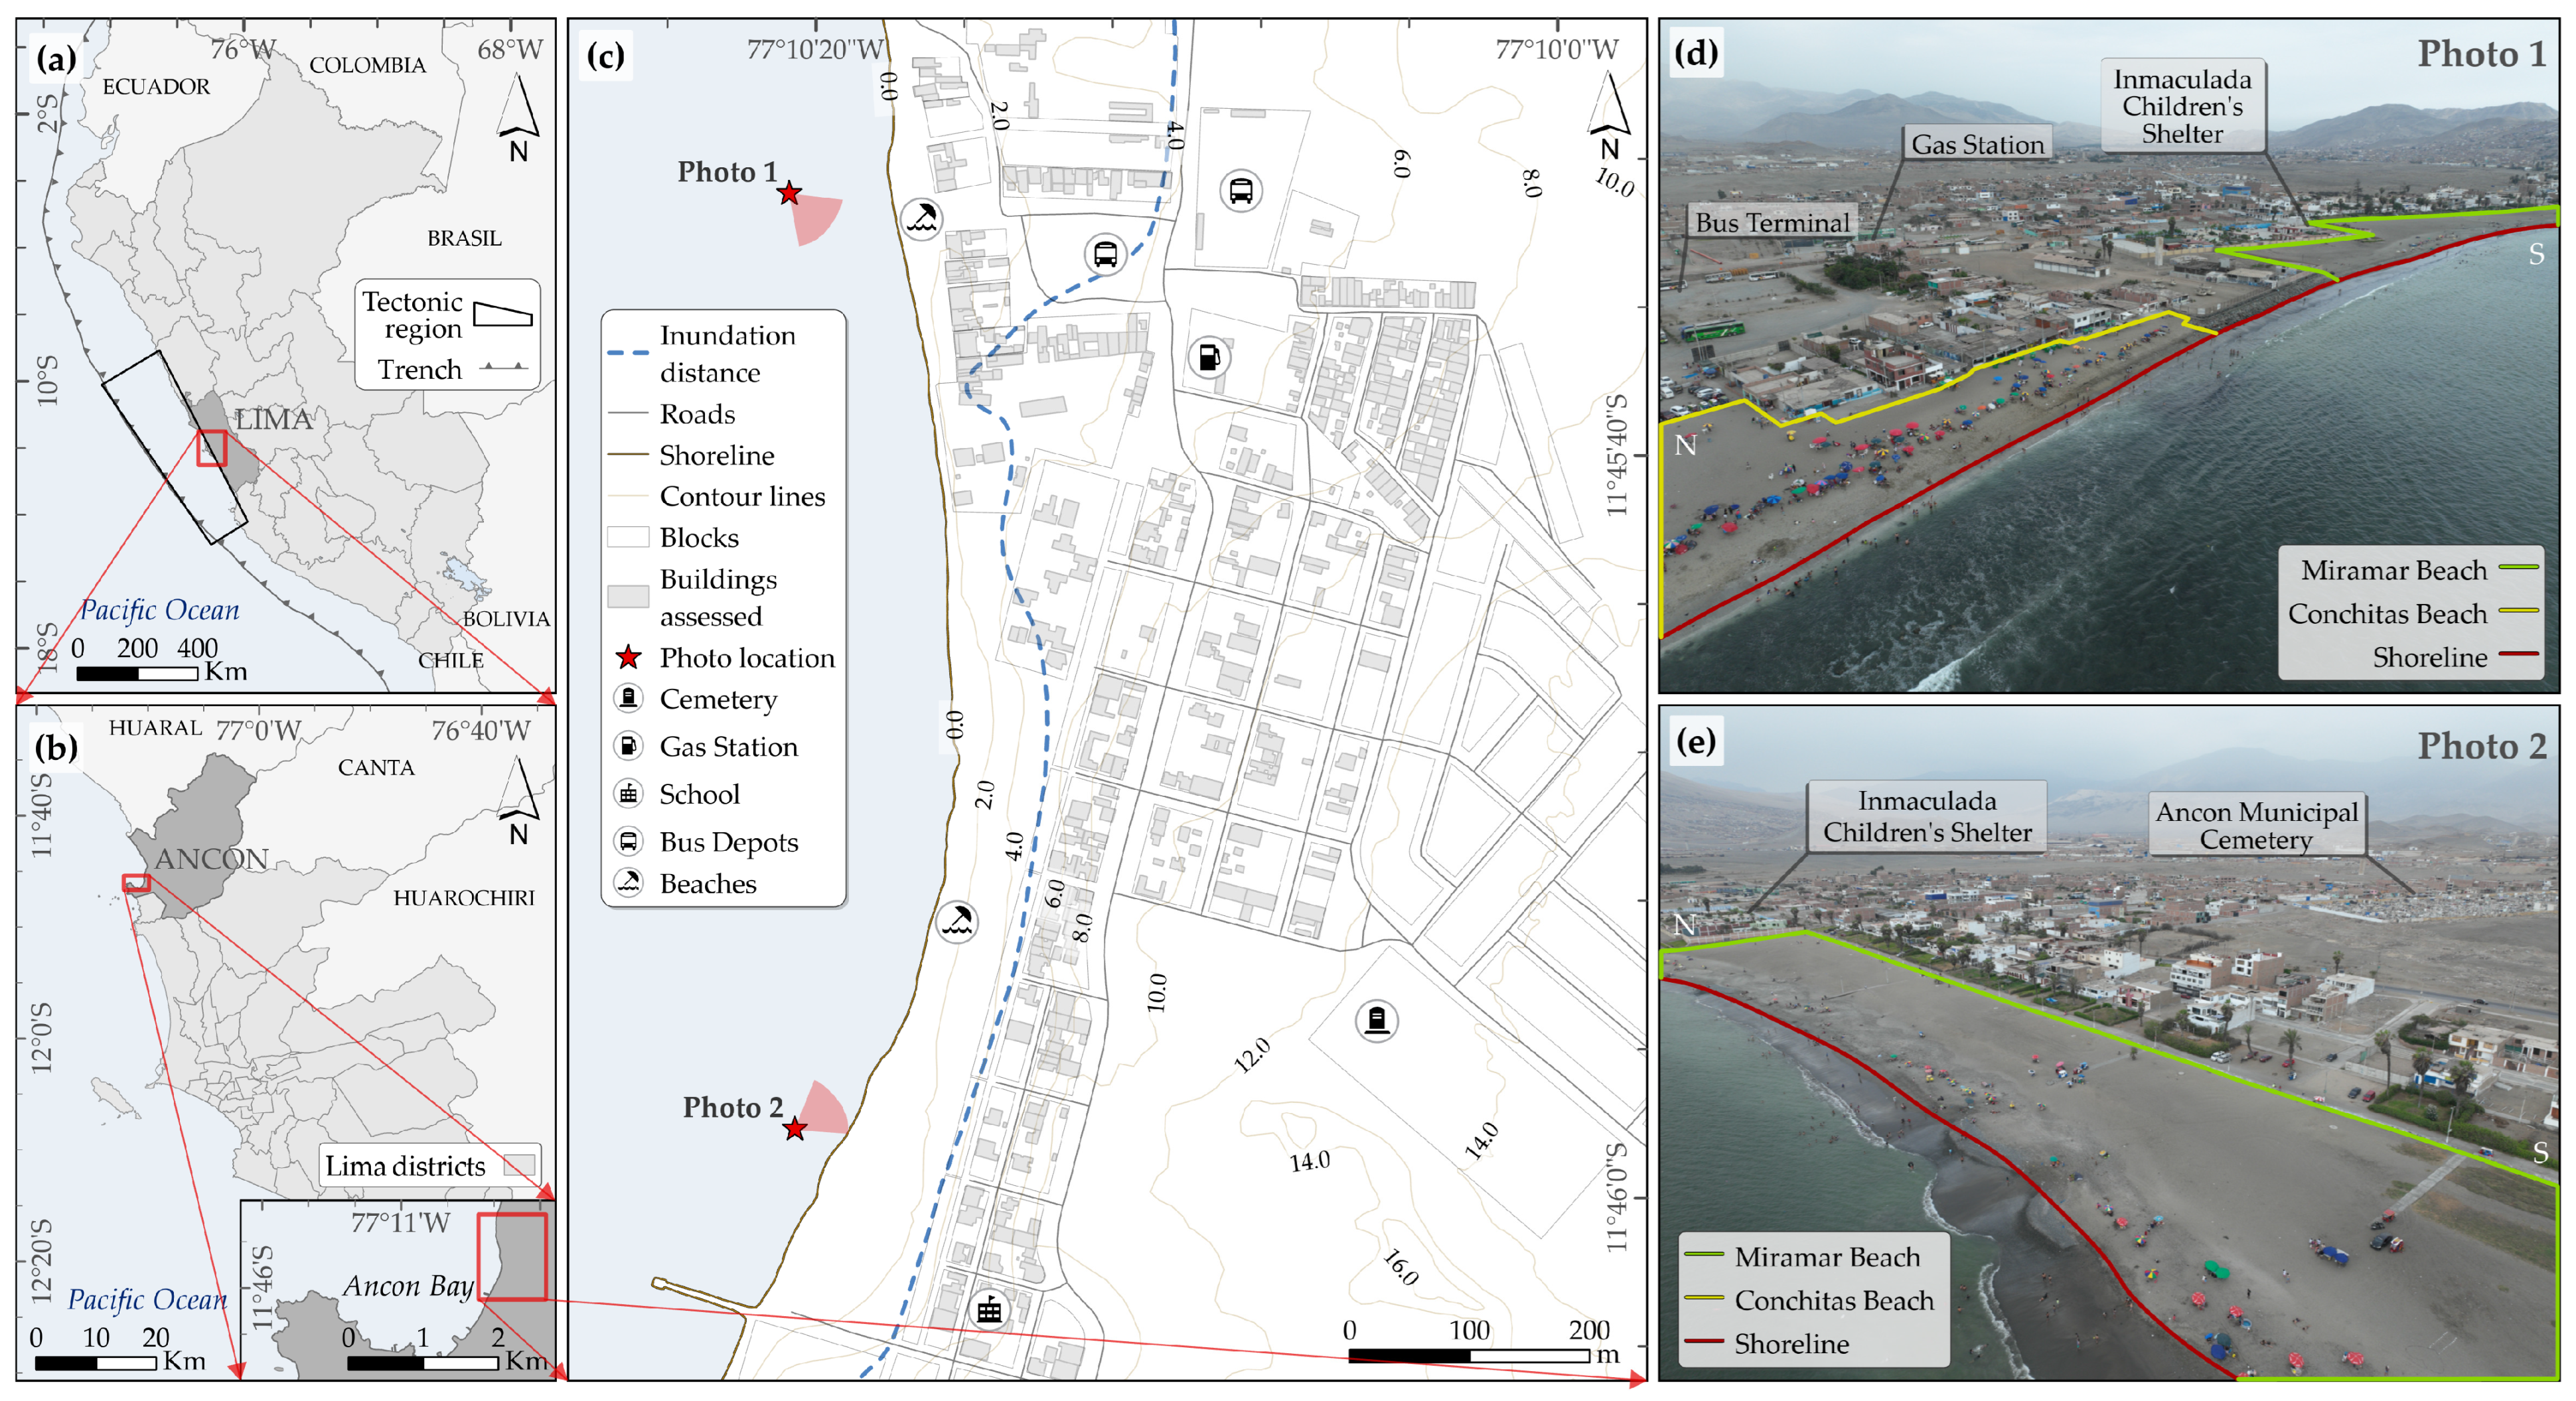
The district of Ancon, located in the province of Lima, has a population of approximately 63,000 inhabitants [49] and is well known for its diverse tourist attractions. The most popular tourist destination is Ancon Bay (Figure 2), which offers a variety of recreational activities, including surfing, sport fishing, and swimming [44]. Despite the severe social and environmental impacts of the oil spill at La Pampilla Refinery in January 2022 [50], Ancon Bay attracts over 30,000 visitors each week during the summer season [51].
Ancon Bay is situated within the Central Peru subduction zone (Figure 2a), a tectonic region that has experienced several large-magnitude earthquakes, including the 1746 Lima–Callao earthquake ( M w 9.0) [52], which triggered a devastating tsunami [53]. Studies on earthquake recurrence indicate that the central part of this tectonic region, which includes Ancon Bay, faces a higher seismic hazard than other areas [54,55], increasing the likelihood of tsunami events.
This study focuses on the eastern sector of Ancon Bay (Figure 2b), which includes two popular beaches, Miramar (Figure 2d) and Conchitas (Figure 2e), both attracting locals and tourists [44]. Figure 2c depicts the urban infrastructure of the study area, where the presence of schools, a gas station, and other critical facilities highlights the need for a detailed vulnerability assessment.
Figure 2. Locations of the following: (a) Central Peru subduction zone; (b) Ancon Bay. (c) Urban infrastructure and features of the study area, with the blue segmented line indicating the official tsunami inundation distance for the most likely earthquake scenario in Lima ( M w 8.5) [56]. Locations of two aerial photos: (d) northern sector, toward southeast; (e) southern sector, toward northeast.
Drones 09 00402 g002

2.3. High-Resolution UAV Photogrammetric Surveys

In this section, we describe the UAV photogrammetry surveys conducted to obtain high-resolution data for the proposed PTVA-4 model. This process includes oblique photogrammetry (Section 2.3.1), for 3D urban reconstruction-based SV assessment, and nadir photogrammetry (Section 2.3.2), for DEM-based tsunami hazard and WV assessment. The parameters of the flights are detailed in Table 1, which summarizes the specifications and settings for both the oblique and nadir photogrammetry surveys.

2.3.1. UAV Oblique Photogrammetry

The acquisition of building data for SV assessment was conducted by using oblique UAV images rather than nadir ones. Previous studies have shown that nadir images alone are insufficient for capturing building facade features due to occlusion and limited perspective [57,58]. In contrast, oblique images enhance vertical geolocation accuracy and provide multiple viewing angles, enabling detailed 3D reconstruction [59]. Consequently, building attributes can be extracted more effectively [34], supporting various engineering evaluations, including seismic damage prediction studies [35,36]. Similarly, in this research study, we utilized oblique images to generate a high-resolution 3D model, enabling a comprehensive assessment of the Bv and Surr factors.
The UAV employed for this task was a DJI Mavic 3E (DJI, Shenzhen, China), equipped with advanced obstacle avoidance sensors that ensure safe takeoff and landing in confined areas, such as urban environments, providing a significant advantage over fixed-wing UAVs [60]. Additionally, the DJI Mavic 3E features a Global Navigation Satellite System (GNSS) antenna capable of collecting Real-Time Kinematic (RTK) data, facilitating 3D photogrammetric reconstruction by reducing reliance on extensive geodetic surveys. However, vertical accuracy may be affected when Ground Control Points (GCPs) are not used [61]. Therefore, GCPs were incorporated to improve georeferencing accuracy. For detailed specifications of the DJI Mavic 3E and flight parameters, see Table 1.
For the flight plans, we performed oblique collection with a camera tilt angle of 45°, as high oblique angles have been shown to improve the geometric accuracy of image blocks [58]. The flight paths were configured to run both parallel and perpendicular to the building facades, ensuring the generation of a high-quality point cloud of the buildings [35]. In addition, a pre-processed digital elevation model (DEM) was incorporated to optimize flight paths. The captured aerial images were then processed by using DJI Terra (version 4.3.0), a software application that employs an efficient matching algorithm to enhance reconstruction quality for building modeling [62].
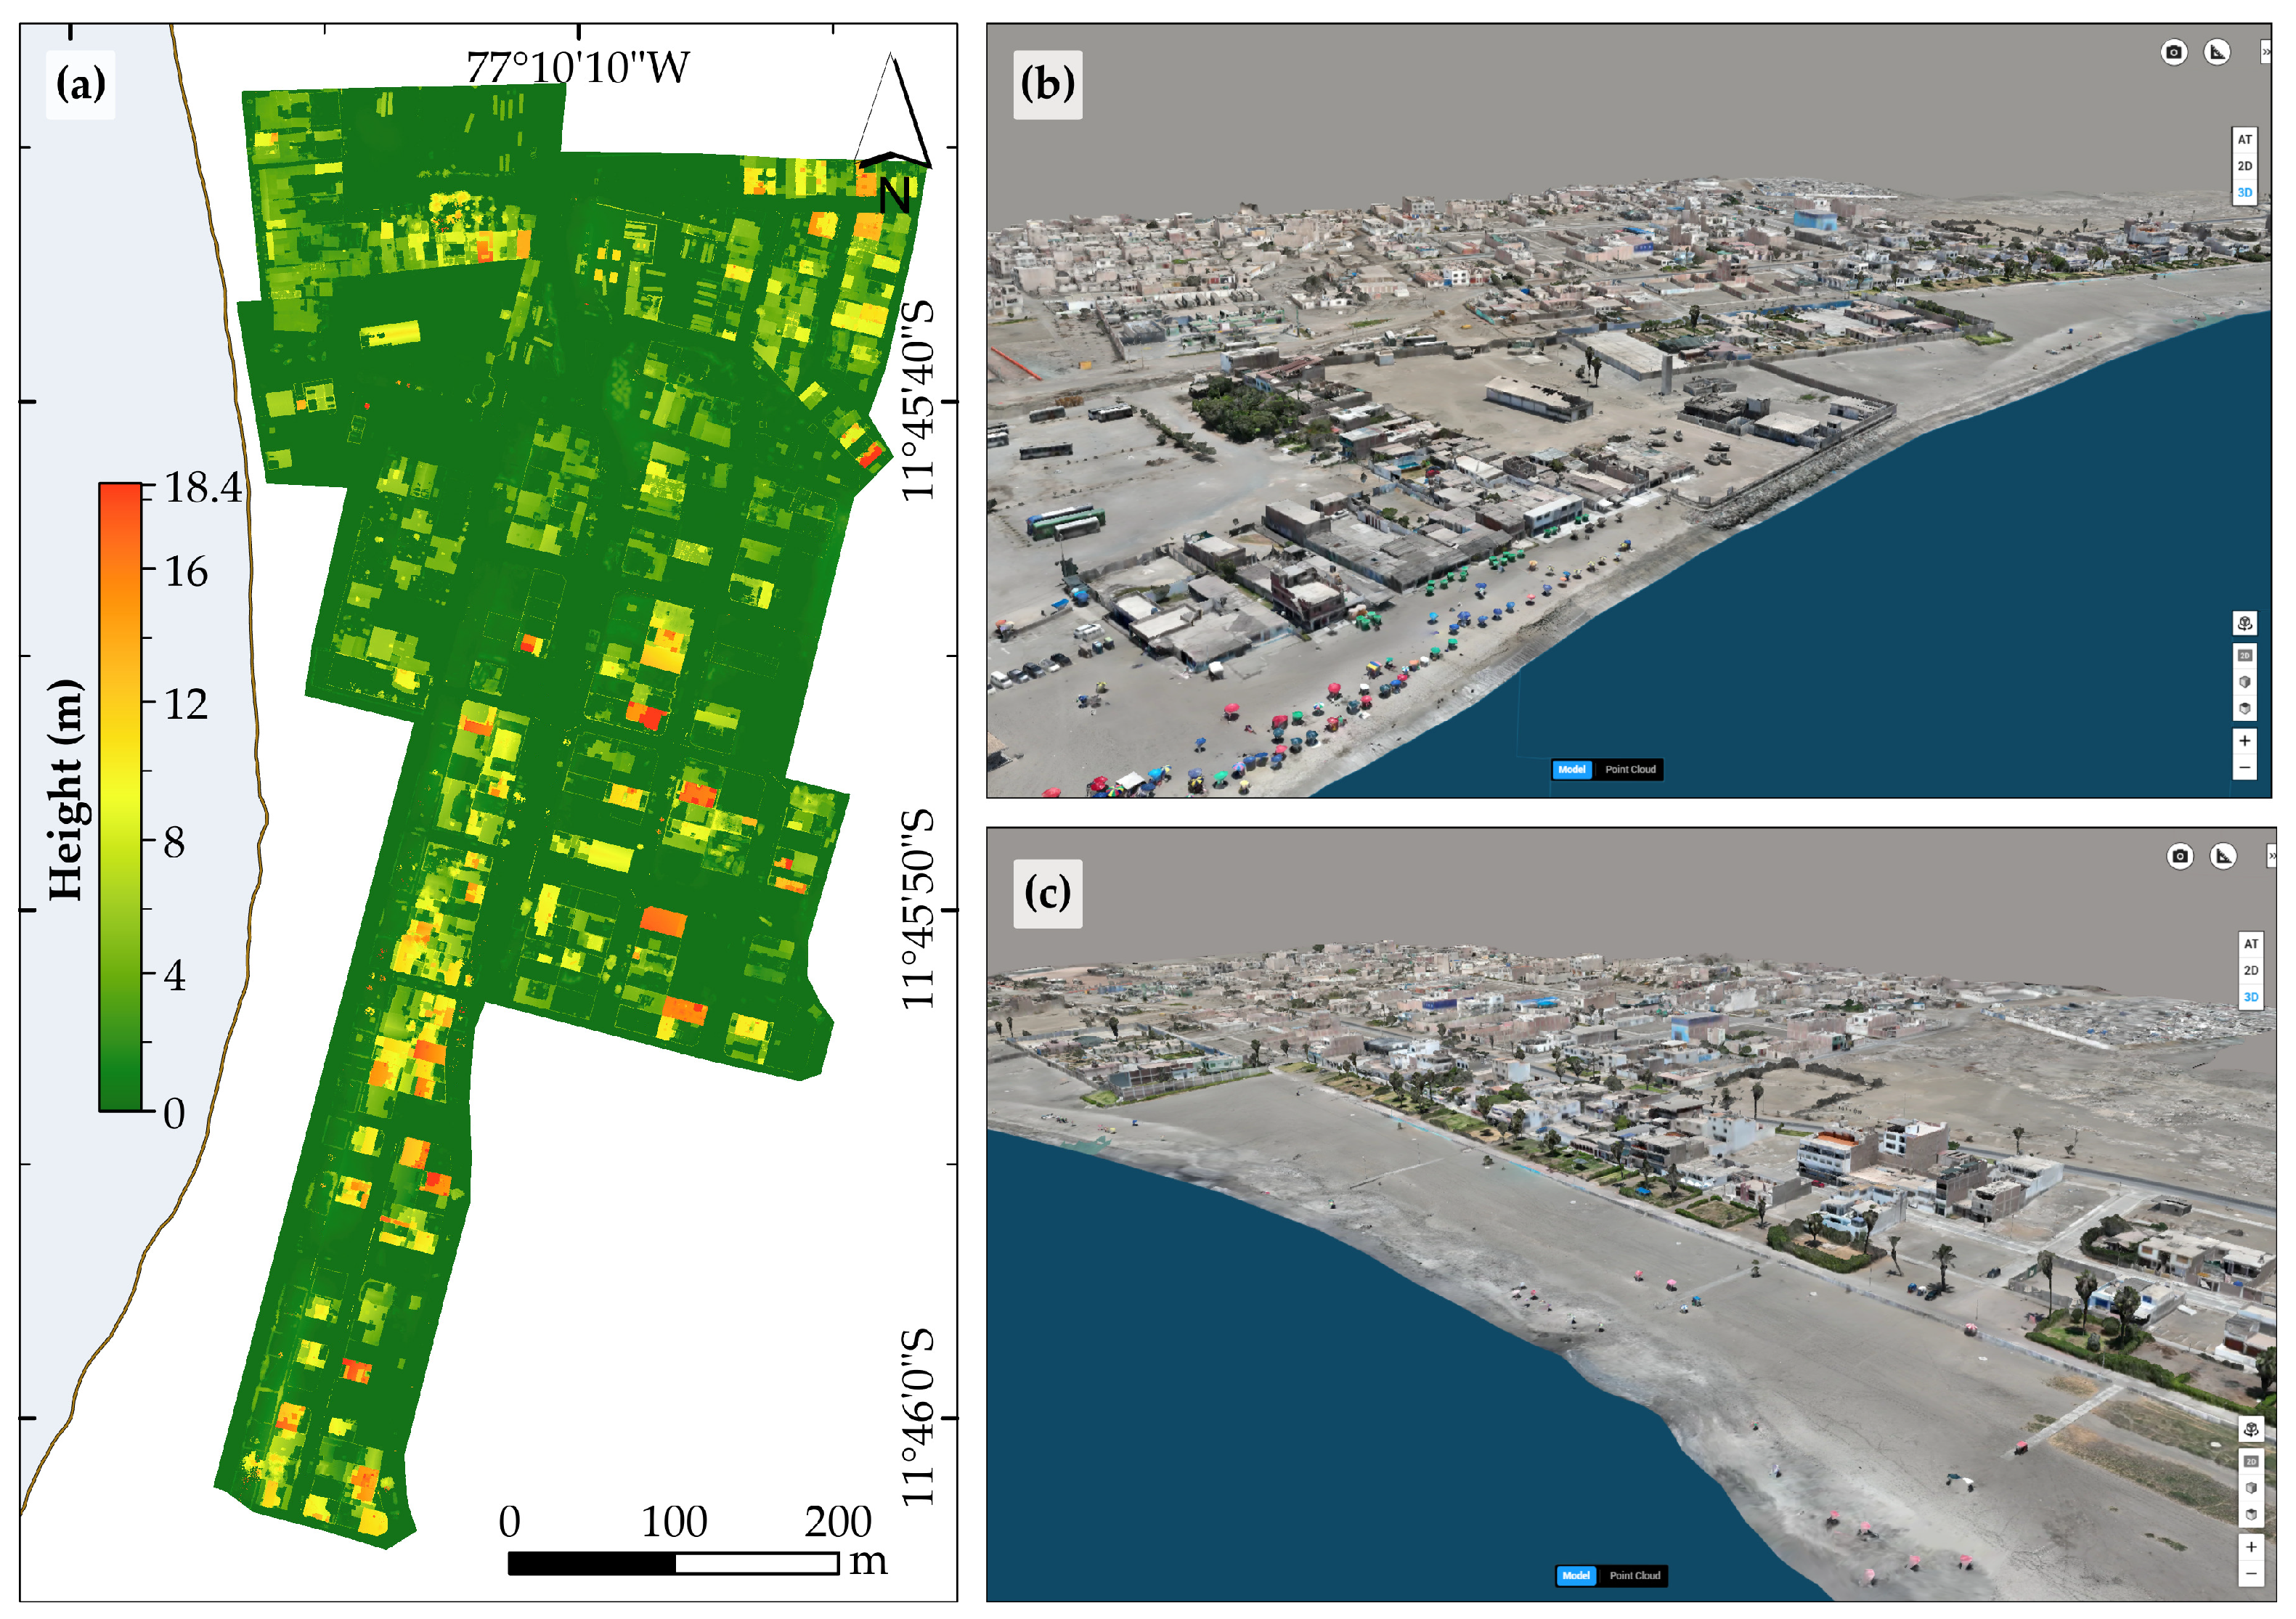
Among the photogrammetric products, the normalized Digital Surface Model (nDSM) of the study area, computed as the difference between the DSM and the Digital Terrain Model (DTM), is displayed in Figure 3a. The nDSM represents the absolute elevation of objects above the ground level, enabling the optimal extraction of building attributes such as footprints [35] and the estimation of the number of floors [34]. Additionally, a 3D model of the study area was generated and was further used to extract building attributes for the PTVA-4 model. As shown in Figure 3b,c, the 3D model successfully represents the buildings and the surrounding environment, matching the aerial photos shown in Figure 2d,e.

2.3.2. UAV Nadir Photogrammetry

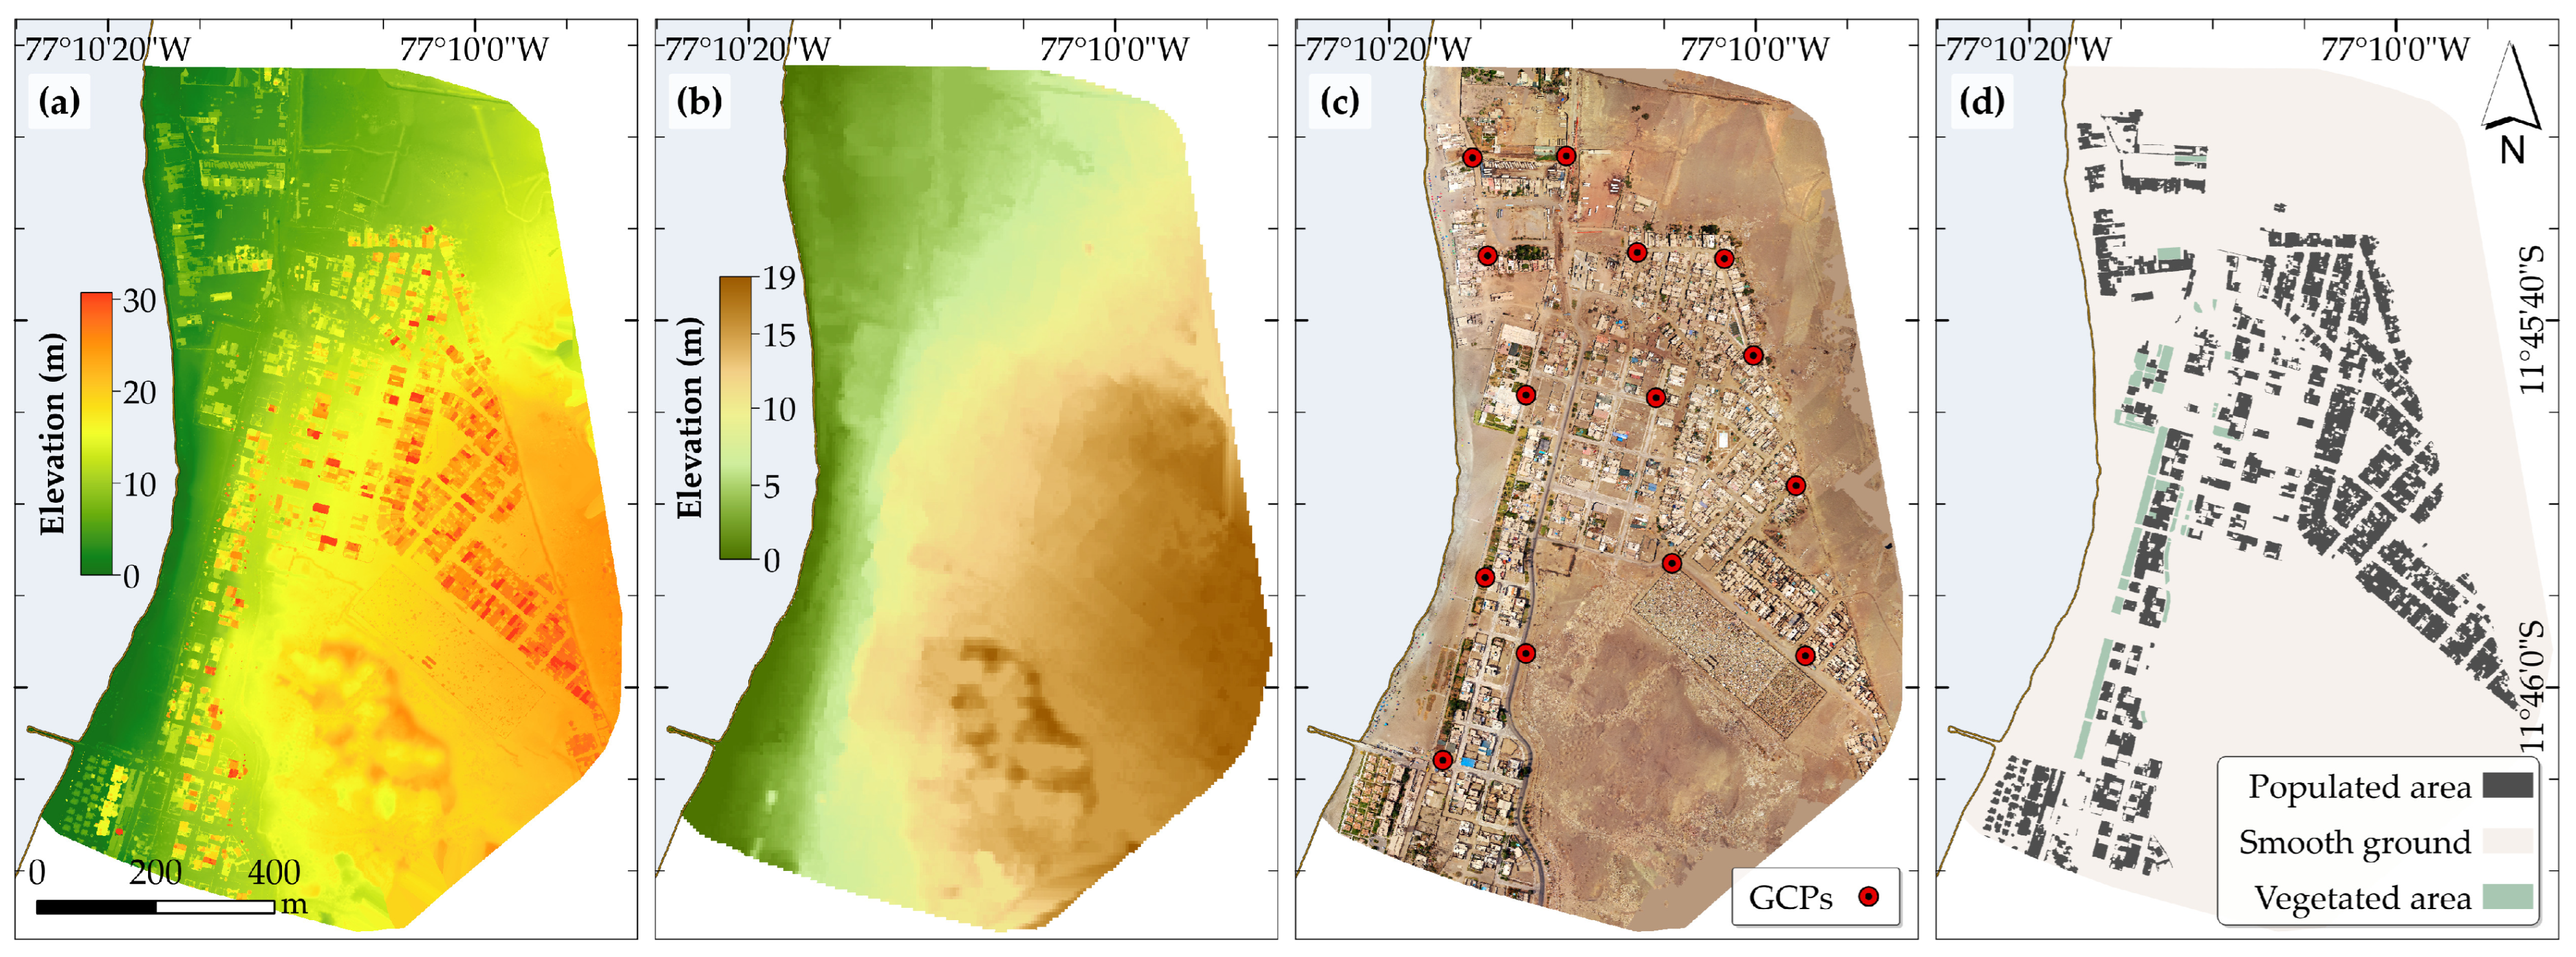
A topographic survey was conducted by using nadir UAV images captured with the DJI Mavic 2 Pro (DJI, Shenzhen, China), with flight parameters listed in Table 1). Given the relatively flat terrain of the study area (Figure 2d,e), oblique imagery, commonly used to mitigate geometric distortions in complex topographies [58], was not required. To improve georeferencing accuracy, GNSS technology was employed with the GCPs shown in Figure 4c, which were evenly distributed at photo-identifiable locations across the study area. The collected images were then processed by using Pix4D software (version 4.8.4), which allows one to perform effective terrain filtering by reducing the influence of anthropogenic objects, thereby enhancing the accuracy of the topographic model [63]. The main results of image processing are shown in Figure 4.
To enhance terrain representation, a filtering process was applied to the DSM (Figure 4a) to generate the DTM (Figure 4b), revealing that the highest elevations are concentrated in the southeastern region of the study area. Additionally, land-use information (Figure 4d) was derived from the Digital Orthophoto Map (DOM; Figure 4c) based on visual interpretation, a highly accurate technique for small-scale studies [29,64]. Figure 4d shows that smooth ground is the predominant land use, followed by populated areas and small patches of vegetation.
The DTM and land-use data are fundamental inputs for tsunami inundation modeling, as shown in Figure 1 (top). The DTM defines the ground elevation and is essential to simulating the inundation phase, while land-use data represent surface roughness and resistance, which influence tsunami flow [65].

2.4. Tsunami Hazard Assessment

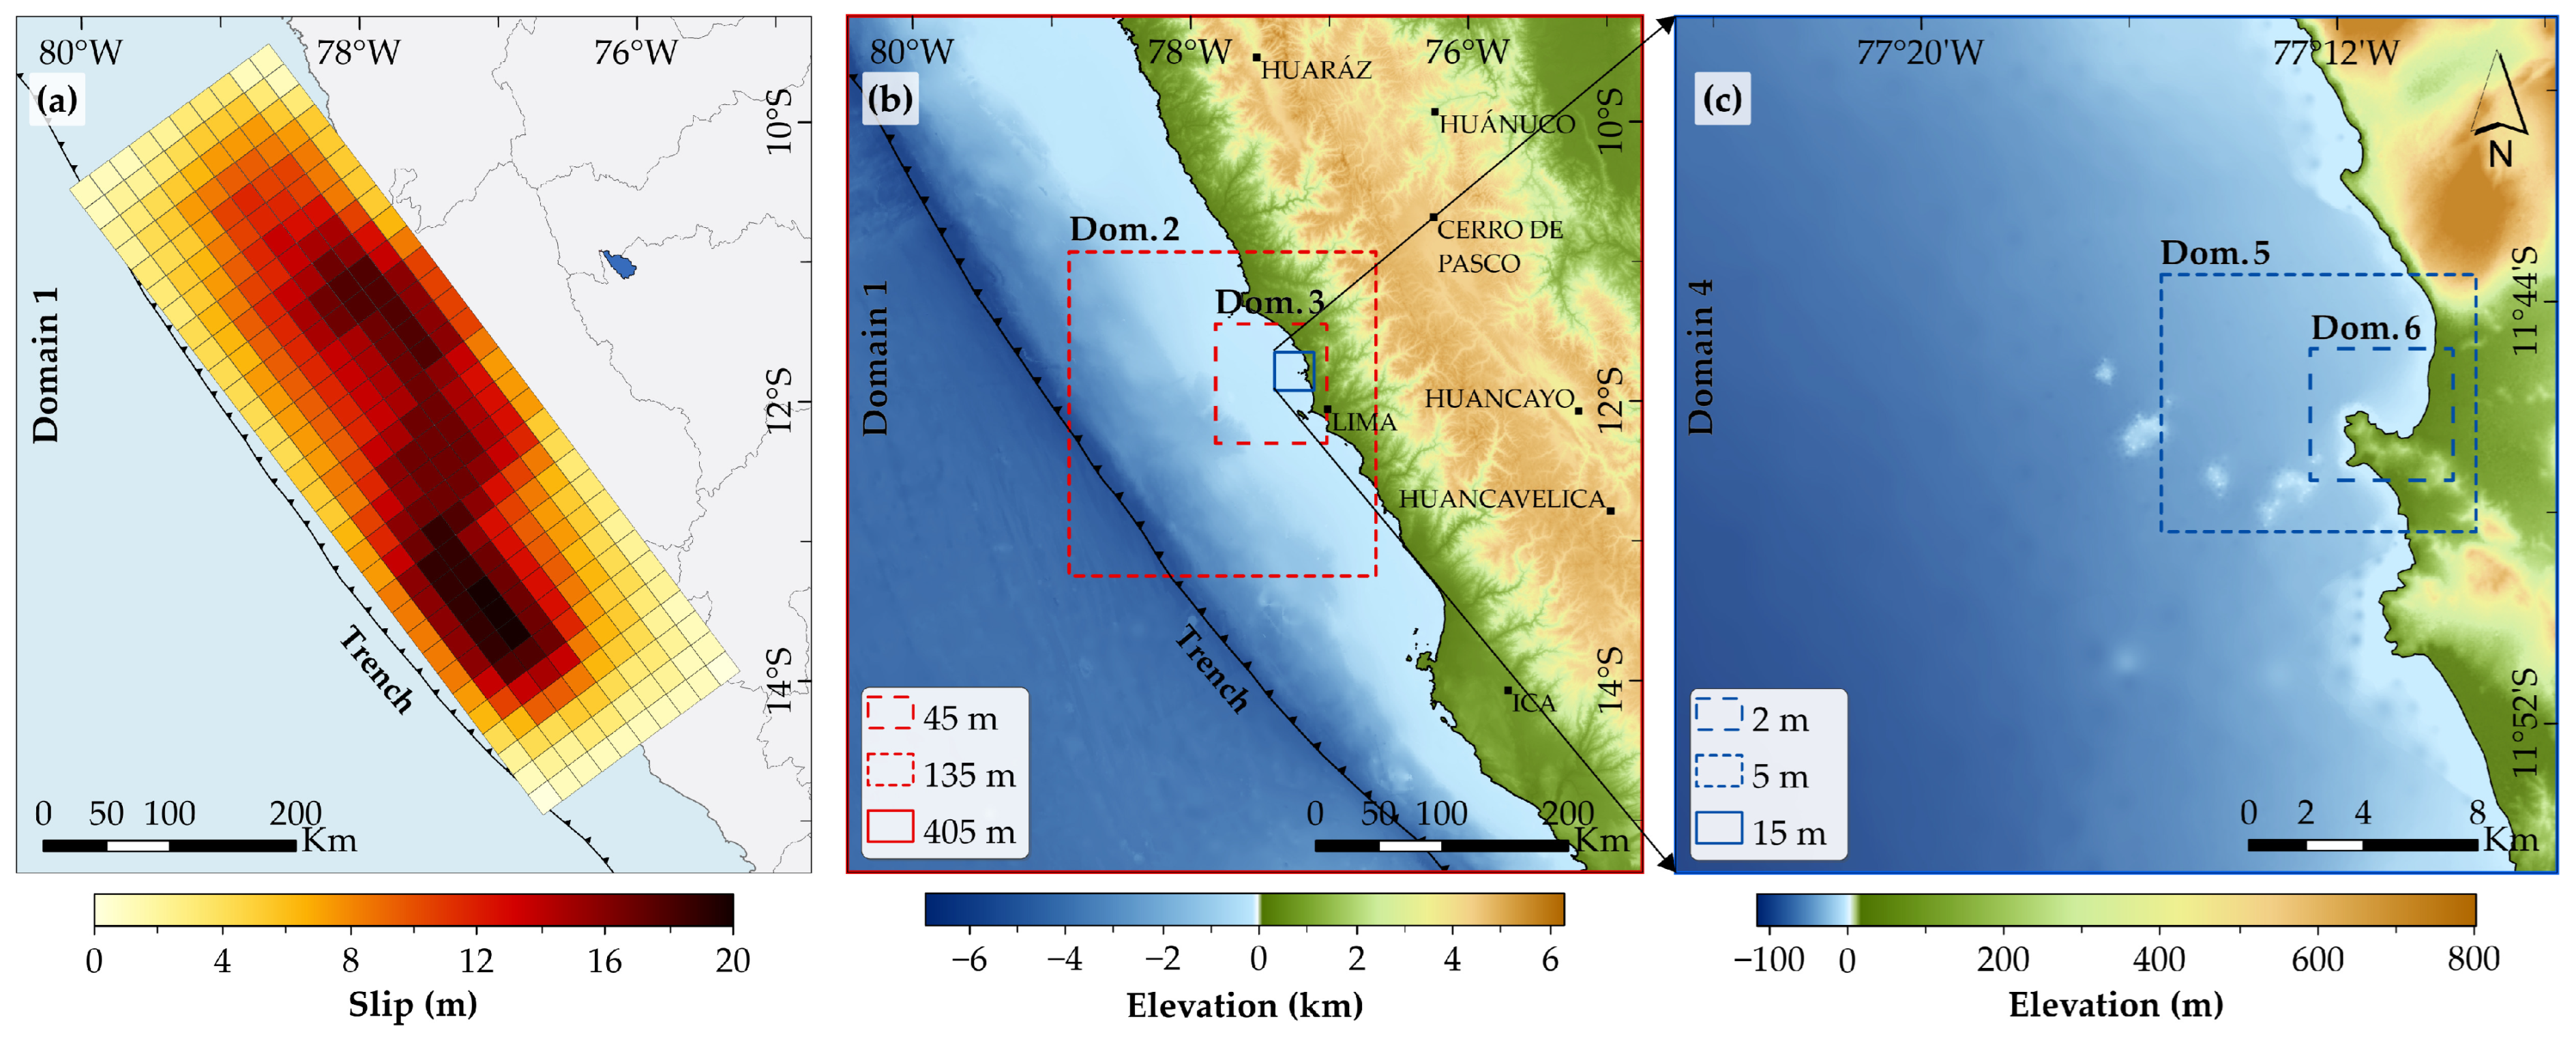
Figure 5a shows the tsunami source scenario analyzed in this study, representing the potential worst-case scenario among the ten heterogeneous slip models proposed by [66], who derived it based on the linear inversion of the accumulated shear stress in the subduction zone, resulting in an M w 8.95 earthquake that could potentially impact the central region of Peru (Figure 2a). This magnitude is consistent with maximum expected values for this region, as supported by moment deficit estimates [67] and seismic catalog-based assessments [68]. While the use of a single worst-case scenario aligns with the objective of demonstrating UAV-based vulnerability assessments, future studies could enhance the generalizability of results by incorporating stochastic slip models [69] and expanding the application of a Probabilistic Tsunami Hazard Assessments (PTHAs) framework, as conducted by [17] within the PTVA-4 model. However, the lack of hazard data for the central coast, including Ancon Bay, currently limits such analyses, as PTHAs have primarily been applied to the southern coast of Peru [70].
The seismic source consists of 310 sub-faults, each measuring 20 km × 20 km, leading to a total rupture length of 620 km and a width of 200 km. Similar to the interseismic coupling model of the Nazca megathrust described by [67], the slip model (Figure 5a) features two main asperities: one located 45 km northwest of Ancon Bay, with a maximum slip of 17.5 m, and the another 200 km southwest of Ancon Bay, with a maximum slip of 19.1 m. Consequently, the great slip along these asperities, combined with the proximity of the rupture, is the cause of the high exposure of the study area to near-field tsunamis.
By using a set of bathymetric and topographic data, we constructed a nested grid system comprising six domains with grid resolutions ranging from 405 m to 2 m (Figure 5b,c). For the first two domains, elevation data from the General Bathymetry Chart of the Ocean (GEBCO) were resampled to 405 m and 135 m. The bathymetry data for the third to sixth domains were derived from nautical charts provided by Direccion de Hidrografia y Navegacion (DHN) and resampled to match their respective resolutions. The topography data for the third to fifth domains were obtained by resampling Shuttle Radar Topography Mission (SRTM) data, while for the sixth domain (at the highest resolution), we used the DTM obtained with UAV photogrammetry (Figure 4b) to generate a 2 m grid.
Based on the slip distribution in Figure 5a, we first calculated the initial coseismic deformation by using the formulation by [71]. This deformation was then used as the sea surface displacement for the initial condition of tsunami propagation. Then, we employed the Tohoku University Numerical Analysis Model for Investigation of Near-field Tsunamis No. 2 (TUNAMI-N2) to conduct the tsunami numerical simulation. This model solves the set of two-dimensional nonlinear shallow water equations, shown in Equations (4)–(6), by using a finite difference method with a staggered leapfrog scheme [46,47].
The tsunami simulation was conducted by using the TUNAMI-N2 model for a total computation time of 3 h with a time step of 0.05 s. Using the DTM instead of the DSM ensures a more accurate hazard assessment, which allows for the identification of safe places, such as tsunami shelters, since buildings and vegetation may be destroyed by the tsunami [39]. For this reason, we applied the Equivalent Roughness Model (ERM), which accounts for building resistance without explicitly incorporating building features into the DEM [65]. This approach integrates elevation data from the DTM (Figure 4b) and land-use data (Figure 4d) to assign roughness coefficients that represent building resistance. The bottom roughness coefficients were set to 0.025 m−1/3s for the ocean and smooth ground, 0.03 m−1/3s for the vegetated areas, and 0.045 m−1/3s for the populated areas [72].
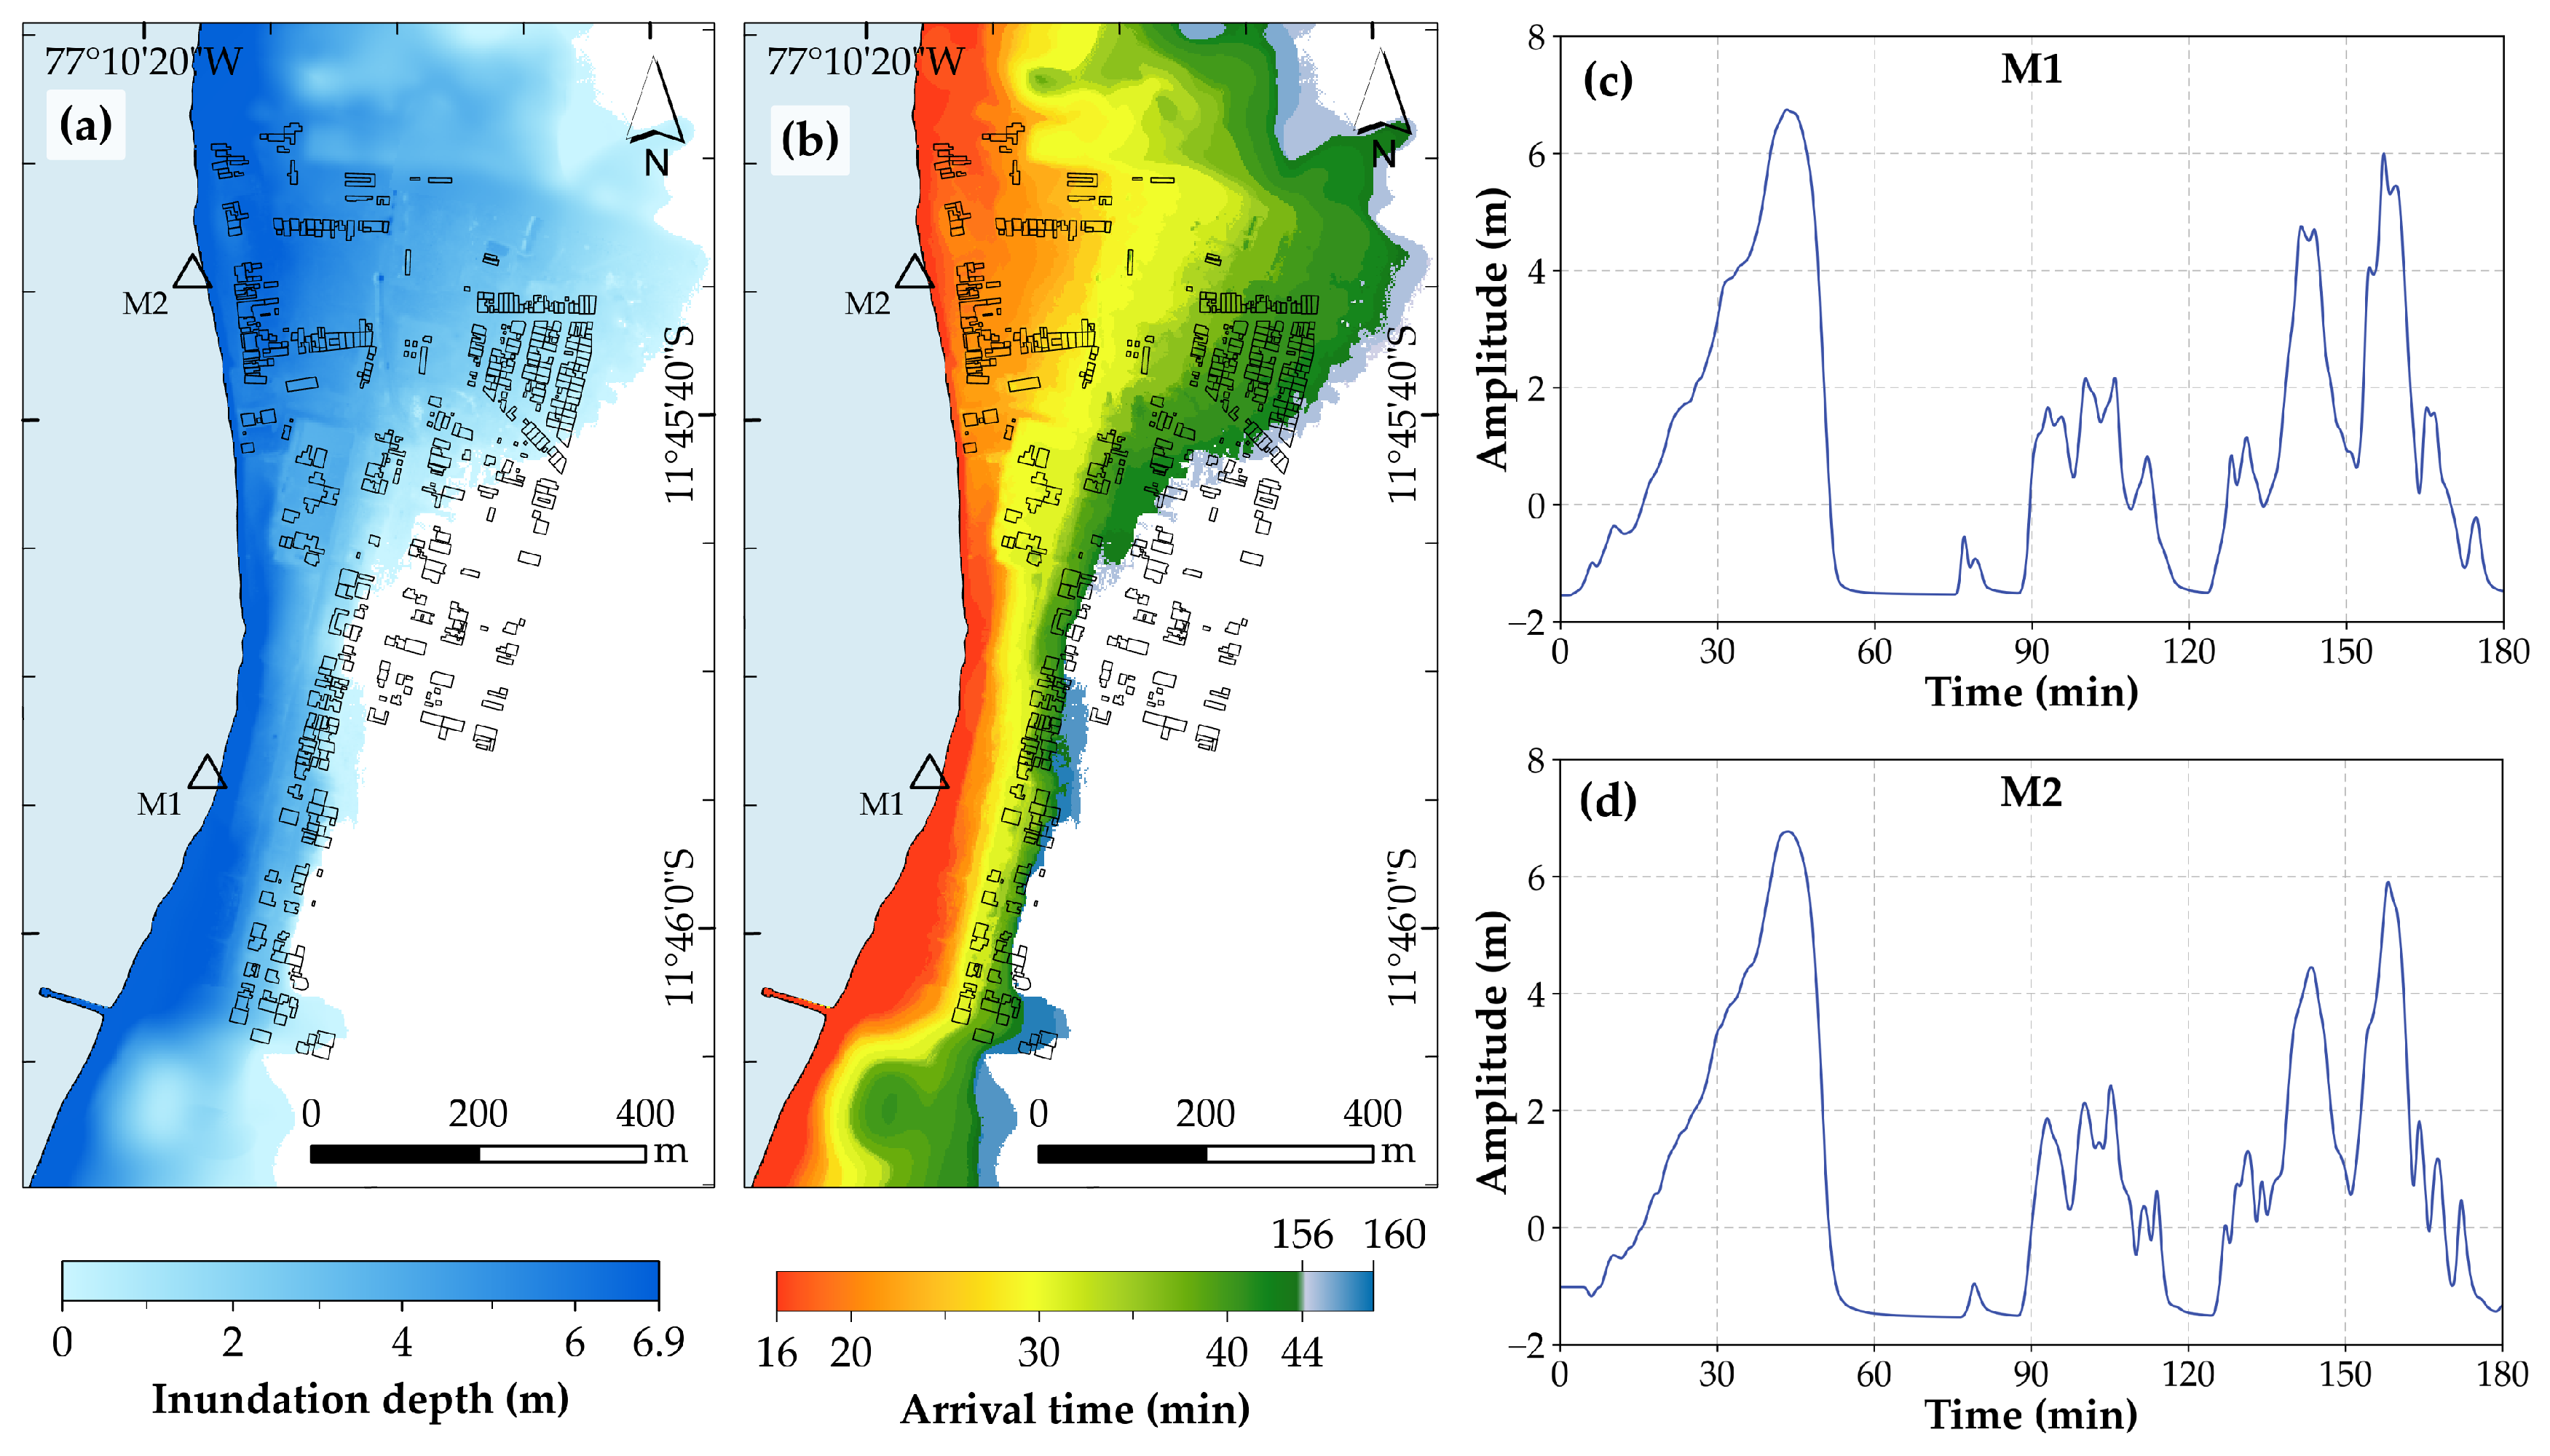
Tsunami inundation was modeled in the sixth domain, and the results are shown in Figure 6. The inundation map (Figure 6a) shows a maximum inundation depth of 6.9 m and an affected area of 0.42 km2. The horizontal inundation extent would reach up to 600 m and 200 m in the northern and southern regions, respectively, suggesting that the northern sector would experience greater impacts. Additionally, Figure 6b illustrates tsunami arrival times, and the synthetic tsunami heights at two coastal recording points (M1 and M2) are shown in Figure 6c,d. At both gauges, the tsunami would arrive 16 min after the earthquake and reach its maximum amplitude of 6.7 m at 44 min. If a complete evacuation were necessary in the northern region (the most affected area), an average person walking at 1.2 m/s [73] would take 8.3 min to reach the inundation limit, located 600 m inland. Notably, wave amplitudes greater than 4 m would persist two hours after the mainshock, with some areas experiencing their maximum tsunami intrusion during this period (Figure 6b). This highlights that the initial wave does not always cause the most extensive inundation, as observed in the 2004 Indian Ocean tsunami [74].
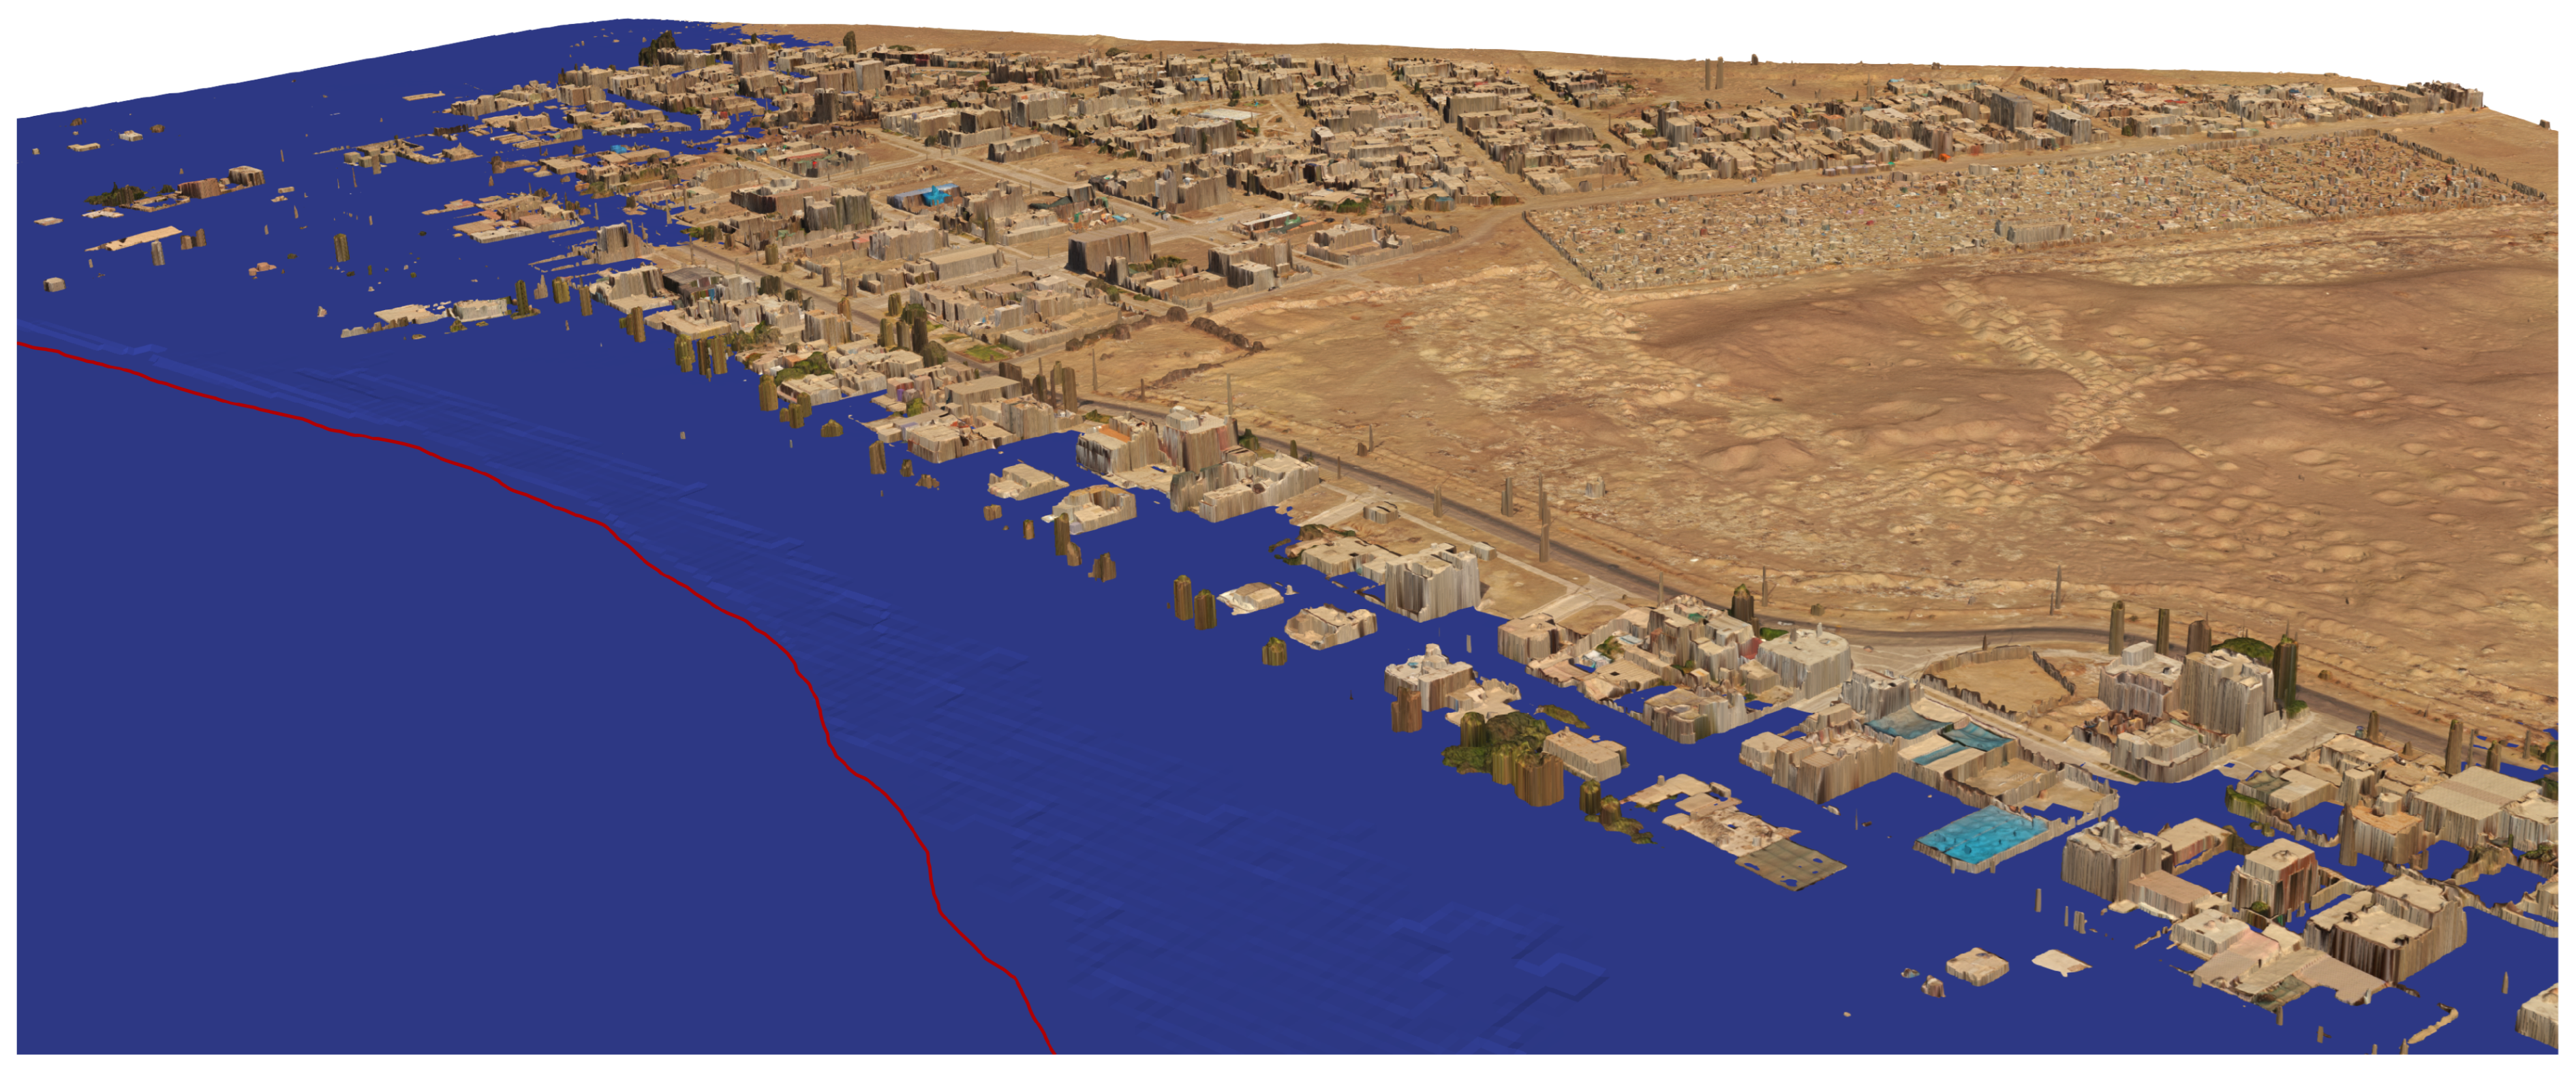
Figure 7 displays a 3D visualization of tsunami inundation at the moment the first wave would reach its peak (minute 44; see Figure 6c,d). UAV photogrammetry is valuable not only for generating high-resolution inundation maps [29,38,75,76], as shown in Figure 6a, but also for constructing detailed three-dimensional representations of the inundation. These 3D models enhance the visual interpretation of the event, making it more comprehensible for the general public through animation [42]. Moreover, they facilitate the identification of shelters and evacuation routes [32,77], enhancing emergency response planning.
The 3D model (Figure 7) reveals that inundation in the northern region would be severe, with numerous buildings becoming completely submerged. Given this, vacant land beyond the inundation limit could serve as a potential safe refuge for evacuees. In contrast, inundation in the southern region would be less severe, affecting the first row of buildings and partially impacting the second row. This suggests that the central and southern bare ground areas, which have the highest elevation (Figure 4b), could serve as safe refuges.

2.5. Building Attribute Extraction

To collect the data required for the PTVA-4 model (Figure 1, middle), we first delineated individual building footprints by using the official cadastre [49] and the DOM (Figure 4c). A detailed visual inspection was then conducted for each building by using the 3D model generated with UAV oblique photogrammetry (Figure 3b,c). Although visual interpretation remains constrained by the interpreter’s expertise, automated extraction methods offer a promising solution for future large-scale applications. Moreover, compared to manual video inspection, which can be limited by occlusions, 3D models facilitate not only the extraction of building attributes from multiple angles but also the measurement of certain attributes, such as the height of perimeter walls and coastal protection structures.
The extracted information on building attributes and the surrounding environment was classified according to the PTVA-4 model into five vulnerability levels: very high, high, average, moderate, and minor. These data and the maximum inundation depth of each building were stored in a Geographic Information System (GIS) geodatabase. A total of 452 buildings were analyzed, 375 of which were located within the inundation area (Figure 6a). The results for each attribute are summarized in Table 2.
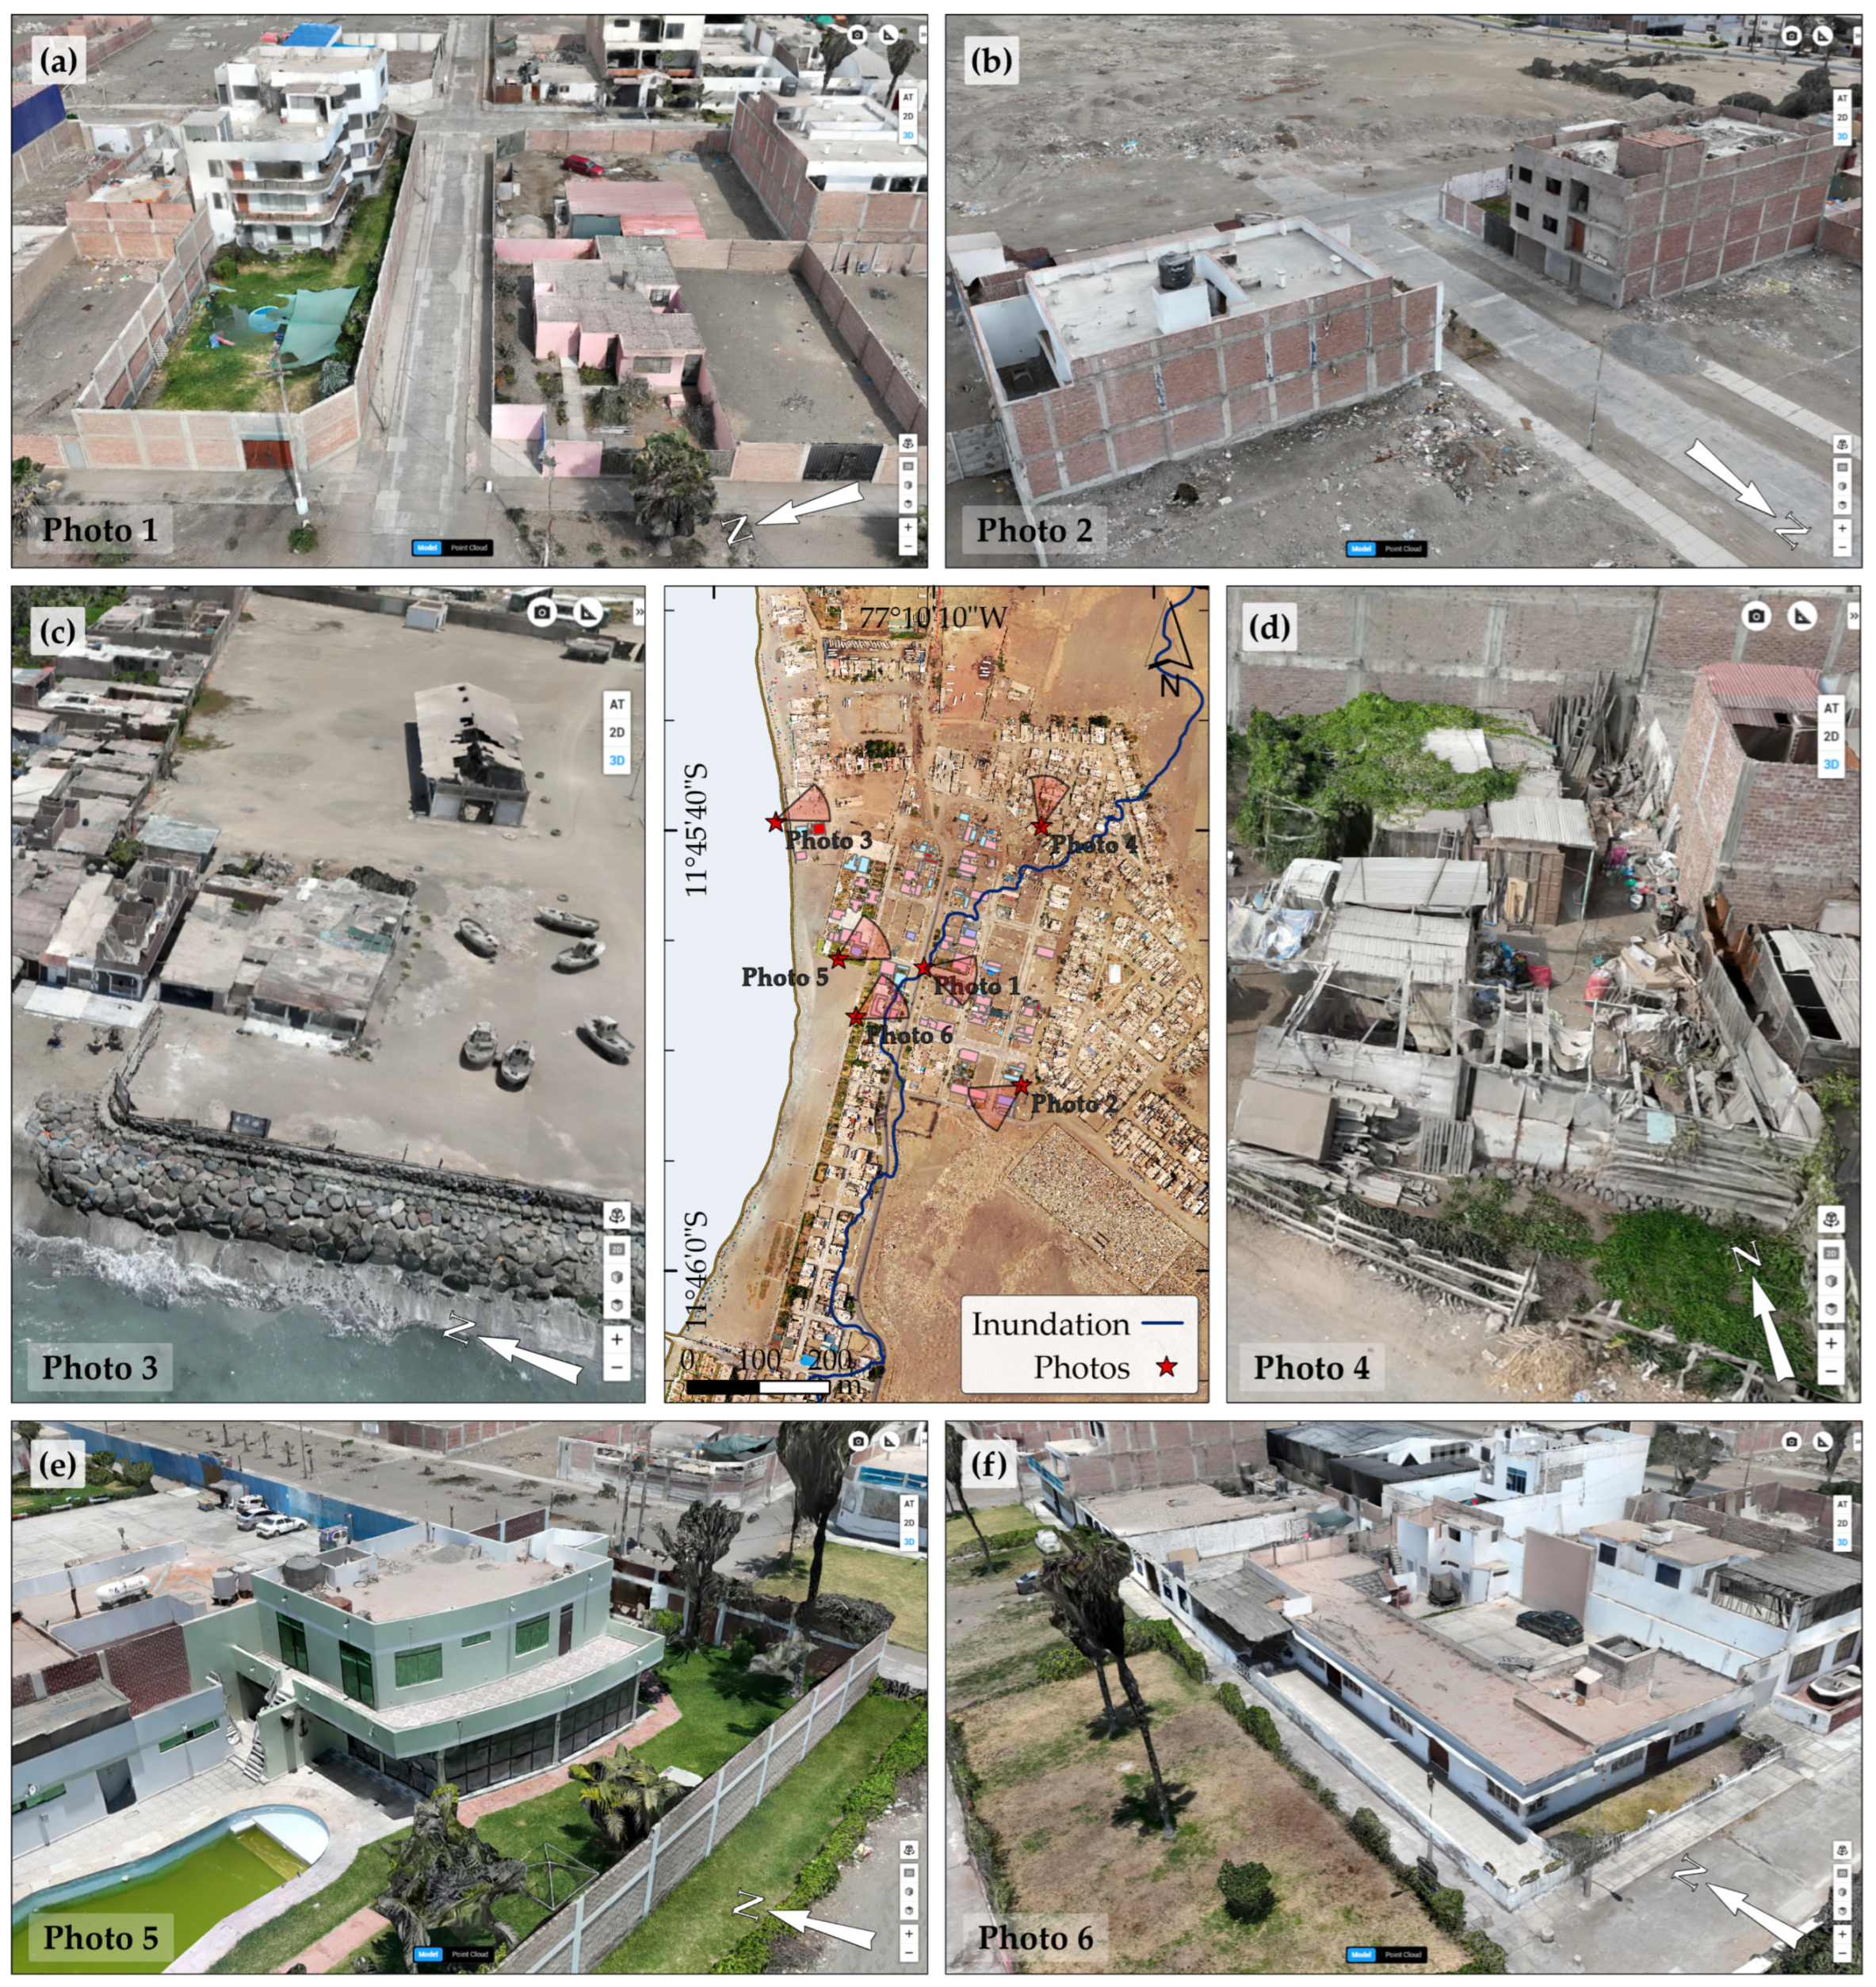
Examples of the 3D model-based survey are shown in Figure 8. One of the main advantages of the proposed approach is its ability to assess buildings that are not accessible or visible from public areas. Figure 8a illustrates three cases where brick walls obstructed visibility, making on-site surveys unfeasible. Out of the 452 buildings, 100 were not visible from public areas due to perimeter walls, fences, and vegetation. However, we successfully conducted the survey despite these obstacles.
By examining the Bv components in the study area, we found that masonry was the predominant construction material (m), with buildings featuring brick walls being confined by reinforced concrete (RC) tie beams and columns (Figure 8b), followed by timber constructions (Figure 8d) and a few RC buildings. Regarding the number of stories (s), most buildings had one or two stories, which are associated with higher vulnerability. Additionally, the majority of buildings lacked an open-plan ground floor (g), increasing wave impact [20], while only a few had ground floors surrounded by glass windows (Figure 8e). Foundation strength (f) was not directly assessed but inferred from the m and s attributes. In terms of footprint shape (sh), most buildings were square and rectangular, reflecting the urban design. However, many had lengthened rectangular or complex shapes, which are both associated with higher vulnerability (Figure 8f). Lastly, the majority of buildings were in average preservation conditions (pc), while some were in poor or very poor conditions (Figure 8c,d).
The second component of SV (i.e., Surr) was also assessed by using the 3D model. Buildings were relatively uniformly distributed up to the tenth row (br). The study area contained a single seawall (sw), shown in Figure 8c. Buildings near the seawall were classified as highly vulnerable, while the rest were categorized as very highly vulnerable. In addition, buildings were classified as having no protection due to the absence of natural barriers (nb). The existence of movable objects (mo), such as boats stored in vacant lands (Figure 8c), bus depots (Figure 2c), and parked vehicles near the beaches, increases building vulnerability. Finally, we found that many buildings had perimeter brick walls (w) (Figure 8a,e), which provide some protection against flood inundation [20].

3. Results and Discussion

3.1. Structural and Water Vulnerability

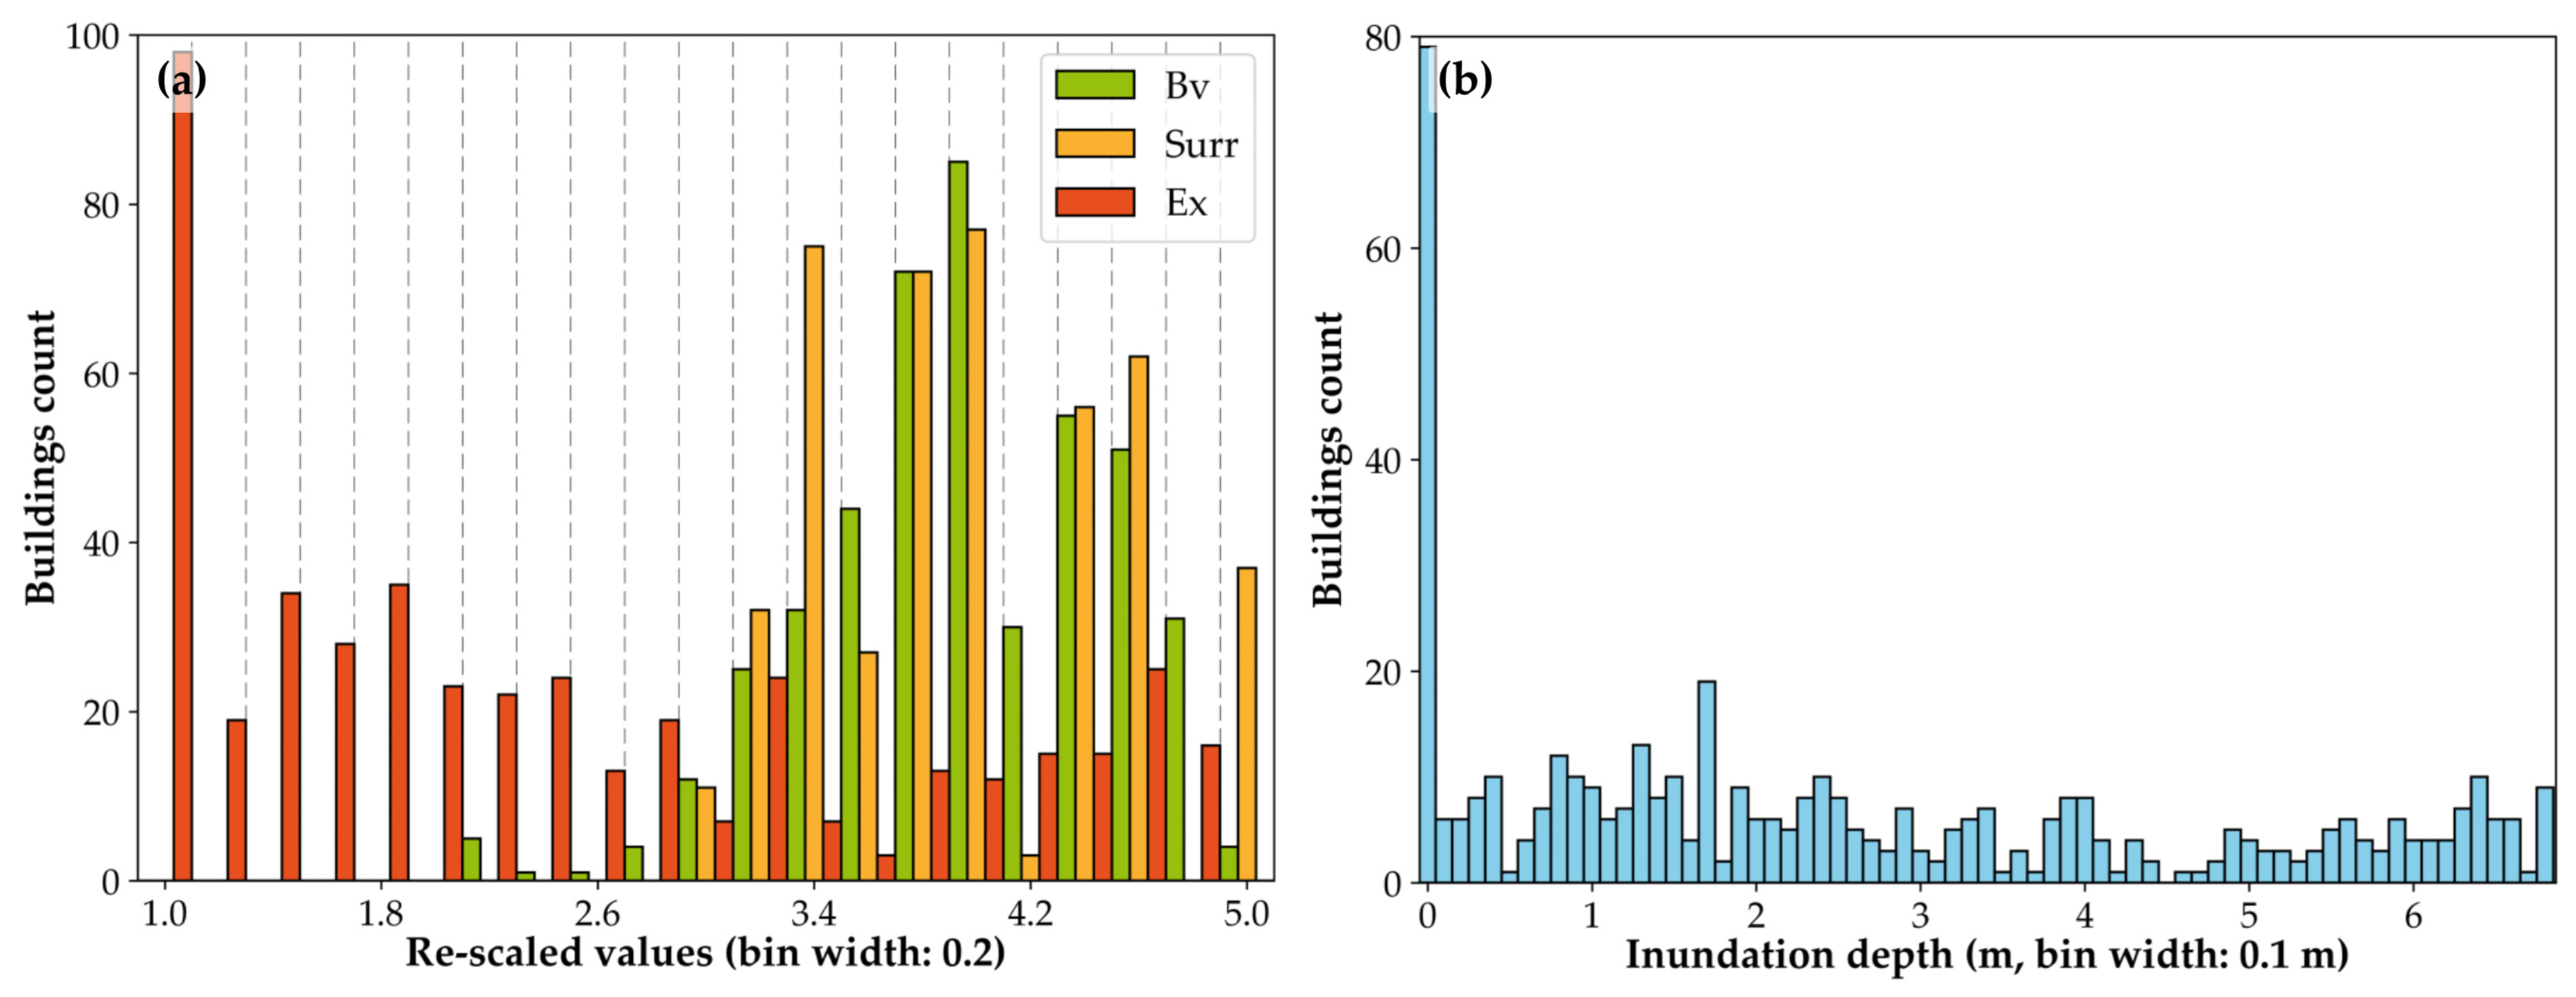
After the extraction of the building attributes, each parameter was assigned a specific value based on the PTVA-4 model (Table 2). The Bv and Surr scores were then calculated by using the equations shown in Figure 1 (middle), while Ex was determined based on the inundation map (Figure 6a). Figure 9 illustrates the spatial distribution of the SV components (i.e., Bv, Surr, and Ex), whereas Figure 10a summarizes the results in a histogram.
Regarding Bv (Figure 9a), 74% of buildings exhibited high vulnerability levels, with 21% being categorized as very high, 17% as high, and 36% as average. These categories primarily comprise single-story timber constructions and masonry buildings with one or two stories. The remaining buildings were categorized as having moderate (22%) and minor (5%) vulnerability, including exclusively masonry and RC buildings. While m and s are the primary factors influencing Bv (Figure 1, middle), other attributes contributed to the variability observed across classification levels. Figure 10a shows that most buildings have high Bv scores, with the frequency increasing up to a score of 3.8 before declining.
In terms of Surr (Figure 9b), 22% and 13% of buildings were classified as having very high and high vulnerability, respectively, and mainly included those within the first three rows, where exposure to movable objects posed a very high or average risk. Among the remaining buildings, 18% were categorized as average, 21% as moderate, and 26% as minor and consisted of buildings up to the tenth row, where the risk posed by movable objects was generally very low. Additionally, since many buildings presented brick walls around them, their ratio relative to the corresponding inundation depth contributed to lower vulnerability levels in some cases. Figure 10a shows that similar to Bv, the Surr scores of most buildings are high, with peak frequencies occurring at values of 3.4, 3.8, and 4.0.
Finally, the results for Ex, representing the ratio between each building’s inundation depth (WD) and the maximum inundation depth ( W D m a x = 6.9 m), are shown in Figure 9c and indicate that 18%, 12%, 17%, 24%, and 29% of the buildings were classified as having very high, high, average, moderate, and minor vulnerability, respectively. Moreover, Figure 10a shows that a significant number of buildings exhibited the lowest Ex value, as they remained unaffected by inundation. The distribution of the remaining Ex values follows a pattern similar to that observed in the histogram in Figure 10b.
SV (Figure 11) was calculated by using Equation (2) based on the previously determined Bv, Surr, and Ex scores (Figure 9). Notably, 10% of buildings presented very high vulnerability and were primarily located in the northern region near Conchitas Beach. This is due to the presence of single-story timber constructions in the first rows, where they are highly susceptible to the risk posed by movable objects and direct exposure to inundation. In addition, 13% of buildings were categorized as having high vulnerability, 14% as average, 24% as moderate, and 39% as minor. While some buildings may have similar Bv scores to those near Conchitas Beach, their lower vulnerability to the surrounding conditions (Surr) and exposure (Ex) results in lower SV levels. Figure 12b indicates that the SV values are more concentrated in the lower range, with frequencies gradually decreasing as SV increases.
Regarding WV (Figure 11b), we applied Equation (3) with the inundation map (Figure 6a) and building height data (Figure 3a). The majority of buildings were classified in the extreme vulnerability levels, with 24% rated as very high and 65% as minor. This result is due to the fact that many buildings near Conchitas Beach would be completely inundated (Figure 7), whereas those in the back rows would experience little to no inundation. The remaining buildings were classified as having high (2%), average (5%), and moderate (4%) vulnerability. Figure 12b shows a similar pattern, with the highest frequencies occurring at the extreme WV values.

3.2. Relative Vulnerability Index

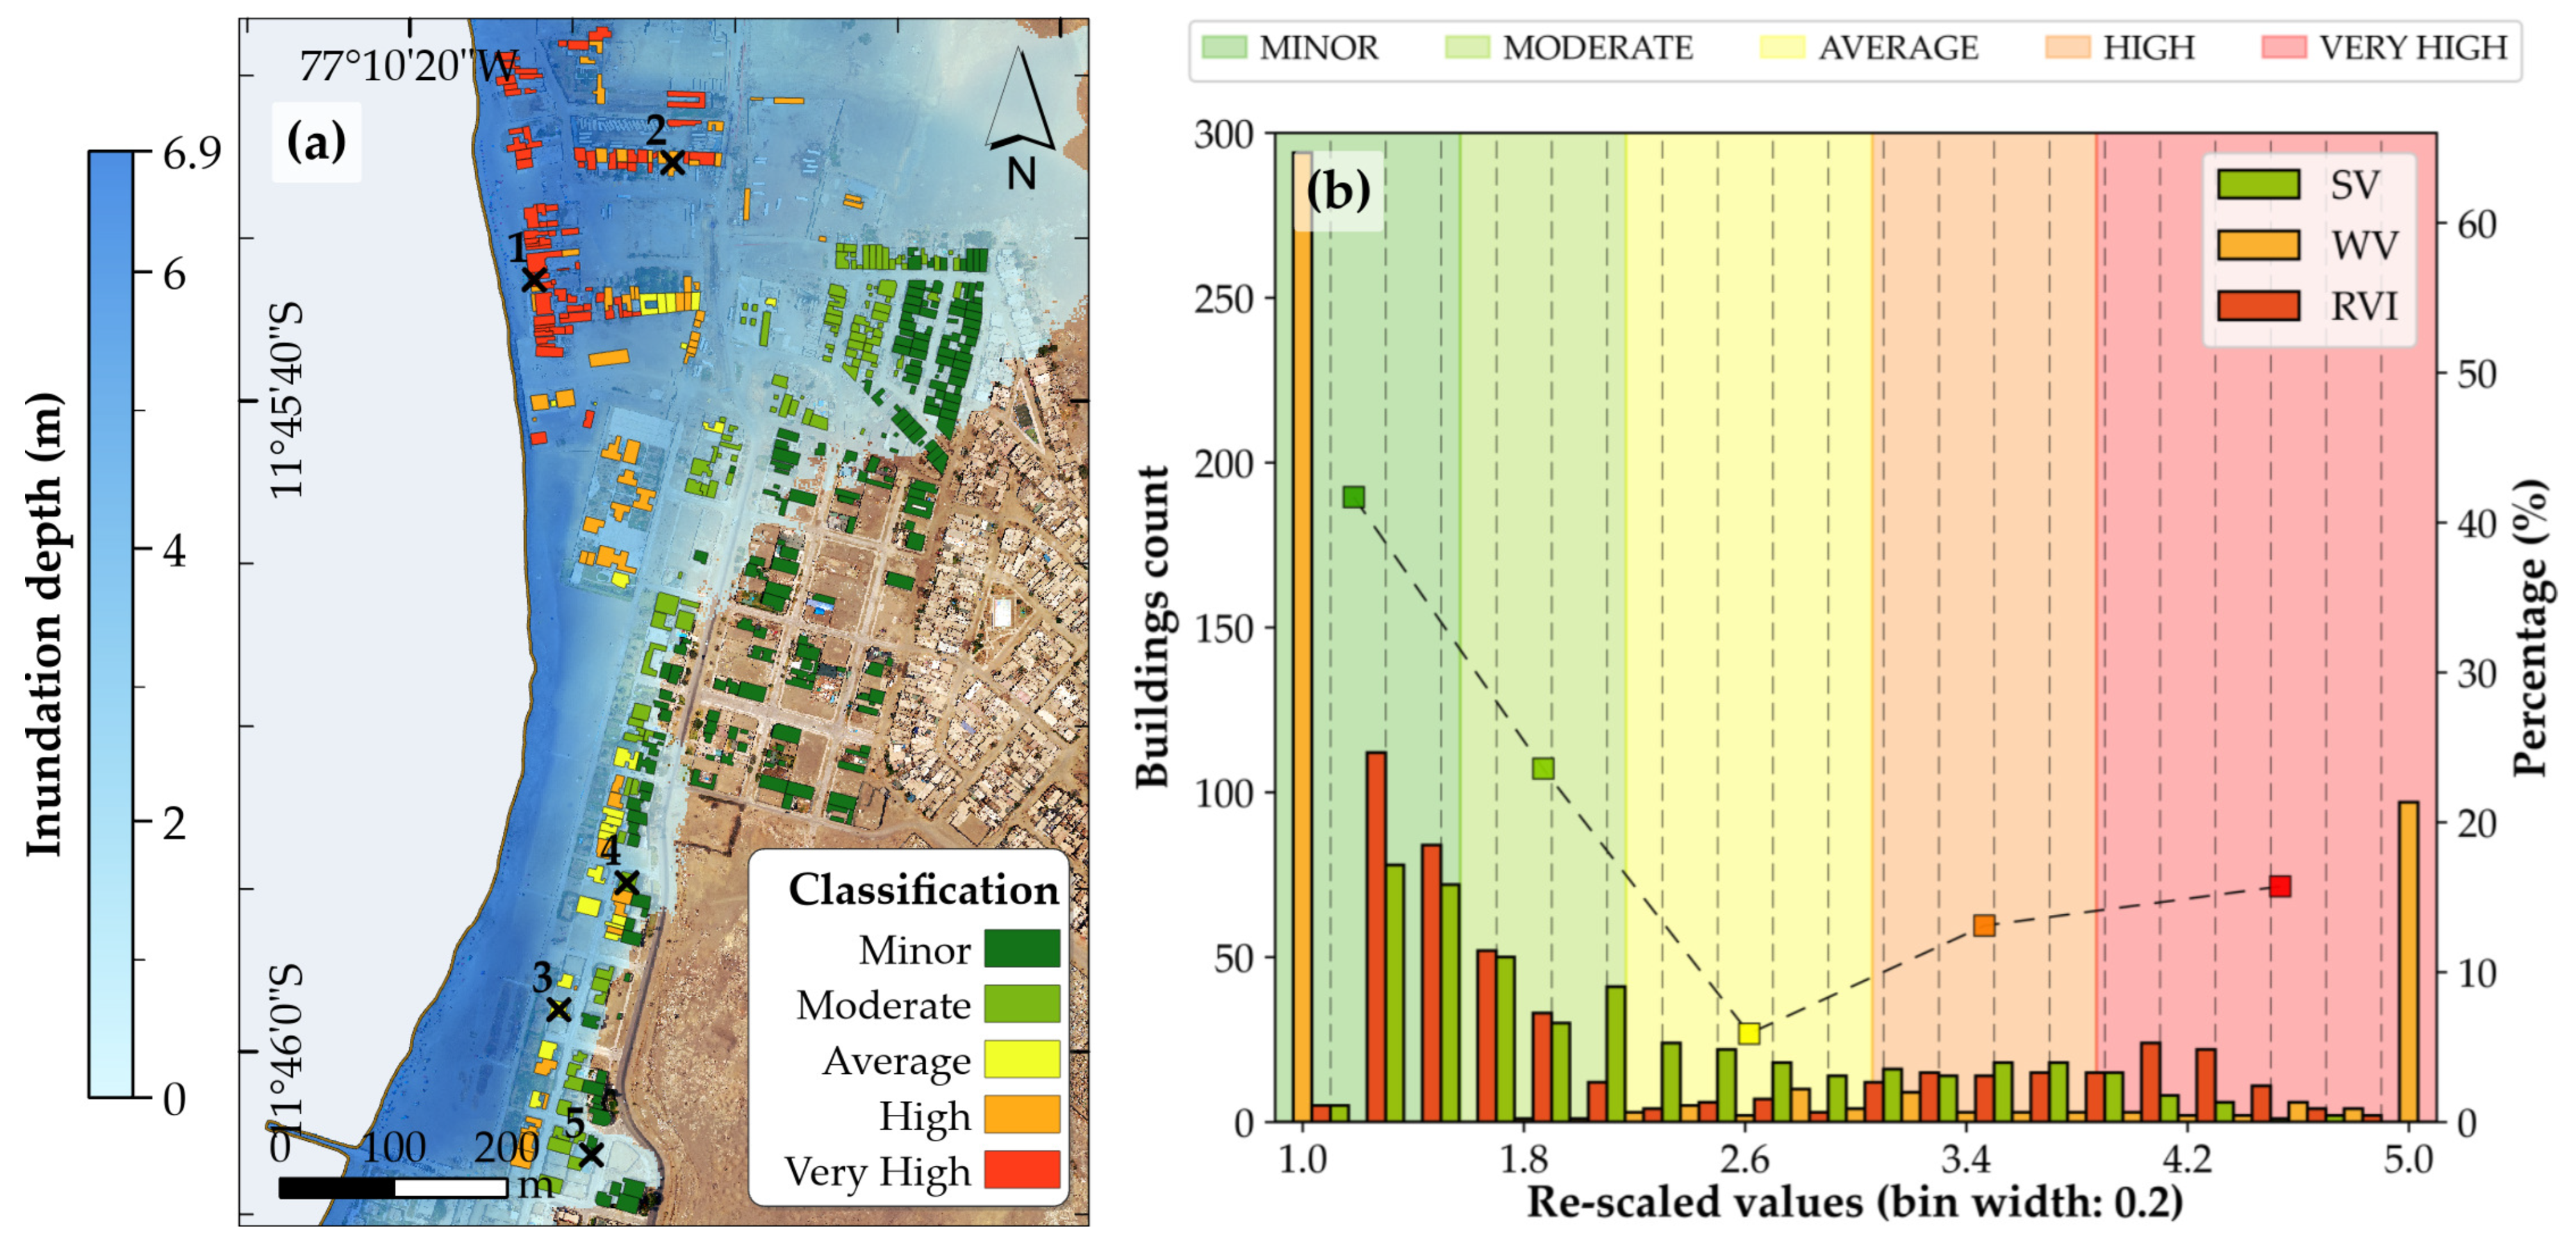
The RVI scores were calculated by using Equation (1) based on the SV and WV results. Figure 12a displays the spatial distribution of the RVI, whereas Figure 12b illustrates its frequency distribution, along with the classification into five vulnerability levels using Jenk’s Natural Breaks Algorithm. As expected, the results indicate that the buildings with very high vulnerability (16% of buildings) were located in the northern region near Conchitas Beach (Figure 12a), where inundation depths would exceed 5 m. Additionally, 13% were classified as having high vulnerability, 5% as average, 24% as moderate, and 42% as minor (Figure 12b). While many buildings exhibited minor vulnerability (primarily those that would not be inundated), 34% exhibited average to very high vulnerability. This evidences the exposure of a considerable number of buildings to tsunami impacts, particularly in areas with high SV (mainly masonry and timber constructions with one or two stories located in the first rows) and WV (where inundation depths exceed 3 m) scores.
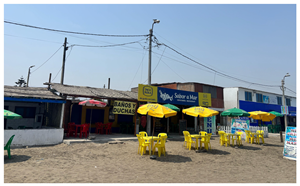
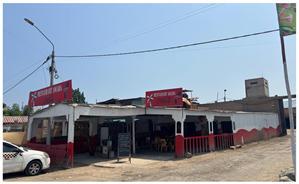
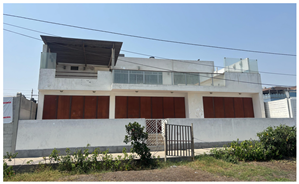
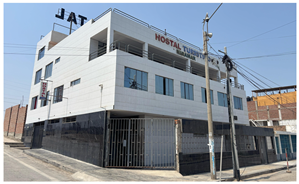
Figure 12a shows the locations of representative buildings for each vulnerability level, selected for having some of the highest RVI scores within their respective levels. These buildings, numbered #1 to #5, are described in Table 3. Building #1 is a single-story timber construction located in the first row, 30 m from the shoreline. It is part of the restaurant association of Conchitas Beach and is expected to be completely inundated. Its very high vulnerability is attributed to its poor preservation condition and lengthened rectangular shape, the lack of a protective brick wall, and the presence of movable objects such as beach chairs and umbrellas. Even though Building #2 has an average SV level (primarily due to the very high risk of bus depots as movable objects), its very high WV level (indicating complete inundation) increases the final RVI score, similar to many other buildings in the northern region. Building #3 is a two-story masonry construction with a highly hydrodynamic ground floor, which allows tsunami flow and helps reduce wave impact. However, its first-row location and lack of protection result in an average level of vulnerability. The tourist hotel (Building #4) has a moderate vulnerability level due to its location in a less exposed area and its three-story height, which results in a lower WV level. Finally, Building #5 is a single-story school with average Bv and Surr levels. Similar to many other buildings in the southern region, its lower inundation depth contributes to a lower RVI score. While the PTVA-4 model provides a valuable tool for assessing relative building vulnerability, its validation remains limited due to the lack of post-tsunami damage data in Ancon. Future events could provide essential information for comparisons.

4. Conclusions

In this study, we introduced a novel UAV-based methodology for assessing building vulnerability to tsunamis by using the PTVA-4 model. With this approach, the following is possible: (1) generate a detailed 3D representation of buildings based on UAV-based oblique photogrammetry to extract building attributes; (2) conduct high-resolution numerical tsunami simulation by using topographic and land-use data obtained with UAV-based nadir photogrammetry; (3) apply the PTVA-4 model to classify a building portfolio into relative vulnerability levels by integrating Structural and Water Vulnerability. This methodology offers a suitable alternative for tsunami vulnerability assessments, as it overcomes the limitations of traditional field surveys, which are often time-consuming and constrained by accessibility issues, such as perimeter walls. In addition, UAV surveys enable the acquisition of high-resolution data, including building attributes, topography, and land use, thus improving the efficiency of vulnerability assessments.
A case study was conducted to demonstrate the applicability of the proposed methodology, evaluating building vulnerability in Ancon Bay in a worst-case tsunami scenario ( M w 8.95) that may affect the Central Peru subduction zone. The numerical tsunami simulation was conducted by using the TUNAMI-N2 model and incorporated high-resolution topographic and land-use data with a 2 m grid size. The inundation map revealed that the northern region would experience the highest inundation depth, up to 6.9 m, whereas the arrival time analysis indicated that some regions would experience their maximum intrusion even two hours after the mainshock, highlighting the prolonged impact of the event. Additionally, the 3D inundation representation improved tsunami hazard visualization in the study area, enhancing the identification of the most affected areas and potential safe refuges for evacuees.
A visual inspection of building attributes was conducted by using the 3D model, analyzing 452 buildings, 375 of which were located within the inundation area. The PTVA-4 classification identified masonry as the predominant construction material, with most buildings featuring one or two stories and lacking open-plan ground floors, which are associated with higher Bv. Moreover, the absence of natural barriers and seawalls, along with the presence of movable objects such as boats and buses, increased the Surr component. Notably, the 3D model enabled the assessment of the 100 buildings that were not visible from public areas, demonstrating the importance of UAV-based surveys in overcoming access limitations.
The building vulnerability assessment showed that 34% of the buildings exhibit an average to very high vulnerability, with those in the northern region near Conchitas Beach being the most affected. This is primarily due to the predominance of single-story timber constructions in the first rows, which are at high risk due to the presence of movable objects and high exposure. In contrast, buildings located further inland showed lower vulnerability, mainly due to the minimal or lack of inundation depth, as well as building attributes that contributed to lower Bv and Surr scores. These findings provide valuable information for implementing effective mitigation measures (e.g., improved building codes or enhanced coastal defenses).
While the proposed methodology offers an adaptable tool for assessing building vulnerability in other tsunami-prone regions, certain aspects warrant further exploration. The PTVA-4 model was developed specifically for tsunami hazards and does not incorporate potential cascading effects from seismic events; therefore, future studies could complement this approach by integrating both seismic and tsunami effects, particularly for near-field earthquakes. In addition, the use of a single worst-case scenario served to demonstrate the methodology’s capabilities, though future research could benefit from incorporating probabilistic approaches and stochastic slip models to enhance hazard representation. Moreover, although manual interpretation enabled detailed attribute extraction, automated methods may support broader applications and reduce dependence on interpreter expertise. The absence of post-tsunami damage data in Ancon currently limits validation, but future events could provide valuable insights to refine and calibrate the methodology.

Author Contributions

C.D. and A.Q. contributed equally to this work. Conceptualization, C.D. and A.Q.; methodology, C.D. and A.Q.; software, C.D., A.Q. and F.G.; validation, C.D., A.Q., F.G., B.P. and O.S.; formal analysis, C.D. and A.Q.; investigation, C.D., A.Q., F.G., B.P., O.S., J.P. and J.M.; resources, C.D. and A.Q.; data curation, C.D.; writing—original draft preparation, C.D.; writing—review and editing, C.D., A.Q., F.G., B.P. and O.S.; visualization, C.D., A.Q., J.P. and J.M.; supervision, C.D., A.Q. and M.E. All authors have read and agreed to the published version of the manuscript.

Funding

This research received no external funding.

Data Availability Statement

The original contributions presented in this study are included in the article. Further inquiries can be directed to the corresponding author.

Acknowledgments

The authors would like to express their appreciation to the Centro de Estudios y Prevención de Desastres (Predes) and USAID’s Bureau for Humanitarian Assistance (BHA) for recognizing this research within the framework of disaster risk management with a focus on inclusion and neighborhoods. We are also grateful to the Centro Peruano Japones de Investigaciones Sismicas y Mitigacion de Desastres (CISMID) and the Universidad Nacional de Ingenieria (UNI) for providing the facilities and equipment for data collection, processing, and analysis. Finally, we acknowledge the valuable contributions of the researchers from the Geoinformatics Research Group for Disaster Risk Management (GeoGiRD) at the Geomatics Laboratory of CISMID.

Conflicts of Interest

The authors declare no conflicts of interest.

References

  1. Silgado, E. Historia de los Sismos más notables ocurridos en el Perú (1513–1974). BoletíN Inst. Geol. MineríA 1978, 3, 130. [Google Scholar]
  2. Adriano, B.; Mas, E.; Koshimura, S.; Fujii, Y.; Yanagisawa, H.; Estrada, M. Revisiting the 2001 Peruvian Earthquake and Tsunami Impact Along Camana Beach and the Coastline Using Numerical Modeling and Satellite Imaging; Springer: Cham, Switzerland, 2016; pp. 1–16. [Google Scholar] [CrossRef]
  3. Jimenez, C.; Moggiano, N.; Mas, E.; Adriano, B.; Fujii, Y.; Koshimura, S. Tsunami Waveform Inversion of the 2007 Peru (Mw 8.1) Earthquake. J. Disaster Res. 2014, 9, 954–960. [Google Scholar] [CrossRef]
  4. Okal, E.A.; Dengler, L.; Araya, S.; Borrero, J.C.; Gomer, B.M.; Koshimura, S.; Laos, G.; Olcese, D.; Ortiz, M.; Swensson, M.; et al. Field Survey of the Camana, Peru Tsunami of 23 June 2001. Seismol. Res. Lett. 2002, 73, 907–920. [Google Scholar] [CrossRef]
  5. Fritz, H.M.; Kalligeris, N.; Borrero, J.C.; Broncano, P.; Ortega, E. The 15 August 2007 Peru tsunami runup observations and modeling. Geophys. Res. Lett. 2008, 35, L10604. [Google Scholar] [CrossRef]
  6. Løvholt, F.; Glimsdal, S.; Harbitz, C.B.; Horspool, N.; Smebye, H.; de Bono, A.; Nadim, F. Global tsunami hazard and exposure due to large co-seismic slip. Int. J. Disaster Risk Reduct. 2014, 10, 406–418. [Google Scholar] [CrossRef]
  7. Tarbotton, C.; Dall’Osso, F.; Dominey-Howes, D.; Goff, J. The use of empirical vulnerability functions to assess the response of buildings to tsunami impact: Comparative review and summary of best practice. Earth-Sci. Rev. 2015, 142, 120–134. [Google Scholar] [CrossRef]
  8. Adriano, B.; Mas, E.; Koshimura, S.; Estrada, M.; Jimenez, C. Scenarios of Earthquake and Tsunami Damage Probability in Callao Region, Peru Using Tsunami Fragility Functions. J. Disaster Res. 2014, 9, 968–975. [Google Scholar] [CrossRef]
  9. Gomez-Zapata, J.C.; Brinckmann, N.; Harig, S.; Zafrir, R.; Pittore, M.; Cotton, F.; Babeyko, A. Variable-resolution building exposure modelling for earthquake and tsunami scenario-based risk assessment: An application case in Lima, Peru. Nat. Hazards Earth Syst. Sci. 2021, 21, 3599–3628. [Google Scholar] [CrossRef]
  10. Gomez-Zapata, J.C.; Pittore, M.; Brinckmann, N.; Lizarazo-Marriaga, J.; Medina, S.; Tarque, N.; Cotton, F. Scenario-based multi-risk assessment from existing single-hazard vulnerability models. An application to consecutive earthquakes and tsunamis in Lima, Peru. Nat. Hazards Earth Syst. Sci. 2023, 23, 2203–2228. [Google Scholar] [CrossRef]
  11. Izquierdo, T.; Fritis, E.; Abad, M. Analysis and validation of the PTVA tsunami building vulnerability model using the 2015 Chile post-tsunami damage data in Coquimbo and La Serena cities. Nat. Hazards Earth Syst. Sci. 2018, 18, 1703–1716. [Google Scholar] [CrossRef]
  12. Mas, E.; Koshimura, S.; Suppasri, A.; Matsuoka, M.; Matsuyama, M.; Yoshii, T.; Jimenez, C.; Yamazaki, F.; Imamura, F. Developing Tsunami fragility curves using remote sensing and survey data of the 2010 Chilean Tsunami in Dichato. Nat. Hazards Earth Syst. Sci. 2012, 12, 2689–2697. [Google Scholar] [CrossRef]
  13. Paez-Ramirez, J.; Lizarazo-Marriaga, J.; Medina, S.; Estrada, M.; Mas, E.; Koshimura, S. A comparative study of empirical and analytical fragility functions for the assessment of tsunami building damage in Tumaco, Colombia. Coast. Eng. J. 2020, 62, 362–372. [Google Scholar] [CrossRef]
  14. Dall’Osso, F.; Dominey-Howes, D.; Tarbotton, C.; Summerhayes, S.; Withycombe, G. Revision and improvement of the PTVA-3 model for assessing tsunami building vulnerability using “international expert judgment”: Introducing the PTVA-4 model. Nat. Hazards 2016, 83, 1229–1256. [Google Scholar] [CrossRef]
  15. Batzakis, D.V.; Misthos, L.M.; Voulgaris, G.; Tsanakas, K.; Andreou, M.; Tsodoulos, I.; Karymbalis, E. Assessment of Building Vulnerability to Tsunami Hazard in Kamari (Santorini Island, Greece). J. Mar. Sci. Eng. 2020, 8, 886. [Google Scholar] [CrossRef]
  16. Sathiparan, N. An assessment of building vulnerability to a tsunami in the Galle coastal area, Sri Lanka. J. Build. Eng. 2020, 27, 100952. [Google Scholar] [CrossRef]
  17. Lo Re, C.; Manno, G.; Basile, M.; Ferrotto, M.F.; Cavaleri, L.; Ciraolo, G. Tsunami Vulnerability Evaluation for a Small Ancient Village on Eastern Sicily Coast. J. Mar. Sci. Eng. 2022, 10, 268. [Google Scholar] [CrossRef]
  18. Nurmaya, A.; Herbanu, P.S.; Nisaa’, R.M.; ‘Arifati, A.; Wardana, R.A.; Sahid; Firmansyah, R.A.; Yudhanti, F.Y. Tsunami Risk Assessment on Public Facilities in Southern Part of Bantul Regency, Yogyakarta. E3S Web Conf. 2023, 447, 01015. [Google Scholar] [CrossRef]
  19. Papathoma-Köhle, M.; Cristofari, G.; Wenk, M.; Fuchs, S. The importance of indicator weights for vulnerability indices and implications for decision making in disaster management. Int. J. Disaster Risk Reduct. 2019, 36, 101103. [Google Scholar] [CrossRef]
  20. Dall’Osso, F.; Gonella, M.; Gabbianelli, G.; Withycombe, G.; Dominey-Howes, D. A revised (PTVA) model for assessing the vulnerability of buildings to tsunami damage. Nat. Hazards Earth Syst. Sci. 2009, 9, 1557–1565. [Google Scholar] [CrossRef]
  21. Acharya, L.; Kumar, N.; Singh, S.; Subedi, U. Comparative Study Using Different Tecniques for Cadastral Survey in Plain Area: Total Station, RTK-GNSS & UAV. 2024. Available online: https://www.researchgate.net/publication/380938470 (accessed on 4 January 2025).
  22. Giordan, D.; Hayakawa, Y.; Nex, F.; Remondino, F.; Tarolli, P. Review article: The use of remotely piloted aircraft systems (RPASs) for natural hazards monitoring and management. Nat. Hazards Earth Syst. Sci. 2018, 18, 1079–1096. [Google Scholar] [CrossRef]
  23. Mohd Daud, S.M.S.; Mohd Yusof, M.Y.P.; Heo, C.C.; Khoo, L.S.; Chainchel Singh, M.K.; Mahmood, M.S.; Nawawi, H. Applications of drone in disaster management: A scoping review. Sci. Justice 2022, 62, 30–42. [Google Scholar] [CrossRef] [PubMed]
  24. Ma, J.; Gao, H.; Xu, C.; Qi, S. Characterization and formation mechanism of the catastrophic flash flood-debris flow hazard triggered by the July 2023 extreme rainstorm in Hantai Gully of Beijing, China. Landslides 2025, 22, 877–893. [Google Scholar] [CrossRef]
  25. Zhao, Z.H.; Sun, H.; Zhang, N.X.; Xing, T.H.; Cui, G.H.; Lai, J.X.; Liu, T.; Bai, Y.B.; He, H.J. Application of unmanned aerial vehicle tilt photography technology in geological hazard investigation in China. Nat. Hazards 2024, 120, 11547–11578. [Google Scholar] [CrossRef]
  26. Qin, L.; Mao, P.; Xu, Z.; He, Y.; Yan, C.; Hayat, M.; Qiu, G.Y. Accurate Measurement and Assessment of Typhoon-Related Damage to Roadside Trees and Urban Forests Using the Unmanned Aerial Vehicle. Remote Sens. 2022, 14, 2093. [Google Scholar] [CrossRef]
  27. Román, A.; Tovar-Sánchez, A.; Roque-Atienza, D.; Huertas, I.; Caballero, I.; Fraile-Nuez, E.; Navarro, G. Unmanned aerial vehicles (UAVs) as a tool for hazard assessment: The 2021 eruption of Cumbre Vieja volcano, La Palma Island (Spain). Sci. Total Environ. 2022, 843, 157092. [Google Scholar] [CrossRef]
  28. Zou, R.; Liu, J.; Pan, H.; Tang, D.; Zhou, R. An Improved Instance Segmentation Method for Fast Assessment of Damaged Buildings Based on Post-Earthquake UAV Images. Sensors 2024, 24, 4371. [Google Scholar] [CrossRef]
  29. Danardono, D.; Wibowo, A.A.; Sari, D.N.; Priyono, K.D.; Dewi, E.S.M. Tsunami hazard mapping based on coastal system analysis using high-resolution unmanned aerial vehicle (UAV) imagery (Case Study in Kukup Coastal Area, Gunungkidul Regency, Indonesia). Geogr. Tech. 2023, 18, 51–67. [Google Scholar] [CrossRef]
  30. Mardiatno, D.; Malawani, M.; Nisaa’, R.M. The future tsunami risk potential as a consequence of building development in Pangandaran Region, West Java, Indonesia. Int. J. Disaster Risk Reduct. 2020, 46, 101523. [Google Scholar] [CrossRef]
  31. Evelpidou, N.; Zerefos, C.; Synolakis, C.; Repapis, C.; Karkani, A.; Polidorou, M.; Saitis, G. Coastal Boulders on the SE Coasts of Cyprus as Evidence of Palaeo-Tsunami Events. J. Mar. Sci. Eng. 2020, 8, 812. [Google Scholar] [CrossRef]
  32. Rezaldi, M.Y.; Yoganingrum, A.; Hanifa, N.R.; Prasetyadi, A.; Kongko, W.; Yulianto, E. Animation tsunami modelling in 3D to determine shelter and evacuation routes. Environ. Hazards 2024, 1–22. [Google Scholar] [CrossRef]
  33. Tiwi, D.A.; Sudiana, N.; Prihartanto; Turyana, I.; Prawiradisastra, F.; Zahro, Q.; Astisiasari. Post-disaster rapid assessment of Sunda Strait tsunami on 24th–25th December 2018 in the Regencies of Serang and Pandeglang, Province of Banten, Indonesia. IOP Conf. Ser. Earth Environ. Sci. 2023, 1173, 012015. [Google Scholar] [CrossRef]
  34. Zhou, J.; Liu, Y.; Nie, G.; Cheng, H.; Yang, X.; Chen, X.; Gross, L. Building Extraction and Floor Area Estimation at the Village Level in Rural China Via a Comprehensive Method Integrating UAV Photogrammetry and the Novel EDSANet. Remote Sens. 2022, 14, 5175. [Google Scholar] [CrossRef]
  35. Zhao, Y.; Huang, B.; Zhu, Z.; Guo, J.; Jiang, J. Building information extraction and earthquake damage prediction in an old urban area based on UAV oblique photogrammetry. Nat. Hazards 2023, 120, 11665–11692. [Google Scholar] [CrossRef]
  36. Kong, C.; Petchsasithon, A. Information Acquisition and Seismic Damage Prediction of Masonry Structures in Rural Areas Based on UAV Inclined Photogrammetry. J. Inf. Syst. Eng. Manag. 2024, 9, 25183. [Google Scholar] [CrossRef]
  37. Marfai, M.A.; Sunarto; Khakim, N.; Cahyadi, A.; Rosaji, F.S.C.; Fatchurohman, H.; Wibowo, Y.A. Topographic data acquisition in tsunami-prone coastal area using Unmanned Aerial Vehicle (UAV). IOP Conf. Ser. Earth Environ. Sci. 2018, 148, 012004. [Google Scholar] [CrossRef]
  38. Palacios, J.; Diaz, M.; Morales, J. Analysis of structural performance of existing RC building designated as tsunami evacuation shelter in case of earthquake-tsunami scenarios in lima city. TECNIA 2019, 29, 109.124. [Google Scholar] [CrossRef]
  39. Fatchurohman, H.; Handayani, W. Coastal hazards mapping using high-resolution UAV image and DEM. A Case study in Siung Beach, Gunungkidul, Indonesia. IOP Conf. Ser. Earth Environ. Sci. 2022, 1039, 012026. [Google Scholar] [CrossRef]
  40. Levine, N.M.; Spencer, B.F. Post-Earthquake Building Evaluation Using UAVs: A BIM-Based Digital Twin Framework. Sensors 2022, 22, 873. [Google Scholar] [CrossRef]
  41. Li, C.; Lyu, H. Study on Seismic Risk Exposure and Vulnerability of Buildings in Southwest China Based on AI Technology. J. Phys. Conf. Ser. 2022, 2185, 012049. [Google Scholar] [CrossRef]
  42. Rezaldi, M.Y.; Yoganingrum, A.; Hanifa, N.R.; Kaneda, Y.; Kushadiani, S.K.; Prasetyadi, A.; Nugroho, B.; Riyanto, A.M. Unmanned Aerial Vehicle (UAV) and Photogrammetric Technic for 3D Tsunamis Safety Modeling in Cilacap, Indonesia. Appl. Sci. 2021, 11, 11310. [Google Scholar] [CrossRef]
  43. Quiñones-Bustos, C.; Bull, M.T.; Oyarzo-Vera, C. Seismic and Coastal Vulnerability Assessment Model for Buildings in Chile. Buildings 2021, 11, 107. [Google Scholar] [CrossRef]
  44. Ruiz Palacios, M.A.; Pereira Texeira de Oliveira, C.; Serrano González, J.; Saénz Flores, S. Analysis of Tourist Systems Predictive Models Applied to Growing Sun and Beach Tourist Destination. Sustainability 2021, 13, 785. [Google Scholar] [CrossRef]
  45. Harisuthan, S.; Hasalanka, H.; Kularatne, D.; Siriwardana, C. Applicability of the PTVA-4 model to evaluate the structural vulnerability of hospitals in Sri Lanka against tsunami. Int. J. Disaster Resil. Built Environ. 2020, 11, 581–596. [Google Scholar] [CrossRef]
  46. Imamura, F. Review of Tsunami Simulation with a Finite Difference Method; World Scientific: Singapore, 1996; pp. 25–42. [Google Scholar]
  47. UNESCO. IUGG/IOC Time Project. Numerical Method of Tsunami Simulation with the Leap-Frog Scheme (IOC Manuals and Guides No. 35); Technical Report; UNESCO: Paris, France, 1997. [Google Scholar]
  48. Turchi, A.; Traglia, F.D.; Gentile, R.; Fornaciai, A.; Zetti, I.; Fanti, R. Relative seismic and tsunami risk assessment for Stromboli Island (Italy). Int. J. Disaster Risk Reduct. 2022, 76, 103002. [Google Scholar] [CrossRef]
  49. National Institute of Statistics and Informatics (INEI). Population Estimates and Projections by Department, Province, and District, 2018–2020; Technical Report; National Institute of Statistics and Informatics (INEI): Lima, Peru, 2020. [Google Scholar]
  50. Yupanqui-Reyes, A.; Guanilo-Chauca, P.; Zegarra-Choque, J. The oil spill at the La Pampilla Refinery in January 2022 and its social impact in the Ancon district. Rev. Kawsaypacha Soc. Medio Ambiente 2024, 14, D-008. [Google Scholar] [CrossRef]
  51. Andina. Mayor of Ancon Denounces that Beaches in 3 Districts Are Still Affected by Spill; Andina: Lima, Peru, 2023. [Google Scholar]
  52. Jimenez, C.; Moggiano, N.; Mas, E.; Adriano, B.; Koshimura, S.; Fujii, Y.; Yanagisawa, H. Seismic Source of 1746 Callao Earthquake from Tsunami Numerical Modeling. J. Disaster Res. 2013, 8, 266–273. [Google Scholar] [CrossRef]
  53. Mas, E.; Adriano, B.; Horiuchi, J.K.; Koshimura, S. Reconstruction Process and Social Issues After the 1746 Earthquake and Tsunami in Peru: Past and Present Challenges After Tsunami Events. In Post-Tsunami Hazard; Springer: Cham, Switzerland, 2015; pp. 97–109. [Google Scholar] [CrossRef]
  54. Ceferino, L.; Kiremidjian, A.; Deierlein, G. Probabilistic Space- and Time-Interaction Modeling of Mainshock Earthquake Rupture Occurrence. Bull. Seismol. Soc. Am. 2020, 110, 2498–2518. [Google Scholar] [CrossRef]
  55. Ceferino, L.; Galvez, P.; Ampuero, J.P.; Kiremidjian, A.; Deierlein, G.; Villegas-Lanza, J.C. Bayesian Parameter Estimation for Space and Time Interacting Earthquake Rupture Model Using Historical and Physics-Based Simulated Earthquake Catalogs. Bull. Seismol. Soc. Am. 2021, 111, 3356–3373. [Google Scholar] [CrossRef]
  56. Dirección de Hidrografía y Navegación. Carta de Inundación en Caso de Tsunami, Balneario Ancon—Lima; Technical Report; Dirección de Hidrografía y Navegación: Callao, Peru, 2015. [Google Scholar]
  57. Vacca, G.; Dessì, A.; Sacco, A. The Use of Nadir and Oblique UAV Images for Building Knowledge. ISPRS Int. J.-Geo-Inf. 2017, 6, 393. [Google Scholar] [CrossRef]
  58. Nesbit, P.R.; Hugenholtz, C.H. Enhancing UAV–SfM 3D Model Accuracy in High-Relief Landscapes by Incorporating Oblique Images. Remote Sens. 2019, 11, 239. [Google Scholar] [CrossRef]
  59. Lee, E.; Park, S.; Jang, H.; Choi, W.; Sohn, H.G. Enhancement of low-cost UAV-based photogrammetric point cloud using MMS point cloud and oblique images for 3D urban reconstruction. Measurement 2024, 226, 114158. [Google Scholar] [CrossRef]
  60. Karolos, I.A.; Bellos, K.; Alexandridisale, V.; Chrysafis, I.; Georgiadis, H.; Pikridas, C.; Tsioukas, V.; Patias, P.; Mallinis, G. Advancing forest biodiversity conservation with the EL-BIOS digital twin: An integration of LiDAR and multispectral earth observation data. In Proceedings of the Tenth International Conference on Remote Sensing and Geoinformation of the Environment (RSCy2024), Paphos, Cyprus, 8–9 April 2024; SPIE: Bellingham, WT, USA, 2024; p. 40. [Google Scholar] [CrossRef]
  61. Štroner, M.; Urban, R.; Reindl, T.; Seidl, J.; Brouček, J. Evaluation of the Georeferencing Accuracy of a Photogrammetric Model Using a Quadrocopter with Onboard GNSS RTK. Sensors 2020, 20, 2318. [Google Scholar] [CrossRef]
  62. Jarahizadeh, S.; Salehi, B. A Comparative Analysis of UAV Photogrammetric Software Performance for Forest 3D Modeling: A Case Study Using AgiSoft Photoscan, PIX4DMapper, and DJI Terra. Sensors 2024, 24, 286. [Google Scholar] [CrossRef] [PubMed]
  63. Mora-Félix, Z.D.; Rangel-Peraza, J.G.; Monjardín-Armenta, S.A.; Sanhouse-García, A.J. Performance and precision analysis of 3D surface modeling through UAVs: Validation and comparison of different photogrammetric data processing software. Phys. Scr. 2024, 99, 035017. [Google Scholar] [CrossRef]
  64. Sari, I.L.; Weston, C.J.; Newnham, G.J.; Volkova, L. Assessing Accuracy of Land Cover Change Maps Derived from Automated Digital Processing and Visual Interpretation in Tropical Forests in Indonesia. Remote Sens. 2021, 13, 1446. [Google Scholar] [CrossRef]
  65. Muhari, A.; Imamura, F.; Koshimura, S.; Post, J. Examination of three practical run-up models for assessing tsunami impact on highly populated areas. Nat. Hazards Earth Syst. Sci. 2011, 11, 3107–3123. [Google Scholar] [CrossRef]
  66. Pulido, N.; Villegas-Lanza, J.C. Mega-thrust earthquake potential along the subduction zone of Peru based on the earthquake energy-budget. In Proceedings of the 28th General Assembly of the International Union of Geodesy and Geophysics, Berlin, Germany, 11–20 July 2023. [Google Scholar]
  67. Villegas-Lanza, J.C.; Chlieh, M.; Cavalié, O.; Tavera, H.; Baby, P.; Chire-Chira, J.; Nocquet, J. Active tectonics of Peru: Heterogeneous interseismic coupling along the Nazca megathrust, rigid motion of the Peruvian Sliver, and Subandean shortening accommodation. J. Geophys. Res. Solid Earth 2016, 121, 7371–7394. [Google Scholar] [CrossRef]
  68. Tarazona, J.C.; Aguilar, Z.; Pulido, N.; Gonzales, C.; Lazares, F.; Miyake, H. Seismicity Based Maximum Magnitude Estimation of Subduction Earthquakes in Peru. J. Disaster Res. 2023, 18, 308–318. [Google Scholar] [CrossRef]
  69. Goda, K. Probabilistic Tsunami Hazard Analysis for Vancouver Island Coast Using Stochastic Rupture Models for the Cascadia Subduction Earthquakes. GeoHazards 2023, 4, 217–238. [Google Scholar] [CrossRef]
  70. Das, R.; Gonzalez, G.; de la Llera, J.C.; Saez, E.; Salazar, P.; Gonzalez, J.; Meneses, C. A probabilistic seismic hazard assessment of southern Peru and Northern Chile. Eng. Geol. 2020, 271, 105585. [Google Scholar] [CrossRef]
  71. Okada, Y. Surface deformation due to shear and tensile faults in a half-space. Bull. Seismol. Soc. Am. 1985, 75, 1135–1154. [Google Scholar] [CrossRef]
  72. Kotani, M.; Imamura, F.; Shuto, N. New method of tsunami run-up and estimation of damage using gis. Proc. Coast. Eng. JSCE 1998, 45, 356–360. [Google Scholar] [CrossRef]
  73. Widiyanto, S.; Adi, D.; Nurdin, N.; Fadila, F. Agent-Based Simulation for Evaluating the Effect of Different Walking and Driving Speed on Disaster Evacuation in Aceh. IPTEK J. Eng. 2021, 7, 50. [Google Scholar] [CrossRef]
  74. Merrifield, M.A.; Firing, Y.L.; Aarup, T.; Agricole, W.; Brundrit, G.; Chang-Seng, D.; Farre, R.; Kilonsky, B.; Knight, W.; Kong, L.; et al. Tide gauge observations of the Indian Ocean tsunami, December 26, 2004. Geophys. Res. Lett. 2005, 32, L09603. [Google Scholar] [CrossRef]
  75. Marfai, M.A.; Fatchurohman, H.; Cahyadi, A. An Evaluation of Tsunami Hazard Modeling in Gunungkidul Coastal Area using UAV Photogrammetry and GIS. Case Study: Drini Coastal Area. E3S Web Conf. 2019, 125, 09005. [Google Scholar] [CrossRef]
  76. Fatchurohman, H.; Cahyadi, A.; Purwanto, T.H. Worst-Case tsunami inundation modeling using high-resolution UAV-DEM in various coastal typologies, case study Gunungkidul coastal area. IOP Conf. Ser. Earth Environ. Sci. 2022, 986, 012027. [Google Scholar] [CrossRef]
  77. Yunita, L.; Sari, N.M.; Kushardono, D. Preliminary study of LSU-02 photo data application to support 3D modeling of tsunami disaster evacuation map. Int. J. Remote Sens. Earth Sci. (IJReSES) 2018, 14, 119. [Google Scholar] [CrossRef]
Figure 1. Flowchart of proposed PTVA-4 model.
Drones 09 00402 g001
Figure 3. (a) nDSM of study area. (b,c) Three-dimensional model views aligned with camera perspectives in Figure 2d,e, respectively.
Drones 09 00402 g003
Figure 4. (a) DSM. (b) DTM. (c) DOM. (d) Land-use classification of study area.
Drones 09 00402 g004
Figure 5. (a) Slip distribution for potential worst-case scenario proposed by [66]. Digital elevation model and nested grid system of study area, showing grids with resolutions of (b) 405, 135, and 45 m for the 1st, 2nd, and 3rd domains, respectively, and (c) 15, 5, and 2 m for the 4th, 5th, and 6th domains, respectively.
Drones 09 00402 g005
Figure 6. (a) Maximum tsunami inundation depth and (b) arrival time distribution for slip model shown in Figure 5a. Synthetic tsunami height obtained at stations (c) M1 and (d) M2.
Drones 09 00402 g006
Figure 7. Three-dimensional visualization of study area with tsunami inundation at minute 44 aligned with camera perspective in Figure 2e. Red line indicates shoreline.
Drones 09 00402 g007
Figure 8. Mapping of building attributes using 3D model: (a) limited-access buildings; (b) typical masonry buildings; (c) boats as movable objects and the rip rap retaining wall; (d) non-engineered timber construction; (e) multiple openings at ground floor; (f) lengthened rectangular building.
Drones 09 00402 g008
Figure 9. Spatial distribution of Structural Vulnerability (SV) inputs: (a) building vulnerability (Bv); (b) building surroundings (Surr); (c) exposure (Ex).
Drones 09 00402 g009
Figure 10. Frequency distributions of the following: (a) SV components; (b) inundation depth (WD).
Drones 09 00402 g010
Figure 11. Spatial distribution of the following: (a) Structural Vulnerability (SV); (b) Water Vulnerability (WV).
Drones 09 00402 g011
Figure 12. (a) Spatial distribution of Relative Vulnerability Index (RVI); representative buildings for each vulnerability level are indicated by x markers. (b) Frequency distributions of SV, WV, and RVI, with percentage of buildings at each vulnerability level.
Drones 09 00402 g012
Table 1. Equipment specifications and flight parameters.
ParameterOblique PhotogrammetryNadir Photogrammetry
UAV modelDJI Mavic 3EDJI Mavic 2 Pro
Camera4/3″ CMOS, 20 MP1″ CMOS, 20.2 MP
Tilt angle45°90°
Number of flights42
Total flight duration92 min27 min
Ground Sample Distance3 cm18.5 cm
Flight height60 m195 m
Number of photos2900553
Processing softwareDJI TerraPix4Dmapper
Covered area25 Ha110 Ha
Products *nDSM and 3D ModelDSM, DTM, and DOM
* Definitions of nDSM, DSM, DTM, and DOM are provided in Section 2.3.1 and Section 2.3.2.
Table 2. Results of building attribute extraction.
LevelMinorModerateAverageHighVery High
Value 1 0 . 5 0+0.5+1.0
m (buildingRC-Masonry-Timber
material)(1%)(68%)(31%)
s (number of≥54321
stories)(0%)(2%)(8%)(24%)(66%)
g (ground floor100%About 75%About 50%About 25%0 %
hydrodynamics) 1(2%)(1%)(19%)(46%)(32%)
f (foundationDeep pile-Average-depth-Shallow
strength)(0%)(20%)(80%)
sh (shape ofRound/TriangularAlmost squaredRectangularLengthenedComplex
building footprint)(0%)(28%)(41%)(18%)(13%)
pc (preservationVery goodGoodAveragePoorVery poor
condition)(0%)(4%)(55%)(29%)(12%)
br (building>10th7–8–9–10th4–5–6th2nd–3rd1st
row)(0%)(22%)(29%)(30%)(19%)
sw (seawall heightVertical > 5 mVertical 3–5 mVertical 1.5–3 mSloped 1.5–3 mNone
and shape)(0%)(0%)(0%)(2%)(98%)
nb (naturalVery highHighAverageModerateNone
barrier) 2(0%)(0%)(0%)(0%)(100%)
mo (source ofVery low-Average-Very high
movable objects) 3(58%)(14%)(29%)
w (brick wall>80%60–80%40–60%20–40%0–20%
around buildings) 4(19%)(3%)(2%)(3%)(73%)
1 Percentage of open plan area on the ground floor (e.g., no walls). 2 Protection level of natural barriers. 3 Risk level from movable objects. 4 Percentage of brick wall height around building relative to water depth.
Table 3. Characteristics of representative buildings with some of the highest RVI scores in each vulnerability level.
BuildingDescriptionInundationRVI ScoreVulnerabilityPhoto
IDDepth (m)[1–5]
1Restaurant6.464.49Very HighDrones 09 00402 i001
2Restaurant5.253.63HighDrones 09 00402 i002
3Dwelling3.782.76AverageDrones 09 00402 i003
4Hotel3.252.10ModerateDrones 09 00402 i004
5School0.661.47MinorDrones 09 00402 i005
Disclaimer/Publisher’s Note: The statements, opinions and data contained in all publications are solely those of the individual author(s) and contributor(s) and not of MDPI and/or the editor(s). MDPI and/or the editor(s) disclaim responsibility for any injury to people or property resulting from any ideas, methods, instructions or products referred to in the content.