1. Introduction
In recent years, UAVs have been extensively employed in visual tasks such as facility inspection, agricultural operations, ground reconnaissance, and civil aviation photography [
1,
2]. However, UAV self-localization typically relies on the global navigation satellite system (GNSS). In complex environments, GNSS signals can be unreliable. They may face interference or complete signal loss. This severely impacts UAV operational safety and stability.
Traditional visual localization methods frequently use feature point matching algorithms, such as scale-invariant feature transform (SIFT) [
3] and speeded-up robust features (SURFs) [
4]. These methods depend on manually designed feature descriptors, exhibiting scale and rotation invariance, widely utilized in simultaneous localization and mapping (SLAM) [
5] and image stitching tasks [
6]. However, these traditional methods struggle in certain scenarios. They often fail to extract enough stable features when there are significant cross-domain variations or large differences in image quality. This leads to reduced matching performance. To address these limitations, deep learning-based feature extraction methods have become mainstream. They offer better representational capabilities and adaptability to various tasks.
Currently, mainstream deep learning localization methods are broadly categorized into two types: (1) Image retrieval-based methods [
7,
8,
9] rely on large-scale image databases with geographic tags. They achieve localization by matching real-time images to these databases. These methods are efficient and straightforward. However, they struggle with accuracy when there are significant viewpoint or environmental differences. They also heavily depend on pre-collected area images. (2) Finding point with image (FPI)-based methods [
10,
11,
12] use the spatial continuity of UAV trajectories. They crop local regions from satellite imagery at known initial locations. Then, they achieve precise localization through fine feature matching. This iterative process allows continuous tracking of UAV trajectories.
Despite differing strategies, both methods typically use backbone networks for extracting UAV and satellite image features, subsequently employing feature fusion and correlation modeling modules for localization. Comparatively, FPI methods exhibit greater flexibility and adaptability, being less reliant on comprehensive databases. However, current approaches face the following issues: (1) Image retrieval methods risk losing spatial details during multi-layer feature compression, restricting final matching accuracy; (2) Predominant FPI methods are limited by the UL14 dataset, which covers only low-altitude urban environments, hindering model generalization to diverse scenarios and flight altitudes.
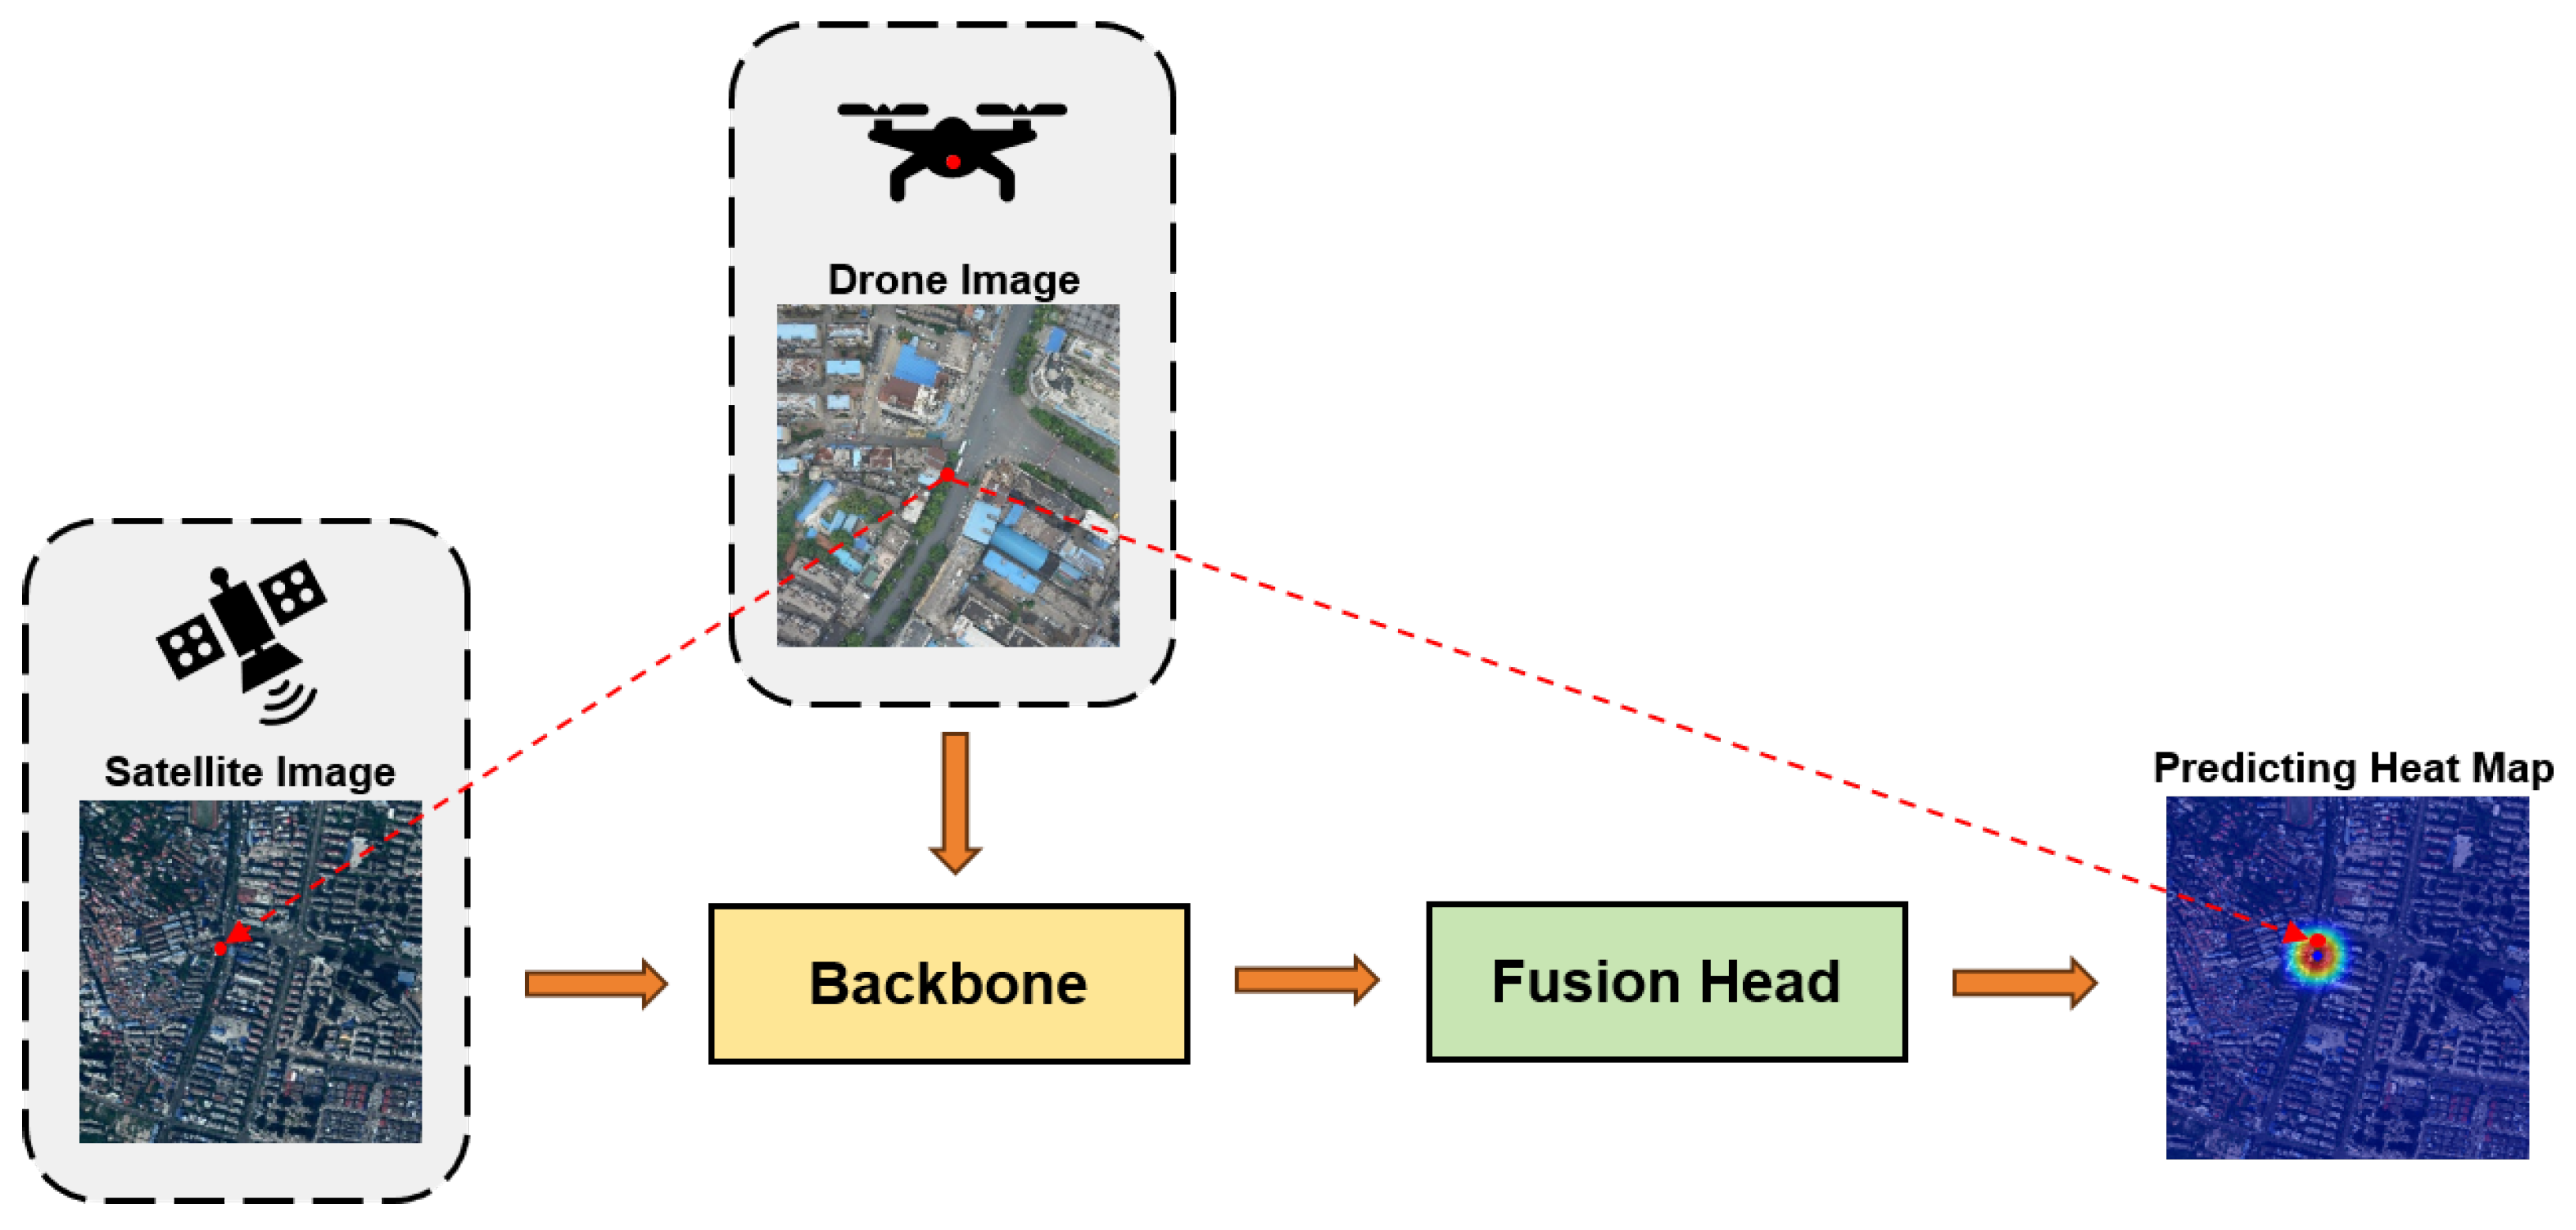
As shown in
Figure 1, this paper introduces a novel end-to-end UAV self-localization method to address these challenges, presenting two main innovations: (1) At the dataset level, the Multi-UAV dataset is constructed by pairing samples from UL14 [
10] and UAV-VisLoc [
13]. This dataset encompasses diverse terrain textures such as rural areas, towns, rivers, and hills across various altitudes and orientations throughout China, including both low-altitude urban and high-altitude rural scenarios. (2) At the model design level, self-attention with high-resolution features has high computational costs. To address this, we propose the value reduction pyramid transformer (VRPT) backbone network. It optimizes the network architecture for efficient early-stage feature integration and computational efficiency. We introduce a dynamic feature network, which integrates self-attention (SA) [
14], cross-attention (CA) [
15], and channel reduction attention (CRA) [
16] mechanisms. These enable dynamic adjustment and optimization during feature extraction. This multiple-attention mechanism enables the parallel training of UAV and satellite images, fostering early feature collaboration. SA enriches feature representation, CA captures global information, and CRA reduces computational complexity, ensuring the network focuses on critical localization features. Moreover, we introduce the Residual Feature Pyramid Network (RFPN), an innovative lightweight feature fusion structure that effectively merges outputs from different backbone stages using residual connections. Experiments indicate that overly deep initial feature fusion may adversely impact localization accuracy, highlighting the need for precise balancing in feature fusion timing and extent.
The key contributions of this paper are given as follows:
Development of the new Multi-UAV dataset, overcoming limitations in traditional cross-view matching datasets regarding single-scenario coverage, altitude monotony, and high production costs.
Introduction of the VRPT backbone network based on the FPI framework, innovatively integrating SA, CA, and CRA attention mechanisms for efficient feature extraction and relational modeling. CRA reduces computational complexity by decreasing channel dimensions, and the proposed RFPN significantly supports effective multi-scale feature fusion.
Demonstration of optimal performance on the UL14 dataset and stable meter-level precision (MA@K) and relative distance score (RDS) on the challenging Multi-UAV dataset. Notably, the VRPT_256 backbone balances computational complexity and accuracy, exhibiting strong adaptability across scenarios, providing an efficient and robust solution for resource-constrained UAV deployment.
2. Related Work
2.1. Self-Localization Methods
In recent years, cross-view geoLocalization (CVGL) has gained significant attention. It is valued for its wide range of practical applications. Most current self-localization methods utilize classification-based learning frameworks. PlaNet [
17] first reformulated geographic localization as an image classification task, effectively addressing the challenges posed by sparse geographic labels and location uncertainty. CVM-Net [
18] integrated Siamese networks [
19,
20] with the NetVLAD [
21] module to enhance cross-view image matching capabilities. Xu et al. [
22] employed cross-entropy loss for supervised image classification, further improving the discriminative quality of image embeddings. Additionally, Liu et al. [
23] introduced multiple triplet loss-based methods to reinforce feature representation robustness.
Although classification-based learning frameworks achieved early success, several limitations emerged, notably the dependency on a predefined number of scene categories. In scenarios with large datasets and diverse environments, predefining scene categories increases model complexity. It also reduces generalization capabilities. To mitigate these limitations, researchers have explored alternative solutions with enhanced representational capacity and training efficiency. For example, Sample4Geo [
24] introduced the InfoNCE loss function to CVGL tasks. This significantly improved the feature contrastive learning outcomes. Building upon this, UCVGL [
25] proposed an unsupervised training framework to reduce reliance on annotated data, thus improving practical deployment feasibility. EP-BEV [
26] further advanced the field by proposing a localization method based on the collaborative retrieval of bird’s eye view (BEV) and satellite imagery, achieving state-of-the-art performance on datasets such as CVACT [
27] and VIGOR [
28].
However, traditional classification frameworks and improved contrastive learning methods struggle to fully exploit deep semantic relationships in images. This is especially true under complex viewpoint variations. This limitation has shifted research attention toward end-to-end feature learning strategies, particularly those leveraging deep convolutional neural networks (CNNs). While early approaches [
29,
30,
31,
32] relied on handcrafted feature extraction methods, the outstanding capabilities of CNNs in image representation learning have increasingly dominated the research landscape. CVGL tasks have expanded to include UAV perspectives. As a result, researchers developed innovative models. These models address complex geometric structures and scale discrepancies. For example, DSM [
33] introduced dynamic similarity matching modules to counteract the feature errors caused by limited viewing angles; PLCD [
34] utilized UAV imagery as a bridging medium between ground and satellite images; LPN [
35] proposed a square-ring partition strategy to enhance the fine-grained modeling of edge regions; FSRA [
36], based on a Transformer architecture, which significantly improved contextual and instance-level understanding; MCCG [
37] employed a ConvNeXt-based structure to extract multi-level discriminative features via cross-dimensional interactions.
Deep learning advancements have driven changes in self-localization approaches. These approaches have shifted from shallow feature-matching methods based on classification. They now use more flexible and expressive deep neural network architectures. These architectures demonstrate greater adaptability and robustness in complex, multi-view, multi-modal environments.
2.2. Transformer in Vision
The Transformer initially demonstrated a remarkable performance in natural language processing (NLP) tasks, achieving breakthroughs in text classification and machine translation tasks [
14,
38,
39]. This success inspired extensive research interest in exploring its potential applications within the field of computer vision (CV). Prior to the advent of transformers, convolutional neural networks (CNNs) dominated feature modeling in visual tasks. However, the vision transformer (ViT), introduced by Alexey Dosovitskiy et al. [
40], successfully applied Transformer architecture to image classification tasks, achieving outstanding results across multiple image recognition benchmarks and marking the rise of visual transformer research.
As ViT gained widespread adoption, its efficacy was further demonstrated in dense prediction tasks such as object detection [
41,
42] and semantic segmentation [
43,
44]. However, ViT’s single-scale structure and global self-attention mechanism create challenges. They cause significant computational overhead. They also struggle to capture local details, especially with high-resolution inputs. These limitations hinder its broader application in visual tasks. To address these challenges, various improved architectures have been proposed to enhance the transformer efficiency and performance in visual tasks. For example, the pyramid vision transformer (PVT) [
45] introduced a pyramid-style feature extraction structure to effectively model multi-scale information. The Swin transformer (shifted window transformer) [
46] employed a sliding window mechanism to improve computational efficiency while maintaining spatial modeling capabilities. Additionally, the data-efficient image transformer (DeiT) [
47] addressed the issue of large-scale data dependency, enabling transformers to achieve high performance even with medium-sized datasets.
In this study, we enhance the attention mechanisms of the visual Transformer. We integrate three complementary mechanisms: self-attention (SA), cross-attention (CA), and channel reduction attention (CRA). Specifically, SA captures contextual relationships among different positions within a single image, enhancing local feature representations. CA establishes cross-modal interactions between UAV and satellite images, thereby enhancing cross-view matching capability. CRA reduces the computational costs by compressing channel dimensions, maintaining global semantic perception while improving network efficiency. The collaborative design of these three attention mechanisms improves our localization network. It achieves high accuracy and computational efficiency. It also provides robust cross-modal modeling capabilities.
2.3. Geo-Localization Datasets
In recent years, UAV-based visual localization tasks have gained significant attention. They are especially important in complex environments where GNSS signals are weak or unavailable. These tasks highlight their strategic and alternative value. To drive advancements in this field, constructing standardized and representative datasets is particularly critical.
Current mainstream cross-view geo-localization datasets can generally be categorized into three types: (1) Ground-to-satellite paired datasets: These datasets focus on one-to-one matching between ground-level images and satellite images, with typical examples being CVUSA [
27] and CVACT [
28]. CVUSA provides panoramic ground images from various U.S. regions matched with corresponding satellite images, establishing a foundational framework for cross-view localization tasks. CVACT further introduces directional labeling, enhancing model orientation awareness. VIGOR [
48] expands beyond one-to-one retrieval by proposing a one-to-many pairing mechanism, increasing retrieval flexibility and complexity. (2) Datasets incorporating UAV perspectives: These datasets broaden task perspectives, integrating cross-modal matching tasks involving UAV, satellite, or ground images. For instance, University-1652 [
49] first combined UAV, ground, and satellite views within a single dataset, supporting fine-grained, building-level retrieval, and matching. SUES-200 [
48] further diversified imaging heights and scenes, enabling models to better adapt to real-world applications with varying altitudes and terrains. (3) Datasets focused on finding point with image (FPI) localization tasks: These datasets aim for precise localization, emphasizing spatial relationships between UAV and satellite images through explicit cropping and alignment strategies. DenseUAV [
7] utilizes salient feature regions for sample construction, emphasizing spatial consistency. Its derivative, UL14 [
10], concentrates on low-altitude campus scenes, improving FPI matching accuracy but exhibiting clear limitations: homogeneous image content, limited terrain types, and constrained flight altitudes ranging from 80 to 100 m, exclusively covering 14 universities in Hangzhou, Zhejiang. By contrast, UAV-VisLoc [
13] provides high-altitude images with precise geographic annotations but lacks a complete FPI workflow, including paired cropping and multi-scale search mechanisms.
In database image retrieval tasks, datasets like DenseUAV, University-1652, and CVUSA are often used. These datasets typically include UAV and corresponding satellite view images, primarily for retrieval tasks. For FPI methods, the UL14 dataset is most commonly used, covering drone images at altitudes of 80 m, 90 m, and 100 m from 14 universities in Xiasha, Hangzhou, Zhejiang Province, matched with the corresponding satellite images, mainly featuring academic buildings, public squares, and recreational areas. Advanced network architectures have greatly improved positioning accuracy. However, UL14 has limitations. It suffers from homogeneous content and lacks diversity. This is because similar geographical locations result in comparable architectural styles and types. UAV imaging altitudes are restricted between 80 m and 100 m due to hardware and flight constraints. These limitations reduce its generalization capability in practical applications. Examples include mapping, agriculture, and reconnaissance. Research focused only on low-altitude positioning is inadequate for these tasks.
To address these shortcomings, we propose the Multi-UAV dataset. The Multi-UAV dataset integrates and restructures samples from UAV-VisLoc and UL14. It includes UAV images from nine geographic regions. These images cover altitudes from 80 m to 800 m. They are paired with the corresponding cropped satellite images. Scenarios include typical terrains such as mountains, cities, farmland, and coastal areas. The Multi-UAV dataset has a broader geographic distribution and varied scale designs. It significantly enhances the challenge and realism of cross-view image matching tasks. It also enables comprehensive evaluation of method performance across diverse scenes and scales.
3. Dataset and Evaluation
In
Section 3.1, we discuss the advantages of the Multi-UAV dataset compared to existing mainstream datasets. We consider multiple perspectives, including dense sampling, multi-altitude collection, diverse terrain coverage, and high-resolution imaging. This discussion includes a detailed comparative analysis. Subsequently, in
Section 3.2, we further elaborate on the specific sampling strategies and construction processes of the Multi-UAV dataset, detailing the structural composition and key features of both the training and testing sets. Additionally, in
Section 3.3, we introduce a random scale crop (RSC) data augmentation technique to significantly enhance data diversity and the generalization capability of models. Finally, in
Section 3.4, we explicitly define two evaluation metrics tailored for cross-view geo-localization tasks—meter-level accuracy (MA@
K) and relative distance score (RDS)—to provide more intuitive and comprehensive assessments of model performance in practical application scenarios.
3.1. Dataset Advantages
We compared the Multi-UAV dataset with existing mainstream datasets. The comparison covers multiple dimensions, including training data scale, data acquisition platforms, evaluation metrics, continuous sampling strategies, UAV flight altitudes, scene types, and satellite image scales. The results are summarized in
Table 1. This multi-dimensional comparison method intuitively highlights the uniqueness and advancement of the Multi-UAV dataset relative to existing datasets.
Specifically, the Multi-UAV dataset demonstrates significant advantages in the four following aspects:
Dense sampling: We adopted a dense sampling strategy with overlapping regions between image frames, where each frame represents a unique scene. This approach requires models to accurately recognize essential features. It also considers spatial relationships between scenes. These steps significantly enhance model generalization capabilities. Additionally, the overlapping regions increase the complexity of positive matches during retrieval, thus increasing the benchmark’s challenge and research value.
Multi-altitude sampling: Previous datasets focused only on low-altitude images (below 300 m). In contrast, the Multi-UAV dataset includes UAV images collected at multiple scales. These images range from 80 to 800 m. This comprehensive altitude range allows models to learn and effectively adapt to visual features observed at varying altitudes, significantly improving model robustness and generalization performance.
Multi-terrain sampling: The UAV images collected in the Multi-UAV dataset encompass diverse real-world scenarios and are continuously expanded. UAV and satellite images have temporal and viewpoint differences. These differences make cross-view localization tasks challenging. Unlike traditional urban-focused datasets, as illustrated in
Figure 2, Multi-UAV includes terrains such as farmlands, ports, cities, deserts, and lakes, enhancing model generalization capabilities across diverse real-world environments.
High-Resolution Sampling: High-resolution cameras were utilized for UAV image acquisition to capture richer ground textures and detailed information. This high-resolution imaging strategy enables models to effectively capture and learn subtle image features, further improving the adaptability and localization performance across diverse scenarios.
3.2. Dataset Construction
The Multi-UAV dataset is reconstructed from the UL14 and UAV-VisLoc datasets. It uses the finding point with image (FPI) method as the benchmark. The dataset includes paired UAV and satellite view images [
51,
52,
53]. It aims to create a comprehensive benchmark for UAV-based visual localization. This benchmark covers diverse altitudes and terrains. It also enhances dataset effectiveness.
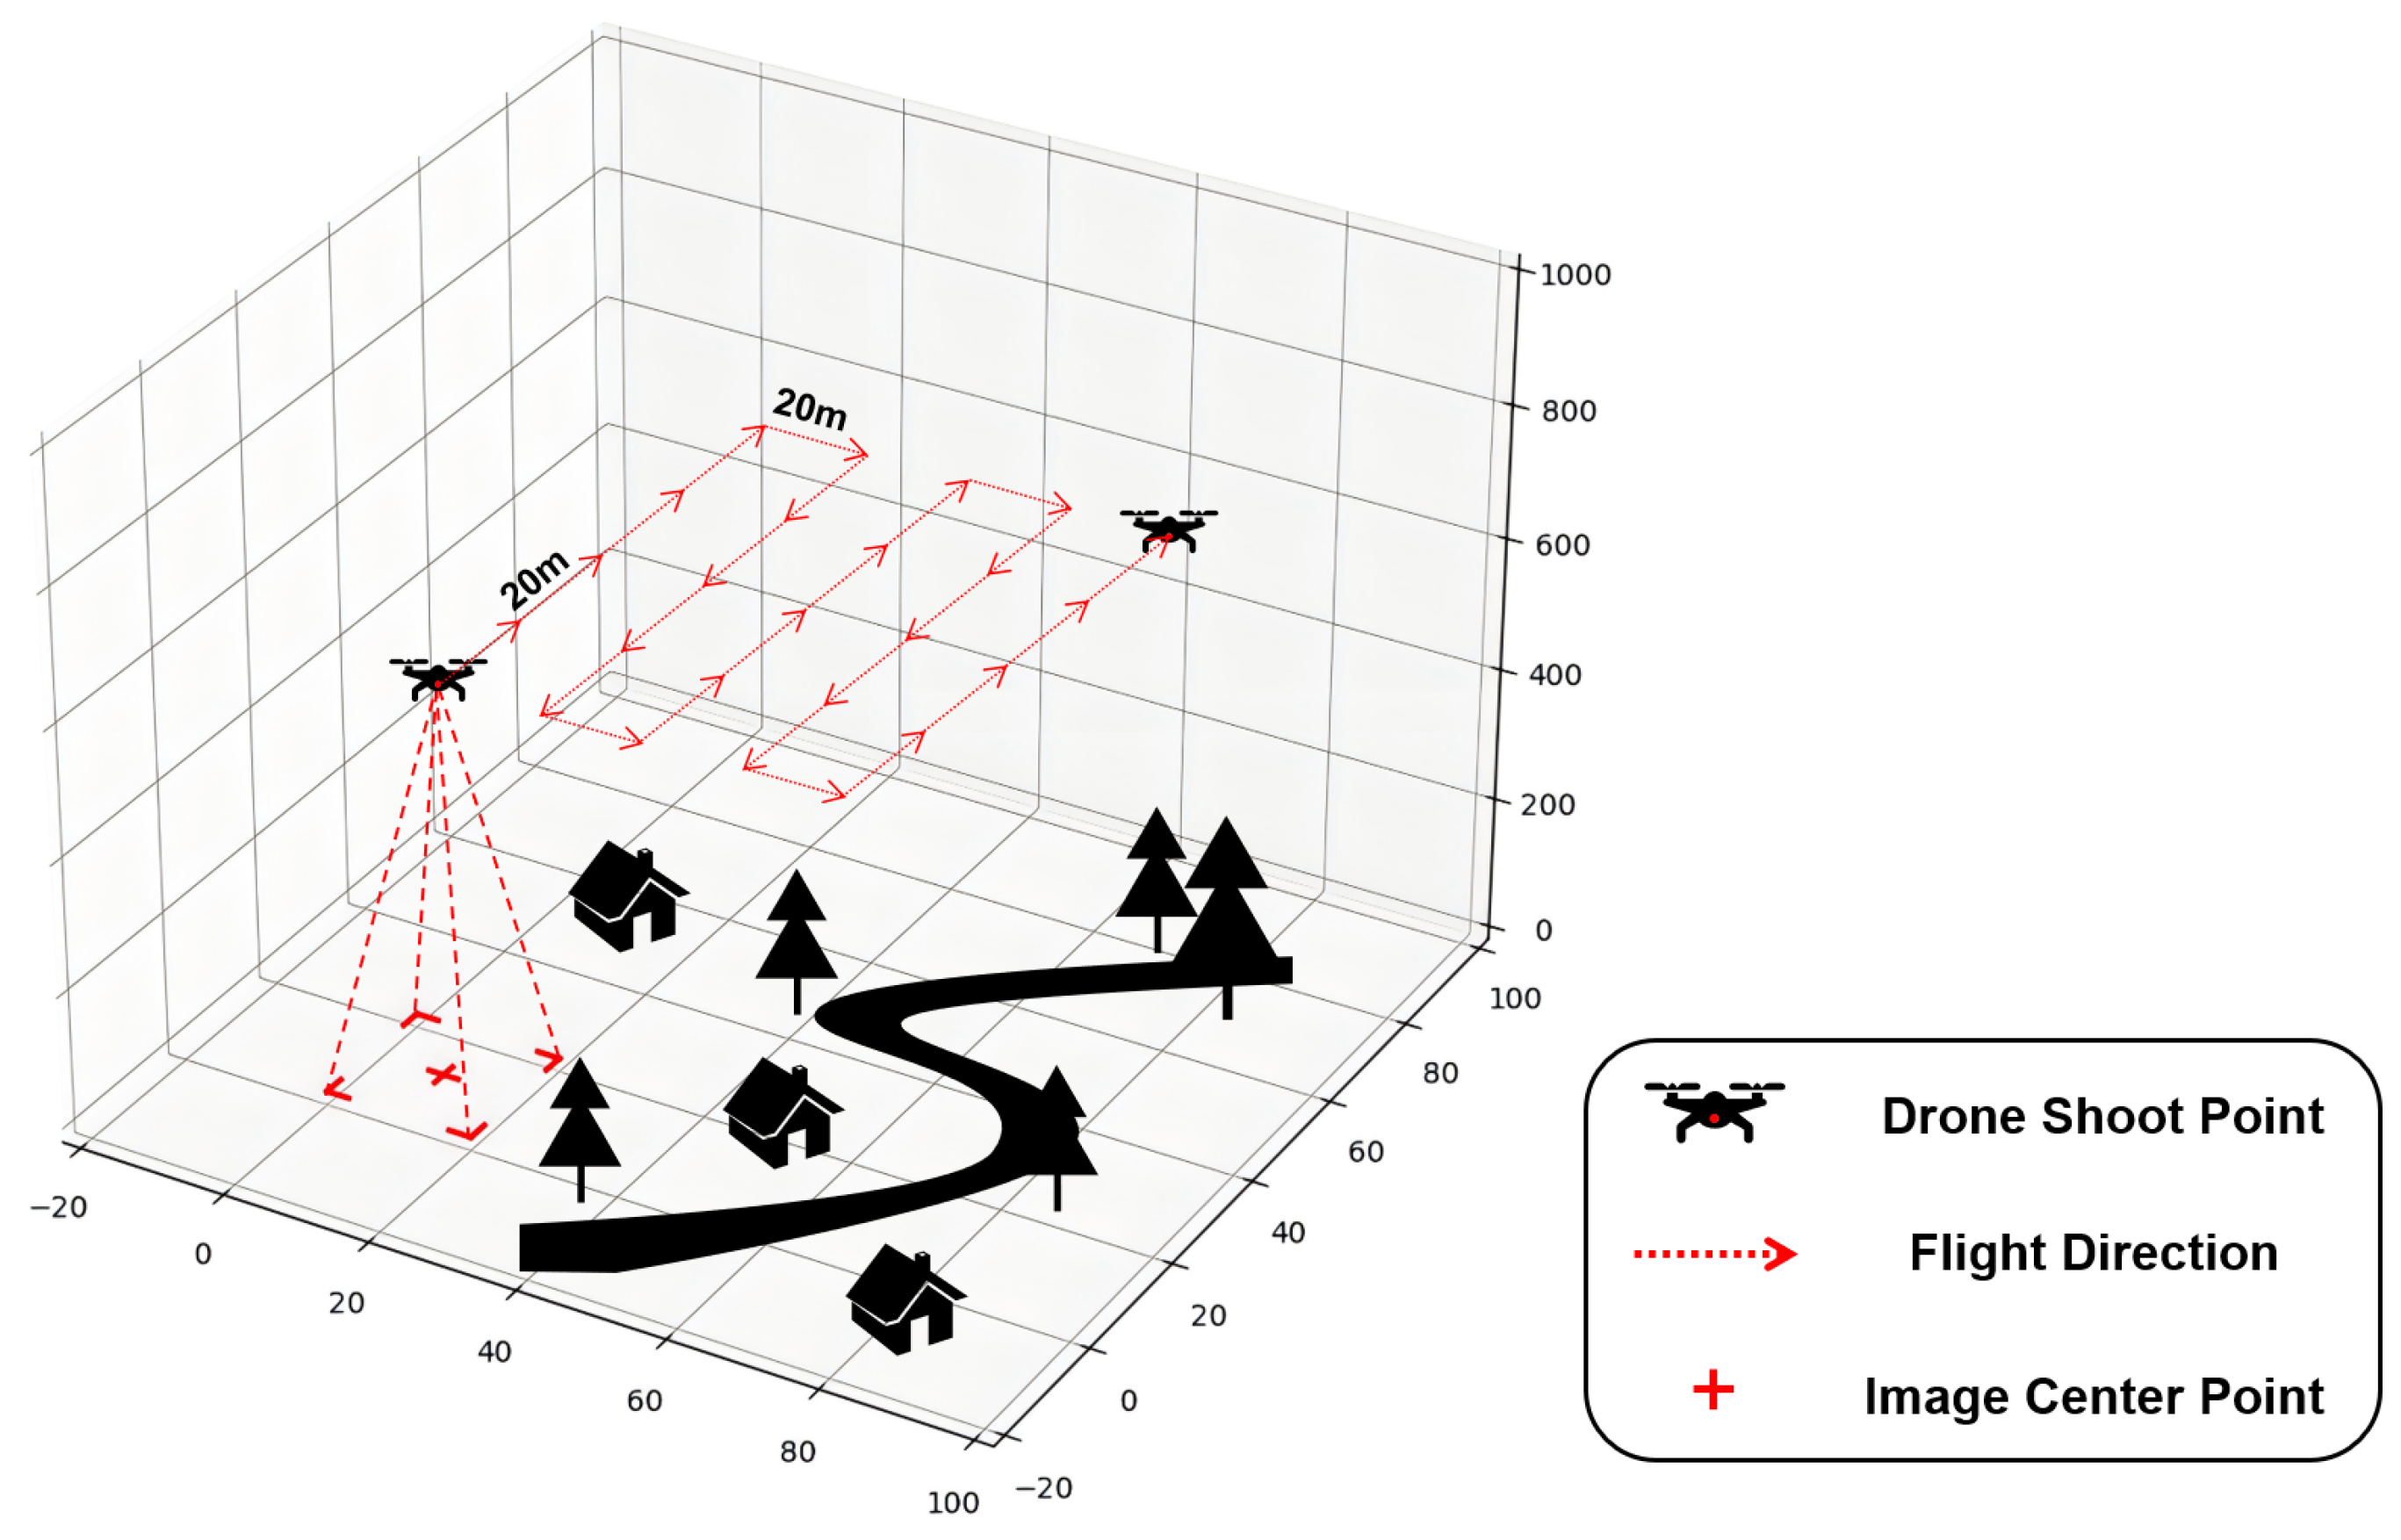
In data collection across various scenes, we adopted a dense sampling strategy, ensuring an overlapping region of at least 20 m between adjacent image frames. This design enhances the model’s sensitivity to subtle differences between scenes and reduces the interference from irrelevant factors during retrieval. The specific data acquisition process is illustrated in
Figure 3.
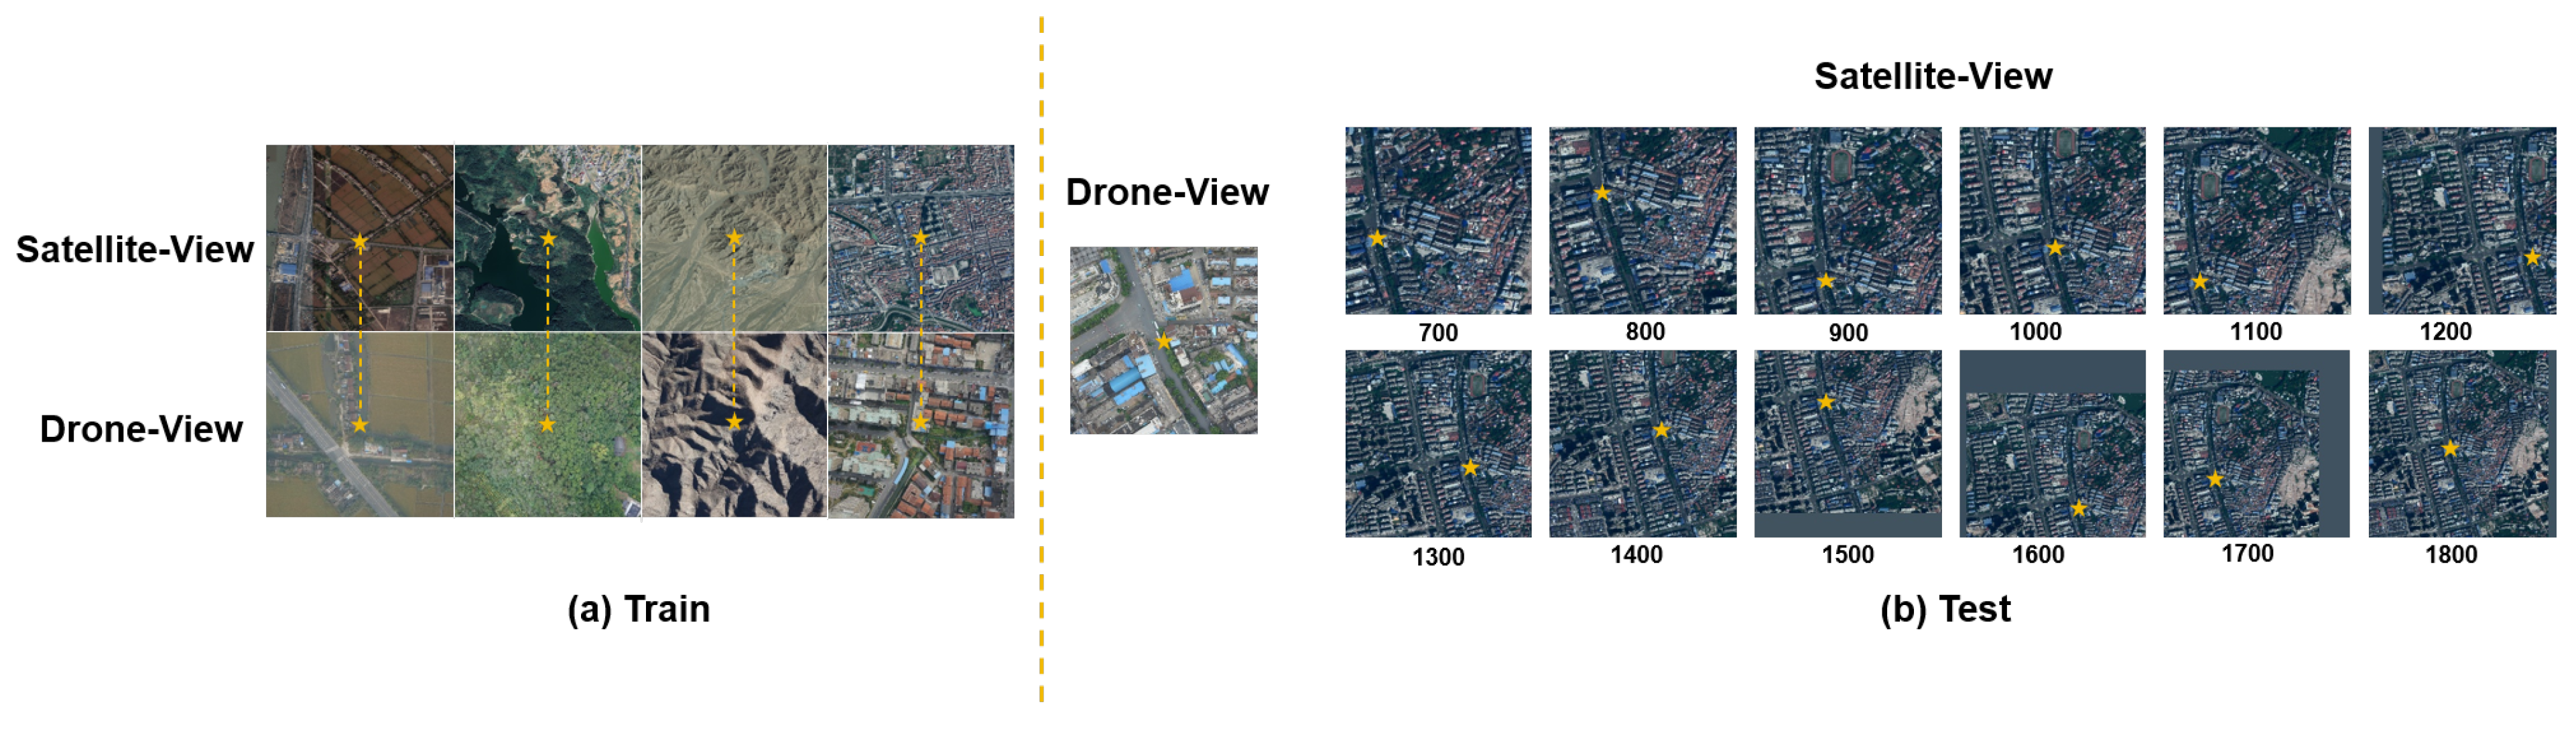
The Multi-UAV dataset constructed in this study includes 17.4 k pairs of UAV and satellite images collected from various regions and scenarios, such as Zhejiang, Changsha, Yangtze River, Yunnan, and Taizhou. Specifically, the training set contains 14.3 k UAV–satellite image pairs, while the test set comprises 3.1 k pairs. Examples of dataset samples are shown in
Figure 4.
Training set: The UAV images cover flight altitudes ranging from 80 m to 800 m. To facilitate uniform model training, all UAV images are standardized to a resolution of 512 × 512 pixels. Corresponding satellite images are sourced from Google Maps at a zoom level of 20 with high resolution, uniformly resized to 1280 × 1280 pixels. The larger satellite image size allows for the flexible implementation of data augmentation strategies (e.g., random cropping) during training. Each training sample consists of one UAV image and its corresponding satellite image, as shown in
Figure 4a.
Test set: The sampling regions for the test set do not overlap with those of the training set, ensuring the objective and effective evaluation of model generalization. The corresponding satellite images are accurately cropped based on the UAV image GPS locations, with satellite image scales ranging from 700 to 1800 pixels at intervals of 100 pixels (700 pixels correspond to approximately 180 m × 180 m, and 1800 pixels to approximately 463 m × 463 m). Each UAV image in the test set corresponds to 12 satellite images. These satellite images have varying spatial scales. This is illustrated in
Figure 4b. This design increases the test data diversity. It also raises evaluation difficulty. Additionally, it improves the model adaptability to scale variations in real-world scenarios. The UAV query image positions within satellite search images have a 0.95 coverage ratio. This means that some query positions may appear at the edge regions of the search images. This placement increases the localization difficulty. It is important to note that a richer random scale crop (RSC) data augmentation strategy will also be applied during training, significantly enhancing the data diversity and robustness. This strategy is detailed in
Section 3.3.
3.3. Random Scale Crop (RSC)
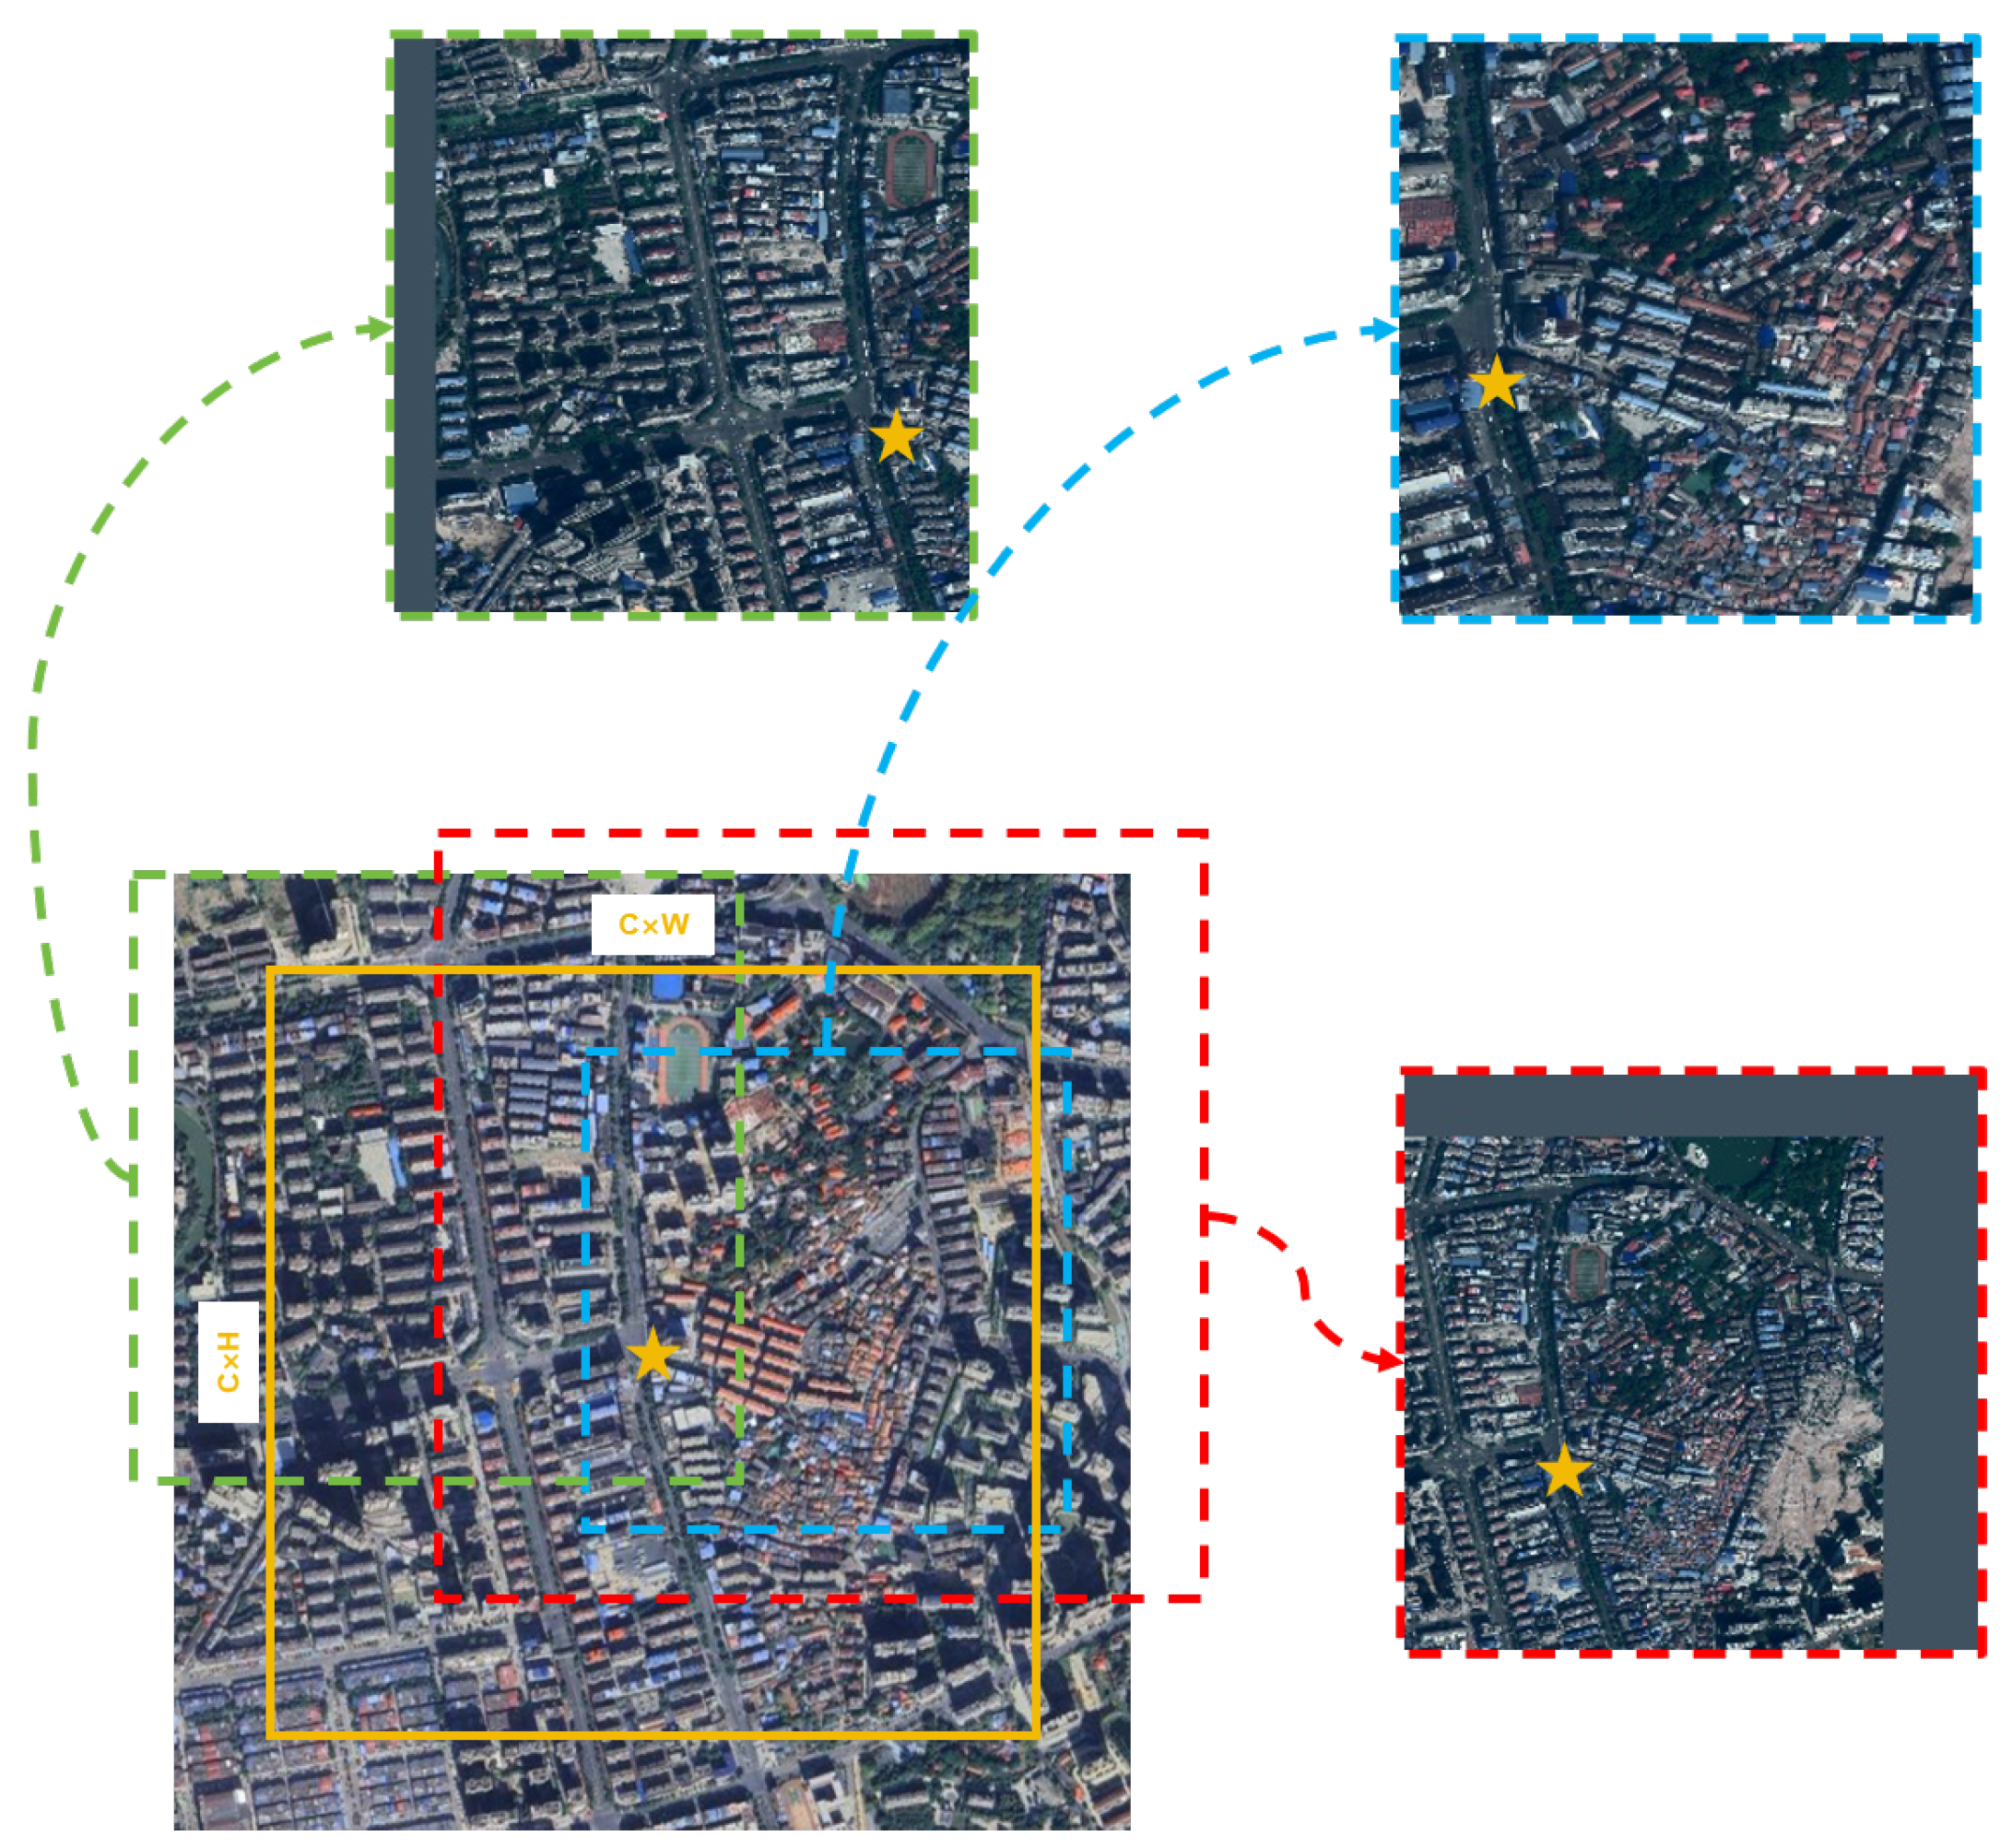
To further enhance the diversity of training images, we propose a random scale crop (RSC) data augmentation method, which introduces randomness in both scale and target position distribution within the satellite search images, as illustrated in
Figure 5. During implementation, we intentionally retained extra scale redundancy in the satellite images during dataset creation, enabling the dynamic cropping of satellite images at varying scales and position offsets during training, thus enriching the diversity of UAV–satellite image pairs.
As shown in
Figure 5, we designed two hyperparameters to facilitate dynamic cropping: the centroid coverage range (C, default value set to 0.75), and the scale range (default upper limit 1800 pixels, lower limit 700 pixels). The hyperparameter C determines the spatial distribution of query targets within the search image. When the C value is small, query targets are more likely to be centrally located; conversely, when the C value is large, query targets may be more broadly distributed across the search image. The scale range determines the actual spatial scale covered by the cropped search image; larger scales imply greater spatial distances per pixel. Through this data augmentation strategy, the model learns visual features across different scales and positional offsets more effectively, significantly improving robustness against scale variations and spatial offsets.
3.4. Evaluation Indicators
Traditional evaluations commonly use Recall@
K [
54] and AP [
55] as metrics for matching accuracy. However, these metrics have limitations as they only consider positive or negative matching results discretely and fail to accurately reflect localization errors or directly address the inherent requirements of localization tasks. Unlike indirect localization through image retrieval methods, we introduce two novel evaluation metrics specifically designed for UAV–satellite image matching tasks: meter-level accuracy (MA@
K) and relative distance score (RDS). These metrics offer a more detailed and intuitive quantitative analysis of the localization accuracy from both spatial and model performance perspectives.
Meter-level accuracy (MA@K):
The MA@
K metric intuitively quantifies the error between predicted and actual locations based on spatial distance. It is defined as:
Here, SD represents the actual spatial distance (in meters) between the predicted and actual locations, and
K is an adjustable distance threshold parameter. MA@
K measures the proportion of samples whose localization error is less than or equal to
. The spatial distance error SD is computed as:
where
and
represent meter-level errors between the predicted and actual positions along the longitude and latitude directions, respectively.
Relative distance score (RDS):
While MA@K directly measures spatial accuracy, it has certain limitations: (1) The choice of threshold K significantly impacts larger-scale search images, where minor pixel deviations may correspond to substantial spatial errors; (2) To comprehensively evaluate model performance, multiple thresholds K must typically be set, complicating the straightforward representation of overall model performance.
To overcome these issues, we further propose the relative distance score (RDS), a robust metric for evaluating the localization accuracy at the model level. Let
be the model-predicted coordinates and
be the actual coordinates. Relative distance (RD) is defined as:
where
and
. To consistently and intuitively represent accuracy between 0 and 1, RD is converted into a score (RDS):
where
k is a scaling factor, set to 10 by default.
The RDS metric offers several advantages: (1) It calculates the distance based on pixel-level distances rather than actual spatial distances, providing robustness to changes in the search image scale; (2) It produces a single score between 0 and 1, where higher scores indicate higher localization accuracy, enabling the intuitive visualization of overall model performance; (3) The exponential function significantly amplifies distance deviations, quickly approaching zero as predicted positions increasingly deviate from actual positions, aligning with practical expectations in localization tasks where large errors are considered failures.
4. Method
In this chapter, we provide an in-depth discussion of the design strategies and implementation details behind the proposed localization network.
Section 4.1 first outlines the overall architecture of the VRPT backbone network, including the hierarchical division of network layers, interconnection structures between modules, and the overall logical workflow of functional implementation. Subsequently,
Section 4.2 thoroughly examines the design principles and specific implementations of the self-attention (SA), cross-attention (CA), and channel reduction attention (CRA) mechanisms employed within the network. Additionally, we present detailed strategies for the network’s patch embedding and position encoding techniques. Finally, in
Section 4.3, we analyze the structural design of the residual feature pyramid network (RFPN) used for prediction, highlighting its pivotal role in enhancing feature resolution and strengthening spatial contextual understanding.
4.1. The Backbone of Networks
In designing the backbone network, we adopted and further enhanced the basic approach of the FPI method, optimizing it based on the SSPT [
56] model to effectively address complex and diverse UAV scenarios.
As shown in
Figure 6, the network input consists of one satellite image (denoted by
X) and one UAV image (denoted by
Z). The backbone network is divided into three similar stages, each progressively halving the spatial resolution (
H and
W), with the channel dimensions (
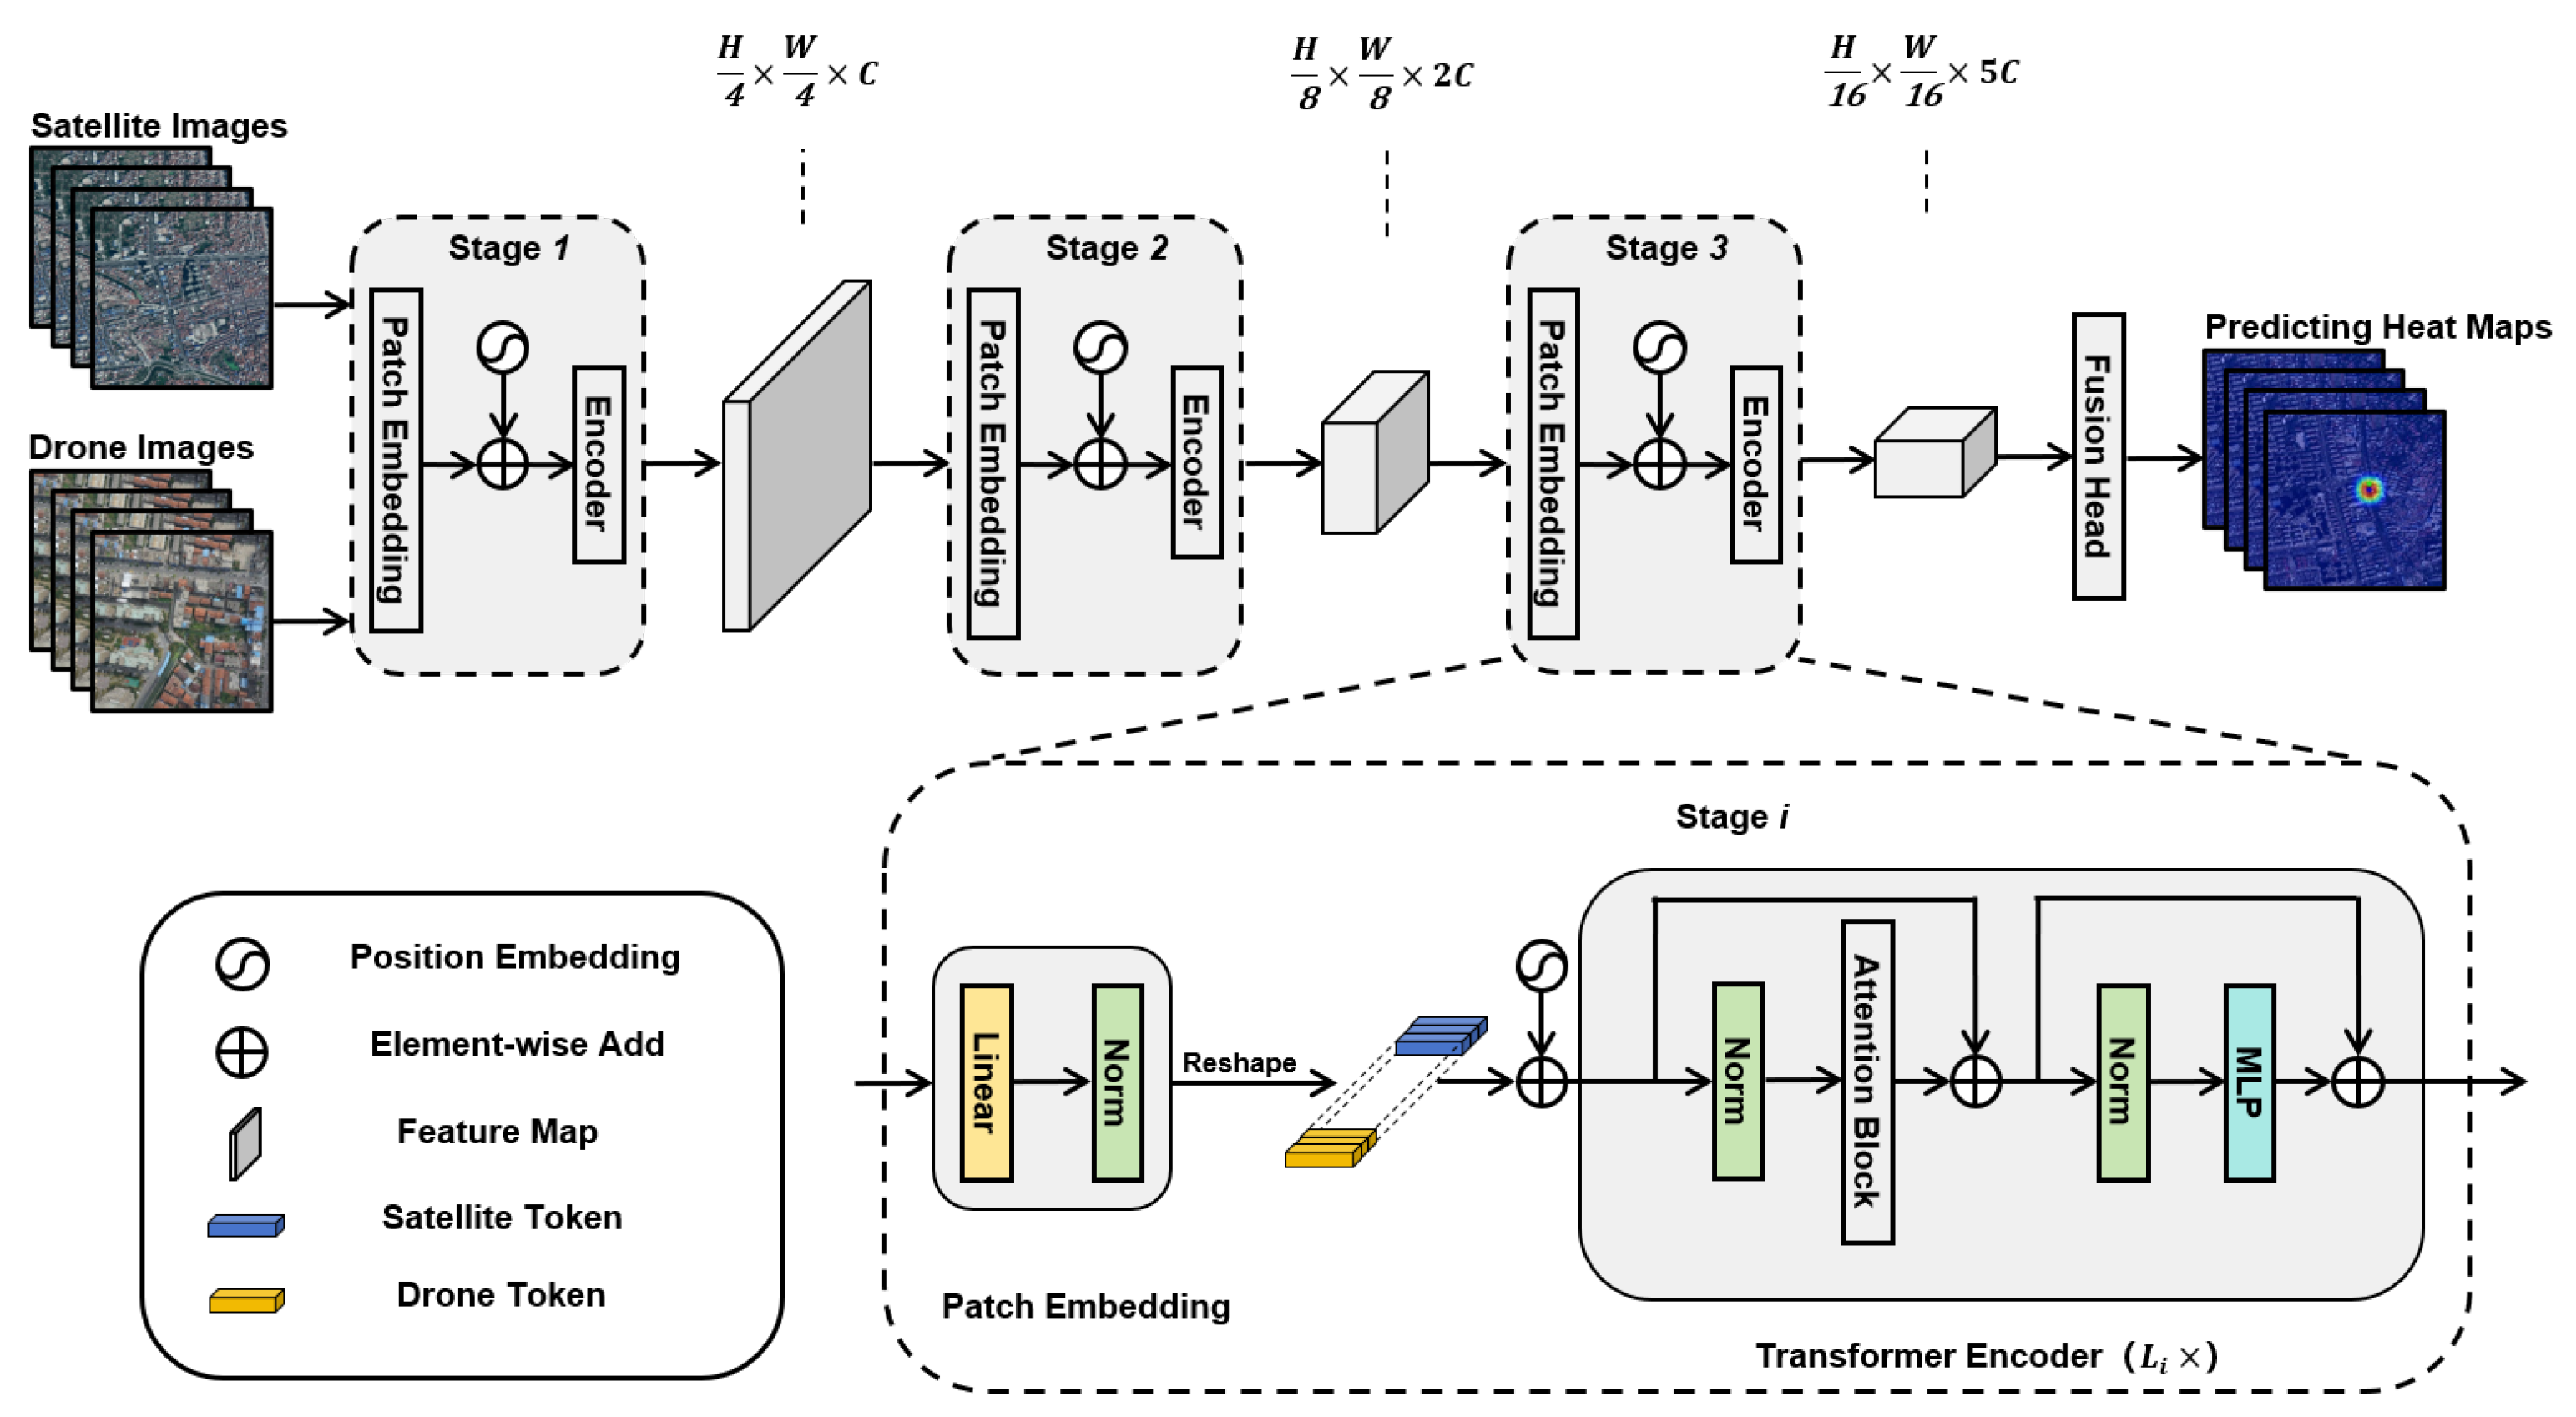
C) set at 64, 128, and 320, respectively. Each stage comprises a patch embedding layer followed by several transformer encoder modules. Specifically, the transformer encoder depths for the three stages are configured as 4, 6, and 8 layers, respectively. Each transformer encoder primarily consists of layer normalization (Norm), attention blocks, and multi-layer perceptron (MLP) modules. In designing the attention block, we innovatively integrated channel reduction attention (CRA) and cross-attention (CA) mechanisms to ensure efficient and thorough feature interactions. Finally, the network’s head components decode and reconstruct the deep features, outputting heatmaps that precisely represent positional information.
4.2. Attention Block
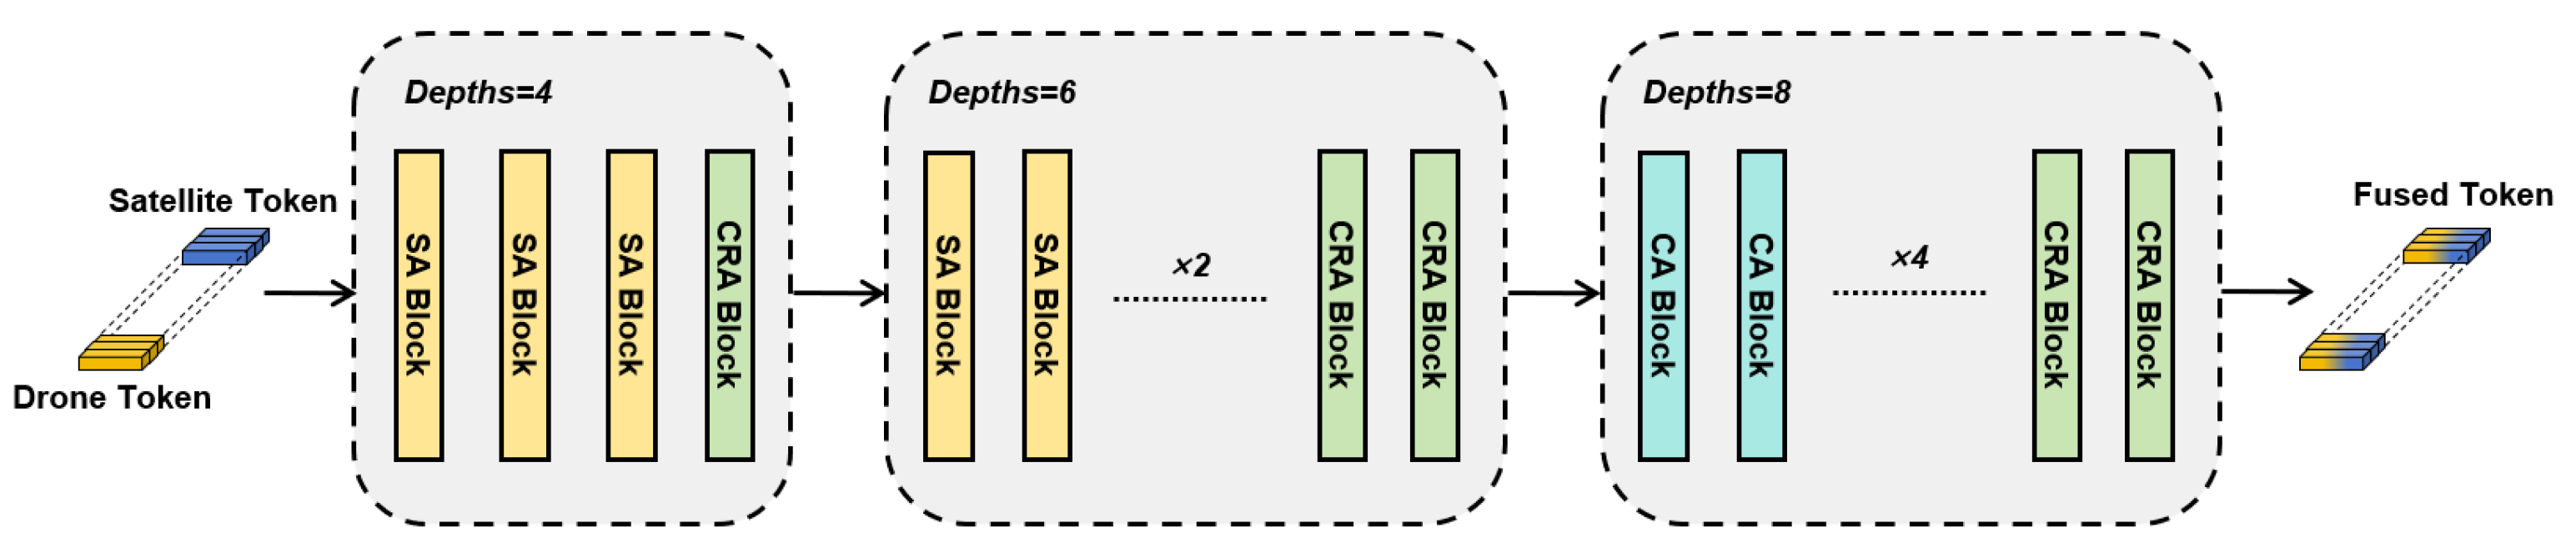
Unlike the SSPT approach, we innovatively introduce the channel reduction attention (CRA) mechanism into the feature modeling layer, significantly enhancing the model’s representational capability while effectively reducing computational costs by integrating self-attention (SA), cross-attention (CA), and channel reduction attention (CRA) mechanisms. The network structure is divided into three stages, with the depth (i.e., the number of Transformer modules per stage) set to 4, 6, and 8, respectively. In each stage, our designed attention module flexibly combines different attention mechanisms, ensuring comprehensive feature interactions among image patches to facilitate deeper feature fusion and information sharing. The overall architecture of the backbone network is illustrated in
Figure 7.
In the first and second stages of the network, we primarily employed the self-attention (SA) mechanism to deeply explore and aggregate intra-image features. The SA mechanism calculates feature similarities between the different positions within the sequence, assigning corresponding weights to facilitate information interaction and fusion over long-range spatial regions, thus obtaining richer contextual representations. This mechanism, shown in Equations (6) and (7), effectively prevents early cross-modal feature mixing at initial network layers, ensuring stable and semantically clear feature extraction for each image independently, thus forming a solid foundation for subsequent cross-modal fusion.
Here, and represent feature vectors at positions i and j in the input sequence (satellite image X or UAV image Z), and denotes the attention weights calculated between positions i and j. denotes the similarity function between positions i and j.
In the third stage of the network, we introduce the cross-attention (CA) mechanism to achieve fine-grained information interaction between different image modalities, as shown in Equations (8) and (9). Unlike SA, CA emphasizes inter-image feature connections, establishing explicit spatial correspondences between UAV and satellite images. By comparing semantic similarities across different image regions, CA dynamically focuses each spatial position on the most relevant regions in the opposite image, enhancing the discriminative capability and spatial alignment accuracy for cross-modal matching tasks.
Here, represents the query vector at position i from the satellite image sequence X, while represents the value vector at position j from the UAV image sequence Z. quantifies the attention weight reflecting the association between the query and value .
To control computational complexity while preserving representational capacity, we introduce the channel reduction attention (CRA) mechanism at each network stage, as shown in Equations (10) and (11). CRA significantly reduces dimensionality by applying average pooling across channel dimensions before attention computation. This strategy decreases the resource consumption during attention weight computation while retaining critical global contextual information, thus enhancing the network efficiency without compromising modeling capability. The integration of CRA facilitates efficient information exchange during deep feature fusion, particularly suited for resource-sensitive UAV platforms.
Here, AvgPool and AvgPool represent feature vectors obtained after average pooling of the input sequences, effectively compressing high-dimensional features into lower dimensions, significantly improving the computational efficiency.
4.3. The Fusion Head of Networks
Since its initial introduction in 2017 and subsequent implementation in object detection tasks, researchers have continually refined and enhanced the feature pyramid network (FPN) [
57] to achieve superior multi-scale feature fusion performance. More efficient feature fusion modules, such as BiFPN [
58] and PANet [
59], have since emerged and demonstrated notable results across various visual tasks. In 2023, Yang et al. introduced the asymptotic feature pyramid network (AFPN) [
60], directly fusing features from the non-adjacent layers to avoid information loss and semantic gaps, further incorporating an adaptive spatial fusion strategy to minimize information conflicts.
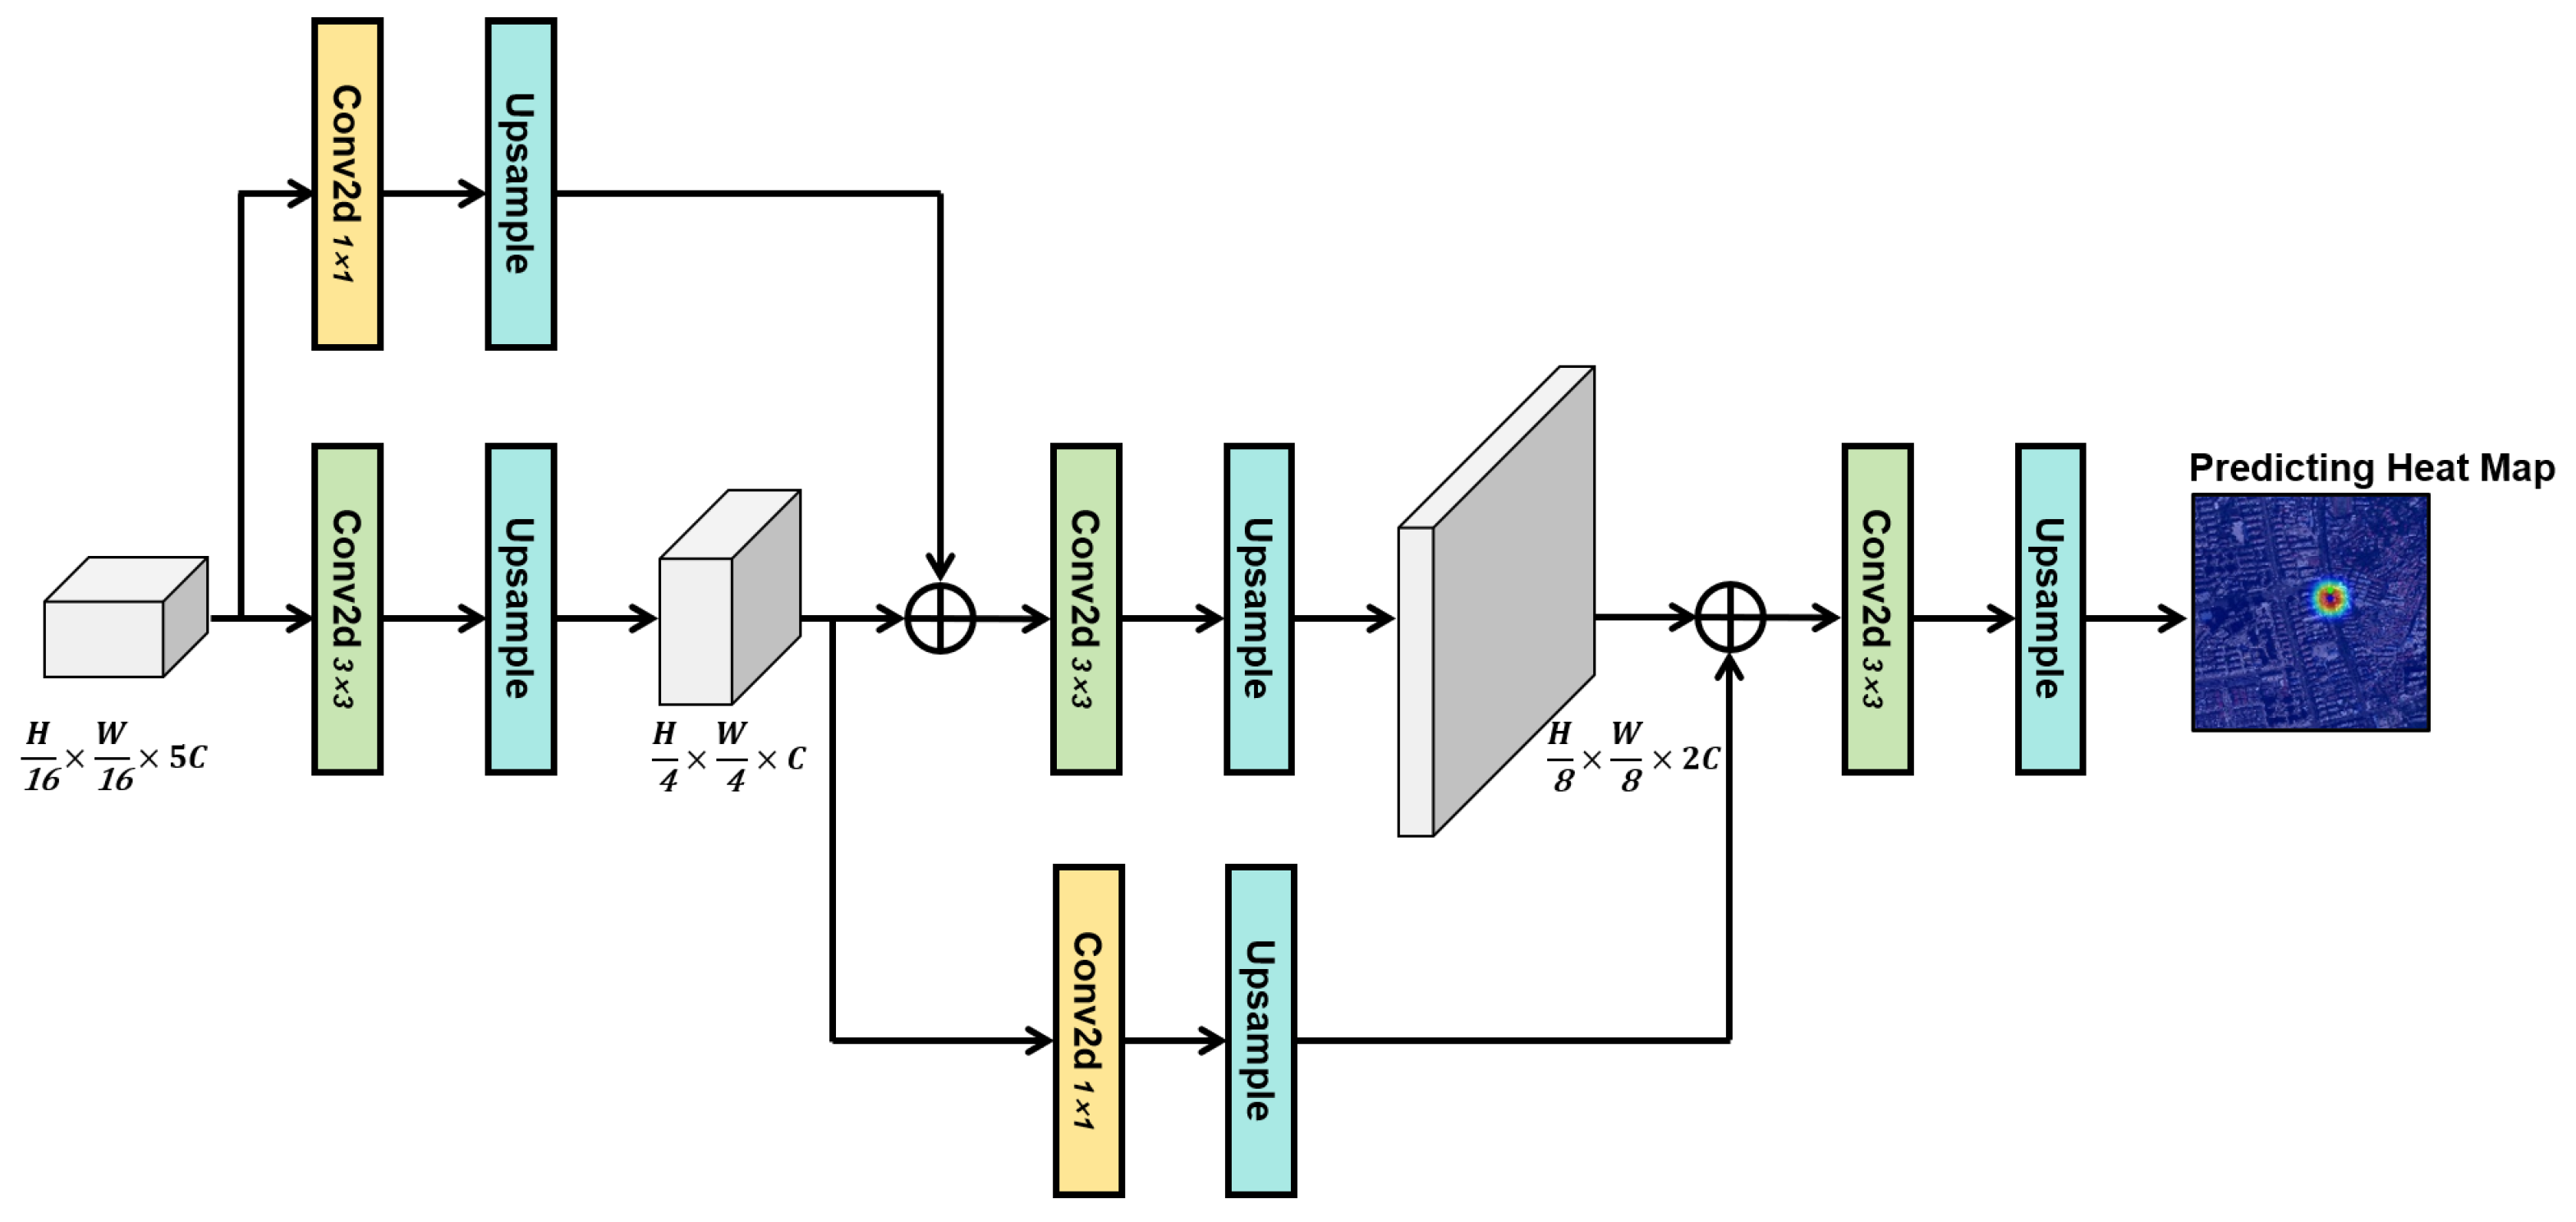
These existing feature fusion structures have provided significant inspiration for designing more efficient cross-modal localization networks. However, these methods are primarily tailored for natural image classification or object detection tasks and are not directly applicable to high-resolution, low-level feature-dominated cross-view image matching scenarios. In our approach, the final output consists of processed satellite image feature sequences with the dimensions (B, 5C, H/16, W/16), characterized by low-resolution feature maps. Directly recovering these low-resolution feature maps to their original dimensions using traditional upsampling techniques would result in substantial loss of spatial positional information and computational inaccuracies. Additionally, considering that the first two stages primarily employ self-attention (SA) modeling on respective image sequences, and cross-attention (CA) for modality fusion is only introduced in the final stage, traditional FPN structures are inadequate in fully exploiting such feature configurations. Therefore, as depicted in
Figure 8, we innovatively propose the residual feature pyramid network (RFPN) to more efficiently and coherently integrate features across different semantic levels.
5. Experiment
In our experiments, we utilized the publicly available UL14 dataset and our newly constructed Multi-UAV dataset. The latter encompasses diverse terrains, viewpoints, and scales, significantly enhancing the model’s generalization capabilities. The models were developed using Python 3.7 and PyTorch 1.10.2 frameworks, executed on a CUDA 12.0 platform, and trained on two NVIDIA GeForce GTX 1080 Ti GPUs (manufactured by NVIDIA Corporation, Santa Clara, CA, USA). The proposed VRPT backbone network consists of a three-stage Transformer architecture with depths of 4, 6, and 8 layers, respectively, forming a bottom–up hierarchical feature extraction structure. The backbone network was pretrained on ImageNet-1K to obtain generalized visual representations. The adopted VRPT_256 configuration resized UAV images to and satellite images to , employing a batch size of 72 to balance accuracy and computational costs.
During training, we utilized the AdamW optimizer, applying differentiated learning rates: 0.0003 for the backbone network and 0.00045 for other modules, with a weight decay of . The learning rate scheduler was configured as CosineAnnealingLR with a maximum period of and a minimum learning rate of over 100 epochs. Mixed precision and gradient scaling were implemented using GradScaler, with model checkpoints saved every 10 epochs. All experimental hyperparameters were consistently maintained across different datasets and configurations to ensure fairness and reproducibility.
5.1. Experimental Results on UL14
To comprehensively evaluate the proposed model’s performance in cross-view UAV localization tasks, quantitative experiments were conducted on the mainstream UL14 dataset, with systematic comparisons against representative image matching methods (FPI [
10], WAMF-FPI [
11], OS-FPI [
12] and SSPT [
56]). Considering the significant influence of image resolution on precision and computational efficiency in practical applications, we developed two VRPT variants, named VRPT_256 and VRPT_384, mainly differing in the satellite image input dimensions (
vs.
). Two key performance metrics were employed: RDS for matching relevance and MA@
K for localization accuracy.
Table 2 presents a multi-dimensional comparison of models on the UL14 dataset. The VRPT_384 model achieved an RDS score of 0.847, substantially outperforming current mainstream methods, demonstrating superior semantic representation capabilities for complex cross-view retrieval tasks. Meanwhile, the lightweight VRPT_256 maintained high precision with significantly lower computational complexity (2.84 G FLOPs) and fewer parameters (10.12 M) than all other compared methods, indicating excellent computational efficiency and compactness, making it particularly suitable for deployment in resource-constrained embedded systems or lightweight UAV platforms.
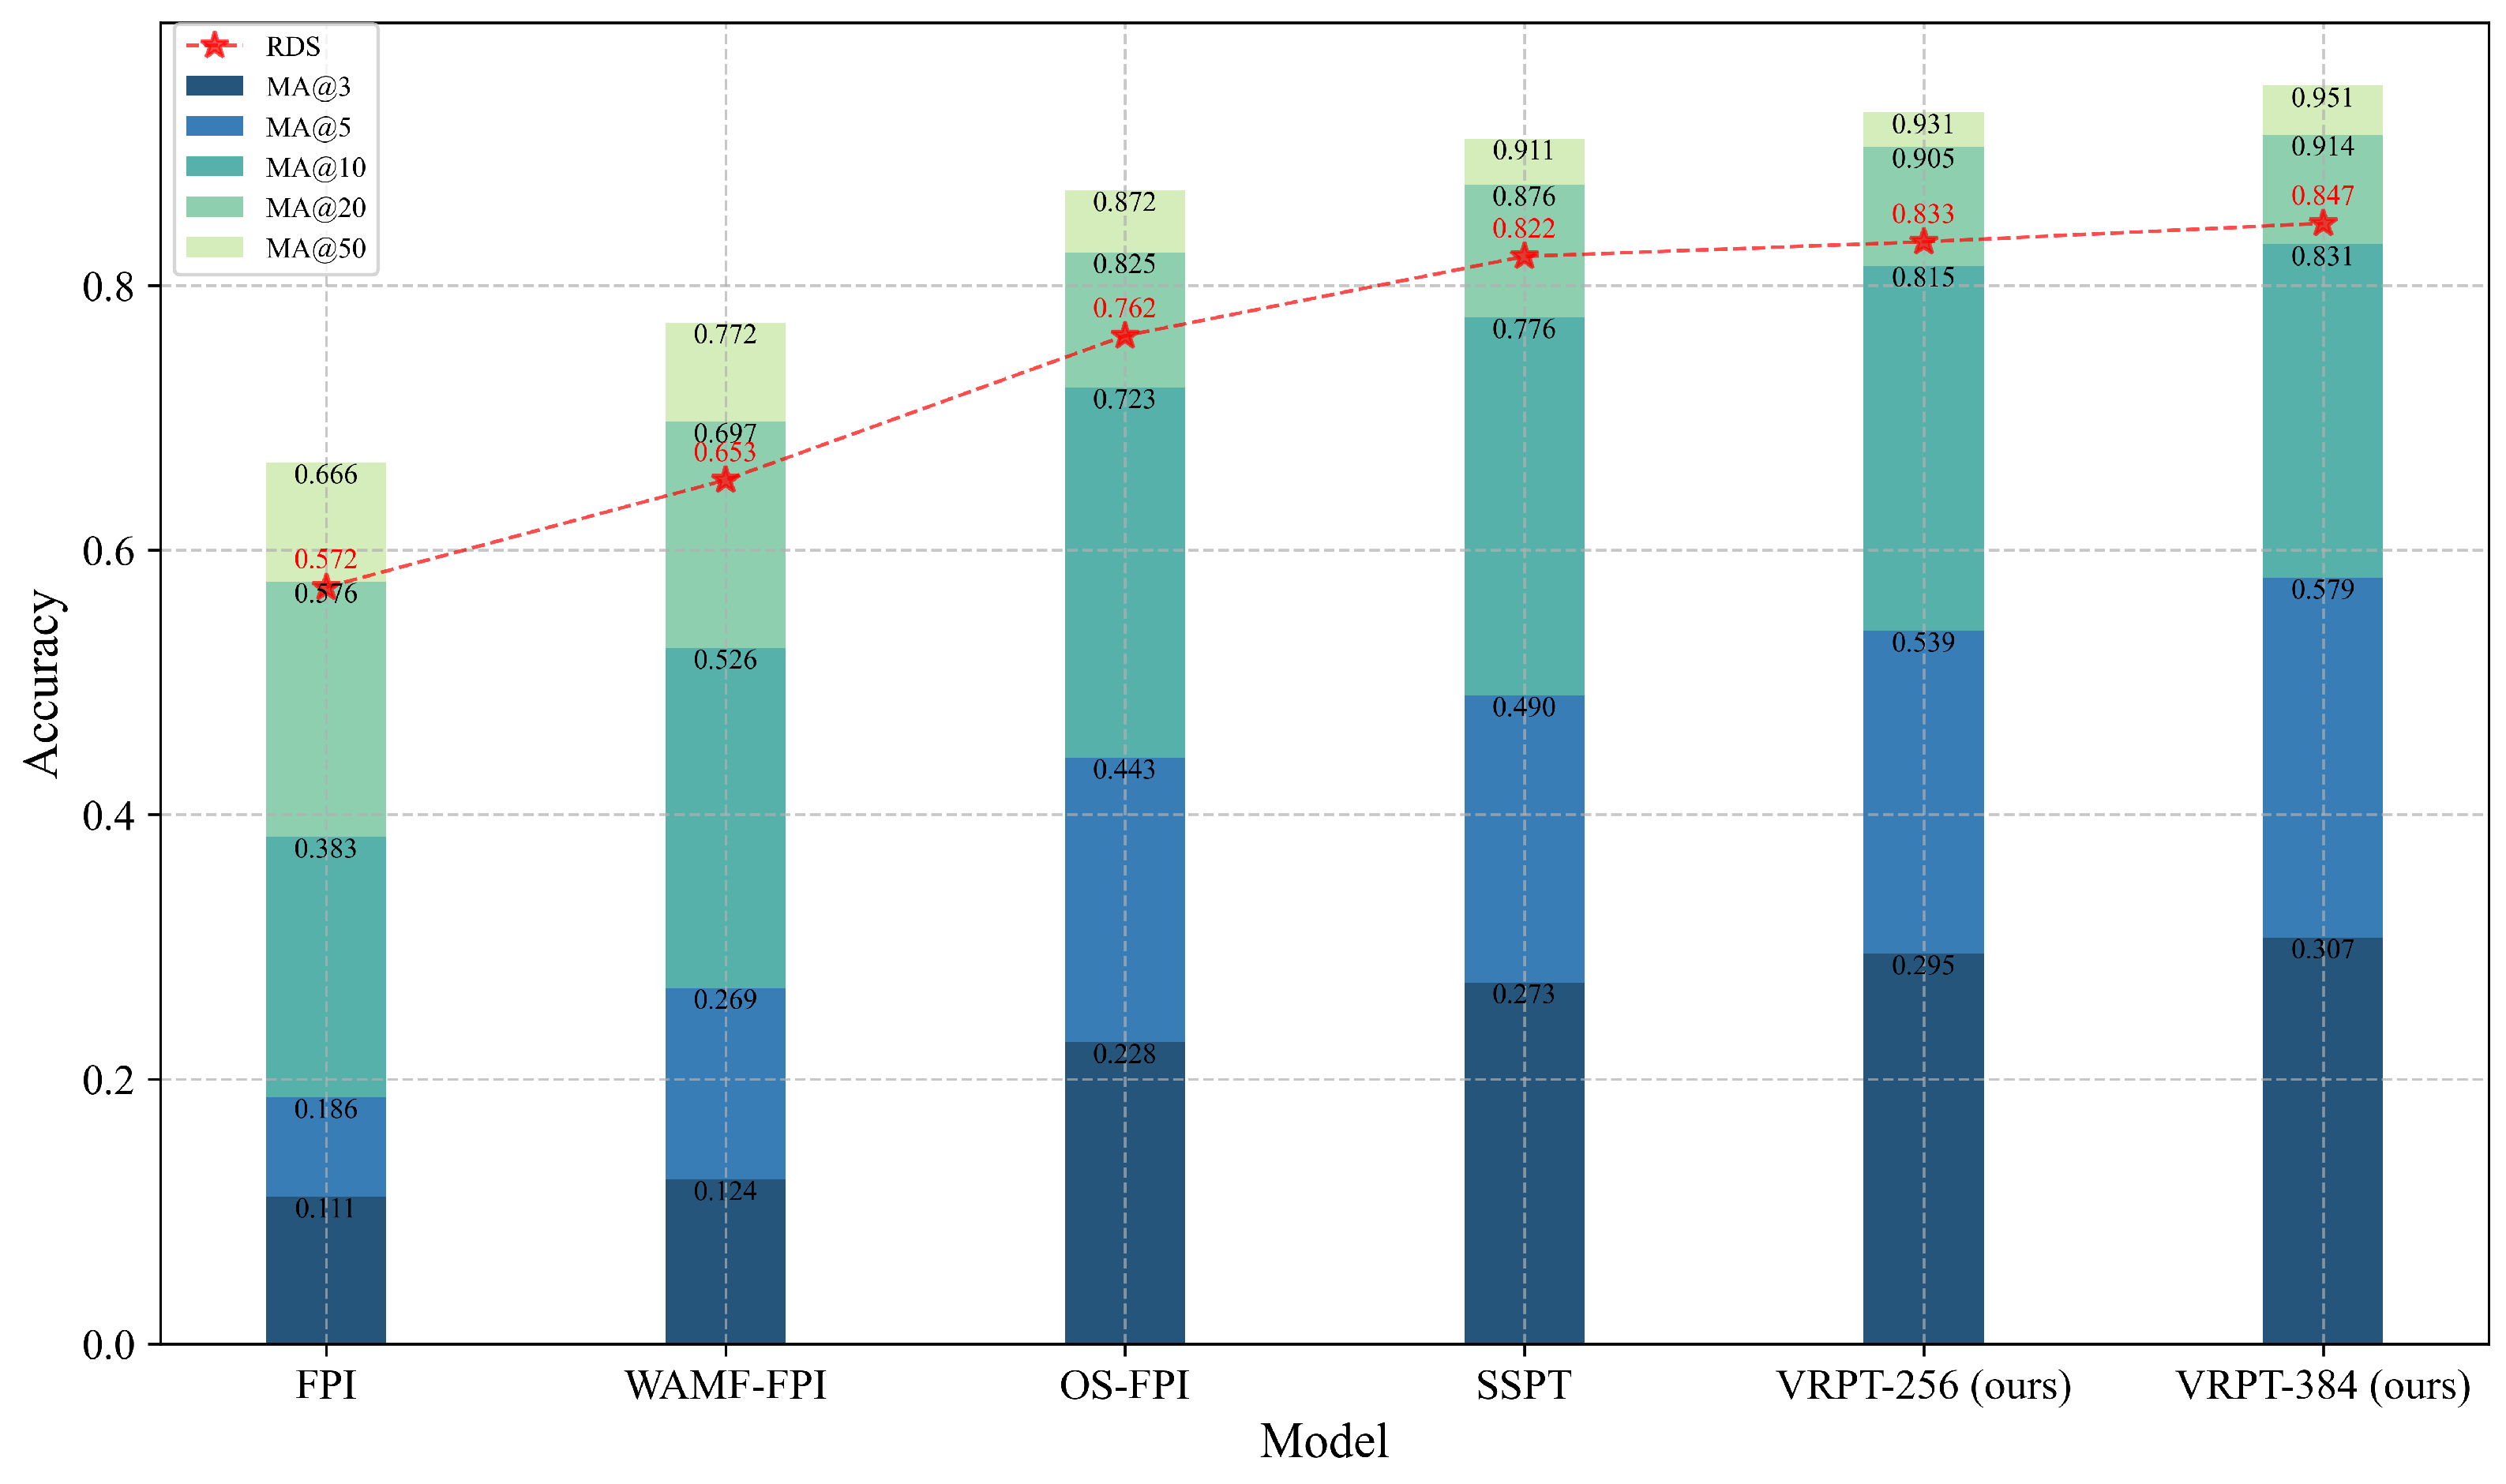
As shown in
Figure 9, VRPT_384 achieved accuracy levels of 30.7%, 57.9%, 83.1%, and 91.4% at varying spatial error thresholds (3 m, 5 m, 10 m, and 20 m), demonstrating substantial improvements of 12.5%, 18.3%, 7.0%, and 1.0%, respectively, compared to the best existing method, particularly excelling in high-precision localization scenarios (3–10 m range). Notably, while VRPT_384 demonstrated higher precision, it required greater computational resources. Hence, VRPT_256 offers a more favorable trade-off between accuracy and computational efficiency.
5.2. Experimental Results on Multi-UAV
After validating the performance on the UL14 dataset, we further evaluated VRPT_256 on the more challenging Multi-UAV dataset to assess its generalization capability across diverse altitudes and terrains. The Multi-UAV dataset includes a variety of typical terrains such as urban, rural, mountainous, and forested areas, collected at significantly higher altitudes than conventional UAV geo-localization datasets, thus presenting greater complexity and representativeness.
Considering the significant spatial coverage and variations in image scales within this dataset, the traditional MA@K metric is less suitable for high-altitude scenarios with sparse labels. In contrast, the RDS metric, capable of measuring pixel-level differences between the predicted and true labels independently of image overlap, was selected as the primary evaluation indicator to objectively assess the effectiveness of cross-view image matching.
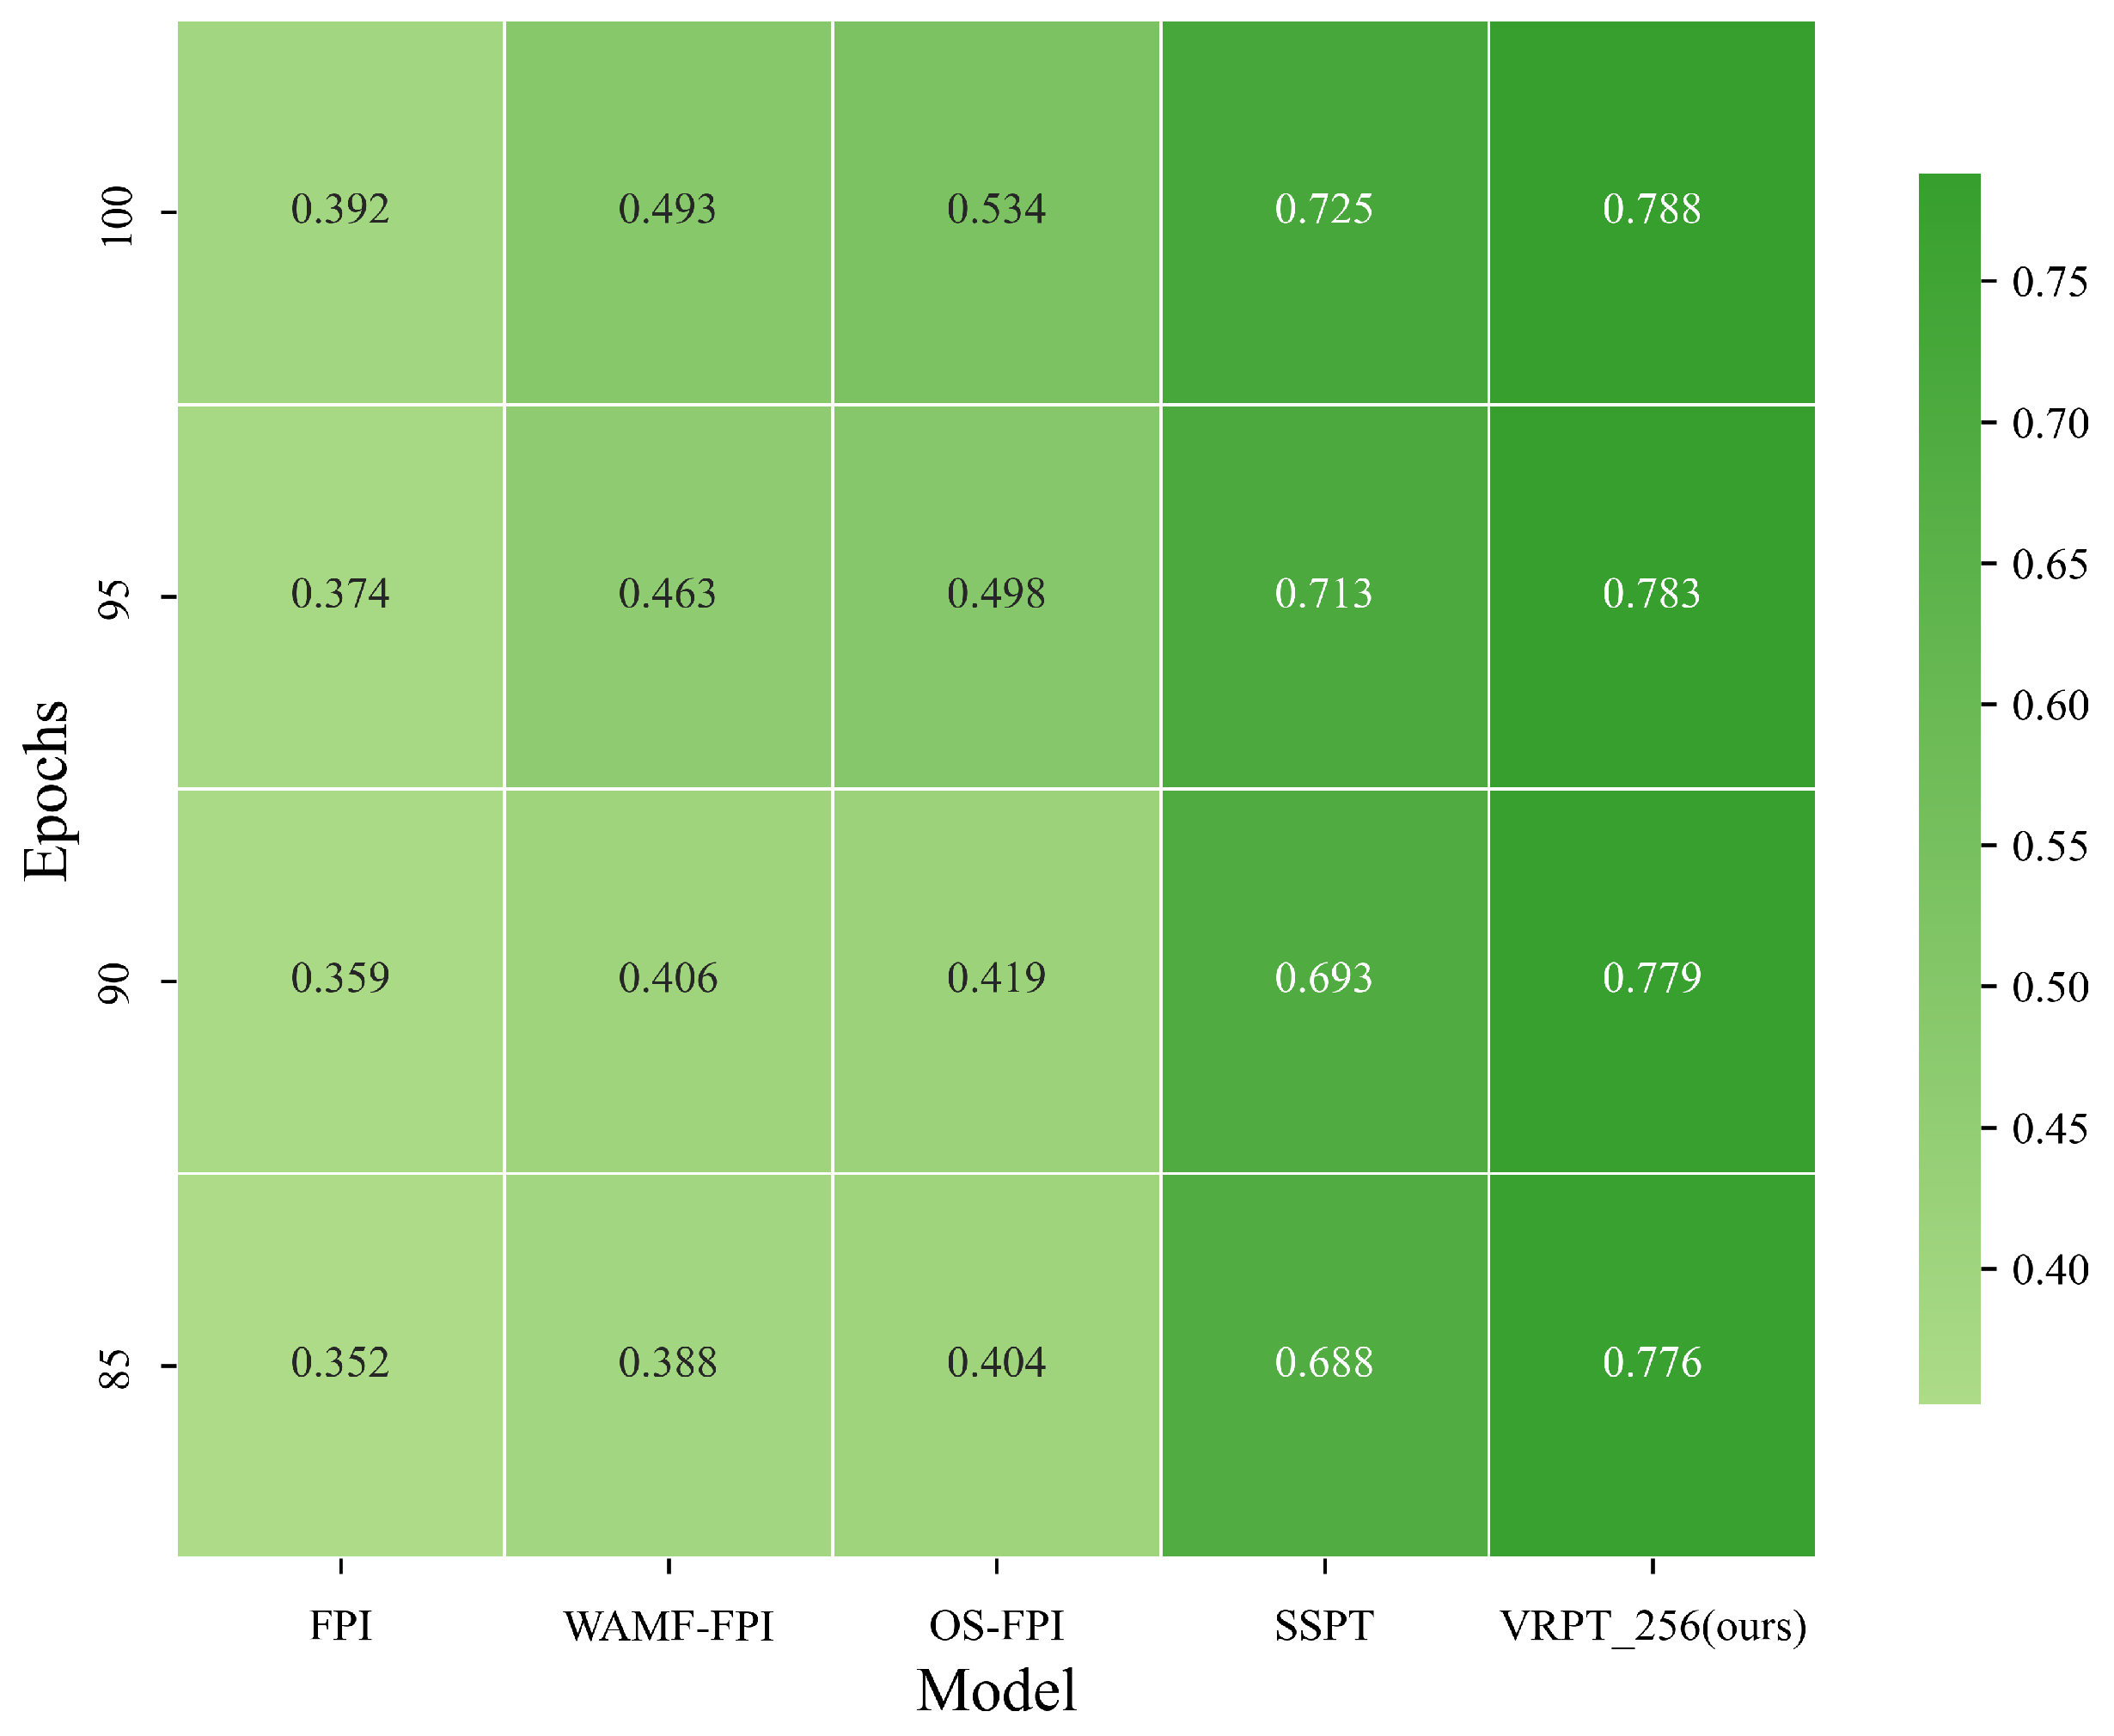
Table 3 and
Figure 10 present the comparative results of VRPT_256 against several mainstream methods on the Multi-UAV dataset. It can be observed that traditional models such as FPI and WAMF-FPI experienced notable performance degradation, achieving only 0.392 and 0.493 RDS scores, respectively, in such complex scenarios. In contrast, the proposed VRPT_256 achieved a superior RDS score of 0.788, surpassing the current best baseline SSPT by 6.3% and significantly outperforming OS-FPI by 25.4%. This further validates its adaptability in highly complex environments.
Comparing the VRPT_256 performance on Multi-UAV (RDS = 0.788) with its results on UL14 (RDS = 0.847), we only observe about a 6.9% decrease in precision despite the substantial increase in environmental complexity. This result indicates that the VRPT framework maintains stable matching capabilities across varying altitudes and terrains, exhibiting excellent robustness and transferability.
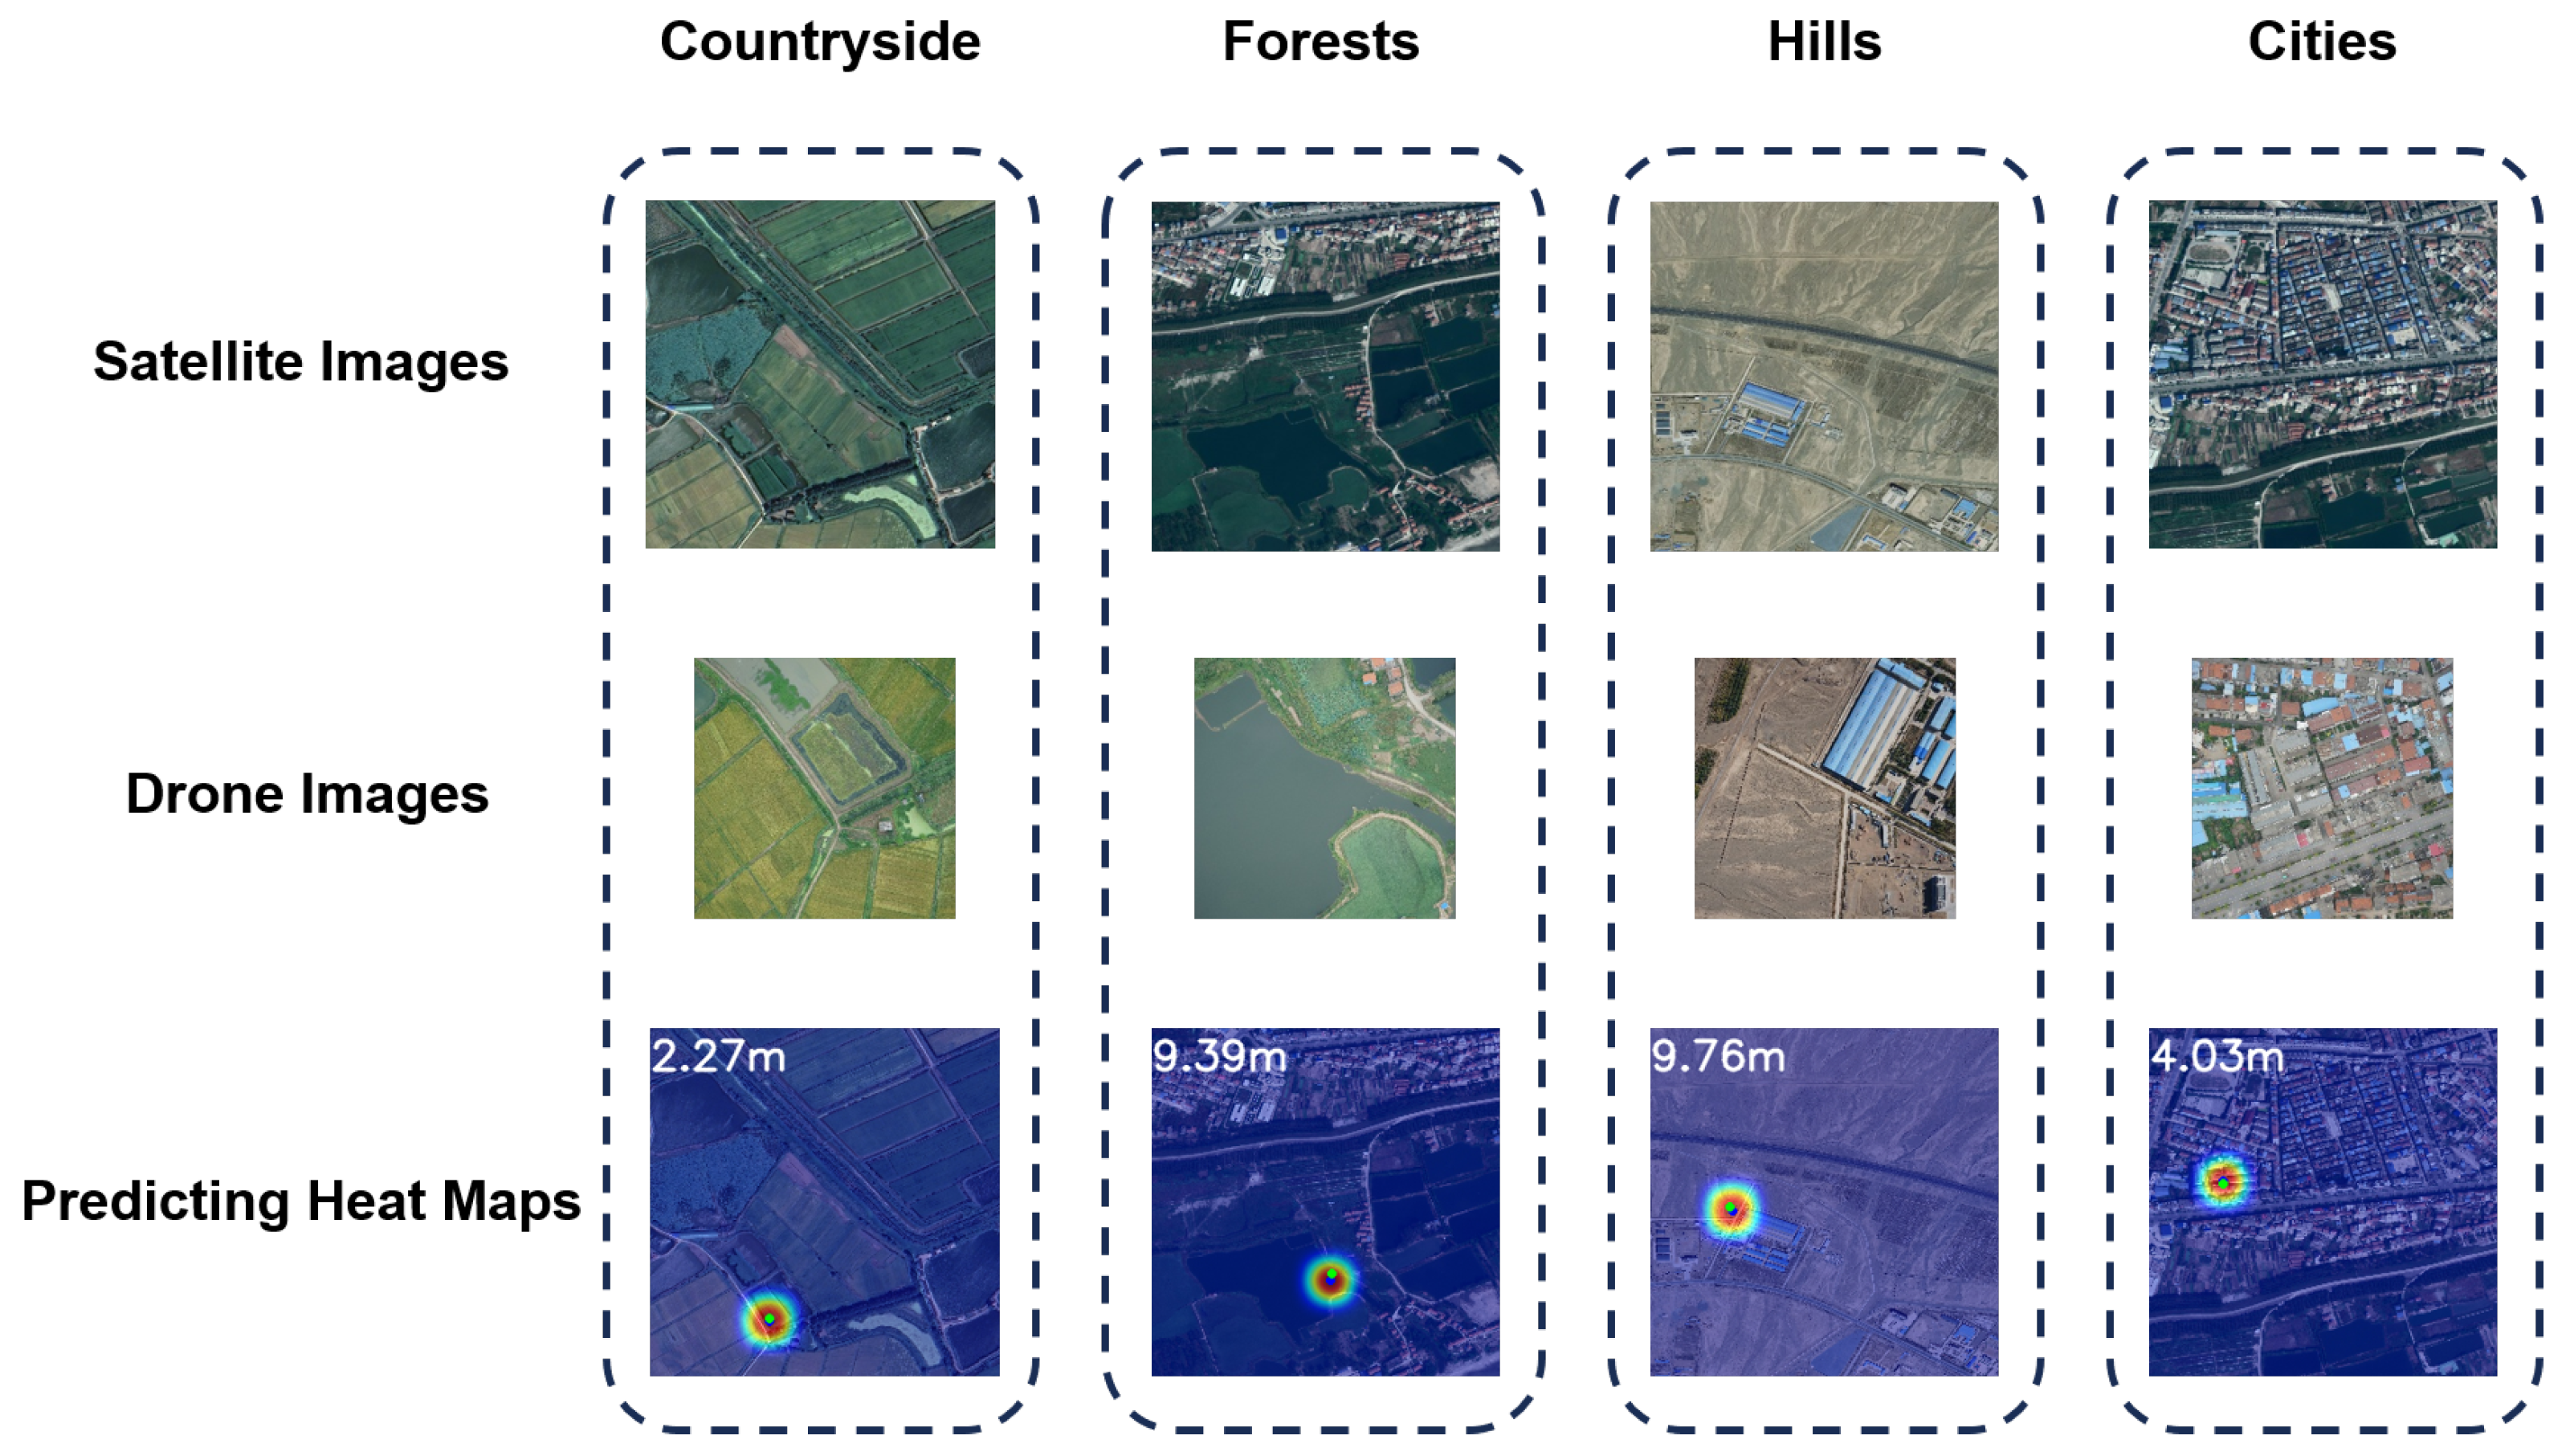
To further interpret the model’s performance across different terrain types, we visualized its heatmap matching results, as shown in
Figure 11. The results demonstrate concentrated attention heatmaps with accurate localization and stable matching results in urban and rural areas. However, in forest and hilly areas, the heatmaps showed some dispersion and offsets, suggesting that the model still faces challenges in texture-sparse and structurally repetitive environments. This phenomenon underscores the model’s superior performance in structurally distinctive regions while indicating potential areas for improvement, such as incorporating terrain priors or structural enhancement modules.
6. Ablation Study and Analysis
6.1. Comparison of Different Feature Fusion Heads
To further investigate the impact of feature fusion strategies on cross-view localization performance, we conducted comparative evaluations of various fusion architectures on the Multi-UAV dataset. These include no fusion structure (No_Head), standard feature pyramid network (FPN), attention-enhanced fusion pyramid network (AFPN), and our proposed residual feature pyramid network (RFPN).
As shown in
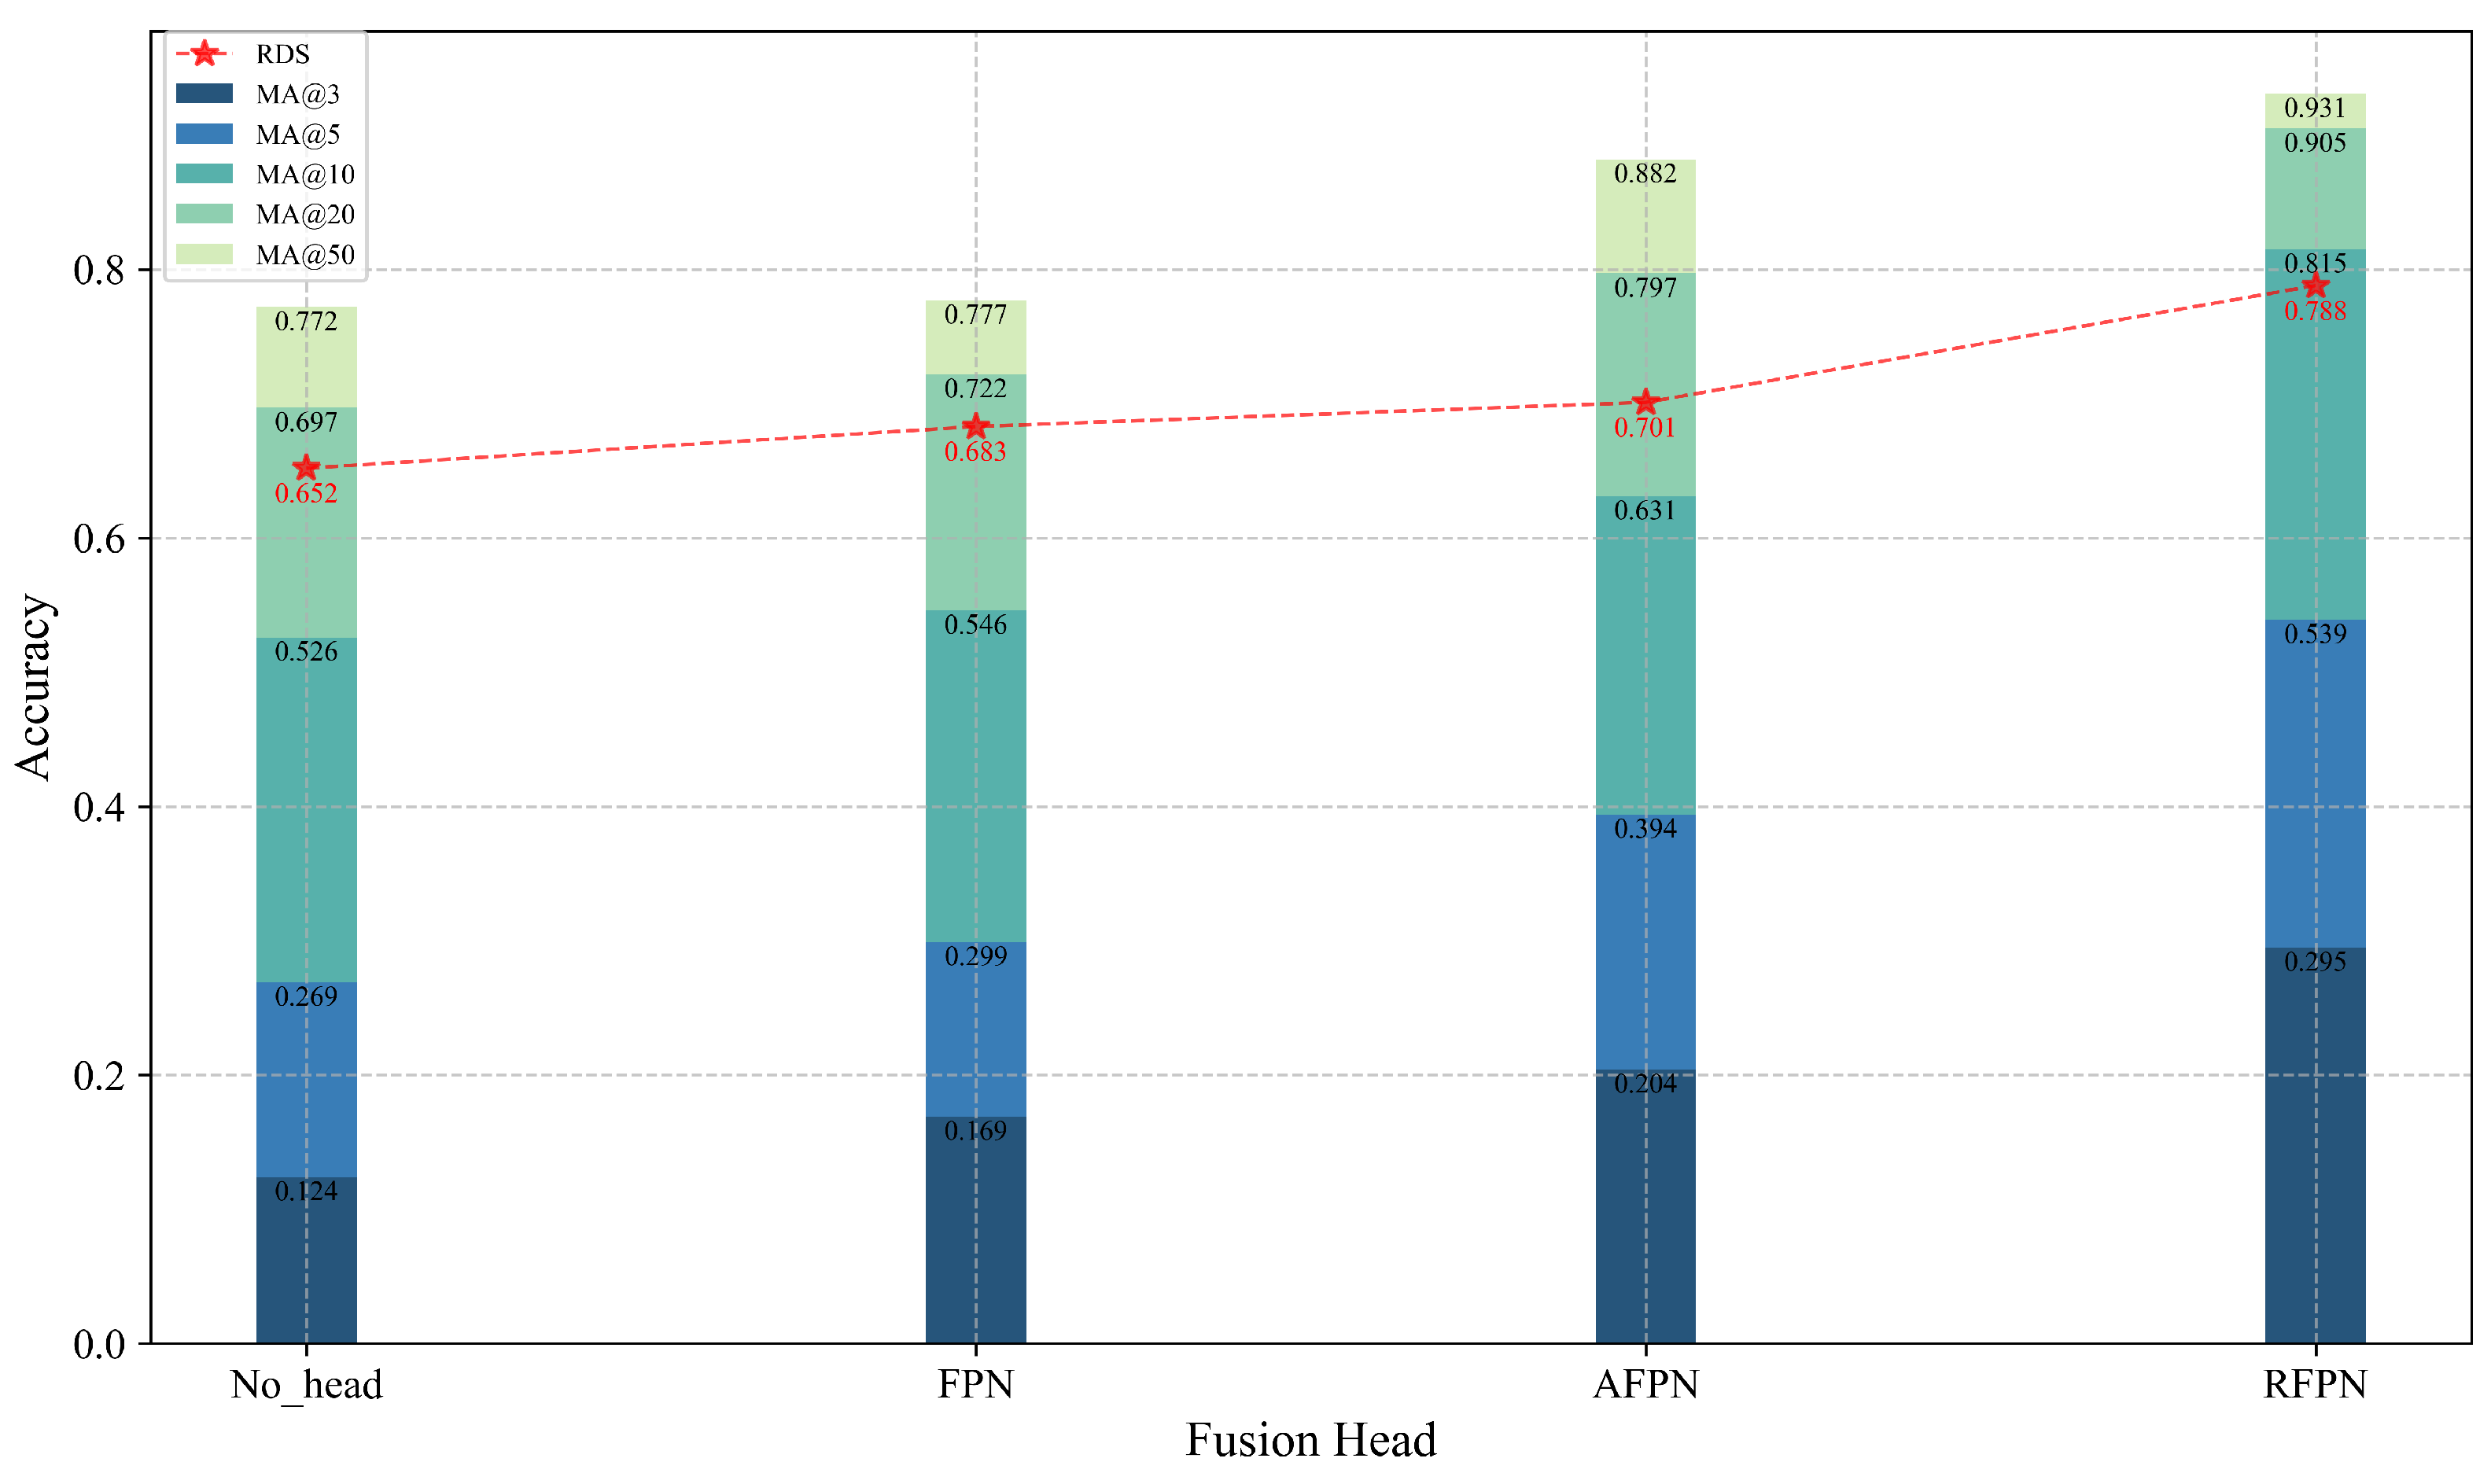
Table 4, RFPN significantly enhances performance while maintaining low computational complexity, achieving an RDS of 0.788, which represents a 15.4% improvement over the traditional FPN structure and surpasses the AFPN (RDS = 0.701) despite AFPN’s higher parameter count. Additionally, RFPN demonstrates a lower computational cost (FLOPs = 2.84 G) compared to AFPN (FLOPs = 3.28 G), highlighting its superior balance between accuracy and efficiency. Compared with no fusion (No_Head), RFPN demonstrates a substantial 20.8% performance gain, underscoring the critical importance of incorporating fusion layers for cross-view feature modeling.
To comprehensively assess the localization performance of various fusion structures across multiple scale error thresholds, we further compared their performance under the MA@
K metric, as shown in
Figure 12. The results indicate that RFPN achieves significant improvements over FPN by 12.6%, 24.0%, and 26.9% in the critical accuracy intervals of 3 m, 5 m, and 10 m, respectively, showing notable advantages in medium-to-close range localization tasks. Particularly within the 3–5 m accuracy range, RFPN effectively captures subtle structural differences and reduces misclassification due to high-level semantic loss.
These results clearly demonstrate the significance of designing fusion structures with residual connections and feature weighting mechanisms to enhance robustness and accuracy in cross-view image matching tasks. Structurally, RFPN integrates shallow detail textures with deeper semantic information through progressive residual channels and leverages multi-scale information weighting strategies to enhance spatial awareness provided by higher-level semantics, enabling more stable and precise cross-view feature alignment.
6.2. Comparison of Different Map Sizes
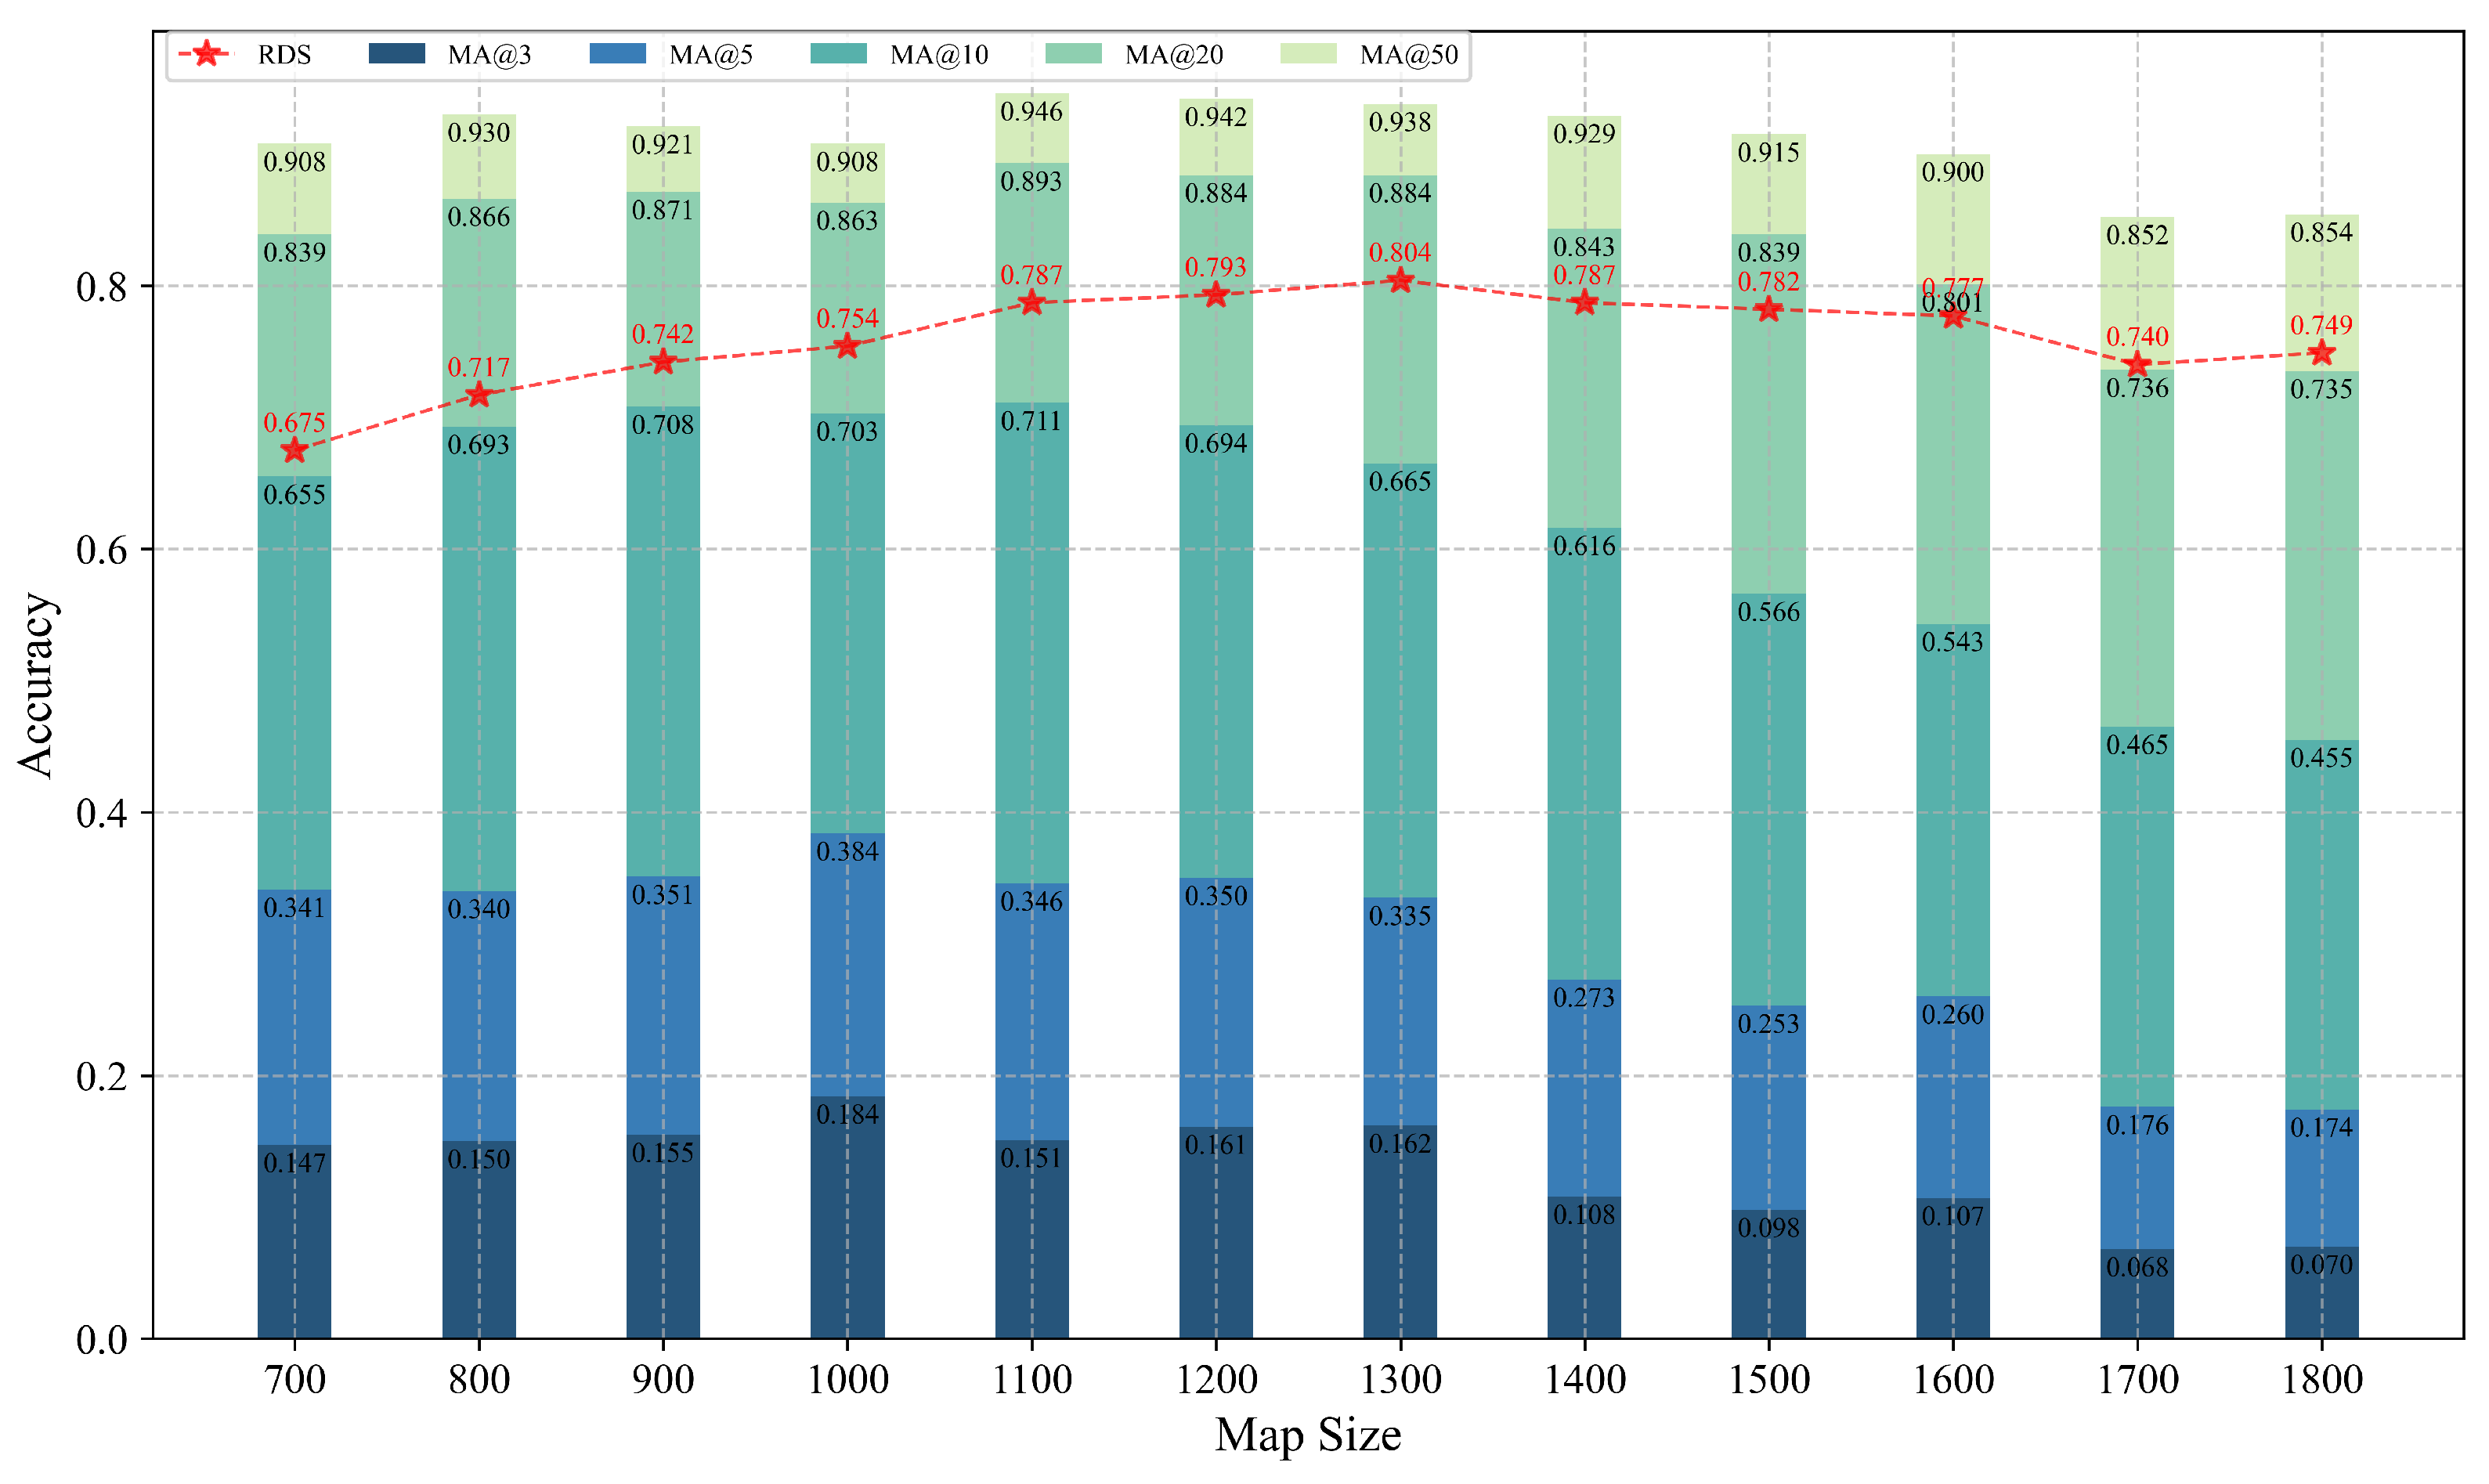
We evaluated the stability and robustness of the model’s localization performance across different spatial scales. We designed satellite retrieval images with varying sizes (map size ∈ [700, 1800]). These images maintained a resolution of 0.294 m/pixel. They were part of the Multi-UAV test set. This setup simulated multi-scale retrieval scenarios in practical applications. All model input dimensions remained constant to ensure consistency and comparability throughout the experiments.
As illustrated in
Figure 13, the model’s performance in terms of MA@3, MA@5, and MA@10 exhibited a clear decline as the map size increased. This trend is due to changes in spatial resolution. With fixed input dimensions, larger image sizes increase the spatial area per pixel. This reduces the effective resolution of the detailed image information. Consequently, this affects the model’s accuracy in high-precision localization tasks.
For example, when the map size is 700 pixels, the spatial range covered is about 205.9 m. Assuming an output feature map dimension of 384, each pixel represents roughly 0.536 m. However, when the map size increases to 1800 pixels, this value rises to approximately 1.66 m, nearly three times larger. Fine-grained spatial differences, like road intersections or terrain boundaries, are compressed in larger images. This limits the model’s discriminative capability at close-range scales.
Notably, despite decreased accuracy metrics, larger-scale maps remain valuable in practical applications. They cover broader search spaces in a single inference. This reduces reliance on prior location information. On the other hand, they facilitate initial coarse localization in complex or unknown regions, providing reliable support for subsequent precise localization. Therefore, achieving an optimal trade-off between performance and resource utilization across various scales remains a critical challenge for real-world UAV deployments.
Further examining the RDS metric curve, we observe that, unlike the MA@K indicators, RDS remains relatively stable across different map scales, showing minor fluctuations and achieving optimal performance (peak value of 0.804) at medium image sizes (approximately 1200–1300 pixels). This indicates that, at this scale, the model optimally balances local structural details and global spatial contextual information. At smaller image sizes, such as 700 pixels, detail resolution is higher. However, limited coverage provides insufficient contextual information. This negatively impacts matching stability and robustness.
6.3. Comparison of Random Scale Crop (RSC) and Fixed-Scale Crop (FSC)
To evaluate the effectiveness of the random scale crop (RSC) data augmentation strategy, we conducted an ablation study comparing RSC with fixed-scale crop (FSC) on the Multi-UAV dataset. As shown in
Table 5, this experiment quantifies RSC’s contribution to localization performance, focusing on meter-level accuracy (MA@K) and relative distance score (RDS) metrics.
We trained the VRPT_256 model on the Multi-UAV training set under two configurations:
RSC: Following
Section 3.3, satellite images are randomly cropped to scales ranging from 700 to 1800 pixels, with a centroid coverage range (C = 0.75). This introduces variability in scale and target position.
FSC: Satellite images are cropped to a fixed scale of 1200 pixels, with the target centered (C = 0). This scale was chosen as it yields peak RDS performance in
Figure 13.
RSC outperforms FSC across all metrics. The RDS improves by 4.2%, with gains of 13.56% at 3 m, 9.36% at 5 m, and 3.28% at 10 m. By randomly cropping satellite images, RSC covers the test set’s scale range and edge positions, enabling the model to learn scale-invariant features and significantly enhancing the high-precision localization. FSC, fixed at 1200 pixels, fails to adapt to multi-scale scenarios and edge positions, resulting in lower accuracy. This fully validates RSC’s ability to improve localization accuracy through scale and position diversity.
6.4. Comparison of Different Attention Allocation Strategies
To investigate the roles of different attention mechanisms in cross-view image matching tasks, we designed and evaluated six attention allocation strategies on the Multi-UAV dataset. These strategies include combinations of self-attention (SA), cross-attention (CA), and channel reduction attention (CRA) mechanisms applied across three stages of feature extraction.
Table 6 summarizes the comparative results of these strategies across multiple performance dimensions.
As shown in
Figure 14, a clear hierarchical performance trend emerged among the various strategies. The basic CRA–CRA–CRA combination achieved an RDS of 0.352. It has the lowest computational cost at 1.88 G FLOPs. However, it limits the matching accuracy. This is due to insufficient spatial and modal interaction modeling. The SA-SA-SA strategy increased RDS to 0.383. It shows utility in intra-modal structural modeling. However, it has limited overall gain. This is due to a lack of cross-modal alignment. The CA–CA–CA strategy enhanced the model. It improved semantic matching between UAV and satellite images. This achieved an RDS of 0.732. It validates the key role of modal interactions in cross-view matching tasks.
Building upon this, we introduced staged fusion strategies: SA–CA–CA and SA–SA–CA. These approaches used SA at shallow layers to capture local intra-modal structures. They used CA at deeper layers for modal alignment. This increased the RDS to 0.749 and 0.761, respectively. They also achieved superior performance in high-accuracy metrics (MA@3, MA@5). These outcomes highlight the importance of staged modeling. Our dynamic hybrid strategy (SA/CRA)-(SA/CRA)-(CA/CRA) integrates three attention mechanisms. It does so flexibly based on semantic hierarchies. This achieves an RDS of 0.788 with a computational complexity of 2.84 G FLOPs. It delivers optimal results across all metrics. This approach balances modeling capability and resource consumption. It shows strong structural adaptability. It also has deployment-friendly characteristics. Additionally, it demonstrates the potential of dynamic attention allocation in cross-view image matching.
7. Conclusions
In this study, we first constructed Multi-UAV, a cross-view UAV visual localization dataset designed specifically for multi-terrain and multi-altitude scenarios. The dataset includes 17.4 k pairs of high-resolution UAV and satellite images. These images are collected from diverse regions across China. They cover urban, rural, mountainous, farmland, and coastal terrains. This comprehensive dataset addresses the limitations of existing datasets, which are typically restricted in scene diversity and flight altitudes. Multi-UAV is the first unified benchmark for UAV self-localization. It supports high-altitude views, multi-scale searches, and multi-terrain matching tasks. This benchmark significantly advances research in realistic high-precision scenarios.
Secondly, we introduced the value reduction pyramid transformer (VRPT) backbone network. It is a lightweight localization backbone. It integrates self-attention (SA), cross-attention (CA), and channel reduction attention (CRA) mechanisms. To enhance the model’s understanding of multi-scale spatial features, we designed the residual feature pyramid network (RFPN) module for efficient multi-layer feature fusion. Regarding evaluation metrics, we adopted two measures closely aligned with practical localization accuracy requirements: meter-level accuracy (MA@K) and relative distance score (RDS). Notably, RDS is robust to scale variations, offering a comprehensive reflection of model performance in complex environments.
In our experiments, we compared the performance on the UL14 and Multi-UAV datasets. We also conducted several ablation studies. These studies assessed the effectiveness of the attention mechanism configurations, fusion structures, and scale adaptability. Results demonstrated that the proposed VRPT-256 model achieves an excellent balance among accuracy, computational efficiency, and parameter scale, significantly outperforming current mainstream methods. The model showed superior robustness and generalization capability. It performed well in high-precision, small-scale, and multi-terrain scenarios. This highlights its substantial potential for practical deployment.
In the future, we plan to further expand the geographic regions and terrain types covered by the Multi-UAV dataset. Additionally, we aim to explore lightweight Transformer-based cross-modal matching methods to enhance the deployment efficiency and cross-scenario adaptability.
Author Contributions
Conceptualization, C.J. and E.Z.; methodology, C.J.; software, C.J.; validation, C.J. and W.X.; resources, E.Z.; data curation, C.J.; writing—original draft preparation, C.J.; writing—review and editing, C.J. and N.C.; visualization, N.C.; supervision, E.Z.; project administration, E.Z. All authors have read and agreed to the published version of the manuscript.
Funding
This research received no external funding.
Institutional Review Board Statement
Not applicable.
Informed Consent Statement
Not applicable.
Data Availability Statement
The data presented in this study are available upon request from the corresponding author on reasonable request.
Acknowledgments
We are grateful to the anonymous reviewers for their insightful comments and suggestions, all of which were valuable in improving our manuscript.
Conflicts of Interest
The authors declare no conflicts of interest.
References
- McCoy, J.; Rawal, A.; Rawat, D.B.; Sadler, B.M. Ensemble deep learning for sustainable multimodal uav classification. IEEE Trans. Intell. Transp. Syst. 2022, 24, 15425–15434. [Google Scholar] [CrossRef]
- Savkin, A.V.; Huang, H. Multi-uav navigation for optimized video surveillance of ground vehicles on uneven terrains. IEEE Trans. Intell. Transp. Syst. 2023, 24, 10238–10242. [Google Scholar] [CrossRef]
- Lowe, D.G. Distinctive image features from scale-invariant keypoints. Int. J. Comput. Vis. 2004, 60, 91–110. [Google Scholar] [CrossRef]
- Bay, H.; Ess, A.; Tuytelaars, T.; Van Gool, L. Speeded-up robust features (surf). Comput. Vis. Image Underst. 2008, 110, 346–359. [Google Scholar] [CrossRef]
- Mur-Artal, R.; Montiel, J.M.M.; Tardos, J.D. Orb-slam: A versatile and accurate monocular slam system. IEEE Trans. Robot. 2015, 31, 1147–1163. [Google Scholar] [CrossRef]
- Brown, M.; Lowe, D.G. Automatic panoramic image stitching using invariant features. Int. J. Comput. Vis. 2007, 74, 59–73. [Google Scholar] [CrossRef]
- Dai, M.; Zheng, E.; Feng, Z.; Qi, L.; Zhuang, J.; Yang, W. Vision-based uav self-positioning in low-altitude urban environments. IEEE Trans. Image Process. 2023, 33, 493–508. [Google Scholar] [CrossRef]
- Ali-Bey, A.; Chaib-Draa, B.; Giguere, P. Mixvpr: Feature mixing for visual place recognition. In Proceedings of the IEEE/CVF Winter Conference on Applications of Computer Vision, Waikoloa, HI, USA, 2–7 January 2023; IEEE: New York, NY, USA, 2023; pp. 2998–3007. [Google Scholar]
- Keetha, N.; Mishra, A.; Karhade, J.; Jatavallabhula, K.M.; Scherer, S.; Krishna, M.; Garg, S. Anyloc: Towards universal visual place recognition. IEEE Robot. Autom. Lett. 2023, 9, 1286–1293. [Google Scholar] [CrossRef]
- Dai, M.; Chen, J.; Lu, Y.; Hao, W.; Zheng, E. Finding Point with Image: An End-to-End Benchmark for Vision-Based UAV Localization. arXiv 2022, arXiv:2208.06561. [Google Scholar]
- Wang, G.; Chen, J.; Dai, M.; Zheng, E. Wamf-fpi: A weight-adaptive multi-feature fusion network for uav localization. Remote Sens. 2023, 15, 910. [Google Scholar] [CrossRef]
- Chen, J.; Zheng, E.; Dai, M.; Chen, Y.; Lu, Y. OS-FPI: A Coarse-to-Fine One-Stream Network for UAV Geo-Localization. IEEE J. Sel. Top. Appl. Earth Obs. Remote Sens. 2024, 17, 7852–7866. [Google Scholar] [CrossRef]
- Xu, W.; Yao, Y.; Cao, J.; Wei, Z.; Liu, C.; Wang, J.; Peng, M. UAV-VisLoc: A Large-scale Dataset for UAV Visual Localization. arXiv 2024, arXiv:2405.11936. [Google Scholar]
- Vaswani, A.; Shazeer, N.; Parmar, N.; Uszkoreit, J.; Jones, L.; Gomez, A.N.; Kaiser, Ł.; Polosukhin, I. Attention is all you need. Adv. Neural Inf. Process. Syst. 2017, 30, 5998–6008. [Google Scholar]
- Chen, C.-F.R.; Fan, Q.; Panda, R. Crossvit: Cross-attention multi-scale vision transformer for image classification. In Proceedings of the IEEE/CVF International Conference on Computer Vision, Montreal, QC, Canada, 10–17 October 2021; IEEE: New York, NY, USA, 2021; pp. 357–366. [Google Scholar]
- Kang, B.; Moon, S.; Cho, Y.; Yu, H.; Kang, S.-J. Metaseg: Metaformer-based global contexts-aware network for efficient semantic segmentation. In Proceedings of the IEEE/CVF Winter Conference on Applications of Computer Vision, Waikoloa, HI, USA, 3–8 January 2024; IEEE: New York, NY, USA, 2024; pp. 434–443. [Google Scholar]
- Weyand, T.; Kostrikov, I.; Philbin, J. Planet-photo geolocation with convolutional neural networks. In Proceedings of the Computer Vision–ECCV 2016: 14th European Conference, Amsterdam, The Netherlands, 11–14 October 2016; Proceedings, Part VIII 14. Springer: Berlin/Heidelberg, Germany, 2016; pp. 37–55. [Google Scholar]
- Hu, S.; Feng, M.; Nguyen, R.M.H.; Lee, G.H. Cvm-net: Cross-view matching network for image-based ground-to-aerial geo-localization. In Proceedings of the IEEE Conference on Computer Vision and Pattern Recognition, Salt Lake City, UT, USA, 18–23 June 2018; IEEE: New York, NY, USA, 2018; pp. 7258–7267. [Google Scholar]
- Koch, G.; Zemel, R.; Salakhutdinov, R. Siamese neural networks for one-shot image recognition. In Proceedings of the ICML 2015 Deep Learning Workshop, Lille, France, 6–11 July 2015; International Machine Learning Society (IMLS). pp. 1–30. [Google Scholar]
- Bertinetto, L.; Valmadre, J.; Henriques, J.F.; Vedaldi, A.; Torr, P.H.S. Fully-convolutional siamese networks for object tracking. In Proceedings of the Computer Vision—ECCV 2016 Workshops, Amsterdam, The Netherlands, 8–10 and 15–16 October 2016; Proceedings, Part II 14. Springer: Berlin/Heidelberg, Germany, 2016; pp. 850–865. [Google Scholar]
- Arandjelovic, R.; Gronat, P.; Torii, A.; Pajdla, T.; Sivic, J. NetVLAD: CNN architecture for weakly supervised place recognition. In Proceedings of the IEEE Conference on Computer Vision and Pattern Recognition, Las Vegas, NV, USA, 27–30 June 2016; IEEE: New York, NY, USA, 2016; pp. 5297–5307. [Google Scholar]
- Xu, H.; Yang, M.; Deng, L.; Qian, Y.; Wang, C. Neutral cross-entropy loss based unsupervised domain adaptation for semantic segmentation. IEEE Trans. Image Process. 2021, 30, 4516–4525. [Google Scholar] [CrossRef] [PubMed]
- Liu, H.; Feng, J.; Qi, M.; Jiang, J.; Yan, S. End-to-end comparative attention networks for person re-identification. IEEE Trans. Image Process. 2017, 26, 3492–3506. [Google Scholar] [CrossRef]
- Deuser, F.; Habel, K.; Oswald, N. Sample4geo: Hard negative sampling for cross-view geo-localisation. In Proceedings of the IEEE/CVF International Conference on Computer Vision, Paris, France, 1–6 October 2023; IEEE: New York, NY, USA, 2023; pp. 16847–16856. [Google Scholar]
- Li, G.; Qian, M.; Xia, G.-S. Unleashing unlabeled data: A paradigm for cross-view geo-localization. In Proceedings of the IEEE/CVF Conference on Computer Vision and Pattern Recognition, Seattle, WA, USA, 16–22 June 2024; IEEE: New York, NY, USA, 2024; pp. 16719–16729. [Google Scholar]
- Ye, J.; Lv, Z.; Li, W.; Yu, J.; Yang, H.; Zhong, H.; He, C. Cross-view image geo-localization with Panorama-BEV Co-Retrieval Network. In European Conference on Computer Vision, Milan, Italy, 29 September–4 October 2024; Springer: Berlin/Heidelberg, Germany, 2024; pp. 74–90. [Google Scholar]
- Zhai, M.; Bessinger, Z.; Workman, S.; Jacobs, N. Predicting ground-level scene layout from aerial imagery. In Proceedings of the IEEE Conference on Computer Vision and Pattern Recognition, Honolulu, HI, USA, 21–26 July 2017; IEEE: New York, NY, USA, 2017; pp. 867–875. [Google Scholar]
- Liu, L.; Li, H. Lending orientation to neural networks for cross-view geo-localization. In Proceedings of the IEEE/CVF Conference on Computer Vision and Pattern Recognition, Long Beach, CA, USA, 15–20 June 2019; IEEE: New York, NY, USA, 2019; pp. 5624–5633. [Google Scholar]
- Castaldo, F.; Zamir, A.; Angst, R.; Palmieri, F.; Savarese, S. Semantic cross-view matching. In Proceedings of the IEEE International Conference on Computer Vision Workshops, Santiago, Chile, 7–13 December 2015; IEEE: New York, NY, USA, 2015; pp. 9–17. [Google Scholar]
- Lin, T.-Y.; Belongie, S.; Hays, J. Cross-view image geolocalization. In Proceedings of the IEEE Conference on Computer Vision and Pattern Recognition, Portland, OR, USA, 23–28 June 2013; IEEE: New York, NY, USA, 2013; pp. 891–898. [Google Scholar]
- Senlet, T.; Elgammal, A. A framework for global vehicle localization using stereo images and satellite and road maps. In Proceedings of the 2011 IEEE International Conference on Computer Vision Workshops (ICCV Workshops), Barcelona, Spain, 6–13 November 2011; IEEE: New York, NY, USA, 2011; pp. 2034–2041. [Google Scholar]
- Workman, S.; Jacobs, N. On the location dependence of convolutional neural network features. In Proceedings of the IEEE Conference on Computer Vision and Pattern Recognition Workshops, Boston, MA, USA, 7–12 June 2015; IEEE: New York, NY, USA, 2015; pp. 70–78. [Google Scholar]
- Shi, Y.; Yu, X.; Campbell, D.; Li, H. Where am i looking at? joint location and orientation estimation by cross-view matching. In Proceedings of the IEEE/CVF Conference on Computer Vision and Pattern Recognition, Seattle, WA, USA, 13–19 June 2020; IEEE: New York, NY, USA, 2020; pp. 4064–4072. [Google Scholar]
- Zeng, Z.; Wang, Z.; Yang, F.; Satoh, S. Geo-localization via ground-to-satellite cross-view image retrieval. IEEE Trans. Multimed. 2022, 25, 2176–2188. [Google Scholar] [CrossRef]
- Wang, T.; Zheng, Z.; Yan, C.; Zhang, J.; Sun, Y.; Zheng, B.; Yang, Y. Each part matters: Local patterns facilitate cross-view geo-localization. IEEE Trans. Circuits Syst. Video Technol. 2021, 32, 867–879. [Google Scholar] [CrossRef]
- Dai, M.; Hu, J.; Zhuang, J.; Zheng, E. A transformer-based feature segmentation and region alignment method for UAV-view geo-localization. IEEE Trans. Circuits Syst. Video Technol. 2021, 32, 4376–4389. [Google Scholar] [CrossRef]
- Shen, T.; Wei, Y.; Kang, L.; Wan, S.; Yang, Y.-H. MCCG: A ConvNeXt-based multiple-classifier method for cross-view geo-localization. IEEE Trans. Circuits Syst. Video Technol. 2023, 34, 1456–1468. [Google Scholar] [CrossRef]
- Koroteev, M.V. BERT: A review of applications in natural language processing and understanding. arXiv 2021, arXiv:2103.11943. [Google Scholar]
- Lan, Z.; Chen, M.; Goodman, S.; Gimpel, K.; Sharma, P.; Soricut, R. Albert: A lite bert for self-supervised learning of language representations. arXiv 2019, arXiv:1909.11942. [Google Scholar]
- Dosovitskiy, A.; Beyer, L.; Kolesnikov, A.; Weissenborn, D.; Zhai, X.; Unterthiner, T.; Dehghani, M.; Minderer, M.; Heigold, G.; Gelly, S. An image is worth 16x16 words: Transformers for image recognition at scale. arXiv 2020, arXiv:2010.11929. [Google Scholar]
- Carion, N.; Massa, F.; Synnaeve, G.; Usunier, N.; Kirillov, A.; Zagoruyko, S. End-to-end object detection with transformers. In Proceedings of the European Conference on Computer Vision, Glasgow, UK, 23–28 August 2020; Springer: Berlin/Heidelberg, Germany, 2020; pp. 213–229. [Google Scholar]
- Zhu, X.; Su, W.; Lu, L.; Li, B.; Wang, X.; Dai, J. Deformable detr: Deformable transformers for end-to-end object detection. arXiv 2020, arXiv:2010.04159. [Google Scholar]
- Strudel, R.; Garcia, R.; Laptev, I.; Schmid, C. Segmenter: Transformer for semantic segmentation. In Proceedings of the IEEE/CVF International Conference on Computer Vision, Montreal, QC, Canada, 10–17 October 2021; IEEE: New York, NY, USA, 2021; pp. 7262–7272. [Google Scholar]
- Zhou, T.; Wang, W.; Konukoglu, E.; Van Gool, L. Rethinking semantic segmentation: A prototype view. In Proceedings of the IEEE/CVF Conference on Computer Vision and Pattern Recognition, New Orleans, LA, USA, 18–24 June 2022; IEEE: New York, NY, USA, 2022; pp. 2582–2593. [Google Scholar]
- Wang, W.; Xie, E.; Li, X.; Fan, D.-P.; Song, K.; Liang, D.; Lu, T.; Luo, P.; Shao, L. Pyramid vision transformer: A versatile backbone for dense prediction without convolutions. In Proceedings of the IEEE/CVF International Conference on Computer Vision, Montreal, QC, Canada, 10–17 October 2021; IEEE: New York, NY, USA, 2021; pp. 568–578. [Google Scholar]
- Liu, Z.; Lin, Y.; Cao, Y.; Hu, H.; Wei, Y.; Zhang, Z.; Lin, S.; Guo, B. Swin transformer: Hierarchical vision transformer using shifted windows. In Proceedings of the IEEE/CVF International Conference on Computer Vision, Montreal, QC, Canada, 10–17 October 2021; IEEE: New York, NY, USA, 2021; pp. 10012–10022. [Google Scholar]
- Touvron, H.; Cord, M.; Douze, M.; Massa, F.; Sablayrolles, A.; Jégou, H. Training data-efficient image transformers & distillation through attention. In Proceedings of the International Conference on Machine Learning, Online, 18–24 July 2021; PMLR: New York, NY, USA, 2021; pp. 10347–10357. [Google Scholar]
- Zhu, S.; Yang, T.; Chen, C. Vigor: Cross-view image geo-localization beyond one-to-one retrieval. In Proceedings of the IEEE/CVF Conference on Computer Vision and Pattern Recognition, Nashville, TN, USA, 19–25 June 2021; IEEE: New York, NY, USA, 2021; pp. 3640–3649. [Google Scholar]
- Zheng, Z.; Wei, Y.; Yang, Y. University-1652: A multi-view multi-source benchmark for drone-based geo-localization. In Proceedings of the 28th ACM International Conference on Multimedia, Seattle, WA, USA, 12–16 October 2020; Association for Computing Machinery: New York, NY, USA, 2020; pp. 1395–1403. [Google Scholar]
- Zhu, R.; Yin, L.; Yang, M.; Wu, F.; Yang, Y.; Hu, W. SUES-200: A multi-height multi-scene cross-view image benchmark across drone and satellite. IEEE Trans. Circuits Syst. Video Technol. 2023, 33, 4825–4839. [Google Scholar] [CrossRef]
- Zhang, W.; Zhong, Z.; Chen, H.; Jing, N. GeoViewMatch: A multi-scale feature-matching network for cross-view geo-localization using Swin-Transformer and contrastive learning. Remote Sens. 2024, 16, 678. [Google Scholar] [CrossRef]
- Li, W.; Zhang, Z.; Jin, B.; Yu, W. A real-time fish target detection algorithm based on improved YOLOv5. J. Mar. Sci. Eng. 2023, 11, 572. [Google Scholar] [CrossRef]
- Chen, N.; Fan, J.; Yuan, J.; Zheng, E. OBTPN: A vision-based network for UAV geo-localization in multi-altitude environments. Drones 2025, 9, 33. [Google Scholar] [CrossRef]
- Zhao, R.; Ouyang, W.; Wang, X. Person re-identification by salience matching. In Proceedings of the IEEE International Conference on Computer Vision, Sydney, Australia, 1–8 December 2013; IEEE: New York, NY, USA, 2013; pp. 2528–2535. [Google Scholar]
- Zheng, L.; Shen, L.; Tian, L.; Wang, S.; Wang, J.; Tian, Q. Scalable person re-identification: A benchmark. In Proceedings of the IEEE International Conference on Computer Vision, Santiago, Chile, 7–13 December 2015; IEEE: New York, NY, USA, 2015; pp. 1116–1124. [Google Scholar]
- Fan, J.; Zheng, E.; He, Y.; Yang, J. A cross-view geo-localization algorithm using UAV image and satellite image. Sensors 2024, 24, 3719. [Google Scholar] [CrossRef]
- Lin, T.-Y.; Dollár, P.; Girshick, R.; He, K.; Hariharan, B.; Belongie, S. Feature pyramid networks for object detection. In Proceedings of the IEEE Conference on Computer Vision and Pattern Recognition, Honolulu, HI, USA, 21–26 July 2017; IEEE: New York, NY, USA, 2017; pp. 2117–2125. [Google Scholar]
- Zhu, L.; Deng, Z.; Hu, X.; Fu, C.-W.; Xu, X.; Qin, J.; Heng, P.-A. Bidirectional feature pyramid network with recurrent attention residual modules for shadow detection. In Proceedings of the European Conference on Computer Vision (ECCV), Munich, Germany, 8–4 September 2018; IEEE: New York, NY, USA, 2018; pp. 121–136. [Google Scholar]
- Liu, S.; Qi, L.; Qin, H.; Shi, J.; Jia, J. Path aggregation network for instance segmentation. In Proceedings of the IEEE Conference on Computer Vision and Pattern Recognition, Salt Lake City, UT, USA, 18–22 June 2018; IEEE: New York, NY, USA, 2018; pp. 8759–8768. [Google Scholar]
- Yang, G.; Lei, J.; Zhu, Z.; Cheng, S.; Feng, Z.; Liang, R. AFPN: Asymptotic feature pyramid network for object detection. In Proceedings of the 2023 IEEE International Conference on Systems, Man, and Cybernetics (SMC), Oahu, HI, USA, 1–4 Octobe 2023; IEEE: New York, NY, USA, 2023; pp. 2184–2189. [Google Scholar]
Figure 1.
Overall network architecture based on VRPT and RFPN structures. Within the FPI-based framework, satellite image features are spatially interconnected and deeply interact with UAV image features. VRPT extracts critical features as the backbone network, with the RFPN module enabling end-to-end integration, effectively simplifying the process and mitigating common error propagation issues.
Figure 2.
Examples of diverse UAV scenes in the Multi-UAV dataset, ensuring broad data diversity and extensive scene coverage.
Figure 2.
Examples of diverse UAV scenes in the Multi-UAV dataset, ensuring broad data diversity and extensive scene coverage.
Figure 3.
Illustration of the dataset construction process. The red cross indicates the projection of the UAV’s current position onto the ground, representing the center of the UAV image; the red arrow denotes the UAV’s flight direction, with a sampling interval of 20 m between adjacent frames.
Figure 3.
Illustration of the dataset construction process. The red cross indicates the projection of the UAV’s current position onto the ground, representing the center of the UAV image; the red arrow denotes the UAV’s flight direction, with a sampling interval of 20 m between adjacent frames.
Figure 4.
Visualization of representative samples from the training set (a) and test set (b).
Figure 4.
Visualization of representative samples from the training set (a) and test set (b).
Figure 5.
Illustration of the RSC augmentation method. The colored solid line box indicates the centroid coverage area. The yellow star represents randomly generated center positions within the image. Green, blue, and red dashed boxes represent cropping results at three different scales, respectively.
Figure 6.
Overall network architecture combining VRPT and RFPN. The backbone network comprises three stages, each containing a patch embedding layer and multiple transformer encoder modules, structured in a pyramidal fashion to progressively reduce feature resolutions. The output features from the final stage feed into the RFPN module, which further enhances feature representations through multi-scale fusion, ultimately generating localization heatmaps.
Figure 7.
UAV and satellite images are partitioned into patches, undergoing feature extraction through attention modules across three distinct stages.
Figure 7.
UAV and satellite images are partitioned into patches, undergoing feature extraction through attention modules across three distinct stages.
Figure 8.
Detailed structure of the residual feature pyramid network (RFPN).
Figure 8.
Detailed structure of the residual feature pyramid network (RFPN).
Figure 9.
Comparison of different models on the UL14 dataset based on MA@K metrics.
Figure 9.
Comparison of different models on the UL14 dataset based on MA@K metrics.
Figure 10.
Performance comparison of different models on the Multi-UAV dataset based on the RDS metric.
Figure 10.
Performance comparison of different models on the Multi-UAV dataset based on the RDS metric.
Figure 11.
Performance comparison of different terrains on the predicting heat maps.
Figure 11.
Performance comparison of different terrains on the predicting heat maps.
Figure 12.
Performance comparison of different feature fusion structures on the Multi-UAV dataset based on MA@K and RDS metrics.
Figure 12.
Performance comparison of different feature fusion structures on the Multi-UAV dataset based on MA@K and RDS metrics.
Figure 13.
Performance comparison based on MA@K and RDS metrics across different map sizes on the Multi-UAV dataset.
Figure 13.
Performance comparison based on MA@K and RDS metrics across different map sizes on the Multi-UAV dataset.
Figure 14.
Performance comparison of different attention mechanism strategies on the Multi-UAV dataset based on MA@K and RDS metrics.
Figure 14.
Performance comparison of different attention mechanism strategies on the Multi-UAV dataset based on MA@K and RDS metrics.
Table 1.
Comparison of the proposed Multi-UAV dataset and existing UAV-based visual geo-localization datasets. The “Training” column indicates the number of samples per location.
Table 1.
Comparison of the proposed Multi-UAV dataset and existing UAV-based visual geo-localization datasets. The “Training” column indicates the number of samples per location.
| Dataset | Multi-UAV (Ours) | UAV-VisLoc [13] | UL14 [10] | DenseUAV [7] | SUES-200 [50] | Uni-1652 [49] | VIGOR [48] | CVUSA [27] |
|---|
| Training | 17.4 k | 6.7 k | 13.6 k | 20.3 k | 6.1 k | 50.2 k | 144 k | 71 k |
| Platform | Drone-Satellite | Drone-Satellite | Drone-Satellite | Drone-Satellite | Drone-Satellite | Ground-Drone-Satellite | Ground– Satellite | Ground– Satellite |
| Evaluation | RDS and MA@K | - | RDS and MA@K | R@K and SDM | R@K and AP | R@K & AP | MA@K | R@K |
| Dense areas | ✓ | ✓ | ✓ | ✓ | ✓ | × | × | × |
| Multi-attitudes | ✓ | × | × | × | ✓ | × | × | × |
| Multi-scenes | ✓ | ✓ | × | × | × | × | × | × |
| Multi-scales | ✓ | - | ✓ | × | × | × | × | × |
Table 2.
Multi-dimensional comparison of different models on the UL14 dataset.
Table 2.
Multi-dimensional comparison of different models on the UL14 dataset.
| Model | RDS | FLOPs | Params |
|---|
| FPI | 0.572 | 14.88 G | 44.48 M |
| WAMF-FPI | 0.653 | 13.32 G | 12.49 M |
| OS-FPI | 0.762 | 14.28 G | 28.17 M |
| SSPT | 0.822 | 7.23 G | 22.81 M |
| VRPT_256 (ours) | 0.833 | 2.84 G | 10.12 M |
| VRPT_384 (ours) | 0.847 | 6.05G | 10.12 M |
Table 3.
Multi-dimensional comparison of different models on the Multi-UAV dataset.
Table 3.
Multi-dimensional comparison of different models on the Multi-UAV dataset.
| Model | RDS | FLOPs | Params |
|---|
| FPI | 0.392 | 14.88 G | 44.48 M |
| WAMF-FPI | 0.493 | 13.32 G | 12.49 M |
| OS-FPI | 0.534 | 14.28 G | 28.17 M |
| SSPT | 0.725 | 7.23 G | 22.81 M |
| VRPT_256 (ours) | 0.788 | 2.84 G | 10.12 M |
Table 4.
Multi-dimensional comparison of different feature fusion structures on the Multi-UAV dataset.
Table 4.
Multi-dimensional comparison of different feature fusion structures on the Multi-UAV dataset.
| Fusion Head | RDS | FLOPs |
|---|
| No_Head | 0.652 | 1.97 G |
| FPN | 0.683 | 2.95 G |
| AFPN | 0.701 | 3.28 G |
| RFPN (ours) | 0.788 | 2.84 G |
Table 5.
Multi-dimensional comparison of different cropping strategies on the Multi-UAV dataset.
Table 5.
Multi-dimensional comparison of different cropping strategies on the Multi-UAV dataset.
| Strategy | RDS | MA@3 | MA@5 | MA@10 |
|---|
| FSC | 0.746 | 0.236 | 0.438 | 0.732 |
| RSC (ours) | 0.788 | 0.268 | 0.479 | 0.756 |
Table 6.
Multi-dimensional comparison of attention mechanism strategies on the Multi-UAV dataset.
Table 6.
Multi-dimensional comparison of attention mechanism strategies on the Multi-UAV dataset.
| Att-Allocation Strategy | RDS | FLOPs | Params |
|---|
| CRA-CRA-CRA | 0.352 | 1.88G | 8.65M |
| SA-SA-SA | 0.383 | 3.97G | 12.78M |
| CA-CA-CA | 0.732 | 3.97G | 12.78M |
| SA-CA-CA | 0.749 | 3.97G | 12.78M |
| SA-SA-CA | 0.761 | 3.97G | 12.88M |
| (ours) | 0.788 | 2.84G | 10.12M |
| Disclaimer/Publisher’s Note: The statements, opinions and data contained in all publications are solely those of the individual author(s) and contributor(s) and not of MDPI and/or the editor(s). MDPI and/or the editor(s) disclaim responsibility for any injury to people or property resulting from any ideas, methods, instructions or products referred to in the content. |
© 2025 by the authors. Licensee MDPI, Basel, Switzerland. This article is an open access article distributed under the terms and conditions of the Creative Commons Attribution (CC BY) license (https://creativecommons.org/licenses/by/4.0/).


