1. Introduction
Integrating unmanned aerial spraying systems (UASS) into precision agriculture represents a transformative advancement in the targeted application of plant protection products (PPPs) spraying. Compared to conventional spraying methods, UASS offer enhanced efficiency, selectivity, and adaptability, particularly in complex terrains where conventional machinery may be impractical or unsafe to operate [
1,
2,
3,
4,
5]. UASS enables site-specific spraying, aligning with precision agriculture principles by optimizing input use and minimizing environmental impact and non-target exposure. Moreover, the potential for reduced spray drift makes UASS an attractive alternative to traditional ground-based and manned aerial applications in sensitive areas [
6]. Additionally, the remote operation of UASS reduces operator exposure by limiting direct contact with PPPs during spraying activities. It enhances worker safety by avoiding navigating hazardous or uneven terrains. Furthermore, UASS can offer time and labor savings, especially during peak agricultural periods, thereby improving overall operational efficiency [
7].
Regulatory constraints further complicate the adoption of UASS in Europe. Under Directive 2009/128/EC on the sustainable use of pesticides, UASS is currently classified alongside conventional manned aerial spraying, effectively prohibiting its use. However, the 2022 draft regulation on sustainable PPP use proposes Article 21, which could allow exemptions for UASS applications that meet specific criteria and demonstrate lower risks than other aerial or land-based methods. Importantly, the European Commission may adopt delegated acts to define these criteria as technological capabilities evolve. While this presents an opportunity, the absence of robust scientific data on UASS exposure risks remains a barrier to informed regulatory decisions.
To support regulatory development and inform risk assessment, it is essential to quantify human exposure linked to UASS use. Human health risk assessment for PPP applications involves evaluating exposure to active substances or toxicologically relevant compounds, considering factors such as dosage, application method, and environmental conditions, as outlined in Regulation (EC) No 1107/2009. This assessment includes operators, workers, residents, and bystanders and typically relies on actual exposure measurements or validated computational models.
Previous studies have investigated spray drift and deposition patterns associated with UASS spraying under various environmental and operational conditions [
8,
9,
10,
11]. However, the existing literature on comprehensive assessments of human exposure, particularly dermal exposure, during UASS operations remains limited. Most research to date has focused on spray drift dynamics or environmental impact modeling, without directly quantifying human exposure risks in real-world scenarios or comparing them to conventional application methods. Consequently, a significant knowledge gap remains concerning the potential of UASS to reduce human exposure to PPPs, especially in European contexts where regulatory scrutiny is particularly high.
Few studies have specifically addressed operator safety given the higher concentration of active ingredients typically used in UASS spraying operations. For example, one study [
12] measured PPP deposition on UASS components after spraying in an almond orchard, finding that the UASS arms accumulated the highest residues and recommending protective equipment when handling the drone. Another study [
13] compared residue levels of active ingredients on UASS and conventional terrestrial airblast sprayers after treating an apple orchard. The results indicated significantly higher residues on the UASS, potentially due to the greater concentration of the sprayed solution.
Recent research has begun to focus on quantifying exposure risks for residents and bystanders associated with UASS applications worldwide. A study in China evaluated bystander dermal exposure using adult-sized mannequins in a coconut plantation [
14]. In the United Kingdom, researchers estimated exposure levels for both child and adult bystanders based on airborne spray drift data collected during UASS operations in open fields [
15]. Similarly, a study conducted in a Swiss apple orchard measured direct dermal and inhalation exposure of bystanders and residents using adult and child-sized mannequins equipped with personal air sampling pumps [
16]. This study concluded that dermal contact represented the primary exposure pathway for bystanders and residents.
The present study compares three widely recognized models to empirical UASS exposure data. EFSA OPEX Guidance [
17] provides an approach for estimating operator exposure to PPPs based on field scenarios and handling tasks using standardized exposure factors. US EPA Pesticide Handler Exposure Database (PHED) [
18] offers empirical data on operator exposure across a range of pesticide handling and application activities, including scenarios relevant to conventional manned aerial applications. AgDrift
® model [
19] simulates spray drift and potential exposure for bystanders and residents by modeling droplet behavior and environmental conditions during application. By comparing these models with UASS field exposure measurements, this study assesses potential and actual dermal exposure associated with UASS operations. Furthermore, it compares UASS exposure levels to those associated with conventional spraying methods, such as vehicle-mounted, manual-knapsack, and handheld spraying systems.
This research aims to address the current knowledge gap concerning human exposure, particularly dermal exposure, during UASS operations and explore the potential benefits of integrating UASS technology into EU agricultural systems for PPP applications. Specifically, this study monitored the potential dermal exposure, defined as the exposure to the skin that would occur in the absence of clothing or personal protective equipment, and actual dermal exposure, which refers to the exposure to the skin that would occur in the presence of clothing and/or personal protective equipment. These dermal exposures were assessed for operators, residents, and bystanders during UASS applications of a Spinosad 480 g·L−1 formulation on grapevines.
2. Materials and Methods
2.1. Field Trials
Field trials were conducted following the protocols established by OG PhytoDron in a fully developed commercial Palomino vineyard (
Vitis vinifera) in Trebujena, Cádiz, Spain (36°44′ N 6°08′ W). The vineyard, covering 8.2 ha, was considered sufficient to simulate a full day of UASS application and assess operator dermal exposure. A 1.8 ha plot within the vineyard was selected to evaluate dermal exposure among bystanders and residents (
Figure 1). This plot was treated at the start of the workday to capture potential exposure levels under standard operational conditions. The vineyard’s characteristics and management practices represented commercial vineyards in the region and the broader Mediterranean area.
The trials were conducted between July and August 2022, corresponding to phenological growth stages 79–83 on the BBCH scale. The grapevines were fully developed, measuring 1.2 m in height and 0.8 m in width, and planted in a 3 m × 1.7 m configuration, with a plant density of 1961 plants⋅ha−1. Notably, crop rows in the residents/bystanders trials area had an orientation of 120°. Spraying took place on four separate dates: 14 July, 21 July, 28 July, and 4 August. The first trial served as a preliminary study to identify critical points and potential sources of cross-contamination; therefore, its data were excluded from this analysis.
2.2. UASS
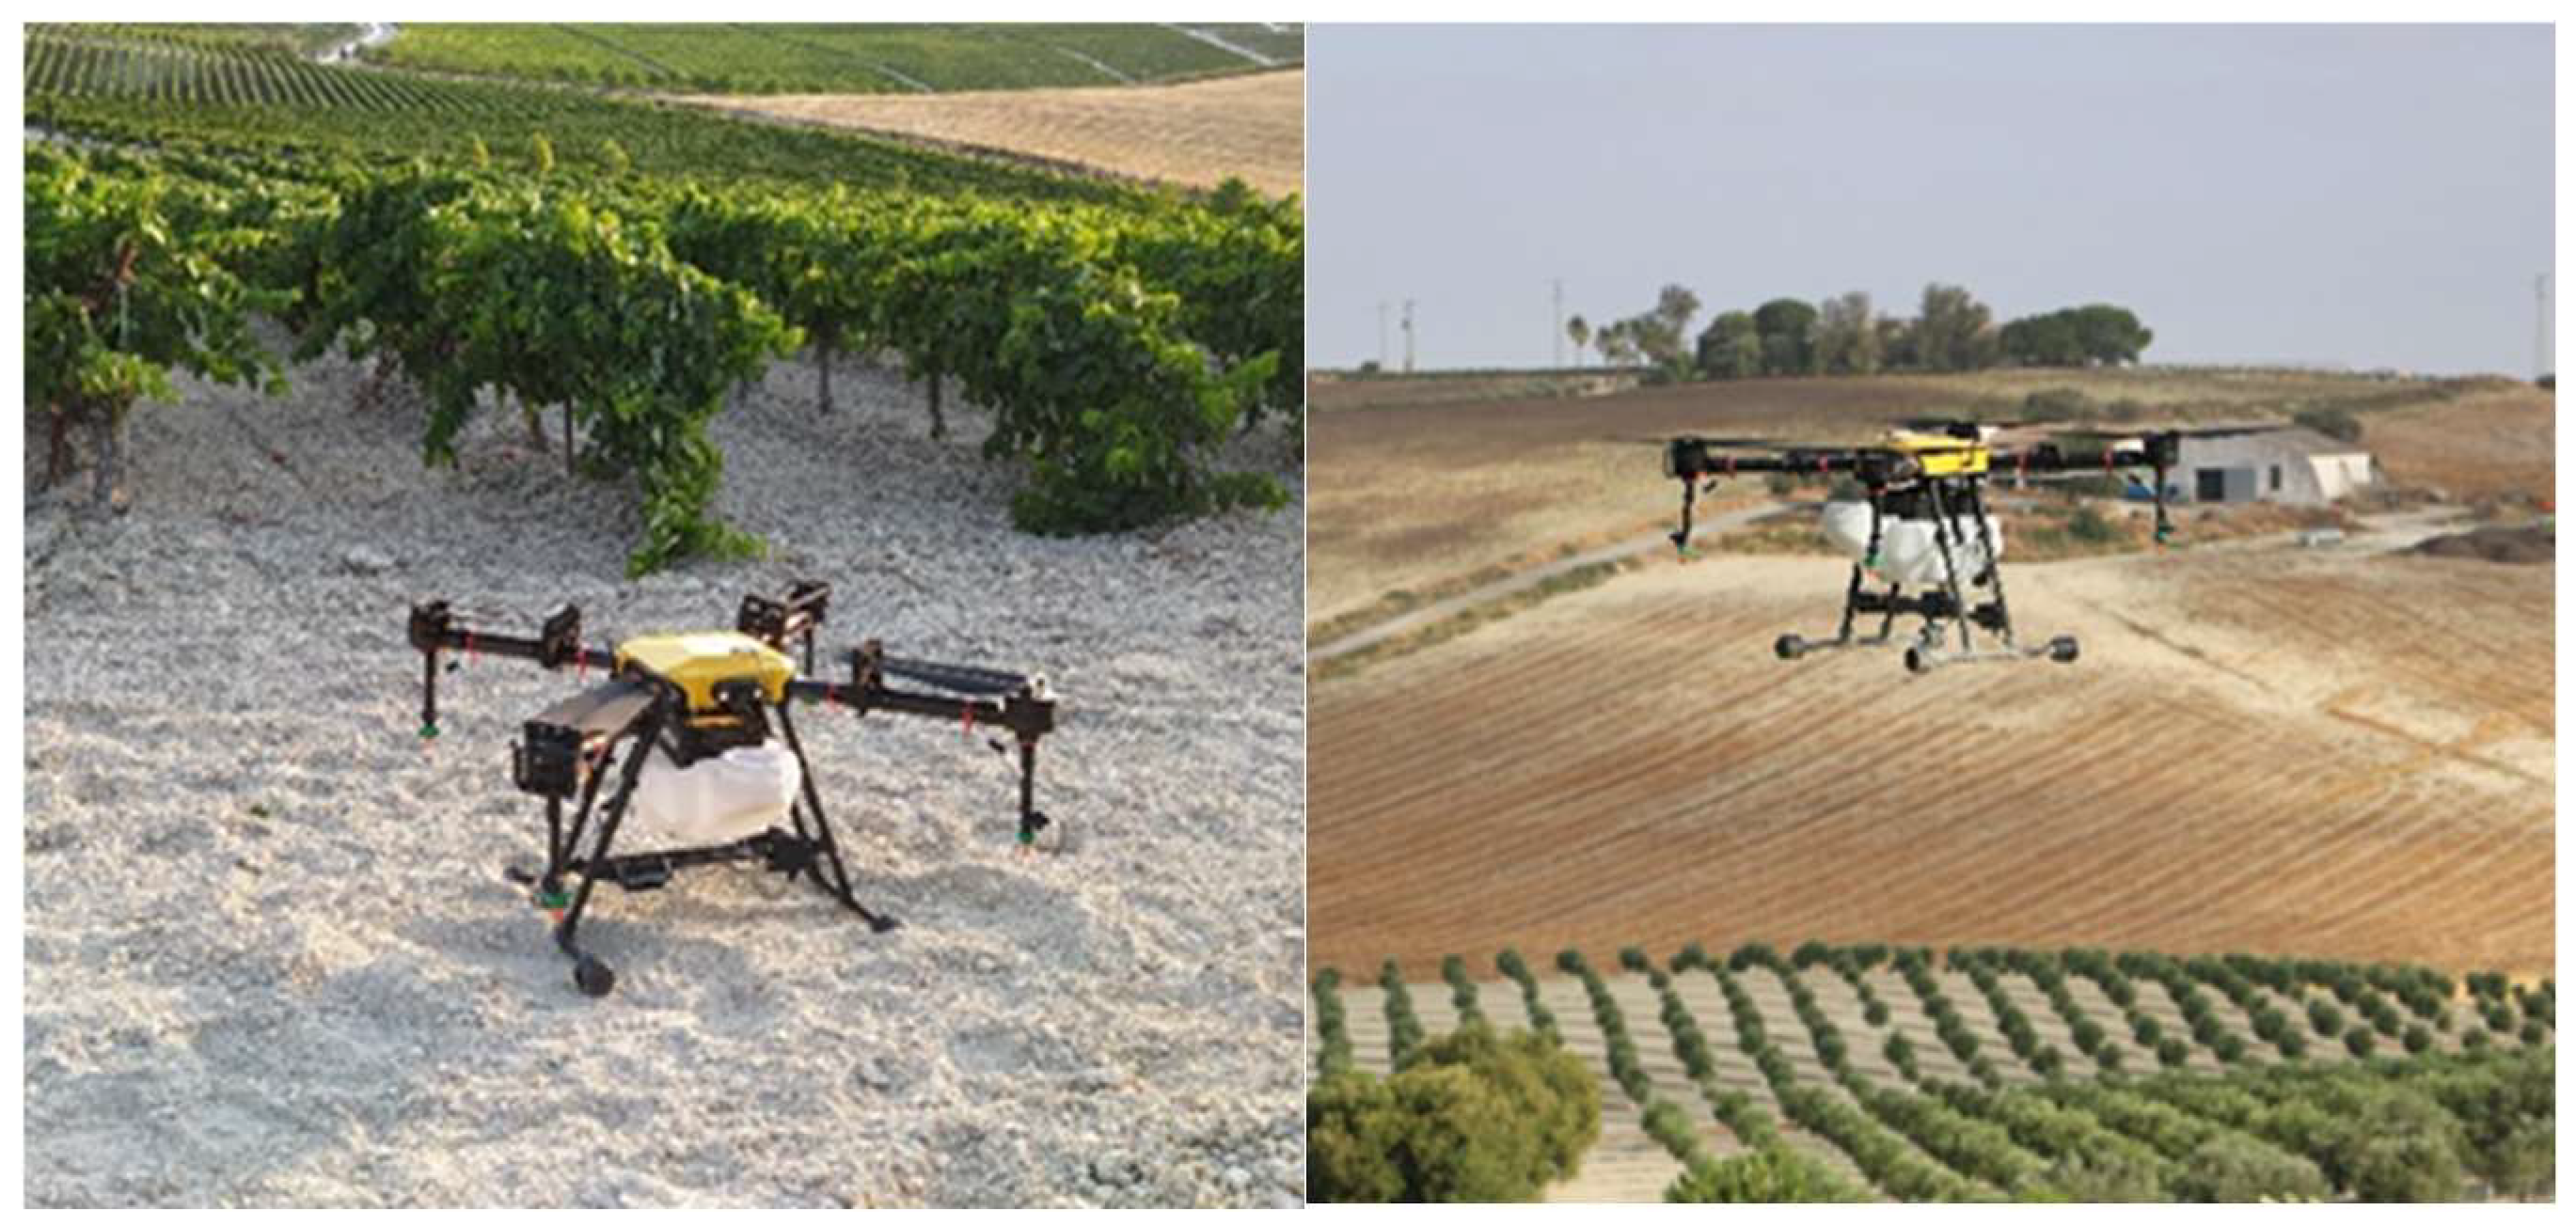
The UASS employed in the trials was a Drone Hispania Y10 quadcopter (Drones Hispania, Seville, Spain), equipped with a 10 L tank and fitted with four orange XR11001VS nozzles (TeeJet Technologies, Wheaton, IL, USA), mounted just below each rotor (
Figure 2). The system had a maximum takeoff weight (MTOW) of 25 kg, a flight autonomy of 14 min when fully loaded, and a wingspan of 2 m when fully deployed. The UASS also has a radar sensor to detect obstacles and keep a consistent distance from the ground. During the spraying trials, the UASS operated at a flying speed of 5 m·s
−1 and a nozzle pressure of 2.5 bar. The flight path followed the crop rows, and the spraying height was maintained 1.5 m above the canopy, achieving a swath width of 3.4 m. The swath width was determined using a sampling line of 26 × 76 mm water-sensitive paper strips (Syngenta, Basel, Switzerland) placed every 0.4 m. The flight height over the sampling line was held at 1.5 m during swath width trials. The final application rate was 10 L·ha
−1, with the spray mixture containing 0.15 L of Spintor 480 SC (Spinosad 48%
w/
v; suspension concentrate, Corteva Agriscience Inc., Indianapolis, IN, USA).
2.3. Weather Conditions
Key meteorological variables such as wind speed, wind direction, temperature and relative humidity were monitored during exposure trials involving residents and bystanders to account for the influence of weather conditions on spray drift. Three weather stations (Raincrop, Sencrop, Lile, France; Windcrop, Sencrop, Lille, France; Froggit WH3000SE PRO, Shenzhen Fine Offset Electronics Co., Ltd., Shenzhen, China) were positioned 1 m above the canopy and located 15 m downwind from the edge of the sprayed area (
Figure 1).
2.4. Operator’s Exposure
To assess the pilot and operators’ dermal exposure, a portion of 8 ha of the vineyard was sprayed, requiring a total of eight mixing and loading operations per working day. The pilot and auxiliary operator’s potential and actual dermal exposure were measured during each trial, with six operators sampled throughout the study. The same pilot participated in all three trials, while two different workers performed auxiliary tasks, including mixing and loading PPPs into the UASS, changing batteries, and cleaning the UASS pump.
Operators were equipped with body and hand dosimeters to assess dermal exposure during auxiliary activities and piloting. The methodology followed to assess dermal exposure was based on the whole body method described in the OECD guidance document for conducting studies of occupational exposure to pesticides during agricultural application [
20]. For the auxiliary operator, body dermal exposure was measured using a long-sleeved cotton shirt and cotton trousers as internal dosimeters and cotton/polyester coveralls as external dosimeters. Hand dermal exposure was assessed using cotton gloves. Since the pilot operated at a distance from the UASS and had no direct contact with the spraying process, only potential body exposure was assessed using a cotton/polyester coverall. Due to difficulties handling the drone’s remote touchscreen, the pilot wore nitrile gloves over the cotton gloves, allowing for the assessment of both potential and actual hand exposure.
At the end of each workday, trained technicians carefully removed internal and external body and hand dosimeters from the pilot and the auxiliary operator to prevent cross-contamination. The external coveralls were hung vertically and cut into sections (sleeves, torso, and legs) using cleaned scissors. Internal cotton shirts were similarly cut into separate sections (sleeves and torso), while internal trousers were processed whole, without sectioning. Throughout the procedure, scissors were thoroughly cleaned before and after each cut. The gloves of both hands were treated as a single sample. Technicians in charge of recovering and processing the dosimeters wore nitrile gloves, which were replaced after processing each sample to minimize the risk of cross-contamination. All samples were individually wrapped in aluminum foil, labeled, and stored at −18 °C until analysis. Each auxiliary operator generated seven samples per trial, while the pilot generated five, resulting in a total of 36 operator dosimeter samples analyzed. All operators were instructed not to remove their dosimeters during the trials and to request immediate replacement in case of breakage or deterioration.
2.5. Bystanders’ and Residents’ Exposure
To assess bystanders’ and residents’ potential and actual dermal exposure, an adaptation of the whole body method described in the OECD guidance document for conducting studies of occupational exposure to pesticides during agricultural application [
20] was used. Three adult-sized mannequins and three child-sized mannequins were positioned at 10 m intervals, 5 m downwind from the crop rows (
Figure 1). Adult sized mannequins were 175 cm high while mannequins representing children were 110 cm high. Each mannequin was dressed in cotton clothing, which served as dosimeters. To simulate a worst-case exposure scenario, the mannequins wore T-shirts and shorts as external dosimeters, while long-sleeved cotton shirts and long cotton trousers functioned as internal dosimeters. Additionally, each mannequin’s head was covered with a balaclava to measure dermal exposure on the head (
Figure 3).
Internal dosimeters were cut to sample specific body parts not covered by the external dosimeters, including the arm and leg portions. For each mannequin, we obtained seven samples: external dosimeters composed of short trousers and T-shirts, internal dosimeters consisting of uncovered arm and leg body parts, covered arm and leg body parts, and balaclava covering the head. All samples were individually labeled, wrapped in foil, and stored at −18 °C under dark conditions until further analysis. A total of 126 mannequin dosimeters were analyzed.
2.6. Field Fortification
A field fortification was performed at the field site to ensure uniformity across trial repetitions. Before the trials, blank control samples were collected from unused dosimeter materials, including inner shirts, pants, cotton gloves, balaclavas, and outer protective coveralls. In addition to blank samples, fortified samples were prepared by spiking unused sections of the same dosimeter matrices with known analyte concentrations at both the limit of quantification (LOQ) and 100 × LOQ levels. Three replicate sections (0.2 m × 0.2 m) were used for each fortification level. The fortification process was carried out in situ but outside the treated area to minimize the risk of cross-contamination. Additionally, laboratory fortification was performed following the same methodology. Field fortifications were carried out to allow the fortified samples to experience the same environmental conditions as the trial samples, helping to ensure that any potential losses or changes in analyte recovery due to environmental factors would be accurately captured. For all dosimeters except gloves, fortification involved spiking the matrices with 0.5 mL of a 10 μg·mL−1 solution of Spintor 480 SC for the low-level (LOQ) fortification and 1 mL of a 500 μg·mL−1 solution for the high-level (100 × LOQ) fortification. For gloves, the fortifications consisted of 0.5 mL of a 4 μg·mL−1 solution for the low level and 1 mL of a 200 μg·mL−1 solution for the high level (100 × LOQ).
Each fortified sample was wrapped in aluminum foil and stored at −18 °C until analysis. Samples were spiked at the beginning of the simulated workday and left to dry until the end of the day. After each trial, the samples were wrapped aluminum foil, bagged, individually labeled, and stored at −18 °C until analysis.
2.7. Analytical Determination
2.7.1. Sample Preparation
After testing various proportions of acetonitrile/water mixtures (Symta SLL, Madrid, Spain), the optimal recovery of the studied analytes, Spinosyn A (99%) and Spinosyn D (98%) (Corteva Agriscience LLC, Indianapolis, IN, USA), was achieved using an 80/20 v/v acetonitrile/water mixture. The volume of this solvent mixture used during the extraction step varied based on dosimeter size, with 1000 mL, 500 mL, or 200 mL employed accordingly. For recovery studies, aliquots of individual stock solutions containing 500 µg·mL−1 of each target analyte (Spinosyn A and Spinosyn D, the active ingredients of the plant protection product Spintor 480 SC) were mixed with a blank matrix solution, which was obtained by extracting 0.2 × 0.2 m sections from different dosimeter types. Specifically, 1000 µL of Spinosyn A and Spinosyn D were used for the 1000 mL solutions designated for inner and outer dosimeters, 500 µL for the 500 mL solution used with balaclavas, and 200 µL for the 200 mL solution applied to cotton and nitrile gloves. Although the commercial product Spintor 480 SC (Spinosad 48% w/v; suspension concentrate, Corteva Agriscience Inc., Indianapolis, IN, USA) was used during field application, the pure analytical standards of Spinosyn A and D were selected for the recovery experiments to obtain accurate and reproducible quantification of the target analytes without potential matrix interferences from the formulation additives present in the commercial product. A 500 µg·mL−1 solution of Spinosyn A and Spinosyn D was used for the 100×LOQ level, corresponding to final concentrations of 0.005 µg·mL−1 for Spinosyn A and 0.5 µg·mL−1 for Spynosin D. The samples fortified in the laboratory were allowed to stand for 30 min before being processed.
For field samples, dosimeters were transferred into HDPE screw-cap bottles before the optimized extraction solvent was added, ensuring the entire sample was fully immersed. The samples were then vigorously mixed using a ROTABIT orbital shaker (J.P. Selecta, Barcelona, Spain) at 230 rpm for 1 h. After standing for 5 min, 1 mL aliquot was transferred into a High-Performance Liquid Chromatography (HPLC) vial for analysis.
2.7.2. HPLC-MS/MS Analysis
The High-Performance Liquid Chromatography-Tandem Mass Spectrometry (HPLC-MS/MS) system (Agilent Technologies, Santa Clara, CA, USA) used for analysis consisted of a 1200 Series liquid chromatograph equipped with a quaternary solvent delivery system, an autosampler, a column oven, a vacuum degasser, a sample thermostat, and a triple quadrupole MS/MS (Agilent 6420, Agilent Technologies Inc., Santa Clara, CA, USA). Chromatographic separation was achieved using a C18 Kinetex column (4.6 internal diameter × 100 mm length, 2.6 µm particle size) (Phenomenex, Milford, MA, USA) with the column oven temperature set to 20 °C throughout the experiments. Samples were maintained at 8 °C using an autosampler thermostat. The mobile phase (A) consisted of water with 5 mM ammonium formate (Aldrich, Steinheim, Germany) and acetonitrile (phase B). An isocratic method was employed with a 10% A and 90% B mobile phase composition. The flow rate was maintained at 0.7 mL·min−1, and the injection volume was fixed at 2 µL. Detection was performed using a triple quadrupole system operating in multiple-reaction monitoring (MRM) mode. The electrospray ionization (ESI) source conditions were optimized with a gas temperature of 300 °C, drying gas flow rate, 11 L·min−1, nebulizer pressure of 40 psi, and a capillary voltage of 4000 V, with N2 gas used as the nebulizer gas. Parameters were optimized using a standard solution of Spintor (10 µg·mL−1 of each compound) prepared in 20% water and 80% acetonitrile. Full-scan spectra were initially acquired to optimize collision-induced dissociation fragmentation for maximum sensitivity of the precursor ions. Subsequently, MS/MS spectra in production mode were acquired to obtain fragment ion information. A multiple reaction monitoring (MRM) experiment was conducted to select the optimum collision energy for each specific transition, with collision energies ranging from 2 to 60 eV.
Data processing was performed with Agilent Mass Hunter Data Acquisition software (version B.07.00) and processed with Agilent Mass Hunter Quantitative Analysis software (version B.07.00).
2.7.3. Method Validation
The method was validated to assess its performance according to a conventional validation procedure, following the guidelines outlined in SANTE/2020/12830 [
21]. The validation parameters included selectivity, linearity, limit of detection (LOD), limit of quantification (LOQ), matrix effects, accuracy, and precision. Selectivity was assessed by analyzing blank samples to identify any potential interfering peaks under the same chromatographic conditions as the test samples. Chromatograms were monitored for the characteristic ions of each analyte (Spinosyn A and Spinosyn D) at their expected retention times, and no significant interferences were observed in the blanks used for recovery experiments. Linearity was evaluated using calibration curves prepared in an acetonitrile/water mixture (80/20%
v/
v) covering two working ranges: 0.001–0.075 μg·mL
−1 for low concentrations and 0.001–0.25 μg·mL
−1 for high concentrations. Method acceptance criteria required a correlation coefficient (r
2) greater than 0.99 and residuals below 30% for linearity.
The matrix effect, expressed as signal suppression/enhancement (SSE), was assessed by comparing the slope ratio of the matrix-matched calibration curve to that of the pure solvent calibration curve.
The limit of detection (LOD) was determined as the analyte concentration corresponding to a signal-to-noise (S/N) ratio of 3, obtained from chromatograms at the lowest tested concentration. The limit of quantification (LOQ) was established as the lowest concentration that provided acceptable recoveries and precision within the defined method parameters.
To assess accuracy and precision, recovery assays were conducted by spiking cotton dosimeters with Spinosyn A and Spinosyn D at two concentration levels: LOQ and 100 × LOQ. 5 replicates of each spiked sample were prepared, followed by analyte extraction and purification. Accuracy was evaluated based on recovery percentages, with an acceptance range between 70% and 120%, while precision was assessed by ensuring a relative standard deviation (RSD) below 20%. Repeatability precision, expressed as RSD, was determined by intra-day and inter-day assays.
2.7.4. Data Analysis
Dermal exposure for operator’s body parts exposure and residents/bystanders was assessed using a one-way analysis of variance (ANOVA) coupled with Fisher’s least significant difference (LSD) test [
22]. Data normality data were assessed using the Shapiro–Wilk test [
23], while Levene’s test [
24] was employed to examine the homogeneity of variance. All statistical analyses were performed at a 95% confidence level. In some cases the data did not meet the assumptions for ANOVA; therefore, the Kruskal–Wallis test was applied [
25]. Data analysis was performed using the R statistical software [
26].
To contextualize the pilot and operator dermal exposure results, estimated exposure values from established operator exposure models were used as standardized reference points for conventional application scenarios. Specifically, the EFSA calculator [
17] and US EPA PHED [
18] are harmonized tools accepted by regulatory authorities for operator exposure assessment. It is important to note that these model estimates represent point values without associated variability and were not included in statistical hypothesis testing. Instead, the model outputs were used for descriptive comparison with the empirical data to illustrate the magnitude of differences in exposure levels.
The spraying methods for this comparative assessment included tractor-mounted application, manual application with a knapsack, manual handheld application (spraying tank with a lance), and conventional aircraft application.
4. Discussion
4.1. Method Validation and Analysis of Field Dosimeters
According to SANTE/11312/2021 [
28], good recoveries were obtained between 82.65 and 108.94% with a Relative Standard Deviation below 5.38%. Slight recoveries above 100% can be attributed to minor analytical variability and possible matrix-induced signal enhancement, which remained within acceptable limits for method validation. To assess matrix effect, two calibration curves were performed in acetonitrile/water (80/20,
v/
v) and in the textile extract fortified at different concentration levels. The results indicated no significant matrix effect, confirming that the calibration curve for compound quantification could be reliably established using acetonitrile/water (80/20,
v/
v) as the solvent.
4.2. Auxiliary Operator Dermal Exposure
The auxiliary operator’s dermal exposure results (
Table 2) indicate that using UASS may lead to higher potential dermal than conventional spraying methods. Although no statistical analysis was performed due to the deterministic nature of the models estimates and the limited sample size, the descriptive comparison indicates that dermal exposure levels with UASS were consistently higher than those associated with traditional spraying techniques. This increased exposure is likely attributable to the high frequency of mixing and loading operations required for UASS, which increases the operator’s direct contact with PPPs [
29].
UASS technology is characterized by its low payload capacity, necessitating frequent refilling and limiting its use to ultra-low volume applications. While the tank capacity of UASS is comparable to manual knapsack sprayers, UASS typically operates with higher concentration spray mixtures to achieve adequate coverage due to the ultra-low volume application method and its characteristic variability in droplet deposition. Additionally, UASS workflows often involve shorter spray durations and faster tank depletion than manual knapsack operations, resulting in more frequent mixing and loading cycles within the same operational timeframe. Consequently, operators may experience higher cumulative exposure during UASS operations than both tractor-mounted and knapsack spraying systems. Furthermore, the PPP tank concentrations used in UASS applications are typically higher than those used in high-volume spraying, further contributing to elevated exposure risks [
29]. In addition, auxiliary operators working with UASS may perform tasks with higher exposure risks than other application methods. For example, pump purging operations might potentially generate substantial dermal exposure. Despite their similar tank capacities, further research is needed to fully understand why UASS may generate higher dermal exposure than knapsack spraying systems.
These findings contradict a previous study, suggesting that UASS significantly reduces operator exposure [
30]. To clarify these differing findings, further research is needed to quantify exposure under diverse operational scenarios considering variations in tank concentrations, application rates, UASS structural design, flight parameters, and environmental conditions.
While results do not show statistical significance, they suggest operator’s most vulnerable body parts during UASS operations are the hands, followed by the legs, arms and torso. This exposure pattern aligns with the nature of the tasks performed, as operators’ hands come into direct contact with PPPs and transfer containers during mixing and loading operations. Additionally, during pump purging, since UASS nozzles point downwards, it is logical that the lower parts of the body are more exposed to spray residues.
Previous studies [
8,
31] have identified the formation of vortices generated by the interaction between rotor blades and the surrounding air in UASS applications. These vortices can cause PPPs to deposit on the UASS structure, potentially increasing auxiliary operator exposure during handling and maintenance of the drone. Although this phenomenon was not explicitly investigated in the present study, it could represent an additional risk factor for operators’ dermal exposure.
To mitigate these risks, safety measures, such as closed transfer systems or interchangeable tanks, are recommended to reduce operator dermal exposure during mixing and loading operations. Additionally, establishing standardized handling and cleaning protocols tailored to UASS operations could minimize auxiliary operator exposure and enhance safety in drone-based applications.
4.3. Pilot’s Dermal Exposure
The pilot’s dermal exposure results indicate that overall exposure was considerably lower when using a UASS than conventional spraying methods. This finding aligns with expectations, as the pilot has minimal direct contact with PPPs, unlike the auxiliary operator responsible for mixing, loading, cleaning and purging the pump. Additionally, the pilot operates the UASS from a considerable distance, reducing exposure relative to conventional spraying systems.
Exposure results suggest that the hands are the pilots’ most exposed body part. These high exposure values are likely attributable to cross-contamination of the remote control during equipment handling before and after operation. Further research is needed to determine the specific operational stages of this cross-contamination and how residues are transferred to the remote control. Identifying these pathways could inform the development of mitigation strategies, such as implementing protective covers for controls, improving hygiene protocols, or modifying handling procedures to minimize pilot exposure.
The pilot’s torso exhibited the second higher potential exposure, which may also be attributed to contamination from the remote control. During the operation, the pilot hangs the remote control from his neck, allowing it to contact with his torso. In this study, we did not sample the remote control for PPP residues. Future research should focus on evaluating the remote control as a potential cross-contamination vector and identifying effective strategies to prevent this form of indirect exposure.
4.4. Residents and Bystander’s Dermal Exposure
Results for residents’ and bystanders’ exposure by body part (
Table 6) reveal that PPP penetration through clothing was below the limit of quantification (<LOQ) in most cases. Although no statistically significant differences were observed, the results suggest that the lower body parts of residents and bystanders may be more exposed to PPPs, as an exposure gradient was identified: the legs received the highest dermal exposure, followed by the torso, arms and head. These findings are consistent with a previous study [
16], which reported that the lower parts of mannequins placed 3 m downwind from the sprayed area accumulated higher PPP deposition. However, other studies under different scenarios have reported contrasting results. For example, a survey conducted on palm tree spraying found higher dermal exposure on the upper parts of the body, particularly the torso and the head [
14].
These contradictions suggest that the spraying height of UASS plays a critical role in determining residents’ and bystanders’ exposure. Some studies have indicated that larger droplets, due to their greater mass, tend to deposit at shorter distances and accumulate on the lower portions of vertical drift collectors [
32]. Notably, in studies where higher exposure of lower body parts was observed, spraying heights were below 4.5 m. A plausible explanation for these discrepancies could involve the ground effect, a phenomenon where airflow disturbances near to the ground influence droplet behavior and deposition patterns [
33]. Further research is required to understand the potential influence of ground effect in UASS spraying operations and its impact on exposure distribution.
The residents’ and bystanders’ dermal exposure results (
Table 7) suggest that UASS applications produce lower drift volumes than those predicted by the EFSA models for residents and bystanders, as well as by AgDRIFT estimates for conventional aircraft spraying. This finding aligns with previous research indicating that UASS generates significantly less airborne and sedimented drift than conventional terrestrial spraying methods under specific conditions [
34]. High variability in spray drift when using UASS was also observed, consistent with findings from earlier studies [
4,
11,
34].
No statistically significant differences were detected between children’s dermal exposure and that of adults. However, adults generally exhibited higher exposure levels. This trend may be explained by differences in body size and the typical behavior of airborne drift to increase with height [
10,
35,
36,
37]. Nevertheless, as previously discussed, this tendency may not fully apply to UASS operations.
One limitation of this study is that all trials were conducted at a single location, which may not fully capture the variability of environmental conditions. Additional trials under a broader range of weather conditions are essential to better understand the dynamics of dermal exposure associated with UASS applications and to support the development of robust exposure models.
5. Conclusions
The results of this study indicate that operators and pilots experienced lower exposure levels when using UASS than those expected with conventional terrestrial and aerial applications. However, mixing and loading tasks resulted in higher-than-expected exposure than the EFSA OPEX Guidance 2022 estimates. A possible explanation for this increased exposure is the greater frequency of mixing and loading operations required for UASS applications. Although some UASS models, such as the Agras T25 or T50, have tank capacities comparable to or larger than backpack sprayers, UASS workflows typically involve faster tank depletion due to higher flow rates. As a result, operators may still need to perform frequent mixing and loading operations within a single spraying session. This aspect should be further investigated to develop strategies that reduce exposure during these tasks, either by modifying operational procedures or implementing risk mitigation measures, such as closed transfer systems or specific protocols for mixing and loading in UASS tanks.
The results also suggest that the primary source of pilot exposure is cross-contamination from the remote control. Therefore, developing protocols to prevent exposure or cross-contamination of the remote control should be considered as a strategy to reduce pilot dermal exposure.
Residents’ and bystanders’ dermal exposure results indicate lower-than-expected exposure levels than estimates from the EFSA OPEX Guidance 2022 and AgDRIFT®. This finding supports the potential of UASS as a safer technology for reducing residents’ and bystanders’ exposure, relative to conventional terrestrial and aircraft spraying methods.


 ,
, 


